1 chapter one introduction cereal-based foods play
TRANSCRIPT
1
CHAPTER ONE
INTRODUCTION
Cereal-based foods play an important role as a source of dietary energy and nutrients in human
nutrition. The use of microorganisms by humans has a long tradition. Besides beer and wine production,
bread making is one of the oldest arts known to man. For example, Egypt, Greece and Italy were early
places of discovery of leavened breads (Kulp and Lorenz, 2003).
Wheat falls under the grass family Gramineae, which include the cereal grains. Other popular cereal
grains that fall under this category are corn, rice, barley, oats, sorghum and pearl millet. All of this can
be milled into flour, but only wheat flour has the ability to be transformed into glutinous dough, together
with water and other ingredients. The uniqueness of wheat flour to be transformed into a cohesive,
viscoelastic mass is due to the hydration of gluten proteins in the wheat together with the application of
mixing energy. After the dough is formed, the gluten structure entraps the gasses produced during the
fermentation stage. This allows the dough mass to expand and to be baked into a soft, light and palatable
product, which is known as bread (September, 2007).
Fermented foods, particularly those produced under controlled conditions, have a good record of
safety and are implicated in outbreaks of diseases relatively infrequently (Adams and Nout, 2001).
Bread is a staple foodstuff made and eaten in most countries around the world (Owens, 2001).
Bread is the most popular yeast leaved product made from wheat flour. The bread making process is one
of the oldest applications of biotechnology. The term bread defines a great variety of baking products,
which vary in formulation, ingredients, and processing conditions (Shetty et al., 2006). Bread products
have evolved to take many forms, each based on quite different and very distinctive characteristics. In
some countries the nature of bread making has retained its traditional form while in others it has
changed dramatically. Of all the cereals wheat is almost unique in this respect. The aim of the bread
making process is quite simple: namely to convert wheat flour and other ingredients into a light, aerated
and palatable food (Owens, 2001).
In Sudan, the consumption of wheat bread is increasing in both rural and urban areas as a
consequence of changing taste, convenience and consumer subsidies (Abdelghafor et al., 2011).
The basic ingredients in bread-making are flour, water, salt, and yeasts. In modern bread making
however a large number of other components and additives are used as knowledge of the baking process
has grown. These components depend on the type of bread and on the practice and regulations operating
in a country. They include ‘yeast food’, sugar, milk, eggs, shortening (fat) emulsifiers, anti-fungal

2
agents, anti-oxidants, enzymes, flavoring, and enriching ingredients. The ingredients are mixed together
to form dough which is then baked (Okafor, 2007).
Nowadays, the use of additives has become a common practice in the baking industry. The need
for their use arises due to the fact that numerous benefits are associated with their use. With this
objective, a large number of these substances of various chemical structures have been used. Some
additives are focused on improving dough machinability.
Food hydrocolloids are high-molecular weight hydrophilic biopolymers used as functional
ingredients in the food industry. In the baked goods, hydrocolloids have been used for retarding the
staling and for improving the quality of the fresh products. Emulsifiers are commonly added to
commercial bakery products to improve bread quality and dough handling characteristics (Kohajdová et
al., 2009). Emulsifiers have become highly functional ingredients in the food industry. They are used at
very low amounts in foods, many times at fractions of a percent, yet can greatly affect the final
products’ performance. For example, emulsifiers can aerate foams and batters, extend shelf-life,
promote fat agglomeration, and improve texture in foods. The functionality of emulsifiers depends on
the particular emulsifier used and the concentration, formulation, and processing the final food product
has experienced (Baker, 2010).
Gum arabic (GA, E-Number 414) is an edible, dried, gummy exudate from the stems and branches
of Acacia senegal and A. seyal that is rich in non-viscous soluble fiber, It is defined by the FAO/WHO
Joint Expert Committee for Food Additives (JECFA) as ‘a dried exudation obtained from the stems of A.
senegal (L.) Willdenow or closely related species of Acacia (family Leguminosae)’ (Ali et al., 2009).
Generally, bread quality faces many problems like deterioration of flavor, color, texture and taste
after few hours from production time, so what the effect of gum arabic on this problem? What amount
of gum arabic that gives desired function on wheat flour? In addition, what about effect of gum arabic in
fermentation process, baking process, color measurement, shelf life and as antistaling agent?
Objectives:
The ultimate goal of this study was to investigate the effect of gum arabic on the quality of bread.
To achieve the goal, there were some minor objectives should be included:
1) To study the characteristics of the dough (fermentation and baking) and bread organoleptics.
2) To evaluate bread quality after 8 hours.
3) To determine the optimum percentage of gum arabic that to be used in the bread making.
3
CHAPTER TWO
LITERATURE REVIEW
2.1 Cereal grains:
Cereals are the fruits of cultivated grasses, members of the monocotyledonous family Gramineae.
Most of the 195,000 species of flowering plants produce edible parts which could be utilized by man;
however less than 0.1% or fewer than 300 species are used for food. Approximately 17 plant species
provide 90% of mankind’s food supply, of which cereal grains supply far and away the greatest
percentage (Cordain, 1999). Grain crops, or cereals, are by far the most important sources of plant food
for the human race. On a worldwide basis, they provide almost half of the energy and protein of the diet
(Vaughan and Geissler, 2010).
Eight cereal grains: wheat, maize, rice, barley, sorghum, oats, rye, and millet provide 56% of the
food energy and 50% of the protein consumed on earth. Three cereals: wheat, maize and rice together
comprise at least 75% of the world’s grain production. It is clear that humanity has become dependent
upon cereal grains for the majority of its food supply. As Mangelsdorf has pointed out, ‘cereal grains
literally stand between mankind and starvation’; therefore, it is essential that we fully understand the
nutritional implications of cereal grain consumption upon human health and well being (Cordain, 1999).
Cereals represent an important food category as they contribute a large portion of our daily calorie
supply. Besides energy, cereal products are important for nutrition because of their contents of dietary
fiber and a wide range of micronutrients and bioactive components including minerals, vitamins,
antioxidants, and other bioactive compounds (Hamaker, 2008).
2.1.1 Origin of cereals:
The genealogy of the cereals begins with wild grasses (Poaceae), Barley (Hordeum vulgare),
probably one of the first cereals grown systematically, was known as early as 5000 B.C. in Egypt and
Babylon (Belitz et al., 2009). Although the first anatomically modern humans (Homo sapiens) appeared
in Africa 90,000 years ago, humans prior to the mesolithic period (~15,000 years ago) like other
primates rarely if ever utilized cereal grains (Cordain, 1999).
The cultivation of wheat (Triticum spp.) reaches far back into history, and the crop was
predominant in antiquity as a source of human food. It was cultivated particularly in Persia (Iran), Egypt,
Greece and Europe (Kent and Evers, 1994).

4
2.1.2 Historical perspective of cereals:
Widespread consumption of cereal grains began in the Middle East about 10,000 years ago, when
agriculture first began. It was then that wheat was first planted and cultivated (Figoni, 2008). Wheat
became so important that at one time its export from Greece was prohibited, and bread was such a staple
and important food that its weight and price were fixed in law (Cauvain and Young, 2006). The status
of the baker began to change during the years of the Roman Empire. It became a profession for men,
and baking acquired a respectable and significant status as a trade. During this period the first guilds, or
trade unions, of bakers began to form, reflecting the respectable nature of the trade (Cauvain and Young,
2006).
The traditional baked products with which we are all familiar have a long history of development
through trial and error rather than systematic study. The origins of many baked products can be assigned
to the error category. Indeed, the discovery of leavened bread has been ascribed to the error of leaving
dough overnight before baking, and the discovery of laminated pastry to the apprentice who forgot to
add fat to the bread dough and tried to recover the situation by folding the missing ingredient into the
dough after mixing (though there can be no absolute proof of either story). More recently, systematic
studies have been applied to the development of new baked products but most commonly the rule sets
applied have tended to be limited and confined by the traditional definition of baked products (Cauvain
and Young, 2006).
2.1.3 Cereal production, utilization and stocks:
The latest FAO world cereal production in 2014 now stands at 2542 million tones. Word cereal
utilization in 2014/15 is expected to reach 2475 million tonnes, 8 million tonnes more than projected in
February with most of the revision resulting from greater anticipated feed use of sorghum and barley. At
the current forecast level, world cereal utilization in 2014/15 would grow by 2.6 percent (62 million
tonnes) from the previous season. Total feed use of cereals is projected at 877 million tonnes, up 4
percent (34 million tonnes) from 2013/14, led by a 3.6 percent (nearly 20 million tonnes) expansion in
maize feed utilization. The FAO forecast for world cereal stocks by the close of the crop seasons ending
in 2015 has been lifted by 1.3 percent (8 million tones)
2.1.4 Importance of cereals:
Cereal products are amongst the most important staple foods of mankind. Nutrients provided by
bread consumption in industrial countries meet close to 50% of the daily requirement of carbohydrates,

5
one third of the proteins and 50–60% of vitamin B. Moreover, cereal products are also a source of
minerals and trace elements (Belitz et al., 2009). In some countries of Southern Asia, Central America,
the Far East and Africa cereal product consumption can comprise as much as 80% of the total caloric
intake, and in at least half of the countries of the world, bread provides more than 50% of the total
caloric intake. In countries where cereal grains comprise the bulk of the dietary intake, vitamin, mineral
and nutritional deficiencies are common place (Cordain, 1999). The major cereals are wheat, rye, rice,
barley, millet and oats. Wheat and rye have a special role since only they are suitable for bread-making
(Belitz et al., 2009). Cereal grains are predominantly composed of starch; nonstarch polysaccharides
composed of glucose (β-glucan), fructose (polyfructan), xylose, and arabinose (arabinoglycan), some of
these polysaccharides, like starch, are partially digested, and others are believed to be dietary fiber, such
as arabinoxylan. In addition to polyfructan, wheat and rye flours contain kestose, nystose, and other
FOS of the inulin type (Shetty et al., 2006).
2.1.5 Applicability of cereals to make bread:
Only milled grain products from wheat and rye can be used to make bread. No other cereal is
capable of retaining gas to the same extent as wheat during fermentation and baking (Brennan, 2006).
Milled products from other types of cereal such as rice, barley, oat or corn will not yield proper dough
when combined with liquid. These results in products with a low increase in volume, hardly any
browning and which, in addition, are hard to cut, spread and chew. On the other hand, milled wheat and
rye products in combination with liquid will yield visco-elastic doughs which retain the gas from the
yeast fermentation (CO2) in the form of tiny bubbles. In wheat dough, the so-called gluten is
responsible for that. This protein absorbs water and forms an extensible and elastic membrane which
encloses the gas bubbles. In rye doughs, the gas is retained due to the high viscosity of swollen gum-
like substances (pentosanes) present in the dough. However, the gas permeability of the mass
surrounding the gas bubbles is higher in rye dough than in wheat dough. Therefore, rye-containing
baked goods have a lower specific volume than wheat dough products (Wassermann, 2009). While
staple food, such as corn and wheat flours are usually fortified with iron, rice grains present much hard
problems and challenges. In addition, whole brown rice is barely consumed, and its commercial milling
(polishing) produces considerable loss of micronutrients, up to 30% and 67% for zinc and iron,
respectively, by eliminating its outer layers where these metals are accumulated (Shetty et al., 2006).
2.2 Wheat grain:
Wheat (Triticum spp.) is a cereal grain, originally from the Levant region of the Near East and
Ethiopian Highlands, but now cultivated worldwide (Belitz et al., 2009). The principal wheats of

6
commerce belong to the botanical species Triticum aestivum and Triticum durum; Triticum compactum
or Club Wheat is not widely grown now, but in the USA it is milled to produce soft flour for the
manufacture of confectionery and biscuits (Ranken et al., 1997). Wheat is the most popular cereal grain
for use in baked goods. Its popularity stems mainly from the gluten that forms when flour is mixed with
water. Without gluten, raised bread is hard to imagine. Wheat is also preferred because of its mild, nutty
flavor. Both factors, no doubt, contribute to wheat being the most widely grown cereal grain in the
world (Figoni, 2008). Wheat grains are the fruit of the wheat plant, which is able to grow in most kinds
of soil and under widely differing climatic conditions (Ranken et al., 1997).
2.2.1 Production of wheat:
More wheat is produced annually than any other cereal crop and it is probably the world’s
foremost food plant (Vaughan and Geissler, 2009). Wheat is a product of the natural environment, and
while breeding and farming practices can modify aspects of wheat quality, we millers and bakers still
have to respond to the strong influences of the environment (Cauvain and Young, 2007). Some 80 per
cent of the world’s wheat production takes place in Russia, the United States of America, China, India,
France, Canada, Australia, Turkey, Pakistan, and Argentina (Vaughan and Geissler, 2009). since
February, to 631 million tonnes. (FAO, 2015).
FAO’s first wheat production forecast for 2015 stands at 720 million tonnes, including an early
projection for the Southern Hemisphere countries that will begin planting in August. At this level,
production would be 1 percent below the record output of 2014, predominantly reflecting an expected
decline in Europe. (Figure 1).
Figure 1: Wheat production in 2015 forecast to contract slightly below the record of 2014.
Note: The regional aggregations refer only to the top fifteen producing countries. Percentages refer to
year-on-year changes.
Source: (FAO, 2015)
7
2.2.2 Wheat classification:
Today, thousands of different wheat varieties are grown throughout the world.While certain
varieties will grow within the Arctic Circle and others will grow near the equator in the Andes
Mountains, most varieties of wheat require moderate growing conditions (Figoni, 2008). Millers and
wheat farmers have devised a classification system in North America to help them predict the likely
performance characteristics of wheat shipped to market. The system comprises three factors that are
correlated with a particular crop before it is sold or turned into flour, Protein content, Kernel color, and
harvest season (DiMuzio, 2010).
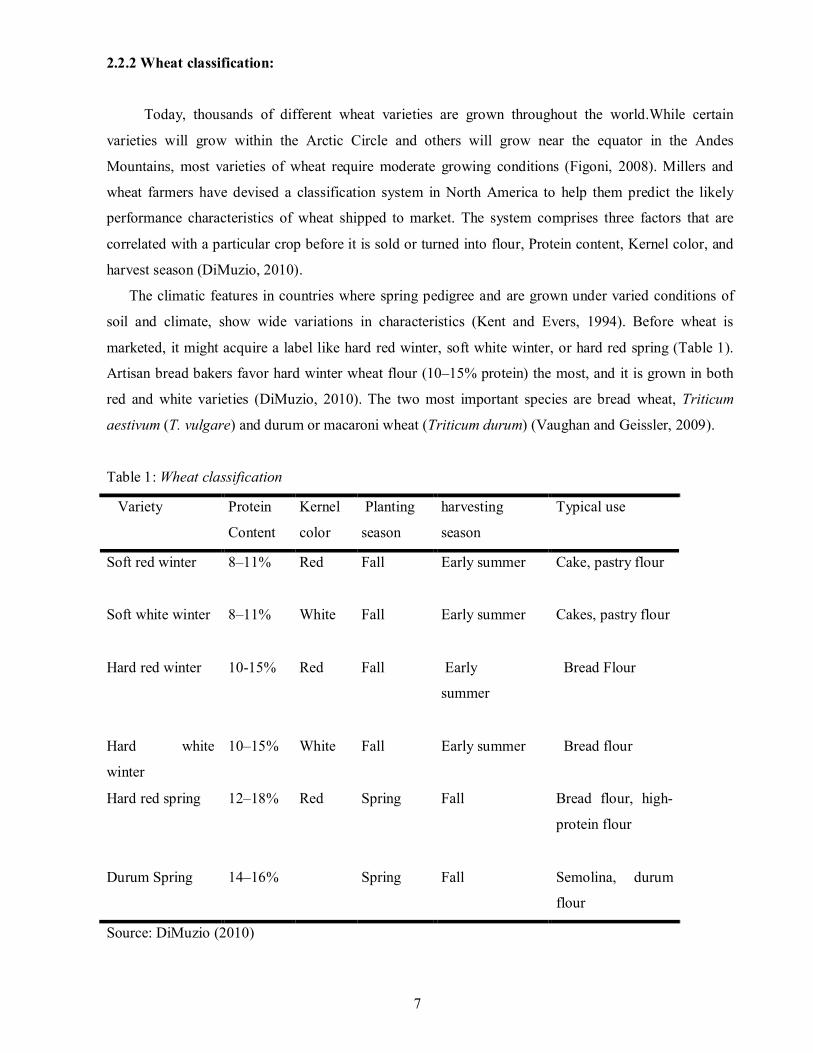
The climatic features in countries where spring pedigree and are grown under varied conditions of
soil and climate, show wide variations in characteristics (Kent and Evers, 1994). Before wheat is
marketed, it might acquire a label like hard red winter, soft white winter, or hard red spring (Table 1).
Artisan bread bakers favor hard winter wheat flour (10–15% protein) the most, and it is grown in both
red and white varieties (DiMuzio, 2010). The two most important species are bread wheat, Triticum
aestivum (T. vulgare) and durum or macaroni wheat (Triticum durum) (Vaughan and Geissler, 2009).
Table 1: Wheat classification
Variety Protein
Content
Kernel
color
Planting
season
harvesting
season
Typical use
Soft red winter
8–11% Red Fall Early summer
Cake, pastry flour
Soft white winter 8–11% White Fall Early summer
Cakes, pastry flour
Hard red winter 10-15% Red Fall Early
summer
Bread Flour
Hard white
winter
10–15% White Fall Early summer
Bread flour
Hard red spring 12–18% Red Spring Fall Bread flour, high-
protein flour
Durum Spring 14–16% Spring Fall Semolina, durum
flour
Source: DiMuzio (2010)

8
Hard wheat is required for inclusion in bread making and a soft texture is required for biscuit making
(Owens, 2001). Soft wheats alone do not make good breads, hard wheats alone are inappropriate for
(sweet) biscuit and cake making, and durum wheat must be used for high-quality pasta (Belton, 2007).
Bread wheat Triticum aestivum (T. vulgare). On a worldwide basis, bread wheat constitutes about 90
per cent of the wheat grown; the remainder is devoted essentially to durum wheat (Vaughan and
Geissler, 2010).
2.2.3 The Wheat berry:
A grain of wheat is ovoid in shape and bears at one end a number of short fine hairs, the beard.
Down one side of the grain runs a deep longitudinal crease. The grain consists of three main parts, the
enveloping skins (bran), the embryo (germ) and the endosperm. The relative proportions of these parts
vary with the plumpness of the grain, but the average composition of wheat is 83% endosperm, 2.5%
embryo, 14.5% enveloping skins (Ranken et al., 1997). An understanding of the structure is necessary
to developing an understanding of the interactions that may be present in the isolated cell-wall
components. The aleurone layer of wheat, rye, and oat grain is one cell thick (Eliasson et al., 2006).
Wheat grain is a seed that is designed to protect the embryonic plant from the rigours of the outside
world until conditions are right for its germination and subsequent growth. A representation of the
structure of the wheat grain is given in. The outer bran coat with its unique physical structure which
folds the seed in on itself to form the characteristic crease protects the seed (Cauvain and Young, 2007).
2.2.4 Composition of wheat grain:
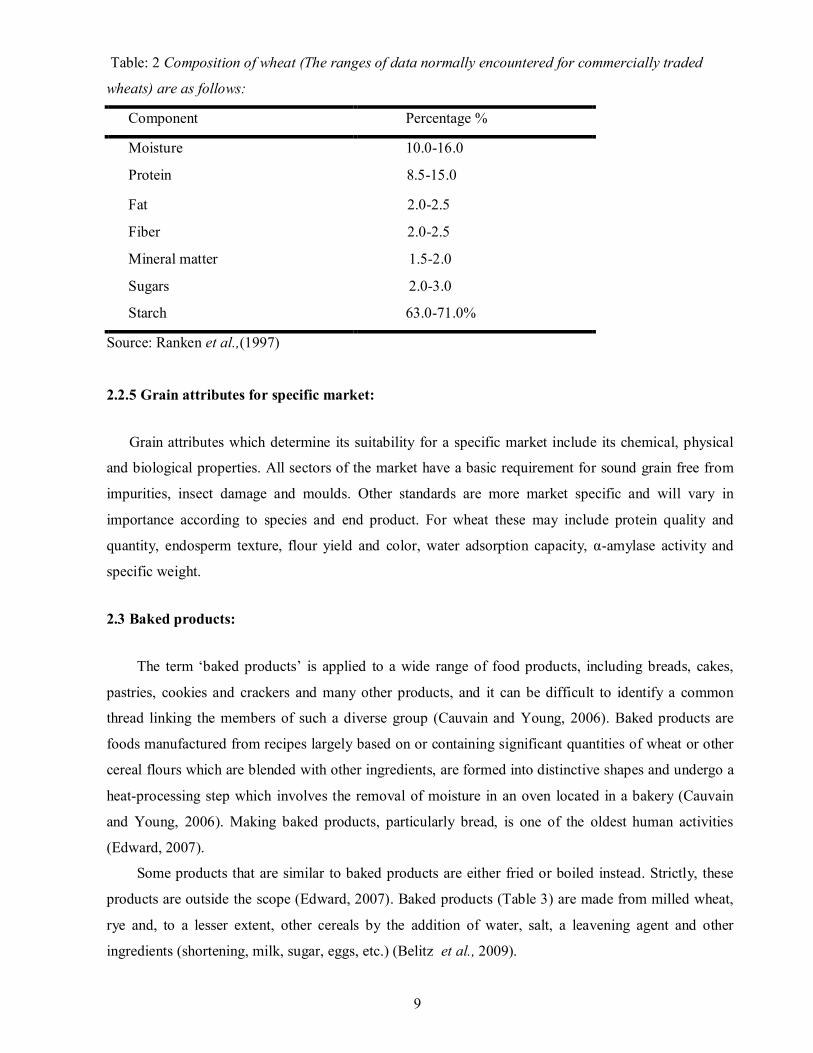
The composition of wheat varies quite widely, which is not unexpected in view of the many
varieties that are grown and the very different conditions under which they are cultivated (Table 2).
Bran consists of the pericarp, the testa, the nucellar layer and the aleurone layer. The components of
bran are fiber (comprising hemicelluloses, b-glucans, cellulose and glucofructans,), minerals, enzymes,
vitamins and globulin storage proteins. The embryo contains lipids, enzymes (lipases and lipoxygenase),
vitamins and globulin storage proteins. The largest proportion of the wheat seed is the endosperm,
which contains the nutrients necessary for germination (Edward, 2007).
9
Table: 2 Composition of wheat (The ranges of data normally encountered for commercially traded
wheats) are as follows:
Component Percentage %
Moisture 10.0-16.0
Protein 8.5-15.0
Fat 2.0-2.5
Fiber 2.0-2.5
Mineral matter 1.5-2.0
Sugars 2.0-3.0
Starch 63.0-71.0%
Source: Ranken et al.,(1997)
2.2.5 Grain attributes for specific market:
Grain attributes which determine its suitability for a specific market include its chemical, physical
and biological properties. All sectors of the market have a basic requirement for sound grain free from
impurities, insect damage and moulds. Other standards are more market specific and will vary in
importance according to species and end product. For wheat these may include protein quality and
quantity, endosperm texture, flour yield and color, water adsorption capacity, α-amylase activity and
specific weight.
2.3 Baked products:
The term ‘baked products’ is applied to a wide range of food products, including breads, cakes,
pastries, cookies and crackers and many other products, and it can be difficult to identify a common
thread linking the members of such a diverse group (Cauvain and Young, 2006). Baked products are
foods manufactured from recipes largely based on or containing significant quantities of wheat or other
cereal flours which are blended with other ingredients, are formed into distinctive shapes and undergo a
heat-processing step which involves the removal of moisture in an oven located in a bakery (Cauvain
and Young, 2006). Making baked products, particularly bread, is one of the oldest human activities
(Edward, 2007).
Some products that are similar to baked products are either fried or boiled instead. Strictly, these
products are outside the scope (Edward, 2007). Baked products (Table 3) are made from milled wheat,
rye and, to a lesser extent, other cereals by the addition of water, salt, a leavening agent and other
ingredients (shortening, milk, sugar, eggs, etc.) (Belitz et al., 2009).
10
Table 3: Classification of baked products
Bread including small baked products
(rolls, buns)
Made entirely or mostly from cereal flours; moisture
content on average 15%. Addition of sugar, milk
and/or shortenings amounts to less than 10%. Small
baked products differ from bread only by their size,
form and weight.
Fine baked goods, including long term or
extended shelf life products such as biscuits
crackers, cookies etc.
Made of cereal flours with at least 10% shortening
and/or sugar, as well as other added ingredients. In
baked goods for long shelf life the moisture content
is greatly reduced.
Source: Belitz (2009)
2.3.1 Traditional basis for classifying baked products:
Despite (or because of) its long history, baking still has strong and deep roots in the craft and still
struggles to develop its scientific credibility. Until it truly graduates to being a science a common
taxonomy remains impossible. Common English dictionary definitions for groups of baked products
include:
• Bread – n. food made of flour or meal (and) baked
• Cake – n. baked, sweetened bread
• Biscuit – n. dry, small, thin variety of cake
• Pastry – n. article of food made chiefly of flour, fat and water.
All of the above definitions illustrate the difficulties associated with defining the various groups
of baked products (Cauvain and Young, 2006).
2.4 Bread:
Bread is an important staple food in both developed and developing countries. Bread is made by
baking a dough which has for its main ingredients wheaten flour, water, yeast and salt. Other
ingredients which may be added include flours Of Other cereals fat, malt flour, soya flour, yeast foods,
emulsifiers, milk and milk products, fruit, gluten (Kent and Evers, 1994). Wheat (Triticum aestivum
Desf.) flour of both hard and soft wheat classes has been the major ingredient of leavened bread for
many years because of its functional proteins (Abdelghafor et al., 2011). Bread is a bakery product
priced for its taste, aroma and texture (Malomo et al., 2011). Bread is baked aerated dough, the primary
ingredients of which are flour, salt and water. The aeration is normally obtained by fermentation with
yeast but may be obtained by other means (Ranken et al., 1997).
11
Bread has affected politics more recently in Russia and Eastern Europe. Former communist
governments in these regions sometimes put a hold on bread prices, or even rolled them back, to keep
their citizens from revolting (DiMuzio, 2010).
2.4.1 Definition of bread:
Bread is baked dough product made from cereal grains (mostly commonly wheat) ground into flour,
moistened and kneaded into dough and then baked, Often leavened by the action of bakers yeasts or by
addition of sodium bicarbonate (Merryweather et al., 2005). Bread is produced by making dough from
wheat flour and aerating this with carbon dioxide produced by yeast fermentation. The proportion of
water in the dough mixture varies with the type of equipment used but is normally within the range 55-
65% of the flour weight (Ranken et al., 1997).
In wheat-producing countries or areas, baked yeast bread is a major staple in people’s diet. This is
common in the major developed countries. In other countries, other forms of bread may be the major
staple.
The fact is that we can never form a concise definition of bread since it is characterized by all of
the ingredients we use to make it, and more besides (Cauvain and Young, 2007).
2.4.2 Physical characteristics of bread:
Bread is characterized by a crust, a dry thin layer that encloses a soft, sponge-like cellular structure.
The crust will usually have a light golden-brown color. In some bread products the color may be darker,
as when whole meal (whole wheat), brown or non-wheat flours are used in its production. Rye breads,
which are especially popular in Scandinavia, eastern and northern Europe, tend to produce darker crust
colors. Many different factors affect crust color, which appears during baking because of the Maillard
reaction (Cauvain and Young, 2006).
2.4.3 A Brief history of bread making:
Historical records have been found in ancient Egyptian tomb carvings dating from 3000 BC,
which show fermented bread being made from wheat flour and baked in clay ovens (Brennan, 2006).
The ancient Hebrews distinguished between the leavened and unleavened forms of bread. Even today
the unleavened bread is reserved for certain ceremonial occasions. Bread quickly took its place in the
psyche of humankind in the ancient world, and the technology spread rapidly wherever wheat and other
cereal grains could be grown. Later, as wheat and other grains began to be imported and exported
around the ancient world, the art of baking either spread with the grain or was discovered in different
12
locations. No doubt three thousand years ago bakers were developing their own distinctive style of
bread based on their cultural beliefs or just for the simple reason of wanting to be different from their
competitors(Cauvain and Young, 2006).
References to bread and baking begin to appear in Greek literature from the seventh century BC.
Wheat became so important that at one time its export from Greece was prohibited, and bread was such
a staple and important food that its weight and price were fixed in law. The place of wheat and bread in
religion remained pivotal and the Greeks built temples to the goddess Demeter, who has remained
associated with agriculture since those ancient times. The importance of bread was not lost on
successive Roman emperors either, and the goddess Ceres was high on the list of important gods. So
important was the provision of bread to the Romans, that it is considered that much of the expansion of
their empire was driven by the need to acquire control of more wheat-growing areas to feed her armies
and growing homeland population. Indeed, it is claimed by some that the Roman invasion of the British
Isles was mostly about acquiring control of the large wheat and barley growing areas that existed at that
time (Cauvain and Young, 2006).
2.4.4 Bread types:
Baked bread may come in different forms such as regular yeast breads, flat breads, and specialty
breads. Today, even retarded (chilled or frozen) doughs are available to meet consumers’ preferences
for a semblance of home-cooked food. For countries or areas with less available energy, other forms of
bread such as steamed bread and boiled breads are available. Fried breads are consumed mainly as
breakfast or snack items (Hui et al., 2007). Many different bread types have been evolved with the
passage of time and all require their own individual bubble structures, processing techniques, processing
equipment and process control mechanisms. To the environmental and cultural differences which have
influenced the type of bread which is predominant in a particular country has been added the
consequences of the various waves of refugees and immigrants which have moved between countries
(Cauvain and Young, 2007). The main bread types can be divided into four broad categories:
Pan breads – that is, products based on placing a piece of dough in a metal pan for the proving
and baking stages. Commonly the pan will be rectangular, though round pan shapes are known.
Sometimes the pan may have a separate lid fitted to more tightly control product shape.
Examples are the sandwich loaf (lidded), open-top pan breads, pan coburgs (round، unlidded),
milk rolls (round, lidded) and malt loaves (baked under inverted pans.
Free-standing breads – that is where the dough product is proved and baked without the aid of a
pan to constrain and support the sides of the dough. This approach leads to a crustier product.
Examples of this type of product include bloomers, cottage loaves and coburgs.
13
Baguettes, pain Parisien and other products made as long, stick-shaped loaves. Sometimes
placed on indented trays for proving and baking. Typically these products will have a high
degree of crust formation and characteristic surface markings.
Rolls and other small fermented breads baked on trays or indented pans. These products will
have higher levels of sugar and fat in the recipe and so typically will have a sweeter flavor and
softer eating character.
This movement of bread types between countries and cultures can pose problems for bakers.
For example, the manufacture of French bread may be considered a challenge to bakers outside
France. This is a challenge which can be overcome but does need an understanding of what makes
French bread what it is.
2.4.5 The difference between bread and other baked products:
Bread is regarded as a staple food and as such attracts regulation of its composition and sometimes
price. Biscuits, cakes, pastries and pies are regarded as discretionary purchases and avoid regulation.
Bread production is an extremely competitive business while the production of other baked goods is not
quite so competitive (Edward, 2007). Bread products are not highly flavored by comparison with other
baked products and many other foods (Cauvain and Young, 2000). The character of bread and other
fermented products then depends very heavily on the formation of a gluten network in the dough, not
just for trapping gas from yeast fermentation but also to make a direct contribution to the formation of a
cellular crumb structure which after baking confers texture and eating qualities quite different from
other baked products (Cauvain and Young, 2007).
2.4.6 Bread baking process:
Baking is at heart a process: the conversion of some relatively unpalatable ingredients (starch,
gluten, bran, in the case of most cereals) into the aerated, open cell sponge structure we know as bread
has taken millennia to develop (Brennan, 2006). The bread making process are related to the ability of
the dough to retain gas bubbles (air) and permit the uniform expansion of the dough piece under the
influence of carbon dioxide gas from yeast fermentation during proof and baking. Bread is produced by
making a dough from wheat flour and aerating this with carbon dioxide produced by yeast fermentation.
The proportion of water in the dough mixture varies with the type of equipment used but is normally
within the range 55-65% of the flour weight (Ranken et al., 1997).
Each country has its own particular methods of baking, but in essence bread is made by simply
mixing flour, water, yeast (and air) into a dough, allowing the yeast to ferment for some time to produce
14
an expanding aerated foam and then setting the structure at high temperature in an oven to produce
bread (Brennan, 2006).
2.4.7 The basic bread recipe:
Formulations for baked products will vary from country to country and from company to company.
Many companies guard their formulations assiduously (Cauvain and Young, 2000). The basic bread
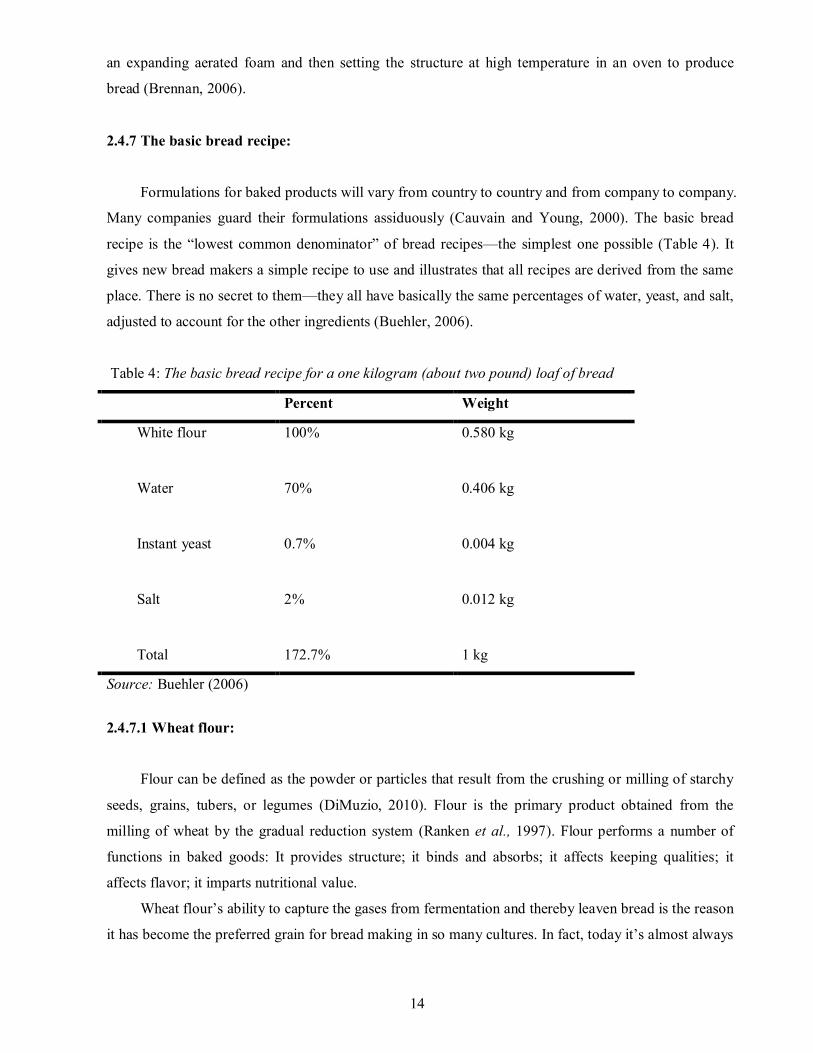
recipe is the “lowest common denominator” of bread recipes—the simplest one possible (Table 4). It
gives new bread makers a simple recipe to use and illustrates that all recipes are derived from the same
place. There is no secret to them—they all have basically the same percentages of water, yeast, and salt,
adjusted to account for the other ingredients (Buehler, 2006).
Table 4: The basic bread recipe for a one kilogram (about two pound) loaf of bread
Percent Weight
White flour
100% 0.580 kg
Water 70% 0.406 kg
Instant yeast
0.7%
0.004 kg
Salt
2%
0.012 kg
Total
172.7%
1 kg
Source: Buehler (2006)
2.4.7.1 Wheat flour:
Flour can be defined as the powder or particles that result from the crushing or milling of starchy
seeds, grains, tubers, or legumes (DiMuzio, 2010). Flour is the primary product obtained from the
milling of wheat by the gradual reduction system (Ranken et al., 1997). Flour performs a number of
functions in baked goods: It provides structure; it binds and absorbs; it affects keeping qualities; it
affects flavor; it imparts nutritional value.
Wheat flour’s ability to capture the gases from fermentation and thereby leaven bread is the reason
it has become the preferred grain for bread making in so many cultures. In fact, today it’s almost always

15
a given that, when we refer to flour in a recipe, with no other descriptors, we’re talking about flour
made from wheat only (DiMuzio, 2010).
Many bread labels include “wheat flour” as an ingredient. Wheat flour is not the same as whole
wheat flour. The names are similar, but the flours are different. Whole wheat flour is a whole grain,
milled from the whole wheat kernel. Wheat flour is another name for white flour, milled from the
endosperm. It is called wheat flour to distinguish it from rye flour, corn flour, oat flour, or rice flour.
This is a helpful distinction for those with allergies to wheat products, but it can mislead consumers into
thinking that wheat flour contains all the health benefits of whole wheat flour (Figoni, 2008).
In the Stone Age, flour that came from grains crushed by hand using rocks would have been quite
coarse and mealy. Ancient Egyptians used stones that were chiseled and shaped purposely for milling to
enable them to produce flour that was much finer in consistency. For approximately the next 6,000
years, this was the basic method used to mill flour (DiMuzio, 2010).
Wheat flour is used for bread making as a result of the viscoelastic properties of the dough when
water is added. There are two principal types of wheat flour: whole meal and white. In the case of whole
meal flour, the whole of the wheat grain is crushed to yield flour. Wheat flour’s ability to capture the
gases from fermentation and thereby leaven bread is the reason it has become the preferred grain for
bread making in so many cultures (DiMuzio, 2010).
In general the higher the protein content in the wheat the higher the protein content of the flours
produced from it. The higher the protein content of flour the better is its ability to trap carbon dioxide
gas and the larger can be the bread volume (Owens, 2001).
2.4.7.1.1 The wheat flour milling process:
The object of this milling process is to separate, as cleanly as possible, the endosperm of the grain
from the enveloping skins and embryo. How effectively this separation can be performed in a given mill
is a measure of its efficiency (Ranken et al., 1997). The term ‘coarse grains milling’ is a very broad one
that refers to the combination of the berries of the wheat, barley and other coarse grain crops. This is the
definition of milling as interpreted by an engineer or process manager. However, a cereal chemist or
quality assurance manager might interpret the term milling as the transformation of raw material into a
primary product for secondary processing. This definition encompasses every aspect of the
transformation, from raw material purchasing to quality assurance and product testing (Owens, 2001).
During milling of wheat to produce sifted white flour, about 30% of the wheat kernel is removed (70%
extraction rate) (Hamaker, 2008).
Milling methods and mixing technology didn’t change significantly for several millennia, but by the
early twentieth century, bakers began to consider the possibility of incorporating more advanced milling
and mixing methods into their production (DiMuzio, 2010). The cultivation of wheat for bread making
has played a key role in the development of modern civilization. The object of the milling process is to
16
remove the endosperm from the wheat grain with the minimum contamination of bran powder and germ
(Ranken et al., 1997).
2.4.7.1.2 Why we do mill wheat grain:
Because bakers demand flours that meet stricter specifications. The procedure for getting from
whole grain to white powder has become more technical and controlled. Initially, turning grain into
flour, or milling it, was done solely to create a meal or powder that more readily absorbed water
(DiMuzio, 2010).
2.4.7.1.3 Flour composition:
The specific composition of flour is critically important because it has a major influence on the
fermentation as well as the physical structure of the dough and finished bread. In the case of wholemeal
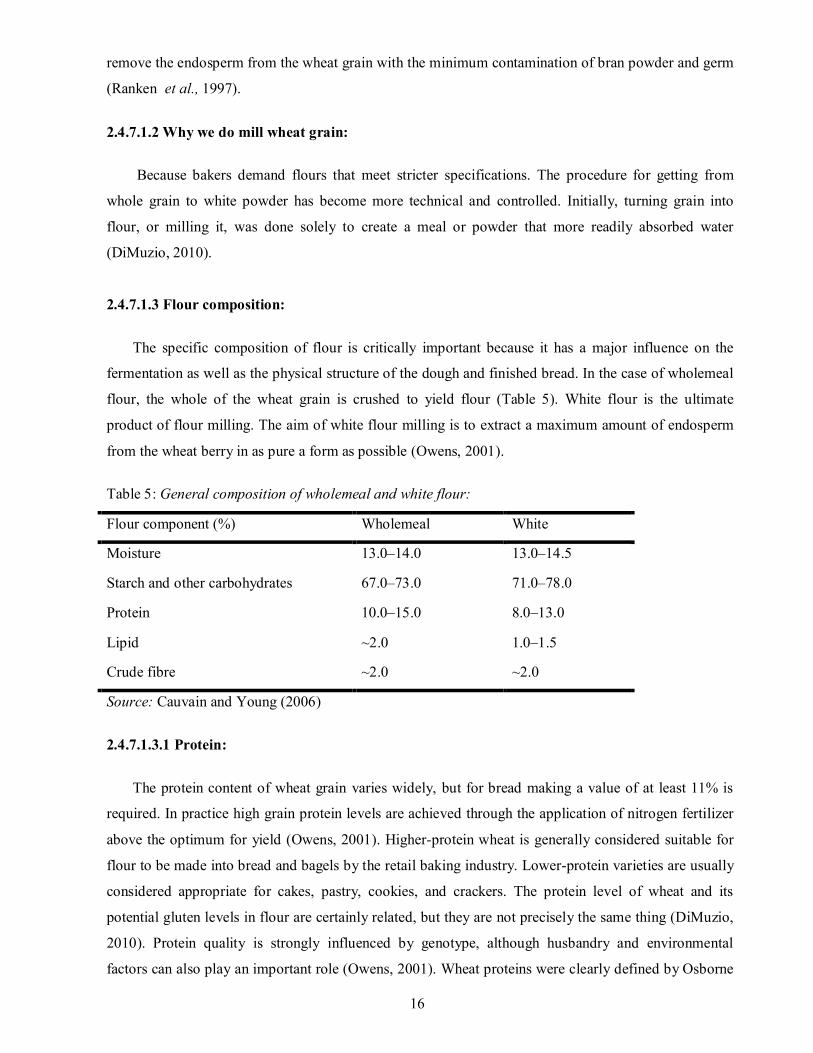
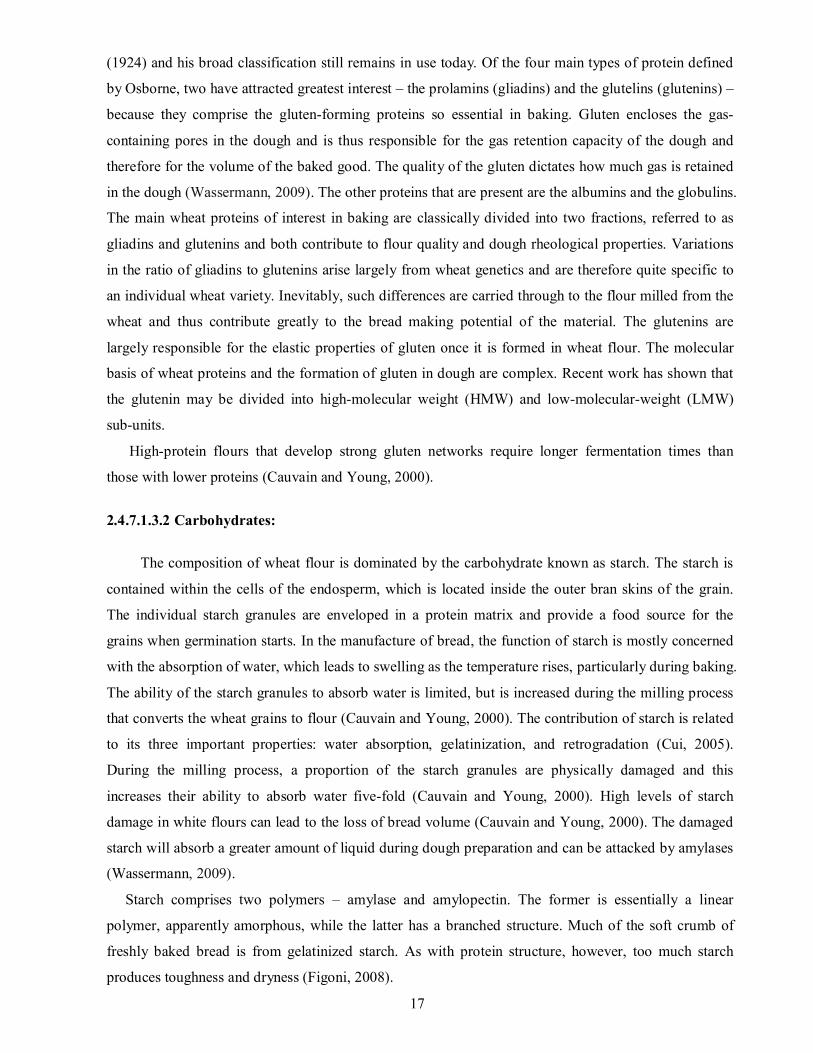
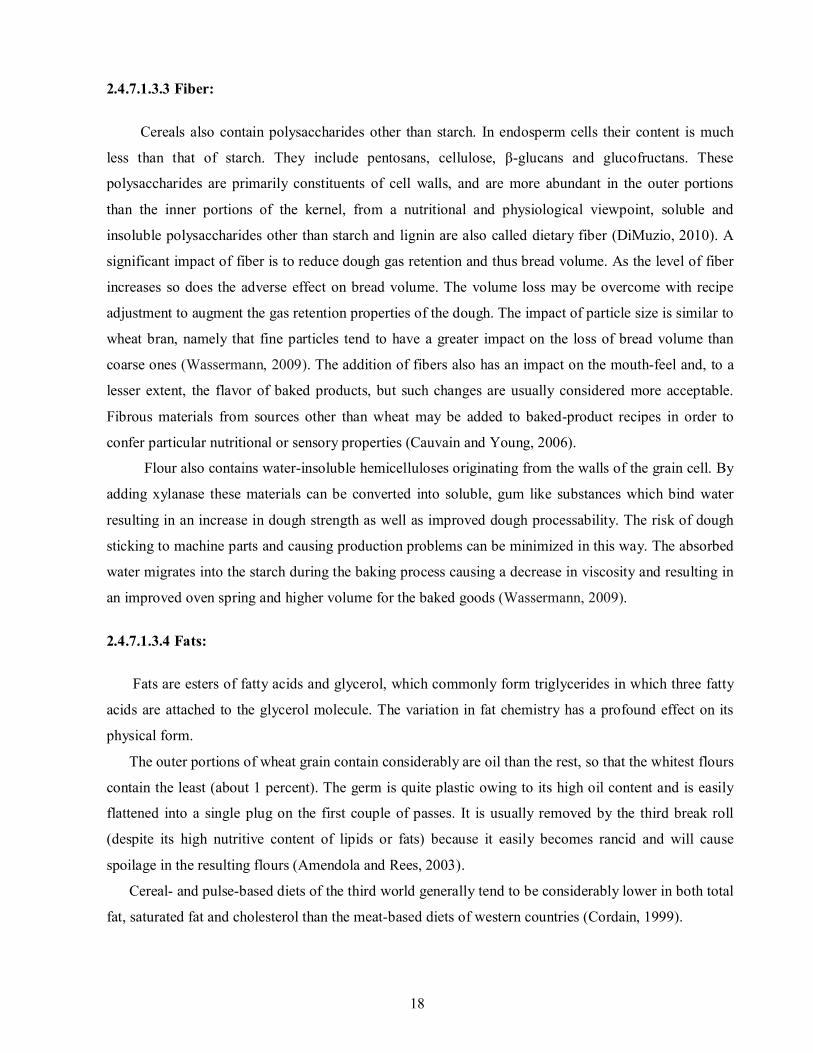
flour, the whole of the wheat grain is crushed to yield flour (Table 5). White flour is the ultimate
product of flour milling. The aim of white flour milling is to extract a maximum amount of endosperm
from the wheat berry in as pure a form as possible (Owens, 2001).
Table 5: General composition of wholemeal and white flour:
Flour component (%) Wholemeal White
Moisture 13.0–14.0 13.0–14.5
Starch and other carbohydrates 67.0–73.0 71.0–78.0
Protein 10.0–15.0 8.0–13.0
Lipid ~2.0 1.0–1.5
Crude fibre ~2.0 ~2.0
Source: Cauvain and Young (2006)
2.4.7.1.3.1 Protein:
The protein content of wheat grain varies widely, but for bread making a value of at least 11% is
required. In practice high grain protein levels are achieved through the application of nitrogen fertilizer
above the optimum for yield (Owens, 2001). Higher-protein wheat is generally considered suitable for
flour to be made into bread and bagels by the retail baking industry. Lower-protein varieties are usually
considered appropriate for cakes, pastry, cookies, and crackers. The protein level of wheat and its
potential gluten levels in flour are certainly related, but they are not precisely the same thing (DiMuzio,
2010). Protein quality is strongly influenced by genotype, although husbandry and environmental
factors can also play an important role (Owens, 2001). Wheat proteins were clearly defined by Osborne
17
(1924) and his broad classification still remains in use today. Of the four main types of protein defined
by Osborne, two have attracted greatest interest – the prolamins (gliadins) and the glutelins (glutenins) –
because they comprise the gluten-forming proteins so essential in baking. Gluten encloses the gas-
containing pores in the dough and is thus responsible for the gas retention capacity of the dough and
therefore for the volume of the baked good. The quality of the gluten dictates how much gas is retained
in the dough (Wassermann, 2009). The other proteins that are present are the albumins and the globulins.
The main wheat proteins of interest in baking are classically divided into two fractions, referred to as
gliadins and glutenins and both contribute to flour quality and dough rheological properties. Variations
in the ratio of gliadins to glutenins arise largely from wheat genetics and are therefore quite specific to
an individual wheat variety. Inevitably, such differences are carried through to the flour milled from the
wheat and thus contribute greatly to the bread making potential of the material. The glutenins are
largely responsible for the elastic properties of gluten once it is formed in wheat flour. The molecular
basis of wheat proteins and the formation of gluten in dough are complex. Recent work has shown that
the glutenin may be divided into high-molecular weight (HMW) and low-molecular-weight (LMW)
sub-units.
High-protein flours that develop strong gluten networks require longer fermentation times than
those with lower proteins (Cauvain and Young, 2000).
2.4.7.1.3.2 Carbohydrates:
The composition of wheat flour is dominated by the carbohydrate known as starch. The starch is
contained within the cells of the endosperm, which is located inside the outer bran skins of the grain.
The individual starch granules are enveloped in a protein matrix and provide a food source for the
grains when germination starts. In the manufacture of bread, the function of starch is mostly concerned
with the absorption of water, which leads to swelling as the temperature rises, particularly during baking.
The ability of the starch granules to absorb water is limited, but is increased during the milling process
that converts the wheat grains to flour (Cauvain and Young, 2000). The contribution of starch is related
to its three important properties: water absorption, gelatinization, and retrogradation (Cui, 2005).
During the milling process, a proportion of the starch granules are physically damaged and this
increases their ability to absorb water five-fold (Cauvain and Young, 2000). High levels of starch
damage in white flours can lead to the loss of bread volume (Cauvain and Young, 2000). The damaged
starch will absorb a greater amount of liquid during dough preparation and can be attacked by amylases
(Wassermann, 2009).
Starch comprises two polymers – amylase and amylopectin. The former is essentially a linear
polymer, apparently amorphous, while the latter has a branched structure. Much of the soft crumb of
freshly baked bread is from gelatinized starch. As with protein structure, however, too much starch
produces toughness and dryness (Figoni, 2008).
18
2.4.7.1.3.3 Fiber:
Cereals also contain polysaccharides other than starch. In endosperm cells their content is much
less than that of starch. They include pentosans, cellulose, β-glucans and glucofructans. These
polysaccharides are primarily constituents of cell walls, and are more abundant in the outer portions
than the inner portions of the kernel, from a nutritional and physiological viewpoint, soluble and
insoluble polysaccharides other than starch and lignin are also called dietary fiber (DiMuzio, 2010). A
significant impact of fiber is to reduce dough gas retention and thus bread volume. As the level of fiber
increases so does the adverse effect on bread volume. The volume loss may be overcome with recipe
adjustment to augment the gas retention properties of the dough. The impact of particle size is similar to
wheat bran, namely that fine particles tend to have a greater impact on the loss of bread volume than
coarse ones (Wassermann, 2009). The addition of fibers also has an impact on the mouth-feel and, to a
lesser extent, the flavor of baked products, but such changes are usually considered more acceptable.
Fibrous materials from sources other than wheat may be added to baked-product recipes in order to
confer particular nutritional or sensory properties (Cauvain and Young, 2006).
Flour also contains water-insoluble hemicelluloses originating from the walls of the grain cell. By
adding xylanase these materials can be converted into soluble, gum like substances which bind water
resulting in an increase in dough strength as well as improved dough processability. The risk of dough
sticking to machine parts and causing production problems can be minimized in this way. The absorbed
water migrates into the starch during the baking process causing a decrease in viscosity and resulting in
an improved oven spring and higher volume for the baked goods (Wassermann, 2009).
2.4.7.1.3.4 Fats:
Fats are esters of fatty acids and glycerol, which commonly form triglycerides in which three fatty
acids are attached to the glycerol molecule. The variation in fat chemistry has a profound effect on its
physical form.
The outer portions of wheat grain contain considerably are oil than the rest, so that the whitest flours
contain the least (about 1 percent). The germ is quite plastic owing to its high oil content and is easily
flattened into a single plug on the first couple of passes. It is usually removed by the third break roll
(despite its high nutritive content of lipids or fats) because it easily becomes rancid and will cause
spoilage in the resulting flours (Amendola and Rees, 2003).
Cereal- and pulse-based diets of the third world generally tend to be considerably lower in both total
fat, saturated fat and cholesterol than the meat-based diets of western countries (Cordain, 1999).
19
2.4.7.1.3.5 Mineral content/ ash:
Minerals are the inorganic substances present in wheat that are derived from the soil. Wheat flour
contains anywhere from 1 to 2 percent minerals. Ash content is affected by the soil itself, rainfall, type
and amount of fertilizer, and so on. Once again, during milling most of the wheat kernel that contains
significant proportions of minerals is removed with the bran and germ. The minerals that remain in
white flour are actually in excess of what minerals occur in the endosperm. Thus, the ash content of the
flour is directly related to the amount of bran particles in the flour (Amendola, and Rees, 2003).
2.4.7.1.4 Different flours for different requirements:
Not every flour is going to do the same job well, so over the years “flour” has become many,
many “flours.” Pastry chefs today are presented with a bewildering array of flours tailored to meet
specific requirements in different products. The big variable at the heart of this proliferation is protein
content (and quality) and its consequences for gluten development. Modern milling practices can further
modify the inherent ability of a specific wheat through choices in blending, milling, and processing
(Amendola, and Rees, 2003).
There are two principal types of wheat flour are whole meal and white (Cauvain and Young, 2000).
Flour of course is the main ingredient in baked goods. Flour is normally supplied to meet a specification.
In some cases the specification is very wide or it is very tight. Some specifications ensure that the flour
is fit for making a specific product, e.g. bread. The description of flour types required for baked
products varies and can be confusing (Cauvain and Young, 2006).
2.4.7.1.4.1 Bread flour:
Bread flour is milled from either hard red spring or hard red winter wheat. It is high in protein—
typically 11.5–13.5 percent proteins that forms good-quality gluten, essential for high volume and fine
crumb in yeast-raised baked goods. Because it is from hard wheat kernels, bread flour is more difficult
for the miller to grind into flour. This is why bread flour is coarser in texture than pastry flour, and why
it contains a higher percentage of broken and fragmented starch granules. These damaged starch
granules absorb more water than intact granules, which is generally considered desirable in bread-
making. Damaged granules are also more susceptible than intact ones to breakdown by amylase,
making more sugar available to yeast for fermenting into carbon dioxide gas and alcohol. Bread flour
can be purchased unbleached or bleached. Sometimes it contains added malted barley flour to provide
for better yeast fermentation, dough handling, and shelf life. Bread flour is typically used for pan breads,
20
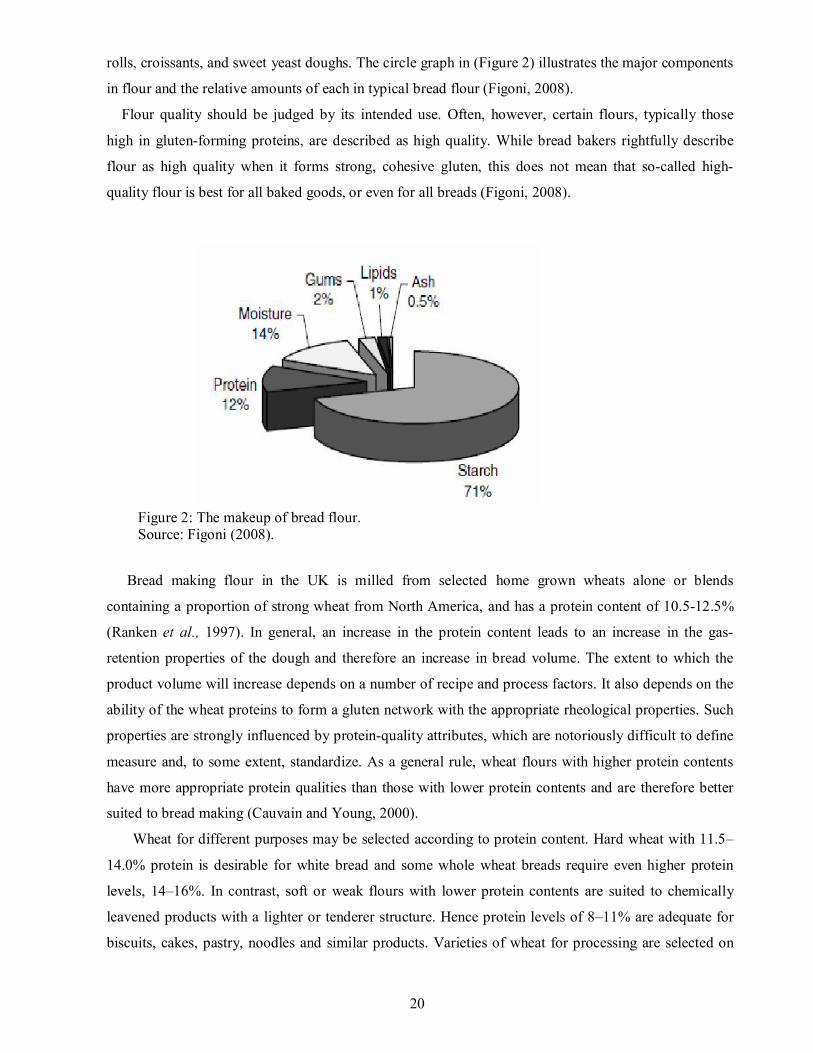
rolls, croissants, and sweet yeast doughs. The circle graph in (Figure 2) illustrates the major components
in flour and the relative amounts of each in typical bread flour (Figoni, 2008).
Flour quality should be judged by its intended use. Often, however, certain flours, typically those
high in gluten-forming proteins, are described as high quality. While bread bakers rightfully describe
flour as high quality when it forms strong, cohesive gluten, this does not mean that so-called high-
quality flour is best for all baked goods, or even for all breads (Figoni, 2008).
Bread making flour in the UK is milled from selected home grown wheats alone or blends
containing a proportion of strong wheat from North America, and has a protein content of 10.5-12.5%
(Ranken et al., 1997). In general, an increase in the protein content leads to an increase in the gas-
retention properties of the dough and therefore an increase in bread volume. The extent to which the
product volume will increase depends on a number of recipe and process factors. It also depends on the
ability of the wheat proteins to form a gluten network with the appropriate rheological properties. Such
properties are strongly influenced by protein-quality attributes, which are notoriously difficult to define
measure and, to some extent, standardize. As a general rule, wheat flours with higher protein contents
have more appropriate protein qualities than those with lower protein contents and are therefore better
suited to bread making (Cauvain and Young, 2000).
Wheat for different purposes may be selected according to protein content. Hard wheat with 11.5–
14.0% protein is desirable for white bread and some whole wheat breads require even higher protein
levels, 14–16%. In contrast, soft or weak flours with lower protein contents are suited to chemically
leavened products with a lighter or tenderer structure. Hence protein levels of 8–11% are adequate for
biscuits, cakes, pastry, noodles and similar products. Varieties of wheat for processing are selected on
Figure 2: The makeup of bread flour. Source: Figoni (2008).
21
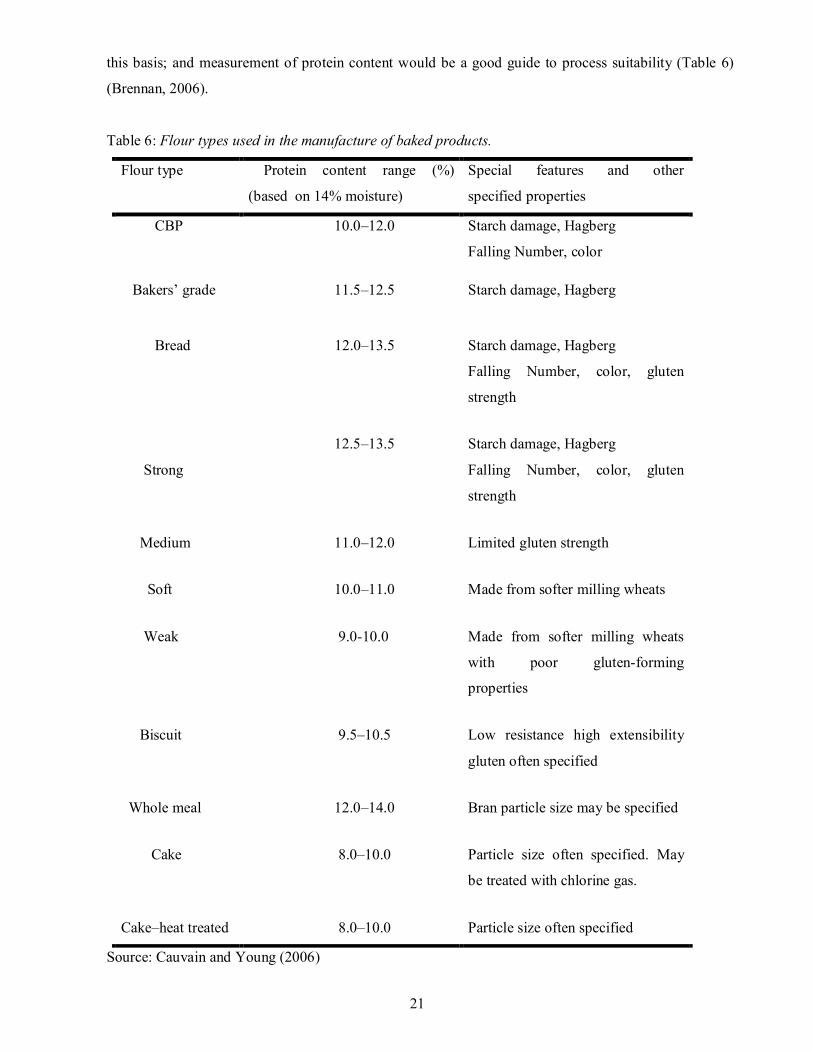
this basis; and measurement of protein content would be a good guide to process suitability (Table 6)
(Brennan, 2006).
Table 6: Flour types used in the manufacture of baked products.
Flour type Protein content range (%)
(based on 14% moisture)
Special features and other
specified properties
CBP 10.0–12.0 Starch damage, Hagberg
Falling Number, color
Bakers’ grade 11.5–12.5
Starch damage, Hagberg
Bread 12.0–13.5
Starch damage, Hagberg
Falling Number, color, gluten
strength
Strong
12.5–13.5 Starch damage, Hagberg
Falling Number, color, gluten
strength
Medium 11.0–12.0 Limited gluten strength
Soft 10.0–11.0 Made from softer milling wheats
Weak 9.0-10.0 Made from softer milling wheats
with poor gluten-forming
properties
Biscuit 9.5–10.5 Low resistance high extensibility
gluten often specified
Whole meal 12.0–14.0 Bran particle size may be specified
Cake 8.0–10.0 Particle size often specified. May
be treated with chlorine gas.
Cake–heat treated 8.0–10.0 Particle size often specified
Source: Cauvain and Young (2006)
22
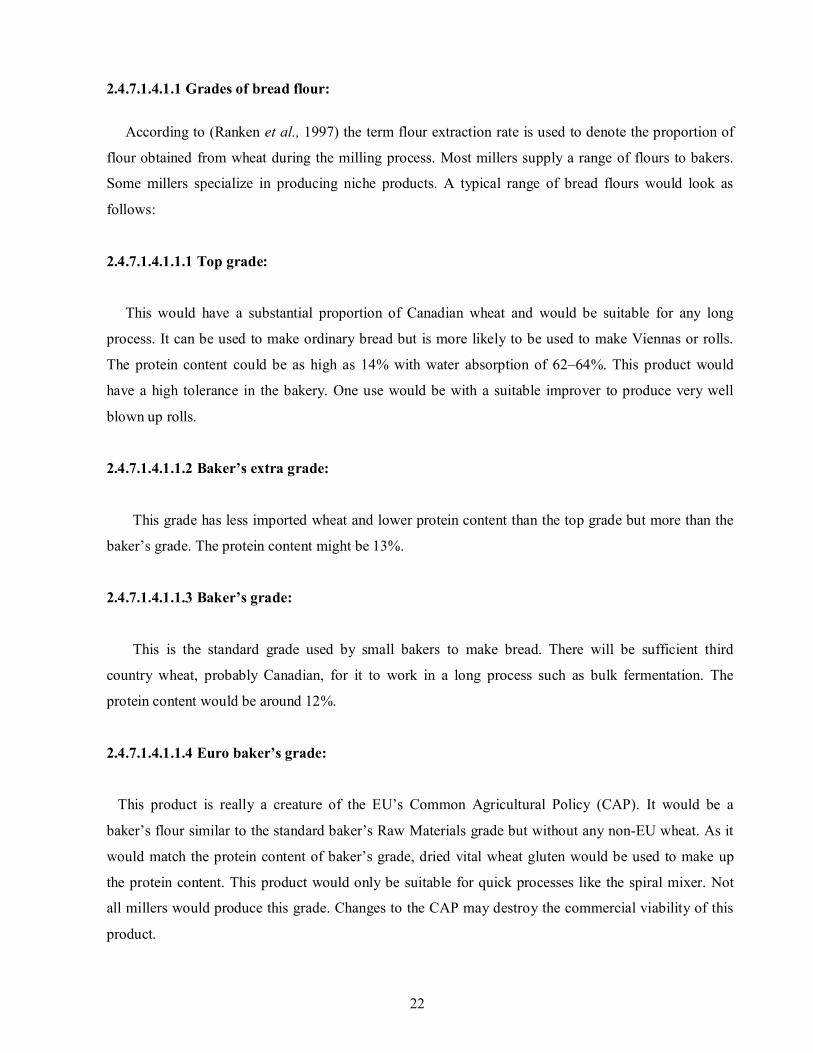
2.4.7.1.4.1.1 Grades of bread flour:
According to (Ranken et al., 1997) the term flour extraction rate is used to denote the proportion of
flour obtained from wheat during the milling process. Most millers supply a range of flours to bakers.
Some millers specialize in producing niche products. A typical range of bread flours would look as
follows:
2.4.7.1.4.1.1.1 Top grade:
This would have a substantial proportion of Canadian wheat and would be suitable for any long
process. It can be used to make ordinary bread but is more likely to be used to make Viennas or rolls.
The protein content could be as high as 14% with water absorption of 62–64%. This product would
have a high tolerance in the bakery. One use would be with a suitable improver to produce very well
blown up rolls.
2.4.7.1.4.1.1.2 Baker’s extra grade:
This grade has less imported wheat and lower protein content than the top grade but more than the
baker’s grade. The protein content might be 13%.
2.4.7.1.4.1.1.3 Baker’s grade:
This is the standard grade used by small bakers to make bread. There will be sufficient third
country wheat, probably Canadian, for it to work in a long process such as bulk fermentation. The
protein content would be around 12%.
2.4.7.1.4.1.1.4 Euro baker’s grade:
This product is really a creature of the EU’s Common Agricultural Policy (CAP). It would be a
baker’s flour similar to the standard baker’s Raw Materials grade but without any non-EU wheat. As it
would match the protein content of baker’s grade, dried vital wheat gluten would be used to make up
the protein content. This product would only be suitable for quick processes like the spiral mixer. Not
all millers would produce this grade. Changes to the CAP may destroy the commercial viability of this
product.
23
2.4.7.2 Common salt (sodium chloride):
Common salt, or simply salt, refers to sodium chloride which is a white, crystalline product,
consisting of the elements sodium and chlorine and has the chemical formula NaCl (Hashmi, 1996). Salt
is used for a variety of purposes in the manufacture of baked products. First and foremost it makes a
major contribution to product flavor. It is also important, because of its ionic nature, in the control of
product water activity and therefore mould-free shelf-life, in the manufacture of fermented products,
salt limits the activity of yeast in dough and so recipes should be balanced to take this into account. The
lower the level of salt in the dough the lower the yeast level will be to maintain a given proof time.
There is also some impact of salt on gluten formation in the dough-making stage (Cauvain and Young,
2000).
Salt levels vary in fermented products according to local tastes. Too little salt and the bread taste
insipid, too much and it tastes too salty. The more salt we use in a given recipe the more yeast will be
needed to achieve a given proof time (Owens, 2001). The quantity used is usually 1.8-2.1 % on flour wt,
giving a concentration of 1.1-1.4 % of salt in the bread. Salt is added as an aqueous solution (brine) or
as the dry solid (Kent and Evers, 1994).
2.4.7.3 Yeast (Saccharomyces cerevisiae):
Yeasts are fungi that grow vegetatively as single-celled organisms; the distinction between yeasts
and other fungi is sometimes murky; fungi such as rusts and smuts grow as single cells during part of
their life cycle and as typical mold-like mycelia during other parts.
All yeasts grow vegetatively by budding or by binary fission. Ascomycetous yeasts are
distinguished by the fact that during sexual reproduction spores are produced inside a specialized
structure known as an ascus, whereas basidiomycetous yeasts produce external spores on a structure
known as a basidium. Although a yeast lifestyle has been adopted by members of three of the four the
major fungal groupings (Basidiomycetes, Ascomycetes, and Fungi imperfect, but not Phycomycetes),
most yeasts of interest to the baking industry are biologically members of the Ascomycetous genus
Saccharomyces. However, because fungal taxonomy relies on the identification of reproductive
structures, yeasts that have lost the capacity for sexual reproduction are automatically classified among
the Fungi imperfecti. In 1983, Saccharomyces minor and Saccharomyces cerevisiae were found by
Kazanskaya et al. in spontaneous sourdoughs from Russian bakeries (Kulp and Lorenz, 2003).
Baker’s yeast, Saccharomyces cerevisiae, is used to produce carbon dioxide in the manufacture of
bread, rolls and other fermented products. Instant dry yeast combines the ease of use of fresh yeast with
the convenient storage of active dry yeast. There is no need to dissolve it first in warm water; in fact, the
24
manufacturer prefers that you mix it first with the flour before adding any liquids (DiMuzio, 2010).
Saccharomyces cerevisiae hydrolyzes maltotriose, although trisaccharides are fermented to a lesser
extent. The yeast does not ferment malto-oligosaccharides with degree of polymerization (DP) 4 to 8,
nor did the presence of glucose stimulate their fermentation, probably due to a lack of the appropriate
transport system for these oligosaccharides (Kulp and Lorenz, 2003). It acts on simple sugars to produce
both carbon dioxide and alcohol; the alcohol is driven off during baking and so is of limited relevance
to baked products. The carbon dioxide is an important part of the expansion of baked products and
contributes significantly to changes in texture and eating quality (Wassermann, 2009).
There is no rule of thumb for how much yeast to use, since that is determined by the length of
fermentation time desired (for development of complex flavors) and whether lots of sugar and fat are in
the dough (Amendola and Rees, 2003).The higher level of yeast presents in the recipe, the faster the rate
at which carbon dioxide will be produced. The reaction is very temperature sensitive and increases as
the temperature rises to 40–43°C. Thereafter, the rate of evolution of carbon dioxide falls until the yeast
is inactivated at 55°C. This temperature profile is critical in the manufacture of bread and fermented
products (Wassermann, 2009).
Too much sugar will damage yeast by an osmotic dehydration mechanism. This is why volume
expansion is always a problem for sweet bread bun. Similarly, salt can inhibit yeast growth, and too
much salt will slow down the proving process (Hui et al., 2007).
Baker’s yeast is marketed in different forms, i.e., compressed yeast (CY), cream yeast (CmY), and
instant yeast (IADY). The chemical parameters describing these products are moisture, protein, and
phosphorus. Using the strain typified as no. 7752 of the American Type Culture Collection for ADY, it
is reported that higher yields of yeast on a sugar basis are achieved, but these are lower in proteins and
phosphorus than the CY. However, they generate less carbon dioxide, indicating a lower activity than
that in CY which needs to be compensated for by a higher level of yeast solids in order to achieve an
equivalent leavening power in bread fermentations (Kulp and Lorenz, 2003). Active dry yeast was
created to help solve the storage and shelf life limitations of fresh yeast. By surrounding live, active
cells with dead cells and removing most of their moisture, yeast manufacturers were able to provide a
reliable source of yeast activity that could be kept in sealed packages for a year or more after
manufacture. Another possible plus is that the dead yeast cells in the product produce a type of protein
called glutathione, which can act as a natural relaxer in bread dough that is otherwise too tight and
inextensible (DiMuzio, 2010).
Bakers’ yeast (S. cerevisiae) has a facultative metabolism, meaning that it can use glucose by either
aerobic (i.e., via the tricarboxylic acid or TCA cycle) or anaerobic pathways the former pathway yields
much more cell mass and more ATP per glucose than the anaerobic pathway (Hutkins, 2006).
Maximum fermentation rates for commercial baker’s yeasts range from 0.3 to 0.7 g carbohydrate
consumed per gram yeast solids per hour.This rate is reached only gradually. Yeast fresh from the
25
manufacturer is in a resting state and requires time to revive and adjust to its new environment. The
time required depends primarily on fermentation temperature and ranges from 30 min at 1070F to 150
min at 840 F. Thus, a baker’s yeast added to dough will not reach maximal activity until well after the
dough is mixed (Kulp and Lorenz, 2003).
Yeast cells possess a variety of transport enzymes to bring sugars from the environment into the cell
where they can be metabolized. The monosaccharides glucose and fructose, molecules consisting of a
single sugar unit, can be used directly, whereas the disaccharides sucrose (glucose plus fructose) and
maltose (glucose plus glucose) must be broken down to their component monosaccharides before they
are metabolized. Glucosesensing molecules (receptors) in the cell membrane monitor the presence of
glucose and signal the cell to synthesize hexose transporters and begin importing glucose for energy
production. The sensor molecules themselves, though closely related to transporters, are specialized for
signaling and do not transport glucose themselves. Glucose and maltose are naturally present in flour,
and additional amounts are released by the action of flour and bacterial amylases on broken or damaged
starch granules. Sucrose or fructose may be added by the baker as table sugar or syrup (Kulp and
Lorenz, 2003).
Baker’s yeasts in general are capable of utilizing a variety of sugars present in flour: glucose,
fructose, mannose, maltose, and sucrose. On the other hand, they do not utilize the pentoses xylose or
arabinose, and consume raffinose only partially (Kulp and Lorenz, 2003).
2.4.7.4 Water:
Water is a critical component in carbohydrate systems because it interacts with all components of
the bread. It facilitates intra- and inter-molecular association of the protein, solvates small molecules
such as sugar and salt, and is a key component in the transformation of starch crystalline structure to
amorphous. As a result, many of the dough‘s physicochemical properties are related to the amount and
state of water (Crockett, 2009).
Chemically, water is the simplest ingredient used in baking (two atoms of hydrogen and one of
oxygen), but because of its special properties it plays many significant roles in baking, final product
quality and product shelf-life (Cauvain and Young, 2000). Water is present in many ingredients that are
used in baking, such as liquid egg, or it may be added as a separate ingredient. It has key roles
associated with the solubilising and dispersion of ingredients during the mixing process and in the
formation of complexes such as gluten in bread and fermented doughs. In the final product, the water
(moisture) content makes major contributions to eating quality and shelf-life. The level of water used in
a given product recipe needs to be optimized in order to achieve the required handling properties of the
intermediate (dough, batter, paste) and final product character. In the case of bread dough, optimum
water levels are associated with the ability to handle the dough during processing and the actual levels
26
used should be as high as possible while remaining consistent with processing requirements. The
temptation to reduce added water levels in bread dough should be avoided, because of the contribution
it makes to dough development. Often, the stickiness that bakers associate with too much water comes
instead from under-development of the dough: that is, the dough has not achieved its full potential.
Improvements in the underlying dough development often allow an increase in added water levels
(Cauvain and Young, 2000).
2.4.7.5 Optional ingredients:
The bread making quality of freshly milled white flour improves with age due to the action of
atmospheric oxygen; the gluten is rendered more stable and stronger and also more elastic. At one time
millers never despatched flour to a baker until it had been stored for several weeks and thus had
undergone this natural 'ageing'. Natural aging has a few disadvantages. First, it requires time, often
several weeks or months. During this time, the four takes up valuable silo space and is not paying the
bills (Figoni, 2008).
Millers often add small amounts of additives to flour. Some of these additives are also available to
bakers for mixing directly into dough. The types and amounts of additives that are allowed are strictly
regulated by government agencies (Figoni, 2008). By law, millers must label flour with the additives it
contains. There are several different types of flour additives. Some improve the nutrient content of flour
and are required by law. Others improve dough handling or baking properties, or whiten the color of
flour. A few of the main flour additives are described in the following (Figoni, 2008).
2.4.7.5.1 Sugar:
Similarly to fat, sugar also functions to reduce dough viscosity and relaxation time, as well as to
delay the effect of chemical leavening agents during baking. Moreover, sugar could increase the
temperature of the starch phase transition. To reduce the sugar content in bakery products, sugar
replacers might be used. Sucrose confers sweetness and color to baked products, but also has a key
function in structure formation. In particular, the concentration of sucrose solution in a recipe has a
significant effect on the gelatinization characteristics of wheat and other starches – the higher the
sucrose concentration, the more significant the delay in the gelatinization temperature of the starch
(Cauvain and Young, 2000).
2.4.7.5.2 Ascorbic acid:
Ascorbic acid has a number of uses in the manufacture of baked products, but by far its main use is
as an oxidizing agent in the production of bread and fermented products. In the strict chemical sense,
27
ascorbic acid is a reducing agent and sometimes described as an anti-oxidant, in the breadmaking
process, the availability of oxygen allows for its conversion to dehydroascorbic acid, which then acts as
an oxidizing agent and plays an essential part in the development of gluten in modern bread making
processes. Ascorbic acid may be used at low levels of addition (<50 ppm flour weight) in the
manufacture of laminated products to increase their lift. The list of other oxidizing agents permitted for
breadmaking is quite small. Commonly, in many parts of the world, ascorbic acid is the only one, but
the use of potassium bromate, azodicarbonamide and calcium peroxide as bread improvers is retained in
the USA and some other countries. While several bromate replacers are available, ascorbic acid is one
of the most popular (Figoni, 2008).
2.4.7.5.3 Alpha-amylases:
The source of amylase—more specifically called alpha-amylase—added by the miller makes a
surprising difference in the quality of baked bread. This is because not all amylase is alike. Different
amylase enzymes are inactivated at different oven temperatures. Since amylase can have its greatest
activity on bread dough during baking, its heat stability is extremely important. Fungal amylase, for
example, typically is inactivated before starch granules gelatinize, which is when the granules are most
susceptible to its action (Figoni, 2008).
Saccharomyces cerevisiae lacks a-amylases, but in dough systems, flour and/or exogenous amylases
split starch molecules into fermentable sugars and malto-oligosaccharides (Kulp and Lorenz, 2003).
Flour naturally contains small amounts of enzymes called amylases and diastases that can break down
starch into simple sugars needed by yeast (Amendola, and Rees, 2003). Amylase —also known as
diastase—breaks down starches into sugars and other molecules. A certain amount of starch breakdown
is desirable because this softens bread and keeps it from becoming stale too quickly (Figoni, 2008).
2.4.7.5.4 Emulsifiers:
Many different emulsifiers provide a wide range of functions in baked goods .In all cases,
emulsifiers function by interacting with other ingredients. For example, emulsifiers interact with fats
and oil droplets, helping to disperse them more evenly throughout batters and dough (Figoni, 2008).
The addition of fat or emulsifiers directly aids the incorporation of air bubbles into the dough, or if they
do then their contribution is small by comparison with that of the gluten network. However, fats and
emulsifiers certainly do play a role in the stabilization of the air bubbles once they have been
incorporated into bread dough and during subsequent processing (Cauvain and Young, 2001).

28
2.4.7.5.5 Hydrocolloids:
Food gums/hydrocolloids are often the determinants of texture, other quality attributes, stability,
and applicable processing methods, even when naturally occurring and not added as ingredients. Often
gum/hydrocolloid producers reduce the average molecular weights of their products in order to have
available different viscosity grades; such depolymerization increases the polydispersity. Additional
analytical difficulties result from the generally low concentrations (0.01 to 1%), the range of use levels
in foods, and the increased use of blends of gums to extend functionalities.These factors complicate
determination of the types and amounts of polysaccharides in a food product (Eliasson et al., 2006).
2.4.8 Methods of bread production:
The manufacture of all baked products is based on complex interactions between ingredients,
formulation and processing methodologies and capabilities – change one aspect of the relationship and
the nature of the interaction changes, resulting in one or more changes in product quality. The
processing methodologies used in the manufacture of baked products today are the result of many years
of, mainly, trial and error research (Cauvain and Young, 2000). Generally, the production of bread and
bakery products consists of several common steps, including:
1) Prepare basic and optional ingredients.
2) Prepare yeast or sourdough for inoculation.
3) Mix proper ingredients to make dough.
4) Ferment.
5) Re-mix dough (optional).
6) Sheet.
7) Mold and pan.
8) Proof in a temperature- and relative-humidity-controlled chamber.
9) Decoratively cut the dough surface (optional).
10) Bake, steam, fry, or boil.
11) Cool.
12) Pack.
13) Store.
Each step plays an important role in achieving high and consistent product quality (Hui et al., 2007). 2.4.9 The steps of baking process:
The baking process can be divided into three main processes: mixing, fermentation (or proof), and
baking according to (Brennan, 2006).
29
2.4.9.1 Mixing:
Mixing can be done either by hand or by machine (Edward, 2007). The first significant process in
the manufacture of any baked product is the blending together of the ingredients used in the recipe.
Mixing of bread dough has three main functions:
(a) To blend and hydrate the dough ingredients.
(b) To develop the dough and.
(c) To incorporate air into the dough.
In the production of doughs, the nature of the mixing action develops the viscoelastic properties of
gluten and also incorporates air, which has a major effect on their rheology and texture (Brennan, 2006).
There is an intimate relationship between mixing, aeration and rheology, the design and operation of the
mixer develops texture, aeration and rheology to different extents; and conversely the rheology of the
food affects the time and energy input required to achieve optimal development. This is seen in the
great variety of mixers used in the baking industry, where certain mixers are required to produce a
desired texture or rheology in the bread (Brennan, 2006). The most common way to increase energy
transfer during mixing is to increase mixing time. However, this does not change the rate at which
energy is transferred and only applies until the resistance of the dough decreases as its temperature rises
above 35°C or so (Cauvain and Young, 2000). Optimum work input or mixing time has been related to
optimum bread making performance, which varies depending on mixer type, flour composition and
ingredients (Brennan, 2006).
The strong relationship between mixing and handling and baking properties has resulted in a large
number of commercial force-recording dough mixers, such as the Farinograph and Mixograph, which
are used to determine the optimum in mixing speed and energy. Mixing doughs by elongational flow in
sheeting to achieve optimum development requires only 10–15% of the energy normally used in
conventional high-speed shear mixers, suggesting that much higher rates of work input can be achieved
due to the enhanced strain hardening of doughs under extension (Brennan, 2006).
First add water. Then add the flour. Add the yeast on top of the flour and swirl to disperse it into
the flour. Use your hand or a spoon to mix the poolish, squashing any flour lumps. At first you will feel
stringy flour globs throughout the mixture. When these are gone, you will find smaller lumps to squash.
Mix until there is no dry flour left (Buehler, 2006).
In the case of such products, the end of mixing was defined as being that moment during mixing at
which the dough mass reached 40–42°C, if sodium metabisulphite (SMS) was present as a reducing
agent, and 44–46°C if SMS was not present. This approach to defining the end point of mixing has
largely been confined to this one area of baking (Cauvain and Young, 2000).
30
Mixing beyond the optimum (overmixing) is thought to damage the dough, causing the gluten
network to break down, resulting in more fragile bubble walls and less gas retention and lower baking
volume, Over mixing can also result in sticky, difficult to handle doughs which causes production
problems (Brennan, 2006).
2.4.9.2 Fermentation (Proof):
Fermentation, or proof, is the critical step in the bread making process, where the expansion of air
bubbles previously incorporated during mixing provides the characteristic aerated structure of bread,
which is central to its appeal (Brennan, 2006). Fermentation involves allowing yeast in dough to convert
sugars into carbon dioxide. It typically occurs in two separate stages—bulk fermentation and final
proofing and can take several hours to complete (Figoni, 2008). The yeast used in bakery products is
Saccharomyces cerevisiae. Various yeast strains have been developed to have different tolerances to
osmotic dehydration and therefore suit different types of bread (Hui et al., 2007). During proof, the gas
content within the dough increases from around 4–8% to approximately 80%. The growth and stability
of the gas bubbles during proof determine the ultimate expansion of the dough and its final baked
texture and volume (Brennan, 2006). In the initial stages of bread-making, the CO2 produced stays in
solution until the water phase becomes saturated. At this point, all further CO2 diffuses into the existing
gas cells produced during mixing (Rosa and Péter, 2006). Dough is normally proved at 380 C, as yeast is
most active within the temperature range of 25–400C. Proving time is dependent on the yeast level,
proving temperature, and humidity. Increasing the yeast level is likely to speed up the proving process
(Hui et al., 2007).
The fermentation conditions should be controlled in order to get optimum and consistent results.
The precise length of fermentation time depends on a number of factors, including the level of yeast and
salt in the recipe and the temperature at which the fermentation is carried out. There is a close
relationship between flour strength and the length of fermentation time. High-protein flours that develop
strong gluten networks require longer fermentation times than those with lower proteins (Cauvain and
Young, 2000). When the dough enters the prover, it will be at a temperature of 28 to 30ºC. Bakers’
yeast is at its most active at 35 to 40º C and so running the prover around 40ºC minimizes the time
required for proof. It is important that the skin of the dough remains flexible so that it does not tear as it
expands. Since the dough relative humidity is around 90–95% a moist atmosphere is required to
maintain that skin flexibility (Owens, 2001).
31
2.4.9.3 Dividing/scaling/depositing:
After mixing the bulk dough is divided to generate the shape and size of product required (Owens,
2001). On the commercial scale no baked products are mixed to deliver a single unit size. This means
that in practice the large bulk of the mix must be divided into smaller units for further processing. The
main aim of all dividing/scaling/depositing processes is to deliver the unit size product for further
processing without significant change in the intrinsic properties of the matrix concerned. The dividing
process is commonly achieved by filling a chamber of known dimensions with a dough, batter or paste
of known and fixed density. This relationship between chamber volume and matrix density is important,
because most bakery products need to be manufactured to a given weight. In some cases this is for legal
weight-control reasons while in others it is so that variations between individual products will be limited
(Cauvain and Young, 2000).
2.4.9.4 Forming/moulding/shaping:
After the bulk of material from the mixer has been divided into unit sized pieces, it is common for
the individual pieces to undergo some change in form or shape to fit the particular product concept
(Cauvain and Young, 2000). The most common shaping is by rounding, an action which mimics that
carried out by hand in the craft bakery. The action of mechanical first moulding places the dough under
stress and strain which may lead to damage to the existing gas bubble structure in the dough (Owens,
2001).
The shaping of a dough piece in bread manufacture is typically a two-stage process, often
separated by a short rest. It is not unusual for the dough piece to be moulded first into a round ball shape
and later into some form of cylinder. There may be a short rest period, known as first or intermediate
proof, between the two moulding stages. In both moulding stages the rheological properties of the
dough are very important in deciding the final product quality (Cauvain and Young, 2000). During
rounding the dough piece is rotated on its axis between the two inner surfaces of a V- or U-shaped
trough, where one side is driven and the other fixed or moving at a lower speed. The dough piece
quickly forms the shape of the trough as it moves under the force of the driven side. The key functions
of the final moulder are to shape the dough to fit the product concept and to re-orientate the cell
structure (Owens, 2001).
It is especially important that the relatively delicate bubble structure in the dough piece is not
damaged during moulding otherwise loss of quality may occur. Damage to the gluten membrane that
separates the gas bubbles allows them to coalesce more readily before baking and can lead to the
formation of large holes and discolored, firm-eating patches in the crumb (Cauvain and Young, 2000).
32
2.4.9.5 Expansion and relaxation:
In many cases, usually bread dough and pastes, the passage of baked products from mixer to oven
is interrupted by a stage of limited activity. A common aim of this interruption is to modify the
rheological properties of the material to prepare it for baking and to obtain improved product quality. In
the manufacture of bread, the moulded dough pieces are transferred to a warm and moist environment in
which the yeast continues to produce carbon dioxide gas and inflate the nitrogen gas-bubble nuclei.
Provided the gas is retained in the dough, it will expand and may more than double its original size in a
defined time period. The process employed is commonly referred to as proof (Cauvain and Young,
2000).
The limit of expansion of these bubbles is related directly to their stability, due to retardation of
coalescence and loss of gas when the bubbles fail. The rheological properties of the expanding bubble
walls are therefore important in maintaining stability in the bubble wall and promoting gas retention
(Brennan, 2006).
2.4.9.6 Baking:
Baking is a complex unit operation involving simultaneous heat and mass transfer mechanisms.
Heat is supplied to the dough through radiation, convection, and conduction. Thermal reactions
including starch gelatinization and protein denaturation are activated (Hui et al., 2007). Within the first
few minutes of baking, the volume of the dough increases rapidly and reaches the maximum size of the
loaf; and this period is called oven rise or oven spring. At the end of oven spring, there is a sharp
increase in the rate of gas lost from the loaf, which is due to the rapid coalescence or rupture of the
bubble cell walls (Brennan, 2006). At the temperature of starch gelatinization (~ 650 C), there is a
transfer of water from the protein to the starch, leading to a swelling of the starch granules and a rapid
increase in viscosity of the dough, which sets the sponge structure. These physical changes lead to a
change from a closed cell foam structure to an open cell sponge structure (Brennan, 2006).
Ovens can be heated by gas, oil, coal, coke, wood or steam. If an oven is steam heated there has to
be a steam boiler elsewhere to generate the steam. This should not be confused with steam baking
where steam is introduced into the oven to give a particularly crisp crust. A low technology way of
doing this is to put a tray of water in the bottom of the oven. While there are small bakers who are using
old ovens that consist merely of a heated box most modern ovens fall into one of three classes:
They are either deck ovens, rack ovens or travelling ovens. Travelling ovens are also known as tunnel
ovens (Edward, 2007).

33
The Maillard reaction is a complex set of chemical reactions in which the amino acids in proteins
react with reducing sugars such as glucose and fructose and which are very important to our perception
of flavor in baked bread (Brennan, 2006).
Generally, the important mechanisms that operate during bread baking may be summarized as
follows:
• Carbon dioxide gas is released from solution in the dough, and from the final burst of activity of the
yeast, until the temperature reaches 55° C.
• As the temperature of the batter increases the starch granules begin to swell and gelatinization occurs
around 60°C.
• Alpha-amylase activity increases and may attack the gelatinizing starch. This activity will continue
until the amylase is inactivated at 60–90° C, depending on the form used.
• Other enzymes which may be present are inactivated
• The gluten proteins in the dough coagulate at 70–80°C
• Gases (including water vapor/steam) trapped in the dough expand with heat.
• Moisture is lost.
• Maillard reactions contribute to crust-color formation.
2.4.9.7 Cooling:
After leaving the oven, most baked products require a period of cooling before further processing
and wrapping. Heat transfer to the surrounding atmosphere involves mainly convection and radiation.
Heat is also lost through moisture evaporation but usually such losses are minimized. Most of the
cooling in bakeries is carried out without refrigeration and relies on a flow of cool air across the product
(Cauvain and Young, 2000). Bread leaves the oven with the centre of the crumb at a temperature of
about 96°C and cools rapidly (Kent and Evers, 1994). When removed from the oven, a baked good
continues to cook until its temperature cools to room temperature. This is called carryover cooking.
Because of carryover cooking, baked goods must be watched carefully during the last few minutes of
baking, and they must be removed before—not when—they are baked to perfection (Figoni, 2008).
Cooling of baked goods between baking and packaging requires an intermediate storage space and
is a stage in processing during which there is a chance that the product will become contaminated with
mould spores. It is also a time during which the collapse of some products occurs and in which the
warm product is more susceptible to damage (Ranken et al., 1997).
The length of time taken for baked products to cool will vary according to size and shape but
commonly takes from 30 minutes for small-cross-section products to several hours for large cross-
section and dense products (Cauvain and Young, 2000).
34
2.4.9.8 Packaging:
Packaging bread in polyethylene bags is an almost universal method of bread packaging (Yam,
2009). In the case of product destined for sale on the store shelf, it must also present the product in an
attractive manner to appeal to the consumer (Hui et al., 2007). There are many factors to be considered
in choosing the optimal packaging form and material for any particular product, including the product
characteristics, processing considerations, shelf-life required and overall cost (Kilcast and Subramaniam,
2000). The function of bread packaging for Western-style breads can be described as:
• To contain the slices and crusts together in a single unit for handling purposes;
• To maintain product quality by reducing crumb drying, minimizing the risk of contamination;
• To present an appealing and informative package to the consumer.
The most common material now used in Western countries is a low-density polyethylene, usually in
the form of bags. This product provides a good barrier to water vapor, thus inhibiting drying, is easy to
handle, and provides a clear background through which the consumer can see the product being
purchased (Cauvain and Young, 2007).The new polyethylene bagging and closing equipment. Tape was
neither convenient for the consumer nor fast and dependable for the bakers. Two types of closures and
automatic equipment systems have emerged as the standards of the baking industry. Developed
simultaneously, these are the wire tie and the plastic-clip closure (Yam, 2009).
In the world of food manufacturing, this is not a small matter, because the FDA has rigid control
over the materials used in food packaging. To obtain a longer shelf-life, packaging has to be carefully
designed. As far as the FDA is concerned, any packaging material is considered a food additive. All
packaging materials used to contain food must comply with rigid regulations for the use of a food
additive (Hui et al., 2007).
Traditional bread is still a very important part of the total bread market. Central European and
Scandinavian influence is bringing new ideas to the Baltic bread market, but the strong tradition will
remain (Kulp and Lorenz, 2003). Normal Polypropylene (PP) films have limited food packaging
applications (e.g., packaging of bread) because of their low cold temperature resistance (Piringer and
Baner, 2008).
2.4.9.9 Bread weights:
From 1980, enforcement of bread weight regulation in the U.K. has taken place at the point of
manufacture rather than, as formerly, at the point of sale, and is based on the average weight of a batch
rather than on the weight of an individual loaf (Kent and Evers, 1994).
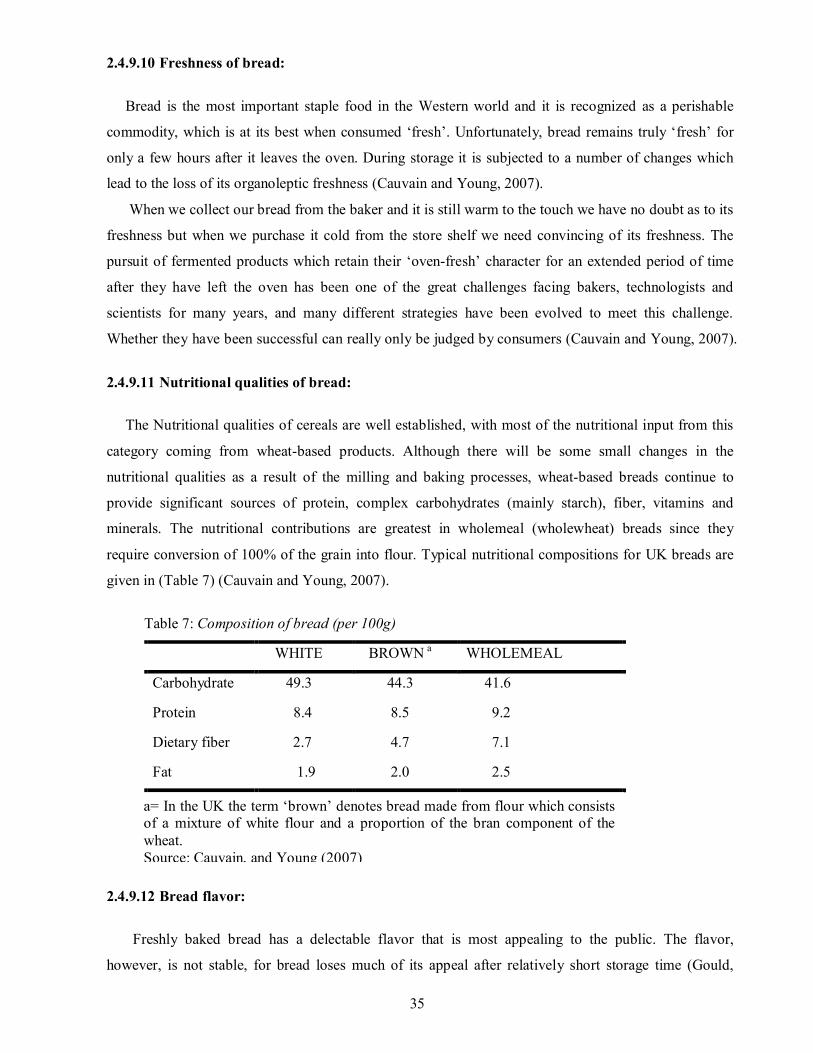
35
2.4.9.10 Freshness of bread:
Bread is the most important staple food in the Western world and it is recognized as a perishable
commodity, which is at its best when consumed ‘fresh’. Unfortunately, bread remains truly ‘fresh’ for
only a few hours after it leaves the oven. During storage it is subjected to a number of changes which
lead to the loss of its organoleptic freshness (Cauvain and Young, 2007).
When we collect our bread from the baker and it is still warm to the touch we have no doubt as to its
freshness but when we purchase it cold from the store shelf we need convincing of its freshness. The
pursuit of fermented products which retain their ‘oven-fresh’ character for an extended period of time
after they have left the oven has been one of the great challenges facing bakers, technologists and
scientists for many years, and many different strategies have been evolved to meet this challenge.
Whether they have been successful can really only be judged by consumers (Cauvain and Young, 2007).
2.4.9.11 Nutritional qualities of bread:
The Nutritional qualities of cereals are well established, with most of the nutritional input from this
category coming from wheat-based products. Although there will be some small changes in the
nutritional qualities as a result of the milling and baking processes, wheat-based breads continue to
provide significant sources of protein, complex carbohydrates (mainly starch), fiber, vitamins and
minerals. The nutritional contributions are greatest in wholemeal (wholewheat) breads since they
require conversion of 100% of the grain into flour. Typical nutritional compositions for UK breads are
given in (Table 7) (Cauvain and Young, 2007).
Table 7: Composition of bread (per 100g)
WHITE BROWN a WHOLEMEAL
Carbohydrate 49.3 44.3 41.6
Protein 8.4 8.5 9.2
Dietary fiber 2.7 4.7 7.1
Fat 1.9 2.0 2.5
2.4.9.12 Bread flavor:
Freshly baked bread has a delectable flavor that is most appealing to the public. The flavor,
however, is not stable, for bread loses much of its appeal after relatively short storage time (Gould,
a= In the UK the term ‘brown’ denotes bread made from flour which consists of a mixture of white flour and a proportion of the bran component of the wheat. Source: Cauvain, and Young (2007)
36
1966). Sometimes bread products are eaten alone, but more often they will be eaten as an
accompaniment to other foods in a meal or as part of a composite product, so that bread flavors tend to
be more subtle than we would encounter in many other foods (Cauvain and Young, 2007). The oven
exhaust from baking industries releases water vapor, CO2, VOC, and various combustion products. The
VOCs are primarily ethanol produced by the yeast during the fermentation process. It should be noted,
however, that many individuals find the odor of fresh baked bread very desirable (Nicolay, 2006). The
extremely complex nature of bread flavor is illustrated by the fact that more than 70 compounds have
been identified or implicated (Gould, 1966). The development of flavor in fermented products is
derived from the ingredients and the processing methods which are used. Flour tends to have a fairly
bland flavor with most of its contribution coming from the oils of the germ (embryo) and any bran
particles present. Since this is the case wholemeal, wholewheat and bran and germ enriched white flours
will yield bread with more flavor than white flours. The addition of salt (sodium chloride) to bread is
the most obvious of those flavor modifiers, imparting both its own characteristic ‘salty’ taste and
working in the mouth to increase our perception of other flavors which may be present (Owens, 2001).
During the dough fermentation process new flavor products are generated within the dough. Not
all of this flavor activity will come from the addition of bakers’ yeast; some will come from wild yeasts
and bacteria, especially lactic acid bacteria, which are present naturally in the flour (Owens, 2001).
2.4.9.13 Color of bread:
The brown color of the crust of bread is probably due to melanoidins formed by a non-enzymic
‘browning reaction’ (Maillard type) between amino acids, dextrins and reducing carbohydrates.
Addition of amino acids to flours giving pale crust color results in improvement of color. The perceived
color of bread crumb is influenced by the color, degree of bleach, and extraction rate of the flour; the
use of fat، milk powder, soya flour or malt flour in the recipe; the degree of fermentation; the extent to
which the mixing process disperses bubbles within the dough and the method Of panning - cross-
panning and twisting to increase light reflectance (Kent and Evers, 1994).
2.4.9.14 Deterioration of bread quality:
Baked goods manufacturers are concerned with physical spoilage (staleness), chemical spoilage
(rancidity), and microbiological spoilage (bacterial, yeast, and mold spoilage) (Zagozewski, 2008).
Bread is a short-life product that is neither sold nor consumed continuously. The need with bread is to
get the product to the retail outlet in time to sell it (Edward, 2007). Fresh bread is a product with a short
shelf-life and during its storage a number of chemical and physical alterations occur, known as staling.
As a result of these changes, bread quality deteriorates gradually as it loses its freshness and crispiness
while crumb firmness and rigidity increase (Kohajdová et al., 2009).

37
The baking process is similar to pasteurization in that both enzymes and micro-organisms are
destroyed by the heat. Thus, bread may be stored at room temperature in spite of its high water activity.
The various modes by breads deteriorate include:
2.4.9.14.1 Microbial growth:
The aw of breads is normally low enough (0.75 to 0.9) to prevent growth of bacteria (Ray, 2004).
The most common source of microbial spoilage of bread is mould growth. Less common, but still
causing problems in warm weather, is the bacterial spoilage condition known as ‘rope’ caused by
growth of Bacillus species (Cauvain and Young, 2007). The spores, coming from flour or equipment,
survive baking and then germinate and grow inside within 1 to 2 d. They also produce extracellular
amylases and proteases and break down the bread structure (Ray, 2004). Least common of all types of
microbial spoilage in bread is that caused by certain types of yeast, There are mainly two types of yeasts
involved in the spoilage of bread, fermentative yeasts and Filamentous yeasts (Cauvain and Young,
2007). By the time microbial growth begins to be a problem, the bread has usually been consumed or
other modes of deterioration have already limited shelf life (The Office of Technology Assessment
(OTA), 1979). Mould spoilage of bread is due to post-processing contamination. Bread loaves fresh out
of the oven are free of moulds or mould spores due to their thermal inactivation during the baking
process (Cauvain and Young, 2007).
Yeast and moulds are more tolerant of low water activity and low pH than bacteria. Subsequently
they typically spoil foods such as fruit and vegetables and bakery products. Bread is spoiled by
Rhizopus nigricans (‘bread mould’, black spots), Penicillium (green mould), Aspergillus (green mould)
and Neurospora sitophila (‘red bread’) (Forsythe, 2000). In wheat-breads a wide range of spoilage
moulds including Penicillium, Aspergillus, Cladosporium, Mucorales and Neurospora have been
observed (Cauvain and Young, 2007).
Aside from the possibly toxic effects of consuming large amounts of moldy bread, there are little or
no safety considerations in determining the shelf life of fresh bakery products. Most people, in fact,
would reject moldy bread even when one colony forms (OTA, 1979).
In addition to spoilage, some moulds present a severe risk to public health because they can produce
mycotoxins. Exposure to mycotoxins can occur either directly by eating bread spoiled by
mycotoxigenic moulds or indirectly as a result of people consuming the products of animals fed
contaminated bread. Mycotoxins are very resistant and can survive the heating process designed to kill
moulds. It has been reported that 10% of Aspergillus spp. and Penicillium spp. are toxic to mice
(Cauvain and Young, 2007).
The anti-microbial activity of propionates is mainly against moulds and the bacteria responsible for
the development of rope in bread. The addition of ethanol at levels between 0.5 and 3.5% of loaf weight
38
leads to a substantial extension of the shelf-life of bread (Cauvain and Young, 2007). Calcium
propionate is often added to bread as a mold inhibitor to slow this process (OTA, 1979).
2.4.9.14.2 Nutritional losses:
Proteins, fats, carbohydrates, vitamins, and minerals are examples of nutrients in food. Heat
changes certain nutrients in very important ways. For example, proteins and starches in flour are more
digestible once they are heated. This means that baked foods containing flour are often more nutritious
than raw foods (Figoni, 2008). Not all the effects of heat on food are positive, however. Heat destroys
some nutrients, such as vitamin C (ascorbic acid). Nutrient loss is of minor consideration since it occurs
much more slowly than sensory quality losses caused by staling. Vitamin losses occur very slowly in
bakery products. Loss of available lysine through nonenzymatic browning occurs more quickly but is
not a significant problem, since bread is not a significant source of lysine in the diet (OTA, 1979).
2.4.9.14.3 Moisture loss:
During the storage of bread, the moisture content of the crust increases as a result of moisture
migration from the crumb to the crust. With an initial moisture content of only 12%, the crust readily
absorbs moisture from the interior crumb, which has a moisture content about 45%. It has been reported,
that during a storage period of 100 h, the crust moisture increased from 15 to 28%, while the crumb
moisture loss was only from about 45 to 43.5%. In a zone near the crust the decrease was much more
pronounced, from about 45 to 32% (Cauvain and Young, 2007). For intermediate moisture products
such as bread and cake, the physicochemical change is normally associated with starch retrogradation.
Water distribution among the high-molecular-weight substances such as protein and starch causes the
water to transform from strongly bound to weakly bound. Therefore, staling can be observed (Hui et al.,
2007). Moisture loss can be kept to a minimum by use of moisture-proof packages (OTA, 1979).
There is no legal standard for the moisture content of bread in the U.K. The moisture content of
American and of Dutch bread must not exceed 38%. In Australia the maximum permitted moisture
content in any portion weighing 5 g or more is 45% for white bread, 48% for brown and wholemeal. In
New Zealand, 45% is the maximum moisture content similarly permitted in any bread (Kent and Evers,
1994).
It is not possible to stop migration of moisture since this obeys physical laws that cannot be changed.
However, product design can help minimize this effect so that the breadcrumb remains more moist and
soft during storage (Smith, 2004).
2.4.9.14.4 Flavor loss:
During the degradation of organic matter, volatile organic compounds (VOC) are formed as
intermediate metabolites. Under aerobic conditions, microbial degradation will lead to the formation of

39
VOC, which are rapidly oxidized to carbon dioxide and water (Nicolay, 2006). Bread quality changes
rapidly during storage. Due to moisture adsorption, the crust loses its crispiness and glossyness. The
aroma compounds of freshly baked bread evaporate or are entrapped preferentially by amylose helices
which occur in the crumb. Repeated heating of aged bread releases these compounds (OTA, 1979).
Very labile aroma compounds also contribute to the aroma of bread, e. g., 2-acetyl-1-pyrroline. They
decrease rapidly on storage due to oxidation or other reactions (Belitz et al., 2009).
2.4.9.14.5 Staling:
The term ‘staling’ refers to the gradually decreasing consumer acceptance of bread due to all the
chemical and physical changes that occur in the crust and crumb during storage excluding microbial
spoilage. Staling is detected organoleptically by the changes in bread texture, as well as in taste and
aroma. (Cauvain and Young, 2007). Baked products are perishable. They undergo physicochemical
changes, generally referred as ‘‘staling’’ and microbial degradation. The term staling designates the loss
of consumer acceptability due the storage changes other than those caused by the microbiological action.
The main change that reduces the bread quality during aging is crumb firming, which is attributed to
starch retrogradation (Kulp and Lorenz, 2003). Staling of wheat bread is often experienced as a firming
of the bread crumb during storage. This process can be retarded by the inclusion of monoglycerides of
fatty acids, stearoyllactylate and/or water binding/swelling agents such as guar gum or locust bean gum.
(Freshkeeping agents) (Wassermann, 2009).
Starch gelatinizes during baking and the amylose component leaches out from the granules. Upon
cooling the amylose crystallizes and determines the firmness of fresh bread crumbs; amylopectin
crystallizes (retrogrades) at a slower rate than amylose and causes gradual firming during storage. This
change is highly correlated with the consumers’ perceived freshness as determined organoleptically.
Other factors that affect freshness judgment are a the loss of moisture due to simple drying out, which
can be controlled by moisture proof wrapping, or moisture migration from the high moisture crumb
phase to the dry crust. The latter change is minimized by production of thin-crust breads. Two types of
reactions affect flavor deterioration associated with aging of breads:
(1) Transfer of certain flavor components from the crust to the crumb region and.
(2) Loss of some flavor compounds by formation of complexes with amylose. The crust of wrapped
products loses its fresh crispness due to equalization of moisture (Kulp and Lorenz, 2003).
Bread tends to stale—i.e., obtain a harder and shorter texture—during storage at room temperature.
Keeping the bread in a refrigerator enhances staling rate, but storage in a freezer greatly reduces staling,
slow rate of staling at a temperature of, say, -200 C is due to the system being near the glassy state,
where the molecular mobility of amylopectin molecules is already greatly reduced, forming of starch
microcrystallites, which make the matrix much stiffer (Walstra et al., 2003). Although no additives have
been specifically developed to counteract staling, emulsifiers such as glyceryl monostearate (GMS) are
40
proven to be very effective, probably because they help complex starch, which inhibits retrogradation
(Smith, 2004). In contrast, increased temperatures can reduce the development of staling in bread,
although the situation with other baked foods can be complex and unpredictable (Kilcast and
Subramaniam, 2000).
2.5 Food additives:
A food additive is a substance (or a mixture of substances) which is added to food and is involved
in its production, processing, packaging and/or storage without being a major ingredient (Belitz et al.,
2009). A food additive is any substance added to food. Legally, the term refers to “any substance the
intended use which results or may reasonably be expected to result, directly or indirectly, in its
becoming a component or otherwise affecting the characteristics of any food.” This definition includes
any substance used in the production, processing, treatment, packaging, transportation, or storage of
food (Hui et al., 2007). Food additives play a vital role in today’s bountiful and nutritious food supply.
They allow our growing urban population to enjoy a variety of safe, wholesome, and tasty foods, year
round. Also, they make possible an array of convenience foods without the inconvenience of daily
shopping. Although salt, baking soda, vanilla, and yeast are commonly used in foods today; many
people tend to think of any additive added to foods as being a complex and sometimes harmful chemical
compound. All food additives are carefully regulated by federal authorities and various international
organizations to ensure that foods are safe to eat and are accurately labeled (Hui et al., 2007).
2.5.1 European community policy regarding additives:
Additives will only be included in a permitted list if a reasonable technological need is demonstrated,
and if this need cannot be achieved by other means that are economically and technologically
practicable. Furthermore, the additives must present no hazard to health at the levels of use proposed,
and they must not mislead the customer. ‘Need’ is understood to mean preservation of nutritional
quality; the meeting of special dietary requirements; enhancement of keeping quality, stability and
organoleptic properties; or providing aid in manufacture, processing, preparation, treatment, packaging,
transport or storage. Specified additives are to be allowed only in specified foods, and at levels not
exceeding those required to achieve the desired effect (Kent and Evers, 1994).
2.5.2 Why are additives used in foods?
According to (Hui et al., 2007) additives perform a variety of useful functions in foods that are
often taken for granted. As most people no longer live on farms, additives help keep food wholesome
and appealing while en route to markets sometimes thousands of miles away from where it is grown or
manufactured. Additives also improve the nutritional value of certain foods and can make them more
appealing by improving their taste, texture, consistency, or color. Some additives could be eliminated if

41
we were willing to grow our own food, harvest and grind it, spend many hours on cooking, or accept
increased risks of food spoilage. However, most people today have come to rely on the many
technological, aesthetic, and convenience benefits that additives provide in food. Additives are used in
foods for five main reasons.
i. To Maintain Product Consistency. Emulsifiers give products a consistent texture and prevent
them from separating. Stabilizers and thickeners give smooth uniform texture. Anticaking agents
help substances such as salt to flow freely.
ii. To Improve or Maintain Nutritional Value. Vitamins and minerals are added to many
common foods such as milk, flour, cereal, and margarine to make up for those likely to be
lacking in a person’s diet or lost in manufacturing. Such fortification and enrichment have
helped reduce malnutrition in the U.S. population. All products containing added nutrients must
be appropriately labeled.
iii. To Maintain Palatability and Wholesomeness. Preservatives retard product spoilage caused by
mold, bacteria, fungi, yeast, or air. Bacterial contamination can cause foodborne illness,
including the life-threatening botulism. Antioxidants are preservatives that prevent fats and oils
in baked goods and other foods from becoming rancid or developing an off-flavor. They also
prevent cut fresh fruits such as apples from turning brown when exposed to air.
iv. To Provide Leavening or Control Acidity/Alkalinity. Leavening agents, which release acids
when heated, can react with baking soda to help cakes, biscuits, and other baked goods to rise
during baking. Other additives help modify the acidity and alkalinity of foods for proper flavor,
taste, and color.
v. To Enhance Flavor or Impart Desired Color. Many spices and natural and synthetic flavors
enhance the taste of foods. Colors, likewise, enhance the appearance of certain foods to meet
consumer expectations.
2.5.3 Evaluation of safety of food additives:
The World Health Organization (WHO) and Food and Agricultural Organization (FAO), joint
expert committee on food additives has the responsibility of proposing Acceptable Daily Intakes. The
Committee divided food additives into three categories:
Fit for use in food.
Need to be evaluated.
Should not be used in foods.
After evaluation, detailed specifications for the food additives include identity and purity.
Typically, WHO provides data on biological aspects such as ingestion, calorific availability, and
digestibility, an on toxicology. Toxicological evaluation includes short term and long term
evaluation using a range of different animals.
42
Since 1958, FDA and USDA have continued to monitor all prior-sanctioned and GRAS
substances in light of new scientific information. If new evidence suggests that a GRAS or prior-
sanctioned substance may be unsafe, federal authorities can prohibit its use or require further studies
to determine its safety (Hui et al., 2007).
In addition, FDA operates an Adverse Reaction Monitoring System (ARMS) to help serve as
an ongoing safety check of all additives. The system monitors and investigates all complaints by
individuals or their physicians that are believed to be related to specific foods, food and color
additives, or vitamin and mineral supplements (Hui et al., 2007).
2.5.4 Bread improvers:
This term covers any ingredient added to ‘improve’ the bread making potential of flour (Owens,
2001). The term ‘dough conditioner’: any material or combination of materials which are added to
yeast-raised doughs to enhance and control gas production or gas retention, or both. Dough conditioners
are also called dough improvers (Figoni, 2008). The range and level of use of these substances is
controlled by legislation in most countries (Cauvain and Young, 2007).
The use of improvers in the production of baked goods is common practice today. It is also part of
the technological effort to produce baked goods from wheat and rye flour that have high sensory,
practical and nutritional value. Besides the use of machines for dough and batter make up, processing
and baking, improvers are used specifically to improve production methods and the quality of bakery
products. According to the definition laid down in the German Guidelines for Bread and Small Baked
Items, improvers are mixtures of food including additives intended to facilitate or simplify the
production of baked goods, to compensate for changes in processing properties due to fluctuations in
raw materials and to influence the quality of baked goods (Wassermann, 2009).
In Austria, improvers are similarly defined by the BMSG (Federal Ministry for Social Security,
Generations and Consumer Protection) in decree 31.901/25-IX/B/12/01 of July 3, 2001.
“Improvers” are preparations intended to simplify the production of baked goods, to compensate
changes in processing properties due to fluctuations in raw materials and to improve the quality of
bakery products. They are made from food (cereal products such as starch, malt… different sugars,
dairy products such as powdered milk, soy flour,...) with or without additives (preservatives, fruit acids,
phosphates, thickening agents,...), depending on the relevant application. The substances used for
improvers are often also components found in the food product that is being made with these improvers
(Wassermann, 2009).
2.5.5 Classification of improvers:
According to (Wassermann, 2009) Improvers can be composed differently depending on the product
to be used in or on the intended production method. They belong to either one of the following groups:
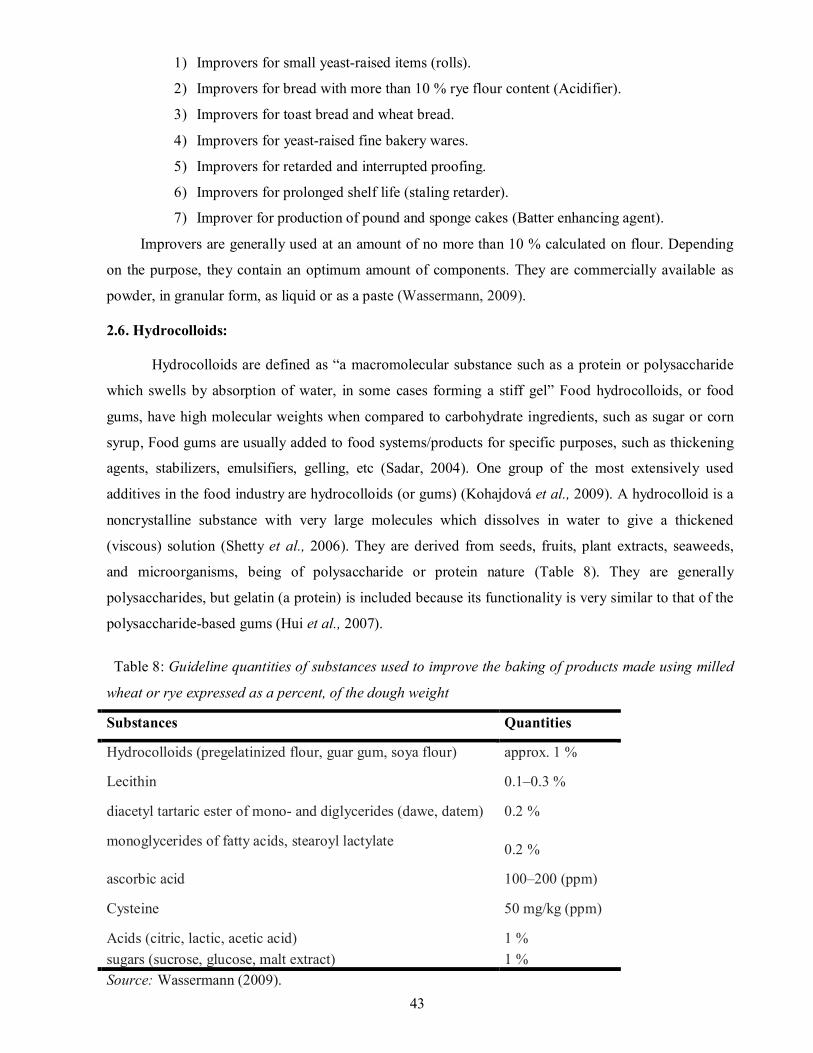
43
1) Improvers for small yeast-raised items (rolls).
2) Improvers for bread with more than 10 % rye flour content (Acidifier).
3) Improvers for toast bread and wheat bread.
4) Improvers for yeast-raised fine bakery wares.
5) Improvers for retarded and interrupted proofing.
6) Improvers for prolonged shelf life (staling retarder).
7) Improver for production of pound and sponge cakes (Batter enhancing agent).
Improvers are generally used at an amount of no more than 10 % calculated on flour. Depending
on the purpose, they contain an optimum amount of components. They are commercially available as
powder, in granular form, as liquid or as a paste (Wassermann, 2009).
2.6. Hydrocolloids:
Hydrocolloids are defined as “a macromolecular substance such as a protein or polysaccharide
which swells by absorption of water, in some cases forming a stiff gel” Food hydrocolloids, or food
gums, have high molecular weights when compared to carbohydrate ingredients, such as sugar or corn
syrup, Food gums are usually added to food systems/products for specific purposes, such as thickening
agents, stabilizers, emulsifiers, gelling, etc (Sadar, 2004). One group of the most extensively used
additives in the food industry are hydrocolloids (or gums) (Kohajdová et al., 2009). A hydrocolloid is a
noncrystalline substance with very large molecules which dissolves in water to give a thickened
(viscous) solution (Shetty et al., 2006). They are derived from seeds, fruits, plant extracts, seaweeds,
and microorganisms, being of polysaccharide or protein nature (Table 8). They are generally
polysaccharides, but gelatin (a protein) is included because its functionality is very similar to that of the
polysaccharide-based gums (Hui et al., 2007).
Table 8: Guideline quantities of substances used to improve the baking of products made using milled
wheat or rye expressed as a percent, of the dough weight
Substances Quantities
Hydrocolloids (pregelatinized flour, guar gum, soya flour) approx. 1 %
Lecithin 0.1–0.3 %
diacetyl tartaric ester of mono- and diglycerides (dawe, datem) 0.2 %
monoglycerides of fatty acids, stearoyl lactylate
0.2 %
ascorbic acid 100–200 (ppm)
Cysteine 50 mg/kg (ppm)
Acids (citric, lactic, acetic acid) 1 % sugars (sucrose, glucose, malt extract) 1 % Source: Wassermann (2009).
44
2.6.1 Types of hydrocolloids:
The scientific and academic classification of food hydrocolloids is divided along functional
properties or raw material origins. For example gelling agents vs. thickening agents or seaweed extracts
vs. seed gums vs. plant exudates vs. fermentation polymers (Williams and Phillips, 2002). The
polysaccharide gums come from a wide variety of sources and are used extensively in the food industry.
The origins of these gums are varied ranging from bacterial (xanthan gum), algal (alginate and
carrageenan) to arborial (gum arabic) (Williams and Phillips, 2004). Not only can hydrocolloids
perform numerous functions, but there is a wide selection of hydrocolloids available for manufacturers.
The function of each gum varies and certain ones are chosen for particular reasons. Decisions may be
based on solution clarity, solubility at various temperatures, suspension ability, natural versus not
natural, ability to stabilize proteins at a low pH, acid stability, or relative cost per pound (Sadar, 2004).
2.6.2 Basic Structure of food hydrocolloid:
Hydrocolloids or gums are substances consisting of hydrophilic long-chain, high-molecular-
weight molecules, usually with colloidal properties, which in water-based systems produce gels, that is,
highly viscous suspensions or solutions with low dry-substance content (Hui et al., 2007). The typical
structure of a food hydrocolloid includes a sugar backbone with protruding substituents. The backbone
can vary in length from several hundred to several thousand sugar units long. These sugar units are most
commonly linear in form, but branched backbones have been seen. The backbone provides pertinent
information such as the acid stability of the particular hydrocolloid. The type, number, and distribution
of substituents protruding from the backbone determine whether a gum is a thickening agent or a gelling
agent (Sadar, 2004).
2.6.3 Factors Influencing behavior of food hydrocolloids:
The four major factors influencing food gum properties include molecular weight, the
monosaccharide backbone, type of side chains, and distribution of side chains the molecular weight of
the food gum is basically the chain length... If the chain length is doubled, the chain will now occupy
eight times the volume it did before, thus it is eight times more likely to collide with an adjacent chain.
These collisions and restrictions are referred to as resistance to flow, which is measured as viscosity.
The composition of the backbone also indicates gum properties. The monosaccharide composition
influences properties such as pH stability, ability to thicken or gel in food systems. Therefore the
45
molecular weight and monosaccharide composition affects the final behavior of the food hydrocolloid
(Sadar, 2004).
In addition to those two factors, the type of side chains or substituents also plays a part in
determining gum behavior. The main influence of side units is whether the gum will become a
thickening or a gelling agent. Side chains can vary drastically in size. In the case of pectin and
carrageenan, the side units are small in size and are simply a carboxyl or a sulfate group respectively.
Side units can be an additional sugar protruding off the backbone as is the case with both guar gum and
locust bean gum, the final factor that influences food gum properties is the distribution or uniformity of
these side chains (Sadar, 2004).
The distribution of side chains can determine cold water solubility and synergistic effects with
other gums. Substituents are distributed either evenly or unevenly on the sugar backbone. Uneven
substitution results in smooth and hairy regions. Smooth areas are defined by areas on the backbone that
do not contain any side units. In contrast, hairy regions contain a cluster of side units projecting from
the backbone. An example of distribution of side units is seen by locust bean gum and guar gum. Both
hydrocolloids have the same galactomannan backbone, but locust bean gum is unevenly distributed and
guar gum is evenly distributed. Due to the substitution difference, they both possess different cold water
solubility properties as well as synergistic relationships with other gums (Sadar, 2004).
2.6.4 Use of hydrocolloids in food industries:
Hydrocolloids are widely used as additives in the food industry because they are useful for
modifying the rheology and texture of aqueous suspensions; hydrocolloids are used in food products as
thickeners, stabilizer, gelling agent and emulsifier. They improve the texture of the products, retard
starch retrogradation during storage, increase water retention, while enhancing lower energy value; they
are often employed in low-calorie foods (Hemeda and Mohamed, 2010).
2.6.5 Role of hydrocolloids in manufacture of baked goods:
1) Hydrocolloids are used either alone or in combination to achieve specific synergies between their
respective functional properties. At a lower level of incorporation, hydrocolloids have served as
additives to improve the quality of baked goods (Kohajdová et al., 2009).
2) Hydrocolloids or gums serve two basic functions in food systems: They stabilize the product, and
they affect the texture of the product, and are widely used in the food industry for these functional
properties These functional properties lead to the improvement of food texture, they retard starch
retrogradation, increase moisture retention, and extend the overall quality of the product over time (Hui
et al., 2007).
46
3) In the baking industry, hydrocolloids are of increasing importance as bread improvers, they can
induce structural changes in the main components of wheat flour systems along the bread making steps
and bread storage (Kohajdová et al., 2009).
4) Hydrocolloids such as pregelatinized cereal flours and starches as well as guar gum and soya flour
can also be used to improve the hydration capacity of doughs. These substances take up water during
dough preparation making the doughs much drier and more easily processed. Besides that, the increased
moisture contributes to optimum starch gelatinization which, in turn, improves the fresh keeping
properties (Wassermann, 2009).
5) Hydrocolloids when used in small quantities (<1% (w/w) in flour) are expected to increase water
retention and loaf volume and to decrease firmness and starch retrogradation (Kohajdová et al., 2009).
Hydrocolloids affected in different extent to the fresh bread quality, and concentrations of 0.1% (w/w,
flour basis) were sufficient for obtaining the observed effects (Guardaa et al., 2004).
6) The presence of hydrocolloids influenced melting, gelatinization, fragmentation, and retrogradation
starch processes. These effects were shown to affect pasting properties, dough rheological behavior
bread staling. It is generally accepted that each hydrocolloid affects the pasting and rheological
properties of starch in a different way (Kohajdová et al., 2009).
7) Hydrocolloids have a neutral taste and aroma which permits a free flavor release of all recipe
components. They provide an unctuous body to fat-reduced products, in which compensate for the low
fat content with their water-binding ability and texturising properties. These compounds have been used
as gluten substitutes in the formulation of gluten – free breads due to their polymeric structure
(Kohajdová et al., 2009).
8) Hydrocolloids have been found to affect dough rheological performance, as they mimic the
viscoelastic properties of gluten in bread doughs and also swelling, gelatinization, pasting properties,
and staling of starch.
2.7 Emulsifiers:
Emulsions are two-phased systems in which one phase (disperse) is suspended as small droplets in
the second phase (continuous). Substances that promote stability in emulsions are known as emulsifiers
and they work by providing a bridge between the two phases. The two common types of emulsion are
oil in water (salad dressings) and water in oil (margarines). Batters and doughs are complex emulsions
and a number of different emulsifiers are used successfully to aid oil and, more critically, air dispersion
and their stability during all stages of baking processes. Emulsifiers have become highly functional
ingredients in the food industry. The functionality of emulsifiers depends on the particular emulsifier
used and the concentration, formulation, and processing the final food product has experienced
(Wassermann, 2009). Emulsifiers contain both hydrophilic and lipophilic parts, resulting in their ability
47
to be useful in foods at very low levels (Baker, 2010).They are used at very low amounts in foods, many
times at fractions of a percent, yet can greatly affect the final products’ performance. For example,
emulsifiers can aerate foams and batters, extend shelf-life, promote fat agglomeration, and improve
texture in foods. In addition to potential interactions with oils, liquids and gases, emulsifiers may play a
role in starch-complexing (anti-staling) and interact with proteins (Cauvain and Young, 2000). Natural
surfactants (emulsifiers) do occur in nature but many are the result of manufacturing technologies
available today. In such cases the emulsifier is more powerful than the fat on a weight -for- weight basis
at promoting many of the required properties, for example batter aeration and gas-bubble stability. Gum
arabic is widely used for emulsifying the flavor bases used in beverages (Williams and Phillips, 2004).
2.7.1 Emulsifiers as bread improver:
These emulsifiers improve the gas impermeability of the membrane that encloses the gas bubbles.
This makes the dough less susceptible to mechanical stress during dividing, moulding and handling.
Proofing stability as well as oven spring will also increase (Wassermann, 2009). Although bread dough
does not ordinarily require emulsification, emulsifying agents may improve the functional properties of
the dough by increasing water absorption and gas retention, decreasing proofing times، and reducing the
staling rate (Hutkins, 2006). The anti-staling ability of emulsifiers is mainly due to their interaction with
starch but the exact mechanism is still unexplained. Emulsifiers complex with linear amylose, and they
may do some complexing with the outer linear branches of amylopectin (Cauvain and Young, 2007).
Dough conditioners or stabilisers and emulsifiers reduce the necessity for resting times and improve
tolerance towards dough handling in the bakery equipment. The bread volume is increased and the
crumb structure becomes finer and more uniform. In addition, dough conditioners emulsify any fat in
the recipe (Smith, 2004). Gums may be used in reduced-fat baked goods to improve texture and prevent
moisture loss (Amendola and Rees, 2003).
2.7.2 Exudate gums:
Plant family Leguminosae belong to the order Rosales which includes 9 sub-families.
Gummiferae is one of the series of the sub family mimosoideae. The species from which gum exudation
is obtained are referred to belong to the series Gummiferae. The series have only fifteen species which
are regarded as a source of the gum where as the plant family Leguminosae includes 550 genera and
13000 species which grow in varied soil and climate condition but most abundantly in temperate and
warm climate. The plants of this family range from herbs, shrubs, and trees and show great diversity in
their habitat (Jilani, 1993).

48
Acacia is the common name for the plants of genus Acacia of the plant family Leguminosae.
Acacia is a large genus with 900 species, approximately 700 of which are native to Australia. The
remainder occurs mainly in tropical and sub-tropical regions of Africa, Asia and America. The name
acacia is derived from the Greek AKAZO which means "l Sharpen." (Jilani, 1993). The genus Acacia is
the second largest within the Leguminosae family and contains at least 900 species (Verbeken et al.,
2003). With their extensive root system, Acacia trees can be found in semi-arid areas in Australia, India,
and America, but mainly in the Sahelian region of Africa. They are multipurpose trees, not only
producing gum, but also preventing desert encroachment, restoring soil fertility, and providing fuel and
fodder. Almost all commercial gum comes from the so-called gum belt of Africa, a vast area which
extends over Mauritania, Senegal, Mali, Burkina Faso, Benin, Niger, Nigeria, Chad, Sudan, Eritrea,
Ethiopia, Somalia, Uganda, and Kenya (Verbeken et al., 2003).
There is no agreement as to the origin of gums exudates. Some thought that they are a product of
normal plant metabolism and some suggest that they are arising from a pathological condition (Jilani,
1993). Exudate gums have been used for centuries in a variety of fields: they have retained their
importance despite the many alternative gums, with similar typical performances, which have since
come into existence. Natural gums exude from trees and shrubs in tear-like, striated nodules or
amorphous lumps, and then dry in the sun, forming hard, glassy exudates of different colors, from white
to pale amber for gum arabic, pale gray to dark brown for karaya gum, and white to dark brown for
tragacanth (Nussinovitch, 2010). Exudates are fluids that ooze out of wounds in injured trees and harden
upon exposure to air. This designation includes all types of natural exudates, including many water-
insoluble materials such as resins, latex, chicle, etc., which accounts for the erroneous use of the term
gum for many of the water-insoluble resins used in the paint and chemical industry today (Nussinovitch,
2010). The term gum is applied to a wide varity of substances with "Gummy" characteristics and cannot
be precisely defined (Jilani, 1993).
2.7.3 Gum arabic: gum acacia E414
Gum arabic is produced from two acacia varieties, which are found to a varying intensity in the
gum belt of Sub-Saharan Africa. These varieties are Acacia senegal and Acacia seyal. Gum from A.
senegal aqueous solutions are levorotatory Gum from A. seyal aqueous solutions are dextrorotatory
(Table 9).
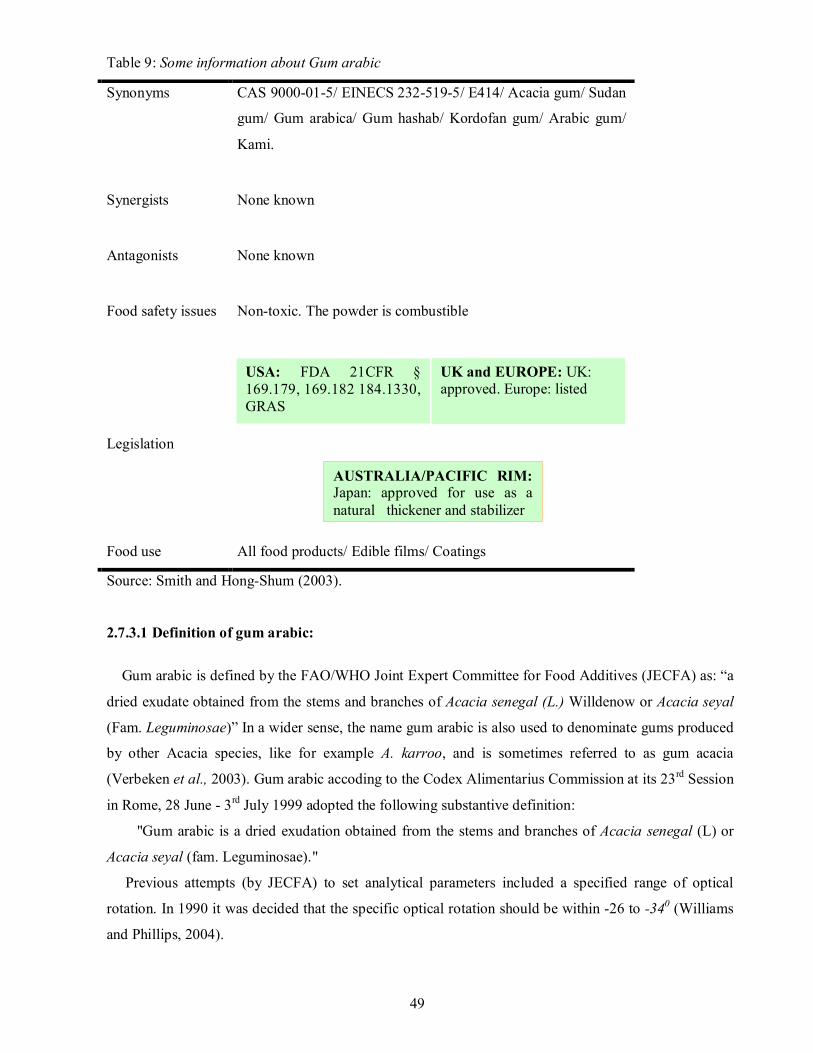
49
Table 9: Some information about Gum arabic
Synonyms
CAS 9000-01-5/ EINECS 232-519-5/ E414/ Acacia gum/ Sudan
gum/ Gum arabica/ Gum hashab/ Kordofan gum/ Arabic gum/
Kami.
Synergists None known
Antagonists
None known
Food safety issues
Non-toxic. The powder is combustible
Legislation
Food use All food products/ Edible films/ Coatings
Source: Smith and Hong-Shum (2003).
2.7.3.1 Definition of gum arabic:
Gum arabic is defined by the FAO/WHO Joint Expert Committee for Food Additives (JECFA) as: “a
dried exudate obtained from the stems and branches of Acacia senegal (L.) Willdenow or Acacia seyal
(Fam. Leguminosae)” In a wider sense, the name gum arabic is also used to denominate gums produced
by other Acacia species, like for example A. karroo, and is sometimes referred to as gum acacia
(Verbeken et al., 2003). Gum arabic accoding to the Codex Alimentarius Commission at its 23rd Session
in Rome, 28 June - 3rd July 1999 adopted the following substantive definition:
"Gum arabic is a dried exudation obtained from the stems and branches of Acacia senegal (L) or
Acacia seyal (fam. Leguminosae)."
Previous attempts (by JECFA) to set analytical parameters included a specified range of optical
rotation. In 1990 it was decided that the specific optical rotation should be within -26 to -340 (Williams
and Phillips, 2004).
USA: FDA 21CFR § 169.179, 169.182 184.1330, GRAS
UK and EUROPE: UK: approved. Europe: listed
AUSTRALIA/PACIFIC RIM: Japan: approved for use as a natural thickener and stabilizer
50
Gum arabic is traditionally defined as a ‘substance, which exudes from Acacia senegal or related
species’. This definition encompasses a variety of species, which, from a taxonomy point of view, are
not related. To date, though, only the gum from A. senegal has been effectively demonstrated as an
innocuous food additive (Touré, 2008).
Gum arabic has proven to be difficult to define unequivocally. One reason is that there are gum
exudates from Acacia species other than A. senegal and the closely related A. seyal, such as A. laeta
(related to A. senegal), A. kamo (related to A. seyal and A. polyacentha. Another reason is that there can
be numerous variations within a single species. A study of 1500 gums from A. senegal demonstrated
significant variations in properties, such as molecular weight, specific optical rotation and viscosity
(Williams, and Phillips, 2004).
2.7.3.2 Plant taxonomy of gum arabic:
There are close to 900 acacia species capable of producing gum. These are primarily located in
tropical climates, with about 130 of them located specifically on the African continent (Touré, 2008).
Acacia senegal (L) Wild.
Family: Mimosaceous Legumes (Leguminosae – Mimosoideae) Synonyms : Acacia vérek Guill et
Perrott; Mimosa senegal L. (1753), Acacia rupestris Stokes. Vernacular names: White gum tree, Vérek
(French); Gum arabic tree, gum tree, threethorned acacia (English); Kittir (Arab).
Acacia seyal Del.
Family: Mimosaceous Legumes (Leguminosae – Mimosoideae)
Synonyms: Acacia stenocarpa Hochst; Acacia hockii De Wild.
Vernacular names: Mimosa épineux (French); Talha (Arabe).
2.7.3.3 Hashab tree:
Acacia senegal is widely distributed and shows a remarkable adaptability to both drought and frost.
Acacia senegal is found in Africa across a belt extending from Senegal to Ethiopia, passing through
Mali, Nigeria, Chad, Somalia, and Sudan. Acacia senegal is a species that can sustain very dry
conditions, can grow with anything from 100 to 800 mm of rain but preferring 300 to 400 mm of rain
and a dry period of 8 to 11 months. It can survive very high daily temperatures but not frost. The
species may grow on a range of topographic conditions but grows well in sandy soils (red-brown sub-
arid soils and ferruginous tropical soils). It also grows well in fossil dunes, slightly silty soils, brown
clay soils, clay sandstone and even in litho soils although a good drainage is required (Touré, 2008).
51
2.7.3.4 Appearance of gum arabic:
Gum arabic is a solid of a pale to orange brown color which, when ruptured, secretes a vitreous
substance. Gum arabic of excellent quality is tear-shaped, round, with an orange-brown color and a
surface with a matte texture. After it is crushed or shattered, the pieces are paler in color and have a
vitreous appearance.
2.7.3.5 History and origin of gum arabic:
Gum arabic is certainly the most ancient and the most well known of all gum types. The term
‘Gum Arabic’ was coined by European merchants who imported it from Arab ports such as Jeddah and
Alexandria. Egyptians referred to it as ‘kami’ and allegedly used it from the third dynasty onwards
(around 2650 BC) to secure bandages around mummies. This gum was supposedly also used to fix
pigments into hieroglyphic paintings (Touré, 2008).
According to a Sudanese researcher, the word ‘mana’ (manna) mentioned in the Koran (Surah Al
baquarah) as the best food available to man is, in fact, a direct reference to gum arabic. The word
‘mana’ seemingly also refers to gum arabic in the Torah where it is described as an essential food and
designated by Moses to the Israelis as God-given bread.
Introduced in Europe through various Arabian ports, it was called gum arabic after its place of
origin. During the middle Ages, gum arabic trade was controlled by the Turkish Empire, giving rise to
the name turkey gum (Verbeken et al., 2003). In the 15th century, European navigators discovered gum
arabic on the coasts of modern-day Senegal and Mauritania. In the 18th century, following a bloody and
determined ‘gum war’ France acquired the monopoly of gum trade along the West African coast (Touré,
2008).
At the beginning of the 20th century, England opened up access to the other primary source of gum
arabic by building a railroad between Eloubeid, in the heart of the Kordofan region, and the Sudanese
port. England and France, aboard their merchant fleet, would transport the gum from the trading post
back to Europe to be processed. Consequently, gum arabic became a prized commodity given its
popularity with these two colonial powers (Touré, 2008).
2.7.3.6 Production of gum arabic:
The most important forest in the Sudan may be the gum arabic belt. The “belt” refers to a zone of
approx. 520,000 km2 that expands across Central Sudan between latitudes 10° and 14° N, accounting
for one-fifth of the country’s total area (Nussinovitch, 2010). Statistical information on production and
exportation are difficult, virtually impossible, to obtain because few producing countries release
customs information (Touré, 2008). Sudan is historically known to be a major exporter, however,

52
during the past 30 years production in Sudan shows alarming signs of overall decrease and also a
substantial year–to-year variation. The average production in Sudan has declined from 46,000 metric
tons (MT) in the sixties to 28,000 MT in the nineties (Table 10). Other countries such as Chad, Senegal
and Niger produce acacia gums (Edward, 2007).
Table 10: Gum arabic production in Sudan (5-year annual averages) between 1960 and 1994
Period Annual average (t)
1960-1964 46,550
1965-1969 50,576
1970- 1974 35,073
1975- 1979 37,408
1980-1984 31,079
1985- 1989 23,721
1990- 1994 18,358
Source: Verbeken et al (2003).
The production of Acacia senegal and Acacia seyal between 1970 and 2003 in Sudan was very
regular and interrupted only by three years of low production: 1992, 2000 and 2004, with less than
10,000 metric tons produced annually (Touré, 2008).
2.7.3.7 Collection of gum arabic:
The time of tapping, tapping intensity, rainfall and maximum temperature at gum collection were
found to explain 85% of the total variability in gum yield per unit area (Nussinovitch, 2010). It is
collected as air-dried droplets with diameters from 2–7 cm. The annual yield per tree averages 0.9–2.0
kg (Edward, 2007). When Acacia trees lose their leaves and become dormant at the beginning of the dry
season, usually by the end of October or beginning of November, superficial incisions are made in the
branches and bands of bark are stripped off. After 5 weeks, gum is manually collected as partially dried
tears. This collection is repeated at 15-day intervals for up to five or six collections in total, depending
on the weather conditions and the health of the tree (Verbeken et al., 2003).
A. senegal is a thorny tree that reaches a height of 4.5–6.0 m. It is very drought-resistant and grows
on sites with annual rainfall of 100–950 mm and dry periods of 5– 11 months. It is known by many
different local names. Sudan is known to have a higher density of Acacia senegal with a uniform
distribution of the tree in pure stands, making the country the most important producer of Hashab gum
arabic (Rahim et al., 2005).
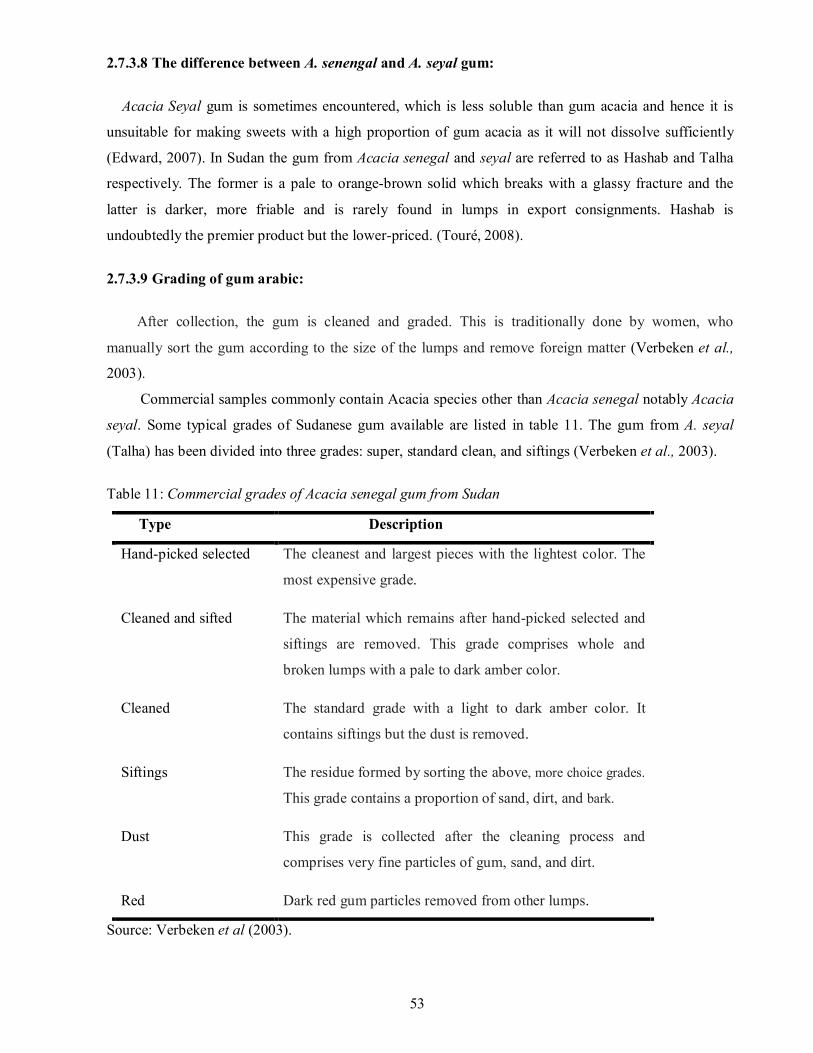
53
2.7.3.8 The difference between A. senengal and A. seyal gum:
Acacia Seyal gum is sometimes encountered, which is less soluble than gum acacia and hence it is
unsuitable for making sweets with a high proportion of gum acacia as it will not dissolve sufficiently
(Edward, 2007). In Sudan the gum from Acacia senegal and seyal are referred to as Hashab and Talha
respectively. The former is a pale to orange-brown solid which breaks with a glassy fracture and the
latter is darker, more friable and is rarely found in lumps in export consignments. Hashab is
undoubtedly the premier product but the lower-priced. (Touré, 2008).
2.7.3.9 Grading of gum arabic:
After collection, the gum is cleaned and graded. This is traditionally done by women, who
manually sort the gum according to the size of the lumps and remove foreign matter (Verbeken et al.,
2003).
Commercial samples commonly contain Acacia species other than Acacia senegal notably Acacia
seyal. Some typical grades of Sudanese gum available are listed in table 11. The gum from A. seyal
(Talha) has been divided into three grades: super, standard clean, and siftings (Verbeken et al., 2003).
Table 11: Commercial grades of Acacia senegal gum from Sudan
Type Description
Hand-picked selected The cleanest and largest pieces with the lightest color. The
most expensive grade.
Cleaned and sifted The material which remains after hand-picked selected and
siftings are removed. This grade comprises whole and
broken lumps with a pale to dark amber color.
Cleaned The standard grade with a light to dark amber color. It
contains siftings but the dust is removed.
Siftings
The residue formed by sorting the above, more choice grades.
This grade contains a proportion of sand, dirt, and bark.
Dust
This grade is collected after the cleaning process and
comprises very fine particles of gum, sand, and dirt.
Red Dark red gum particles removed from other lumps.
Source: Verbeken et al (2003).
54
For several years, it was impossible for any organization apart from the Gum Arabic Company
(GAC) to buy Gum Arabic in Sudan or export from Sudan. This company maintained the monopoly
because it was created by the State, in order to monitor and maintain control over a resource so key to
the economy (Touré, 2008). The aim of this policy was to end GAC’s monopoly and gave numerous
exporters' direct access to raw Sudanese Gum Arabic. Fifty-nine exporters joined the local gum arabic
market and energized it in the process. This policy was very successful because the exporters generated
gum arabic transformation factories in Sudan, which eventually changed local trade practices and
guaranteed better revenues for farmers and internationally acceptable rates for producers (Touré, 2008).
Gum arabic manufacturing companies lack the means to promote it through the media. However,
an organization like the Association for International Gum Promotion (AIPG), working in conjunction
with producer countries, their exporters and financed by international partners, could achieve this
(Touré, 2008).
Recently the supply of gum acacia from the Sudan was subjected to U.S. trade sanctions and
embargoes. Additionally, some corn starch producers have been unable to guarantee that their products
are not derived from Genetically Modified Organisms (GMO), creating a marketing problem where
consumers demand products that are "GMO-free". Due to the above considerations, it would be
desirable to investigate other options by evaluating polysaccharide or hydrocolloid emulsifiers that are
not based on cornstarch or its derivatives, and do not have the supply problem and high cost of
emulsifying grade gum acacia (Williams and Phillips, 2004). 2.7.3.10 Gum arabic processing:
After grading, the gum can be further processed into kibbled and powdered forms. Kibbling is a
mechanical process which breaks up large lumps into smaller granules with a more uniform size
distribution and facilitates the dissolution of the gum in water. Even better solubility characteristics are
obtained with powdered gum, which is usually produced by dissolving the gum in water, removing
impurities by filtration or centrifugation and spray-drying (Verbeken et al., 2003).
The number of viable bacteria contained in the gum can also be reduced by treatment with ethylene
oxide (no longer permitted for food use), or propylene oxide (less efficacious). Heating carried out
during manufacture to reduce the microflora can lead to precipitation of the arabinogalactan-protein
complex (Nussinovitch, 2010).
The drying temperature influences the gum’s functional behavior. Heat in general (either from spray-
drying or rollerdrying) causes the gum solutions to be slightly turbid or opalescent (Nussinovitch, 2010).
2.7.3.11 Structure of gum arabic:
Gum arabic analyzed and found that moisture content of 15%, ash content of 3.56%, nitrogen
content of 0.35% protein content of 2.31% and with no tannin content. Minerals content of the gum
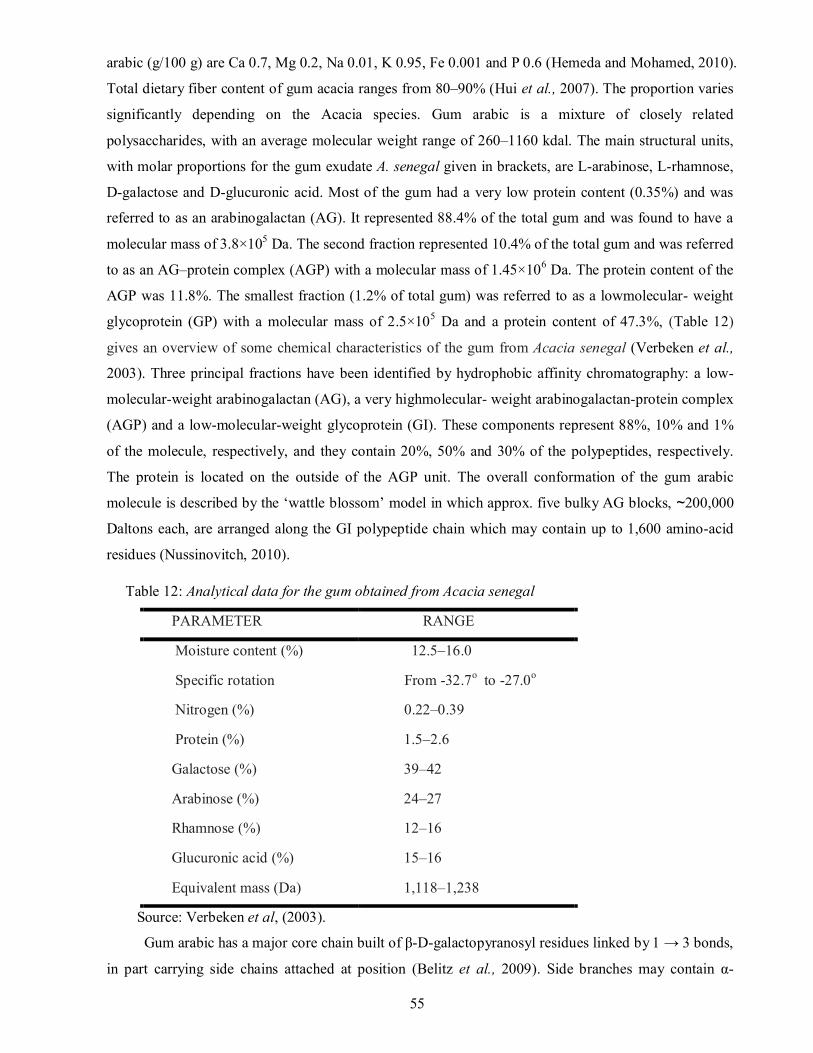
55
arabic (g/100 g) are Ca 0.7, Mg 0.2, Na 0.01, K 0.95, Fe 0.001 and P 0.6 (Hemeda and Mohamed, 2010).
Total dietary fiber content of gum acacia ranges from 80–90% (Hui et al., 2007). The proportion varies
significantly depending on the Acacia species. Gum arabic is a mixture of closely related
polysaccharides, with an average molecular weight range of 260–1160 kdal. The main structural units,
with molar proportions for the gum exudate A. senegal given in brackets, are L-arabinose, L-rhamnose,
D-galactose and D-glucuronic acid. Most of the gum had a very low protein content (0.35%) and was
referred to as an arabinogalactan (AG). It represented 88.4% of the total gum and was found to have a
molecular mass of 3.8×10⁵ Da. The second fraction represented 10.4% of the total gum and was referred
to as an AG–protein complex (AGP) with a molecular mass of 1.45×10⁶ Da. The protein content of the
AGP was 11.8%. The smallest fraction (1.2% of total gum) was referred to as a lowmolecular- weight
glycoprotein (GP) with a molecular mass of 2.5×10⁵ Da and a protein content of 47.3%, (Table 12)
gives an overview of some chemical characteristics of the gum from Acacia senegal (Verbeken et al.,
2003). Three principal fractions have been identified by hydrophobic affinity chromatography: a low-
molecular-weight arabinogalactan (AG), a very highmolecular- weight arabinogalactan-protein complex
(AGP) and a low-molecular-weight glycoprotein (GI). These components represent 88%, 10% and 1%
of the molecule, respectively, and they contain 20%, 50% and 30% of the polypeptides, respectively.
The protein is located on the outside of the AGP unit. The overall conformation of the gum arabic
molecule is described by the ‘wattle blossom’ model in which approx. five bulky AG blocks, ~200,000
Daltons each, are arranged along the GI polypeptide chain which may contain up to 1,600 amino-acid
residues (Nussinovitch, 2010).
Table 12: Analytical data for the gum obtained from Acacia senegal
PARAMETER RANGE
Moisture content (%) 12.5–16.0
Specific rotation From -32.7o to -27.0o
Nitrogen (%) 0.22–0.39
Protein (%) 1.5–2.6
Galactose (%) 39–42
Arabinose (%) 24–27
Rhamnose (%) 12–16
Glucuronic acid (%) 15–16
Equivalent mass (Da) 1,118–1,238
Source: Verbeken et al, (2003).
Gum arabic has a major core chain built of β-D-galactopyranosyl residues linked by 1 → 3 bonds,
in part carrying side chains attached at position (Belitz et al., 2009). Side branches may contain α-
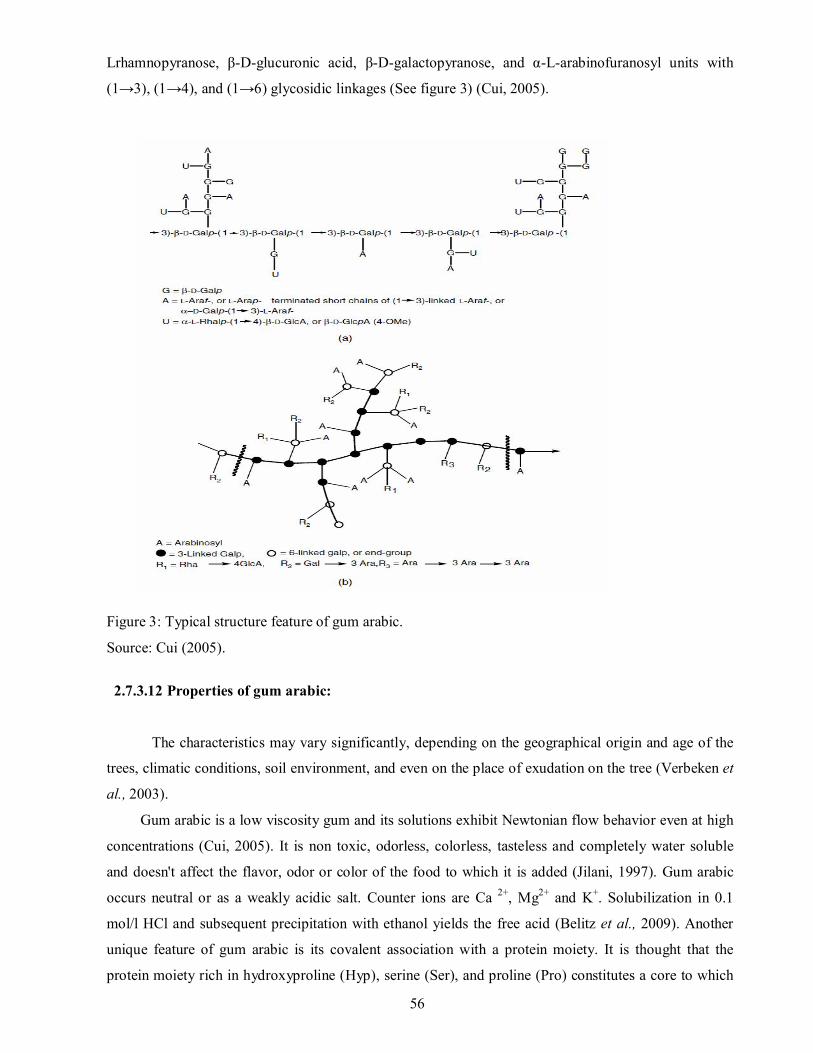
56
Lrhamnopyranose, β-D-glucuronic acid, β-D-galactopyranose, and α-L-arabinofuranosyl units with
(1→3), (1→4), and (1→6) glycosidic linkages (See figure 3) (Cui, 2005).
Figure 3: Typical structure feature of gum arabic.
Source: Cui (2005).
2.7.3.12 Properties of gum arabic:
The characteristics may vary significantly, depending on the geographical origin and age of the
trees, climatic conditions, soil environment, and even on the place of exudation on the tree (Verbeken et
al., 2003).
Gum arabic is a low viscosity gum and its solutions exhibit Newtonian flow behavior even at high
concentrations (Cui, 2005). It is non toxic, odorless, colorless, tasteless and completely water soluble
and doesn't affect the flavor, odor or color of the food to which it is added (Jilani, 1997). Gum arabic
occurs neutral or as a weakly acidic salt. Counter ions are Ca 2+, Mg2+ and K+. Solubilization in 0.1
mol/l HCl and subsequent precipitation with ethanol yields the free acid (Belitz et al., 2009). Another
unique feature of gum arabic is its covalent association with a protein moiety. It is thought that the
protein moiety rich in hydroxyproline (Hyp), serine (Ser), and proline (Pro) constitutes a core to which
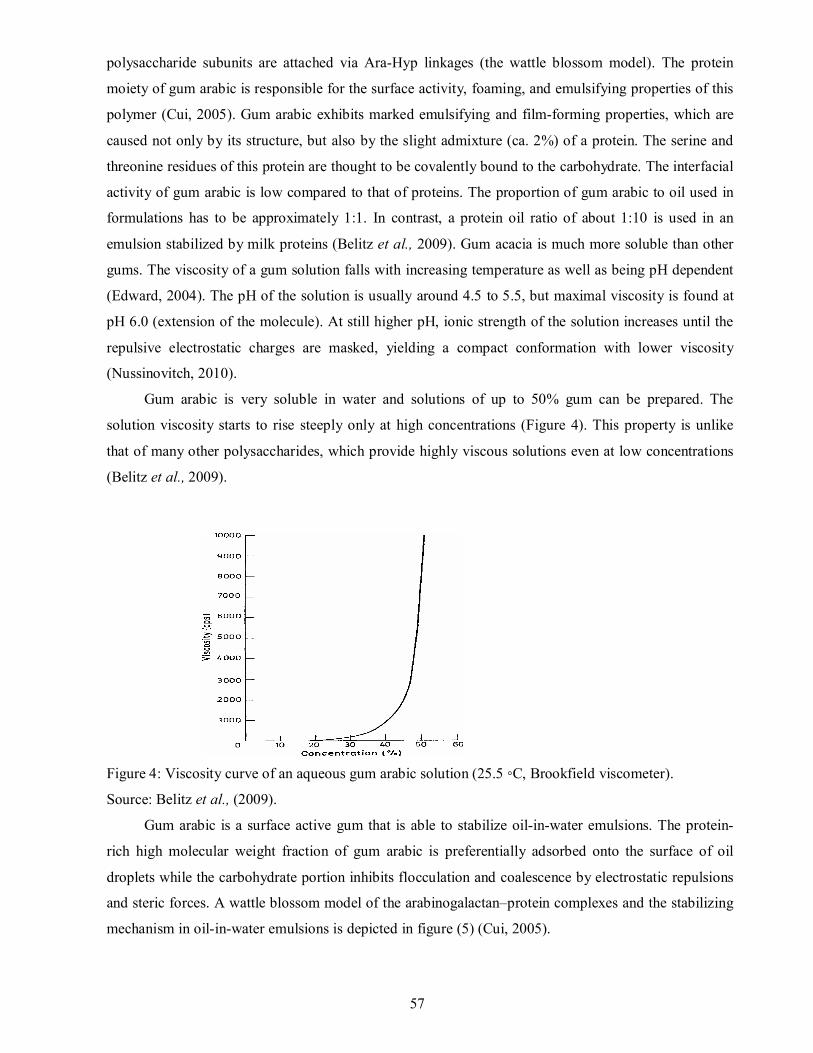
57
polysaccharide subunits are attached via Ara-Hyp linkages (the wattle blossom model). The protein
moiety of gum arabic is responsible for the surface activity, foaming, and emulsifying properties of this
polymer (Cui, 2005). Gum arabic exhibits marked emulsifying and film-forming properties, which are
caused not only by its structure, but also by the slight admixture (ca. 2%) of a protein. The serine and
threonine residues of this protein are thought to be covalently bound to the carbohydrate. The interfacial
activity of gum arabic is low compared to that of proteins. The proportion of gum arabic to oil used in
formulations has to be approximately 1:1. In contrast, a protein oil ratio of about 1:10 is used in an
emulsion stabilized by milk proteins (Belitz et al., 2009). Gum acacia is much more soluble than other
gums. The viscosity of a gum solution falls with increasing temperature as well as being pH dependent
(Edward, 2004). The pH of the solution is usually around 4.5 to 5.5, but maximal viscosity is found at
pH 6.0 (extension of the molecule). At still higher pH, ionic strength of the solution increases until the
repulsive electrostatic charges are masked, yielding a compact conformation with lower viscosity
(Nussinovitch, 2010).
Gum arabic is very soluble in water and solutions of up to 50% gum can be prepared. The
solution viscosity starts to rise steeply only at high concentrations (Figure 4). This property is unlike
that of many other polysaccharides, which provide highly viscous solutions even at low concentrations
(Belitz et al., 2009).
Figure 4: Viscosity curve of an aqueous gum arabic solution (25.5 ◦C, Brookfield viscometer).
Source: Belitz et al., (2009).
Gum arabic is a surface active gum that is able to stabilize oil-in-water emulsions. The protein-
rich high molecular weight fraction of gum arabic is preferentially adsorbed onto the surface of oil
droplets while the carbohydrate portion inhibits flocculation and coalescence by electrostatic repulsions
and steric forces. A wattle blossom model of the arabinogalactan–protein complexes and the stabilizing
mechanism in oil-in-water emulsions is depicted in figure (5) (Cui, 2005).

58
The unique property of Gum Arabic is its ability to produce oil droplets of fairly uniform 1-2 micron
diameter and to stabilize the emulsion so that it neither aggregates nor coalescences in acid solutions,
even over periods of several months (Nishinari, 2000).
Spray dried gum acacia has been used in pharmaceutical products for some time. The spray dried
gum offers the pharmaceutical manufacturer a clean ready to use product. Instant forms of gum acacia
have been offered by suppliers for some time. The instant products can be rapidly made into solution
and used. Obviously the instant gum is more expensive. A manufacturer that uses gum as a minor
ingredient may well find that the capital and labor cost of purifying raw gum is not cost effective. A
company that uses gum acacia as a major ingredient might come to a different conclusion (Edward,
2007).
2.7.3.13 Safety of gum arabic:
In Europe, gum arabic is authorized as a food additive named E414; while in the United States it
possesses the FDA GRAS (Generally Recognized as Safe) status (Touré, 2008). Moreover, its safety
has been established in healthy volunteers. The estimated acceptable daily intake (ADI) for humans was
set as “not specified” in 1982, and this was confirmed in 1992 (Nussinovitch, 2010).
Clinically, it has been tried in patients with chronic renal failure, and it was claimed that it helps
reduce urea and creatinine plasma concentrations and reduces the need for dialysis from 3 to 2 times per
week. GA has been claimed to alleviate the adverse effects of chronic renal failure in humans. Effects of
GA on lipid metabolism in humans and rats are at variance, but mostly suggest that GA ingestion can
Figure 5: Models of gum arabic as an emulsifier in oil-in-water emulsions: (a) Sketch representation of gum arabic structure: c and p represent the carbohydrate and protein moieties respectively; (b) Behavior of gum arabic at the oil/water interface. Source: Cui, (2005).
59
reduce plasma cholesterol concentrations in rats. GA has proabsorptive properties and can be used in
diarrhea. It enhances dental remineralization, and has some antimicrobial activity, suggesting a possible
use in dentistry. GA has been shown to have an adverse effect on electrolyte balance and vitamin D in
mice, and to cause hypersensitivity in humans (Ali et al., 2009).
Returning to the renal field of renal medicine, it is well established that supplementation of the diet
with gum arabic soluble fiber lowers serum urea nitrogen in rodents and in patients with chronic renal
failure. This effect is the result of increased colonic bacterial fermentation of gum arabic thus providing
them with energy for growth and nitrogen incorporation, and in turn increasing faecal bacterial mass
and nitrogen excretion. More recently a pilot study performed in collaboration with the Dialysis Centre
in Khartoum suggests that dietary gum arabic supplementation also reduces serum creatinine. This
cannot be related to alterations in colonic bacterial fermentation, but rather suggest that there may be a
direct beneficial effect on renal function. The mechanism of these potentially important therapeutic
observations is currently the subject of ongoing research (Williams and Phillips, 2004).
2.7.3.14 Nutrition of gum arabic:
Food manufacturers use the term “dietary fiber” to describe their products or its contents, but there
is no internationally accepted legal definition or approval system to support this practice. Gum arabic,
like other food fiber materials, is universally recognized scientifically as a food additive but its
regulatory status remains a matter of discussion and some uncertainty. The same uncertainty also relates
to the regulatory status, as dietary fiber, of other soluble and insoluble plant/algal polysaccharides
(Nussinovitch, 2010).
Upon its consumption, gum arabic is fermented by the intestinal bacteria to SCFAs, particularly
propionate. Using an enrichment culture of pig cecal bacteria from a selected high-molecular- weight
gum arabic (MW 1.77 x 10⁶), it was observed that a Prevotella ruminicola-like bacterium, as the
predominant bacterium, is most likely responsible for gum arabic fermentation to propionate. On the
one hand, dietary supplementation with gum arabic (SUPER GUMTM) increased serum butyrate, which
at least in vitro has beneficial effects on renal profibrotic cytokine generation. On the other hand, plant
hydrocolloids can reduce protein digestibility and, consequently, modify the bioavailability of amino
acids. In-vitro hydrolysis at 37°C of β-lactoglobulin in mixed dispersions containing gum arabic, low-
methylated pectin or xylan was studied. β-lactoglobulin was almost totally resistant to pepsin digestion
and the three plant hydrocolloids significantly inhibited β-lactoglobulin digestibility. The decrease in
digestibility obtained with xylan was greater than that obtained with gum arabic or low-methylated
pectin (Nussinovitch, 2010).
Diarrhea is a common and deadly threat to millions of infants and children worldwide. Similarly,
malabsorption can aggravate the health status of the chronically ill, particularly in the elderly population.
60
Prompt recovery from intestinal dysfunction may have a substantial impact on many populations. The
proabsorptive effects of gum arabic could directly reduce and ameliorate intestinal dysfunction. Natural
proteoglycans, such as gum arabic, can reduce secretory effects induced by cathartics and, hence, are
predictive of potential effectiveness in the context of diarrhea or malabsorption due to infectious or
systemic causes. Stem exudates, seeds, leaves and the insides of pods are also used for skin diseases, as
well as to control parasites in dogs and to treat diarrhea (Nussinovitch, 2010).
2.7.3.15 Adverse effects and toxicity of Gum arabic:
Gum arabic, gum tragacanth, gum karaya and gum ghatti are safe for human consumption based on
a long history of usage as well as recent toxicological studies (Nussinovitch, 2010).
The safety of GA (5, 10, 20 or 40 g in water for 4 weeks) has recently been confirmed in healthy
men. The subchronic toxicity of a new type of GA (SUPER GUM [Acacia (sen) SUPER GUM]), a
naturally processed polysaccharide exudate from A. senegal, was studied when given to both sexes of
F344 rats at dietary levels of 0 (control), 1.25%, 2.5%, and 5.0% (10 rats/sex/group). During the study,
the treatment had no effect on clinical signs, survival, body weights, food and water consumption,
urinalysis, ophthalmology, hematology, and blood biochemistry, and no gross pathological or
histopathological alterations. Increased relative cecum (filled) weights, evident in both sexes of the
5.0% group and females of the 1.25% and 2.5% groups, were considered to be a physiological
adaptation. It was concluded that, at least, up to a dietary level of 5.0%, SUPER GUM (equivalent to
3117 mg/kg body weights/day for males, and 3296 mg/kg body weights/day for females) caused no
adverse effect. This confirms earlier reports that documented the safety of GA (Ali et al., 2009).
2.7.3.16 Applications of gum arabic:
Gum arabic is used in five main food areas: confections, beverages and emulsions, flavor
encapsulation, baked goods and brewing (Nussinovitch, 2010). Only the gum from A. senegal has been
effectively demonstrated as an innocuous food additive (Touré, 2008). Gum arabic is the most
commonly recognized hydrocolloid emulsifier which is widely used in the soft drinks industry for
emulsifying flavor oils (e.g., orange oil) under acidic conditions. Gum arabic found broad applications
in the confectionary and beverage industries as an emulsifier and stabilizer and flavor encapsulation
agent. For example, it is used as an emulsifier in the production of concentrated citrus juices and cola
flavor soft drinks (Edward, 2007). Gums have also been used to coat sensitive ingredients against both
moisture and fat migration. A common example is the use of gum arabic solution, to coat nuts prior to
chocolate panning or adding into multicomponent confectionery bars (Kilcast and Subramaniam, 2000).
61
Gum arabic has excellent emulsifying properties, particularly thanks to its AGP fraction (Verbeken
et al., 2003). The officially accepted value for the energy content of gum acacia has varied between zero
and 100% of the bomb calorimeter value. The currently accepted value is 50% of the bomb calorimeter
value (Edward, 2007).
Gum arabic is also used in candies to prevent sugar crystallization and to emulsify the fatty
components in products such as pastilles, caramel, and toffee. Gum arabic is an ingredient in chewing
gums and cough drops. Spray-drying of flavor oils with gum arabic solutions produces
microencapsulated powders that can be easily incorporated into convenient dry food products such as
soup and dessert mixes (Cui, 2005).
Gum acacia gives a lower viscosity than the other gums more has to be used. However, as this gum
is more soluble it is possible to use more (Edward, 2007). Natural gums are capable of causing a large
increase in solution viscosity, often even at low concentrations (Nussinovitch, 2010).
2.7.3.17 Use of gum arabic in breadbaking:
Gum arabic is unique in the very high gum concentrations which can be used to prepare solutions.
Thus, large amounts of gum can be used in a variety of food products (Nussinovitch, 2010).
Gum arabic is widely used in the backing industry for its viscosity and adhesive property (Jilani,
1993). The addition of gum arabic concludes in increased loaf volume and bread characteristics. The
improvement of bread external appearance and its internal characteristics such as texture, cell wall
structure, color and softness were also described (Hemeda and Mohamed, 2010). Gum arabic and CMC
improved loaf volume, internal and external appearance of bread, Gum Arabic gave the better results
than CMC (Asghar et al., 2005). Gum acacia is likely to be encountered in bakeries in small quantities
when it has been used to make emulsions of citrus oils as a bakery flavor (Edward, 2007). Gums like
guar, carboxy-methylcellulose, xanthan, and gum arabic improve machinability, decrease dough
stickiness, delay staling, improve rollability and water holding capacity, improve freeze/thaw stability
and decrease moisture loss (Gritsenko, 2009). Arabic gum is added into wheat dough to slow aging of
bakery products, to improve volume of bakery products, to milder consistence in ice creams and in
confectionery to stop sugar crystallization (Mikuš et al., 2011). The use of gum arabic and CMC, both
at 3% on a flour weight basis, improved the quality of the frozen pizza dough (Nussinovitch, 2010). The
effects of different hydrocolloids on the gelatinization behavior of hard wheat flour, Gum Arabic lowers
the peak viscosity, reduces breakdown during heating and thus provides increased stability during
cooking (Alam et al., 2009).
In general, however, it is the highly soluble fibers (those that are highly branched or are relatively
short-chain polymers, such as gum arabic, isolated arabinogalactans, inulin and oligosaccharides) that
have low viscosities. These low-viscosity fibers have low GI and are generally used to modify texture or
62
rheology, manage water migration, influence the solution properties of the food system, and improve
the marketability of the food product as a health-promoting or functional food product. These fiber
sources can be used in food products at relatively high levels, as they typically enhance the food
product’s taste, mouth feel and shelf-life without significantly altering the specific application
characteristics. For example, they can be used in sugar-free and fat-free products, increasing the
potential for a high fiber claim (Kent and Evers, 1994).
Gum arabic can also be regarded as a source of soluble fiber, being unaffected by passage through the
stomach but broken down by the large intestine (Emerton and Choi, 2008).
Flavor emulsions are flavor oils dissolved in water with the aid of a starch or gum. The starch or
gum—often gum arabic or xanthan gum—acts as an emulsifier, allowing the oil to blend more easily
with other ingredients. This makes flavor emulsions easier to add to batters and doughs, for example
(Figoni, 2008).
The maximum % usage level of specific gums in bakery foods, based on the Code of Federal
Regulations in the U.S. Gum acacia may be used at 0.8% gum level in baked goods (Williams and
Phillips, 2004).
63
CHAPTER THREE
MATERIALS AND METHODS
3.1 Materials:
3.1.1 Wheat flour:
Wheat flour was obtained from A Flour Mills – industrial zone Bahry. Main specification of flour
is without any additives, that sample was taken from process line. Flour was kept in temperature below
50 C during period of experiment.
3.1.2 Gum arabic:
Gum arabic was obtained from Henelie Industries Ltd. Which is provide gum arabic (Spray-dried
gum arabic and kibbled gum), Industrial zone – Albagair. Type of gum arabic (Hashab) gum, that gum
was purchased from Alobeid market. Weights of samples of gum arabic were taken as percentage of
flour (w/w %), the sample of gum arabic was kept in temperature below 50 C during period of
experiment.
3.1.3 Other raw materials:
- Baker yeast from local market, Levure instant yeast, made in Turkey by Ozmaya San. A.S. (a
Lesaffre company).
- Salt from Alrasheed factory, portsudan, local market
- Ascorbic acid, purchasing from local market.
- Alpha amylase purchasing from local market.
- Sugar from Dal group company package 1 kg
- Edible oil from Savola Company – Sudan
3.2 Methods:
Proximate analysis was carried out for samples consist of mixture of wheat flour and gum
arabic.

64
3.2.1 Determination of moisture content:
The determination of moisture was carried out according to AACC (2000) methods.
The main steps were as follows:
Three grams of well-mixed samples were weighed accurately in clean preheated moisture dish of
known weight by using sensitive balance.
The uncovered dishes with the samples were kept in an air oven provided with a fan at 130°C
for 1 hour.
The dish was then covered and transferred to desiccator and weighed after cooled to room
temperature.
The loss of weight was calculated as percent of sample weight and expressed as moisture
content:
Moisture content % = Wt1 – Wt2
Sample wt.
Where:
Wt1 = Weight of sample + dish before oven dry.
Wt2 = Weight of sample + dish after oven dry.
3.2.2 Determination of ash
The determination of ash was carried out according to AACC (2000) methods.
The steps were as follows:
Three grams were weighed in empty crucible of known weight. The sample was heated in a Muffle-
Furnace at 550°C until its weight is stable. The residue is cooled to room temperature after removed
from a Muffle-furnace and placed in a desiccator then weighed.
The process was repeated until constant weight was obtained.
% Ash content was calculated using the following equation:
Ash content % = (Wt1 – Wt2) x 100X100
Sample wt.x (100-m)
Where:
Wt1 = Weight of crucible with ashed sample.
Wt2 = Weight of empty crucible.
m = % moisture.
65
3.2.3 Determination of crude protein:
The determination of crude protein was carried out on the samples according to AOAC (1984)
methods.
The steps were as follows:
A 0.2 gram of sample, plus 0.4 gram catalyst mixture (potassium sulfate + cupric sulfate 10:1 by
wt), and 7 ml concentrated nitrogen free sulfuric acid, were mixed in a small Kjeldahl flask (100 ml).
The mixture was digested for two hours, then cooled, diluted, and placed in the distillation
apparatus.
Fifteen milliliters of 40% NaOH solution were added and mixture
was heated and distilled until 50 ml were collected in a 100 ml conical flask. The ammonia evolved was
received in 10 ml of 2% boric acid solution plus 3-4 drops of universal indicators (methyl red and
bromo cresol green).
The trapped ammonia was titrated against 0.02N Hcl.
The percentage (g/100) of protein was calculated by using an empirical factor to convert
nitrogen into protein as follows:
Nitrogen content % = TV × N × 14.00 × 100
1000 × wt. of sample
Protein content % = (nitrogen content %) X F
Where:
TV = Actual volume of HCL used for titration (ml HCL – ml blank).
N = Normality of HCL.
14.00 = Each ml of HCL is equivalent to 14 mg nitrogen.
1000 = To convert from mg to gm.
5.7 = constant factor for wheat flour.
3.2.4 Determination of fat content:
Crude fat was determined according to the standard method of AOAC (1990). A sample of 3 g was
weighed into an extraction thimble and covered with cotton; that was previously extracted with hexane
(BP60-70°C), and then the sample and a pre-dried and weighed Erlenmeyer flask containing about 50
ml were attached to extraction unit for 45 minutes. At the end of distillation period, the solvent was
recovered from the oil. Later, the flask with the remaining crude hexane extract was put in an oven at
105 °C for about an hour. Cooled in a desiccator, reweighed and dried extract was recorded as crude
fat% (DM) according to the following formula:
Crude fat % (DM) = Dry extract w.t (g) x 100 x 100
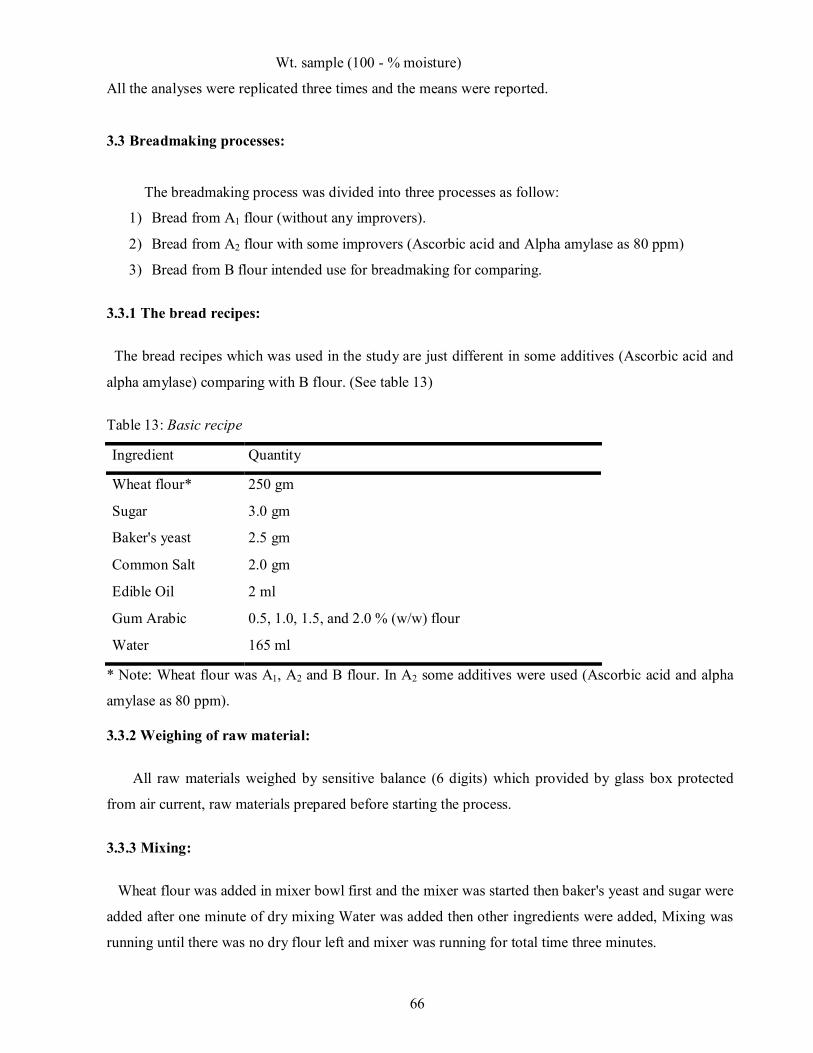
66
Wt. sample (100 - % moisture)
All the analyses were replicated three times and the means were reported.
3.3 Breadmaking processes:
The breadmaking process was divided into three processes as follow:
1) Bread from A1 flour (without any improvers).
2) Bread from A2 flour with some improvers (Ascorbic acid and Alpha amylase as 80 ppm)
3) Bread from B flour intended use for breadmaking for comparing.
3.3.1 The bread recipes:
The bread recipes which was used in the study are just different in some additives (Ascorbic acid and
alpha amylase) comparing with B flour. (See table 13)
Table 13: Basic recipe
Ingredient Quantity
Wheat flour* 250 gm
Sugar 3.0 gm
Baker's yeast 2.5 gm
Common Salt 2.0 gm
Edible Oil 2 ml
Gum Arabic 0.5, 1.0, 1.5, and 2.0 % (w/w) flour
Water 165 ml
* Note: Wheat flour was A1, A2 and B flour. In A2 some additives were used (Ascorbic acid and alpha
amylase as 80 ppm).
3.3.2 Weighing of raw material:
All raw materials weighed by sensitive balance (6 digits) which provided by glass box protected
from air current, raw materials prepared before starting the process.
3.3.3 Mixing:
Wheat flour was added in mixer bowl first and the mixer was started then baker's yeast and sugar were
added after one minute of dry mixing Water was added then other ingredients were added, Mixing was
running until there was no dry flour left and mixer was running for total time three minutes.
67
3.3.4 First fermentation (proofing):
Fermentation process was implemented in two steps:
After mixing the dough was taken out from the mixer and put on the table after that it was given
code numbers and covered and kept to rest for ten minutes at room temperature.
3.3.5 Dividing:
After first fermentation, dough was transferred and scaled into three portions, and rounded into
balls. Each weight of piece was 120 gm and then pieces were placed in lightly greased metal templates.
3.3.6 Second fermentation:
Dough after dividing was placed in the fermentation cabinet at 30ºC and 85% relative humidity. In
this step fermentation times were done in different time in both samples of A flours, in B flour the
fermentation time was maintained stable for each samples.
3.3.7 Baking process:
After fermentations process all templates were transferred to Oven at 2500 C, provided with rotation
shelf to distribute heating. Baking time of samples were different in A1 and A2 flour, B flour sample was
maintained stable.
3.3.8 Cooling process:
Bread was transferred from the Oven to table and then were removed from the templates and kept to
cool. After 15 minutes all bread reached the room temperature.
3.3.9 Measuring of specific volume:
The specific volume of bread was calculated according to AACC (2000) by dividing volume (cc) by
weight (g). After bread was cooled. It was transferred to sensitive balance for weight and subsequently
to bread volume tester to measure volume. Loaf Specific Volume (LSV), was calculated according to
the following:
L.S.V = Loaf volume (cc) / Loaf weight (g) = cc /g
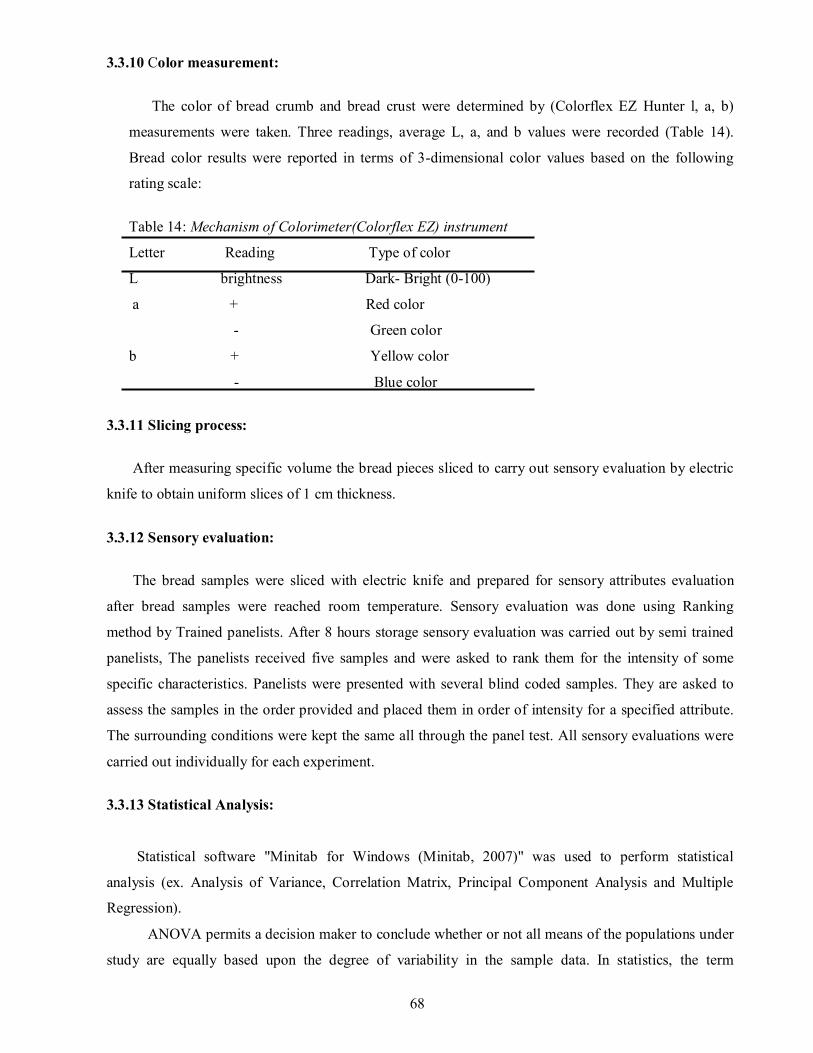
68
3.3.10 Color measurement:
The color of bread crumb and bread crust were determined by (Colorflex EZ Hunter l, a, b)
measurements were taken. Three readings, average L, a, and b values were recorded (Table 14).
Bread color results were reported in terms of 3-dimensional color values based on the following
rating scale:
Table 14: Mechanism of Colorimeter(Colorflex EZ) instrument
Letter Reading Type of color
L brightness Dark- Bright (0-100)
a + Red color
- Green color
b + Yellow color
- Blue color
3.3.11 Slicing process:
After measuring specific volume the bread pieces sliced to carry out sensory evaluation by electric
knife to obtain uniform slices of 1 cm thickness.
3.3.12 Sensory evaluation:
The bread samples were sliced with electric knife and prepared for sensory attributes evaluation
after bread samples were reached room temperature. Sensory evaluation was done using Ranking
method by Trained panelists. After 8 hours storage sensory evaluation was carried out by semi trained
panelists, The panelists received five samples and were asked to rank them for the intensity of some
specific characteristics. Panelists were presented with several blind coded samples. They are asked to
assess the samples in the order provided and placed them in order of intensity for a specified attribute.
The surrounding conditions were kept the same all through the panel test. All sensory evaluations were
carried out individually for each experiment.
3.3.13 Statistical Analysis:
Statistical software "Minitab for Windows (Minitab, 2007)" was used to perform statistical
analysis (ex. Analysis of Variance, Correlation Matrix, Principal Component Analysis and Multiple
Regression).
ANOVA permits a decision maker to conclude whether or not all means of the populations under
study are equally based upon the degree of variability in the sample data. In statistics, the term
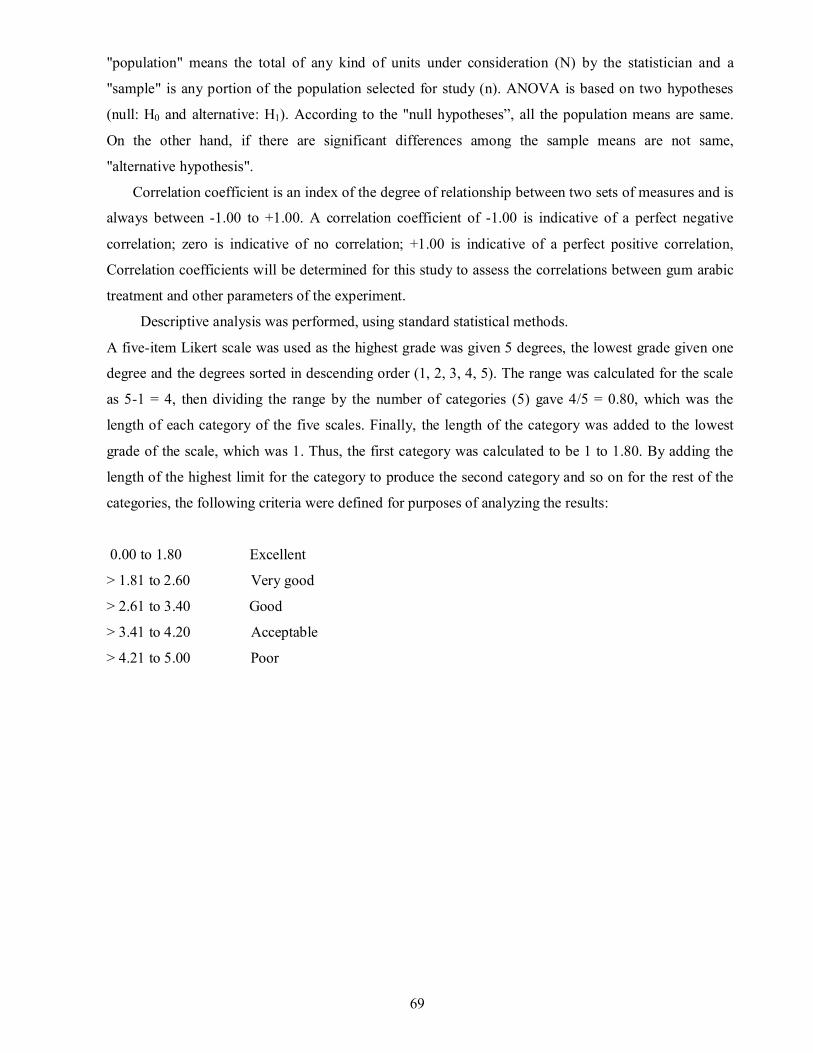
69
"population" means the total of any kind of units under consideration (N) by the statistician and a
"sample" is any portion of the population selected for study (n). ANOVA is based on two hypotheses
(null: H0 and alternative: H1). According to the "null hypotheses”, all the population means are same.
On the other hand, if there are significant differences among the sample means are not same,
"alternative hypothesis".
Correlation coefficient is an index of the degree of relationship between two sets of measures and is
always between -1.00 to +1.00. A correlation coefficient of -1.00 is indicative of a perfect negative
correlation; zero is indicative of no correlation; +1.00 is indicative of a perfect positive correlation,
Correlation coefficients will be determined for this study to assess the correlations between gum arabic
treatment and other parameters of the experiment.
Descriptive analysis was performed, using standard statistical methods.
A five-item Likert scale was used as the highest grade was given 5 degrees, the lowest grade given one
degree and the degrees sorted in descending order (1, 2, 3, 4, 5). The range was calculated for the scale
as 5-1 = 4, then dividing the range by the number of categories (5) gave 4/5 = 0.80, which was the
length of each category of the five scales. Finally, the length of the category was added to the lowest
grade of the scale, which was 1. Thus, the first category was calculated to be 1 to 1.80. By adding the
length of the highest limit for the category to produce the second category and so on for the rest of the
categories, the following criteria were defined for purposes of analyzing the results:
0.00 to 1.80 Excellent
> 1.81 to 2.60 Very good
> 2.61 to 3.40 Good
> 3.41 to 4.20 Acceptable
> 4.21 to 5.00 Poor
70
CHAPTER FOUR
RESULTS AND DISCUSSION
4.1 Proximate composition of mixture of wheat flour and gum arabic:
Gum arabic had no significant effect on proximate composition of mixture of gum arabic and wheat
flour P-value is greater than the -level (Table 15) (P> 0.05). Therefore, the null hypothesis failed to
reject.
4.2 Effect of gum arabic on fermentation time:
Table 16 shows that the gum arabic addition has no significant effects on fermentation time (P-
values: 0.651 and -0.769) in A1 flour, A2 flour, respectively, p-values is greater than the -level, failed
to reject the null hypothesis.
Gum arabic addition had no effect on fermentation time at significant level (0.05). Emulsifying
agents may improve the functional properties of the dough by increasing water absorption and gas
retention, decreasing proofing times, and reducing the staling rate as was previously found by (Hutkins,
2006). In another study, dough conditioners or stabilizers and emulsifiers reduce the necessity for
resting times and improve tolerance towards dough handling in the bakery equipment (Amendola and
Rees, 2003).
4.3 Effect of gum arabic on baking time:
Table 17 shows the gum addition had no significant effect on baking time (P-values: 0.162 and
0.932 in A1 flour and A2, respectively, p-values are greater than the a-level, fail to reject the null
hypothesis.
From this result effect of gum arabic on baking time had no significant by comparison with sample
of B flour (constant baking time) perhaps, due to amount of gum arabic addition compared as was
previously found by Wassermann (Proofing stability as well as oven spring will also increase)
(Wassermann, 2009).
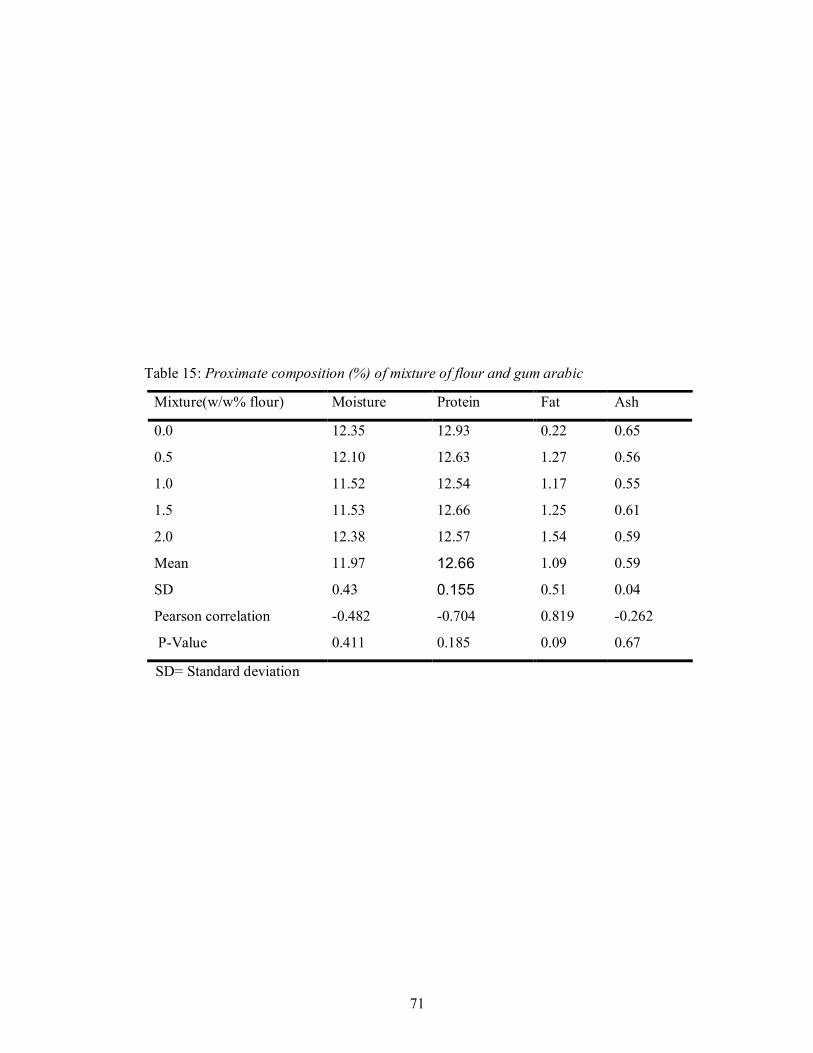
71
Table 15: Proximate composition (%) of mixture of flour and gum arabic
Mixture(w/w% flour) Moisture Protein Fat Ash
0.0 12.35 12.93 0.22 0.65
0.5 12.10 12.63 1.27 0.56
1.0 11.52 12.54 1.17 0.55
1.5 11.53 12.66 1.25 0.61
2.0 12.38 12.57 1.54 0.59
Mean 11.97 12.66 1.09 0.59
SD 0.43 0.155 0.51 0.04
Pearson correlation -0.482 -0.704 0.819 -0.262
P-Value 0.411 0.185 0.09 0.67
SD= Standard deviation
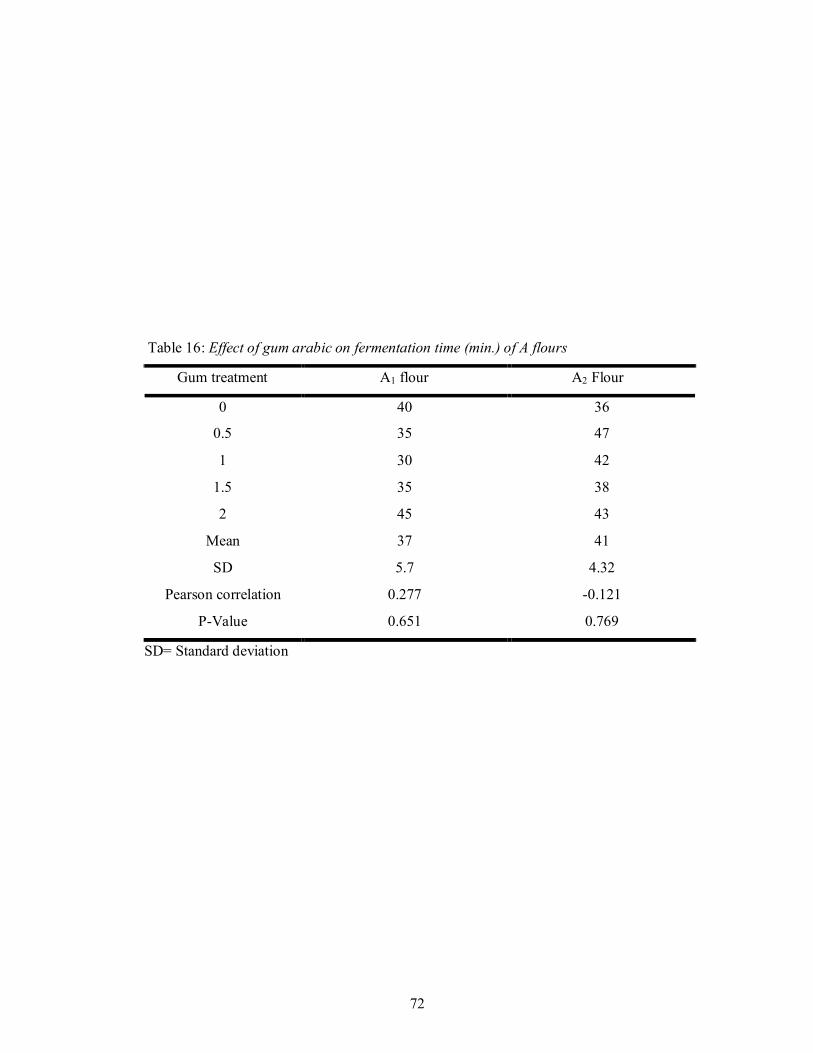
72
Table 16: Effect of gum arabic on fermentation time (min.) of A flours
Gum treatment A1 flour A2 Flour
0 40 36
0.5 35 47
1 30 42
1.5 35 38
2 45 43
Mean 37 41
SD 5.7 4.32
Pearson correlation 0.277 -0.121
P-Value 0.651 0.769
SD= Standard deviation
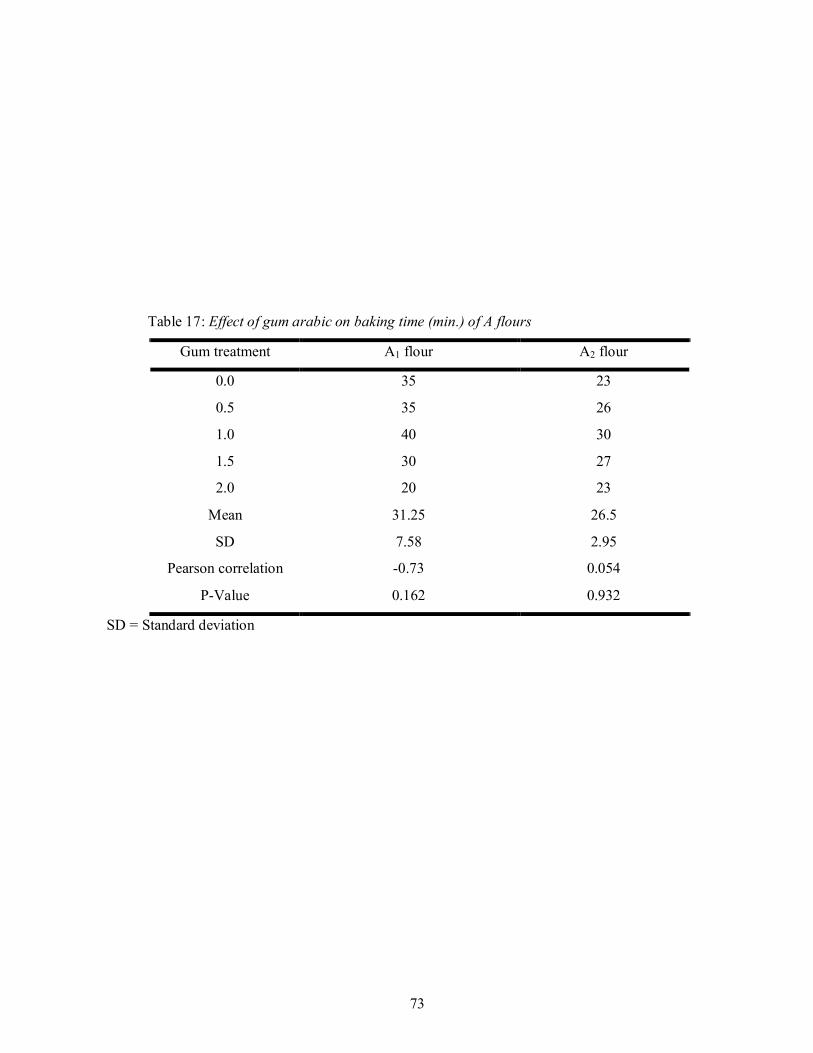
73
Table 17: Effect of gum arabic on baking time (min.) of A flours
Gum treatment A1 flour A2 flour
0.0 35 23
0.5 35 26
1.0 40 30
1.5 30 27
2.0 20 23
Mean 31.25 26.5
SD 7.58 2.95
Pearson correlation -0.73 0.054
P-Value 0.162 0.932
SD = Standard deviation

74
4.4 Effect of gum arabic on specific volume of A1 and A2 breads:
Table 18 shows the gum addition had significant effects on specific volume (P-values: 0.004 and
0.043 in A1 bread and A2 bread respectively, p-values are less than the -level, reject the null
hypothesis in favor of the alternative hypothesis.
Gum arabic had strong decreasing effect on specific volume on A breads (Look Plate 1 and 2). Table
19 presented effect of gum arabic on specific volume of A1 bread and A2 bread as percentage compared
with control sample. 4.5 Effect of gum arabic addition on specific volume of B bread:
Table 20 shows the gum addition has significant effects on specific volume of B bread (Fermentation
and baking times were kept stable). (P-value: 0.007) p-value is less than the -level, failed to reject the
null hypothesis in favor of the alternative hypothesis. Gum arabic decreased specific volume of B bread
by -20.67 % every 0.5% gum arabic (Table 21)
Gum arabic had different effect on specific volume of three types of flours, decreasing of specific
volume was presented for every treatment, but the effect is less in A1 bread, A2 bread and B bread,
respectively (Table 22).
In the results above gum arabic play as inhibition factor as was previously found by hydrocolloids
when used in small quantities (<1% (w/w) in flour) are expected to increase water retention and loaf
volume and to decrease firmness and starch retrogradation (Kohajdova et al., 2009).
The negative effect of gum arabic was more effect by the general volume of bread, so if specific
volume of bread was too high gum arabic effect was becomes high too.
Generally, comparing with the control, gum arabic addition decreased specific volume according to
volume of bread, but this effect does not continue because there well reached point then become
permanent. There was semi relation between A1 bread and B bread in 0.5% and 1.5% of gum arabic.
Gum arabic had decreased specific volume of all treated breads compared with the control sample.
Plate (3) shows relation between gum arabic treatment and specific volume of B bread.

75
Plate 1: A1 bread
Plate 2: A2 bread
0.0% 0.5% 1.0% 1.5% 2.0%
0.0% 0.5% 1.0% 1.5% 2.0%
Plate 3: B bread
0.0% 0.5% 1.0% 1.5% 2.0%
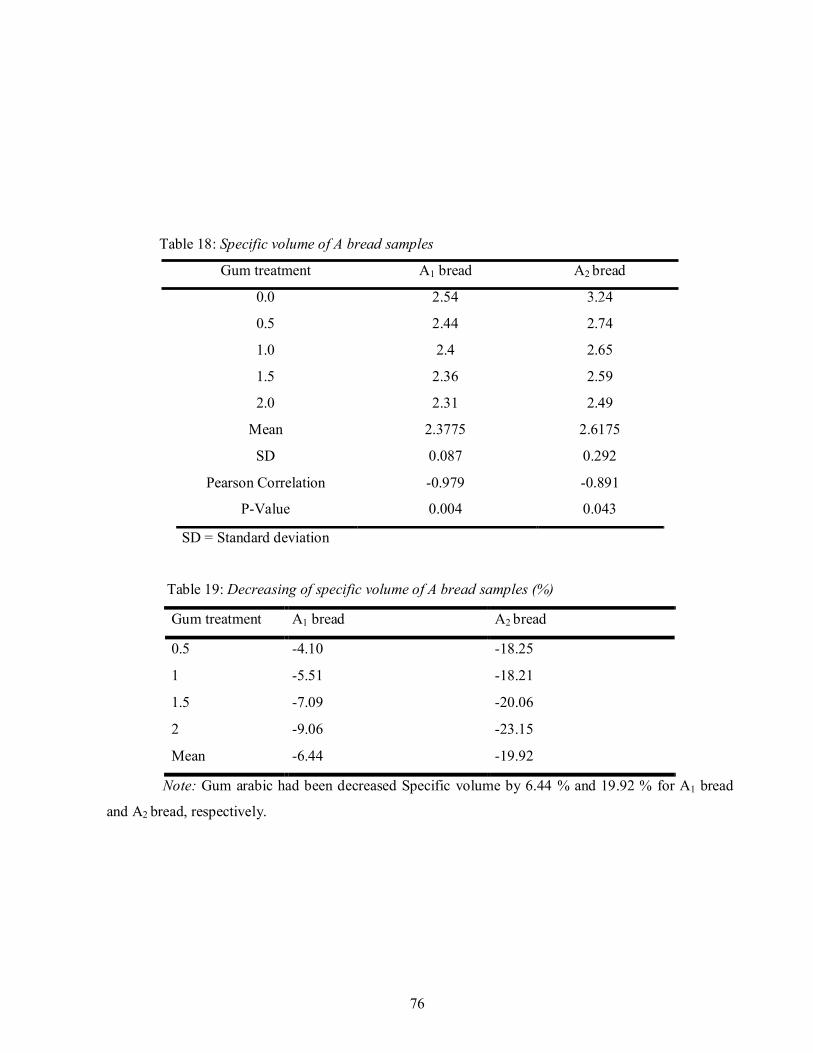
76
Table 18: Specific volume of A bread samples
Gum treatment A1 bread A2 bread
0.0 2.54 3.24
0.5 2.44 2.74
1.0 2.4 2.65
1.5 2.36 2.59
2.0 2.31 2.49
Mean 2.3775 2.6175
SD 0.087 0.292
Pearson Correlation -0.979 -0.891
P-Value 0.004 0.043
SD = Standard deviation
Table 19: Decreasing of specific volume of A bread samples (%)
Gum treatment A1 bread A2 bread
0.5 -4.10 -18.25
1 -5.51 -18.21
1.5 -7.09 -20.06
2 -9.06 -23.15
Mean -6.44 -19.92
Note: Gum arabic had been decreased Specific volume by 6.44 % and 19.92 % for A1 bread
and A2 bread, respectively.
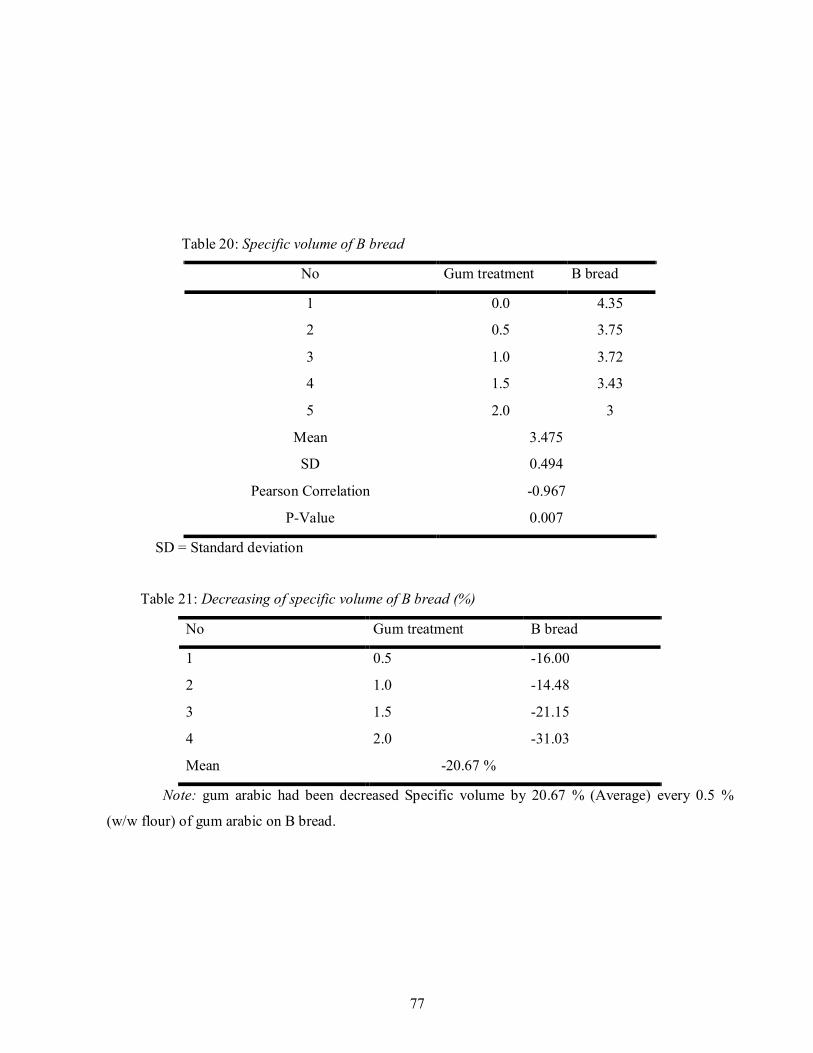
77
Table 20: Specific volume of B bread
No Gum treatment B bread
1 0.0 4.35
2 0.5 3.75
3 1.0 3.72
4 1.5 3.43
5 2.0 3
Mean 3.475
SD 0.494
Pearson Correlation -0.967
P-Value 0.007
SD = Standard deviation
Table 21: Decreasing of specific volume of B bread (%)
No Gum treatment B bread
1 0.5 -16.00
2 1.0 -14.48
3 1.5 -21.15
4 2.0 -31.03
Mean -20.67 %
Note: gum arabic had been decreased Specific volume by 20.67 % (Average) every 0.5 %
(w/w flour) of gum arabic on B bread.
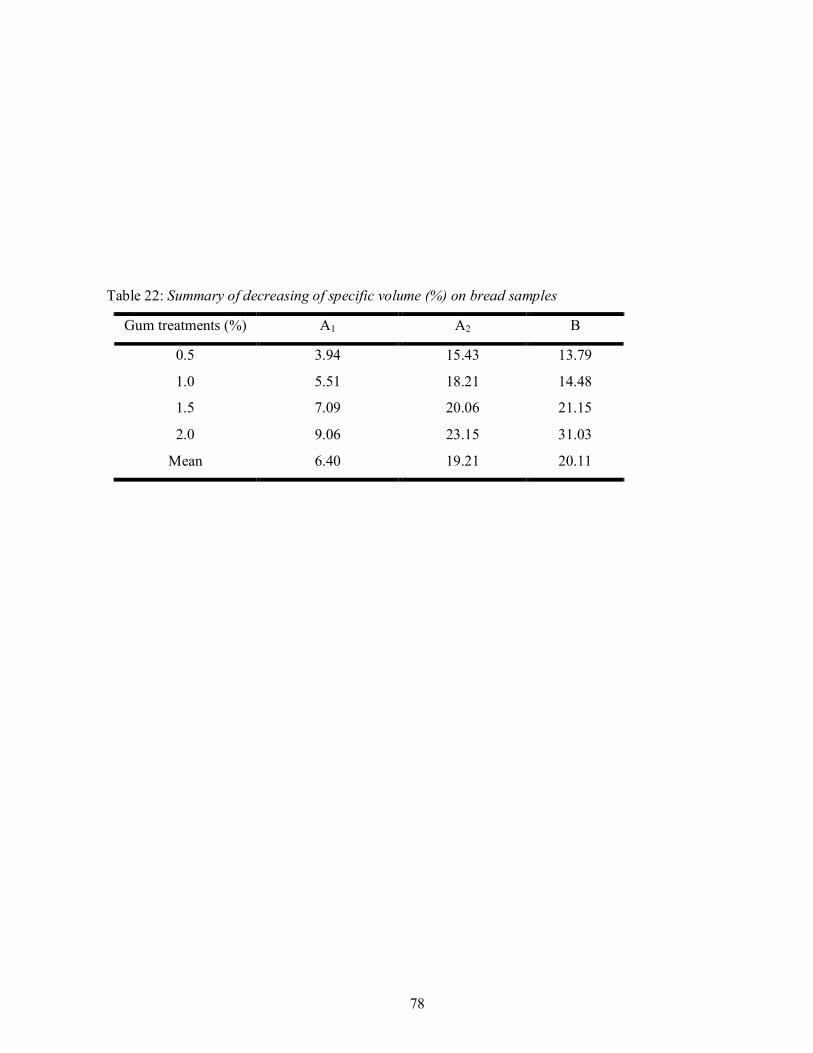
78
Table 22: Summary of decreasing of specific volume (%) on bread samples
Gum treatments (%) A1 A2 B
0.5 3.94 15.43 13.79
1.0 5.51 18.21 14.48
1.5 7.09 20.06 21.15
2.0 9.06 23.15 31.03
Mean 6.40 19.21 20.11

79
In table (22) specific volume of all bread types treated by gum arabic decreased with increasing
amount of gum arabic. However, the decreasing was different from one type to another. Therefore, gum
arabic treatment did not improve specific volume of all bread types, this result was opposite result that
found by Kohajdova et al. (2009) the addition of gum arabic concludes in increased loaf volume and
bread characteristics. The improvement of bread external appearance and its internal characteristics
such as texture, cell wall structure, color and softness were also described.
4.6 Effect of gum arabic on bread colors (a/b) of crumb and crust of A1 and A2 breads:
Table 23 shows the gum addition did not had significant effected on color (a/b) of crumb and crust
of breads. (P-values are greater than the -level) so, failed to reject the null hypothesis in crumb and
crust color.
4.7 Effect of gum arabic addition on sensory evaluation:
The gum addition has significant effects on sensory evaluation p-value is less than the -level,
failed to reject the null hypothesis in favor of the alternative hypothesis (Look Appendices).
Gum arabic had different effect on sensory attributes at fresh and at stored bread.
In A1 bread, taste, texture and general acceptability were preferred in gum arabic addition 0.5%.
Whereas, color and flavor were preferred in 1.5% and 1.0% respectively. Nevertheless, after 8 hours
taste, texture and general acceptability were preferred in 0.5 % and color and flavor were preferred in
2% addition (Table 24). Generally, 0.5% gum Arabic addition was preferred by panelists in overall
sensory evaluation, however after 8 hours from evaluation, 1.0 % of gum Arabic addition panelists
preferred it, figure 6 presented that clearly.
Addition of gum arabic on A2 bread was given findings differ from those findings in A1 bread, as 1.0
% gum Arabic is better in color acceptance. flavor, texture and general acceptability preferred in 0.5%
addition and taste was better in 1.0% addition.
After 8 hours, taste, texture and general acceptability were preferred in 0.5% addition; color and
flavor were preferred in 1.5% and 1.0% addition respectively (Table 25).
Generally, 0.5% was overall preferred in fresh bread but after 8 hours 0.5% was overall preferred
too, this finding was opposite result of A1 bread (Figure 7).
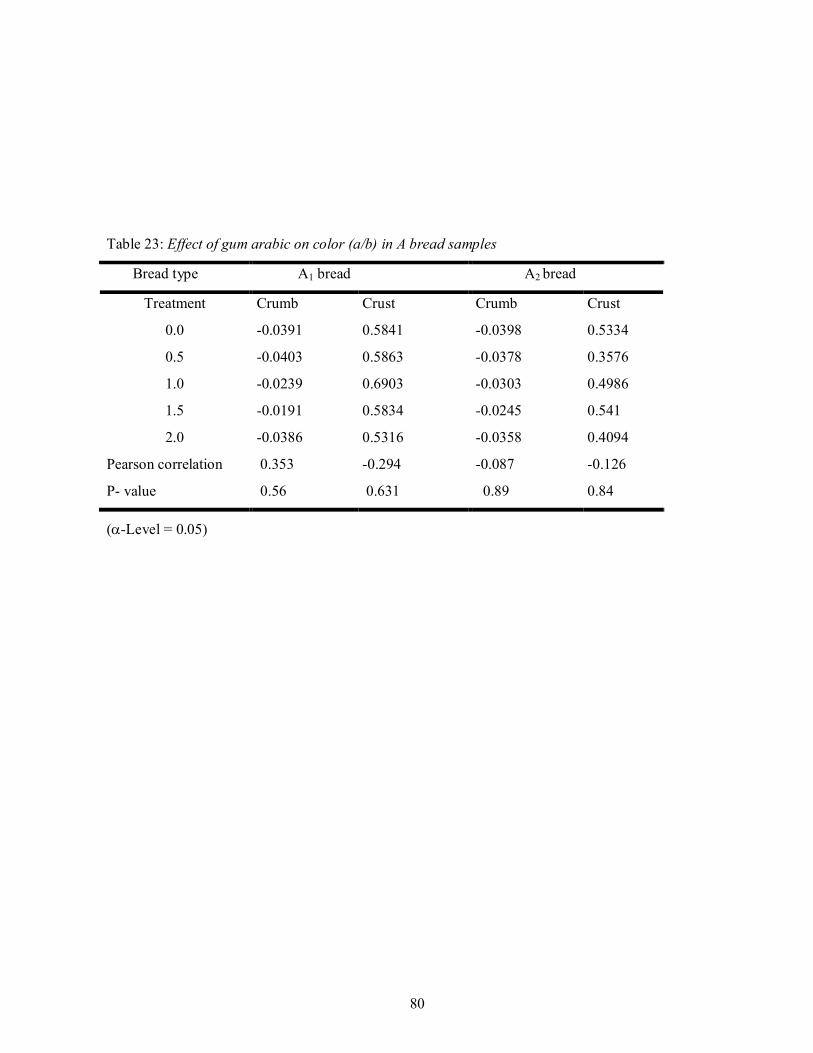
80
Table 23: Effect of gum arabic on color (a/b) in A bread samples
(-Level = 0.05)
Bread type A1 bread A2 bread
Treatment Crumb Crust Crumb Crust
0.0 -0.0391 0.5841 -0.0398 0.5334
0.5 -0.0403 0.5863 -0.0378 0.3576
1.0 -0.0239 0.6903 -0.0303 0.4986
1.5 -0.0191 0.5834 -0.0245 0.541
2.0 -0.0386 0.5316 -0.0358 0.4094
Pearson correlation 0.353 -0.294 -0.087 -0.126
P- value 0.56 0.631 0.89 0.84

81
Table 24: Grouping sensory attributes of A1 bread using Fisher method
Fresh Bread After 8 hours
Gum treatment (%) N Mean Grouping Gum treatment Mean Grouping
2.0 5 3.72 A 0.0 5.0 A
1.5 5 3.42 A 0.5 3.1 B
1.0 5 3.29 A 1.5 2.5 BC
0.0 5 2.40 B 2.0 2.3 C
0.5 5 2.21 B 1.0 2.1 C
* Means that do not share a letter are significantly different.
Figure 6: Comparison of overall acceptability of A1 fresh bread (Left) and after 8 hours of storage bread
(Right). (Note: Preference is for the shortest bar).

82
Table 25: Grouping sensory attributes of A2 bread using Fisher method.
Fresh bread After 8 hours
Gum treatment% N Mean Grouping Gum treatment% Mean Grouping
0.0 5 3.26 A 2.0 4.76 A
2.0 5 3.22 A 1.5 3.10 B
1.5 5 2.76 A 0.0 2.70 BC
0.5 5 2.69 A 1.0 2.40 BC
1.0 5 2.65 A 0.5 1.80 C
Note: Means that do not share a letter are significantly different
Figure 7: Comparison of overall acceptability of A2 fresh bread (Left) and after 8 hours of storage bread
(Right). (Note: Preference is for the shortest bar).
83
Effect of gum arabic addition on B bread to compare sensory attributes with other samples. All
sensory attributes were preferred in 0.5% gum arabic addition except taste was preferred in 2.0%
addition in fresh bread, but after 8 hours texture and general acceptability were preferred in 1.0%
addition, and color and texture were preferred in 2.0% and 0.5% addition respectively (table 26).
Generally 1.0% was preferred in fresh bread and 0.5% in same bread after 8 hours (Figure 8).
In overall preferring for all types of bread 0.5% gum arabic was preferred in fresh bread, whereas;
1.0% gum arabic was preferred in the same bread after 8 hours in room temperature (Table 27).
Sensory evaluation results of fortified bread with gums, it was found that no significant (P ≤ 0.05)
differences between the all organoleptic properties of control sample and samples with gum arabic and
locust bean gum at different ratios except with regard to appearance and color which were significant(P
≤ 0.05) lower in pan bread with locust bean gum and the same result were observed in samples with
mixture gum. Hardness of bread sample increased significantly with time during storage. The increase
in firmness was found to associate with the decrease in moisture content. When moisture content
decreases, it accelerate the starch-starch interaction, .. gum addition could be useful in retarding staling
in terms of hardness values (Hemeda and Mohamed, 2010).
In this study gum arabic was improved organoleptic characteristics and extended shelf life of bread
by maintain bread quality for few hours. But the main negative effect- according to this study- was
observed in specific volume of bread in spit of varieties of fermentation time and baking time, to
enhance this evidence B dough was fermented and baked in constant time period. The addition of gums
did not show a detrimental effect on arabic bread and addition of gums to arabic flat bread improved
quality and extended shelf life (Hemeda and Mohamed, 2010). Therefore, gum arabic can be added as
1.0% for bread to protect quality of bread from deterioration.
Gum arabic did not had significant effect on fermentation time, baking time, color measurement,
but, had negative effect on specific volume of bread, and had different effect on organoleptic
characteristics according to type of flour. Generally, gum arabic did not improve the bread quality
according to the results.

84
Table 26: Grouping sensory attributes of B bread using Fisher method
Fresh Bread After 8 hours
Gum treatment % N Mean Grouping Gum treatment% Mean Grouping
0.0 5 4.50 A 2.0 4.76 A
2.0 5 3.96 A 1.5 3.10 AB
1.5 5 3.21 B 0.0 2.70 AB
1.0 5 1.74 C 0.5 2.40 B
0.5 5 1.57 C 1.0 1.80 B
* Means that do not share a letter are significantly different
Figure 8: Comparison of overall acceptability of fresh and after 8 hours storage of B bread. (Note:
Preference is for the shortest bar).

85
Table 27: General comparison between fresh bread and bread after 8 hours
Sample Treatment Color Flavor Taste Texture G. Accept.
0.00 3.53 3.67 3.36 3.20 3.20
0.50 2.22 2.40 2.58 1.80 1.80
1.00 2.69 2.31 2.40 2.71 2.71
1.50 2.82 3.16 3.38 3.16 3.16
Fres
h br
ead
2.00 3.82 3.47 3.29 3.80 3.80
0.00 4.67 3.60 2.50 3.43 3.43
0.50 3.33 2.30 2.53 2.07 2.07
1.00 3.00 2.27 2.43 1.80 1.80
1.50 1.67 2.83 3.37 3.37 3.37
Afte
r 8 h
rs
2.00 2.00 3.93 4.17 4.33 4.33

86
CHAPTER FIVE
CONCLUSIONS AND RECOMMENDATIONS
5.1 Conclusions:
1) Gum arabic had significant effect on bread quality according to its percent.
2) Addition of gum arabic as general was preferred in organoleptic attributes at percent 0.5% and
1.0% for fresh bread and after 8 hours in A1 bread and B bread.
3) Addition of 0.5% gum arabic was preferred in both, fresh bread and after 8 hours of A2 bread.
4) Specific volume of bread was generally decrease by addition of gum arabic.
5) Fermentation time, baking time, and color measurement did not show significant effect by
addition of gum arabic in confidence level (0.05).
6) Gum arabic maintains bread quality (Expended shelf life of bread for few hours).
5.2 Recommendations:
1) To use gum arabic in bread making process especially bakers who produce very large quantities
and they need time for selling.
2) To use gum arabic less than or equal to 1.0%, to reduce the negative effect on specific volume.
3) To investigate what exact percent of gum arabic should be added to reduce the negative effect
and maintain bread quality as long as possible by modifying some parameters.
4) It is recommended for the consumers to consume bread with gum arabic especially patients
with chronic renal failure and those who have diarrhea diseases.
5) Further studies are needed on the effect of gum arabic on bread volume.
87
REFERENCES
1. AACC (2000). Approved Method of the American Association of Cereal Chemists, 10th Ed., The
Association: St. Paul, MN.
2.
3. Abdelghafor, R.F.; Mustafa, A.I.; Ibrahim, A.M.H.; and Krishnan, P.G. (2011). Quality of Bread from
Composite Flour of Sorghum and Hard White Winter Wheat. Advance Journal of Food Science and
Technology, 3(1): 9-15.
4.
5. Abu Baker, A.; Tahir, A.; Sabah Elkheir, M. K.; and Yagoub, A. A. (2007). Effect of Tree and Nodule
Age on Some Physicochemical Properties of Gum from Acacia senegal (L.) Wild., Sudan. Research
Journal of Agriculture and Biological Sciences, 3(6): 866-870.
6.
7. Adams, M.R.; and Nout, M. J. R. (2001) Fermentation and Food Safety. Maryland: Aspen Publishers,
Inc.
8.
9. Alam, F.A.; Lutfi, S.Z., and Hasnain, A. (2009). Effect of different hydrocolloids on gelatinization
behavior of hard wheat flour. Trakia Journal of Sciences, 7(1): 1-6. Retrieved from http://www.uni-
sz.bg.
10.
11. Ali, B. H.; Ziada, A., and Blunden, G. (2009). Biological effects of gum arabic. Food and Chemical
Toxicology, 47, 1–8. Retrieved from http://www.elsevier.com/locate/foodchemtox.
12. Amendola, J.; and Rees, N. (2003) Understanding baking: The Art and Science of Baking (3rd ed.).
New Jersey: John Wiley and Sons, Inc.
13. AOAC (1984) Official method of analysis of the Association of Official Analytical Chemists. 14th ed.
Washington, DC.
14. AOAC (1990) Official method of analysis of the Association of Official Analytical Chemists. 2 Vols.
15th ed. Washington, DC.
15.
16. Asghar, A.; Anjum, F.M.; Tariq, M.W. and Hussain, S. (2005).Effect of Carboxy Methyl Cellulose and
Gum Arabic on the Stability of Frozen Dough for Bakery Products. Turk J Biol, (29), 237-241.
17.
88
Baker, S. R. (2010). Maximizing the use of food emulsifiers. M.Sc. Thesis. Kansas State University.
Retrieved, 2010, from Kansas State University.
18. Belitz, D.; Grosch, W. and Schieberle, P. (2009). Food Chemistry (4th ed.) Berlin: Springer-Verlag.
19.
20. Belton, P. (2007). The Chemical Physics of Food. Oxford: Blackwell Publishing Ltd.
21.
22. Brennan, J. G. (2006). Food Processing Handbook. Weinheim: WILEY-VCH Verlag GmbH and Co.
KGaA.
23.
24. Buehler, E. (2006). Bread science: The Chemistry and Craft of Making Bread. North Carolina: Author.
25.
26. Cauvain, S. P., and Young L. S. (2006), Baked Products: Science, Technology and Practice, Oxford:
Blackwell Publishing.
27.
28. Cauvain, S. P., and Young L. S. (2001), Baking problems solved, Cambridge: Woodhead Publishing
Limited and CRC Press LLC.
29.
30. Cauvain, S. P., and Young L. S. (2007). Technology of Breadmaking (2nd ed.). New York: Springer
Science+Business Media, LLC.
31.
32. Cordain, L. (1999). Cereal Grains: Humanity’s Double-Edged Sword. Evolutionary Aspects of Nutrition
and Health. Diet, Exercise, Genetics and Chronic Disease. World Rev Nutr Diet. Basel, Karger, 1999,
84: 19–73.
33.
34. Crockett, R.B.S. (2009). The Physicochemical Properties of Gluten -Free Dough with the Addition of
Hydrocolloids and Proteins. M.Sc. Thesis. The Ohio State University. Retrieved, 2009, From The
Ohio State University.
35.
36. Cui, W. S. (2005). Food carbohydrates: chemistry, physical properties, and applications. Boca Raton:
CRC Press.
37.
38. DiMuzio, D. T. (2010). Bread baking. New Jersey: John Wiley and Sons.
39.
40. Edward, W. P. (2007). The Science of Bakery Products. Cambridge: RSC publishing.
41.

89
42. Eliasson, A. C.; Gustavo V.; Barbosa, G.V.; Davidson, P. M.; Richard, M.; D. W., and Lekh, R. (2006).
Carbohydrates in Food (2nd ed.). Boca Raton: CRC press.
43.
44. Emerton, V., and Choi, E. (2008).Essential guide to food additives. Surrey: Leatherhead Food
International Ltd.
45.
46. FAO. (2013). Food outlook - biannual report on global food markets. (ISSN: 0251-1959). Retrieved
from (http://www.fao.org/docrep/019/i3473e/i3473e.pdf).
47.
48. Figoni, F. (2008). How baking works (2nd ed.). New Jersey: John Wiley and Sons, Inc.
49.
50. Forsythe, S.J. (2000). The microbiology of safe food. Oxford: Blackwell Science Ltd.
51.
52. Gould, R. F. (1966). Flavor Chemistry. Washington: American Chemical Society.
53.
54. Gritsenko, M. (2009). Effects of composite flours on quality and nutritional profile of flour tortillas.
M.Sc. thesis. Texas A&M University, Retrieved, May 2009, from Texas A&M University.
55.
56. Guardaa, A.; Rosellb, C.M.; Beneditob, C. and Galottoc, M.J. (2004). Different hydrocolloids as bread
improvers and antistaling agents. 18 (2004): 241–247. Retrieved from
http://www.elsevier.com/locate/foodhyd.
57.
58. Hamaker, B. R. (2008). Technology of functional cereal products .Cambridge: Woodhead Publishing.
59.
60. Hashmi, A. I. (1996). Wheat and Flour Properties Affecting Tandoori Bread Quality. Ph.D. Thesis.
Retrieved December, 1996, From Victoria University of Technology.
61.
62. Hemeda, H. M., and Mohamed, E. F. (2010). Ban bread quality as affected by low and high viscous
hydrocolloids gum. World journal of dairy and food science, 5 (2): 100-106.
63.
64. Hui, Y.H.; Chandan, R.C.; Clark, S.; Cross, N.; Dobbas, J. and Hurst, W. J., (2007) Handbook of Food
Products Manufacturing, New Jersey: John Wiley and Sons, Inc.
65.
66. Hutkins, R. W. (2006). Microbiology and Technology of Fermented Foods. Iowa: Blackwell Publishing.
67.
90
68. Jilani. S. (1993) Isolation and structural studies of acacia gum exudates from the species of gumiferae.
M.Sc. thesis. The University of the Punjab. Retrieved, 1997, from university of the Punjab, Lahore,
Pakistan.
69.
70. Vaughan, J. G. and Geissler C. A. (2009). The new oxford book of food plants. Oxford University Press
Inc.: New York.
71.
72. Kent, N. L. and Evers, A. D. (1994) Technology of cereals (4th ed.). Oxford: Elsevier Science Ltd.
73.
74. Kilcast, D. and Subramaniam, P. (2000). The stability and shelf-life of food. Cambridge: CRC Press
LLC.
75.
76. Kohajdová, Z.; Karovičová, J., and Schmidt, S. (2009). Significance of Emulsifiers and Hydrocolloids
in Bakery Industry. Acta Chimica Slovaca, 2(1): 46 – 61.
77.
78. Kulp, K. and Lorenz, K. (2003). Handbook of Dough Fermentations. New York: Marcel Dekker, Inc.
79.
80. Malomo, S. A.; Eleyinmi, A. F. and Fashakin, J. B. (2011). Chemical composition, rheological
properties and bread making potentials of composite flours from breadfruit, breadnut and wheat.
African Journal of Food Science, 5(7): 400 – 410.
81.
82. Merryweather, L. M.; Hill, S. H. A.; Robinson, A. L.; Spencer, H. A.; Rudge, K. A., and Taylor, G. R. J.
(2005). Dictionary of food science and technology. Oxford: Blackwell Publishing.
83.
84. Mikuš, Ľ; Valík, Ľ. and Dodok, L. (2011).Usage of hydrocolloids in cereal technology, Acta univ. agric.
ET silvic. Mendel. Brun. , LIX(5): 325–334.
85.
86. Minitab 16.2 Statistical software (2010). [Computer software]. State College, PA: Minitab, Inc.
(www.minitab.com)
87.
88. Nicolay, X. (2006). Odors in the Food Industry. Vol. 2. New York: Springer Science+Business Media,
LLC.
89.
90. Nishinari, K. (2000). Hydrocolloids: Part 1: Physical Chemistry and Industrial Application of Gels,
Polysaccharides, and Proteins. Amsterdam: Elsevier Science B.V.
91.

91
92. Nussinovitch, A. (2010). Plant gum exudates of the world: Sources, Distribution, Properties, and
Applications. Boca Raton: Taylor and Francis Group, LLC.
93.
94. Okafor, N. (2007), Modern industrial microbiology and biotechnology, Enfield, NH, USA: Science
Publishers.
95.
96. Owens, G. (2001). Cereals processing technology. Boca Raton: CRC Press.
97. Piringer, O. G. and Baner, A. L. (2008). Plastic Packaging, Interactions with Food and
Pharmaceuticals (2nd ed.). Weinheim: WILEY-VCH Verlag GmbH and Co. KGaA.
98.
99. Rahim, A. H.; Ruben, R. and Ekko, C. (2005) Adoption and abandonment of gum arabic agroforestry in
Sudan. Paper presented at the scientific meeting of Wageningen University, The Netherlands.
100.
101. Ranken, M.D.; KiU, R.C., and Baker, C. (1997). Food industries manual. London: Blackie Academic
and Professional.
102.
103. Rosa, C. and Péter, G. (2006). The Yeast Handbook Biodiversity and Ecophysiology of Yeasts. Berlin:
Springer-Verlag.
104.
105. Sadar. L. N. (2004). Rheological and textural characteristics of copolymerized hydrocolloidal solutions
containing curdlan gum. M.Sc. Thesis. University of Maryland. Retrieved, 2004, From University of
Maryland.
106.
107. September, C. (2007). The effect of enzymes, Gums, and Proteins on the water absorption, loaf volume
and shelf life of bread. M.Sc. thesis. University of Johannesburg. Retrieved (2007) from university of
Johannesburg. Boca Raton South Africa.
108.
109. Shetty, K.; Paliyath, G.; Pometto, A., and Levin, R. E. (2006). Food biotechnology (2nd ed.). Boca
Raton: CRC Press.
110. Smith, J. (2004). Technology of Reduced Additive Foods (2nd ed.). Oxford: Blackwell Science Ltd.
111.
112. Smith, J., and Hong-Shum, L. (2003). Food Additives Data Book. Oxford: Blackwell Publishing.
113.
114. (OTA) The Office of Technology Assessment. (1979). Open Shelf-Life Dating of Food.
Washington:John C. Holmes, Publishing Officer.
115.

92
116. Touré, S., (2008).Gum Arabic. Retrieved from Market News Service (MNS), Division of Market
Development, International Trade Centre: http://www.intracen.org/mns
117.
118. Verbeken, D., Dierckx, S., and Dewettinck, K. (2003). Exudate gums: occurrence, production, and
applications. Appl Microbiol Biotechnol. 63:10–21. DOI 10.1007/s00253-003-1354-z
119.
120. Walstra, P., (2003). Physical Chemistry of Foods .New York: Marcel Dekker, Inc.
121.
122. Wassermann, L. (2009). Bread improvers –action and application. (5th ed.). (C. Sprinz, and Adendor`f,
Trans.). Retrieved from http//www.wissensforum-backwaren.at.
123.
124. Williams, P. A. and Phillips, G. O. (2002). Gum and stabilisers for the food industries 11. Cambridge:
The Royal Society of Chemistry.
125.
126. Williams, P. A., and Phillips, G. O. (Eds). (2004). Gums and Stabilisers for the Food Industry 12.
Cambridge: The Royal Society of Chemistry.
127.
128. Yam, K. (2009) The Wiley encyclopedia of packaging technology (3ed ed.). New Jersey: John Wiley and
Sons, Inc., Publication
129.
130. Zagozewski, T. (2008). (RE)Making bread: industrial technologies and the skills of food industry
workers. M.Sc. Thesis. University of Saskatchewan, April 2008, Retrieved from University of
Saskatchewan.
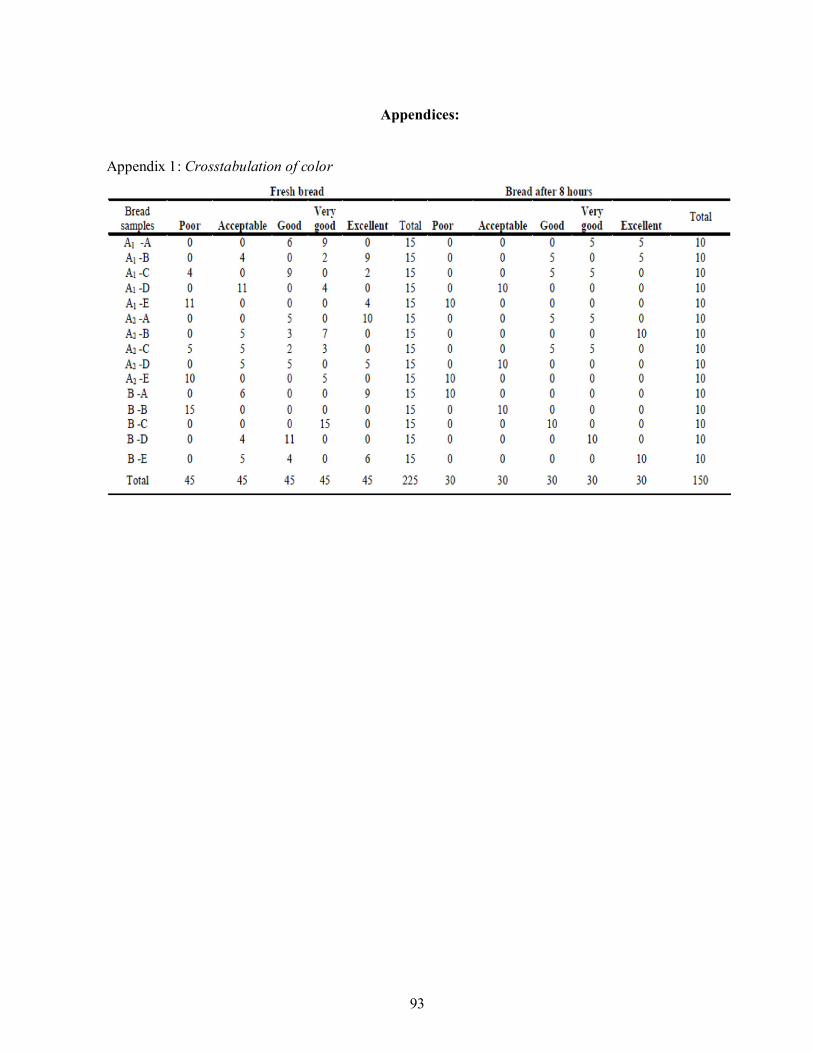
93
Appendices:
Appendix 1: Crosstabulation of color
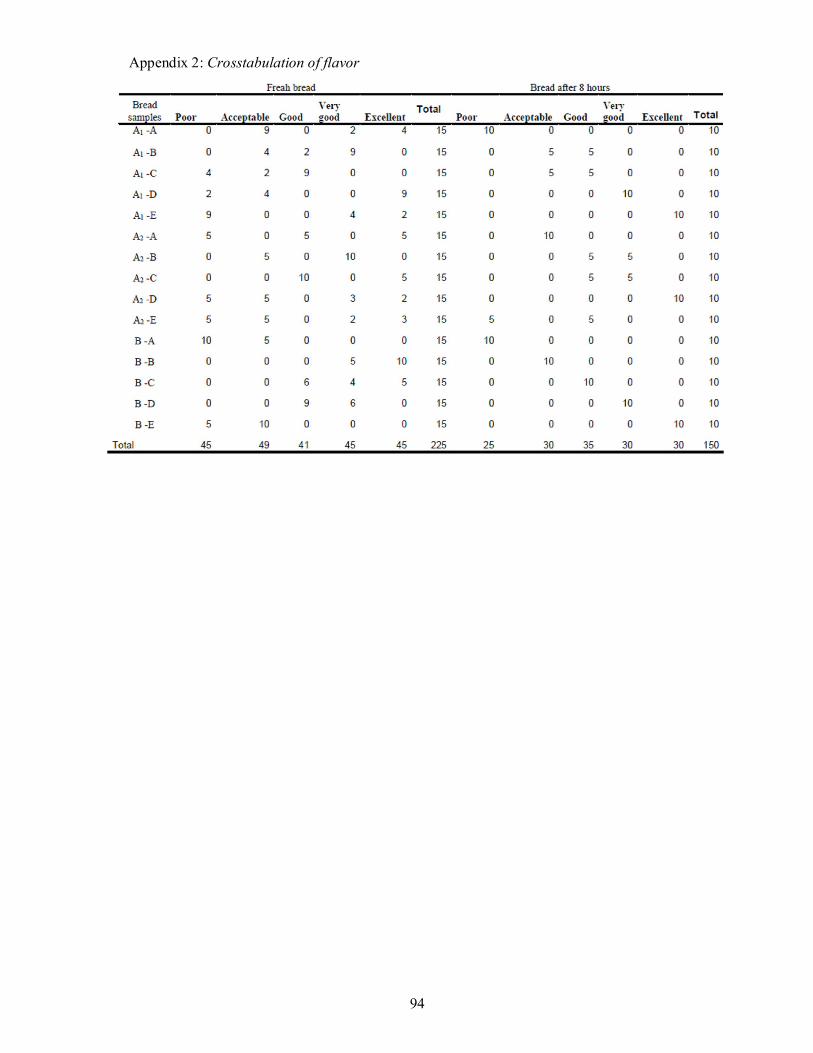
94
Appendix 2: Crosstabulation of flavor
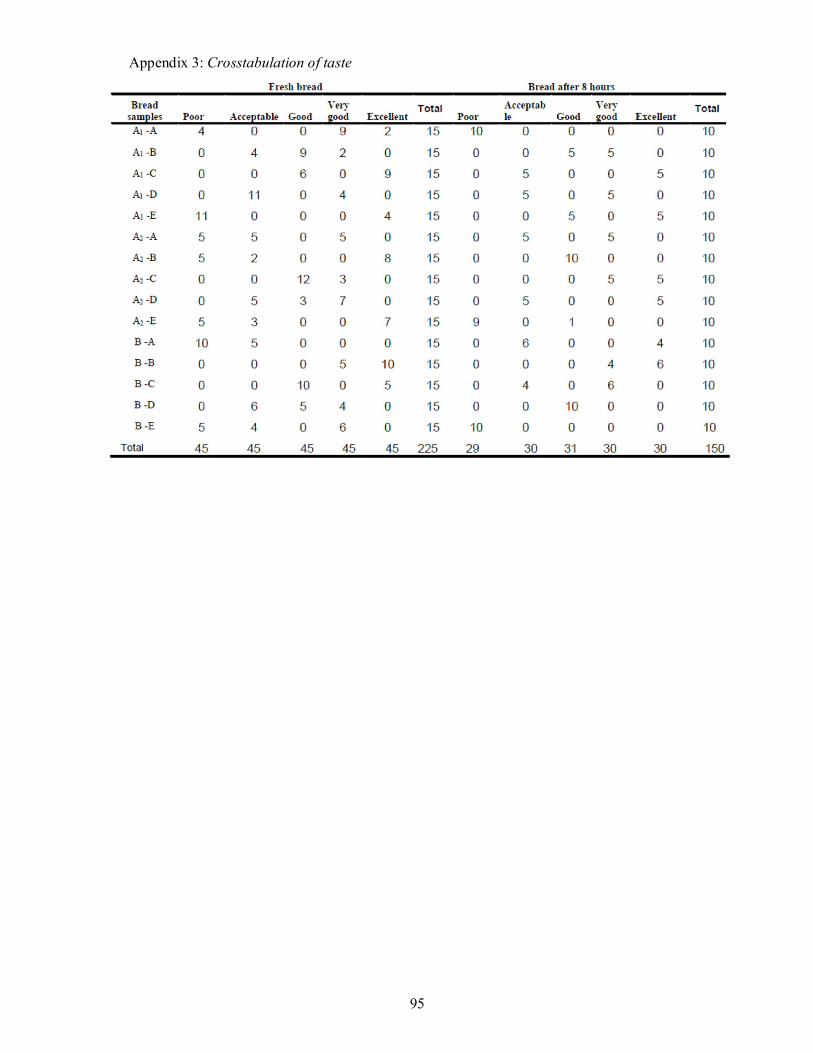
95
Appendix 3: Crosstabulation of taste

96
Appendix 4: Crosstabulation of texture
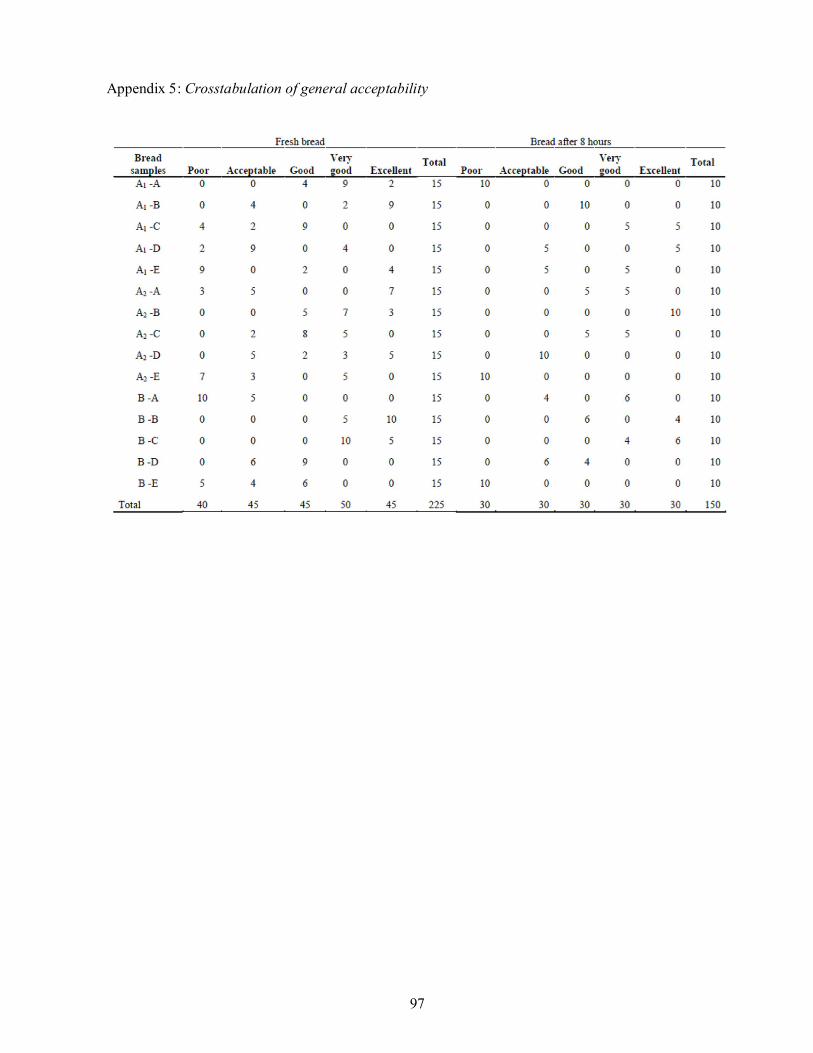
97
Appendix 5: Crosstabulation of general acceptability
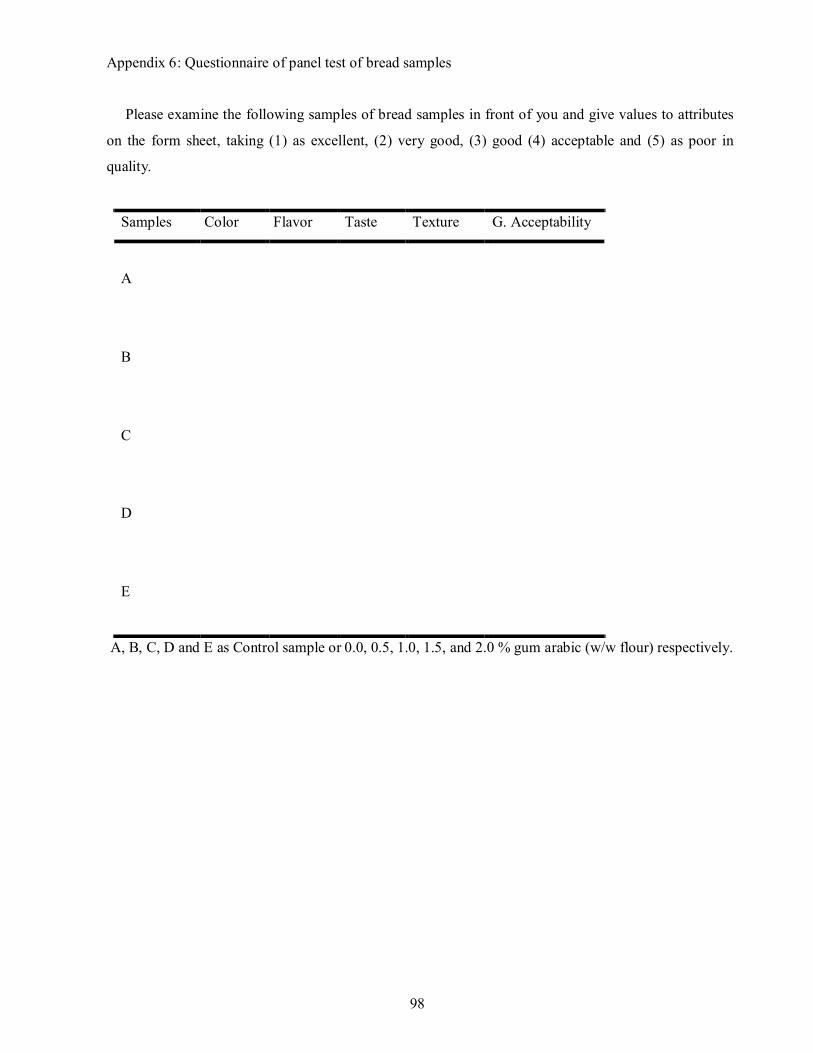
98
Appendix 6: Questionnaire of panel test of bread samples
Please examine the following samples of bread samples in front of you and give values to attributes
on the form sheet, taking (1) as excellent, (2) very good, (3) good (4) acceptable and (5) as poor in
quality.
Samples Color Flavor Taste Texture G. Acceptability
A
B
C
D
E
A, B, C, D and E as Control sample or 0.0, 0.5, 1.0, 1.5, and 2.0 % gum arabic (w/w flour) respectively.
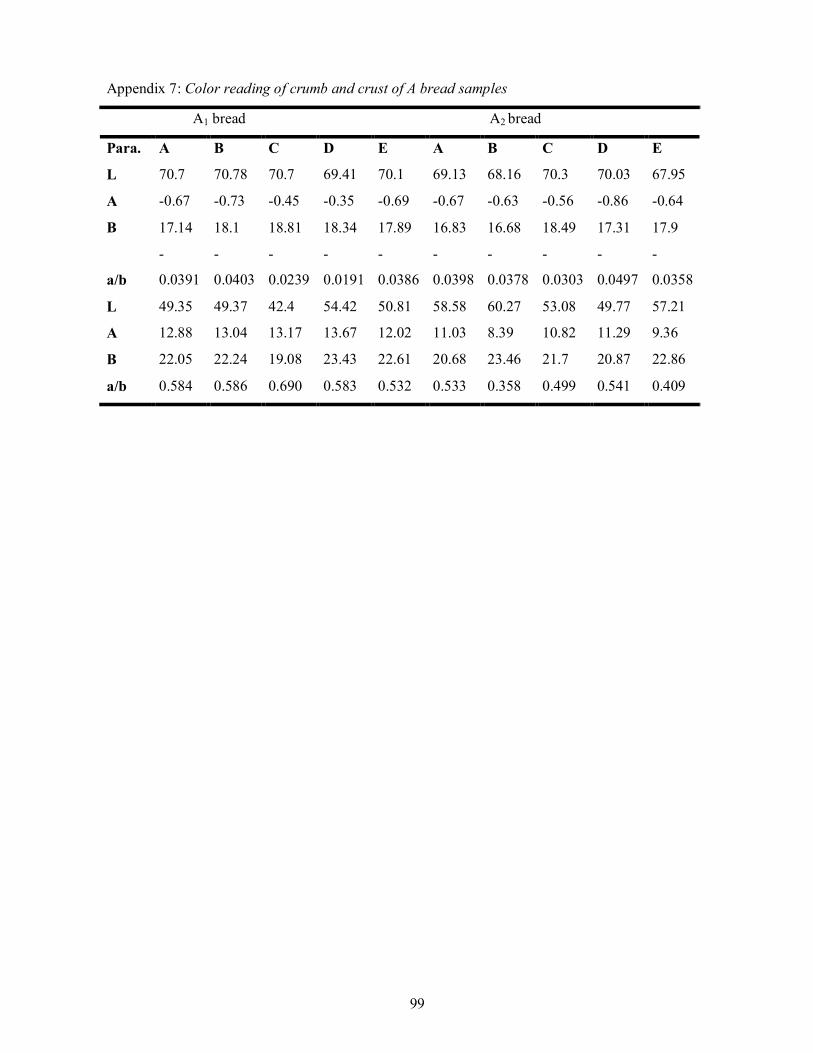
99
Appendix 7: Color reading of crumb and crust of A bread samples
A1 bread A2 bread
Para. A B C D E A B C D E
L 70.7 70.78 70.7 69.41 70.1 69.13 68.16 70.3 70.03 67.95
A -0.67 -0.73 -0.45 -0.35 -0.69 -0.67 -0.63 -0.56 -0.86 -0.64
B 17.14 18.1 18.81 18.34 17.89 16.83 16.68 18.49 17.31 17.9
a/b
-
0.0391
-
0.0403
-
0.0239
-
0.0191
-
0.0386
-
0.0398
-
0.0378
-
0.0303
-
0.0497
-
0.0358
L 49.35 49.37 42.4 54.42 50.81 58.58 60.27 53.08 49.77 57.21
A 12.88 13.04 13.17 13.67 12.02 11.03 8.39 10.82 11.29 9.36
B 22.05 22.24 19.08 23.43 22.61 20.68 23.46 21.7 20.87 22.86
a/b 0.584 0.586 0.690 0.583 0.532 0.533 0.358 0.499 0.541 0.409
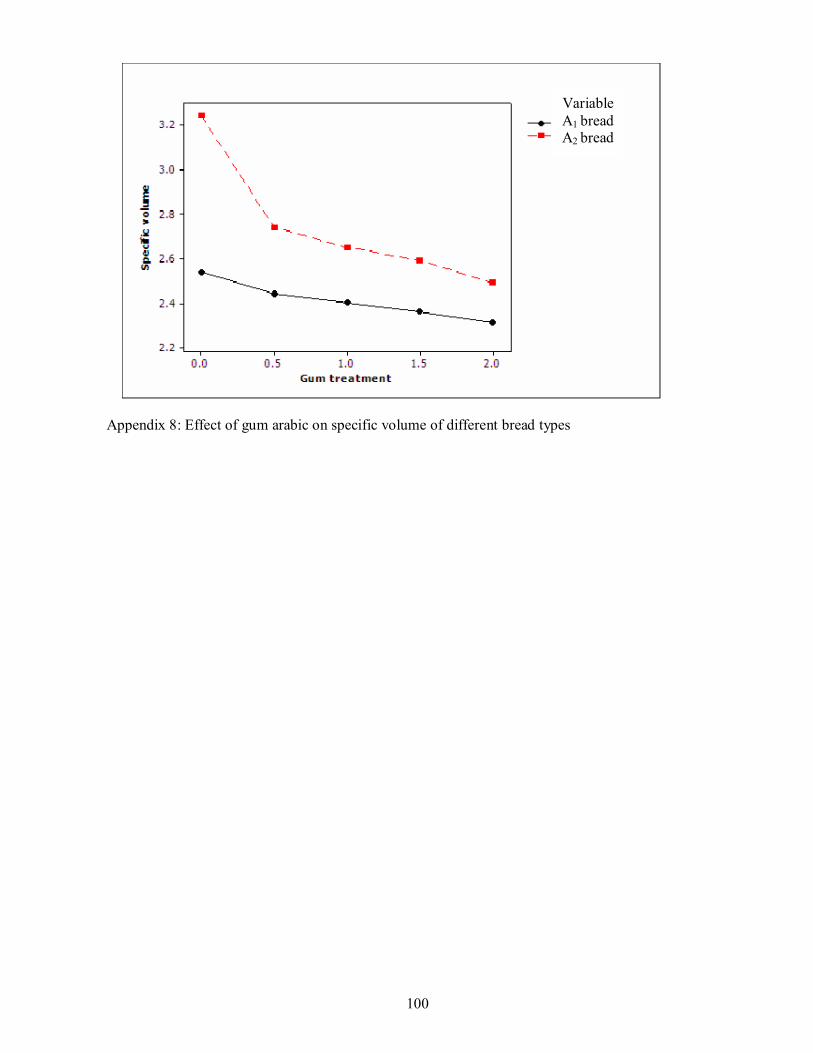
100
Appendix 8: Effect of gum arabic on specific volume of different bread types
Variable A1 bread A2 bread

101
Appendix 9: ANOVA table (Analysis Of Variance)

102
Appendix 10: General comparison between fresh bread and Bread after 8 hours
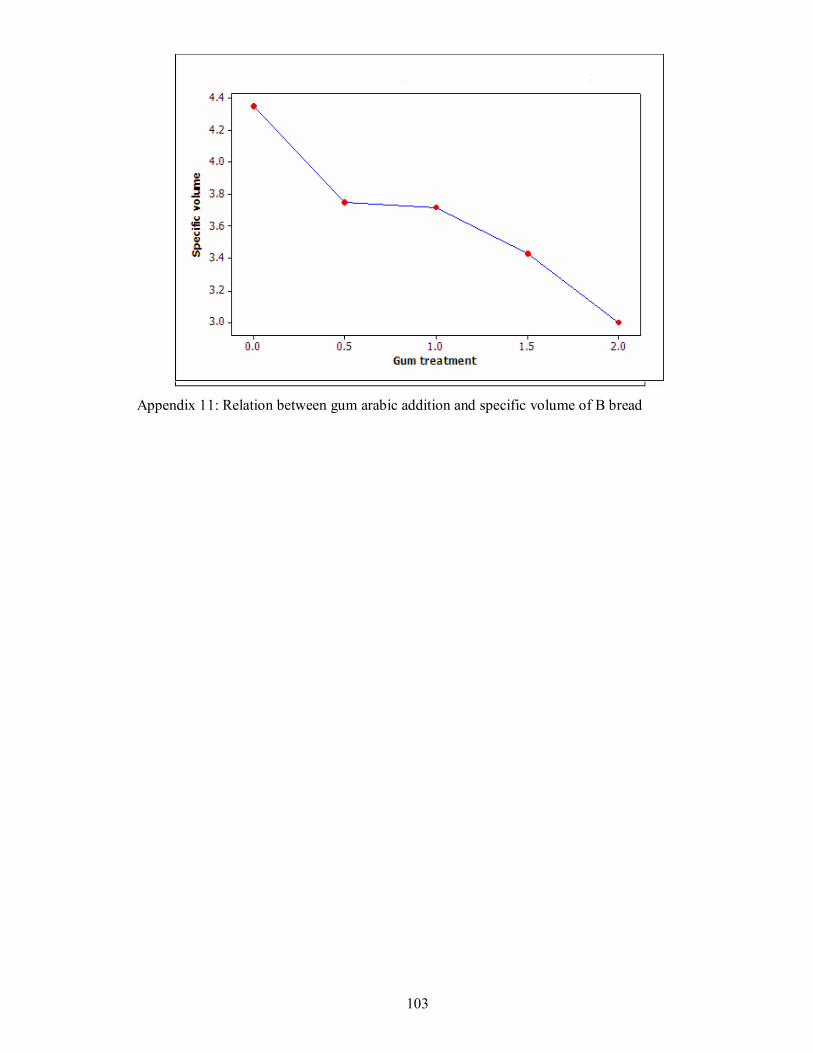
103
Appendix 11: Relation between gum arabic addition and specific volume of B bread
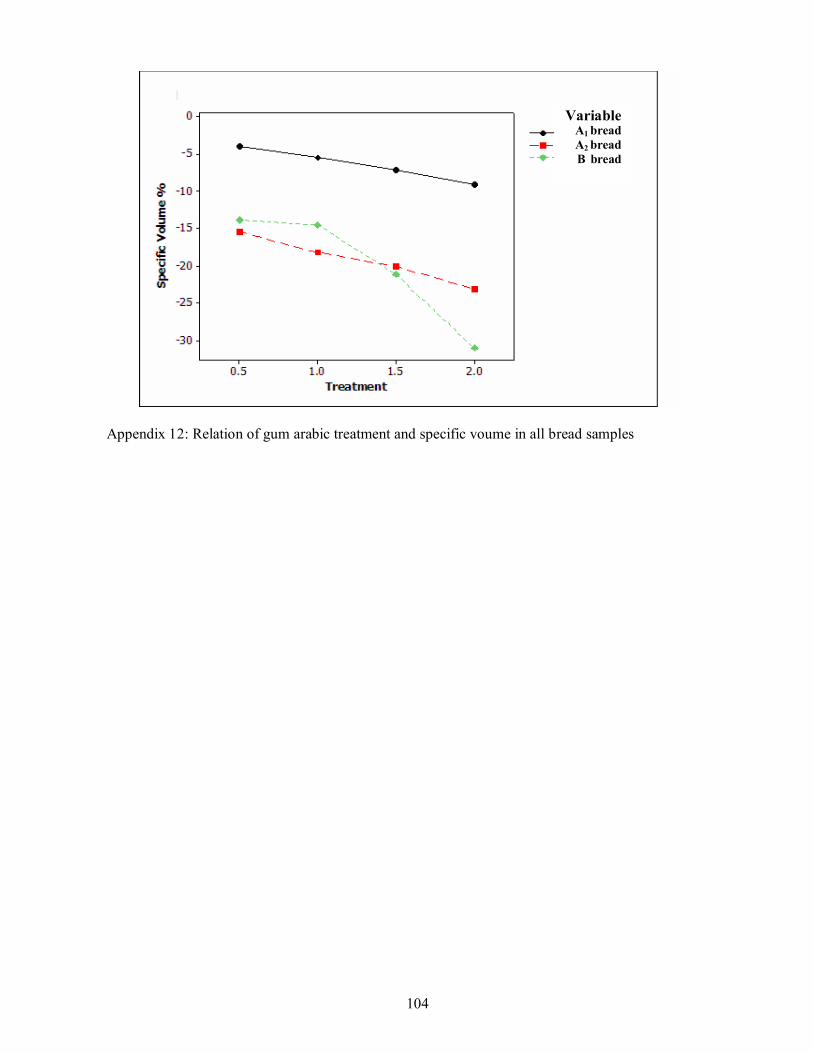
104
Appendix 12: Relation of gum arabic treatment and specific voume in all bread samples
Variable A1 bread A2 bread B bread