1 abstract 2 preface - uis brage - unit
TRANSCRIPT

1 Abstract The purpose of this thesis is to estimate the intrinsic value of Siem Offshore. The main
method is the discounted cash flows approach (DCF). This is complemented by a ratio
analysis. The present value calculation gives at target share price of NOK 7.72.1 The latest
closing price was NOK 8.3.2 The relative valuation based on peers on the Oslo Stock
Exchange came up with a price of NOK 6.43. Siem Offshore is still struggling for profitability
after the slump that hit the OSV business in 2008. The conclusion and recommendation in this
thesis is to sell SIOFF.
2 Preface The most important reason for writing a valuation as a final thesis – is to learn and get close to
the real life of economics. Valuation has not been part of my curriculum, but I have followed
the lectures in valuation at UiS. Valuation is a core discipline in my major field of study in
graduate school – applied finance. It sums up and brings together several skills from the
business education. Valuation is a complex and diverse economic exercise.
Like many other fields in economics, it is not an exact science, but it is nevertheless a
necessary task to perform valuations to form a basis for informed economic decisions.
The goal was to take a stand and end up with a single number, and translate that into an
unequivocally recommendation. In hindsight this has of course proven difficult.
One of the challenges in valuation is to find updated, unbiased information. In this respect I
had hopes for more exact information from SIOFF, but it turned out that the restrictions on
listed firms would not allow them do disclose information beyond annual reports, stock
exchange releases and the likes.
The reason for choosing to write about a company in the offshore supply business is personal
interest in shipping, the importance of shipping in Norway, and more recently the importance
of energy for the increased wealth in my nation.
1 NOK/USD 13 June 2014 is 6.0038 http://www.norges-bank.no/no/prisstabilitet/valutakurser/usd/ 2 http://www.oslobors.no/markedsaktivitet/stockOverview?newt__ticker=SIOFF
1
The reason for selecting Siem Offshore in particular among all the OSV players is that
Kristoffer Stensrud, one of the founders and the manager of the mutual fund Skagen Kon-
Tiki has expressed that SIOFF will be part of his portfolio at least to the end of 2014. As
Skagenfondene are a value based mutual fund, I was hoping to find the stock to be
undervalued.
I would like to extend my gratitude to those parties taking their time to supply me with
information, data and guidance. This includes IHS, RS Platou, SR Bank and Mads Holm
representing UiS. The list is not exhaustive.
I have tried, to the best of my ability to give appropriate credit to my sources. If there are any
discrepancies, the bibliography should be exhaustive.
Table of Contents 1 Abstract ........................................................................................................................................... 1
2 Preface ............................................................................................................................................. 1
3 Siem Offshore - a company overview ............................................................................................. 4
4 The OSV Industry ............................................................................................................................. 7
4.1 Vessels and segments .............................................................................................................. 8
4.2 Drilling rigs ............................................................................................................................... 9
4.3 Demand drivers ..................................................................................................................... 10
4.4 Deeper water ......................................................................................................................... 15
4.5 Arctic ...................................................................................................................................... 16
4.6 Wind ...................................................................................................................................... 17
4.7 Regional markets ................................................................................................................... 17
4.8 Macro drivers prompting OSV demand................................................................................. 18
4.9 Struggle .................................................................................................................................. 19
4.10 Challenges ............................................................................................................................. 19
4.11 Expectations and Outlook.................................................................................................... 20
4.11.1 IHS Petrodata– Former ODS Petrodata ......................................................................... 21
4.12 Prices historic ........................................................................................................................ 25
4.13 Fleet ....................................................................................................................................... 26
4.13.1 AHTS a closer look ......................................................................................................... 30
2
4.13.2 PSV a closer look ............................................................................................................ 31
4.14 Subsea ................................................................................................................................... 33
4.15 Risks ....................................................................................................................................... 34
4.16 Possible ups and downs by Swedbank First Securities .......................................................... 36
4.17 Energy in the future ............................................................................................................... 37
4.18 Macro and Energy ................................................................................................................. 38
4.19 Conclusion ............................................................................................................................. 49
5 Financial Statement – Reformulated balance sheet and P&L ....................................................... 50
5.1 Income statement ................................................................................................................. 50
5.2 Extraordinary items and Recurring vs. Non-recurring bookings ........................................... 50
5.3 Balance sheet ........................................................................................................................ 51
5.4 Accounting Measures of Risk ................................................................................................ 51
5.4.1 Financial ratios ............................................................................................................... 51
5.5 Credit rating ........................................................................................................................... 56
5.6 Depreciation .......................................................................................................................... 56
5.7 Tax rate and tax regime ......................................................................................................... 56
6 Valuation and Valuation Models ................................................................................................... 60
7 Cost of Capital ............................................................................................................................... 63
7.1 Risk ........................................................................................................................................ 63
7.2 Cost of Capital ....................................................................................................................... 63
7.3 Cost of equity ........................................................................................................................ 64
7.3.1 Risk Parameters ............................................................................................................. 65
7.3.2 Historical beta................................................................................................................ 65
7.3.3 Fundamental betas ........................................................................................................ 69
7.3.4 Market risk premium ..................................................................................................... 72
7.3.5 The riskless rate ............................................................................................................. 74
7.3.6 CAPM ............................................................................................................................. 75
7.4 Cost of debt ........................................................................................................................... 75
7.4.1 Traded Loans ................................................................................................................. 76
7.4.2 Synthetic rating Damodaran.......................................................................................... 76
7.4.3 Synthetic rating Knivsflaa .............................................................................................. 78
7.4.4 Summary cost of debt ................................................................................................... 80
7.5 Summary cost of capital – WACC .......................................................................................... 80
8 Growth ........................................................................................................................................... 82
3
8.1 Growth in SIOFF ..................................................................................................................... 84
8.2 The historical growth in revenue for SIOFF ........................................................................... 85
8.3 Analyst estimates of growth .................................................................................................. 85
8.4 Fundamental determinants in SIOFF ..................................................................................... 86
8.5 Steely business ...................................................................................................................... 87
8.6 Assumptions for a going concern – Estimating sustainable margins and the path to margin 88
9 Forecasting Pro Forma financial statement, P&L (Measuring FCFF) ............................................. 89
10 DCF Valuation ............................................................................................................................ 91
11 Relative valuation ...................................................................................................................... 92
12 Sensitivity analysis ..................................................................................................................... 94
13 Conclusion ................................................................................................................................. 96
14 Bibliography ............................................................................................................................... 98
14.1 Books ..................................................................................................................................... 98
14.2 Lecture and lecture notes...................................................................................................... 98
14.3 Research reports and papers ................................................................................................ 99
14.4 Articles, surveys and publications ....................................................................................... 100
14.5 Analytical reports ................................................................................................................ 101
14.6 Annual and Quarterly reports ............................................................................................. 102
14.7 Personal Communication .................................................................................................... 102
14.8 Web ..................................................................................................................................... 102
15 Appendix .................................................................................................................................. 104
15.1 Financial Statement Appendix............................................................................................. 104
15.2 Cost of Capital Appendix ..................................................................................................... 107
15.3 Growth Appendix ................................................................................................................ 113
15.4 Sensitivity analysis ............................................................................................................... 117
3 Siem Offshore - a company overview Siem Offshore was established as a stand-alone company in July 2005 following a spin-off
from the company Subsea 7 Inc.
Siem Offshore is a Cayman Island-based (registered) shipping company engaged in marine
services for the offshore oil and gas industry. Siem Offshore is organized as at parent
4
company with several subsidiaries and associates. The company is listed on the Oslo Stock
Exchange, with the ticker SIOFF. The GICS3 code is 10101020 Oil & Gas Equipment &
Services 1 - Oil and Gas. The headquarter is located in Kristiansand, Norway with subsidiary
offices located in Brazil, Germany, the Netherlands, Ghana, USA, India, Canada, Poland and
Australia.
The fleet operates in the North Sea, West Africa, the Middle East, the United States, India
and Nigeria.
The company’s primary activity is to own and operate offshore support vessels (OSV).
According to the annual report 2013, Siem operated 42 vessels, with an additional 13 vessels
under construction. The fleet comprised of 18 Platform Supply Vessels (PSV), 6 Offshore
Subsea Construction Vessels (OSCV) and Multipurpose Field & ROV Support Vessels
(MRSV), 10 Anchor Handling Tug Supply Vessels (AHTS). The AHTS vessels are operated
in a pool, and 2 of the vessels are operated on behalf of a pool partner. The company has also
entered the submarine power cable installation, repair and maintenance business aimed at the
offshore wind farm market. Siem also operates a Scientific Drilling Vessel (SCDV) and part
of a Well Stimulation Vessel (WSV).The Brazilian subsidiary operates smaller Fast Supply
Vessels (FSV), Fast Crew Vessels (FSV) and Oil Spill Recovery Vessels (OSRV). In addition
they provide combat management systems for vessels in the Brazilian navy. Siem WIS has
designed and developed a pressure control device to improve managed pressure drilling
operations. Siem expect a rising demand for this technology as demand for increased oil
recovery and the increased number of deep sea and high pressure, high temperature reservoirs.
Siem WIS has recently landed a contract for Statoil on the Gullfaks, Valemon and Gudrun
fields and the prospects Romeo and Julius in the North Sea.4
The vessels under construction will expand the existing fleet type, in addition to Well
Intervention Vessels (WIV) and Oil Spill Recovery Vessels (OSRV).
3 The MSCI Global Sector Indexes are constructed using the Global Industry Classification Standard (GICS®), a widely accepted industry analysis framework for investment research, portfolio management and asset allocation jointly developed and maintained by MSCI and Standard & Poor's. The MSCI Global Sector Indexs comprise regional and country sector, industry group and industry indexes based on the MSCI Global Investable Market Indexes. 10101020 Oil & Gas Equipment & Services; Manufacturers of equipment, including drilling rigs and equipment, and providers of supplies and services to companies involved in the drilling, evaluation and completion of oil and gas wells. http://www.msci.com/products/indexes/sector/gics/
4 Siem WIS MPD http://www.offshore.no/sak/61261_gjennombrudd_for_boreteknologi (09 May 2014)
5
Siem acquired 50% ownership in Secunda Canada LP in the third quarter 2013. Sucunda
operates six offshore support vessels.
Siem classifies their own fleet of PSV’s and AHTS’s as “high end”. They also use the
terminology “large” PSV and OSCV. The term “high end” for PSV’s is based on usable cargo
deck area measured in square meters. For AHTS’s the pulling power is included measured by
brake horse power (BHP) or pulling power in water measured as Bollard Pull. The distinction
between high end and low end is not a universal measure. The vessels are divided in several
steps depending on the above mentioned capabilities in addition to age, class of dynamic
position systems (DP)5 and the level of technological specifications.
The majority of the fleet is on long-term contract. Even half the vessels under construction
have long term contracts.
Siem Industries Inc. is the largest owner with 34.23 % of the shares. Siem Industries inc. is
controlled by a trust whose beneficiaries include Kristian Siem’s immediate family. Kristian
Siem is a director of Siem Offshore and chairman for Siem Industries Inc. The second largest
owner is the Hong Kong based Ace Crown International Ltd. with at 19.72 % share.6 Ace
Crown is recorded as a “Local Company” in Hong Kong. Ace Crown keeps a low profile with
no more information easily available.
Total employees are 1110 by year end 2013. CEO Terje Sørensen is explaining to
Sunnmørsposten that Siem is planning to lay off 60 Scandinavian seamen. This is due to the
competitive international market, but the opposite argument of increasing protectionism is
another reason mentioned for the layoffs. The increasing protectionism in the global market is
giving demand to a so called “Local Content”.7
The peers used in this thesis on the Oslo Stock Exchange are Deep Sea Supply (DESSC),
DOF (DOF), Farstad Shipping (FAR), Solstad Offshore (SOFF), Havila Supply (HAVI),
Eidesvik Offshore (EIOF), REM (REM). The tickers for the peers and Siem Offshore
(SIOFF) will for convenience be used interchangeably throughout this paper.
5 DP will be explained in the next chapter. 6 Annual report 2013 7 Sunnmørsposten http://www.smp.no/nyheter/article7704395.ece (07 June 2013)
6
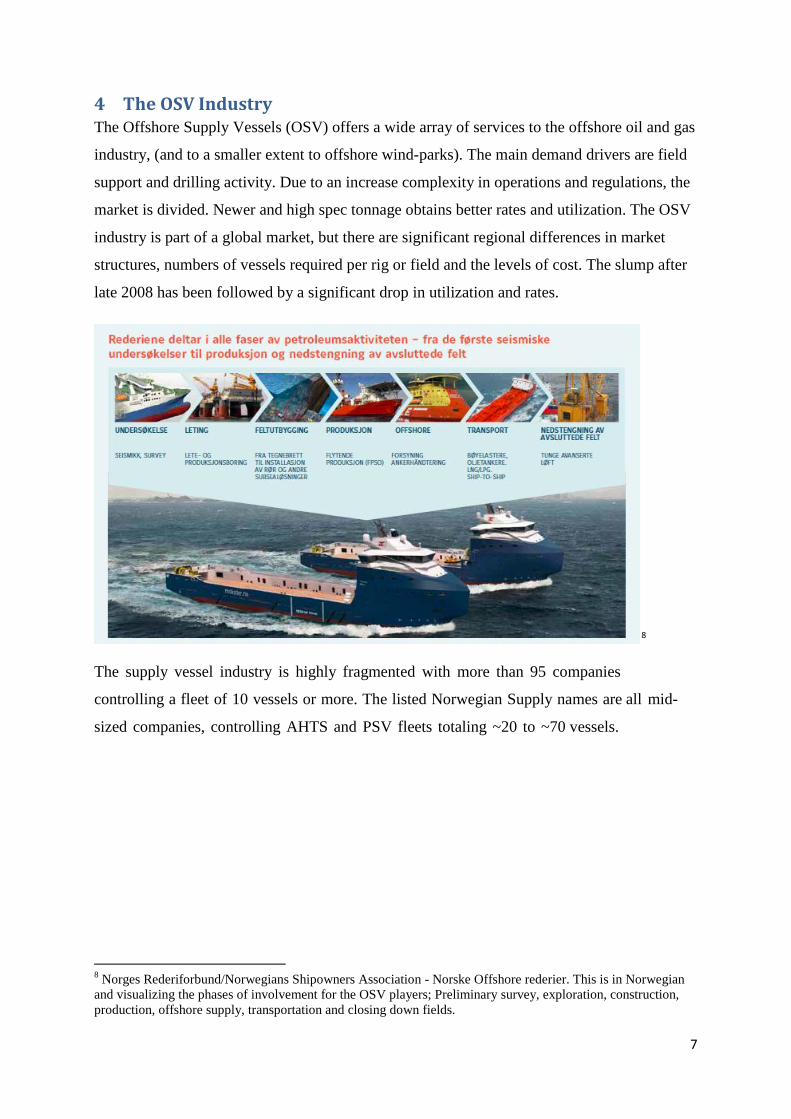
4 The OSV Industry The Offshore Supply Vessels (OSV) offers a wide array of services to the offshore oil and gas
industry, (and to a smaller extent to offshore wind-parks). The main demand drivers are field
support and drilling activity. Due to an increase complexity in operations and regulations, the
market is divided. Newer and high spec tonnage obtains better rates and utilization. The OSV
industry is part of a global market, but there are significant regional differences in market
structures, numbers of vessels required per rig or field and the levels of cost. The slump after
late 2008 has been followed by a significant drop in utilization and rates.
8
The supply vessel industry is highly fragmented with more than 95 companies
controlling a fleet of 10 vessels or more. The listed Norwegian Supply names are all mid-
sized companies, controlling AHTS and PSV fleets totaling ~20 to ~70 vessels.
8 Norges Rederiforbund/Norwegians Shipowners Association - Norske Offshore rederier. This is in Norwegian and visualizing the phases of involvement for the OSV players; Preliminary survey, exploration, construction, production, offshore supply, transportation and closing down fields.
7
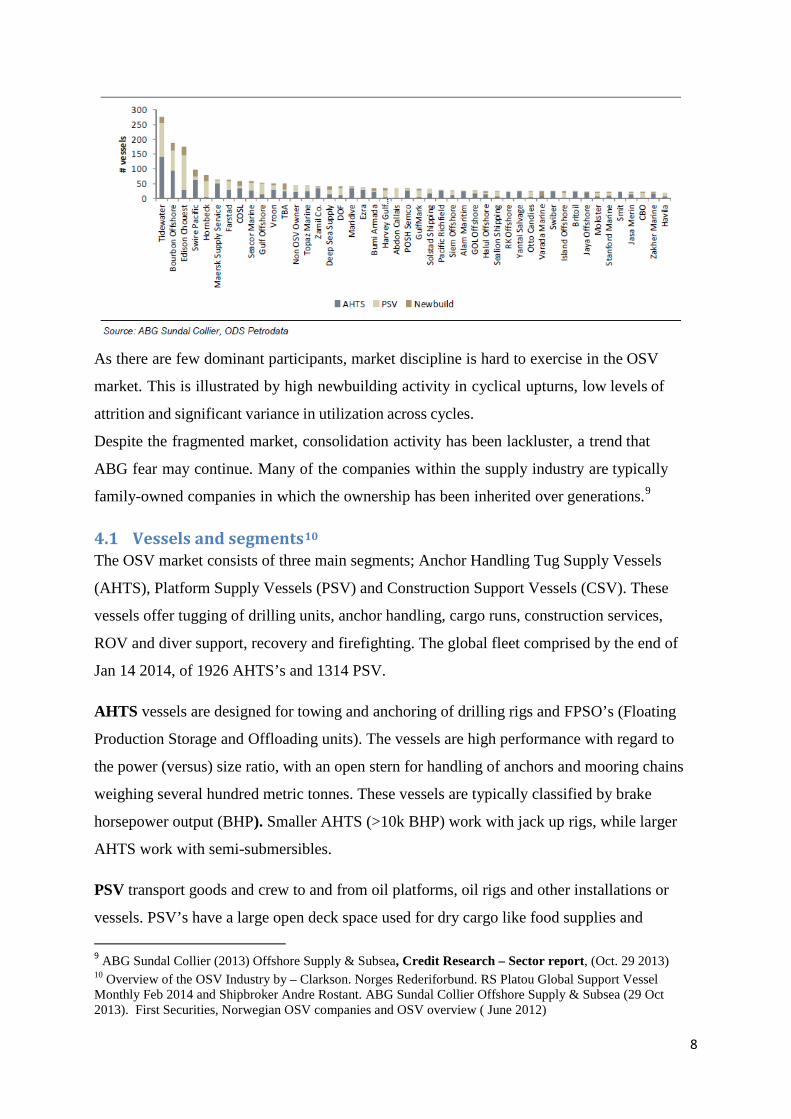
As there are few dominant participants, market discipline is hard to exercise in the OSV
market. This is illustrated by high newbuilding activity in cyclical upturns, low levels of
attrition and significant variance in utilization across cycles.
Despite the fragmented market, consolidation activity has been lackluster, a trend that
ABG fear may continue. Many of the companies within the supply industry are typically
family-owned companies in which the ownership has been inherited over generations.9
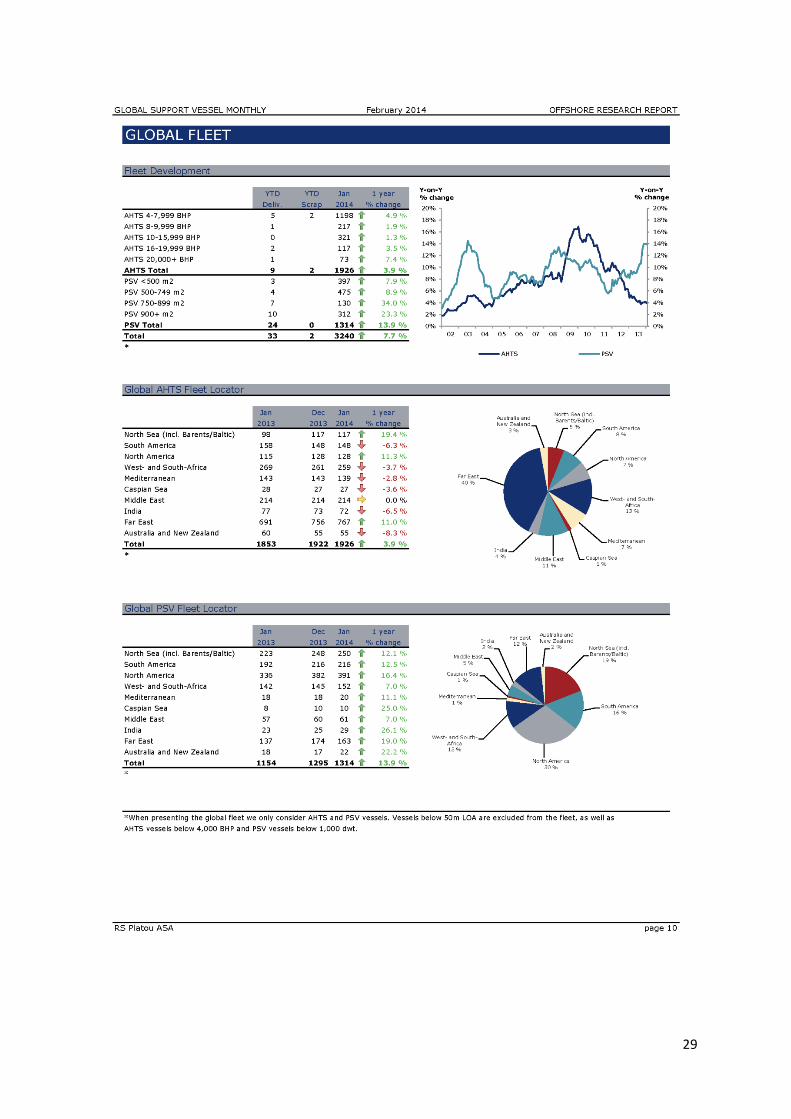
4.1 Vessels and segments10 The OSV market consists of three main segments; Anchor Handling Tug Supply Vessels
(AHTS), Platform Supply Vessels (PSV) and Construction Support Vessels (CSV). These
vessels offer tugging of drilling units, anchor handling, cargo runs, construction services,
ROV and diver support, recovery and firefighting. The global fleet comprised by the end of
Jan 14 2014, of 1926 AHTS’s and 1314 PSV.
AHTS vessels are designed for towing and anchoring of drilling rigs and FPSO’s (Floating
Production Storage and Offloading units). The vessels are high performance with regard to
the power (versus) size ratio, with an open stern for handling of anchors and mooring chains
weighing several hundred metric tonnes. These vessels are typically classified by brake
horsepower output (BHP). Smaller AHTS (>10k BHP) work with jack up rigs, while larger
AHTS work with semi-submersibles.
PSV transport goods and crew to and from oil platforms, oil rigs and other installations or
vessels. PSV’s have a large open deck space used for dry cargo like food supplies and
9 ABG Sundal Collier (2013) Offshore Supply & Subsea, Credit Research – Sector report, (Oct. 29 2013) 10 Overview of the OSV Industry by – Clarkson. Norges Rederiforbund. RS Platou Global Support Vessel Monthly Feb 2014 and Shipbroker Andre Rostant. ABG Sundal Collier Offshore Supply & Subsea (29 Oct 2013). First Securities, Norwegian OSV companies and OSV overview ( June 2012)
8
equipment, and several different cargo tanks used for the transportation of fluids like fuel,
water, drilling mud, chemicals and cement, drill-pipe, casing etc. These vessels are also used
as standby vessels and are often equipped with firefighting and oil recovery capabilities.
PSV’s are typically classified by deadweight tonnage (dwt) and/or total deck space (square
meters) and are relatively uncomplicated vessels compared to other OSVs
Large PSV’s have more than 900 m2 available deck area. Medium size PSV’s have 700-800
m2. (“High end” is also common terminology about modern tonnage, maybe built or outfitted
in Norway.)
CSV’s perform tasks related to subsea activities and general field construction operations.
This includes pipe laying, well stimulation, diving, ROV (remotely operated vehicle), IMR
(inspection, maintenance and repair) and seabed mapping and surveying. The CSV are
significantly more diversified than the PSV and AHTS segment. Vessels are typically
classified according to length, although this does not fully explain the capability of a specific
vessel within this highly diversified segment.
4.2 Drilling rigs11 Mobile offshore drilling units (MODU’s) consist of Jackups and floaters.
Jackups stand on the ocean floor with their hull and drilling equipment elevated above water
on connected leg supports. A jack-up rig is a self-elevating unit with a buoyant hull, capable
of raising its hull over the surface of the sea. The buoyant hull enables transportation of the
unit and all attached machinery to a desired location.
Jackup rigs are generally preferred over other rig types in water depths of 400 feet or less,
primarily because jackup rigs provide a more stable drilling platform with above water
blowout prevention (BOP) equipment.
Jack up platforms are used as exploratory drilling platforms and offshore wind farm service
platforms.
11 http://www.enscoplc.com/Rig-Fleet/Definitions/default.aspx and RS Platou Rig Montly jan 2013
9

Floaters comprise of semi-submersible rigs and drillship’s.
Semisubmersible rigs are floating offshore drilling units supported by pontoon type columns
that can be partially submerged to a predetermined depth. While in transit semis can float on
top of the water making tugging of these rigs from location to location easier. Semis are
capable of drilling in water depths up to 8,000 feet. Semisubmersibles are chosen for their
stability, but drillship’s are capable of holding more equipment.
Drillship rigs are maritime vessels that have been outfitted with drilling apparatus. Most often
used for exploratory drilling of new oil and gas wells in deep water. Drillships may also be
used as platforms to carry out well maintenance or completion work such as casing and tubing
installation or subsea tree installations. Drillship rigs are capable of ultra-deepwater drilling in
depths of up to 10,000 feet with a total vertical drilling depth of 40,000 feet
Both Semis and drillships can be conventionally moored (CM) or dynamically positioned
(DP). Dynamically-positioned floaters are held in a fixed location over the ocean floor by
computer-controlled propellers or "thrusters."
4.3 Demand drivers The main drivers for the PSV, AHTS and CSV segments are field activity as in
developments, new fields coming on stream and development drilling and offshore
construction.12 The demand for these ships, are closely linked to exploration and production
(E&P). The numbers of rigs, determine the demand for OSV’s. 4 AHTS are required to move
1 rig in Norway, and 3 vessels are required in the UK. For PSV’s the number is 2.5-3 per rig.
Exploration is a driver as the drilling period for one well is +/- 30 days. There is high boat
12 ABG Sundal Collier (2013) Offshore Supply & Subsea, Credit Research – Sector report, (Oct. 29 2013)
10
intensity during rig moves and for PSV’s during the drilling period. Production (drilling)
mostly involves PSV’s.
Future OSV demand driven by an expanding MODU fleet
Both shallow and Deepwater offshore activity is likely to propel PSV demand further in the
period 2014 and 2015. Discoveries of oil and gas in deep-water (>3000ft) have been
bountiful. As a result, significant investments in mobile offshore drilling units (MODUs) to
help explore and develop deep-water oil and gas resources have been made. In total, more
than 100 units have been delivered in the last five years and the order books are currently
indicating that 35 and 27 units will be delivered in 2014 and 2015, respectively. Having said
this, the floater market is facing some headwinds, but the large contract backlog of rig owners
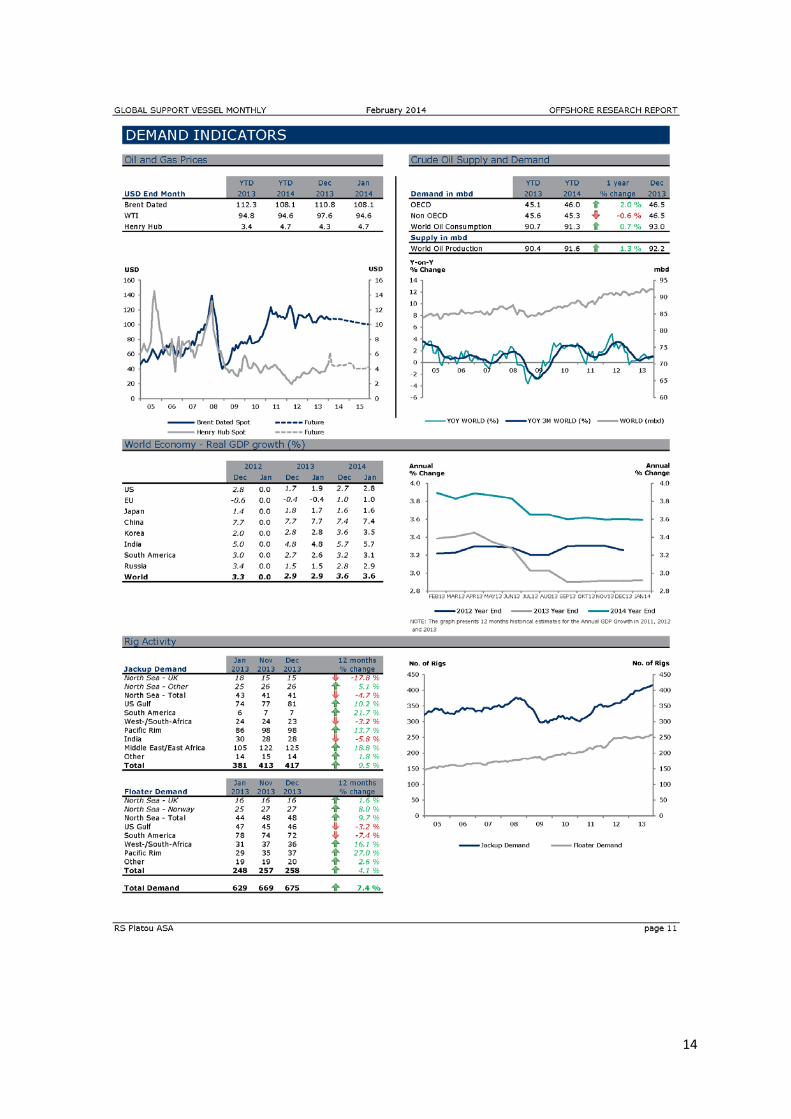
should keep floater utilization at a high level. In shallow water RS Platou also expect
increases in demand, with the redevelopment of older fields being the main driver.13
The world fleet development of AHTS and PSV has a CAGR of 9 %. The OSV to Rig ratio is
expected to fall below 3.9 by 2014 from 4.1 as of March 2012, reflecting a tilt in market
balance in favor of vessel owners. 14
The OSV demand per rig/field (what ABG denote as the “demand multiplier”) also differs
between geographical regions. Demand tends to be highest on a per rig/field basis in
immature areas, where a large proportion of the total demand stems from (exploration)
drilling activity. The demand also increases with distance to shore, poor onshore
infrastructure and a high degree of government regulation. As ABG have defined the
supply as the mid- to high-end of the OSV fleet, the multiplier also accounts for
crowding out of low-end capacity. Relatively new oil and gas regions such as Brazil and
West Africa fit the “high demand” description well.15
For the AHTS segment, the number of prelays16, have increased over the past years. This
reduces time for anchoring, optimizing rig and vessel time. Reduced weather window reduces
13 RS Platou ASA Global Support Vessel Monthly (January & February 2014) RS Platou Montly (February 2014) The North Sea OSV Market (January 2014) The Platou Report (2014) 14 Clarkson Capital Markets (2012) Overview of the OSV Industry, International Monetary Fund (IMF), World Economic Outlook (April 2012) 15 ABG Sundal Collier (2013) Offshore Supply & Subsea, Credit Research – Sector report, (Oct. 29 2013) 16 Prelaying means that a significant part of the mooring work can be conducted weeks in advance and at the optimal time with respect to weather conditions and vessel availability or prices.
11
weather risk. Prelaying is safer for the oil company. Maersk FPSO17 Gryphon18 sustained
damage in a storm in 2011, when four anchor chains broke and the vessel moved off station,
causing considerable damage to the vessel and the subsea architecture. The number of Heading
Control fixtures, have been increasing since. Demand for larger AHTS vessels are likely to
come from Brazil. It is increasingly difficult to attain term charter contract in order to finance
due to the banks being more focused on the Subsea sector. Many owners are uncertain about
mooring vs DP in the future. Limited order-book is combined with a lower vessel to rig ratio.19
Clarkson Capital claims that oil consumption seems to be strongly correlated with GDP
Growth. High energy demand and high oil prices leads to high exploration & production
(E&P), which again leads to an increase in offshore activity as onshore fields mature. The
OSV demand is robust. The global offshore CAPEX is expected to increase by CAGR20
12%.21
17 Floating Production Storage and Offloading system is used extensively by oil companies for the purpose of storing oil from the oil rigs in the middle of the ocean and in the high seas. 18 http://www.maerskoil.com/media/newsroom/pages/maerskoiluk%E2%80%99sgryphonfpsobackinproduction.aspx 19 Westshore Shipbrokers AS (2013) Market Presentation 20 Compound Annual Growth Rate 21 Clarkson Capital Markets (2012) Overview of the OSV Industry, International Monetary Fund (IMF), World Economic Outlook (April 2012)
12
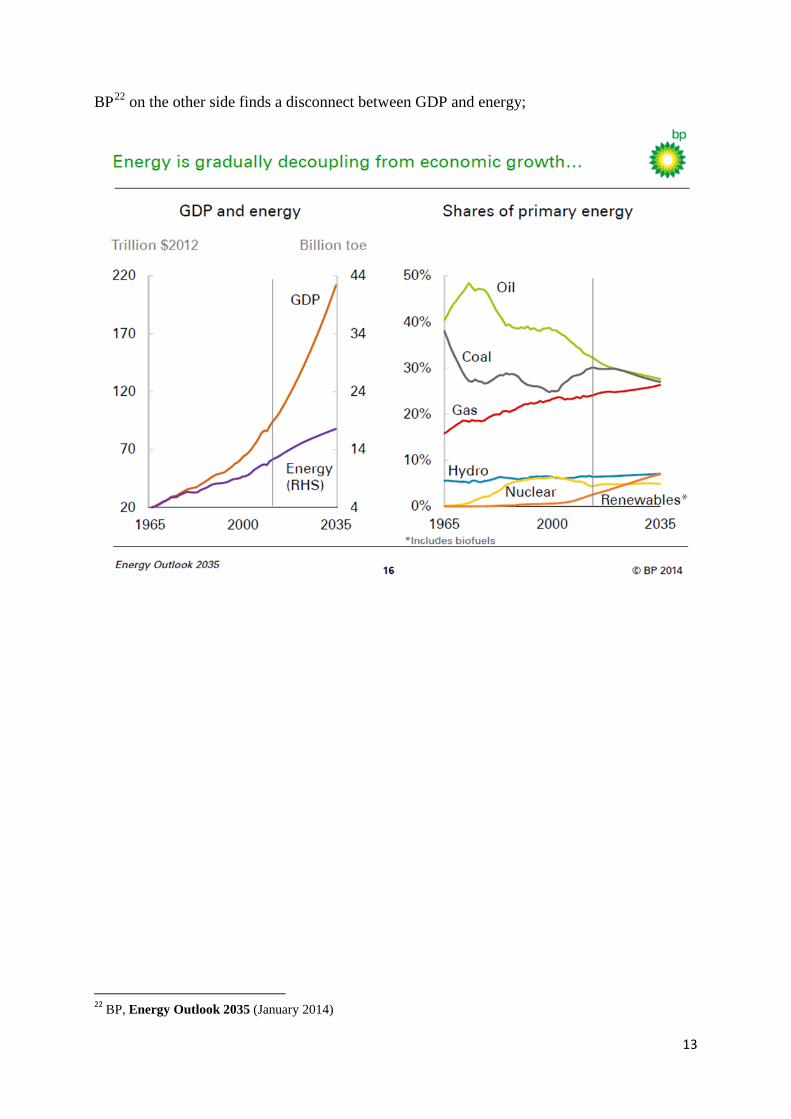
BP22 on the other side finds a disconnect between GDP and energy;
22 BP, Energy Outlook 2035 (January 2014)
13
14
4.4 Deeper water Offshore oil production contribution is expected to increase its share on behalf of onshore
fields. Deepwater (water depths > 600 feet) CAPEX is expected to increase its share of the
offshore production, with at CAGR of 23 %. The Golden Triangle of Latin America, The Gulf
of Mexico and West Africa are expected to dominate deepwater expenditure over the next
four to five years according to Douglas-Westwood23. The exploration trend goes deeper and
deeper, concentrated in the deep-water regions such as; Angola, USA, Brazil, Nigeria,
Malaysia and Norway. There are significant Hydrocarbon discoveries in these deep-water
regions24.
Frontier operations absorb more supply capacity. Newer and larger vessels should intuitively
bring efficiency gains to the industry, but the “real” world (count) confirms theory of 3-4
supply vessels per rig. Large PSV’s are taking a larger portion of the PSV segment in all
offshore basins. The PSV platform is versatile and will also be used for subsea support, well
intervention, renewables offshore and possibly seismic operations. Limited growth should be
expected from current balance sheets due to low equity ratio.25
As oil exploration and development become increasingly complex, moving into deep sea
and harsh water acreages, the demands of the offshore supply vessel industry also
increase. On top of this, stricter government regulations also support a trend for increasingly
complex vessels, typically by adding requirements such as firefighting and oil recovery
capabilities. This effect is expected to increase in the wake of the Macondo oil spill (BP
Deepwater Horizon in 2010) and with oil and gas activity moving into more
environmentally sensitive areas.26
Increased operations in remote areas are fantastic for the industry, but are also dependent on
the oil prices hovering at “healthy levels”. Fearnley comments that they have seen it before and
23 http://www.offshoreenergytoday.com/douglas-westwood-golden-triangle-to-dominate-deepwater-expenditure-over-5-years/ 24 Clarkson Capital Markets (2012) Overview of the OSV Industry, International Monetary Fund (IMF), World Economic Outlook (April 2012) 25 Swedbank First Securities (2012) Offshore Supply Vessels 26 ABG Sundal Collier (2013) Offshore Supply & Subsea, Credit Research – Sector report, (Oct. 29 2013)
15
will see it again – if or when the oil price takes a sharp dip and remains low for a period,
such projects together with deep water drilling are the first ones to be put on the shelves.27
4.5 Arctic The Arctic frontiers are seeing more activity. The Barents and Kara seas, Sakhalin,
Canada and Greenland should all create demand for high end tonnage inclusive of
ice management services.
Drilling in Arctic areas, with tough weather conditions, large distances and poor infrastructure
does create a much higher relative demand for larger and more sophisticated Offshore Support
Vessels (OSV). During 2014 there will be an increase of about 250 percent in deliveries of
Deepwater rigs (34 in 2014 versus 13 in 2013), and this should drive demand for high-end
OSVs. Over the next 12-24 month’s we could see a somewhat challenging market for offshore
drilling rigs, but longer-term this segment still looks firm. Fearnley expect the oil price will
continue to perform better than current analyst consensus expects. Geopolitical risks are likely
to continue to affect the supply side, and Fearnley expect to see oil demand surprise on the
upside as the global economy, hopefully gathers long-sought after momentum.
AHTS demand (but also PSV demand) is expected to receive a significant boost from
increasing offshore activity in the oil and gas basins of the Arctic, as the vessel intensity per
rig is much higher than in other regions. Past experience from the Cairn Greenland campaigns
indicates that each rig operating in Greenland will require three suitably sized and specified
AHTS ‘vessels for ice management. Due to the challenges in the Arctic, charterers will
generally require top-end tonnage, which will, in most cases, be sourced from the North Sea
market.
Although the timing of offshore activity in Arctic basins can be challenging to estimate, some
Arctic campaigns for 2014 and 2015 have been booked already. AHTS vessels representing
nearly 15 percent of the North Sea fleet are already booked for Arctic activity in 2014.
Excessive supply growth, especially of the PSV fleet, has been the concern of many OSV
owners and investors. These concerns are based on the considerable PSV order book. Last
year (2013), for example, 229 PSVs of various sizes were scheduled for delivery. Vessel
27 Fearnley Offshore Supply The Offshore Report No.1&2 Offshore Support and Specialized Vessels
16
deliveries from yards were, however, extensively delayed. Inexperience, especially at new
Asian yards and especially in the final construction stages, is cited as the main reason for
delays. Furthermore, anecdotal evidence suggests that labor rotation at yards is high, thus
preventing many yards from progressing along the ‘learning curve’ at the desired rate. The
latest quarter is, however, showing a rise in deliveries. If this is an actual lift in productivity,
then PSV fleet growth could be accelerating further.28
4.6 Wind29 The offshore wind market has been extremely active in 2013 in terms of construction activity,
but this will change for the worse in 2015 and 2016. The UK dominance in the offshore wind
market is now being, and will continue to be, challenged by Germany in 2014 and 2015.
Germany saw a tremendous level of construction activity during 2013, with most of the
projects set to be finalized in 2014 and 2015. New megawatts are being lined up in Europe,
Asia and North America, but a significant proportion of the megawatts added are pilot
projects and not commercial wind farms. Delays in current and future projects continue to be
due to cabling issues, but in addition to that there have been several delays due to fabrication
and installation problems.
The prevalent market driver in the offshore wind sector is, and will continue to be,
government subsidies. In order to reach grid parity, technological progress, which is driven by
large-scale government support, is essential.
4.7 Regional markets US Gulf of Mexico (US GoM) is the most actively explored and drilled offshore basin.
Deepwater activity remains near historically high. The E&P companies prefer to contract new
DP drillships, with increased capabilities such as dual activity derrick and dual BOP’s.
Deepwater PSV’s are on the orderbook to meet the increased demand from these vessels.
Latin America is one of the important OSV markets given its huge growth potential over the
next decade. Petrobras indicated that the seventh OSV newbuilding tender, will be the last out
of a 146 vessel renewal program. The tender calls for vessel constructed in Brazil with
28 RS Platou ASA Global Support Vessel Monthly (January & February 2014) The North Sea OSV Market (January 2014) The Platou Report (2014) 29 RS Platou ASA Global Support Vessel Monthly (January & February 2014) The North Sea OSV Market (January 2014) The Platou Report (2014)
17
contract duration of 4, 6 and 8 years with an option to extend with the same number of years.
It is expected that Petrobras will come to the market for foreign PSV’s again.
West African region is both a shallow and deepwater play. The additional demand is likely to
come from deepwater projects in Angola, Nigeria and Ghana.
Middle East region is primarily a shallow water play. The Jackup count is an important
driver for OSV activity and demand. The dayrates in the region are among the lowest in the
world due to shallow waters and Saudi Aramco’s ability to dictate prices.
The North Sea is one of the oldest and most explored oil and gas basins. It is the only
established spot market in the supply industry. This is as close as it gets towards a perfect
market as it is 100 % driven by supply and demand. The North Sea is the only market in
shipping where the rates can surge 400 % in 4 hours.
In Norway, the tonnage is mostly high end. The tonnage in Aberdeen, are mixed bags as the
requirements/specifications are lower. (The operators are holding a high standard though)
The Barents Sea has increased drilling activity. Boats for this spotmarket are based or on
standby in Bergen and Stavanger. Ad hoc rig moves and supply in this area occupies 10 days
just in sailing time up and down. This affects the availability in the spot market. The
importance of arctic regions is growing. The Kara Sea is also attracting available tonnage.
The Asia Pacific region has witnessed rapid growth in production.
4.8 Macro drivers prompting OSV demand Damodaran30 warns against bringing macro into the valuation. Macroeconomic changes will
affect value, but building the macroeconomic view into the valuation model will make it
…”impossible to separate how much of the result is attributed to views about the firm, and
how much to the macroeconomic judgment”. Hirt and Block31, on the other hand brings in a
Top-Down, and Bottom-Up approach into the valuation. In this thesis the company was
chosen before analyzing the macroeconomic picture and consequently it will be closer to the
bottom-up methodology. Another challenge is to quantify subjective factors. Qualitative
views have to be translated into quantitative elements of growth32.
30 Damodaran, A. (2006) Damodaran on Valuation 2nd ed. pp. 5-7 and 663 and Damodaran, A. (2012) Investment Valuation 3rd ed. p. 622 31 Hirt, G.A. & Block, S.B. (2012) Fundamentals of Investment Management 10th ed. ch. 5 and 6 32 Damodaran, A. (2012) Investment Valuation 3rd ed. pp. 301-302
18
4.9 Struggle Many of the participants in the industry are still struggling to deliver decent returns, with
high financial gearing due to extensive investments in recent years. So far, the companies
have been able to generate sufficient cash flows to service interest and debt amortization.
However, some companies appear to be in sight of harvesting the fruit of the high
investments made.33
4.10 Challenges The industry has several challenges such as: Tremendous yard capacity - it is estimated that
approximately 50% of the yard capacity in China is being utilized, hence we have seen in
2013 that many private shipyards have gone bankrupt and closed up. China is not the only
challenge. In many other countries there is just too much capacity which is also fuelled by
the fact that due to lack of orders for conventional ships many shipyards have switched to
building offshore vessels.
Turkish shipyards are now offering prices which are very competitive compared to Norwegian
and European yards, in fact prices have been close to Chinese prices which makes some of
them very attractive alternatives. Rising costs - in areas such as Norway and Brazil we have
reached level’s which by many is considered “too much”. Statoil has officially said that they
are having difficulties in making a profit with oil prices around USD 100 per barrel and they
have started a cost cutting process. Crew and operating costs have also reached level’s, which
seems to be (almost) too high and many owners have miscalculated totally the cost of
operating in Brazil and to a certain extent regrets going in there. A few years ago it was
unheard of for a Norwegian supply vessel owner to have any other crew than full Norwegian
speaking crew. Today the situation has changed totally and most of these owners have today a
large amount of Non Norwegian crew onboard.
Commercial life time for offshore support vessels - during 2013 we saw several vessels built
in the early 80´s being removed from the market and went into scrapping and the last two
years have shown that the commercial life time for a supply vessel has been quite reduced.34
Financing - or rather lack of financing will continue to be a big challenge during 2014 and we
will see a large amount of sale/ leaseback which was also the case for 2013. Many of them
might go into KS or DIS companies (or other limited liability companies) with bareboat
charter back to the sellers. Secured or unsecured bonds will also be much in demand. From a
33 ABG Sundal Collier (2013) Offshore Supply & Subsea, Credit Research – Sector report 34 IHS does not agree. Ref IHS subchapter.
19
market prospective and in theory, it is quite good that financing is tight as it is supposed to
reduce the speculative new buildings or make life to speculative projects. As certain yards are
offering extremely attractive payment terms and no take out guarantee, the speculative new
building will still carry on.
The OSV owners have two years behind them with “expectations not quite fulfilled”.
It seems as if the expected activity wave has been pushed in front of them - the high
activity peak with high rates being pushed to the right.35
4.11 Expectations and Outlook ABG expect a healthy CSV market, improved rates in the AHTS market and continued
oversupply putting pressure on the PSV segment. Due to the opening up of new oil and gas
regions such as Brazil and West Africa, mature regions such as the NWECS36 being
given a second life through new discoveries and increased exploration efforts in frontier
arctic regions, ABG believe the underlying demand fundamentals in the OSV industry are
strong.
Looking at E&P spending levels over the next few years, ABG still expect this to grow,
albeit at a slower pace than in recent years. ABG forecast 3% growth in offshore
spending in ’14e and no growth in ’15e.
The outlook for the mid- and high-end AHTS (> 10k BHP) market is slightly positive for
2014e. A 9% year-on-year increase in demand and a 5% forecast increase in supply should
translate to a slight increase in utilization from 2013. For the PSV segment, the outlook is
worse, as a 10% growth in demand stemming from growth in offshore fields and drilling
units should be insufficient compared to a forecast of 15% growth in supply. 37
Fearnley generally have a positive outlook for the industry. Utilization has been picking up,
but the rates have been lagging behind. Term rates for certain types of vessels will most likely
pick up during 2014.38
35 Fearnley Offshore Supply The Offshore Report No.1&2 Offshore Support and Specialized Vessels 36 North West Europe Continental Shelf 37 ABG Sundal Collier (2013) Offshore Supply & Subsea, Credit Research – Sector report 38 Fearnley Securities AS OSV Sector outlook 4q13 previews (24 February 2014)
20
E&P Spending 2013 to 2017 in the Norwegian Continental Shelf (NCS) is expected to be 7.7
% CAGR. The UK Continental Shelf (UKCS) is benefitting from record investment in new
development. Exploration and Appraisal wells are up from previous years and possibly facing
the most active drilling period in the last 15 years. Westshore sees a global potential of 950
offshore rigs by the end of 2015. Smaller operators are entering the NCS and the UKCS
leading to more activity on the shelf.39
RS Platou expects escalating costs and flat oil prices. Public oil companies face the challenge
of maintaining dividend payments to their shareholders, while continuing to increase their
E&P budgets. Global E&P is still expected to grow by approximately 6 percent to 700—750
bill USD, but growth in real oil service purchasing power will be relatively modest.40
4.11.1 IHS Petrodata41– Former ODS Petrodata IHS is a leading supplier of data to, among else, the shipping and offshore industry, and to
those who follow these markets and make forecasts etc. As this is based on a breakfast
briefing, and not written reports, their view will be hurdled up in this separate subchapter. IHS
is tracking every vessel and rig individually. They are basing their prognosis and forecasts
mainly on regression. The rigmarket is in a cyclical pause with signs of slowdown for 2014.
South East Asia is primarily a midwater region, with increased deepwater development.
Mediterranean with Israel, Cyprus and the Black Sea have promising discoveries. West Africa
is the best UDW area with high rates and high utility. The bureaucracies are time consuming.
The US Gulf of Mexico has DW discoveries, and Mexico is opening up exploration. East
Africa has major discoveries and large future DW developments. The demand in North West
Europe appears to be weak through 2014-2015. The Falkland Islands have promising first
development. Brazil looks good for long term development, with new exploration. It’s a
regulated market, but it seems the authorities are easing on requirements like local content.
The harsh environment areas of the Kara Sea, and Greenland does not look promising for the
next few years, but maybe on a longer term.
Contractors prefer drillship’s. IHS predicts that the fleet of drillship’s will grow till 170 by
2020. 71 of 75 of the new ships will be capable of UDW drilling. Semisubmersibles are less
attractive. The market for floaters is softening. The dayrates for UDW capability are expected
39 Westshore Shipbrokers AS (2013) Market Presentation 40 RS Platou ASA Global Support Vessel Monthly (January & February 2014) RS Platou Montly (February 2014) The North Sea OSV Market (January 2014) The Platou Report (2014) 41 IHS Petrodata Breakfast Briefing: Offshore Rig Market, Supply Vessel Trends (March 26, 2014)
21
to fall from 630 000 USD to 450-500 000 USD. Few UDW rigs are drilling in UDW. This is
pushing down the rates of lesser specified rigs. Latin America and Africa dominates
discoveries. Chinese yards only require 10 % down payment for ship orders. They may get
order for 3 vessels but builds 5 with hope to sell the last 2 later. The global PSV rates are on a
slide 2009-2014. In many markets the Rig/OSV ratio is 90 % correlated, but there are regional
differences. Examples of segmentation in the regional markets are; local content requirement
in Brasil, Jones act in USGoM, high Norwegian requirement relative to lower requirements in
the UK and the Aramco monopoly in the Mideast.
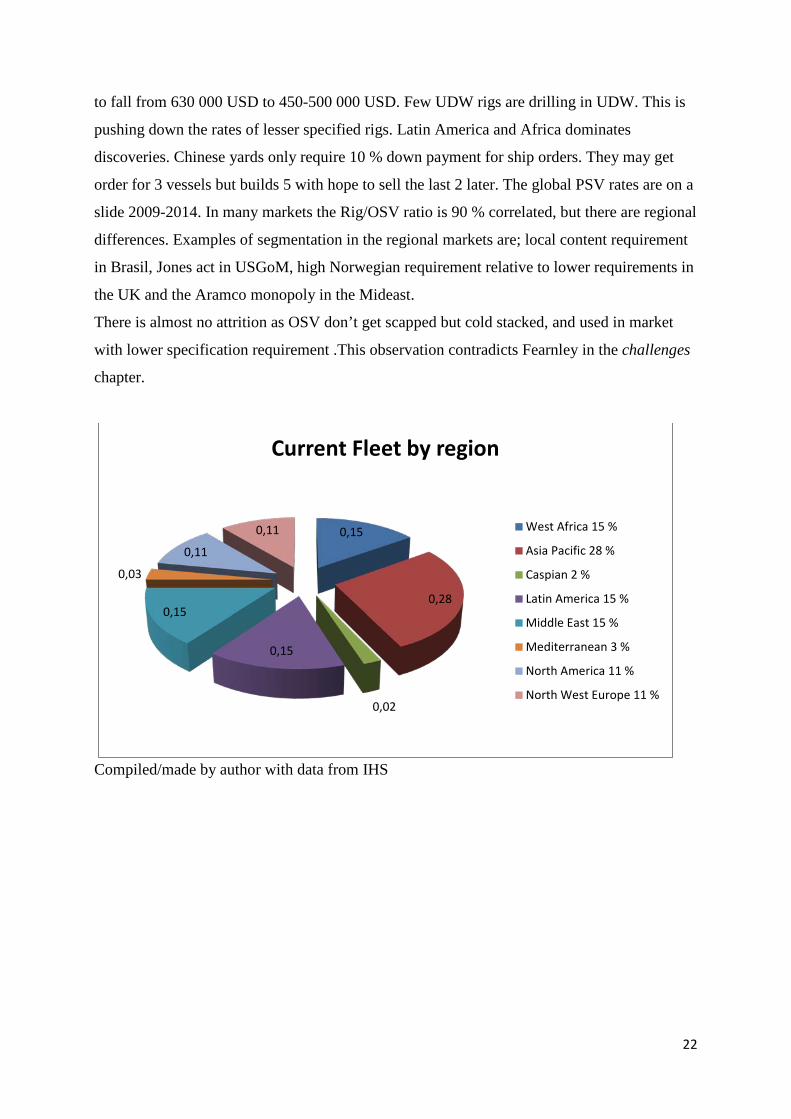
There is almost no attrition as OSV don’t get scapped but cold stacked, and used in market
with lower specification requirement .This observation contradicts Fearnley in the challenges
chapter.
Compiled/made by author with data from IHS
0,15
0,28
0,02
0,15
0,15
0,03
0,11
0,11
Current Fleet by region
West Africa 15 %
Asia Pacific 28 %
Caspian 2 %
Latin America 15 %
Middle East 15 %
Mediterranean 3 %
North America 11 %
North West Europe 11 %
22
Compiled/made by author with data from IHS
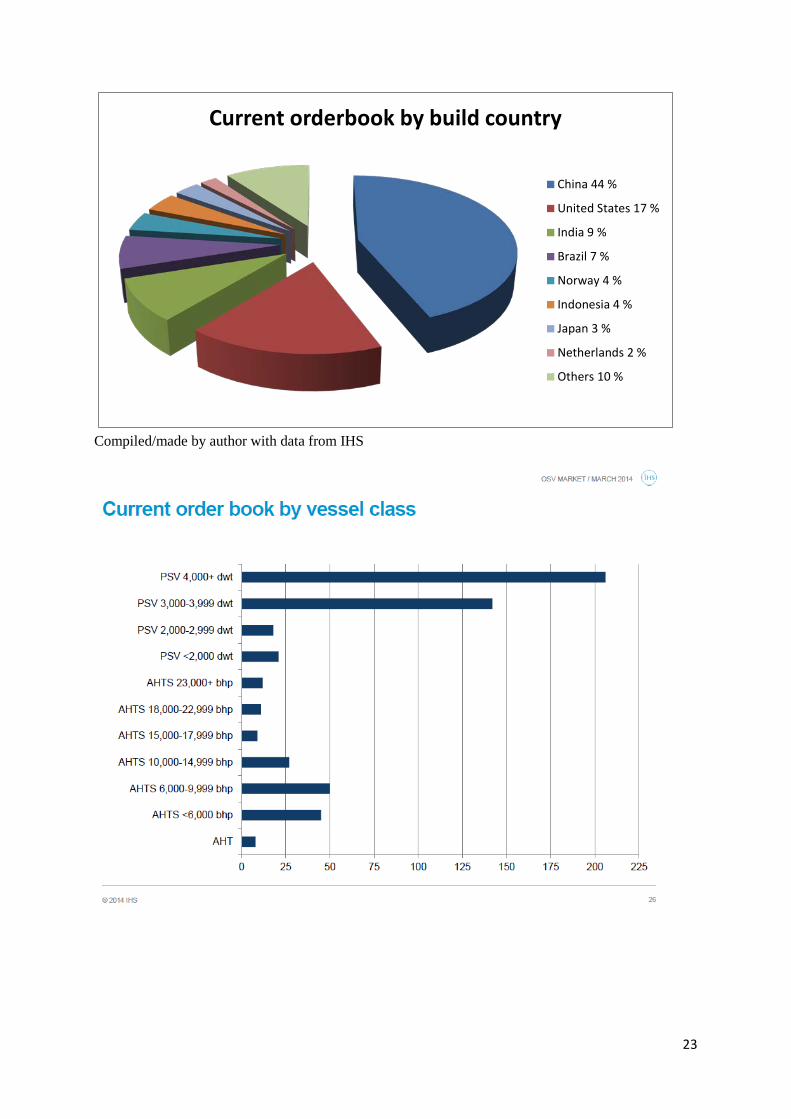
Current orderbook by build country
China 44 %
United States 17 %
India 9 %
Brazil 7 %
Norway 4 %
Indonesia 4 %
Japan 3 %
Netherlands 2 %
Others 10 %
23
24
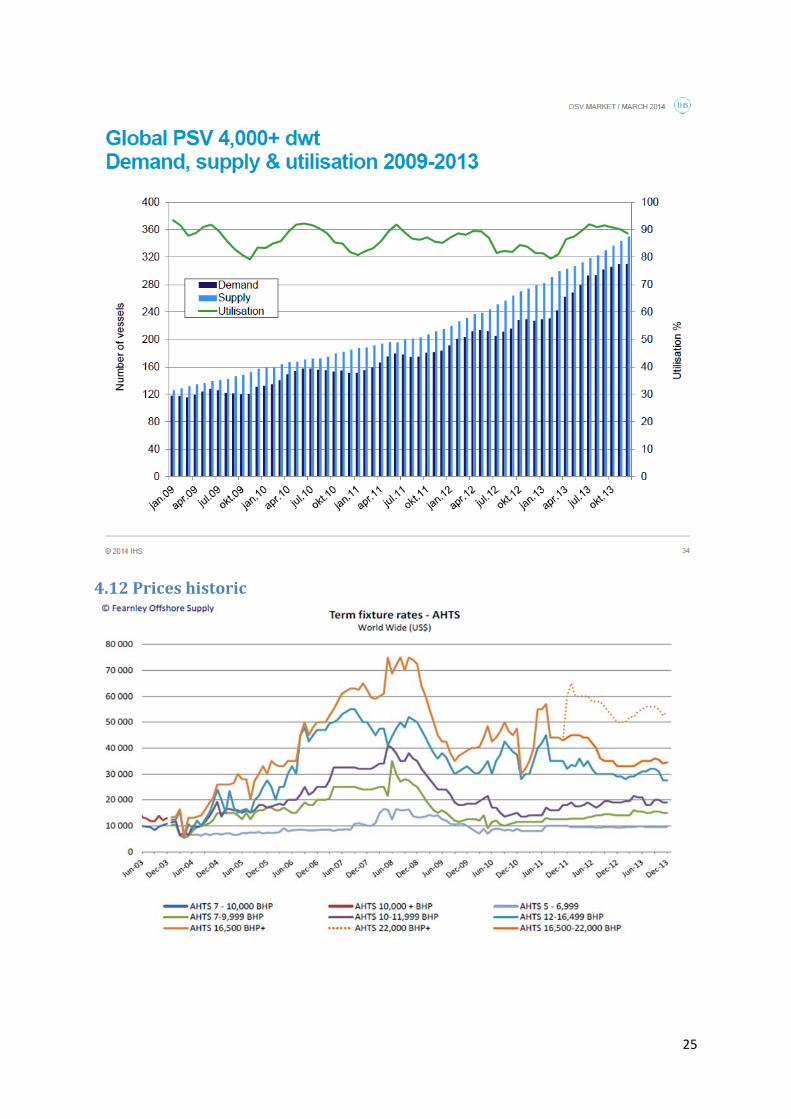
4.12 Prices historic
25
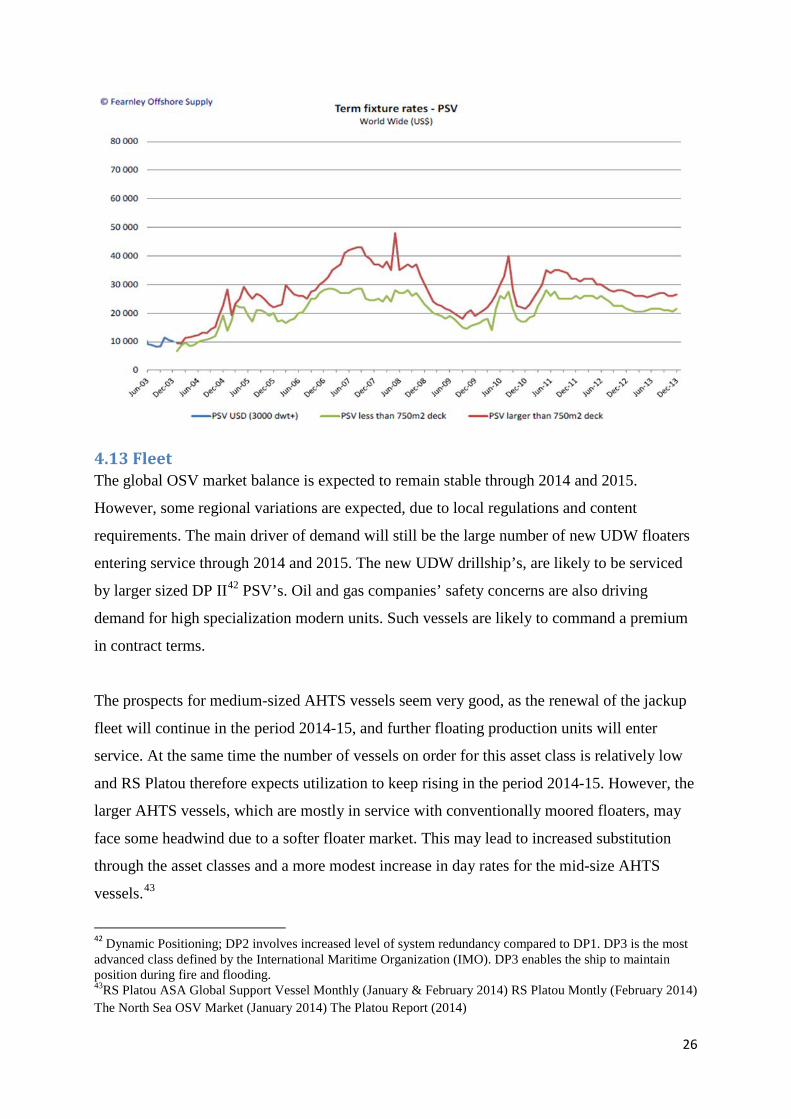
4.13 Fleet The global OSV market balance is expected to remain stable through 2014 and 2015.
However, some regional variations are expected, due to local regulations and content
requirements. The main driver of demand will still be the large number of new UDW floaters
entering service through 2014 and 2015. The new UDW drillship’s, are likely to be serviced
by larger sized DP II42 PSV’s. Oil and gas companies’ safety concerns are also driving
demand for high specialization modern units. Such vessels are likely to command a premium
in contract terms.
The prospects for medium-sized AHTS vessels seem very good, as the renewal of the jackup
fleet will continue in the period 2014-15, and further floating production units will enter
service. At the same time the number of vessels on order for this asset class is relatively low
and RS Platou therefore expects utilization to keep rising in the period 2014-15. However, the
larger AHTS vessels, which are mostly in service with conventionally moored floaters, may
face some headwind due to a softer floater market. This may lead to increased substitution
through the asset classes and a more modest increase in day rates for the mid-size AHTS
vessels.43
42 Dynamic Positioning; DP2 involves increased level of system redundancy compared to DP1. DP3 is the most advanced class defined by the International Maritime Organization (IMO). DP3 enables the ship to maintain position during fire and flooding. 43RS Platou ASA Global Support Vessel Monthly (January & February 2014) RS Platou Montly (February 2014) The North Sea OSV Market (January 2014) The Platou Report (2014)
26
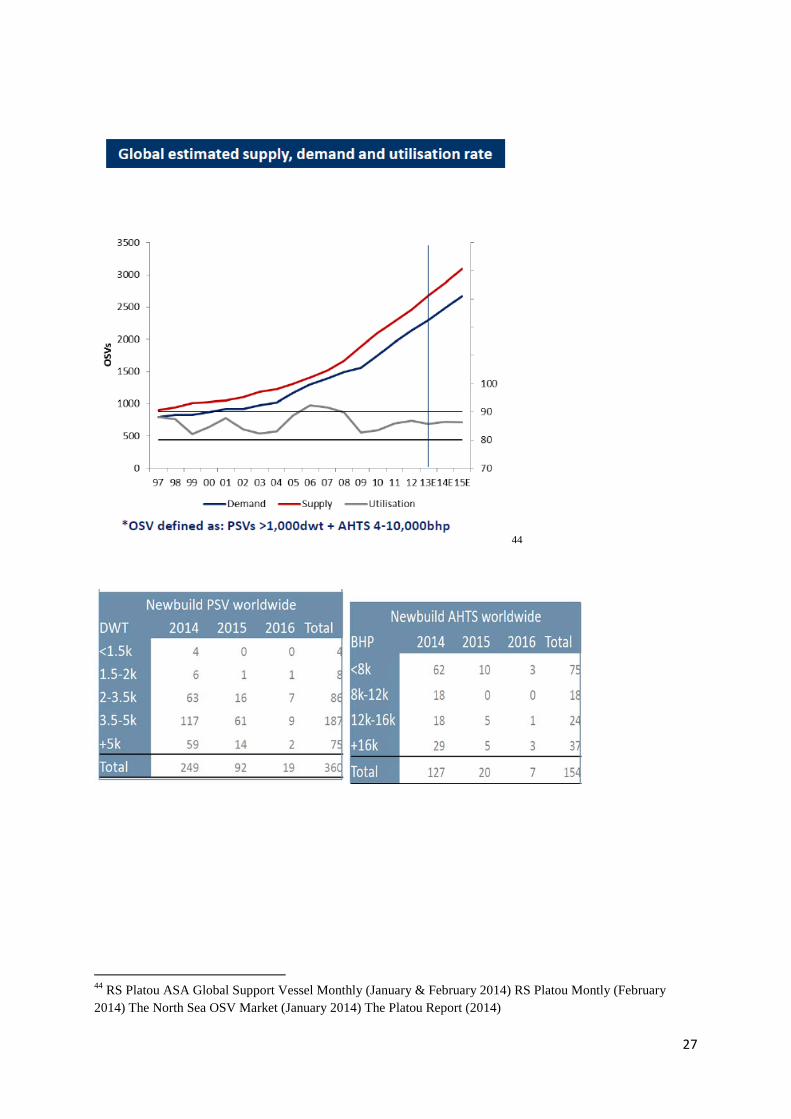
44
44 RS Platou ASA Global Support Vessel Monthly (January & February 2014) RS Platou Montly (February 2014) The North Sea OSV Market (January 2014) The Platou Report (2014)
27

Currently under construction – World Wide45
45 Fearnley Offshore Supply The Offshore Report No.1&2 Offshore Support and Specialized Vessels
28
29

4.13.1 AHTS a closer look46 A closer look – AHTS The underlying assumption behind the ABG AHTS market
model is that demand is mainly driven by drilling activity. The following graphs
illustrate the forecast drilling demand stemming from exploration and development
drilling, as well as the geographical split.
The geographical distribution of drilling activity is important, as the demand for AHTS vessels
per rig year varies significantly from region to region. This is due to factors such as the water
depth in the oil and gas basins, government regulations, distance to shore, existing onshore
infrastructure etc.
In summary, ABG find that the AHTS market should remain fairly unchanged going into
2014e, while ABG forecast utilization (term+spot demand vs. supply) to increase
marginally.
46 ABG Sundal Collier (2013) Offshore Supply & Subsea, Credit Research – Sector report, (Oct. 29 2013)
30
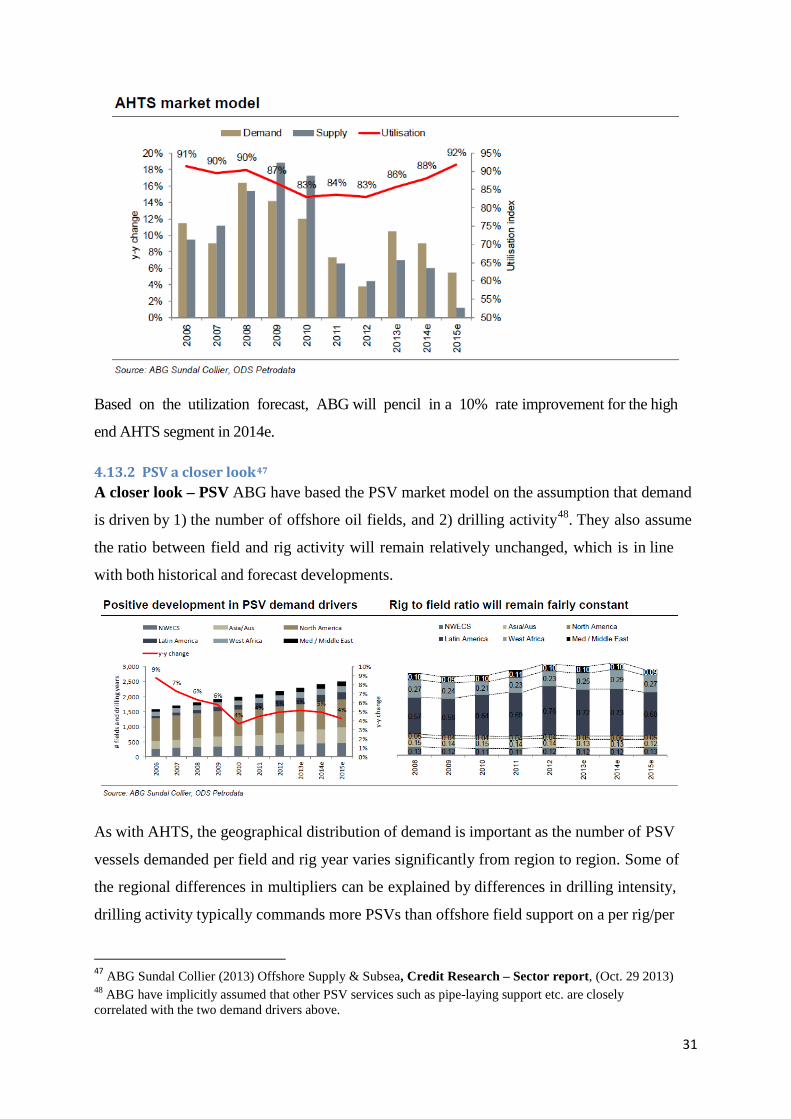
Based on the utilization forecast, ABG will pencil in a 10% rate improvement for the high
end AHTS segment in 2014e.
4.13.2 PSV a closer look47 A closer look – PSV ABG have based the PSV market model on the assumption that demand
is driven by 1) the number of offshore oil fields, and 2) drilling activity48. They also assume
the ratio between field and rig activity will remain relatively unchanged, which is in line
with both historical and forecast developments.
As with AHTS, the geographical distribution of demand is important as the number of PSV
vessels demanded per field and rig year varies significantly from region to region. Some of
the regional differences in multipliers can be explained by differences in drilling intensity,
drilling activity typically commands more PSVs than offshore field support on a per rig/per
47 ABG Sundal Collier (2013) Offshore Supply & Subsea, Credit Research – Sector report, (Oct. 29 2013) 48 ABG have implicitly assumed that other PSV services such as pipe-laying support etc. are closely correlated with the two demand drivers above.
31
field basis.49
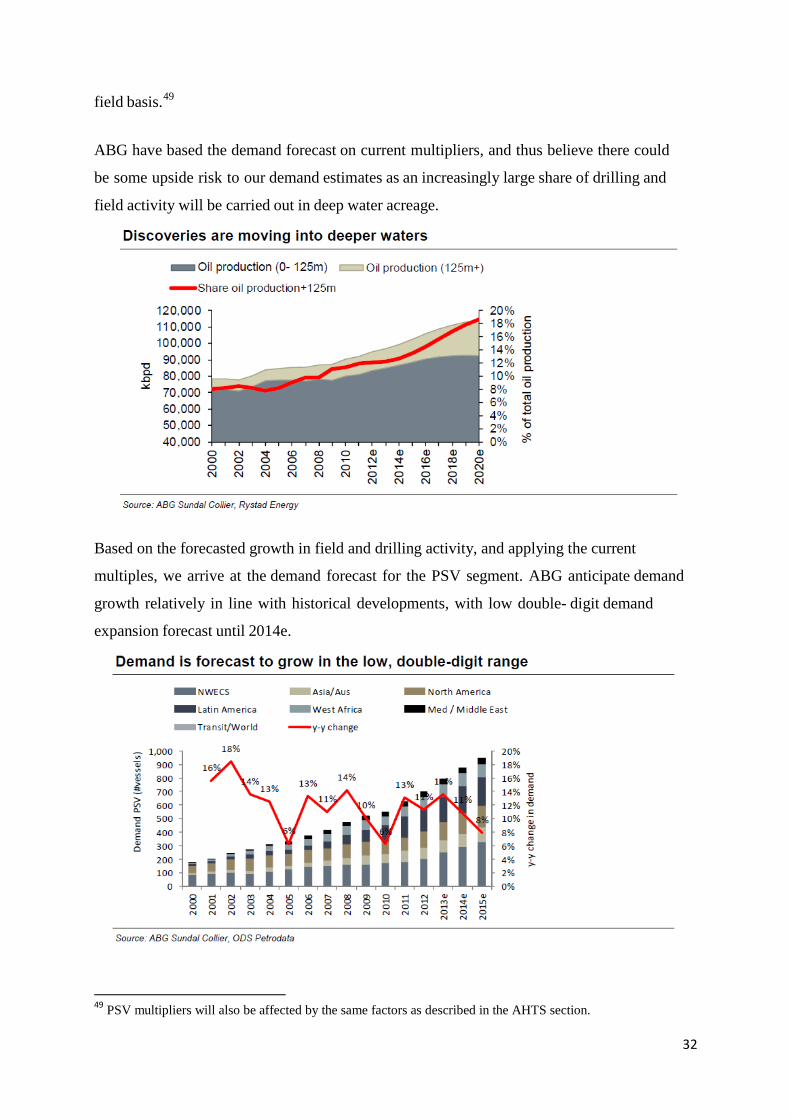
ABG have based the demand forecast on current multipliers, and thus believe there could
be some upside risk to our demand estimates as an increasingly large share of drilling and
field activity will be carried out in deep water acreage.
Based on the forecasted growth in field and drilling activity, and applying the current
multiples, we arrive at the demand forecast for the PSV segment. ABG anticipate demand
growth relatively in line with historical developments, with low double- digit demand
expansion forecast until 2014e.
49 PSV multipliers will also be affected by the same factors as described in the AHTS section.
32
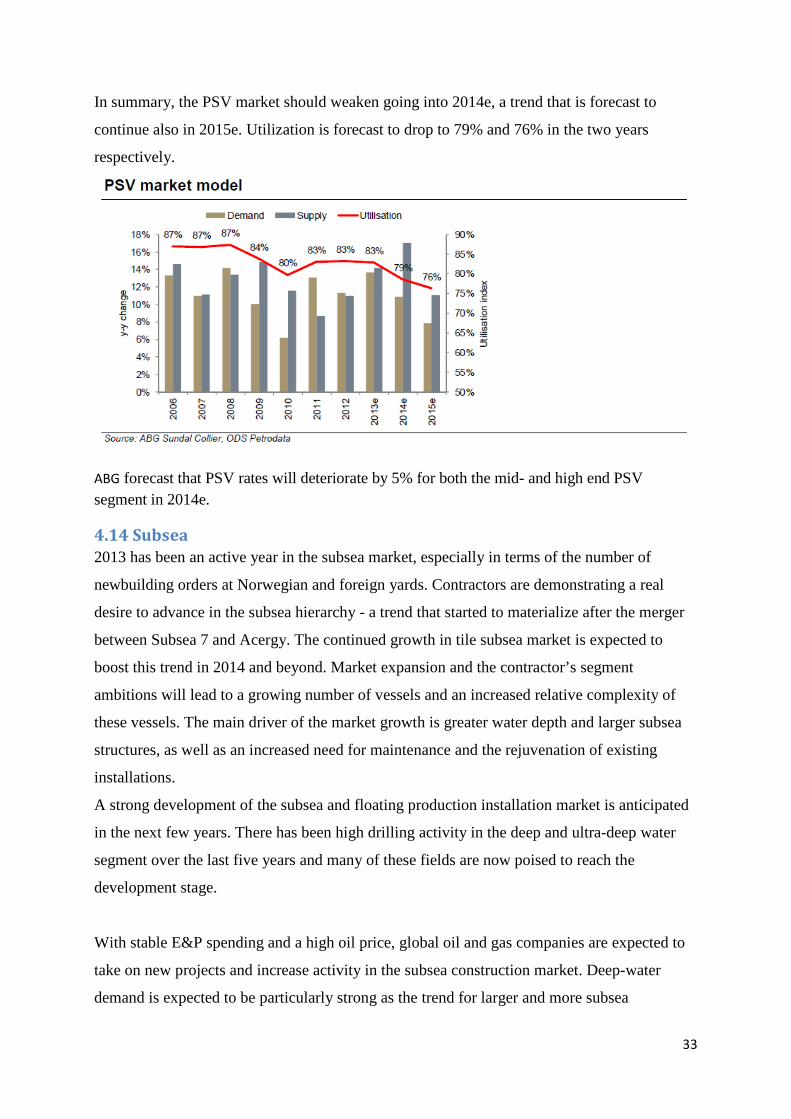
In summary, the PSV market should weaken going into 2014e, a trend that is forecast to
continue also in 2015e. Utilization is forecast to drop to 79% and 76% in the two years
respectively.
ABG forecast that PSV rates will deteriorate by 5% for both the mid- and high end PSV segment in 2014e.
4.14 Subsea 2013 has been an active year in the subsea market, especially in terms of the number of
newbuilding orders at Norwegian and foreign yards. Contractors are demonstrating a real
desire to advance in the subsea hierarchy - a trend that started to materialize after the merger
between Subsea 7 and Acergy. The continued growth in tile subsea market is expected to
boost this trend in 2014 and beyond. Market expansion and the contractor’s segment
ambitions will lead to a growing number of vessels and an increased relative complexity of
these vessels. The main driver of the market growth is greater water depth and larger subsea
structures, as well as an increased need for maintenance and the rejuvenation of existing
installations.
A strong development of the subsea and floating production installation market is anticipated
in the next few years. There has been high drilling activity in the deep and ultra-deep water
segment over the last five years and many of these fields are now poised to reach the
development stage.
With stable E&P spending and a high oil price, global oil and gas companies are expected to
take on new projects and increase activity in the subsea construction market. Deep-water
demand is expected to be particularly strong as the trend for larger and more subsea
33
equipment being put on the seabed will continue. Offshore wind farms are being placed
further offshore and thus will demand more subsea vessels in the years to come. Several
vessels were absorbed during 2013. In 2014 and 2015 several tidal projects are reaching the
start of the construction stage and this will require subsea tonnage. In recent times, many oil
companies have turned their focus on the escalation of costs, which is seen as a major threat
for several projects. However, the field economics are still sufficient to continue developing
deep-water subsea fields, where oil companies have reported higher return on the employed
capital than in the shallow and medium water segments. Healthy growth across the coming
years is expected in the subsea vessel market, but timing will still be crucial in this relatively
young market.50
The subsea market has been solid for PSV’s. Owners are likely to upgrade those vessel’s that
have the ability to be upgraded to work in the subsea market. Medium to long term
fundamentals for the subsea construction market is strong. Deepwater drilling activity, and
subsea tree awards indicates significant growth. The market has absorbed new tonnage well,
but there is an oversupply of PSV’s. Banks favor subsea or specialized offshore areas. Larger
PSV sector will be tight going forward, while mid sector is swamped. 51
The Subsea Vessel segment was undoubtedly the hottest sector in 2013 according to
Fearnley. There are few OSV owners left who have not bought a ticket in this demanding
niche, and several large speculative investments were made both by existing players and by
newcomers to the subsea industry. 2014 may prove to be the “acid test” to the sustainability
of the fleet growth we have seen in 2013. Needless to say, all the planned deepwater
developments will require a growing fleet of installation- and maintenance vessels with larger
cranes and ROV’s for depth in excess of 1500 meters.52
4.15 Risks53 ABG Sundal Collier offers this perspective on the risks in OSV business:
1. Business risks
50 RS Platou ASA Global Support Vessel Monthly (January & February 2014) RS Platou Montly (February 2014) The North Sea OSV Market (January 2014) The Platou Report (2014) 51 Westshore Shipbrokers AS (2013) Market Presentation 52 Fearnley Offshore Supply The Offshore Report No.1&2 Offshore Support and Specialized Vessels 53 ABG Sundal Collier (2013) Offshore Supply & Subsea, Credit Research – Sector report, (Oct. 29 2013)
34
Commodity price risks
We identify the oil price as the most important risk factor affecting growth in oil
services. A sudden and unexpected long-term drop in the oil price would have a negative
impact on demand for oil services and equipment. Activity within the supply segment,
especially for AHTS vessels, is driven by rig activity. Rig activity depends on the oil
companies’ E&P spend, which in turn depends on the oil price.
Market supply
Besides the oil price and the implicit demand for supply services, supply growth is a key
risk for the offshore supply names. The big increase in orders for newbuilds in recent
years could potentially lead to massive supply growth over the next few years, thus
putting further downward pressure on day rates and profitability within the supply industry.
Operational risk
The offshore supply companies have several vessels operating globally in challenging
environments. This represents risk relating to damage and erosion to vessels, which could
lead to significant cost and reduced utilization.
Construction risk
The companies currently have several vessels under construction at different ship yards.
This represents risks related to prepayments that have been paid. Also, it’s prudent to
assume a delay in the delivery schedule, which in turn would impact the company’s cash
flow.
Counterparty risk
Many of the companies in the industry have contracts with major E&P counterparties like
Statoil, Petrobas, and Total, mitigating the counterparty risk. The offshore supply
companies are exposed to the volatility in the oil price through their counterparties.
2. Financial risk
35
Financial gearing
Several companies in the offshore industry tend to have high financial gearing due to
large capex from extensive newbuild activity. The level of indebtedness depends
predominantly on the pattern of vessel investments. For many companies in this industry,
deleveraging is highly important in order to achieve a more prudent credit profile.
Cash flow position
The debt characteristics, i.e. the pattern of debt issuance, amortizations and redemption,
will have a major impact on the total cash flow position in the capital intensive offshore
supply industry. Capex related to new vessel programs will in some companies be partly
funded by internally generated cash, which will have a negative effect on the total cash flows.
Currency risk
There is also risk related to currency exposure, as the local currency acts as the functional
currency in several countries in which it operates, whereas the liabilities are predominantly
denominated in NOK. The actual currency risk depends on the degree to which any
currency mismatches are hedged.
4.16 Possible ups and downs by Swedbank First Securities54 Possible positive surprises: Brazil sourcing more capacity, at higher rates - Greenland
shows real impact in frontier operations - An increased activity in Canada and Alaska -
Subsea segment increased appetite for large AHTS units, for ploughing and installation -
Rigs being reactivated - Accidents with more widespread impact on demand than expected -
High end vessels are preferred in emerging markets like West Africa.
Possible negative impact: Significant drop in oil price - Financing once again becomes
cheap - Large scale accidents occur - An increased in local content, that induces less
business and growth - Significant efficiency gains in operations and yards.
At the event “Aksjeåret 2014”55 Chief Strategist Peter Hermanrud at Swedbank First
54 Swedbank First Securities Offshore Supply Vessels (June 2012) 55 Madsen, A. (2014) Gullalderen kan være over. Offshore.no (07 January 2014) http://www.offshore.no/sak/60484_gullalderen_kan_vaere_over_#
36
Securities gave his view of the future. Shale gas will possibly sail up as the most important
source of energy. Shale gas is less expensive than oil, and therefore a treat in the long term
perspective. The oil companies are making a profit, but the cost of E&P is rising. The
offshore market will stagnate. The rig rates will fall as the number of rigs will increase by 30
% over the next 3 years. He is expecting a drop in E&P during 2014. Up until now there has
been a lack of capacity, and suddenly this has turned around to a lack of capital. The oil
service profitability is disappointing, but the stock prices are increasing (rising) due to the
markets expectations for 2015-16. The price of oil will average around 115 USD and end
over 120 USD.
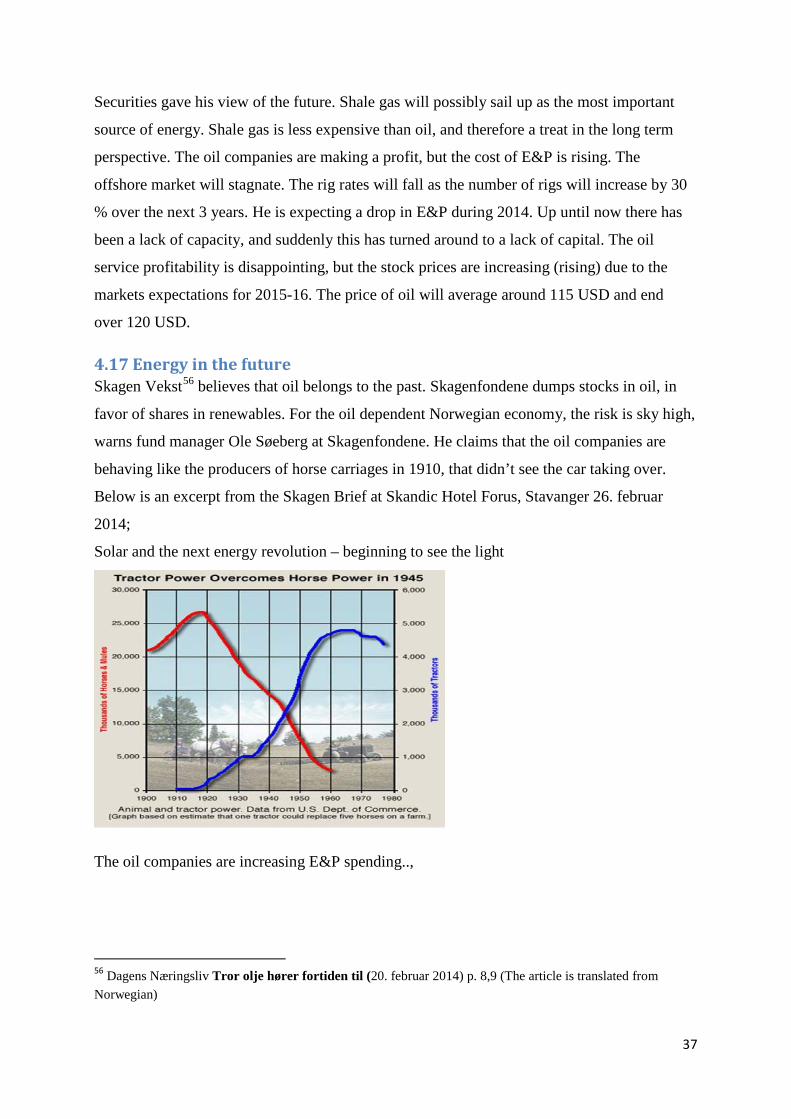
4.17 Energy in the future Skagen Vekst56 believes that oil belongs to the past. Skagenfondene dumps stocks in oil, in
favor of shares in renewables. For the oil dependent Norwegian economy, the risk is sky high,
warns fund manager Ole Søeberg at Skagenfondene. He claims that the oil companies are
behaving like the producers of horse carriages in 1910, that didn’t see the car taking over.
Below is an excerpt from the Skagen Brief at Skandic Hotel Forus, Stavanger 26. februar
2014;
Solar and the next energy revolution – beginning to see the light
The oil companies are increasing E&P spending..,
56 Dagens Næringsliv Tror olje hører fortiden til (20. februar 2014) p. 8,9 (The article is translated from Norwegian)
37
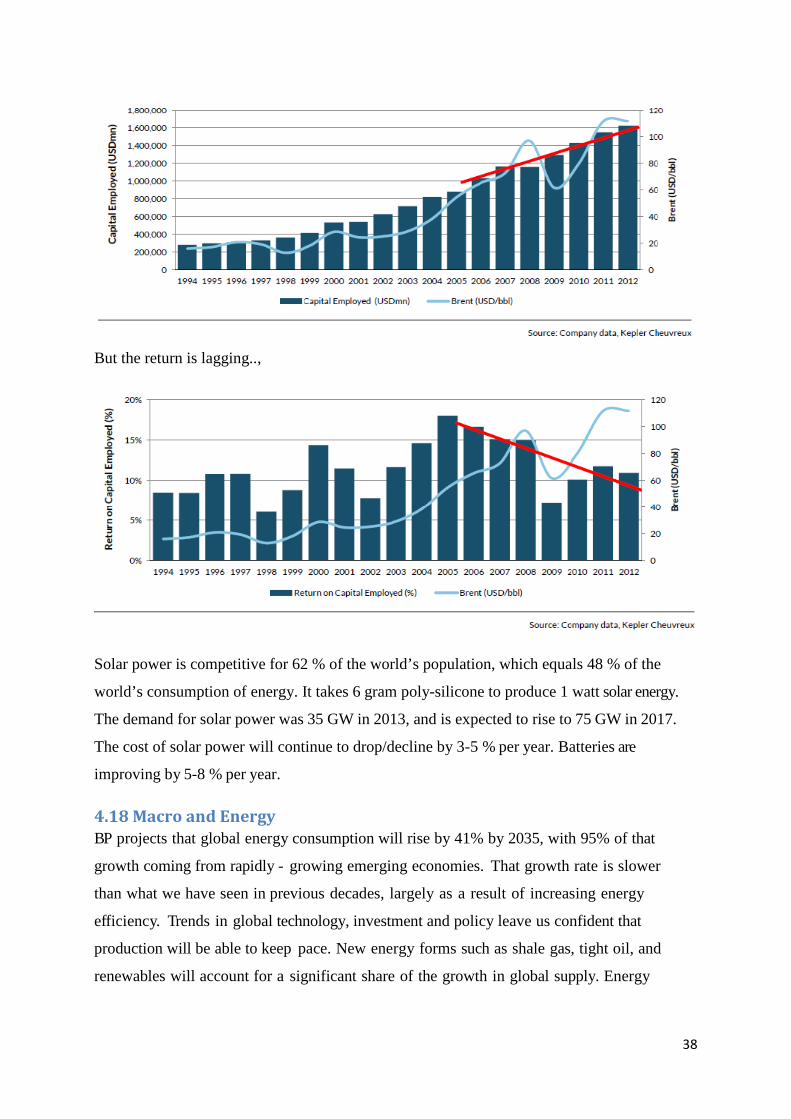
But the return is lagging..,
Solar power is competitive for 62 % of the world’s population, which equals 48 % of the
world’s consumption of energy. It takes 6 gram poly-silicone to produce 1 watt solar energy.
The demand for solar power was 35 GW in 2013, and is expected to rise to 75 GW in 2017.
The cost of solar power will continue to drop/decline by 3-5 % per year. Batteries are
improving by 5-8 % per year.
4.18 Macro and Energy BP projects that global energy consumption will rise by 41% by 2035, with 95% of that
growth coming from rapidly - growing emerging economies. That growth rate is slower
than what we have seen in previous decades, largely as a result of increasing energy
efficiency. Trends in global technology, investment and policy leave us confident that
production will be able to keep pace. New energy forms such as shale gas, tight oil, and
renewables will account for a significant share of the growth in global supply. Energy
38
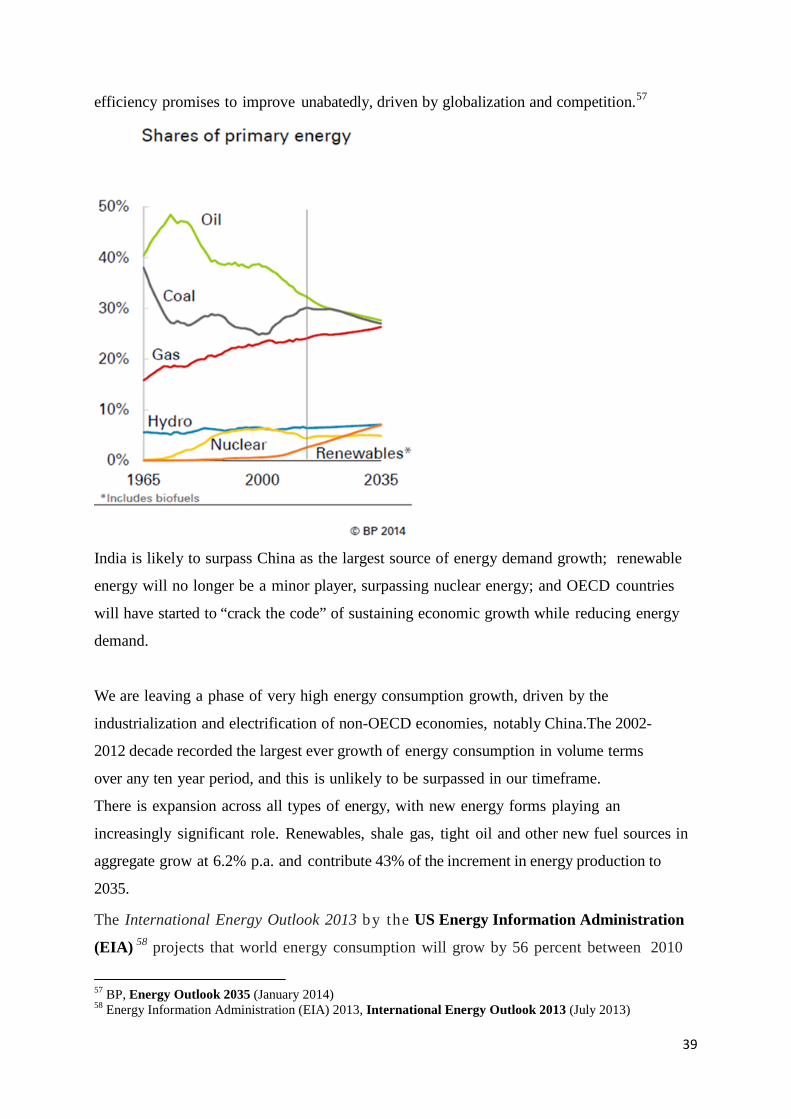
efficiency promises to improve unabatedly, driven by globalization and competition.57
India is likely to surpass China as the largest source of energy demand growth; renewable
energy will no longer be a minor player, surpassing nuclear energy; and OECD countries
will have started to “crack the code” of sustaining economic growth while reducing energy
demand.
We are leaving a phase of very high energy consumption growth, driven by the
industrialization and electrification of non-OECD economies, notably China. The 2002-
2012 decade recorded the largest ever growth of energy consumption in volume terms
over any ten year period, and this is unlikely to be surpassed in our timeframe.
There is expansion across all types of energy, with new energy forms playing an
increasingly significant role. Renewables, shale gas, tight oil and other new fuel sources in
aggregate grow at 6.2% p.a. and contribute 43% of the increment in energy production to
2035.
The International Energy Outlook 2013 by the US Energy Information Administration
(EIA) 58 projects that world energy consumption will grow by 56 percent between 2010
57 BP, Energy Outlook 2035 (January 2014) 58 Energy Information Administration (EIA) 2013, International Energy Outlook 2013 (July 2013)
39
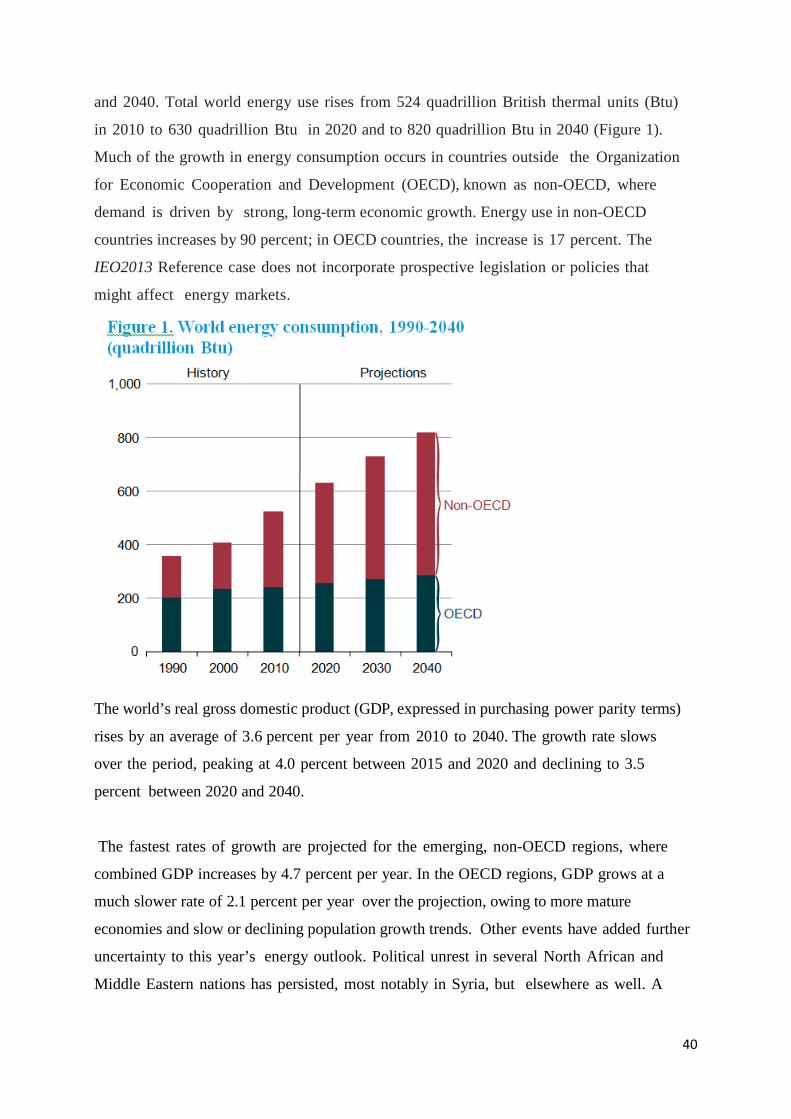
and 2040. Total world energy use rises from 524 quadrillion British thermal units (Btu)
in 2010 to 630 quadrillion Btu in 2020 and to 820 quadrillion Btu in 2040 (Figure 1).
Much of the growth in energy consumption occurs in countries outside the Organization
for Economic Cooperation and Development (OECD), known as non-OECD, where
demand is driven by strong, long-term economic growth. Energy use in non-OECD
countries increases by 90 percent; in OECD countries, the increase is 17 percent. The
IEO2013 Reference case does not incorporate prospective legislation or policies that
might affect energy markets.
The world’s real gross domestic product (GDP, expressed in purchasing power parity terms)
rises by an average of 3.6 percent per year from 2010 to 2040. The growth rate slows
over the period, peaking at 4.0 percent between 2015 and 2020 and declining to 3.5
percent between 2020 and 2040.
The fastest rates of growth are projected for the emerging, non-OECD regions, where
combined GDP increases by 4.7 percent per year. In the OECD regions, GDP grows at a
much slower rate of 2.1 percent per year over the projection, owing to more mature
economies and slow or declining population growth trends. Other events have added further
uncertainty to this year’s energy outlook. Political unrest in several North African and
Middle Eastern nations has persisted, most notably in Syria, but elsewhere as well. A
40
number of the countries that experienced political transition as a result of the Arab Spring
revolutions, including Egypt, Tunisia, and Yemen, have struggled to establish stability. In
addition, the sanctions imposed on Iran as a result of its nuclear program have dampened the
country’s growth outlook.
Economic growth is among the most important factors to be considered in projecting
changes in world energy consumption.
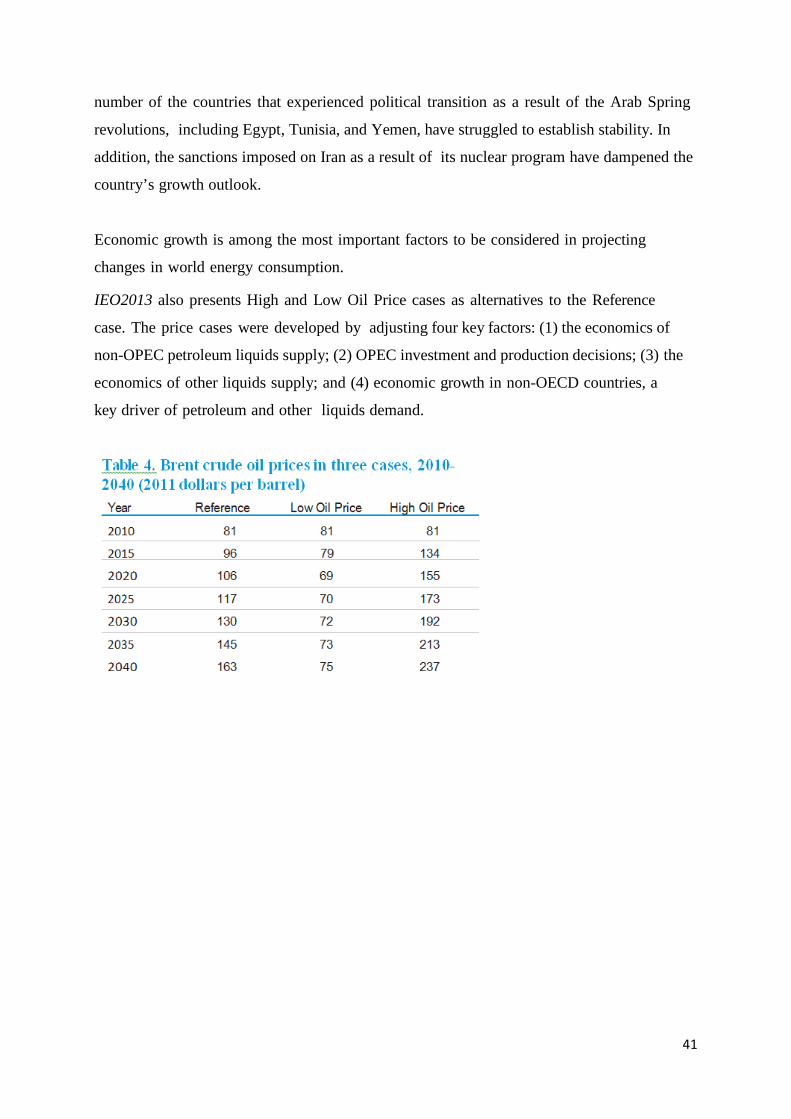
IEO2013 also presents High and Low Oil Price cases as alternatives to the Reference
case. The price cases were developed by adjusting four key factors: (1) the economics of
non-OPEC petroleum liquids supply; (2) OPEC investment and production decisions; (3) the
economics of other liquids supply; and (4) economic growth in non-OECD countries, a
key driver of petroleum and other liquids demand.
41
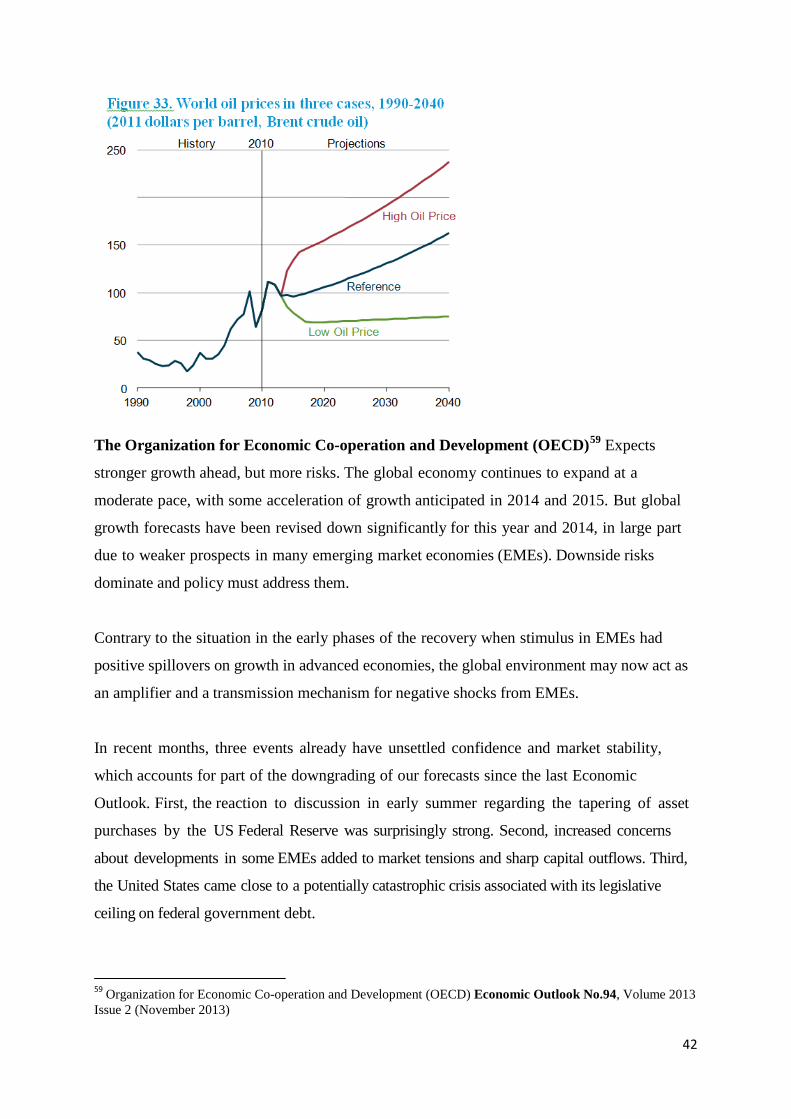
The Organization for Economic Co-operation and Development (OECD)59 Expects
stronger growth ahead, but more risks. The global economy continues to expand at a
moderate pace, with some acceleration of growth anticipated in 2014 and 2015. But global
growth forecasts have been revised down significantly for this year and 2014, in large part
due to weaker prospects in many emerging market economies (EMEs). Downside risks
dominate and policy must address them.
Contrary to the situation in the early phases of the recovery when stimulus in EMEs had
positive spillovers on growth in advanced economies, the global environment may now act as
an amplifier and a transmission mechanism for negative shocks from EMEs.
In recent months, three events already have unsettled confidence and market stability,
which accounts for part of the downgrading of our forecasts since the last Economic
Outlook. First, the reaction to discussion in early summer regarding the tapering of asset
purchases by the US Federal Reserve was surprisingly strong. Second, increased concerns
about developments in some EMEs added to market tensions and sharp capital outflows. Third,
the United States came close to a potentially catastrophic crisis associated with its legislative
ceiling on federal government debt.
59 Organization for Economic Co-operation and Development (OECD) Economic Outlook No.94, Volume 2013 Issue 2 (November 2013)
42
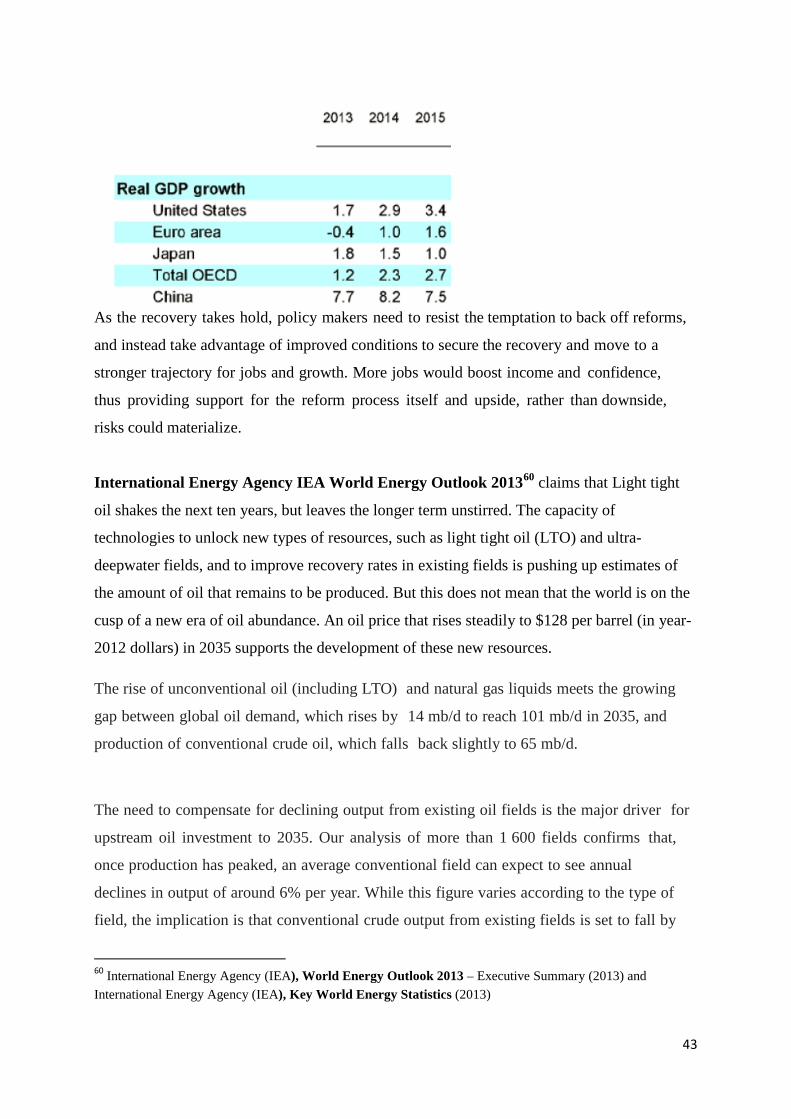
As the recovery takes hold, policy makers need to resist the temptation to back off reforms,
and instead take advantage of improved conditions to secure the recovery and move to a
stronger trajectory for jobs and growth. More jobs would boost income and confidence,
thus providing support for the reform process itself and upside, rather than downside,
risks could materialize.
International Energy Agency IEA World Energy Outlook 201360 claims that Light tight
oil shakes the next ten years, but leaves the longer term unstirred. The capacity of
technologies to unlock new types of resources, such as light tight oil (LTO) and ultra-
deepwater fields, and to improve recovery rates in existing fields is pushing up estimates of
the amount of oil that remains to be produced. But this does not mean that the world is on the
cusp of a new era of oil abundance. An oil price that rises steadily to $128 per barrel (in year-
2012 dollars) in 2035 supports the development of these new resources.
The rise of unconventional oil (including LTO) and natural gas liquids meets the growing
gap between global oil demand, which rises by 14 mb/d to reach 101 mb/d in 2035, and
production of conventional crude oil, which falls back slightly to 65 mb/d.
The need to compensate for declining output from existing oil fields is the major driver for
upstream oil investment to 2035. Our analysis of more than 1 600 fields confirms that,
once production has peaked, an average conventional field can expect to see annual
declines in output of around 6% per year. While this figure varies according to the type of
field, the implication is that conventional crude output from existing fields is set to fall by
60 International Energy Agency (IEA), World Energy Outlook 2013 – Executive Summary (2013) and International Energy Agency (IEA), Key World Energy Statistics (2013)
43
more than 40 mb/d by 2035. Among the other sources of oil, most unconventional plays
are heavily dependent on continuous drilling to prevent rapid field-level declines. Of the
790 billion barrels of total production required to meet our projections for demand to
2035, more than half is needed just to offset declining production.
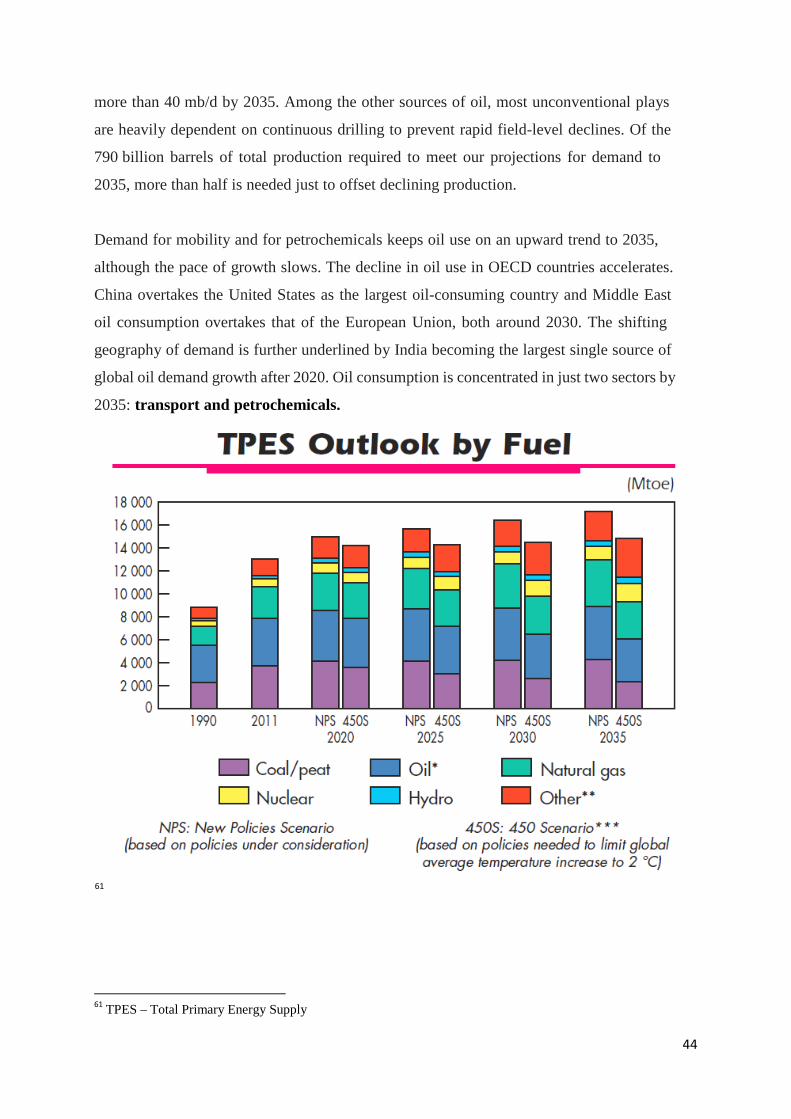
Demand for mobility and for petrochemicals keeps oil use on an upward trend to 2035,
although the pace of growth slows. The decline in oil use in OECD countries accelerates.
China overtakes the United States as the largest oil-consuming country and Middle East
oil consumption overtakes that of the European Union, both around 2030. The shifting
geography of demand is further underlined by India becoming the largest single source of
global oil demand growth after 2020. Oil consumption is concentrated in just two sectors by
2035: transport and petrochemicals.
61
61 TPES – Total Primary Energy Supply
44
International Monetary Fund (IMF) 62 The global activity strengthened during the second
half of 2013, as anticipated in the October 2013 World Economic Outlook (WEO). Activity is
expected to improve further in 2014–15, largely on account of recovery in the advanced
economies. Global growth is now projected to be slightly higher in 2014, at around 3.7
percent, rising to 3.9 percent in 2015, a broadly unchanged outlook from the October 2013
WEO. But downward revisions to growth forecasts in some economies highlight continued
fragilities, and downside risks remain. In advanced economies, output gaps generally remain
large and, given the risks, the monetary policy stance should stay accommodative while fiscal
consolidation continues. In many emerging market and developing economies, stronger
external demand from advanced economies will lift growth, although domestic weaknesses
remain a concern. Some economies may have room for monetary policy support. In many
others, output is close to potential, suggesting that growth declines partly reflect structural
factors or a cyclical cooling and that the main policy approach for raising growth must be to
push ahead with structural reform. In some economies, there is a need to manage
vulnerabilities associated with weakening credit quality and larger capital outflows.
Risks to activity associated with very low inflation in advanced economies, especially
the euro area, have come to the fore. With inflation likely to remain below target for
some time, longer-term inflation expectations might drift down. This raises the risks of
lower-than-expected inflation, which increases real debt burdens, and of premature real
interest rate increases, as monetary policy is constrained in lowering nominal interest
rates. It also raises the likelihood of deflation in the event of adverse shocks to activity.
In emerging market economies, increased financial market and capital flow volatility remain
a concern given that the Fed will start tapering in early 2014.Portfolio shifts and some capital
outflows are likely with Fed tapering. When combined with domestic weaknesses, the result
could be sharper capital outflows and exchange rate adjustments.
In advanced economies, it will be critical to avoid a premature withdrawal of monetary policy
accommodation, including in the United States, as output gaps are still large while inflation is
low and fiscal consolidation continues. Stronger growth is needed to complete balance sheet
1.1.1 62 International Monetary Fund (IMF), World Economic Outlook (October 2013) p. xv, 12, 17, 42, 153 & 180 and International Monetary Fund (IMF), World Economic Outlook - Update (January 21, 2014)
45
repair after the crisis and to lower related legacy risks.
European Central Bank (ECB) will need to consider additional measures, such as longer-
term liquidity provision, including targeted lending, would strengthen demand and reduce
financial market fragmentation. Repairing bank balance sheets through the Balance Sheet
Assessment exercise and recapitalizing weak banks and completing the Banking Union.
In emerging market and developing economies, recent developments highlight the need
to manage the risks of potential capital flow reversals. Economies with domestic
weaknesses and partly related external current account deficits appear particularly exposed.
Exchange rates should be allowed to depreciate in response to deteriorating external
funding conditions.
Policymakers might need to consider a combination of tightening macroeconomic policies
and stronger regulatory and supervisory policy efforts. In China, the recent rebound
highlights that investment remains the key driver in growth dynamics. More progress is
required on rebalancing domestic demand from investment to consumption to effectively
contain the risks to growth and financial stability from overinvestment.
Figure 1.13. Real GDP Projections: Past and Current
An assessment of past WEO forecasts reveals that those made in September 2008, just before the Lehman failure, have proved too optimistic for all economies; the forecasts that came soon afterward, in April 2009, were too pessimistic for the emerging market economies in Asia, Latin America, and sub-Saharan Africa. During October 2010–October 2011, forecasts settled broadly around their current profile, with two notable exceptions. First, the euro area fell into a crisis, which started with Greece in spring 2010 and broadened in 2011. Second, after forecast upgrades during 2010, emerging market economies experienced serial growth disappointments.
Real GDP, Percent of Precrisis Trend (2008 = 100)
Source: IMF staff estimates. Note: Precrisis trend is defined as the geometric average of real GDP level growth between 1996 and 2006.
46
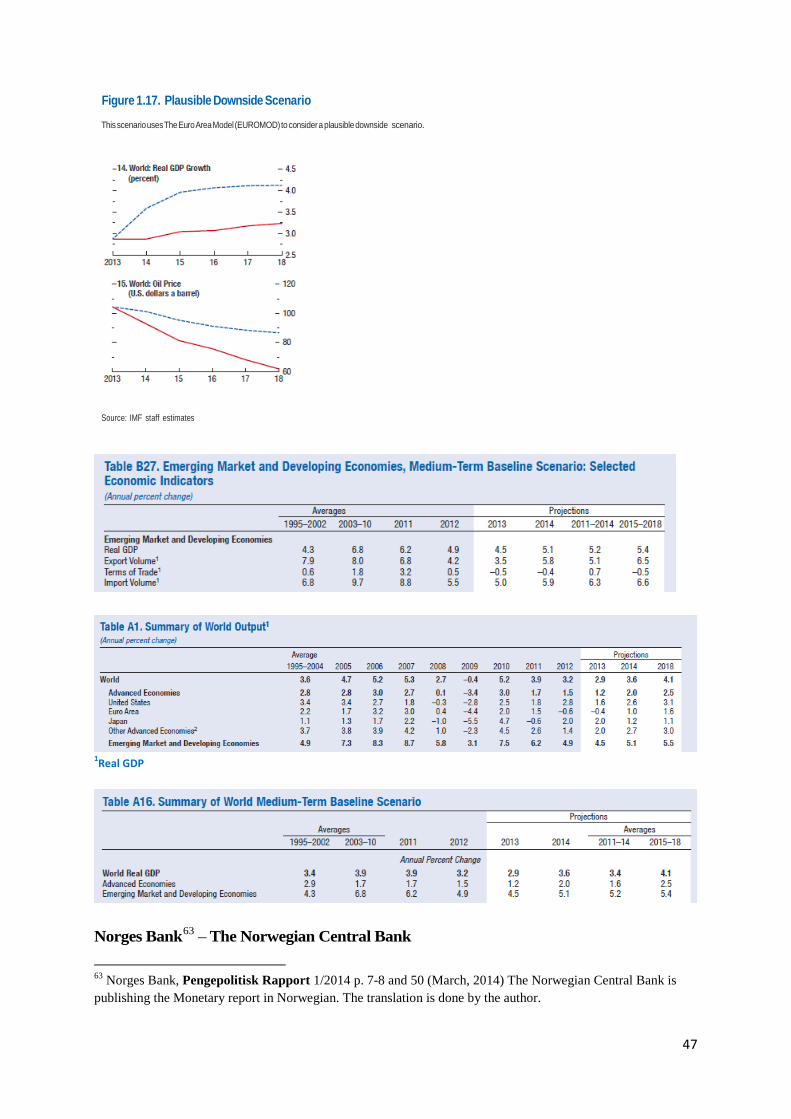
Figure 1.17. Plausible Downside Scenario This scenario uses The Euro Area Model (EUROMOD) to consider a plausible downside scenario.
Source: IMF staff estimates
1Real GDP
Norges Bank63 – The Norwegian Central Bank
63 Norges Bank, Pengepolitisk Rapport 1/2014 p. 7-8 and 50 (March, 2014) The Norwegian Central Bank is publishing the Monetary report in Norwegian. The translation is done by the author.
47
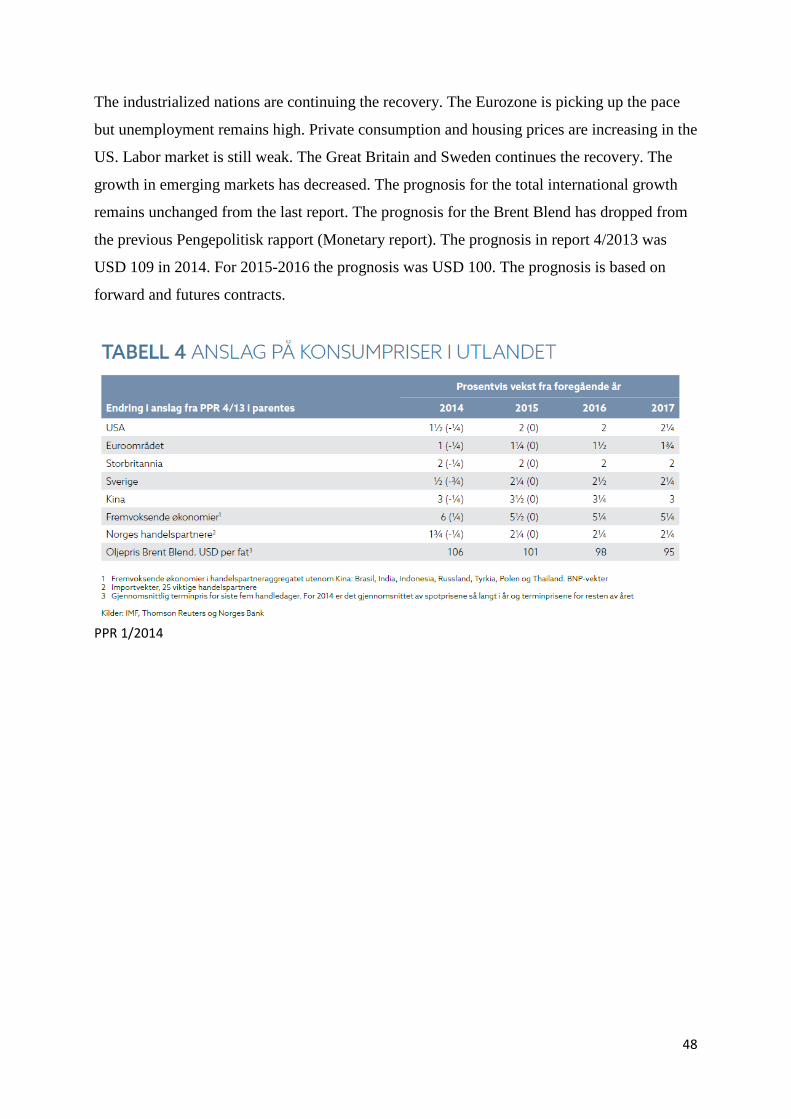
The industrialized nations are continuing the recovery. The Eurozone is picking up the pace
but unemployment remains high. Private consumption and housing prices are increasing in the
US. Labor market is still weak. The Great Britain and Sweden continues the recovery. The
growth in emerging markets has decreased. The prognosis for the total international growth
remains unchanged from the last report. The prognosis for the Brent Blend has dropped from
the previous Pengepolitisk rapport (Monetary report). The prognosis in report 4/2013 was
USD 109 in 2014. For 2015-2016 the prognosis was USD 100. The prognosis is based on
forward and futures contracts.
PPR 1/2014
48
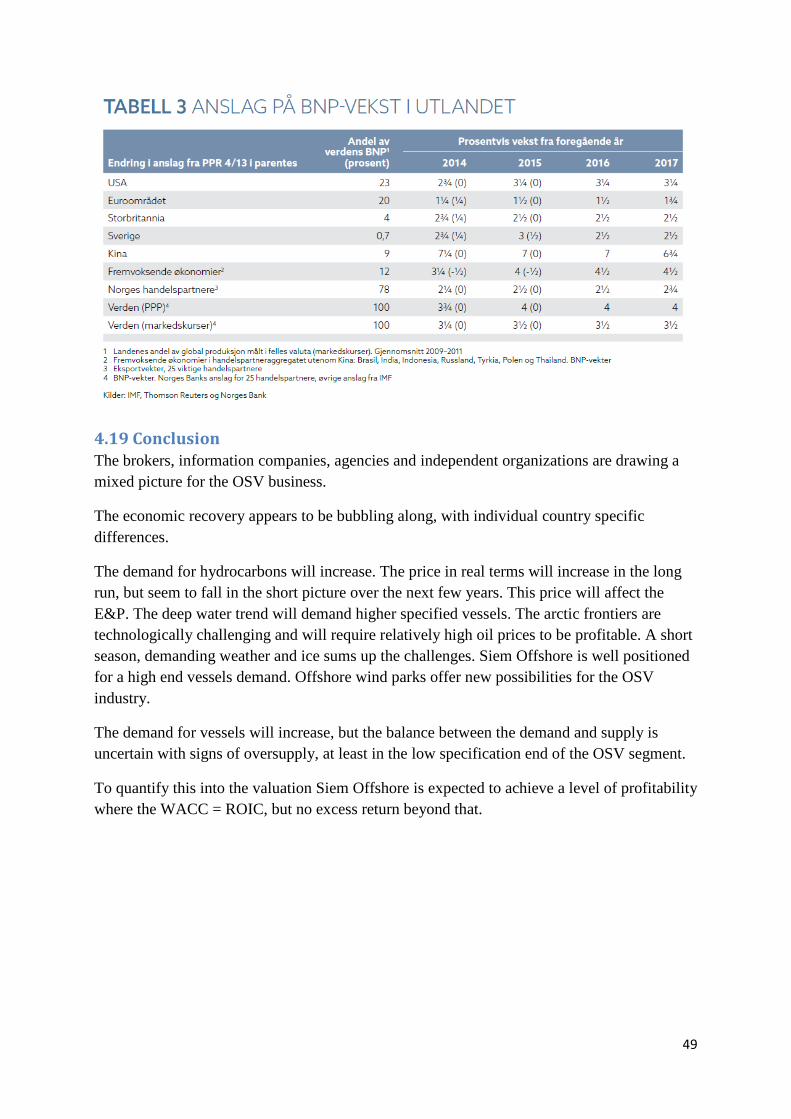
4.19 Conclusion The brokers, information companies, agencies and independent organizations are drawing a mixed picture for the OSV business.
The economic recovery appears to be bubbling along, with individual country specific differences.
The demand for hydrocarbons will increase. The price in real terms will increase in the long run, but seem to fall in the short picture over the next few years. This price will affect the E&P. The deep water trend will demand higher specified vessels. The arctic frontiers are technologically challenging and will require relatively high oil prices to be profitable. A short season, demanding weather and ice sums up the challenges. Siem Offshore is well positioned for a high end vessels demand. Offshore wind parks offer new possibilities for the OSV industry.
The demand for vessels will increase, but the balance between the demand and supply is uncertain with signs of oversupply, at least in the low specification end of the OSV segment.
To quantify this into the valuation Siem Offshore is expected to achieve a level of profitability where the WACC = ROIC, but no excess return beyond that.
49
5 Financial Statement – Reformulated balance sheet and P&L
5.1 Income statement The income statement is regrouped according to the lectures in valuation64 at UiS and
Damodaran65 with a focus on measuring cash flows. In addition it is influenced by the
remarks below.
5.2 Extraordinary items and Recurring vs. Non-recurring bookings Gjesdal66 emphasize the distinction between operating and non-operating items. He argues
that deferred tax is non-interest bearing and actually not debt at all. There is a trend towards
cost items more often being posted as extraordinary, than revenue items. In valuation it is
important to separate temporary or extraordinary items, from more permanent elements.
Earnings power is referring to normal earnings. Gain on sales should mainly be classified as
extraordinary.
Knivsflaa67 states that a normal result form the basis for pro forma income predictions. Gain
or loss from sales of assets, are usually non-recurring, and extraordinary. Knivsflaa is using
the term “unusual gain or loss” when describing postings regarding sale of assets as non-
recurring, and even more so if the bookings are seldom and especially if the amounts are
relatively deviating.
Hedging of currency – loss and gain – is included because the revenue itself goes into the
profit and loss statement.
One can question whether gain and loss of assets at SIOFF is recurring or nonrecurring.
Finally it is the judgment of the analyst’s that determines whether an item is normal or
abnormal. Several bookings are in reality a mix of recurring and nonrecurring items. An
instable trend makes predictions difficult.
The Damodaran68 view is that gain or loss that seems to recur at regular intervals may really
be ordinary. If the volatility in the size of the bookings is large the items may be normalized
1.1.2 64 MØA370 Valuation Fall term 2013 Instructor: Bernt Arne Ødegaard at UiS http://dl.dropboxusercontent.com/u/8078351/teach/moa370_2013/index.html
65 Damodaran, A. (2006) Damodaran on Valuation. 2nd ed. New Jersey, John Wiley & Sons, Inc. p. 79 -116 66 Gjesdal, F. (2007) Regnskapsanalyse: Omgruppering av regnskapet for eierkontroll og verdsettelse. Praktisk Økonomi & Finans (2/2007) p. 3-16 67 Rekneskapsanalyse og verdivurdering BUS 440 Professor Kjell Henry Knivsflå at NHH Lecture 04-42 to 04-47 http://course.nhh.no/master/BUS440/ 68 Damodaran, A. (2012) Investment Valuation. 3rd ed. New Jersey, John Wiley & Sons, Inc. p. 43 and 243
50

over time. If currency translations are recurring every year with different signs it may be
ignored for the purpose of measuring cash flows.
Siem Offshore reports both gain and loss from sale of assets in the income statement, not only
the gain. It seems to be recurring every year and these bookings will therefore be included in
the operating income in this thesis. Even though the bookings may be noisy on an individual
year basis, it could distort the picture to remove the items. Normalization or aggregation could
be justified. Aggregation will be used in the growth section.
5.3 Balance sheet The reformulated balance sheet is based on the basic principle of separating operating assets
and liabilities from financial assets. The operating assets and liabilities are used in the
business towards customers. The financial assets and liabilities are used to finance the
business69.
5.4 Accounting Measures of Risk
5.4.1 Financial ratios The financial ratios below are used to measure profitability, risk and leverage. The specific
ratios, and variations of ratios, will also be used to estimate two synthetic ratings. One is
based on Damodaran’s Interest coverage ratio, and the other on Knivsflaa’s rating based on 4
ratios. As Siem Offshore is not rated by any of the big, recognized rating agencies, these
synthetic ratings will be used to estimate the default risk in the company, and the
accompanying default spread. This spread will be added on to the riskless interest rate to find
the cost of debt.
Current ratio70 71 measures short term liquidity risk;
Current ratio = Current assets / Current liabilities
69 Penman, S.H. (2013) Financial Statement Analysis and Security Valuation. 5thed. New York, McGraw-Hill Companies, Inc.p.241,295 70 Damodaran, A. (2012) Investment Valuation. 3rd ed. New Jersey, John Wiley & Sons, Inc. p.44,48-50, 52, 218,219, 230 71 Penman, S.H., (2013) Financial Statement Analysis and Security Valuation. 5thed. New Yord, McGraw-Hill Companies, Inc. p. 39,318,685,686,716
51
This ratio is traditionally expected to be more than 2, but Damodaran points out the trade-off
between minimizing liquidity risk and tying up an increasing amount of cash in net working
capital. (Net working capital=Current assets – Current liabilities). Knivsflaa72 is comparing
the ratios to the industry for calibration. The current ratio on Oslo Stock Exchange has been
1,527 in the period 1999-2012. Sector ratios; Industry 1.692, Offshore 1.73, Shipping 1.508,
Siem Offshore is classified by CIGS Oil &Gas, Equipment & Services and has had a current
ratio between 1,235 and 1,989 the last 5 years.73
Interest coverage ratio is a solvency flow measure. It measures the capacity to meet interest
payments in the long run;
Interest coverage ratio = EBIT / Interest expenses
Penman uses net interest expense in the denominator. Damodaran is using pre-tax in both the
numerator and the denominator. Koller et al. are using EBITA, EBITDA or EBITDAR
(includes rental expenses) in the numerator74.
Knivsflå is using an after tax ratio, but he points out that if the tax rate on income is about the
same as the one for financials, the ratio will be about the same post-tax, as well as pre-tax .
This is not the case for Siem Offshore. The tax rate for SIOFF on income is estimated to 14
%, and the tax on financials is reported by SIOFF to be 28 % (27 % for 2014 onwards). The
latter reported tax rate is taken for granted as it is in line with the external information about
tax deductions75.
Knivsflaa is using a slightly modified version of the above formula. The pre-tax version calls
for EBIT + Financial income in the numerator and Financial expenses in the denominator.
The post-tax version corrects Altinn76 recommends a ratio above 3. The OSE average for the
period 1999-2012 is 1,908. The ratio for the industrial sector is 1,800 and 1,408 for offshore
and 2,144 for shipping. Siem Offshore ranges from 0,711-2,066 using Damodaran for low cap
72 Rekneskapsanalyse og verdivurdering BUS 440 Professor Kjell Henry Knivsflå at NHH http://course.nhh.no/master/BUS440/ Lecture 8 p.30-75 lecture 11 p. 23 73 Rekneskapsanalyse og verdivurdering BUS 440 Professor Kjell Henry Knivsflå at NHH http://course.nhh.no/master/BUS440/ Lecture 8 p. 30,39,58 and 61 74 Koller, T., Goedhart, M. & Wessels, D. (2010) Valuation, Measuring and Managing the Value of Companies. 5th ed. New Jersey, John Wiley & Sons, Inc. p. 178-179 75 KPMG Law (2013) Tax Facts Norway 2013 A survey of the Norwegian Tax System p.29 and Lov om skatt av formue og inntekt (skatteloven) http://lovdata.no/dokument/NL/lov/1999-03-26-14/*#* 76 Altinn Beregning av økonmiske nøkkeltall http://webcache.googleusercontent.com/search?q=cache:QzlrL6G0eZwJ:https://www.altinn.no/Global/Starte%2520og%2520drive%2520bedrift/Dokumentmaler/Nokkeltall.doc+&cd=1&hl=no&ct=clnk&gl=no
52
firms (0,711-2,908 disregarding one outlier), and from 0,904 – 6,681 using Knivsflaa (0,904 –
2,066 leaving out the same outlier). Siem Offshore is reporting a lower tax rate on income
than for financials. This fact will improve the ratio. The tax rates are discussed in the tax-
section below.
The equity to total assets ratio measures the long term solvency and default risk. The equity
ratio may be looked at as a buffer to handle/resist/survive/withstand future losses. Indirectly it
also shows the ability to pay back principal on outstanding debt. Knivsflaa seems to use the
book values;
Equity ratio = Total equity / Total assets
Penman and Damodaran looks at the opposite ratio, the debt ratio to total assets. Damodaran
makes an argument for market values, and that the book values are not necessarily the
conservative choice. Siem Offshore can serve as an example, as the market value of equity,
are lower than the book value. He also makes the case that even if the market value of the
debt-ratio are lower than the book value ratios – the cost of capital using book values will be
lower than those calculated on the basis of the market value. In this case the book value is a
less conservative estimate than the market value. Altinn suggest 30 % as a norm, but adds that
it should be as high as possible. The average equity ratio on OSE in the period 1999-2012 is
0,403. The industrial sector average is 0,431. For Offshore the ratio is 0,424 and 0,379 for
shipping. The equity ratio for Siem Offshore using book values range from 0,414 – 0,547 in
the same period.
Return on net operating assets (RNOA). This is the fourth and last ratio in the Knivsflaa
table. RNOA is according to Knivsflaa also referred to as Return on Invested Capital (ROIC).
Penman77 defines RNOA to Operating income divided by average Net Operating Assets
(NOA);
Return on net operating assets (RNOAt) = OIt / 12 (NOAt + NOAt-1)
Penman also defines RNOA as operating income after tax relative to net operating asset. (This
is some of the challenge with financial statements – the lack of standardization or variability
77 Penman, S.H., (2013) Financial Statement Analysis and Security Valuation. 5thed. New Yord, McGraw-Hill Companies, Inc. p. 39, 241,318,686,716
53
in terminology – even in the same book) Operating income is defined as Gross margin less
Operating expenses by Penman. EBIT is the accounting measure of operating income. It is
also commonly referred to as operating profit or recurring profit. Siem Offshore uses
operating profit as EBIT. Net operating asset derives from deducting operating liabilities from
operating assets.
Koller et al78., who has devoted a whole chapter to this specific metric, shows that ROICs
differ by industry, but not by company size. McKinsey have studied the ROIC by industry for
the last 45 years. In the low end we find commodities and regulated industries with a median
ROIC of 5.8 %. In the other end of the scale, Pharmaceutical and Biotechnology, the ROIC is
soaring at 23.5 %. The study also shows that ROIC tend to persist for both high and low
ROIC companies. The longer a company can sustain a ROIC greater than its cost of capital,
the more value it will create. The traditional definition is NOPLAT divided by invested
capital. Koller et al. are now using an after tax ROIC;
ROIC = (1 – Tax Rate) * ((Price per Unit – Cost per Unit) / Invested Capital per Unit).
The Damodaran79 version is; ROIC= EBIT(1-tax) / (BV of debt + BV of equity – Cash). The
denominator reflects the book value of invested capital. In a paper about return
measurements, Damodaran80 explains a shift in corporate finance and valuation towards
“excess return” as a key figure in estimating the value of a business. Earlier focus on growth
as a foundation for value creation has been modified to include excess return. Growth without
excess return creates no value. Excess return equals ROIC - Cost of Capital. In this paper the
numerator is at time t, and the denominator is at time t-1. He also offers a variant of
subtracting goodwill from the denominator for those cases where all the goodwill is
associated with growth assets. This may increase the ROIC markedly. The paper is also
referring to the Mc Kinsey study;
ROIC and Revenue Growth at US Firms: The Mc Kinsey Study
78 Koller, T., Goedhart, M. & Wessels, D. (2010) Valuation, Measuring and Managing the Value of Companies. McKinsey & Company 5th ed. New Jersey, John Wiley & Sons, Inc. p. 58,68,72 79 Damodaran, A. (2012) Investment Valuation. 3rd ed. New Jersey, John Wiley & Sons, Inc. p. 45 80 Damodaran, A. (2007) Return on Capital (ROC), Return on Invested Capital (ROIC) and Return on Equity (ROE): Measurement and Implications. Stern School of Business p.1-11, 37,44,45,59
54
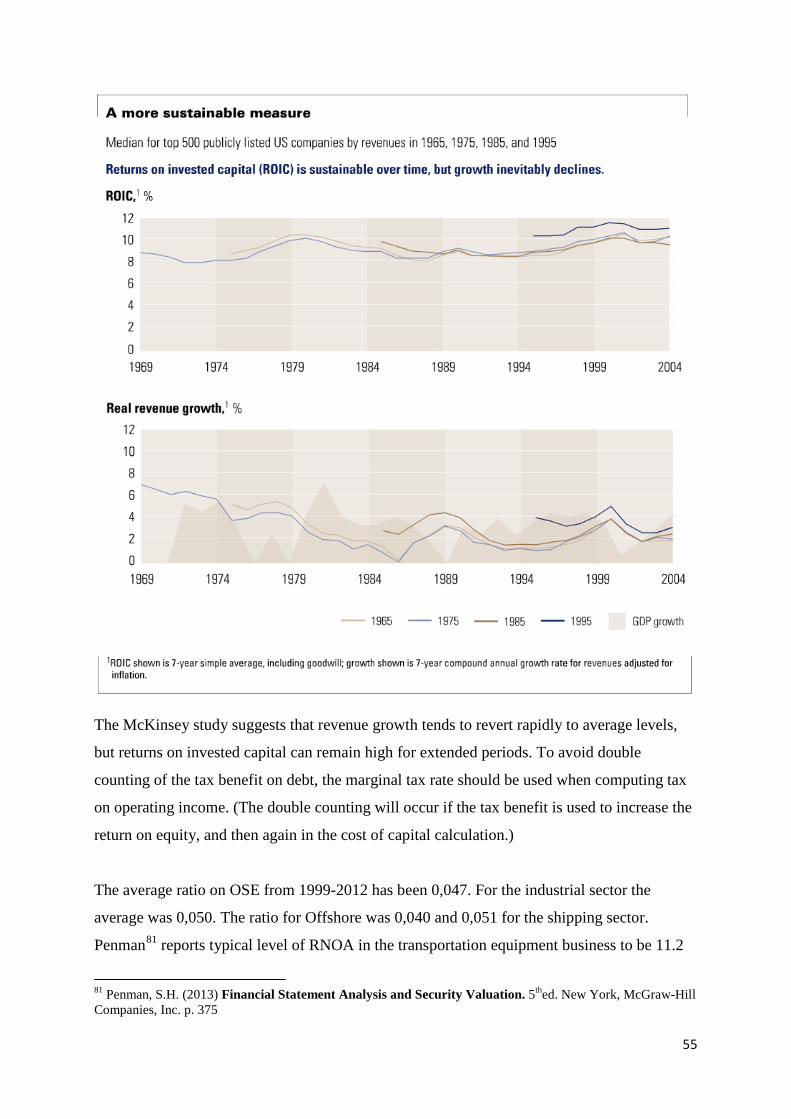
The McKinsey study suggests that revenue growth tends to revert rapidly to average levels,
but returns on invested capital can remain high for extended periods. To avoid double
counting of the tax benefit on debt, the marginal tax rate should be used when computing tax
on operating income. (The double counting will occur if the tax benefit is used to increase the
return on equity, and then again in the cost of capital calculation.)
The average ratio on OSE from 1999-2012 has been 0,047. For the industrial sector the
average was 0,050. The ratio for Offshore was 0,040 and 0,051 for the shipping sector.
Penman81 reports typical level of RNOA in the transportation equipment business to be 11.2
81 Penman, S.H. (2013) Financial Statement Analysis and Security Valuation. 5thed. New York, McGraw-Hill Companies, Inc. p. 375
55
% and shipping 9,1 %. The ratio for Siem Offshore using Knivsflaa for the last 5 years, have
ranged in the interval 0,013-0,089. Looking 3 years back, the range is 0,027-0,042.
5.5 Credit rating The resultant credit rating will be discussed and displayed in the cost of capital section.
5.6 Depreciation82 Most OSV operators depreciate their assets over a period towards a presumed date of sale.
This is typically 15-20 years. The firms estimate a sales price 15 years in the future. This
(very) often presupposes a very moderate impairment in asset value in the period. Lower
depreciation leads to a markedly higher profit than if a “standard” linear depreciation of 30
years were used. The profit in the OSV firms would typically be 30-40 % lower if linear
depreciation over 30 years were implemented. The above procedure is in line with the
recommendations from the Financial Supervisory Authority of Norway (Finanstilsynet). On
the contrary, The Norwegian Society of Financial Analysts (NFF) recommends linear
depreciation over an expected life time of the asset.
Deep Sea Supply (DESSC) and Siem Offshore (SIOFF) depreciate their vessels over the full
life time of the assets.
The Norwegian Society of Financial Analysts (NFF) finds the above principles
counterproductive and asks for them to be amended. They object due to the large fluctuations
in depreciation. Analysts will not get a good estimate of average wear and tear. The balance
will be more correct but this is allegedly less important for investors according to NFF.
SIOFF and DESSC are therefore apparently underperforming on P&L relative to peer group.
This will influence multiples.
5.7 Tax rate and tax regime The effective tax rate is the most widely reported rate in financial statements. Tax credits are
seldom perpetual, and the deferred taxes have to be paid eventually. The marginal tax is the
tax paid on the last dollar of income - the marginal income. This rate depends on the tax code
and country of operation. This paper intended to estimate a marginal tax rate for Siem
82 Norske Finansanalytikeres Forening (NFF) The Norwegian Society of Financial Analysts. NFFs Komite for Finansiell Informasjon, Uttalelse 2013 1. Avskrivninger i Supply (12 Sept 2013)
56
Offshore for use in measuring and calculations. It has proven rather difficult to gain the
required information, necessary83 to estimate the marginal tax rate.
Siem Offshore84 is subject to taxes in several jurisdictions. To calculate the tax provision
requires significant judgment.
The company has estimated a tax rate of 0 % for companies subject to the Norwegian
Tonnage Tax Regime85. Financial income within the regime is taxable at a rate of 28%.
Interest cost is tax deductible at the same rate. The rate is lowered to 27 % from 2014.The
tonnage rates86, the favorable tax deductions for interest expenses in addition to the net wages
arrangements for seamen in Norway is the explanation for the 0 tax estimate for the part of the
fleet being subject to the Norwegian tonnage regime.
For companies not included in the tonnage tax regime Siem Offshore applies at tax rate of 28
%. As it is written in note 1.19 it appears that the 28 % rate applies to the rest of the operation,
all over the world.
The corporate tax rate in Brazil is 34 % according to note 11 in the annual report. I have been
led to believe that I would get some guidance from SIOFF on the tax matter, but recently in an
email87 of 16 May 2014 SIOFF unexpectedly replied that they were unwilling, or unable to
elaborate on the matter of taxation. SIOFF is pointing to the fact that they are noted on OSE
and therefore are not able to give out any information beyond what is stated in the Annual
Reports, or other public reports. That is of course not entirely true as I have seen that some
brokerage firms have information about SIOFF that exceeds what is stated in the annual
reports. SIOFF of course has to oblige with/to the legislation regarding listed firms on Oslo
Stock Exchange.
Siem Offshore is currently under investigation by the Norwegian financial crimes unit,
Økokrim, for alleged tax evasion, or possible tax fraud. This may be one reason for the
cautiousness when my questions came too close to the tax manager of the firm. Several other
OSV operators report revenue by geographical sectors. This would be very helpful in the
effort to estimate a proper tax rate. In the absence of exact information about the marginal
taxes affecting SIOFF I have to turn my attention to other sources.
83 More on effective tax rates http://pages.stern.nyu.edu/~adamodar/New_Home_Page/valquestions/taxrate.htm 84 Siem Offshore Annual report 2012 note 11 and note 1.19 85 Siem Offshore ASA Annual Report 2012, p.36 86 KPMG Law (2013) Tax Facts Norway 2013 A survey of the Norwegian Tax System p.30 87 E-mail of 16 May 2014 See Appendix Fin statement
57
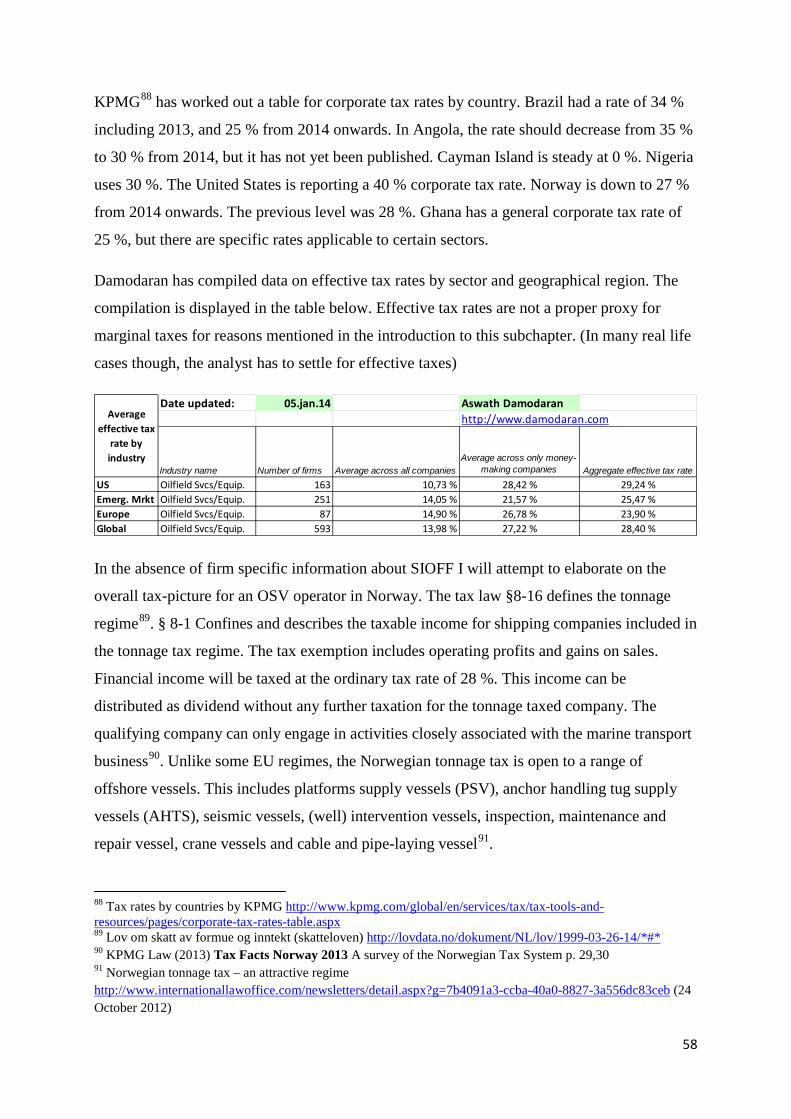
KPMG88 has worked out a table for corporate tax rates by country. Brazil had a rate of 34 %
including 2013, and 25 % from 2014 onwards. In Angola, the rate should decrease from 35 %
to 30 % from 2014, but it has not yet been published. Cayman Island is steady at 0 %. Nigeria
uses 30 %. The United States is reporting a 40 % corporate tax rate. Norway is down to 27 %
from 2014 onwards. The previous level was 28 %. Ghana has a general corporate tax rate of
25 %, but there are specific rates applicable to certain sectors.
Damodaran has compiled data on effective tax rates by sector and geographical region. The
compilation is displayed in the table below. Effective tax rates are not a proper proxy for
marginal taxes for reasons mentioned in the introduction to this subchapter. (In many real life
cases though, the analyst has to settle for effective taxes)
In the absence of firm specific information about SIOFF I will attempt to elaborate on the
overall tax-picture for an OSV operator in Norway. The tax law §8-16 defines the tonnage
regime89. § 8-1 Confines and describes the taxable income for shipping companies included in
the tonnage tax regime. The tax exemption includes operating profits and gains on sales.
Financial income will be taxed at the ordinary tax rate of 28 %. This income can be
distributed as dividend without any further taxation for the tonnage taxed company. The
qualifying company can only engage in activities closely associated with the marine transport
business90. Unlike some EU regimes, the Norwegian tonnage tax is open to a range of
offshore vessels. This includes platforms supply vessels (PSV), anchor handling tug supply
vessels (AHTS), seismic vessels, (well) intervention vessels, inspection, maintenance and
repair vessel, crane vessels and cable and pipe-laying vessel91.
88 Tax rates by countries by KPMG http://www.kpmg.com/global/en/services/tax/tax-tools-and-resources/pages/corporate-tax-rates-table.aspx 89 Lov om skatt av formue og inntekt (skatteloven) http://lovdata.no/dokument/NL/lov/1999-03-26-14/*#* 90 KPMG Law (2013) Tax Facts Norway 2013 A survey of the Norwegian Tax System p. 29,30 91 Norwegian tonnage tax – an attractive regime http://www.internationallawoffice.com/newsletters/detail.aspx?g=7b4091a3-ccba-40a0-8827-3a556dc83ceb (24 October 2012)
Date updated: 05.jan.14 Aswath Damodaranhttp://www.damodaran.com
Industry name Number of firms Average across all companiesAverage across only money-
making companies Aggregate effective tax rateUS Oilfield Svcs/Equip. 163 10,73 % 28,42 % 29,24 %Emerg. Mrkt Oilfield Svcs/Equip. 251 14,05 % 21,57 % 25,47 %Europe Oilfield Svcs/Equip. 87 14,90 % 26,78 % 23,90 %Global Oilfield Svcs/Equip. 593 13,98 % 27,22 % 28,40 %
Average effective tax
rate by industry
58
This means that the entire SIOFF fleet and the associated administration is eligible for tax
exemption based on Norwegian jurisdiction. The actual tax will depend on the jurisdiction in
the region of the operation of each individual vessel. Glenn Pettersen at SIOFF claims that
most of their fleet is subject to the Norwegian tonnage regime92. He is not able, or willing, to
quantify the term “most” into a number or ratio. Unfortunately the annual report for SIOFF
does not specify revenue by geographical region. This makes it difficult for the stakeholders
to get e clear picture of the taxation of SIOFF’s operations. SIOFF’s reply to the question
about marginal tax rates is that tax rates will not be determining for the valuation of SIOFF93.
This contradicts, among else Damodaran94, that stresses the importance of at least adjusting
the taxes towards the marginal tax rate over time so that the tax rate used in perpetuity to
compute the terminal value is the marginal tax rate
Effective tax rate for SIOFF, measured by aggregating taxes for the last 6 years, divided by
the aggregated operating income (EBIT) in the same period, results in a rate of 1.5 %. The
same exercise over the last 7 years yields an effective tax rate of 4.5 %. The effective tax rate
in the Global Oilfield Service and Equipment sector based on 593 firms yields an average of
14 % effective tax rate.
Given that SIOFF claims that an unquantified “most of their fleet”, are subject to the
Norwegian tonnage tax regime together with applied tax rate of 28 % for the rest of the
operation the Global effective tax rate can serve as a best estimate and a proxy for the
marginal tax rate. In SIOFF’s own application this would fit with 50 % of the taxable income
being subject to the Norwegian tonnage tax regime, and 50 % not included in this regime.
This is more restrictive than SIOFF’s claim that “most of their fleet” is being subject to an
estimated tax rate of 0 %, and also more restrictive than the reported effective taxes.
The accusations and the ongoing investigation by the Norwegian financial crimes unit
regarding tax evasions calls for cautiousness about the reported figures. SIOFF’s apparent
ambitions for growth, and the fact that SIOFF is already now being an international player,
makes it more believable and probable that the effective tax rate should converge towards the
global sector average over time.
92 E-mail of 16 May 2014 See Appendix Fin statement 93 E-mail of 16 May 2014 See Appendix Fin statement 94 More on effective tax rates http://pages.stern.nyu.edu/~adamodar/New_Home_Page/valquestions/taxrate.htm
59
Another point to evaluate is the favorable Norwegian tonnage tax regime. There is no
guarantee that this so called “competitive” regime will last in the long run. And in terminal
value calculations, it is the rates in the long term that are the determinants for value. On the
other side, the picture towards globalization is mixed with increased protectionism and
demand for local content in some regions of the OSV market. This may give a longer life
expectancy for special tax regimes as well.
The chosen proxy rate of 14 % is still not a theoretically correct marginal tax rate, but it is the
best estimate and will be used for further calculations in this paper.
6 Valuation and Valuation Models95 Why Value Value96?
Investors expect that the value of each investment will grow sufficiently to compensate for the
risk taken. According to a growing body of research, companies that maximize value for their
shareholders in the long term will create more employment, threat their employee’s better,
increase customer satisfaction, takes on a greater burden of corporate responsibility than
shortsighted rivals. Value focused companies also ensures efficient use of capital, human
capital and natural resources. Knowledge of how companies create value and how to measure
it are vital tools in a market economy. Confusion around which investments create value and
how to measure it, has led to value-destroying investments ending up in crisis.
Efficient Market Hypothesis (EMH)
The strong form of the efficient market hypothesis - implies that public and inside information
- are embedded in a traded security. Major test results are not supportive of the strong form of
EMH. The semistrong form of EMH maintains that all public information is impounded into
the value of a security. Fundamental analysis would not work under this assumption. This
form of EMH appears to be generally valid, but exceptions can be noted. It is fundamental
analysis that makes the market efficient and some analysts may have extraordinary insight and
capability. The weak form of EMH suggests that there is no relationship between past and
95 Damodarans books…several/all.., 96 Koller, T., Goedhart, M. & Wessels, D. (2010) Valuation, Measuring and Managing the Value of Companies. 5th ed. p.3-4
60
future prices of securities. This seems to be supported in studies but it does not exclude
fundamental analysis.97
The market price of a stock will reflect the weighted average of the opinion of all analysts.
The individual analysts estimates may differ for two reasons: 1.They could have access to
different amounts of information (although presumably public information is available to all)
or; 2. They could analyze the information differently with regard to its impact on future stock
prices. Arbitrage also enforces the Law of One Price – in a competitive market, if two assets
are equivalent they will tend to have the same market price.98
Bodie et al99 (2011) conclude that markets are generally very efficient, but that rewards to the
especially diligent, intelligent, or creative may in fact be waiting. Empirical evidence both
supports and contradicts EMH. Bubbles appear to depart from an unbiased assessment of
intrinsic value. Are anomalies regarding fundamental analysis unexplained puzzles or merely
a result of data mining? It is still a matter of debate whether anomalies like the P/E effect,
small-firm-in-January effect, the neglected-firm effect, price drift, book-to-market effect and
so on - represent market inefficiency or poorly understood risk premiums.
Damodaran claims that it is possible to make reasonable estimates of value from financial
fundamentals, with error, for most assets. The market price cannot deviate from this value in
the long run. The price we pay for any asset should reflect the cash flow it is expected to
generate. There will always be uncertainty associated with valuations, and some valuations
will be hopelessly wrong in hindsight. The payoff to valuation will actually be the highest
when you are most uncertain about the numbers. It is not how precise a valuation is that
determines its usefulness, but how precise the value is relative to the estimates of other
investors trying to value the same company. Valuation plays a key role in corporate finance,
in mergers and acquisitions, and in portfolio management. Valuation is not an objective
exercise, and any preconceptions and biases the analyst brings to the process will find their
way into the value.
97 Hirt, G.A. & Block, S.B. (2012) Fundamentals of Investment Management. p.237-241 98 Bodie, Z., Merton, R.C., Cleeton, D.L. (2009) Financial Economics 2nd ed.p.209-211 99 Bodie, Z., Kane, A., Marcus, A.J. (2011) Investments and Portfolio Management 9th ed. p.371-402
61
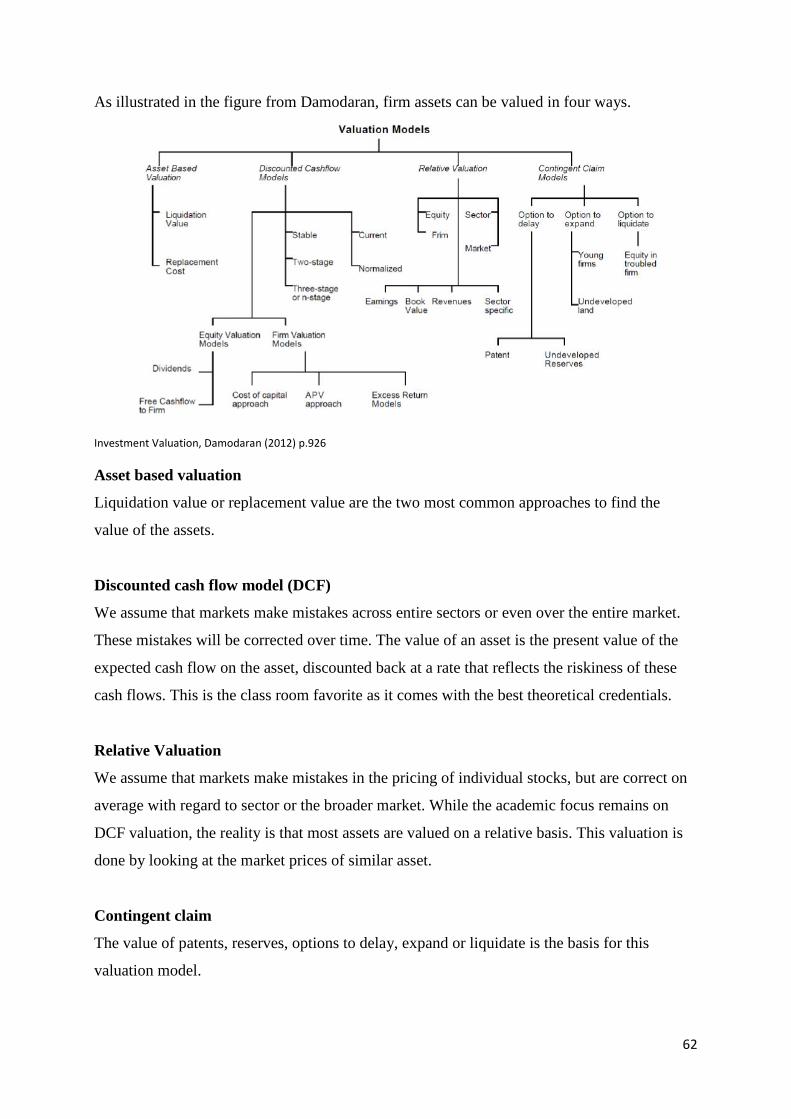
As illustrated in the figure from Damodaran, firm assets can be valued in four ways.
Investment Valuation, Damodaran (2012) p.926
Asset based valuation
Liquidation value or replacement value are the two most common approaches to find the
value of the assets.
Discounted cash flow model (DCF)
We assume that markets make mistakes across entire sectors or even over the entire market.
These mistakes will be corrected over time. The value of an asset is the present value of the
expected cash flow on the asset, discounted back at a rate that reflects the riskiness of these
cash flows. This is the class room favorite as it comes with the best theoretical credentials.
Relative Valuation
We assume that markets make mistakes in the pricing of individual stocks, but are correct on
average with regard to sector or the broader market. While the academic focus remains on
DCF valuation, the reality is that most assets are valued on a relative basis. This valuation is
done by looking at the market prices of similar asset.
Contingent claim
The value of patents, reserves, options to delay, expand or liquidate is the basis for this
valuation model.
62

7 Cost of Capital
7.1 Risk Risk refers to the likelihood of receiving a return on an investment that is different from the
return we expect to make. Damodaran100 uses the Chinese symbol for risk to capture the
definition of risk in finance.
The first symbol means “danger” and the second stands for “opportunity”. Although this may
not be proper Mandarin101, this popular translation makes a nice metaphor of the trade-off
between risk and reward.
There are two types of risk. The first is equity risk from investments with no promised cash
flow, but with an expected cash flow. The second type, default risk arises on investments with
promised cash flow.102 The following chapters will attempt to quantify these risks.
7.2 Cost of Capital Cost of capital is defined as the opportunity cost of all capital invested in an enterprise. The
cost of capital is a weighted average of the cost of the different components of financing, with
weights based on the market value of each component.
Some analysts use the unlevered cost of equity as the cost of capital, following the argument
made by Modigliani and Miller103 about capital structure. The value of a firm should be
independent of the capital structure. This implies that the cost of capital should not be affected
by its debt ratio. (See figure below)
100 Damodaran, A. (2012) Investment Valuation. 3rd ed New Jersey, John Wiley & Sons, Inc. p.59 101 Victor H. Mair (2009) How a misunderstanding about Chinese characters has led many astray Pinyin.info (September 2009) http://www.pinyin.info/chinese/crisis.html 102 Damodaran, A. (2012) Investment Valuation. 3rd ed. New Jersey, John Wiley & Sons, Inc. p.81 103 Miller, M. H. and Modigliani, F. (1958) The Cost of Capital, Corporation Finance and the Theory of Investment. The American Economic Review, Volume XLVIII (June 1958 Number Three) p.23-29
63
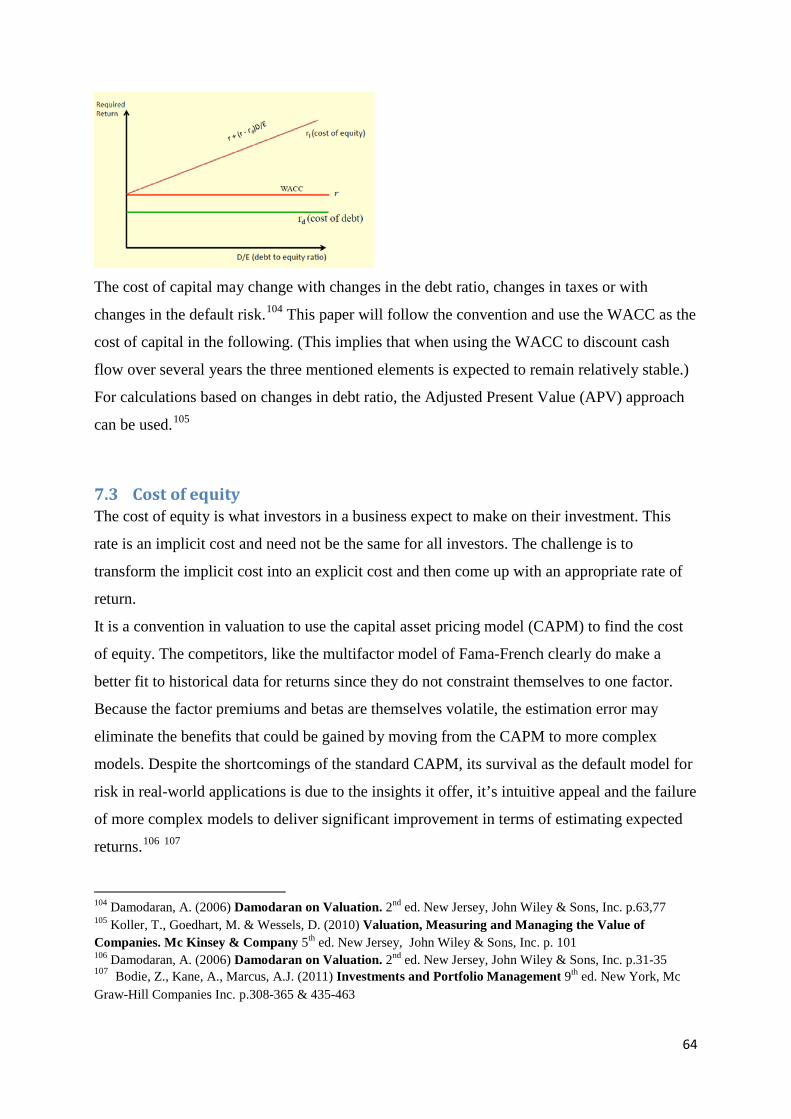
The cost of capital may change with changes in the debt ratio, changes in taxes or with
changes in the default risk.104 This paper will follow the convention and use the WACC as the
cost of capital in the following. (This implies that when using the WACC to discount cash
flow over several years the three mentioned elements is expected to remain relatively stable.)
For calculations based on changes in debt ratio, the Adjusted Present Value (APV) approach
can be used.105
7.3 Cost of equity The cost of equity is what investors in a business expect to make on their investment. This
rate is an implicit cost and need not be the same for all investors. The challenge is to
transform the implicit cost into an explicit cost and then come up with an appropriate rate of
return.
It is a convention in valuation to use the capital asset pricing model (CAPM) to find the cost
of equity. The competitors, like the multifactor model of Fama-French clearly do make a
better fit to historical data for returns since they do not constraint themselves to one factor.
Because the factor premiums and betas are themselves volatile, the estimation error may
eliminate the benefits that could be gained by moving from the CAPM to more complex
models. Despite the shortcomings of the standard CAPM, its survival as the default model for
risk in real-world applications is due to the insights it offer, it’s intuitive appeal and the failure
of more complex models to deliver significant improvement in terms of estimating expected
returns.106 107
104 Damodaran, A. (2006) Damodaran on Valuation. 2nd ed. New Jersey, John Wiley & Sons, Inc. p.63,77 105 Koller, T., Goedhart, M. & Wessels, D. (2010) Valuation, Measuring and Managing the Value of Companies. Mc Kinsey & Company 5th ed. New Jersey, John Wiley & Sons, Inc. p. 101 106 Damodaran, A. (2006) Damodaran on Valuation. 2nd ed. New Jersey, John Wiley & Sons, Inc. p.31-35 107 Bodie, Z., Kane, A., Marcus, A.J. (2011) Investments and Portfolio Management 9th ed. New York, Mc Graw-Hill Companies Inc. p.308-365 & 435-463
64
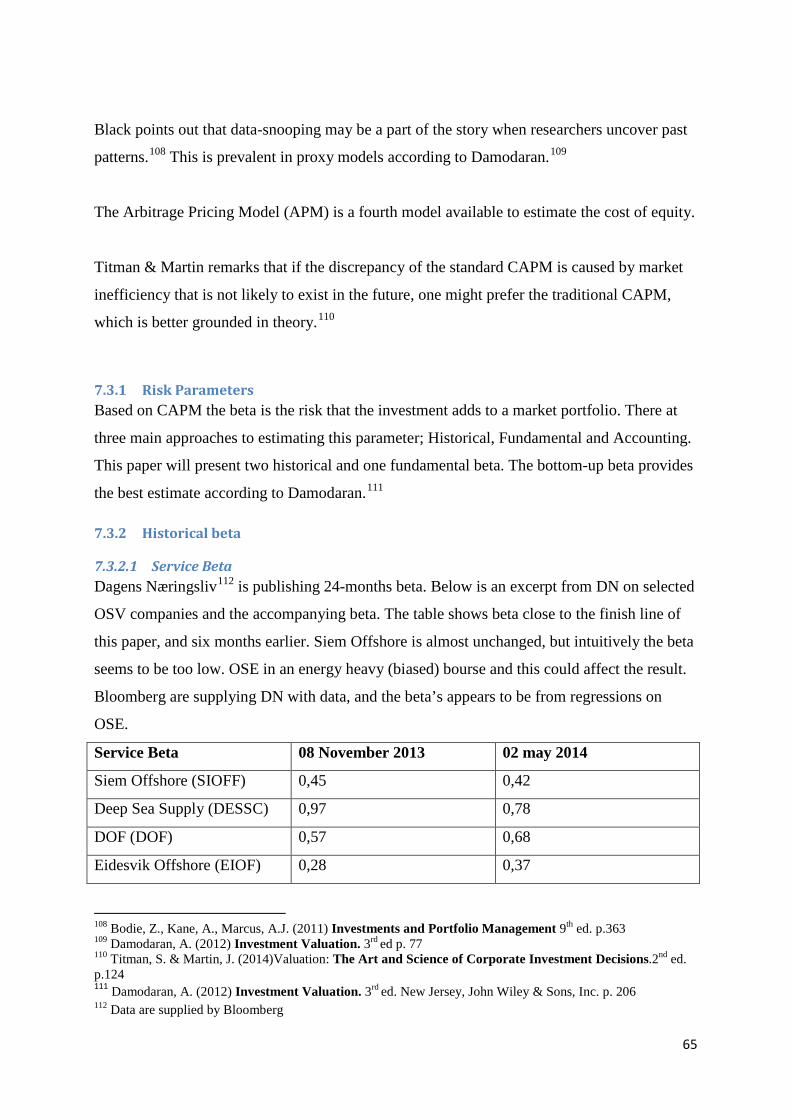
Black points out that data-snooping may be a part of the story when researchers uncover past
patterns.108 This is prevalent in proxy models according to Damodaran.109
The Arbitrage Pricing Model (APM) is a fourth model available to estimate the cost of equity.
Titman & Martin remarks that if the discrepancy of the standard CAPM is caused by market
inefficiency that is not likely to exist in the future, one might prefer the traditional CAPM,
which is better grounded in theory.110
7.3.1 Risk Parameters Based on CAPM the beta is the risk that the investment adds to a market portfolio. There at
three main approaches to estimating this parameter; Historical, Fundamental and Accounting.
This paper will present two historical and one fundamental beta. The bottom-up beta provides
the best estimate according to Damodaran.111
7.3.2 Historical beta
7.3.2.1 Service Beta Dagens Næringsliv112 is publishing 24-months beta. Below is an excerpt from DN on selected
OSV companies and the accompanying beta. The table shows beta close to the finish line of
this paper, and six months earlier. Siem Offshore is almost unchanged, but intuitively the beta
seems to be too low. OSE in an energy heavy (biased) bourse and this could affect the result.
Bloomberg are supplying DN with data, and the beta’s appears to be from regressions on
OSE.
Service Beta 08 November 2013 02 may 2014
Siem Offshore (SIOFF) 0,45 0,42
Deep Sea Supply (DESSC) 0,97 0,78
DOF (DOF) 0,57 0,68
Eidesvik Offshore (EIOF) 0,28 0,37
108 Bodie, Z., Kane, A., Marcus, A.J. (2011) Investments and Portfolio Management 9th ed. p.363 109 Damodaran, A. (2012) Investment Valuation. 3rd ed p. 77 110 Titman, S. & Martin, J. (2014)Valuation: The Art and Science of Corporate Investment Decisions.2nd ed. p.124 111 Damodaran, A. (2012) Investment Valuation. 3rd ed. New Jersey, John Wiley & Sons, Inc. p. 206 112 Data are supplied by Bloomberg
65
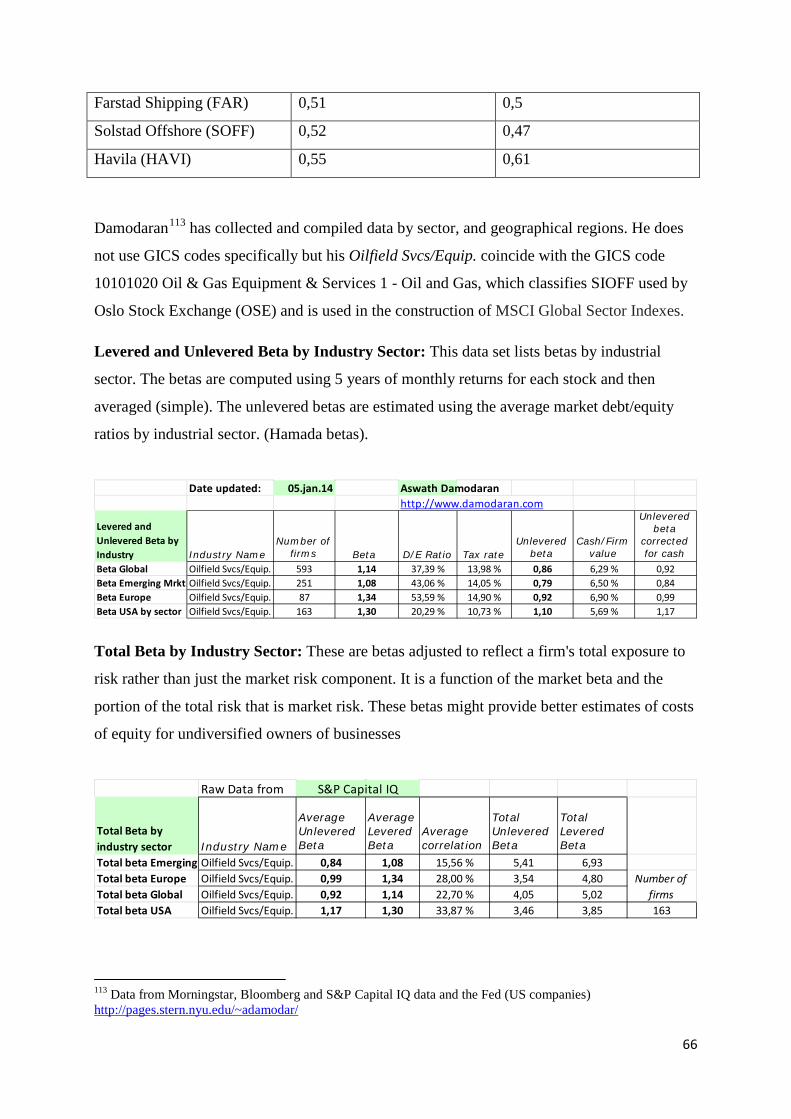
Farstad Shipping (FAR) 0,51 0,5
Solstad Offshore (SOFF) 0,52 0,47
Havila (HAVI) 0,55 0,61
Damodaran113 has collected and compiled data by sector, and geographical regions. He does
not use GICS codes specifically but his Oilfield Svcs/Equip. coincide with the GICS code
10101020 Oil & Gas Equipment & Services 1 - Oil and Gas, which classifies SIOFF used by
Oslo Stock Exchange (OSE) and is used in the construction of MSCI Global Sector Indexes.
Levered and Unlevered Beta by Industry Sector: This data set lists betas by industrial
sector. The betas are computed using 5 years of monthly returns for each stock and then
averaged (simple). The unlevered betas are estimated using the average market debt/equity
ratios by industrial sector. (Hamada betas).
Total Beta by Industry Sector: These are betas adjusted to reflect a firm's total exposure to
risk rather than just the market risk component. It is a function of the market beta and the
portion of the total risk that is market risk. These betas might provide better estimates of costs
of equity for undiversified owners of businesses
113 Data from Morningstar, Bloomberg and S&P Capital IQ data and the Fed (US companies) http://pages.stern.nyu.edu/~adamodar/
Date updated: 05.jan.14 Aswath Damodaranhttp://www.damodaran.com
Levered and Unlevered Beta by Industry Industry Name
Number of firms Beta D/E Ratio Tax rate
Unlevered beta
Cash/Firm value
Unlevered beta
corrected for cash
Beta Global Oilfield Svcs/Equip. 593 1,14 37,39 % 13,98 % 0,86 6,29 % 0,92Beta Emerging Mrkt. Oilfield Svcs/Equip. 251 1,08 43,06 % 14,05 % 0,79 6,50 % 0,84Beta Europe Oilfield Svcs/Equip. 87 1,34 53,59 % 14,90 % 0,92 6,90 % 0,99Beta USA by sector Oilfield Svcs/Equip. 163 1,30 20,29 % 10,73 % 1,10 5,69 % 1,17
Raw Data from
Total Beta by industry sector Industry Name
Average Unlevered Beta
Average Levered Beta
Average correlation
Total Unlevered Beta
Total Levered Beta
Total beta Emerging Oilfield Svcs/Equip. 0,84 1,08 15,56 % 5,41 6,93Total beta Europe Oilfield Svcs/Equip. 0,99 1,34 28,00 % 3,54 4,80Total beta Global Oilfield Svcs/Equip. 0,92 1,14 22,70 % 4,05 5,02Total beta USA Oilfield Svcs/Equip. 1,17 1,30 33,87 % 3,46 3,85 163
S&P Capital IQ
Number of firms
66
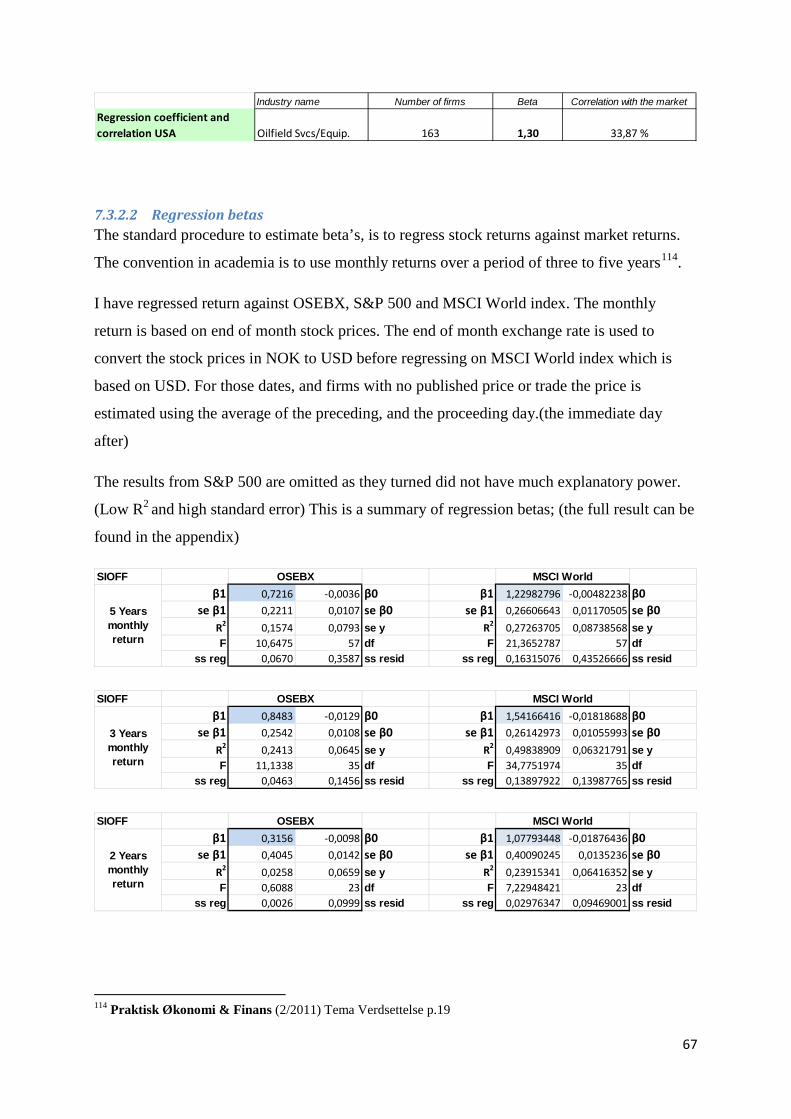
7.3.2.2 Regression betas The standard procedure to estimate beta’s, is to regress stock returns against market returns.
The convention in academia is to use monthly returns over a period of three to five years114.
I have regressed return against OSEBX, S&P 500 and MSCI World index. The monthly
return is based on end of month stock prices. The end of month exchange rate is used to
convert the stock prices in NOK to USD before regressing on MSCI World index which is
based on USD. For those dates, and firms with no published price or trade the price is
estimated using the average of the preceding, and the proceeding day.(the immediate day
after)
The results from S&P 500 are omitted as they turned did not have much explanatory power.
(Low R2 and high standard error) This is a summary of regression betas; (the full result can be
found in the appendix)
114 Praktisk Økonomi & Finans (2/2011) Tema Verdsettelse p.19
Industry name Number of firms Beta Correlation with the marketRegression coefficient and correlation USA Oilfield Svcs/Equip. 163 1,30 33,87 %
SIOFFβ1 0,7216 -0,0036 β0 β1 1,22982796 -0,00482238 β0
se β1 0,2211 0,0107 se β0 se β1 0,26606643 0,01170505 se β0R2 0,1574 0,0793 se y R2 0,27263705 0,08738568 se yF 10,6475 57 df F 21,3652787 57 df
ss reg 0,0670 0,3587 ss resid ss reg 0,16315076 0,43526666 ss resid
OSEBX MSCI World
5 Years monthly return
SIOFFβ1 0,8483 -0,0129 β0 β1 1,54166416 -0,01818688 β0
se β1 0,2542 0,0108 se β0 se β1 0,26142973 0,01055993 se β0R2 0,2413 0,0645 se y R2 0,49838909 0,06321791 se yF 11,1338 35 df F 34,7751974 35 df
ss reg 0,0463 0,1456 ss resid ss reg 0,13897922 0,13987765 ss resid
MSCI WorldOSEBX
3 Years monthly return
SIOFFβ1 0,3156 -0,0098 β0 β1 1,07793448 -0,01876436 β0
se β1 0,4045 0,0142 se β0 se β1 0,40090245 0,0135236 se β0R2 0,0258 0,0659 se y R2 0,23915341 0,06416352 se yF 0,6088 23 df F 7,22948421 23 df
ss reg 0,0026 0,0999 ss resid ss reg 0,02976347 0,09469001 ss resid
2 Years monthly return
MSCI WorldOSEBX
67
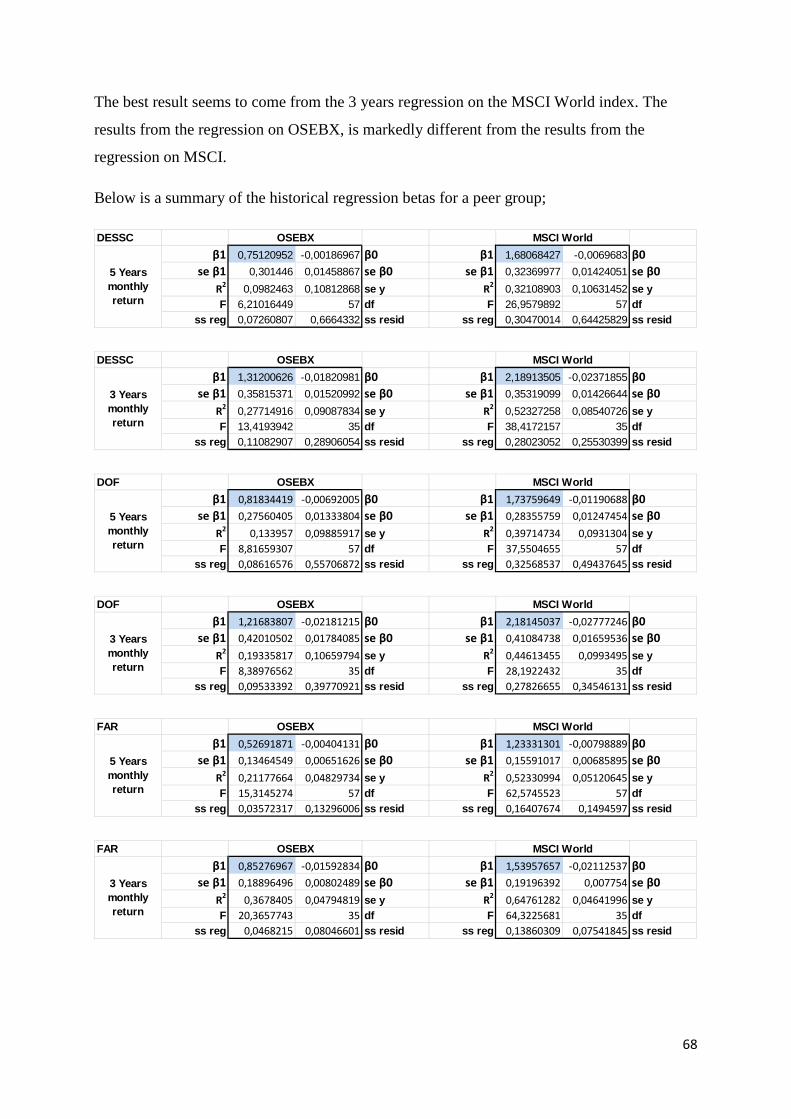
The best result seems to come from the 3 years regression on the MSCI World index. The
results from the regression on OSEBX, is markedly different from the results from the
regression on MSCI.
Below is a summary of the historical regression betas for a peer group;
DESSCβ1 0,75120952 -0,00186967 β0 β1 1,68068427 -0,0069683 β0
se β1 0,301446 0,01458867 se β0 se β1 0,32369977 0,01424051 se β0R2 0,0982463 0,10812868 se y R2 0,32108903 0,10631452 se yF 6,21016449 57 df F 26,9579892 57 df
ss reg 0,07260807 0,6664332 ss resid ss reg 0,30470014 0,64425829 ss resid
5 Years monthly return
OSEBX MSCI World
DESSCβ1 1,31200626 -0,01820981 β0 β1 2,18913505 -0,02371855 β0
se β1 0,35815371 0,01520992 se β0 se β1 0,35319099 0,01426644 se β0R2 0,27714916 0,09087834 se y R2 0,52327258 0,08540726 se yF 13,4193942 35 df F 38,4172157 35 df
ss reg 0,11082907 0,28906054 ss resid ss reg 0,28023052 0,25530399 ss resid
OSEBX MSCI World
3 Years monthly return
DOFβ1 0,81834419 -0,00692005 β0 β1 1,73759649 -0,01190688 β0
se β1 0,27560405 0,01333804 se β0 se β1 0,28355759 0,01247454 se β0R2 0,133957 0,09885917 se y R2 0,39714734 0,0931304 se yF 8,81659307 57 df F 37,5504655 57 df
ss reg 0,08616576 0,55706872 ss resid ss reg 0,32568537 0,49437645 ss resid
OSEBX MSCI World
5 Years monthly return
DOFβ1 1,21683807 -0,02181215 β0 β1 2,18145037 -0,02777246 β0
se β1 0,42010502 0,01784085 se β0 se β1 0,41084738 0,01659536 se β0R2 0,19335817 0,10659794 se y R2 0,44613455 0,0993495 se yF 8,38976562 35 df F 28,1922432 35 df
ss reg 0,09533392 0,39770921 ss resid ss reg 0,27826655 0,34546131 ss resid
OSEBX MSCI World
3 Years monthly return
FARβ1 0,52691871 -0,00404131 β0 β1 1,23331301 -0,00798889 β0
se β1 0,13464549 0,00651626 se β0 se β1 0,15591017 0,00685895 se β0R2 0,21177664 0,04829734 se y R2 0,52330994 0,05120645 se yF 15,3145274 57 df F 62,5745523 57 df
ss reg 0,03572317 0,13296006 ss resid ss reg 0,16407674 0,1494597 ss resid
OSEBX MSCI World
5 Years monthly return
FARβ1 0,85276967 -0,01592834 β0 β1 1,53957657 -0,02112537 β0
se β1 0,18896496 0,00802489 se β0 se β1 0,19196392 0,007754 se β0R2 0,3678405 0,04794819 se y R2 0,64761282 0,04641996 se yF 20,3657743 35 df F 64,3225681 35 df
ss reg 0,0468215 0,08046601 ss resid ss reg 0,13860309 0,07541845 ss resid
OSEBX MSCI World
3 Years monthly return
68
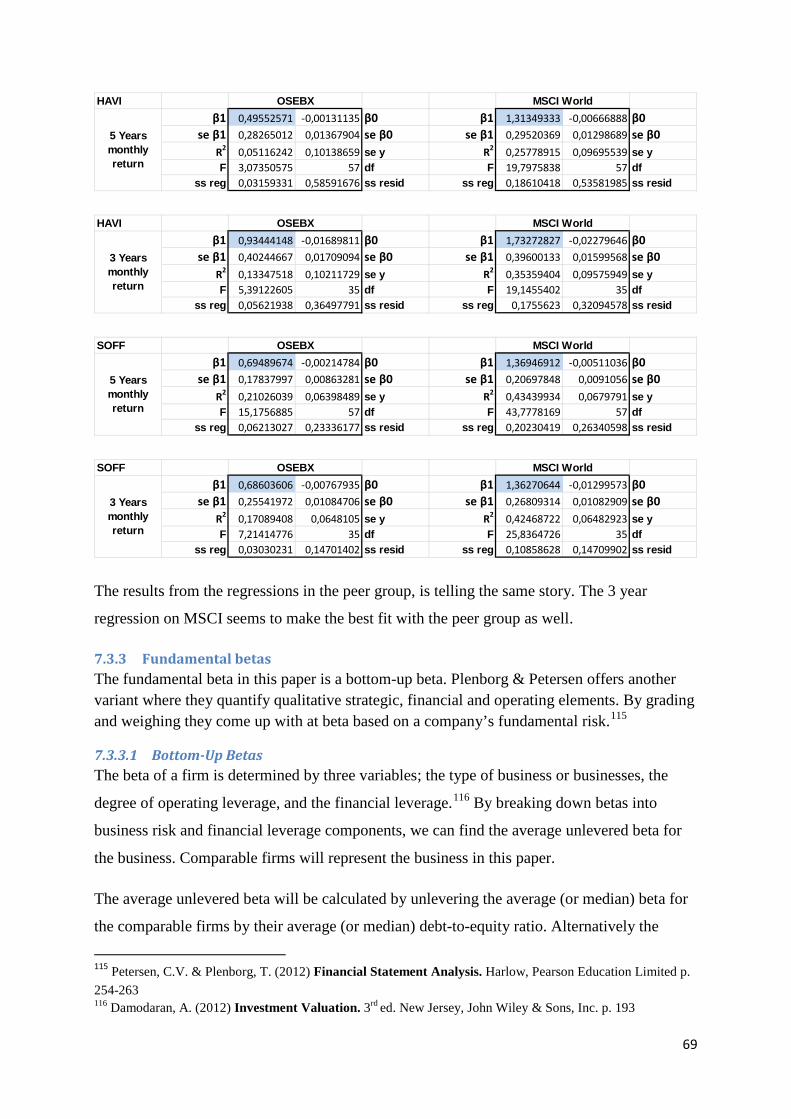
The results from the regressions in the peer group, is telling the same story. The 3 year
regression on MSCI seems to make the best fit with the peer group as well.
7.3.3 Fundamental betas The fundamental beta in this paper is a bottom-up beta. Plenborg & Petersen offers another variant where they quantify qualitative strategic, financial and operating elements. By grading and weighing they come up with at beta based on a company’s fundamental risk.115
7.3.3.1 Bottom-Up Betas The beta of a firm is determined by three variables; the type of business or businesses, the
degree of operating leverage, and the financial leverage.116 By breaking down betas into
business risk and financial leverage components, we can find the average unlevered beta for
the business. Comparable firms will represent the business in this paper.
The average unlevered beta will be calculated by unlevering the average (or median) beta for
the comparable firms by their average (or median) debt-to-equity ratio. Alternatively the
115 Petersen, C.V. & Plenborg, T. (2012) Financial Statement Analysis. Harlow, Pearson Education Limited p. 254-263 116 Damodaran, A. (2012) Investment Valuation. 3rd ed. New Jersey, John Wiley & Sons, Inc. p. 193
HAVIβ1 0,49552571 -0,00131135 β0 β1 1,31349333 -0,00666888 β0
se β1 0,28265012 0,01367904 se β0 se β1 0,29520369 0,01298689 se β0R2 0,05116242 0,10138659 se y R2 0,25778915 0,09695539 se yF 3,07350575 57 df F 19,7975838 57 df
ss reg 0,03159331 0,58591676 ss resid ss reg 0,18610418 0,53581985 ss resid
OSEBX MSCI World
5 Years monthly return
HAVIβ1 0,93444148 -0,01689811 β0 β1 1,73272827 -0,02279646 β0
se β1 0,40244667 0,01709094 se β0 se β1 0,39600133 0,01599568 se β0R2 0,13347518 0,10211729 se y R2 0,35359404 0,09575949 se yF 5,39122605 35 df F 19,1455402 35 df
ss reg 0,05621938 0,36497791 ss resid ss reg 0,1755623 0,32094578 ss resid
OSEBX MSCI World
3 Years monthly return
SOFFβ1 0,69489674 -0,00214784 β0 β1 1,36946912 -0,00511036 β0
se β1 0,17837997 0,00863281 se β0 se β1 0,20697848 0,0091056 se β0R2 0,21026039 0,06398489 se y R2 0,43439934 0,0679791 se yF 15,1756885 57 df F 43,7778169 57 df
ss reg 0,06213027 0,23336177 ss resid ss reg 0,20230419 0,26340598 ss resid
OSEBX MSCI World
5 Years monthly return
SOFFβ1 0,68603606 -0,00767935 β0 β1 1,36270644 -0,01299573 β0
se β1 0,25541972 0,01084706 se β0 se β1 0,26809314 0,01082909 se β0R2 0,17089408 0,0648105 se y R2 0,42468722 0,06482923 se yF 7,21414776 35 df F 25,8364726 35 df
ss reg 0,03030231 0,14701402 ss resid ss reg 0,10858628 0,14709902 ss resid
OSEBX MSCI World
3 Years monthly return
69
average unlevered beta for every firm may be used. Titman & Martin uses the latter method.
Damodaran claims that the compounding of errors is less (pronounced) with the first
approach.
Unlevered beta business =Beta comparable firms / [1 + (1-t) (D/E ratio comparable firms)]
This beta will be relevered using the debt-to-equity ratio for Siem Offshore to get a levered,
equity beta for the cost of capital calculation.
Most corporate debt is thinly traded, if at all. It is therefore customary to use book value of
debt. Titman & Martin117 suggests using the firm’s interest bearing liabilities. This includes
short-term notes payable, the current portion of the long-term debt, plus long term debt.
Petersen & Plenborg118 uses net interest bearing debt (NIBD). NIBD is the difference between
enterprise value and shareholder’s equity. Damodaran119 recommends the use of gross debt.
The focus in this paper will be on the interest bearing debt.
The selected comparable firms are DESSC, DOF, FAR, SOFF, HAVI and SIOFF. Other firms
like EIOF and REM are not include due to illiquidity, despite EIOF being on the OB Match
list. The inclusion of SIOFF is because SIOFF is the best match for SIOFF. Titman &
Martin120 argues that this could be a reason to increase the weight on SIOFF in the
calculation. Damodaran claims that even weights are more appropriate due to the savings in
standard error.121
The Bottom-Up beta calculation for Siem Offshore is displayed below. The calculation is
based on the 3 years beta from the regressions on MSCI World index. The book value at the
year-end 2013 is used for debt, and the market value the 8 of May 2014 is used for equity.
Finally the bottom-up beta is corrected for the long term trend of any stock, towards the
market beta of 1. Bloomberg calls this adjusted beta;
117 Titman, S. & Martin, J. (2014) Valuation: The Art and Science of Corporate Investment Decisions.2nd ed. Harlow, Pearson Education Limited p. 118 118 Petersen, C.V.& Plenborg, T. (2012) Financial Statement Analysis. Harlow, Pearson Education Limited p. 204,210 119 Damodaran, A. (2012) Investment Valuation. 3rd ed. New Jersey, John Wiley & Sons, Inc. p.217,218,220 120 Titman, S. & Martin, J. (2014) Valuation: The Art and Science of Corporate Investment Decisions.2nd ed. Harlow, Pearson Education Limited p. 117 121 Damodaran, A. (2012) Investment Valuation. 3rd ed. New Jersey, John Wiley & Sons, Inc. p. 199
70
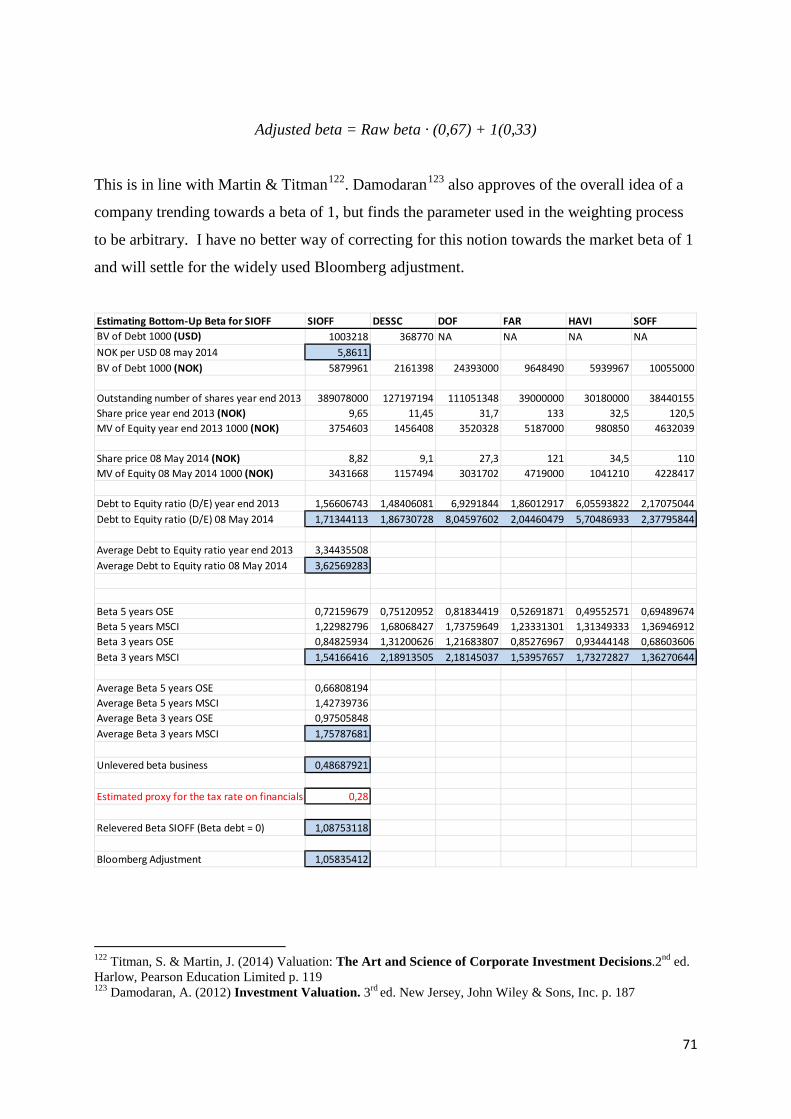
Adjusted beta = Raw beta · (0,67) + 1(0,33)
This is in line with Martin & Titman122. Damodaran123 also approves of the overall idea of a
company trending towards a beta of 1, but finds the parameter used in the weighting process
to be arbitrary. I have no better way of correcting for this notion towards the market beta of 1
and will settle for the widely used Bloomberg adjustment.
122 Titman, S. & Martin, J. (2014) Valuation: The Art and Science of Corporate Investment Decisions.2nd ed. Harlow, Pearson Education Limited p. 119 123 Damodaran, A. (2012) Investment Valuation. 3rd ed. New Jersey, John Wiley & Sons, Inc. p. 187
Estimating Bottom-Up Beta for SIOFF SIOFF DESSC DOF FAR HAVI SOFFBV of Debt 1000 (USD) 1003218 368770 NA NA NA NANOK per USD 08 may 2014 5,8611BV of Debt 1000 (NOK) 5879961 2161398 24393000 9648490 5939967 10055000
Outstanding number of shares year end 2013 389078000 127197194 111051348 39000000 30180000 38440155Share price year end 2013 (NOK) 9,65 11,45 31,7 133 32,5 120,5MV of Equity year end 2013 1000 (NOK) 3754603 1456408 3520328 5187000 980850 4632039
Share price 08 May 2014 (NOK) 8,82 9,1 27,3 121 34,5 110MV of Equity 08 May 2014 1000 (NOK) 3431668 1157494 3031702 4719000 1041210 4228417
Debt to Equity ratio (D/E) year end 2013 1,56606743 1,48406081 6,9291844 1,86012917 6,05593822 2,17075044Debt to Equity ratio (D/E) 08 May 2014 1,71344113 1,86730728 8,04597602 2,04460479 5,70486933 2,37795844
Average Debt to Equity ratio year end 2013 3,34435508Average Debt to Equity ratio 08 May 2014 3,62569283
Beta 5 years OSE 0,72159679 0,75120952 0,81834419 0,52691871 0,49552571 0,69489674Beta 5 years MSCI 1,22982796 1,68068427 1,73759649 1,23331301 1,31349333 1,36946912Beta 3 years OSE 0,84825934 1,31200626 1,21683807 0,85276967 0,93444148 0,68603606Beta 3 years MSCI 1,54166416 2,18913505 2,18145037 1,53957657 1,73272827 1,36270644
Average Beta 5 years OSE 0,66808194Average Beta 5 years MSCI 1,42739736Average Beta 3 years OSE 0,97505848Average Beta 3 years MSCI 1,75787681
Unlevered beta business 0,48687921
Estimated proxy for the tax rate on financials 0,28
Relevered Beta SIOFF (Beta debt = 0) 1,08753118
Bloomberg Adjustment 1,05835412
71
The tax rate for financials is used to estimate the unlevered and the re-levered betas. See the
tax section for the discussion around the two different tax rates used for SIOFF.
This chapter has presented betas for SIOFF in the range from 0.42 – 1.54. The bottom-up beta
is somewhat lower than the global service beta, and slightly above the emerging market beta.
As a revenue breakdown is not possible based on public available information, the beta is not
corrected for country specific risk. One could argue that country risk is diversifiable. The fact
that the bottom-up beta is based on regression against a world index opens for the possibility
that the beta could capture country risk. But according to Damodaran, there is little evidence
that they do in practice.124 The bottom-up beta for SIOFF is within the range of the emerging
market beta and the global beta for the relevant industry sector as displayed in the service beta
section - and thus may be regarded as adjusted for country risk. At the same time it is well
below the sector beta for Europe and the US which is part of the market for SIOFF.
The bottom-up beta for SIOFF ended well below all of the individual betas in the peer group.
This is partly due to the high leverage in DOF and HAVI, relative to their respective betas.
The number of peer’s in the peer group is in the absolute shallow end for making a bottom-up
beta.
Together this calls for an adjustment upwards.
This paper will continue with the bottom-up beta, including the Bloomberg adjustment and an
upward harmonizing to the global average. The beta of 1.09 will be used in the CAPM to
calculate the cost of equity.
7.3.4 Market risk premium The risk premium will be proportional to the average degree of risk aversion of the investor
population and the risk of the market portfolio.125
124 Damodaran, A. (2013) Equity Risk Premiums (ERP): Determinants, Estimation and Implications – The 2013 Edition (March 2013) p. 40-45 125 Bodie, Z., Kane, A., Marcus, A.J. (2011) Investments and Portfolio Management 9th ed. New York, Mc Graw-Hill Companies Inc. p 312-313
72
There are three broad approaches used to estimate equity risk premiums. The first is to survey
investors and managers to sense their expectations (and implied risk aversion). The second is
to look at historical return relative to the riskless return. The third is to calculate the implied
premium on traded assets today. The risk premium is not constant and Wacther linked the risk
premiums in the US to the volatility in GDP growth. The risk premium has been declining as
the result of lower volatility in real economic variables.126
Mehra and Prescott argued that the observed historical risk premium at the time of 6 %, were
too high. A demand for this level of risk premium would require an implausible high constant
relative risk aversion.127
Barro and Ursua on the other hand, estimated that investor would need en equity risk
premium of 7 % to compensate for the 3.6 % disaster probability per year found in their
research. This is based on what they deem to be a reasonable coefficient of relative risk
aversion of 3.5.128
A study performed by PWC and The Norwegian Society of Financial Analysts (NFF) finds
the risk premium in the Norwegian market to be 5.0 %. This study is based on surveys and
implied risk premium. A small firm premium between 0 % - 1 % may be added for firms with
a market value less than 5 billion NOK.129
Fernadez et al. finds the median risk premium for Norway to be 5.5 % in a comprehensive
survey. The median US premium is 5.4 %. This is in line with the PWC study and a small cap
premium (for SIOFF). But the median for developed markets is 6.01 %, Emerging Asia 7,42
%, and the grand total median and average is 7,77 %. This survey asks about the required
equity premium, as opposed to expected equity premium used in most surveys.130 131
126 Damodaran, A. (2013) Equity Risk Premiums (ERP): Determinants, Estimation and Implications – The 2013 Edition (March 2013) p. 8,9, 17 127 Mehra, R. and Prescott, E.C. (1985) The Equity Premium – A Puzzle. Journal of Monetary Economics 15 (1985) p. 145-161 128 Barro, R. and Ursua, J. (2008) Macroeconomic Crisis since 1870 (April 2008) 129PWC and NFF (2012) Risikopremien i det norske markedet 2012 og 2013 (The risk premium in the Norwegian market) p. 9 130 Fernandez et al. (2012) Market risk premium used in 82 countries in 2012: a survey with 7192 answers (Nov. 23 2013) p. 4 131 Table for regional and total risk premium is in the Appendix
73
Although many in the finance profession disagree about how to measure the market risk
premium, Koller et al.132 believe that 4.5 to 5.5 percent is an appropriate range for the market
risk premium.
Dimson et al. infer that investor expect a long run equity premium relative to bill of 3 – 3.5 %
on a geometric mean basis. The equity premium is smaller than was once thought. This study
is based on 111 years of historical equity premiums on their 19-country world index.133
Titman and Martin uses an equity risk premium of 5 % which they claim to be commonly
used in practice.134
Although there are evidence of the risk premium might being both higher and lower, this
thesis will use a risk premium of 6.0 % including an additional small cap premium of 1.0 %.
This includes any illiquidity premium. This rate is also in line with the findings in the
Fernandez survey for developed markets.
In a discounted cash flow (DCF) perspective a low cost of equity, will lower the cost of
capital. This again will lead to a higher valuation of SIOFF. A low risk premium is not
conservative in DCF valuation.
No corrections are made with regard to a specific country or world premium. Several of the
premiums discussed above are on a world basis. So even though a world premium is not
explicitly added, it may be regarded as embedded in the selected risk premium.
7.3.5 The riskless rate The convention is to use the return on 10 year government bonds as a proxy for the riskless
rate. The rate on Norwegian government bonds was 2.81 %, and 2.61 % on US Treasury
notes. Both rates are taken on the 8 of May, with 10 years maturity.
SIOFF is exposed to several currencies and markets both for revenue and loans. SIOFF is
noted on the Oslo Stock exchange, utilizing the Norwegian tonnage regime, Norwegian
132 Koller, T., Goedhart, M. & Wessels, D. (2010) Valuation, Measuring and Managing the Value of Companies. Mc Kinsey & Company 5th ed. New Jersey, John Wiley & Sons, Inc. p. 244-245 133 Dimson, E., Marsh, P., Staunton, M. (2011) Equity Premia Around the World (7 October 2011) p.14, 18, 19 134 Titman, S. & Martin, J. (2014) Valuation: The Art and Science of Corporate Investment Decisions.2nd ed. Harlow, Pearson Education Limited p. 122
74
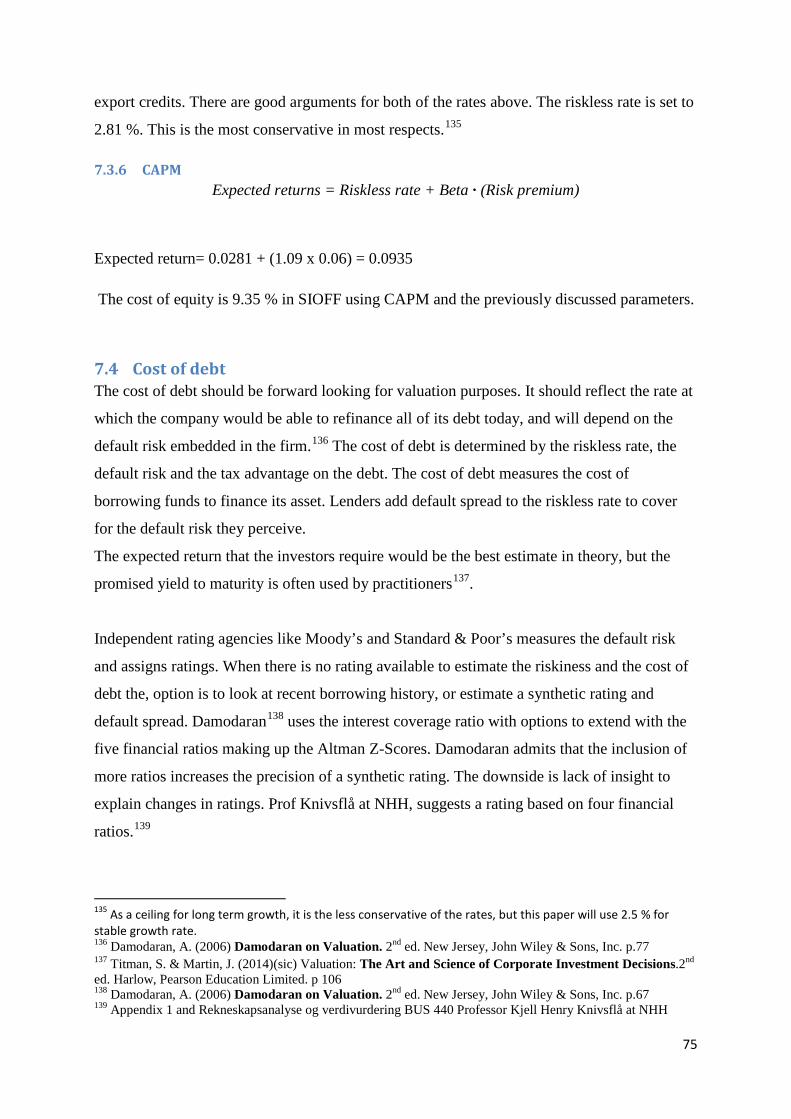
export credits. There are good arguments for both of the rates above. The riskless rate is set to
2.81 %. This is the most conservative in most respects.135
7.3.6 CAPM Expected returns = Riskless rate + Beta · (Risk premium)
Expected return= 0.0281 + (1.09 x 0.06) = 0.0935
The cost of equity is 9.35 % in SIOFF using CAPM and the previously discussed parameters.
7.4 Cost of debt The cost of debt should be forward looking for valuation purposes. It should reflect the rate at
which the company would be able to refinance all of its debt today, and will depend on the
default risk embedded in the firm.136 The cost of debt is determined by the riskless rate, the
default risk and the tax advantage on the debt. The cost of debt measures the cost of
borrowing funds to finance its asset. Lenders add default spread to the riskless rate to cover
for the default risk they perceive.
The expected return that the investors require would be the best estimate in theory, but the
promised yield to maturity is often used by practitioners137.
Independent rating agencies like Moody’s and Standard & Poor’s measures the default risk
and assigns ratings. When there is no rating available to estimate the riskiness and the cost of
debt the, option is to look at recent borrowing history, or estimate a synthetic rating and
default spread. Damodaran138 uses the interest coverage ratio with options to extend with the
five financial ratios making up the Altman Z-Scores. Damodaran admits that the inclusion of
more ratios increases the precision of a synthetic rating. The downside is lack of insight to
explain changes in ratings. Prof Knivsflå at NHH, suggests a rating based on four financial
ratios.139
135 As a ceiling for long term growth, it is the less conservative of the rates, but this paper will use 2.5 % for stable growth rate. 136 Damodaran, A. (2006) Damodaran on Valuation. 2nd ed. New Jersey, John Wiley & Sons, Inc. p.77 137 Titman, S. & Martin, J. (2014)(sic) Valuation: The Art and Science of Corporate Investment Decisions.2nd ed. Harlow, Pearson Education Limited. p 106 138 Damodaran, A. (2006) Damodaran on Valuation. 2nd ed. New Jersey, John Wiley & Sons, Inc. p.67 139 Appendix 1 and Rekneskapsanalyse og verdivurdering BUS 440 Professor Kjell Henry Knivsflå at NHH
75
The after-tax cost of debt should be calculated using the marginal tax rate. Firms mostly
report the effective tax rate. These rates may differ due to tax brackets, different books for tax
and reporting purpose and deferred taxes. Firms may for instance use straight-line
depreciations for reporting purposes an accelerated depreciation for tax purposes. To omit this
obstacle the tax code of the country may be used. Corporations like Siem Offshore, with
global operations will be subject to different tax regimes. The weighted average of the
marginal tax rates, or the rate of the country where the income eventually will return for
taxation, may be used. The third approach is to separate the income based on geographical
regions140.
7.4.1 Traded Loans The forward looking prerequisite (for valuation purposes) limits the use of the numbers from
the financial statement, as these numbers represent historical loan agreements, and do not
necessarily represent refinancing cost today. SIOFF has a 600 Mill NOK bond that is traded
on the Oslo Stock Exchange. It is a 3 months floating rate bond, with a margin on the 3
months NIBOR of 4.75 %. The bond has been traded around par, but has risen somewhat over
the last 9 months. It was traded on an all-time high of 102.475 the 14 of May 2014. The bond
was issued 30 Jan 2013, and matures the same date 2018. Even though this is a floating rate
bond the margin in combination with the traded price reflects the present market view of the
credit quality of SIOFF.
Why not regress bonds against a market index to estimate a beta for debt? A significant
portion of debt is non-traded. Beta is based on the mean-variance criterion. This assumes
symmetric returns. The investor either gets the promised interest and principal payment, or in
a worst case scenario, the firm defaults on its debt. This makes the risks asymmetric and turns
the focus on the downside risks. Low rated companies may have more symmetric payoffs and
debt betas may therefore make more sense141. But, even if the debt is risky, its covariance
with the market will be very low. As a result, and for simplicity, the beta for the debt is
usually assumed to be zero.
7.4.2 Synthetic rating Damodaran The interest coverage ratio of a firm relates to a synthetic rating and an accompanying default
spread. The link between interest coverage ratios and ratings was developed by looking at all
140 Damodaran, A. (2012) Investment Valuation. 3rd ed p. 251-252 141 Damodaran, A. (2011) Applied Corporate Finance. 3rd ed. New Jersey, John Wiley & Sons, Inc. p158
76
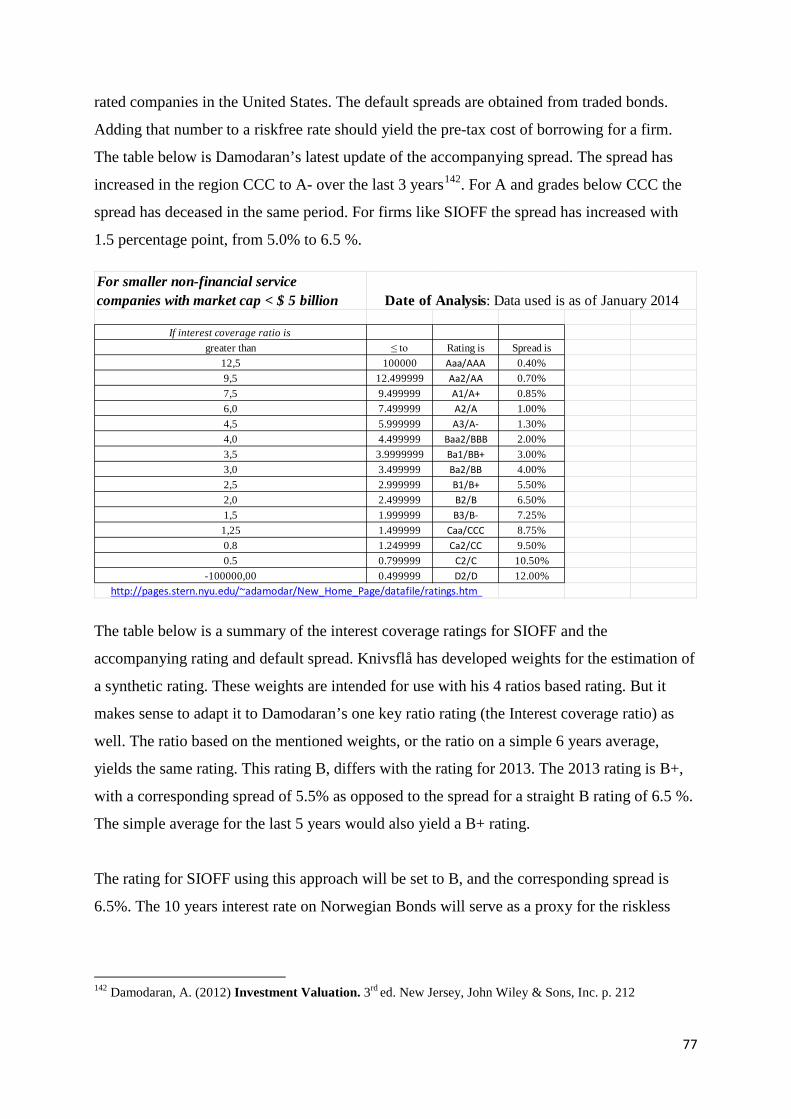
rated companies in the United States. The default spreads are obtained from traded bonds.
Adding that number to a riskfree rate should yield the pre-tax cost of borrowing for a firm.
The table below is Damodaran’s latest update of the accompanying spread. The spread has
increased in the region CCC to A- over the last 3 years142. For A and grades below CCC the
spread has deceased in the same period. For firms like SIOFF the spread has increased with
1.5 percentage point, from 5.0% to 6.5 %.
The table below is a summary of the interest coverage ratings for SIOFF and the
accompanying rating and default spread. Knivsflå has developed weights for the estimation of
a synthetic rating. These weights are intended for use with his 4 ratios based rating. But it
makes sense to adapt it to Damodaran’s one key ratio rating (the Interest coverage ratio) as
well. The ratio based on the mentioned weights, or the ratio on a simple 6 years average,
yields the same rating. This rating B, differs with the rating for 2013. The 2013 rating is B+,
with a corresponding spread of 5.5% as opposed to the spread for a straight B rating of 6.5 %.
The simple average for the last 5 years would also yield a B+ rating.
The rating for SIOFF using this approach will be set to B, and the corresponding spread is
6.5%. The 10 years interest rate on Norwegian Bonds will serve as a proxy for the riskless
142 Damodaran, A. (2012) Investment Valuation. 3rd ed. New Jersey, John Wiley & Sons, Inc. p. 212
For smaller non-financial service companies with market cap < $ 5 billion
If interest coverage ratio isgreater than ≤ to Rating is Spread is
12,5 100000 Aaa/AAA 0.40%9,5 12.499999 Aa2/AA 0.70%7,5 9.499999 A1/A+ 0.85%6,0 7.499999 A2/A 1.00%4,5 5.999999 A3/A- 1.30%4,0 4.499999 Baa2/BBB 2.00%3,5 3.9999999 Ba1/BB+ 3.00%3,0 3.499999 Ba2/BB 4.00%2,5 2.999999 B1/B+ 5.50%2,0 2.499999 B2/B 6.50%1,5 1.999999 B3/B- 7.25%1,25 1.499999 Caa/CCC 8.75%0.8 1.249999 Ca2/CC 9.50%0.5 0.799999 C2/C 10.50%
-100000,00 0.499999 D2/D 12.00%
Date of Analysis: Data used is as of January 2014
http://pages.stern.nyu.edu/~adamodar/New_Home_Page/datafile/ratings.htm
77
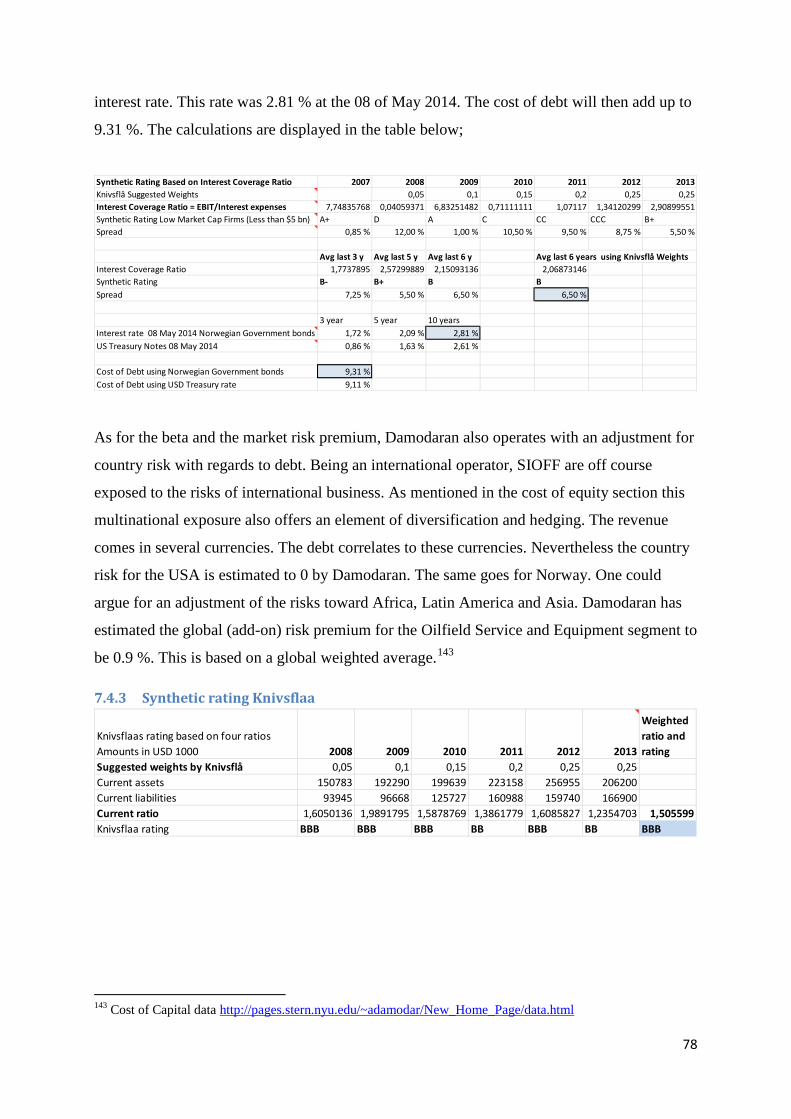
interest rate. This rate was 2.81 % at the 08 of May 2014. The cost of debt will then add up to
9.31 %. The calculations are displayed in the table below;
As for the beta and the market risk premium, Damodaran also operates with an adjustment for
country risk with regards to debt. Being an international operator, SIOFF are off course
exposed to the risks of international business. As mentioned in the cost of equity section this
multinational exposure also offers an element of diversification and hedging. The revenue
comes in several currencies. The debt correlates to these currencies. Nevertheless the country
risk for the USA is estimated to 0 by Damodaran. The same goes for Norway. One could
argue for an adjustment of the risks toward Africa, Latin America and Asia. Damodaran has
estimated the global (add-on) risk premium for the Oilfield Service and Equipment segment to
be 0.9 %. This is based on a global weighted average.143
7.4.3 Synthetic rating Knivsflaa
143 Cost of Capital data http://pages.stern.nyu.edu/~adamodar/New_Home_Page/data.html
Synthetic Rating Based on Interest Coverage Ratio 2007 2008 2009 2010 2011 2012 2013Knivsflå Suggested Weights 0,05 0,1 0,15 0,2 0,25 0,25Interest Coverage Ratio = EBIT/Interest expenses 7,74835768 0,04059371 6,83251482 0,71111111 1,07117 1,34120299 2,90899551Synthetic Rating Low Market Cap Firms (Less than $5 bn) A+ D A C CC CCC B+Spread 0,85 % 12,00 % 1,00 % 10,50 % 9,50 % 8,75 % 5,50 %
Avg last 3 y Avg last 5 y Avg last 6 y Avg last 6 years using Knivsflå WeightsInterest Coverage Ratio 1,7737895 2,57299889 2,15093136 2,06873146Synthetic Rating B- B+ B BSpread 7,25 % 5,50 % 6,50 % 6,50 %
3 year 5 year 10 yearsInterest rate 08 May 2014 Norwegian Government bonds 1,72 % 2,09 % 2,81 %US Treasury Notes 08 May 2014 0,86 % 1,63 % 2,61 %
Cost of Debt using Norwegian Government bonds 9,31 %Cost of Debt using USD Treasury rate 9,11 %
Knivsflaas rating based on four ratios Amounts in USD 1000 2008 2009 2010 2011 2012 2013
Weighted ratio and rating
Suggested weights by Knivsflå 0,05 0,1 0,15 0,2 0,25 0,25Current assets 150783 192290 199639 223158 256955 206200Current liabilities 93945 96668 125727 160988 159740 166900Current ratio 1,6050136 1,9891795 1,5878769 1,3861779 1,6085827 1,2354703 1,505599Knivsflaa rating BBB BBB BBB BB BBB BB BBB
78
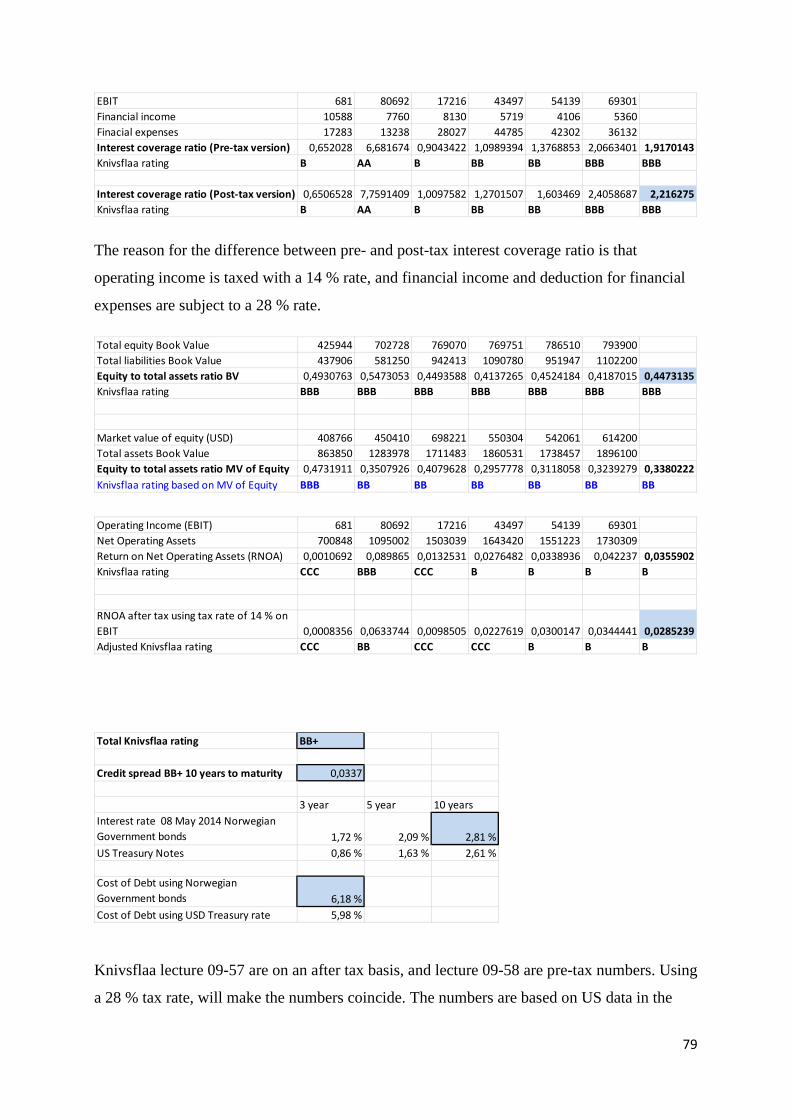
The reason for the difference between pre- and post-tax interest coverage ratio is that
operating income is taxed with a 14 % rate, and financial income and deduction for financial
expenses are subject to a 28 % rate.
Knivsflaa lecture 09-57 are on an after tax basis, and lecture 09-58 are pre-tax numbers. Using
a 28 % tax rate, will make the numbers coincide. The numbers are based on US data in the
EBIT 681 80692 17216 43497 54139 69301Financial income 10588 7760 8130 5719 4106 5360Finacial expenses 17283 13238 28027 44785 42302 36132Interest coverage ratio (Pre-tax version) 0,652028 6,681674 0,9043422 1,0989394 1,3768853 2,0663401 1,9170143Knivsflaa rating B AA B BB BB BBB BBB
Interest coverage ratio (Post-tax version) 0,6506528 7,7591409 1,0097582 1,2701507 1,603469 2,4058687 2,216275Knivsflaa rating B AA B BB BB BBB BBB
Total equity Book Value 425944 702728 769070 769751 786510 793900Total liabilities Book Value 437906 581250 942413 1090780 951947 1102200Equity to total assets ratio BV 0,4930763 0,5473053 0,4493588 0,4137265 0,4524184 0,4187015 0,4473135Knivsflaa rating BBB BBB BBB BBB BBB BBB BBB
Market value of equity (USD) 408766 450410 698221 550304 542061 614200Total assets Book Value 863850 1283978 1711483 1860531 1738457 1896100Equity to total assets ratio MV of Equity 0,4731911 0,3507926 0,4079628 0,2957778 0,3118058 0,3239279 0,3380222Knivsflaa rating based on MV of Equity BBB BB BB BB BB BB BB
Operating Income (EBIT) 681 80692 17216 43497 54139 69301Net Operating Assets 700848 1095002 1503039 1643420 1551223 1730309Return on Net Operating Assets (RNOA) 0,0010692 0,089865 0,0132531 0,0276482 0,0338936 0,042237 0,0355902Knivsflaa rating CCC BBB CCC B B B B
RNOA after tax using tax rate of 14 % on EBIT 0,0008356 0,0633744 0,0098505 0,0227619 0,0300147 0,0344441 0,0285239Adjusted Knivsflaa rating CCC BB CCC CCC B B B
Total Knivsflaa rating BB+
Credit spread BB+ 10 years to maturity 0,0337
3 year 5 year 10 yearsInterest rate 08 May 2014 Norwegian Government bonds 1,72 % 2,09 % 2,81 %US Treasury Notes 0,86 % 1,63 % 2,61 %
Cost of Debt using Norwegian Government bonds 6,18 %Cost of Debt using USD Treasury rate 5,98 %
79
period 2001-2010, with times to maturity from 1 year to 30 years. 10 Years will be used in
this paper. The same goes for the risk-less interest rate. (The Spread for this rating is similar
to a BB+ spread using Damodaran’s table from Jan 2014, despite Knivsflaa’s table being
based on an older time series)
7.4.4 Summary cost of debt There is a significant difference in the result between the two approaches. Damodaran’s
interest coverage ratio is a common factor. The same coverage ratio is yielding a lower rating
in the Damodaran table than in the Knivsflaa table. Damodaran is using only one key ratio but
is being more restrictive in the grading. The spread based on a specific grade is similar for the
relevant range. The spread based on the broader Knivsflaa approach and the more narrow and
also more restrictive rating and corresponding spread based on the Damodaran will be given
even weights in this thesis.
The cost of debt is set to 9,31 % + 6,18 %2
= 7,745 %
Adding the 0.9 % global default spread for the cost of debt in the Oilfield Service and
Equipment segment, the cost of debt will be 8,645 %
This is also in line with the margin on the traded bond. The bond margin of 4.75 % would
yield a cost of debt of 4.75 % + 2.81 % + 0.9 % = 8.46 %.
A cost of debt of 8,645 % will be used in the continuation of this paper.
7.5 Summary cost of capital – WACC
WACC = 𝐷𝑒𝑏𝑡𝐷𝑒𝑏𝑡+𝐸𝑞𝑢𝑖𝑡𝑦
rD (1 – τ) + 𝐸𝑞𝑢𝑖𝑡𝑦𝐷𝑒𝑏𝑡+𝐸𝑞𝑢𝑖𝑡𝑦
rE
Notation;
Debt is the market value of debt. Book value will serve as a proxy for the market value.
Equity is the market value of equity
rD return on debt (cost of debt)
rE return on equity (cost of equity)
τ tax rate
WACCSIOFF = 0.6483 · 0.08645 · (1- 0.28) + 0.3517 · 0.0935 = 0.0732
80
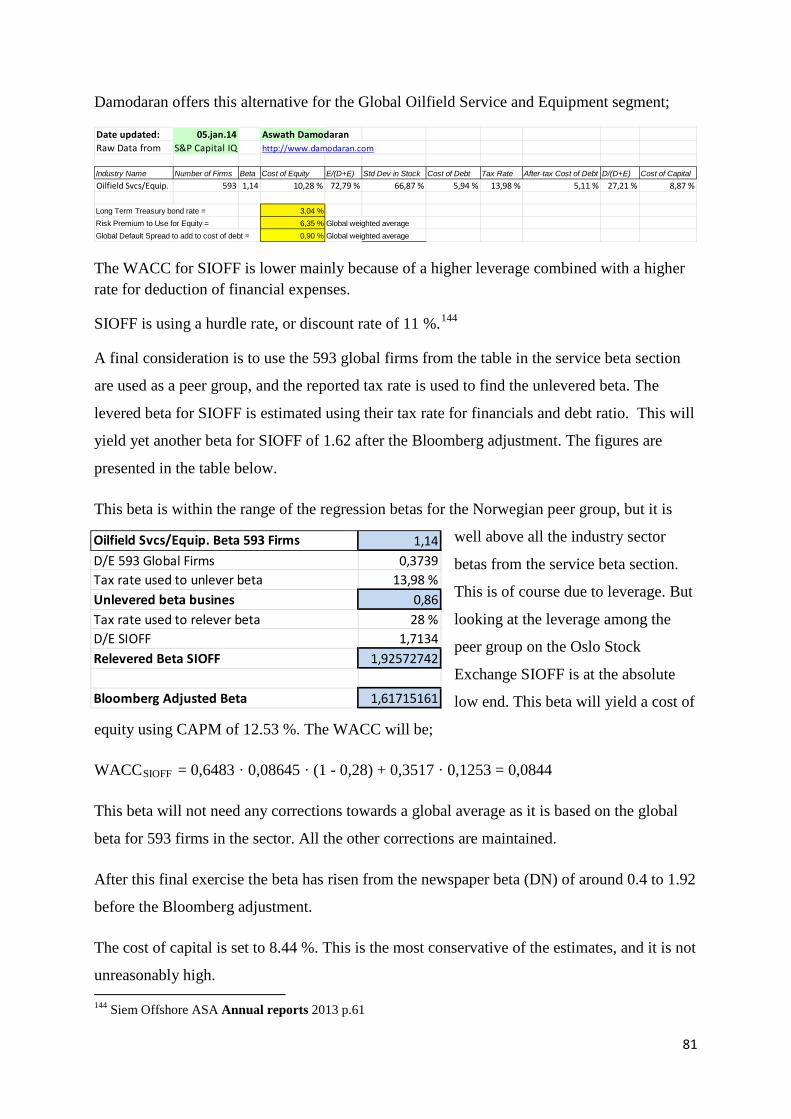
Damodaran offers this alternative for the Global Oilfield Service and Equipment segment;
The WACC for SIOFF is lower mainly because of a higher leverage combined with a higher rate for deduction of financial expenses.
SIOFF is using a hurdle rate, or discount rate of 11 %.144
A final consideration is to use the 593 global firms from the table in the service beta section
are used as a peer group, and the reported tax rate is used to find the unlevered beta. The
levered beta for SIOFF is estimated using their tax rate for financials and debt ratio. This will
yield yet another beta for SIOFF of 1.62 after the Bloomberg adjustment. The figures are
presented in the table below.
This beta is within the range of the regression betas for the Norwegian peer group, but it is
well above all the industry sector
betas from the service beta section.
This is of course due to leverage. But
looking at the leverage among the
peer group on the Oslo Stock
Exchange SIOFF is at the absolute
low end. This beta will yield a cost of
equity using CAPM of 12.53 %. The WACC will be;
WACCSIOFF = 0,6483 · 0,08645 · (1 - 0,28) + 0,3517 · 0,1253 = 0,0844
This beta will not need any corrections towards a global average as it is based on the global
beta for 593 firms in the sector. All the other corrections are maintained.
After this final exercise the beta has risen from the newspaper beta (DN) of around 0.4 to 1.92
before the Bloomberg adjustment.
The cost of capital is set to 8.44 %. This is the most conservative of the estimates, and it is not
unreasonably high.
144 Siem Offshore ASA Annual reports 2013 p.61
Date updated: 05.jan.14 Aswath DamodaranRaw Data from S&P Capital IQ http://www.damodaran.com
Industry Name Number of Firms Beta Cost of Equity E/(D+E) Std Dev in Stock Cost of Debt Tax Rate After-tax Cost of Debt D/(D+E) Cost of CapitalOilfield Svcs/Equip. 593 1,14 10,28 % 72,79 % 66,87 % 5,94 % 13,98 % 5,11 % 27,21 % 8,87 %
Long Term Treasury bond rate = 3,04 %Risk Premium to Use for Equity = 6,35 % Global weighted averageGlobal Default Spread to add to cost of debt = 0,90 % Global weighted average
Oilfield Svcs/Equip. Beta 593 Firms 1,14D/E 593 Global Firms 0,3739Tax rate used to unlever beta 13,98 %Unlevered beta busines 0,86Tax rate used to relever beta 28 %D/E SIOFF 1,7134Relevered Beta SIOFF 1,92572742
Bloomberg Adjusted Beta 1,61715161
81
8 Growth Growth is the most critical input in valuation145. A firm can grow by managing its existing
investments better, or by making new investments. As an example of efficiency growth Siem
Offshore is laying off 60 Scandinavian seamen in an attempt to cut costs146. This comes on
top of previous/earlier layoffs of 100 local seamen. Chairman Sorensen in Siem Offshore
points to the competition in the world market, but he emphasizes that the increasing
protectionism and the demand for local content is an additional cause for these layoffs.
Growth from improvements in efficiency can generate substantial growth in the near term, but
not for ever.
Graham147 suggests that the growth rate itself be calculated by comparing the average of the
last three years with the corresponding figures ten years earlier. Read financial reports
backward. Read the notes in the reports. The unpleasant are hidden in the back.
A long term constraint to growth is the growth rate in the economy. No firm can outgrow this
rate in the long run. A rule of thumb is to use the riskless rate used in the valuation as a
ceiling for long term, stable growth. The nominal riskless rate equals the expected inflation +
the real riskless rate which in sum roughly equals the nominal growth rate in the economy in
the long run.148
Koller et al.149 divides revenue growth into three main components; organic growth caused by
the overall market expansion, organic growth due to changes in the market share, inorganic
growth achieved by mergers and acquisitions (M&A). In a study by Baghai, Smith and
Viguerie of 416 large companies worldwide, the gain in market share is the least significant of
the three. The market share performance accounted for only 0,4 percentage point of at total
growth of 10,1 % in the period 1999-2006. The average median revenue growth in the US in
real term was 5,4 % in the period from 1963 -2007. The real growth in GDP was 3,2 % in the
same period. This apparent disconnect may be explained by the capital inflow to companies
145 Damodaran, A. (2012) Investment Valuation. 3rd ed. New Jersey, John Wiley & Sons, Inc. p. 271 146 Sunnmørsposten http://www.smp.no/nyheter/article7704395.ece 147 Graham, B. (2006) The Intelligent Investor. Revised edition. New York, HarperCollins Publishers. p. 319,328 148 Damodaran, A. (2006) Damodaran on Valuation. 2nd ed. New Jersey, John Wiley & Sons, Inc. p.146 149 Koller, T., Goedhart, M. & Wessels, D. (2010) Valuation, Measuring and Managing the Value of Companies. Mc Kinsey & Company 5th ed. New Jersey, John Wiley & Sons, Inc. p. 79-98
82
with growth opportunities, outsourcing and specialization, M&A and global expansion not
affecting US GDP. The use of median company may affect the result. The median company is
typically small, and small public companies grow faster. But, even the fastest growing
company tend, to fall below 5 % growth within 10 years.
Petersen & Plenborg150 introduces sustainable growth as a key measure. This is the upper
limit to growth, while preserving financial risk, as in maintaining the same financial leverage.
Sustainable growth = ROE x (1- Payout ratio). They also emphasize that all growth is not
necessarily adding value. One measure of value creation is the Economic value added (EVA).
Value added (EVA) = (ROIC-WACC) x Invested capital. (ROIC – WACC) is the measure
Damodaran calls excess return.151 A further distinction between growth in EVA due to
growth in core business or due to transitory item is needed to sort out the quality and the
sustainability of growth. The increasingly popular share buy-back programs are only affecting
the capital structure, and not the underlying performance of the operation.
There are three basic methods of estimating growth according to Damodaran, starting with the
least precise method;
1. Historical growth. Past growth is not a sure indicator of the future. The geometric average
is preferred over arithmetic average. This is even more important with erratic growth. The
geometric mean uses only the first and the last observation. This is partly overcome by using
OLS regressions of earnings per share (EPS) against time. Time series do better than models
based on past earnings but may be of limited value for periods extending over several years.
Siem Offshore is relatively young and in many respects regarded as s a high growth firm. In
the presence of negative earnings and volatile growth, as is the case in SIOFF, the revenue
might be a better indicator than earnings. Revenue growth is less volatile and less affected by
accounting choices and adjustments.
150Petersen, C.V.& Plenborg, T. (2012) Financial Statement Analysis. Harlow, Pearson Education Limited p. 127-148 151 Damodaran, A. (2007) Return on Capital (ROC), Return on Invested Capital (ROIC) and Return on Equity (ROE): Measurement and Implications. Stern School of Business p. 36
83
Titman and Martin152 argues that although the geometric mean is the appropriate way to
measure historic return, the arithmetic average is a better estimate for forward looking
periods.
2. Analyst or manager estimate of growth. Managers are likely to overestimate their capacity
to generate growth and may serve as an upper limit to the growth estimate. Analysts may have
their own biases, but are able to include the latest information about the firm,
macroeconomics, the competitors, private information and public information other than
historic data on earnings.
3. Fundamental determinants of growth. This is held up as the soundest way.
In the long run a firm’s growth will depend on the reinvestment it makes in new assets and the
quality of these investments. Investments in this broad sense, includes acquisitions, expanding
market capabilities and building distribution channels.
8.1 Growth in SIOFF In some respect SIOFF may be regarded as a high growth firm. Koller et al.153 suggests the
measure of organic revenue growth exceeding 15 % annually, to categorize a firm as a high
growth company. They recommend the use of discounted cash flow (DCF) valuation. The
process should begin with the future, by sizing the potential market, predicting the level of
sustainable profitability, and estimating the investment necessary to achieve scale. The long
term future view is linked back to current performance.
Damodaran154 defines growth companies as firms that get most of their value from growth
assets - from investments yet to be made. This main characteristic may not fit SIOFF exactly
although the strategy is altered towards an increase in subsea which is expected to be more
profitable. Other characteristics like short and shifting history and profitability makes a better
fit. The debt to equity ratio is more than 1.5 but SIOFF is still on the shallow side regarding
leverage amongst the Norwegian peer group. The market value of equity is below the book
value, but again, this goes for the peer group as well.
152 Titman, S. & Martin, J. (2013) Valuation: The Art and Science of Corporate Investment Decisions.2nd ed. Harlow, Pearson Education Limited p.121 153 Koller, T., Goedhart, M. & Wessels, D. (2010) Valuation, Measuring and Managing the Value of Companies. Mc Kinsey & Company 5th ed. New Jersey, John Wiley & Sons, Inc. p.717-718 154 Damodaran, A. (2010) The Dark Side of Valuation. 2nd ed. New Jersey, Pearson Education, inc. Published as FT Press p.263-266
84
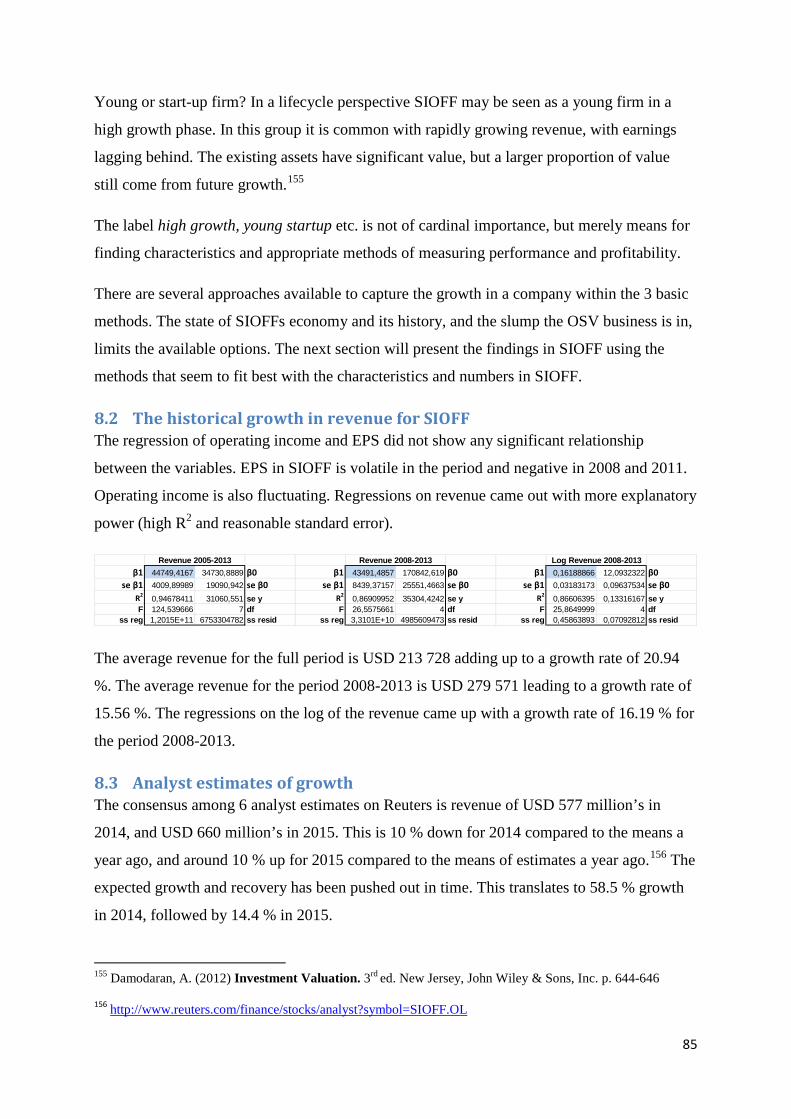
Young or start-up firm? In a lifecycle perspective SIOFF may be seen as a young firm in a
high growth phase. In this group it is common with rapidly growing revenue, with earnings
lagging behind. The existing assets have significant value, but a larger proportion of value
still come from future growth.155
The label high growth, young startup etc. is not of cardinal importance, but merely means for
finding characteristics and appropriate methods of measuring performance and profitability.
There are several approaches available to capture the growth in a company within the 3 basic
methods. The state of SIOFFs economy and its history, and the slump the OSV business is in,
limits the available options. The next section will present the findings in SIOFF using the
methods that seem to fit best with the characteristics and numbers in SIOFF.
8.2 The historical growth in revenue for SIOFF The regression of operating income and EPS did not show any significant relationship
between the variables. EPS in SIOFF is volatile in the period and negative in 2008 and 2011.
Operating income is also fluctuating. Regressions on revenue came out with more explanatory
power (high R2 and reasonable standard error).
The average revenue for the full period is USD 213 728 adding up to a growth rate of 20.94
%. The average revenue for the period 2008-2013 is USD 279 571 leading to a growth rate of
15.56 %. The regressions on the log of the revenue came up with a growth rate of 16.19 % for
the period 2008-2013.
8.3 Analyst estimates of growth The consensus among 6 analyst estimates on Reuters is revenue of USD 577 million’s in
2014, and USD 660 million’s in 2015. This is 10 % down for 2014 compared to the means a
year ago, and around 10 % up for 2015 compared to the means of estimates a year ago.156 The
expected growth and recovery has been pushed out in time. This translates to 58.5 % growth
in 2014, followed by 14.4 % in 2015.
155 Damodaran, A. (2012) Investment Valuation. 3rd ed. New Jersey, John Wiley & Sons, Inc. p. 644-646
156 http://www.reuters.com/finance/stocks/analyst?symbol=SIOFF.OL
β1 44749,4167 34730,8889 β0 β1 43491,4857 170842,619 β0 β1 0,16188866 12,0932322 β0se β1 4009,89989 19090,942 se β0 se β1 8439,37157 25551,4663 se β0 se β1 0,03183173 0,09637534 se β0
R2 0,94678411 31060,551 se y R2 0,86909952 35304,4242 se y R2 0,86606395 0,13316167 se yF 124,539666 7 df F 26,5575661 4 df F 25,8649999 4 df
ss reg 1,2015E+11 6753304782 ss resid ss reg 3,3101E+10 4985609473 ss resid ss reg 0,45863893 0,07092812 ss resid
Revenue 2005-2013 Revenue 2008-2013 Log Revenue 2008-2013
85
Arctic Securities expect revenue to rise to USD 621 mill in 2014, and USD 678 mill in
2015.157 This is an increase of 70.1 % in 2014 followed by 9.2 % in 2015. The EBIT margin
is expected to increase to 25.2 % by 2015.
Based on estimates from Fearnley Securities158the EBIT/Revenue for DESSC, DOF, FAR and
SOFF is in the region 23-36 % and a sales-to-capital in the region 29-37 % for 2014 and 2015.
The average EBIT/Revenue for 2014 is 28.5 %, and 27.75 % for 2015. The average sales-to-
capital is 32.25 % for 2014 and 31.5 % for 2015.
8.4 Fundamental determinants in SIOFF When a firm has a stable return on capital its expected growth in operating income is a
product of the reinvestment rate and the quality of these reinvestments. The quality is here
measured by the return on the capital invested. (ROIC)
Expected growth EBIT =Reinvestment rate x Return on capital.
Reinvestment rate = (Capital expenditure - Depreciation + Δ Noncash WC)/[EBIT(1-Tax
Rate)]
Return on Capital = EBIT(1-t)/(Book value of Equity + Book value of debt – Cash and
marketable securities)
To capture the nature of SIOFFs fluctuating figures in the financial statement, shifting
profitability and low return, the expected growth in EBIT will be estimated by aggregating the
reinvestment rate and the return on capital. The aggregated invested capital, reinvestment and
EBIT(1-t) is used to find an average reinvestment rate and ROIC.159 From this aggregation the
estimated growth in operating income for SIOFF is 13.76 %. This implies an initial
reinvestment rate of 4.174.
The historic ROIC in SIOFF based on the aggregated figures is 3.3 %. Besides this obviously
being below the cost of capital, it also demands hefty reinvestments to sustain the brisk
157 Arctic Securities (2014) Result analysis Siem Offshore (20 February 2014) 158 Fearnley Securities AS OSV Sector outlook 4q13 previews (24 February 2014) 159 Damodaran, A. (2012) Investment Valuation. 3rd ed. New Jersey, John Wiley & Sons, Inc. p. 292 Damodaran has not included the first column/year for reinvestment in his example. The request for an explanation from Mr Damodaran is not yet answered. Until further it will be considered a possible spreadsheet mistake made by Damodaran. This valuation is based on aggregation of all the years for both reinvestment and return in capital. Appendix Growth and Forecast for SIOFF
86
growth in SIOFF. The sales to capital in SIOFF from 2009 onwards have averaged 21.63 %,
with a standard error of 1.55 %.
Hereof lies some of the problems, challenges, and the financial predicament in SIOFF. SIOFF
is, and has been, destroying value as the ROIC-WACC has been, and is negative. As a
consequence, the market is pricing the equity in SIOFF well below book value.
One of the reasons for choosing just SIOFF in this valuation was due to the fact that the
mutual funds Skagen Kon-Tiki and Skagen Vekst were major shareholders in SIOFF.
Kristoffer Stensrud, one of the founders of Skagenfondene, and the manager of Skagen Kon-
Tiki has on several occasions held SIOFF up as a company to invest in for the value oriented
investor. In other words – I was hoping to find the company to be undervalued.
8.5 Steely business On direct questions/confrontation about where the values in SIOFF where to be found (are
hidden), Mr. Stensrud replied the 04th of June 2014;
“The steel-value of SIOFF is around 13 NOK/share. If you add 1-3 NOK for
construction etc.., DESSC160 has once again led the way by sale to the Brazilians and
rebated buy from JF161 with fixed financing and dividend policy. ………SIOFF will
possibly see the light soon. Horrible business – nessekonger162 & commissioning
sharks are all over…”
It goes beyond the scope of this thesis to enter into a discussion around all the details of the
above. The basis for his conclusion is not taken directly from the latest annual reports. But
Mr. Stensrud’s fundamental view is enticing. The argument makes sense in a fundamental
view. The intrinsic steel value of NOK 13 per share on top of the cost of construction
indicates a value well above the latest market value of NOK 8.49 the 11th of June 2014. It
follows from this that the market is getting OSV-services way below the cost. The sales-to-
capital, the ROIC and the OPEX level underpins this conclusion. Unless the market condition
improves, leading to a pickup in revenue, SIOFF and its investors will have to consider
changing the strategy towards divesting or liquidation of assets. In this steel value perspective
the share is underpriced and the recommendation is a clear – buy.
160 DESSC is the ticker for Deep Sea Supply, one of the companies in the peer group 161 John Fredriksen, shipping tycoon and stakeholder in DESSC. 162 “Nessekonger” may be explained as local privileged merchants, or owners of a smaller port, with a monopoly power to dictate prices and terms. The permission to trade was granted by the King. (This translation is done to the best of my knowledge and is by no means substantiated or verified by any official sources)
87
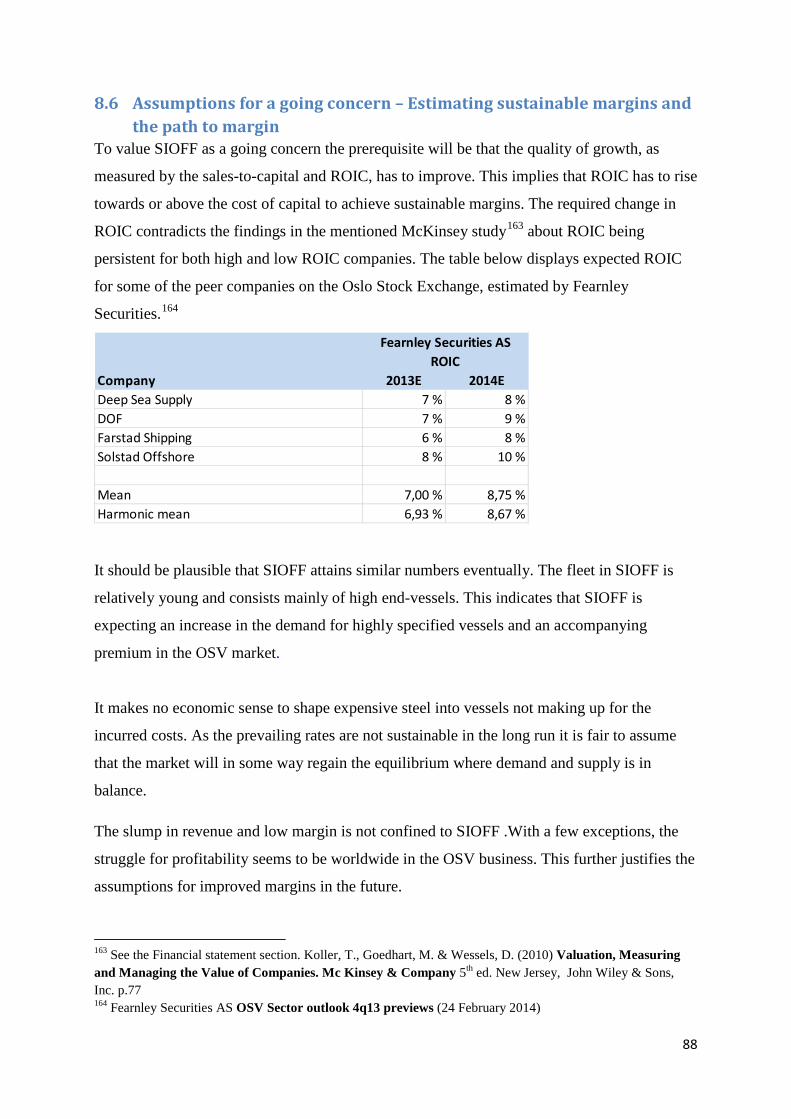
8.6 Assumptions for a going concern – Estimating sustainable margins and the path to margin
To value SIOFF as a going concern the prerequisite will be that the quality of growth, as
measured by the sales-to-capital and ROIC, has to improve. This implies that ROIC has to rise
towards or above the cost of capital to achieve sustainable margins. The required change in
ROIC contradicts the findings in the mentioned McKinsey study163 about ROIC being
persistent for both high and low ROIC companies. The table below displays expected ROIC
for some of the peer companies on the Oslo Stock Exchange, estimated by Fearnley
Securities.164
It should be plausible that SIOFF attains similar numbers eventually. The fleet in SIOFF is
relatively young and consists mainly of high end-vessels. This indicates that SIOFF is
expecting an increase in the demand for highly specified vessels and an accompanying
premium in the OSV market.
It makes no economic sense to shape expensive steel into vessels not making up for the
incurred costs. As the prevailing rates are not sustainable in the long run it is fair to assume
that the market will in some way regain the equilibrium where demand and supply is in
balance.
The slump in revenue and low margin is not confined to SIOFF .With a few exceptions, the
struggle for profitability seems to be worldwide in the OSV business. This further justifies the
assumptions for improved margins in the future.
163 See the Financial statement section. Koller, T., Goedhart, M. & Wessels, D. (2010) Valuation, Measuring and Managing the Value of Companies. Mc Kinsey & Company 5th ed. New Jersey, John Wiley & Sons, Inc. p.77 164 Fearnley Securities AS OSV Sector outlook 4q13 previews (24 February 2014)
Company 2013E 2014EDeep Sea Supply 7 % 8 %DOF 7 % 9 %Farstad Shipping 6 % 8 %Solstad Offshore 8 % 10 %
Mean 7,00 % 8,75 %Harmonic mean 6,93 % 8,67 %
Fearnley Securities ASROIC
88
These preconditions for a going concern will be modelled into the valuation parameters. The
parameters will further be corrected for actual yard installments up to, and including 2016.
The confirmed future installments, actually over-goes the brisk growth estimate, based on
historic and fundamental determinants
9 Forecasting Pro Forma financial statement, P&L (Measuring FCFF) Titman & Martin recommends the use of common size financial statement to construct the pro
forma financial statement. A blind use of common size will fail to capture economies of scale
effects. 165 The relationship between the individual entries and the firm revenue is used to
construct the common size income statement in this paper.166
The average operating expenses for the period 2009-2013 is 67.19 %. The standard error is
2.08 %. The average EBIT is 19.60 % with a standard error of 12.73 %. The fluctuations in
EBIT, is partly due to bookings recurring with uneven intervals and magnitude. This is
discussed in the financial statement chapter.
The following steps are used to compute FCFF. After the initial construction the pro forma
statement is adjusted to incorporate the requirements for SIOFF to perform as a going concern
from an investor perspective;
Step 1: Revenue. The revenue is constructed on the basis of the regression on historical
revenue. A second input is analyst estimates. The projected revenue will stay within the
span/range of these outcomes. The projected revenue has to fit with the planned and
forecasted reinvestments and the sales-to-capital.
Step 2: Operating Income (EBIT). Operating income will be modelled on the basis of the
fundamental approach. The second input is the expected operating margin in the mature
phase, based on sustainable profitability. A third input is the operating margin, and expected
operating margin for peer companies.167
Step 3: Reinvestment. The initial reinvestment is based on the rate from the fundamental
determinants section above. This is further adjusted for planned yard installments and
deliveries of new vessels forward, including 2016. Reinvestment needs is further estimated on
165 Titman, S. & Martin, J. (2014) Valuation: The Art and Science of Corporate Investment Decisions.2nd ed. Harlow, Pearson Education Limited p. 206 166 Appendix Growth and Forecast 167 Damodaran, A. (2012) Investment Valuation. 3rd ed. New Jersey, John Wiley & Sons, Inc. p.650 Ill. 23.2
89
the basis of expected growth and return on capital. Sales-to-capital links this to revenue.
Expected reinvestment = expected Δ revenue/ (sales/capital).168 The reinvestments will be
scaled down towards the stable reinvestment needed in the mature phase. Working capital
(WC) is taken from the common size statement, and is expected to remain at 8% of revenue.
Cash is expected to stay fixed. Arctic securities have made the opposite assumption regarding
cash and WC.
Step 4: Terminal Value. The assumption is that the return on invested capital after the high
growth period will be equal to the cost of capital in perpetuity. This implies a reinvestment in
perpetuity of;169
Reinvestment rate in Mature Phase = Stable Growth rate / Stable return on capital.
The stable growth rate is assumed to be 2.5 %.170 This results in a reinvestment rate of (2.5 %
/ 8.44 %) = 29.62 % in perpetuity. The formula to calculate the terminal value is;
Terminal Value = [EBIT2019(1-t)(1-Reinvestment Rate)] / (Cost of Capitalstable – gstable)
Step 5: Adjustments. Make necessary adjustments in revenue, EBIT and reinvestments to
link the long term future view to current performance. The EBIT as a percentage of revenue is
presumed to increase with around 1 percentage point a year. The base year figure from the
common size statement is 19.6 %. This will rise to 26-27 % in the terminal year.
The argument for the improvement in the operating income margin is economies of scale and
efficiency growth. In addition to these internal improvements from SIOFF, an improvement in
the market condition is necessitated to attain the target level for sustainable profitability.
These figures are further substantiated by looking at the analyst’s expectation for SIOFF and
its peers.
The reinvestment needed to fuel the growth will fall as the ROIC improves. Higher sales-to-
capital ratio also decreases reinvestment needs.
168 Damodaran, A. (2012) Investment Valuation. 3rd ed. New Jersey, John Wiley & Sons, Inc. p.651 169 Damodaran, A. (2010) The Dark Side of Valuation. 2nd ed. New Jersey, Pearson Education, inc. Published as FT Press p.285 170 PWC and NFF (2012) Risikopremien i det norske markedet 2012 and 2013 (The risk premium in the Norwegian market) p.16. This is also in line with the riskless rate used, of 2.81 %. Damodaran, A. (2006) Damodaran on Valuation. 2nd ed. New Jersey, John Wiley & Sons, Inc. p. 146 The stable growth rate is also discussed in the beginning of this chapter.
90
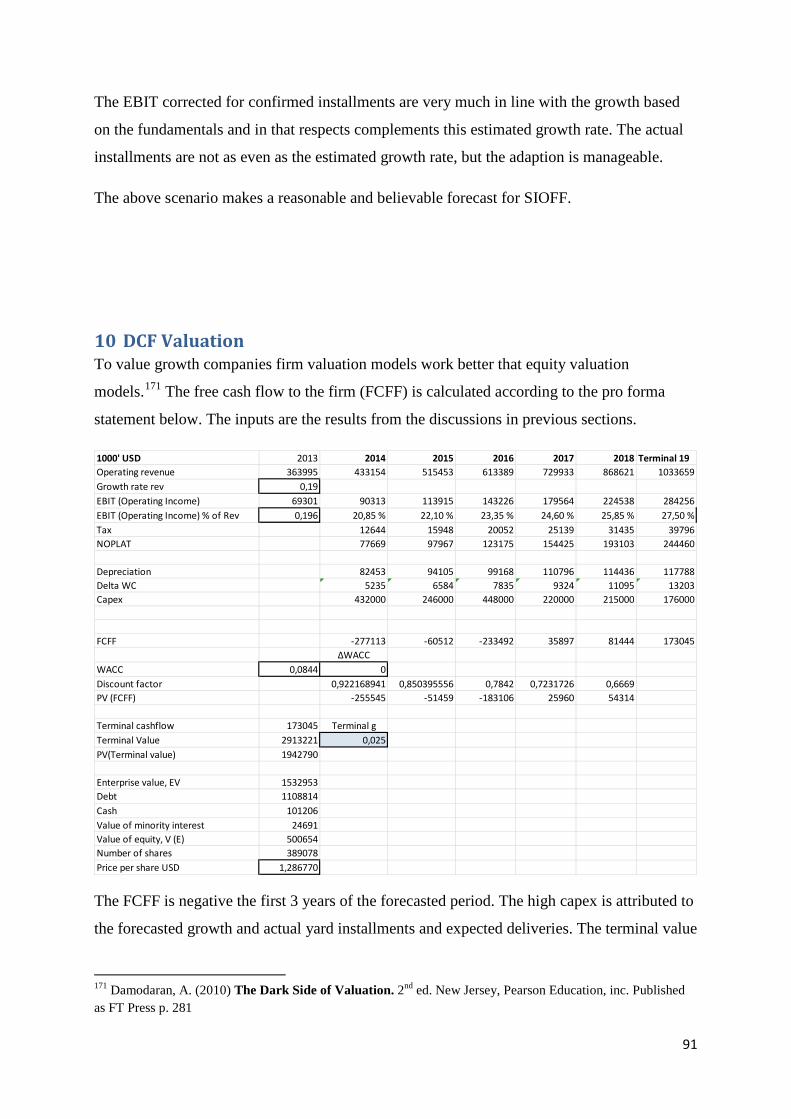
The EBIT corrected for confirmed installments are very much in line with the growth based
on the fundamentals and in that respects complements this estimated growth rate. The actual
installments are not as even as the estimated growth rate, but the adaption is manageable.
The above scenario makes a reasonable and believable forecast for SIOFF.
10 DCF Valuation To value growth companies firm valuation models work better that equity valuation
models.171 The free cash flow to the firm (FCFF) is calculated according to the pro forma
statement below. The inputs are the results from the discussions in previous sections.
The FCFF is negative the first 3 years of the forecasted period. The high capex is attributed to
the forecasted growth and actual yard installments and expected deliveries. The terminal value
171 Damodaran, A. (2010) The Dark Side of Valuation. 2nd ed. New Jersey, Pearson Education, inc. Published as FT Press p. 281
1000' USD 2013 2014 2015 2016 2017 2018 Terminal 19Operating revenue 363995 433154 515453 613389 729933 868621 1033659Growth rate rev 0,19EBIT (Operating Income) 69301 90313 113915 143226 179564 224538 284256EBIT (Operating Income) % of Rev 0,196 20,85 % 22,10 % 23,35 % 24,60 % 25,85 % 27,50 %Tax 12644 15948 20052 25139 31435 39796NOPLAT 77669 97967 123175 154425 193103 244460
Depreciation 82453 94105 99168 110796 114436 117788Delta WC 5235 6584 7835 9324 11095 13203Capex 432000 246000 448000 220000 215000 176000
FCFF -277113 -60512 -233492 35897 81444 173045ΔWACC
WACC 0,0844 0Discount factor 0,922168941 0,850395556 0,7842 0,7231726 0,6669PV (FCFF) -255545 -51459 -183106 25960 54314
Terminal cashflow 173045 Terminal gTerminal Value 2913221 0,025PV(Terminal value) 1942790
Enterprise value, EV 1532953Debt 1108814Cash 101206Value of minority interest 24691Value of equity, V (E) 500654Number of shares 389078Price per share USD 1,286770
91
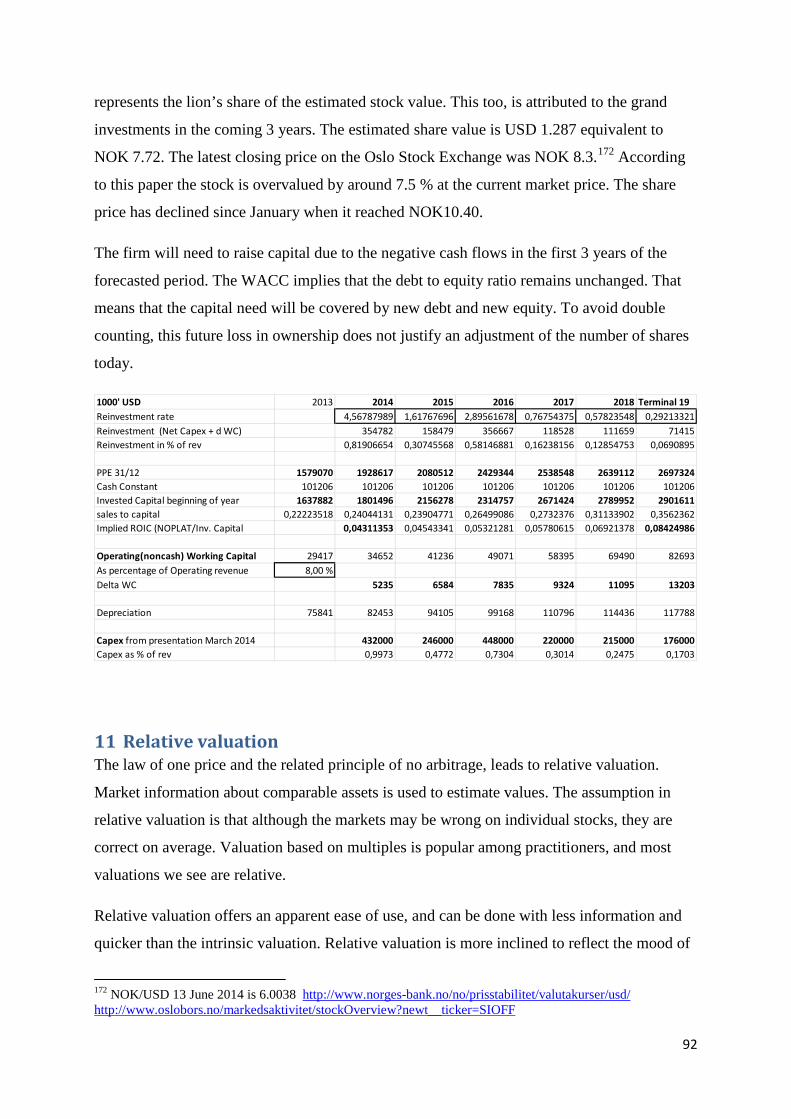
represents the lion’s share of the estimated stock value. This too, is attributed to the grand
investments in the coming 3 years. The estimated share value is USD 1.287 equivalent to
NOK 7.72. The latest closing price on the Oslo Stock Exchange was NOK 8.3.172 According
to this paper the stock is overvalued by around 7.5 % at the current market price. The share
price has declined since January when it reached NOK10.40.
The firm will need to raise capital due to the negative cash flows in the first 3 years of the
forecasted period. The WACC implies that the debt to equity ratio remains unchanged. That
means that the capital need will be covered by new debt and new equity. To avoid double
counting, this future loss in ownership does not justify an adjustment of the number of shares
today.
11 Relative valuation The law of one price and the related principle of no arbitrage, leads to relative valuation.
Market information about comparable assets is used to estimate values. The assumption in
relative valuation is that although the markets may be wrong on individual stocks, they are
correct on average. Valuation based on multiples is popular among practitioners, and most
valuations we see are relative.
Relative valuation offers an apparent ease of use, and can be done with less information and
quicker than the intrinsic valuation. Relative valuation is more inclined to reflect the mood of
172 NOK/USD 13 June 2014 is 6.0038 http://www.norges-bank.no/no/prisstabilitet/valutakurser/usd/ http://www.oslobors.no/markedsaktivitet/stockOverview?newt__ticker=SIOFF
1000' USD 2013 2014 2015 2016 2017 2018 Terminal 19Reinvestment rate 4,56787989 1,61767696 2,89561678 0,76754375 0,57823548 0,29213321Reinvestment (Net Capex + d WC) 354782 158479 356667 118528 111659 71415Reinvestment in % of rev 0,81906654 0,30745568 0,58146881 0,16238156 0,12854753 0,0690895
PPE 31/12 1579070 1928617 2080512 2429344 2538548 2639112 2697324Cash Constant 101206 101206 101206 101206 101206 101206 101206Invested Capital beginning of year 1637882 1801496 2156278 2314757 2671424 2789952 2901611sales to capital 0,22223518 0,24044131 0,23904771 0,26499086 0,2732376 0,31133902 0,3562362Implied ROIC (NOPLAT/Inv. Capital 0,04311353 0,04543341 0,05321281 0,05780615 0,06921378 0,08424986
Operating(noncash) Working Capital 29417 34652 41236 49071 58395 69490 82693As percentage of Operating revenue 8,00 %Delta WC 5235 6584 7835 9324 11095 13203
Depreciation 75841 82453 94105 99168 110796 114436 117788
Capex from presentation March 2014 432000 246000 448000 220000 215000 176000Capex as % of rev 0,9973 0,4772 0,7304 0,3014 0,2475 0,1703
92
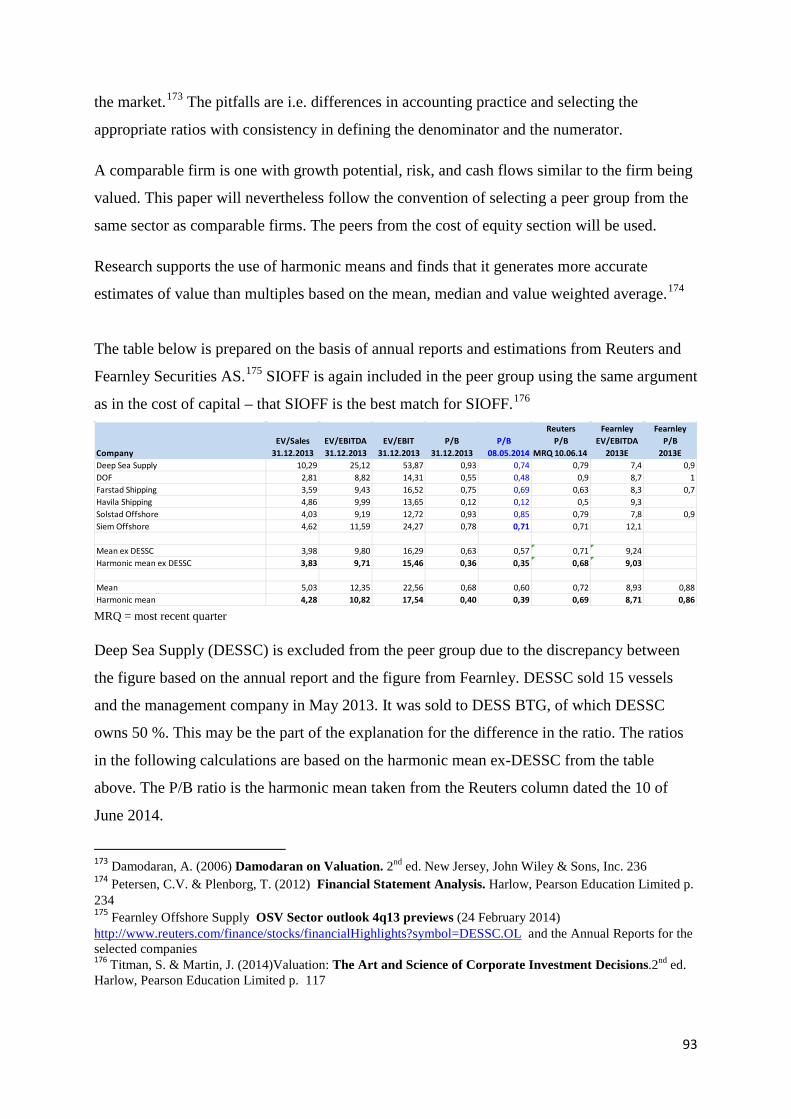
the market.173 The pitfalls are i.e. differences in accounting practice and selecting the
appropriate ratios with consistency in defining the denominator and the numerator.
A comparable firm is one with growth potential, risk, and cash flows similar to the firm being
valued. This paper will nevertheless follow the convention of selecting a peer group from the
same sector as comparable firms. The peers from the cost of equity section will be used.
Research supports the use of harmonic means and finds that it generates more accurate
estimates of value than multiples based on the mean, median and value weighted average.174
The table below is prepared on the basis of annual reports and estimations from Reuters and
Fearnley Securities AS.175 SIOFF is again included in the peer group using the same argument
as in the cost of capital – that SIOFF is the best match for SIOFF.176
MRQ = most recent quarter Deep Sea Supply (DESSC) is excluded from the peer group due to the discrepancy between
the figure based on the annual report and the figure from Fearnley. DESSC sold 15 vessels
and the management company in May 2013. It was sold to DESS BTG, of which DESSC
owns 50 %. This may be the part of the explanation for the difference in the ratio. The ratios
in the following calculations are based on the harmonic mean ex-DESSC from the table
above. The P/B ratio is the harmonic mean taken from the Reuters column dated the 10 of
June 2014.
173 Damodaran, A. (2006) Damodaran on Valuation. 2nd ed. New Jersey, John Wiley & Sons, Inc. 236 174 Petersen, C.V. & Plenborg, T. (2012) Financial Statement Analysis. Harlow, Pearson Education Limited p. 234 175 Fearnley Offshore Supply OSV Sector outlook 4q13 previews (24 February 2014) http://www.reuters.com/finance/stocks/financialHighlights?symbol=DESSC.OL and the Annual Reports for the selected companies 176 Titman, S. & Martin, J. (2014)Valuation: The Art and Science of Corporate Investment Decisions.2nd ed. Harlow, Pearson Education Limited p. 117
Reuters Fearnley FearnleyEV/Sales EV/EBITDA EV/EBIT P/B P/B P/B EV/EBITDA P/B
Company 31.12.2013 31.12.2013 31.12.2013 31.12.2013 08.05.2014 MRQ 10.06.14 2013E 2013EDeep Sea Supply 10,29 25,12 53,87 0,93 0,74 0,79 7,4 0,9DOF 2,81 8,82 14,31 0,55 0,48 0,9 8,7 1Farstad Shipping 3,59 9,43 16,52 0,75 0,69 0,63 8,3 0,7Havila Shipping 4,86 9,99 13,65 0,12 0,12 0,5 9,3Solstad Offshore 4,03 9,19 12,72 0,93 0,85 0,79 7,8 0,9Siem Offshore 4,62 11,59 24,27 0,78 0,71 0,71 12,1
Mean ex DESSC 3,98 9,80 16,29 0,63 0,57 0,71 9,24Harmonic mean ex DESSC 3,83 9,71 15,46 0,36 0,35 0,68 9,03
Mean 5,03 12,35 22,56 0,68 0,60 0,72 8,93 0,88Harmonic mean 4,28 10,82 17,54 0,40 0,39 0,69 8,71 0,86
93
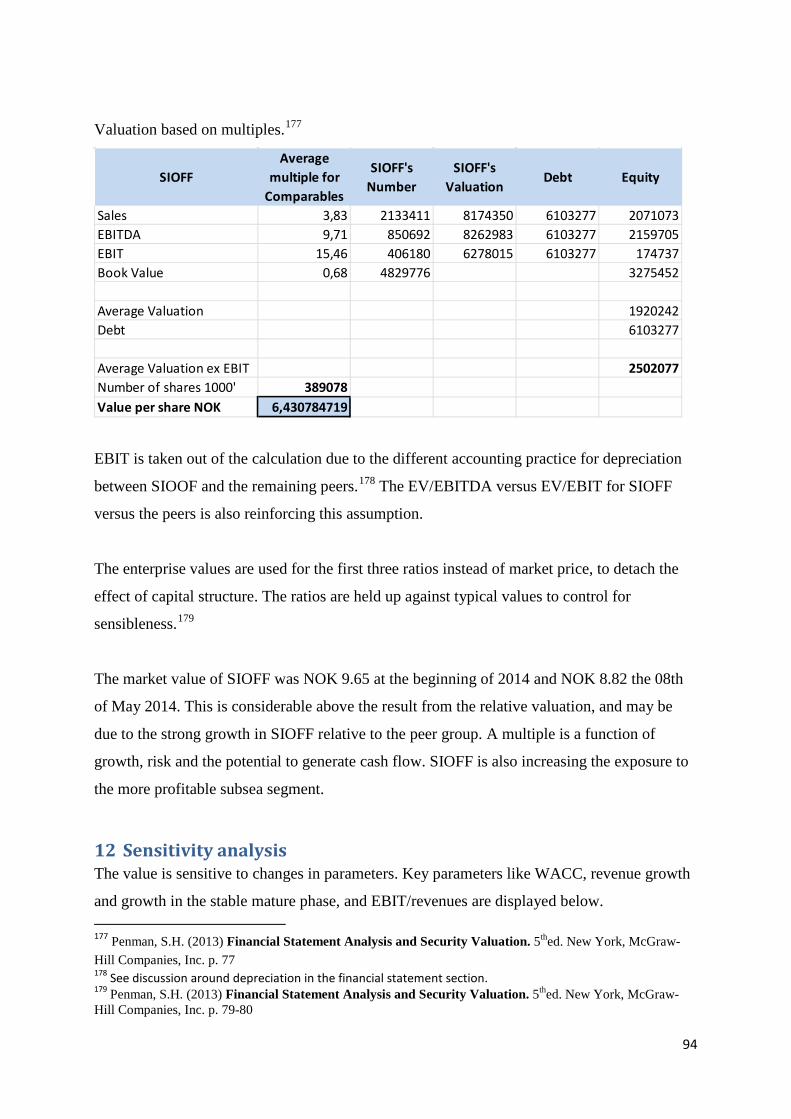
Valuation based on multiples.177
EBIT is taken out of the calculation due to the different accounting practice for depreciation
between SIOOF and the remaining peers.178 The EV/EBITDA versus EV/EBIT for SIOFF
versus the peers is also reinforcing this assumption.
The enterprise values are used for the first three ratios instead of market price, to detach the
effect of capital structure. The ratios are held up against typical values to control for
sensibleness.179
The market value of SIOFF was NOK 9.65 at the beginning of 2014 and NOK 8.82 the 08th
of May 2014. This is considerable above the result from the relative valuation, and may be
due to the strong growth in SIOFF relative to the peer group. A multiple is a function of
growth, risk and the potential to generate cash flow. SIOFF is also increasing the exposure to
the more profitable subsea segment.
12 Sensitivity analysis The value is sensitive to changes in parameters. Key parameters like WACC, revenue growth
and growth in the stable mature phase, and EBIT/revenues are displayed below.
177 Penman, S.H. (2013) Financial Statement Analysis and Security Valuation. 5thed. New York, McGraw-Hill Companies, Inc. p. 77 178 See discussion around depreciation in the financial statement section. 179 Penman, S.H. (2013) Financial Statement Analysis and Security Valuation. 5thed. New York, McGraw-Hill Companies, Inc. p. 79-80
SIOFFAverage
multiple for Comparables
SIOFF's Number
SIOFF's Valuation
Debt Equity
Sales 3,83 2133411 8174350 6103277 2071073EBITDA 9,71 850692 8262983 6103277 2159705EBIT 15,46 406180 6278015 6103277 174737Book Value 0,68 4829776 3275452
Average Valuation 1920242Debt 6103277
Average Valuation ex EBIT 2502077Number of shares 1000' 389078Value per share NOK 6,430784719
94
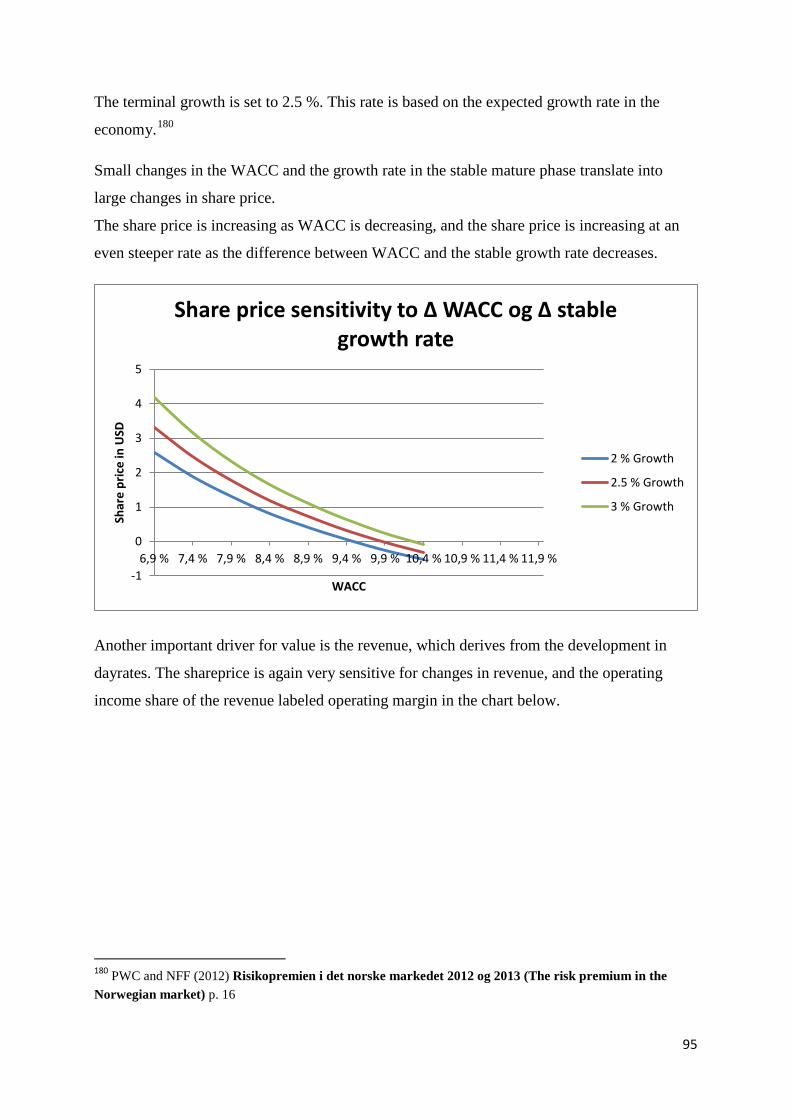
The terminal growth is set to 2.5 %. This rate is based on the expected growth rate in the
economy.180
Small changes in the WACC and the growth rate in the stable mature phase translate into
large changes in share price.
The share price is increasing as WACC is decreasing, and the share price is increasing at an
even steeper rate as the difference between WACC and the stable growth rate decreases.
Another important driver for value is the revenue, which derives from the development in
dayrates. The shareprice is again very sensitive for changes in revenue, and the operating
income share of the revenue labeled operating margin in the chart below.
180 PWC and NFF (2012) Risikopremien i det norske markedet 2012 og 2013 (The risk premium in the Norwegian market) p. 16
-1
0
1
2
3
4
5
6,9 % 7,4 % 7,9 % 8,4 % 8,9 % 9,4 % 9,9 % 10,4 % 10,9 % 11,4 % 11,9 %
Shar
e pr
ice
in U
SD
WACC
Share price sensitivity to Δ WACC og Δ stable growth rate
2 % Growth
2.5 % Growth
3 % Growth
95
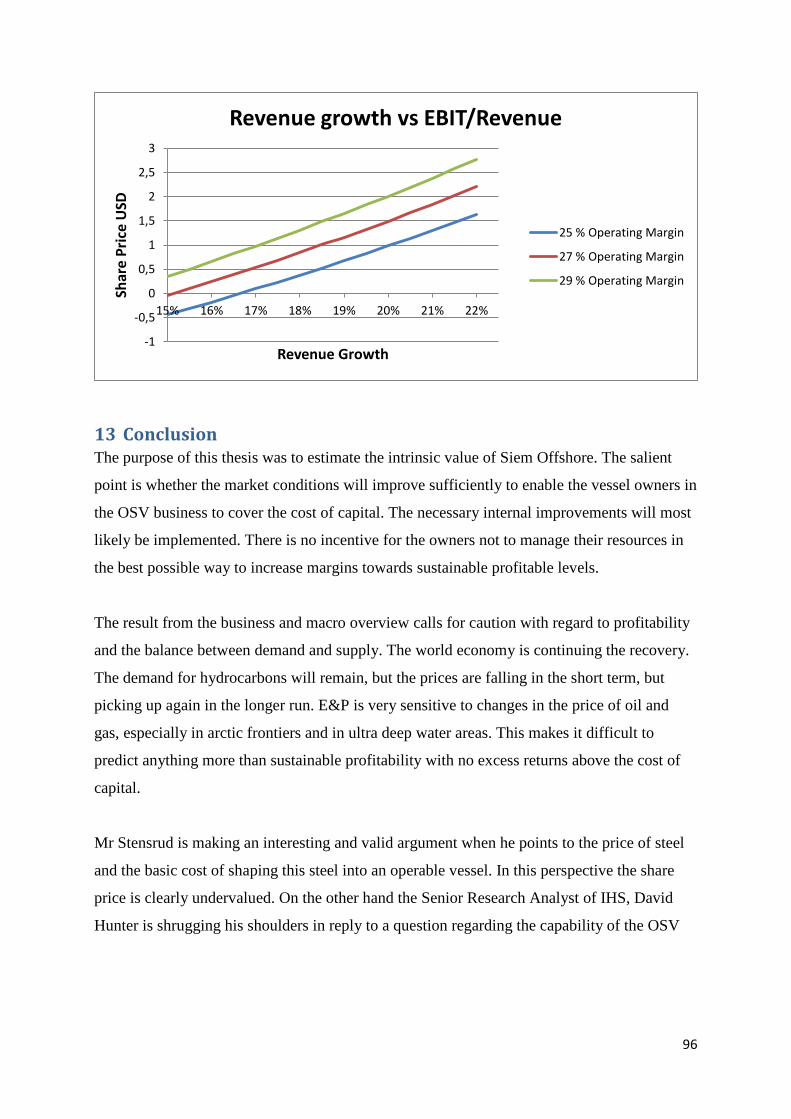
13 Conclusion The purpose of this thesis was to estimate the intrinsic value of Siem Offshore. The salient
point is whether the market conditions will improve sufficiently to enable the vessel owners in
the OSV business to cover the cost of capital. The necessary internal improvements will most
likely be implemented. There is no incentive for the owners not to manage their resources in
the best possible way to increase margins towards sustainable profitable levels.
The result from the business and macro overview calls for caution with regard to profitability
and the balance between demand and supply. The world economy is continuing the recovery.
The demand for hydrocarbons will remain, but the prices are falling in the short term, but
picking up again in the longer run. E&P is very sensitive to changes in the price of oil and
gas, especially in arctic frontiers and in ultra deep water areas. This makes it difficult to
predict anything more than sustainable profitability with no excess returns above the cost of
capital.
Mr Stensrud is making an interesting and valid argument when he points to the price of steel
and the basic cost of shaping this steel into an operable vessel. In this perspective the share
price is clearly undervalued. On the other hand the Senior Research Analyst of IHS, David
Hunter is shrugging his shoulders in reply to a question regarding the capability of the OSV
-1
-0,5
0
0,5
1
1,5
2
2,5
3
15% 16% 17% 18% 19% 20% 21% 22%
Shar
e Pr
ice
USD
Revenue Growth
Revenue growth vs EBIT/Revenue
25 % Operating Margin
27 % Operating Margin
29 % Operating Margin
96
market to absorb all the newbuilds.181 Mr Hunter is following the OSV market in particular.
IHS, former Petrodata, is tracking every vessel worldwide and is the main supplier of data to
the business.
The well specified fleet in Siem Offshore will most likely find employed, but will the rates
defend the extra cost of a high end vessel?
The sensitivity analysis demonstrates that the value is very sensitive to even small changes in
any of the key parameter. This means that the valuation is associated (tied up) with a fair
amount of uncertainty.
The DCF is the basis for this valuation and is consequently given the largest weight, with the
relative valuation regarded as a supplement. Based on the result from the DCF valuation (80%
weight) and the relative valuation (20 % weight) the estimated value per share is 0.8 x 7.72 +
0.2 x 6.43 = 7.46
The estimated value in this paper is below the analyst’s estimates. According to Møller and
Kaldestad many valuations tend to be on the positive side. They are pointing to weakness in
the analysis and several behavioral biases and analyst’s being overly optimistic. They claim
that the real life probability distribution usually have fat tails on the left side. The probability
for disaster is greater than the probability for very good news. They justify this view by
referring to catastrophe scenarios and Taleb’s black swans. Competition from new players and
substitutes further complicates the picture in the long run.182
Based on the findings, assumptions and estimates throughout this paper the recommendation
to investor is – Sell.
181 IHS Breakfast briefing in Stavanger on March 26, 2014. Subject; Offshore Rig Market, Supply Vessel Trends and more from IHS Petrodata Experts. 182 Praktisk Økonomi & Finans (2/2011) Tema Verdsettelse p. 60-65
97

14 Bibliography
14.1 Books Bodie, Z., Merton, R.C., Cleeton, D.L. (2009) Financial Economics 2nd ed. New Jersey,
Pearson Education Inc.
Bodie, Z., Kane, A., Marcus, A.J. (2011) Investments and Portfolio Management 9th ed.
New York, Mc Graw-Hill Companies Inc.
Damodaran, A. (2006) Damodaran on Valuation. 2nd ed. New Jersey, John Wiley & Sons,
Inc.
Damodaran, A. (2010) The Dark Side of Valuation. 2nd ed. New Jersey, Pearson Education,
inc. Published as FT Press
Damodaran, A. (2011) Applied Corporate Finance. 3rd ed. New Jersey, John Wiley & Sons,
Inc.
Damodaran, A. (2012) Investment Valuation. 3rd ed. New Jersey, John Wiley & Sons, Inc.
Graham, B. (2006) The Intelligent Investor. Revised edition. New York, HarperCollins
Publishers.
Hirt, G.A. & Block, S.B. (2012) Fundamentals of Investment Management. 10th ed. New
York, McGraw-Hill Companies Inc.
Koller, T., Goedhart, M. & Wessels, D. (2010) Valuation, Measuring and Managing the
Value of Companies. Mc Kinsey & Company 5th ed. New Jersey, John Wiley & Sons, Inc.
Penman, S.H. (2013) Financial Statement Analysis and Security Valuation. 5thed. New
York, McGraw-Hill Companies, Inc.
Petersen, C.V. & Plenborg, T. (2012) Financial Statement Analysis. Harlow, Pearson
Education Limited
Titman, S. & Martin, J. (2014) Valuation: The Art and Science of Corporate Investment
Decisions.2nd ed. Harlow, Pearson Education Limited (the book was bought in 2013)
14.2 Lecture and lecture notes MØA370 Valuation Fall term 2013 Instructor: Bernt Arne Ødegaard at
UiS http://dl.dropboxusercontent.com/u/8078351/teach/moa370_2013/index.html
98
Rekneskapsanalyse og verdivurdering BUS 440 Professor Kjell Henry Knivsflå at
NHH http://course.nhh.no/master/BUS440/
MØA 220 Financial statement analysis and security valuation, Lecture slides Spring term
2014 Instructor: Quinqian DU at UiS
14.3 Research reports and papers Barro, R. and Ursua, J. (2008) Macroeconomic Crisis since 1870 (April 2008)
BP, Energy Outlook 2035 (January 2014)’
Damodaran, A. (2013) Equity Risk Premiums (ERP): Determinants, Estimation and
Implications – The 2013 Edition (March 2013)
Dimson, E., Marsh, P., Staunton, M. (2011) Equity Premia Around the World (7 October
2011)
Energy Information Administration (EIA), International Energy Outlook 2013 (July 2013)
Fernandez et al. (2012) Market risk premium used in 82 countries in 2012: a survey with
7192 answers (November 23 2013)
Mehra, R. and Prescott, E.C. (1985) The Equity Premium – A Puzzle. Journal of Monetary
Economics 15 (1985) p. 145-161
Miller, M. H. and Modigliani, F. (1958) The Cost of Capital, Corporation Finance and the
Theory of Investment. The American Economic Review, Volume XLVIII (June 1958
Number Three)
Norges Bank, Pengepolitisk Rapport 3/2013 (September, 2013)
Norges Bank, Pengepolitisk Rapport 4/2013 (December, 2013)
Norges Bank, Pengepolitisk Rapport 1/2014 (March, 2014)
International Energy Agency (IEA), World Energy Outlook Special Report (10 June 2013)
International Energy Agency (IEA), Key World Energy Statistics (2013)
International Energy Agency (IEA), World Energy Outlook 2013 – Executive Summary
(2013)
99
International Monetary Fund (IMF), World Economic Outlook. (April 2012)
International Monetary Fund (IMF), World Economic Outlook. (October 2013)
International Monetary Fund (IMF), World Economic Outlook - Update (January 21, 2014)
International Monetary Fund (IMF), Oil Prices and Global Imbalances (2006)
International Monetary Fund (IMF), Commodity Price Outlook & Risks (February 14,
2014)
Organization for Economic Co-operation and Development (OECD) Economic Outlook
No.94, Volume 2013 Issue 2 (November 2013) Read
online; http://www.keepeek.com/Digital-Asset-Management/oecd/economics/oecd-economic-
outlook-volume-2013-issue-2_eco_outlook-v2013-2-en#page1
Damodaran, A. (2007) Return on Capital (ROC), Return on Invested Capital (ROIC) and
Return on Equity (ROE): Measurement and Implications. Stern School of Business
14.4 Articles, surveys and publications Dagens Næringsliv (2014) Tror olje hører fortiden til (20. februar 2014)
Gjesdal, F. (2007) Regnskapsanalyse: Omgruppering av regnskapet for eierkontroll og
verdsettelse. Praktisk Økonomi & Finans (2/2007)
KPMG Law (2013) Tax Facts Norway 2013 A survey of the Norwegian Tax System
Madsen, A. (2014) Gullalderen kan være over. Offshore.no (07 January
2014) http://www.offshore.no/sak/60484_gullalderen_kan_vaere_over_#
Norske Finansanalytikeres Forening (NFF) The Norwegian Society of Financial Analysts.
NFFs Komite for Finansiell Informasjon, Uttalelse 2013 1. Avskrivninger i Supply (12 Sept
2013)
Norwegian tonnage tax – an attractive
regime http://www.internationallawoffice.com/newsletters/detail.aspx?g=7b4091a3-ccba-
40a0-8827-3a556dc83ceb (24 October 2012)
Praktisk Økonomi & Finans (2/2011) Tema Verdsettelse
100
PWC and NFF (2012) Risikopremien i det norske markedet 2012 og 2013 (The risk
premium in the Norwegian market)
Sunnmørsposten http://www.smp.no/nyheter/article7704395.ece (07 June 2013)
Victor H. Mair (2009) How a misunderstanding about Chinese characters has led many astray
Pinyin.info (September 2009) http://www.pinyin.info/chinese/crisis.html
14.5 Analytical reports ABG Sundal Collier (2013) Offshore Supply & Subsea, Credit Research – Sector report,
(Oct. 29 2013)
Arctic Securities (2014) Result analysis Siem Offshore (20 February 2014)
Clarkson Capital Markets (2012) Overview of the Offshore Supply Vessel Industry (May
2012)
Fearnley Offshore Supply
The Offshore Report No.1 Offshore Support and Specialized Vessels (7 Feb.
2014)
The Offshore Report No.2 Offshore Support and Specialized Vessels (8
March 2014)
Fearnley Securities AS
OSV Sector outlook 4q13 previews (24 February 2014)
RS Platou ASA
Global Support Vessel Monthly (January & February 2014)
Rig Montly (January 2013)
RS Platou Montly (February 2014)
The North Sea OSV Market (January 2014)
The Platou Report (2013)
The Platou Report (2014)
Weekly North Sea Spot Market Update (week 09, 2014)
Swedbank First Securities
Offshore Supply Vessels (June 2012)
101
Norwegian Offshore Supply Companies (2013)
Westshore Shipbrokers AS (2013) Market Presentation
IHS Petrodata Breakfast Briefing: Offshore Rig Market, Supply Vessel Trends (March
26, 2014)
14.6 Annual and Quarterly reports Siem Offshore ASA Annual reports 2013,2012,2011,2010, 2009,2008,2007,2006,2005?
Siem Offshore ASA Q4 2013
14.7 Personal Communication Rostant, André A. ([email protected]), 25 February 2014. Rapporter. Geir Vidnes
14.8 Web Aswath Damodaran http://pages.stern.nyu.edu/~adamodar/
Bloomberg http://www.bloomberg.com/
BP http://www.bp.com/
Investopedia http://www.investopedia.com/
Norges Bank http://www.norges-bank.no/
Oslo Stock Exchange http://www.oslobors.no/
Reuters http://www.reuters.com/
Reuters SIOFF
Highlights http://www.reuters.com/finance/stocks/financialHighlights?symbol=SIOFF.OL
Reuters SIOFF
Overview http://www.reuters.com/finance/stocks/overview?symbol=SIOFF.OL
Reuters SIOFF Analyst http://www.reuters.com/finance/stocks/analyst?symbol=SIOFF.OL
Revisjon.no http://www.revisjon.no
RS Platou ASA http://www.platou.com/dnn_site/Default.aspx
102
Siem Offshore http://www.siemoffshore.com/
Yahoo Finance http://finance.yahoo.com/
Ensco http://www.enscoplc.com/Rig-Fleet/Definitions/default.aspx
Acteon Customer Magazine http://www.acteon.com/s2s-magazine/s2s-issue-11/making-all-
the-right-moves-346
Acteon http://www.acteon.com/
Maersk Gryphon
accident; http://www.maerskoil.com/media/newsroom/pages/maerskoiluk%E2%80%99sgryp
honfpsobackinproduction.aspx
10 Regnskapsprinsipper http://www.revisjon.no/spesielle_tema_regnskap
Regnskapsloven http://lovdata.no/dokument/NL/lov/1998-07-17-56
Altinn Beregning av økonomiske
nøkkeltall http://webcache.googleusercontent.com/search?q=cache:QzlrL6G0eZwJ:https://w
ww.altinn.no/Global/Starte%2520og%2520drive%2520bedrift/Dokumentmaler/Nokkeltall.do
c+&cd=1&hl=no&ct=clnk&gl=no
Tax rates by countries by KPMG http://www.kpmg.com/global/en/services/tax/tax-tools-and-
resources/pages/corporate-tax-rates-table.aspx
Foreign exchange rates, Norges Bank http://www.norges-
bank.no/no/prisstabilitet/valutakurser/usd/
Statsobligasjoner (Treasury notes), Norges Bank http://www.norges-
bank.no/no/prisstabilitet/rentestatistikk/statsobligasjoner-rente-daglige-noteringer/
U.S. Department of Treasury http://www.treasury.gov/resource-center/data-chart-
center/interest-rates/Pages/TextView.aspx?data=yield
Beta by industry http://pages.stern.nyu.edu/~adamodar/New_Home_Page/datafile/Betas.html
Ratings, Interest Coverage Ratios and Default
Spread http://pages.stern.nyu.edu/~adamodar/New_Home_Page/datafile/ratings.htm
103
Lov om skatt av formue og inntekt (skatteloven) http://lovdata.no/dokument/NL/lov/1999-03-
26-14/*#*
More on effective tax
rates http://pages.stern.nyu.edu/~adamodar/New_Home_Page/valquestions/taxrate.htm
GICS codes http://www.msci.com/products/indexes/sector/gics/
Cost of Capital data http://pages.stern.nyu.edu/~adamodar/New_Home_Page/data.html
WACC tutorial http://pages.stern.nyu.edu/~igiddy/articles/wacc_tutorial.pdf
Siem WIS MPD http://www.offshore.no/sak/61261_gjennombrudd_for_boreteknologi (09
May 2014)
15 Appendix
15.1 Financial Statement Appendix
Fra: Glenn Pettersen [mailto:[email protected]] Sendt: 16. mai 2014 11:34 Til: 'Geir Vidnes' Emne: RE: årsrapporter
Hei,
Dette dokumentet inneholder noe om norsk tonnasjebeskatning som det meste av vår flåte er underlagt (ref. effektiv skattesats).
Mvh
Glenn Pettersen
Fra: Glenn Pettersen [mailto:[email protected]] Sendt: 23. april 2014 13:17 Til: 'Geir Vidnes' Emne: RE: årsrapporter
Hei,
104
Jeg har forhørt meg slik at vår tax manager ser på dette.
Kommer tilbake så snart jeg får noe derfra.
Mvh
Glenn Pettersen
Fra: Glenn Pettersen [mailto:[email protected]] Sendt: 16. mai 2014 11:53 Til: 'Geir Vidnes' Emne: RE: årsrapporter
Hei,
Som børsnotert selskap, kan vi ikke gå ut med mer informasjon enn hva vi gir til markedet/offentlig.
I forbindelse med å finne marginalskattesats er som regel dine egne argumentasjoner og vurderinger viktigs ifm denne typen oppgaver, men også ispedd faktiske forhold i de enkelte regioner. Derfor er ikke faktisk skattesats utslagsgivende. (snakker av erfaring).
I det store og hele vil ikke skattesatsen materielt være utslagsgivende for din verdivurdering, noe du også vil se dersom du gjør sensitivitetsanalyser.
Mvh
Glenn Pettersen
105
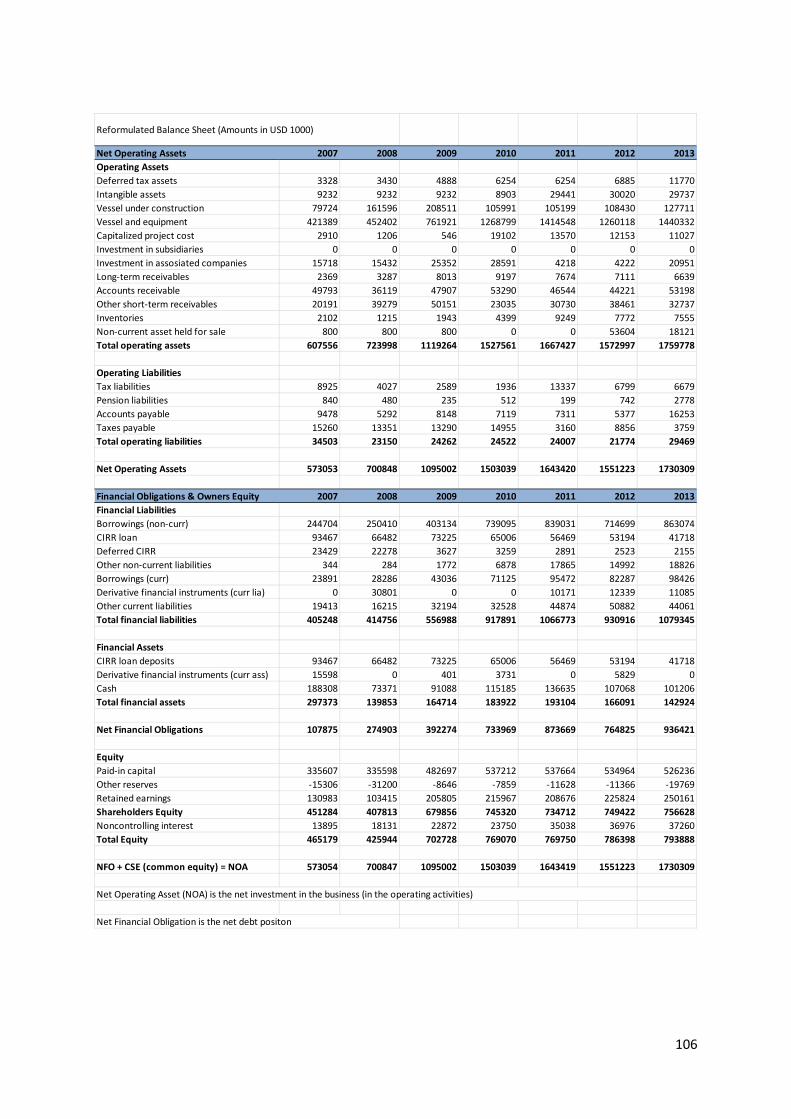
Net Operating Assets 2007 2008 2009 2010 2011 2012 2013Operating AssetsDeferred tax assets 3328 3430 4888 6254 6254 6885 11770Intangible assets 9232 9232 9232 8903 29441 30020 29737Vessel under construction 79724 161596 208511 105991 105199 108430 127711Vessel and equipment 421389 452402 761921 1268799 1414548 1260118 1440332Capitalized project cost 2910 1206 546 19102 13570 12153 11027Investment in subsidiaries 0 0 0 0 0 0 0Investment in assosiated companies 15718 15432 25352 28591 4218 4222 20951Long-term receivables 2369 3287 8013 9197 7674 7111 6639Accounts receivable 49793 36119 47907 53290 46544 44221 53198Other short-term receivables 20191 39279 50151 23035 30730 38461 32737Inventories 2102 1215 1943 4399 9249 7772 7555Non-current asset held for sale 800 800 800 0 0 53604 18121Total operating assets 607556 723998 1119264 1527561 1667427 1572997 1759778
Operating LiabilitiesTax liabilities 8925 4027 2589 1936 13337 6799 6679Pension liabilities 840 480 235 512 199 742 2778Accounts payable 9478 5292 8148 7119 7311 5377 16253Taxes payable 15260 13351 13290 14955 3160 8856 3759Total operating liabilities 34503 23150 24262 24522 24007 21774 29469
Net Operating Assets 573053 700848 1095002 1503039 1643420 1551223 1730309
Financial Obligations & Owners Equity 2007 2008 2009 2010 2011 2012 2013Financial LiabilitiesBorrowings (non-curr) 244704 250410 403134 739095 839031 714699 863074CIRR loan 93467 66482 73225 65006 56469 53194 41718Deferred CIRR 23429 22278 3627 3259 2891 2523 2155Other non-current liabilities 344 284 1772 6878 17865 14992 18826Borrowings (curr) 23891 28286 43036 71125 95472 82287 98426Derivative financial instruments (curr lia) 0 30801 0 0 10171 12339 11085Other current liabilities 19413 16215 32194 32528 44874 50882 44061Total financial liabilities 405248 414756 556988 917891 1066773 930916 1079345
Financial AssetsCIRR loan deposits 93467 66482 73225 65006 56469 53194 41718Derivative financial instruments (curr ass) 15598 0 401 3731 0 5829 0Cash 188308 73371 91088 115185 136635 107068 101206Total financial assets 297373 139853 164714 183922 193104 166091 142924
Net Financial Obligations 107875 274903 392274 733969 873669 764825 936421
EquityPaid-in capital 335607 335598 482697 537212 537664 534964 526236Other reserves -15306 -31200 -8646 -7859 -11628 -11366 -19769Retained earnings 130983 103415 205805 215967 208676 225824 250161Shareholders Equity 451284 407813 679856 745320 734712 749422 756628Noncontrolling interest 13895 18131 22872 23750 35038 36976 37260Total Equity 465179 425944 702728 769070 769750 786398 793888
NFO + CSE (common equity) = NOA 573054 700847 1095002 1503039 1643419 1551223 1730309
Reformulated Balance Sheet (Amounts in USD 1000)
Net Operating Asset (NOA) is the net investment in the business (in the operating activities)
Net Financial Obligation is the net debt positon
106
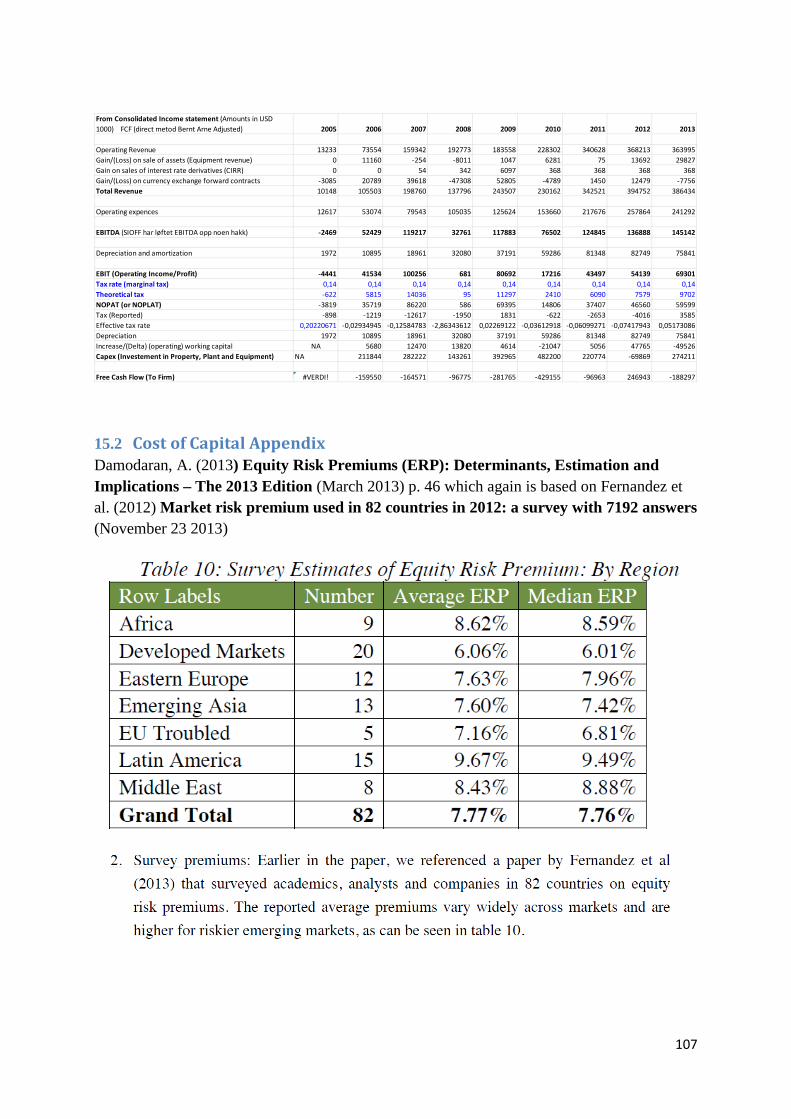
15.2 Cost of Capital Appendix Damodaran, A. (2013) Equity Risk Premiums (ERP): Determinants, Estimation and Implications – The 2013 Edition (March 2013) p. 46 which again is based on Fernandez et al. (2012) Market risk premium used in 82 countries in 2012: a survey with 7192 answers (November 23 2013)
From Consolidated Income statement (Amounts in USD 1000) FCF (direct metod Bernt Arne Adjusted) 2005 2006 2007 2008 2009 2010 2011 2012 2013
Operating Revenue 13233 73554 159342 192773 183558 228302 340628 368213 363995Gain/(Loss) on sale of assets (Equipment revenue) 0 11160 -254 -8011 1047 6281 75 13692 29827Gain on sales of interest rate derivatives (CIRR) 0 0 54 342 6097 368 368 368 368Gain/(Loss) on currency exchange forward contracts -3085 20789 39618 -47308 52805 -4789 1450 12479 -7756Total Revenue 10148 105503 198760 137796 243507 230162 342521 394752 386434
Operating expences 12617 53074 79543 105035 125624 153660 217676 257864 241292
EBITDA (SIOFF har løftet EBITDA opp noen hakk) -2469 52429 119217 32761 117883 76502 124845 136888 145142
Depreciation and amortization 1972 10895 18961 32080 37191 59286 81348 82749 75841
EBIT (Operating Income/Profit) -4441 41534 100256 681 80692 17216 43497 54139 69301Tax rate (marginal tax) 0,14 0,14 0,14 0,14 0,14 0,14 0,14 0,14 0,14Theoretical tax -622 5815 14036 95 11297 2410 6090 7579 9702NOPAT (or NOPLAT) -3819 35719 86220 586 69395 14806 37407 46560 59599Tax (Reported) -898 -1219 -12617 -1950 1831 -622 -2653 -4016 3585Effective tax rate 0,20220671 -0,02934945 -0,12584783 -2,86343612 0,02269122 -0,03612918 -0,06099271 -0,07417943 0,05173086Depreciation 1972 10895 18961 32080 37191 59286 81348 82749 75841Increase/(Delta) (operating) working capital NA 5680 12470 13820 4614 -21047 5056 47765 -49526Capex (Investement in Property, Plant and Equipment) NA 211844 282222 143261 392965 482200 220774 -69869 274211
Free Cash Flow (To Firm) #VERDI! -159550 -164571 -96775 -281765 -429155 -96963 246943 -188297
107
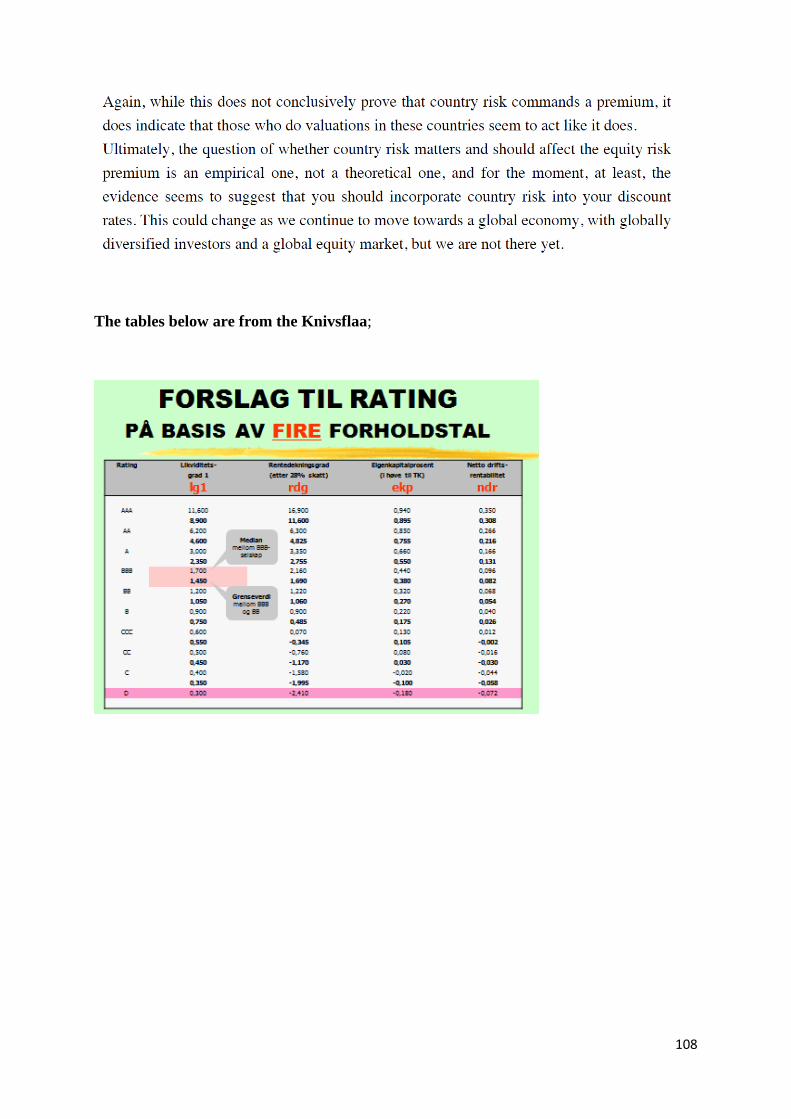
The tables below are from the Knivsflaa;
108
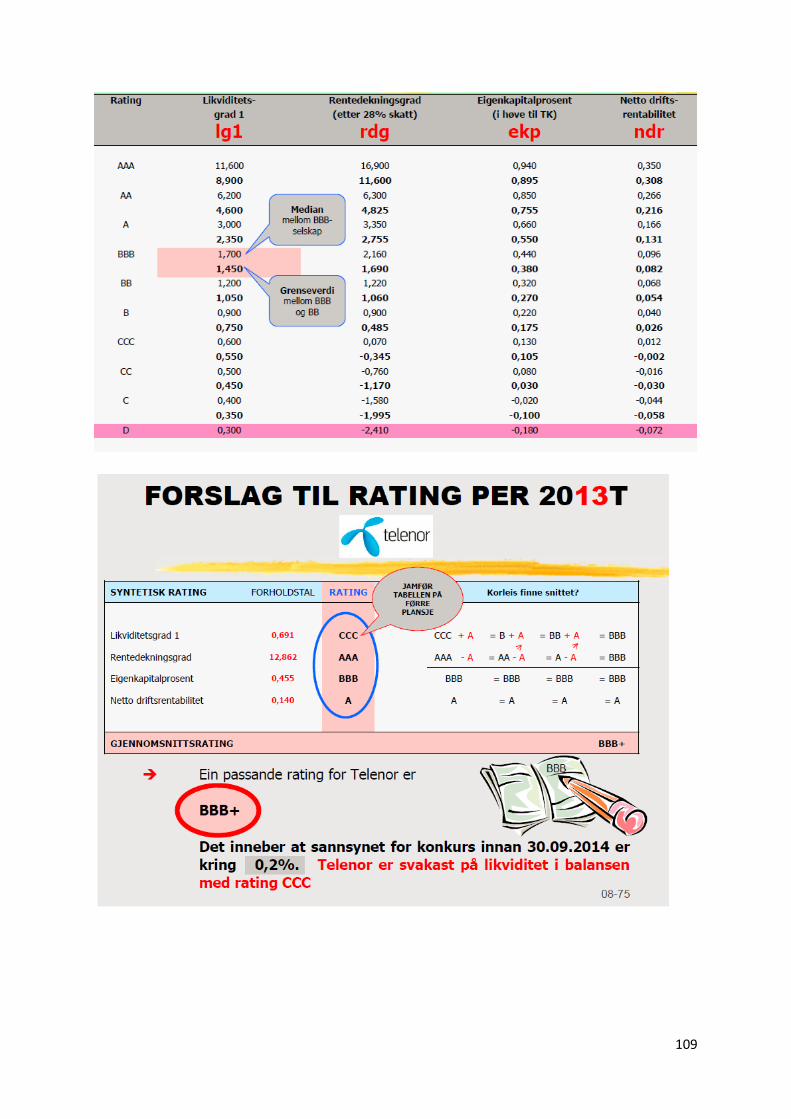
109
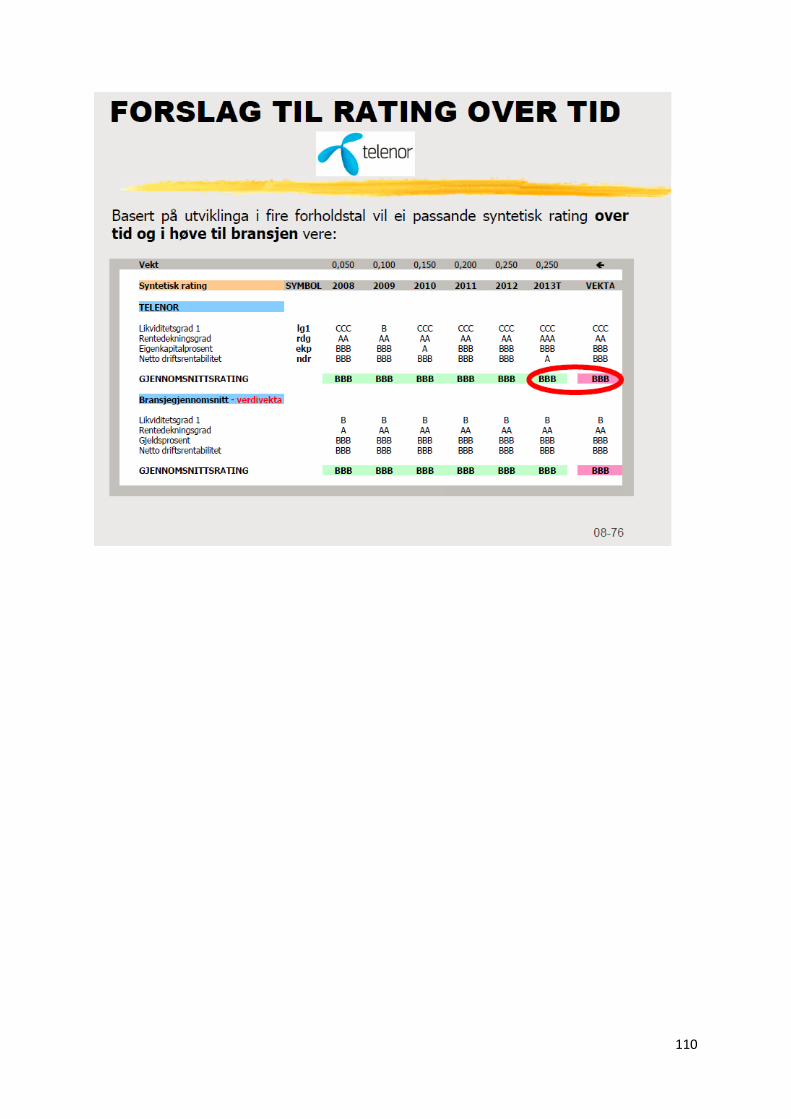
110
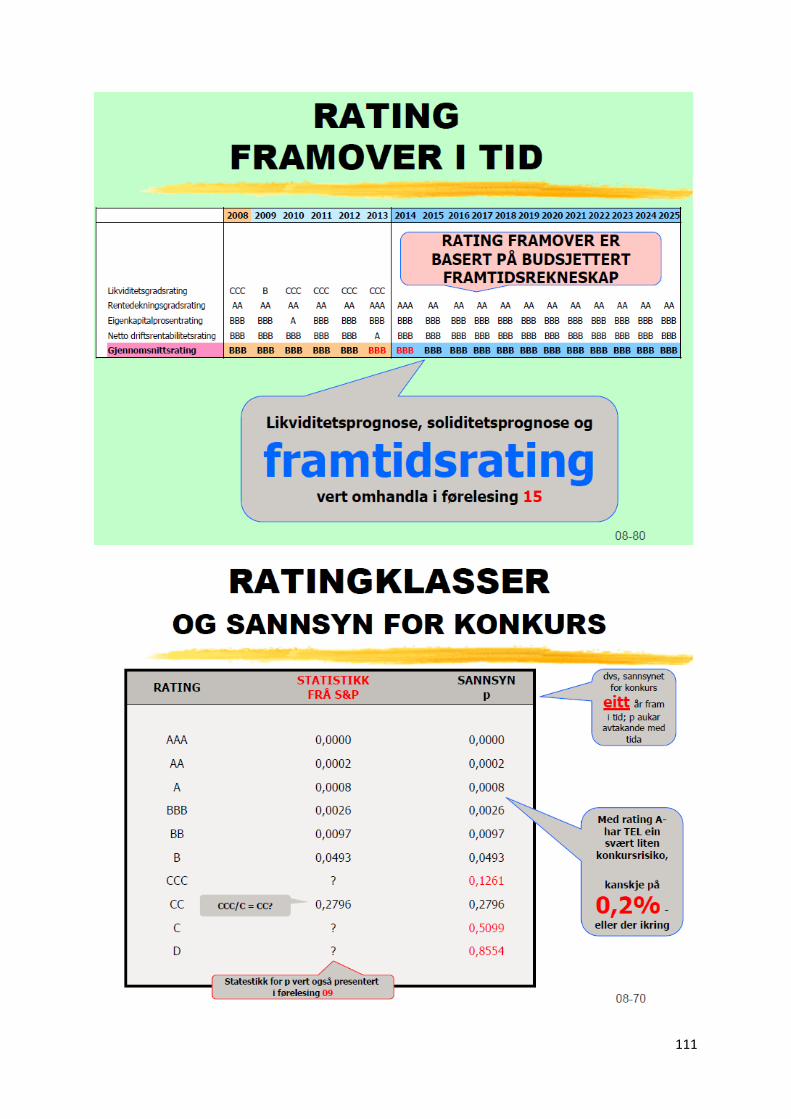
111
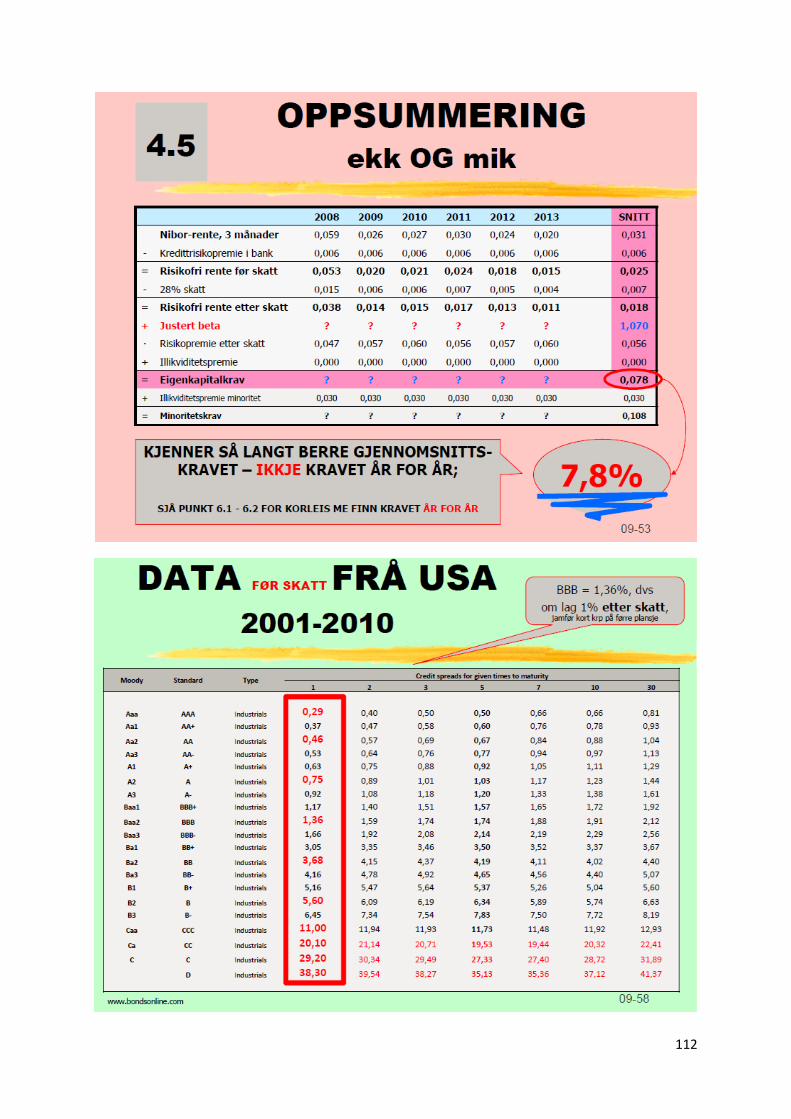
112
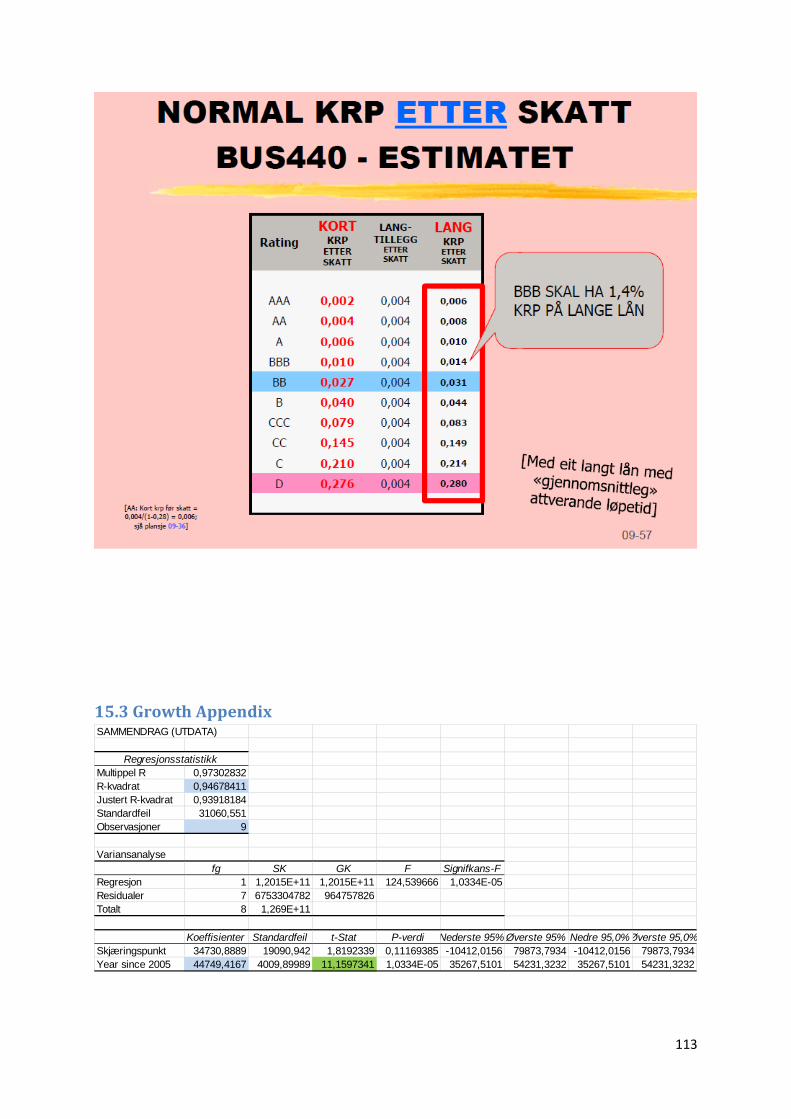
15.3 Growth Appendix
SAMMENDRAG (UTDATA)
RegresjonsstatistikkMultippel R 0,97302832R-kvadrat 0,94678411Justert R-kvadrat 0,93918184Standardfeil 31060,551Observasjoner 9
Variansanalysefg SK GK F Signifkans-F
Regresjon 1 1,2015E+11 1,2015E+11 124,539666 1,0334E-05Residualer 7 6753304782 964757826Totalt 8 1,269E+11
Koeffisienter Standardfeil t-Stat P-verdi Nederste 95% Øverste 95% Nedre 95,0%Øverste 95,0%Skjæringspunkt 34730,8889 19090,942 1,8192339 0,11169385 -10412,0156 79873,7934 -10412,0156 79873,7934Year since 2005 44749,4167 4009,89989 11,1597341 1,0334E-05 35267,5101 54231,3232 35267,5101 54231,3232
113
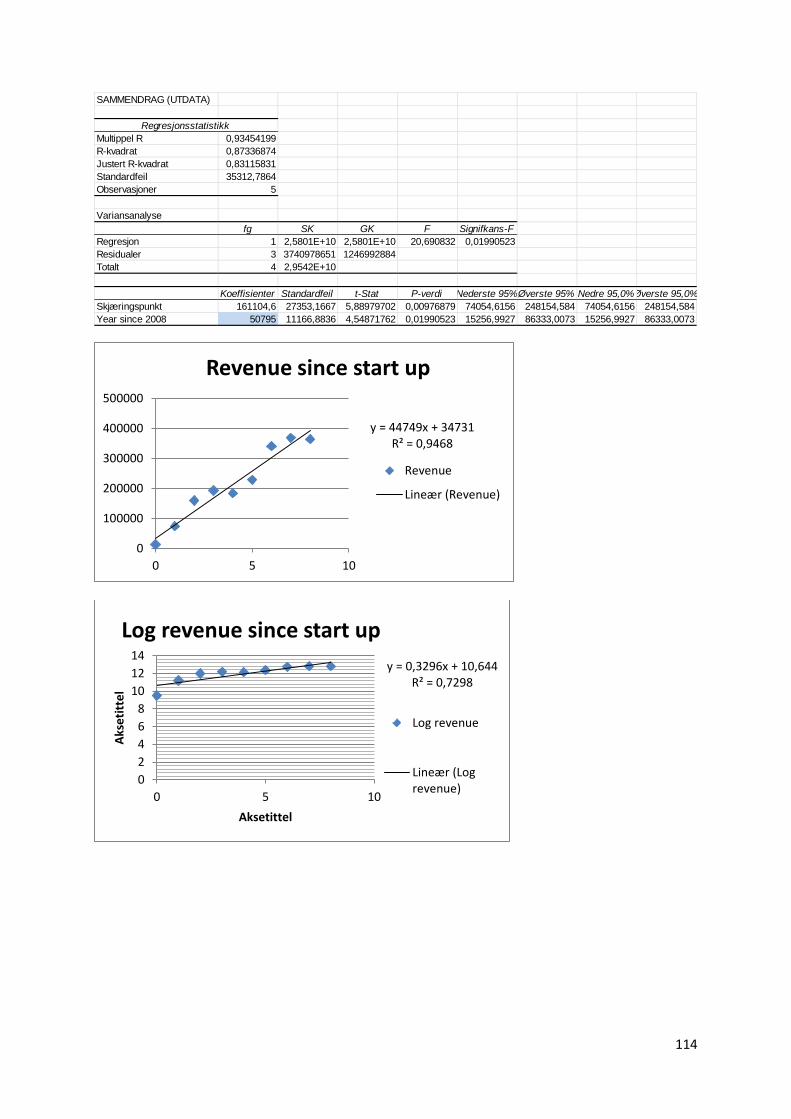
SAMMENDRAG (UTDATA)
RegresjonsstatistikkMultippel R 0,93454199R-kvadrat 0,87336874Justert R-kvadrat 0,83115831Standardfeil 35312,7864Observasjoner 5
Variansanalysefg SK GK F Signifkans-F
Regresjon 1 2,5801E+10 2,5801E+10 20,690832 0,01990523Residualer 3 3740978651 1246992884Totalt 4 2,9542E+10
Koeffisienter Standardfeil t-Stat P-verdi Nederste 95%Øverste 95% Nedre 95,0%Øverste 95,0%Skjæringspunkt 161104,6 27353,1667 5,88979702 0,00976879 74054,6156 248154,584 74054,6156 248154,584Year since 2008 50795 11166,8836 4,54871762 0,01990523 15256,9927 86333,0073 15256,9927 86333,0073
y = 44749x + 34731 R² = 0,9468
0
100000
200000
300000
400000
500000
0 5 10
Revenue since start up
Revenue
Lineær (Revenue)
y = 0,3296x + 10,644 R² = 0,7298
02468
101214
0 5 10
Akse
titte
l
Aksetittel
Log revenue since start up
Log revenue
Lineær (Logrevenue)
114
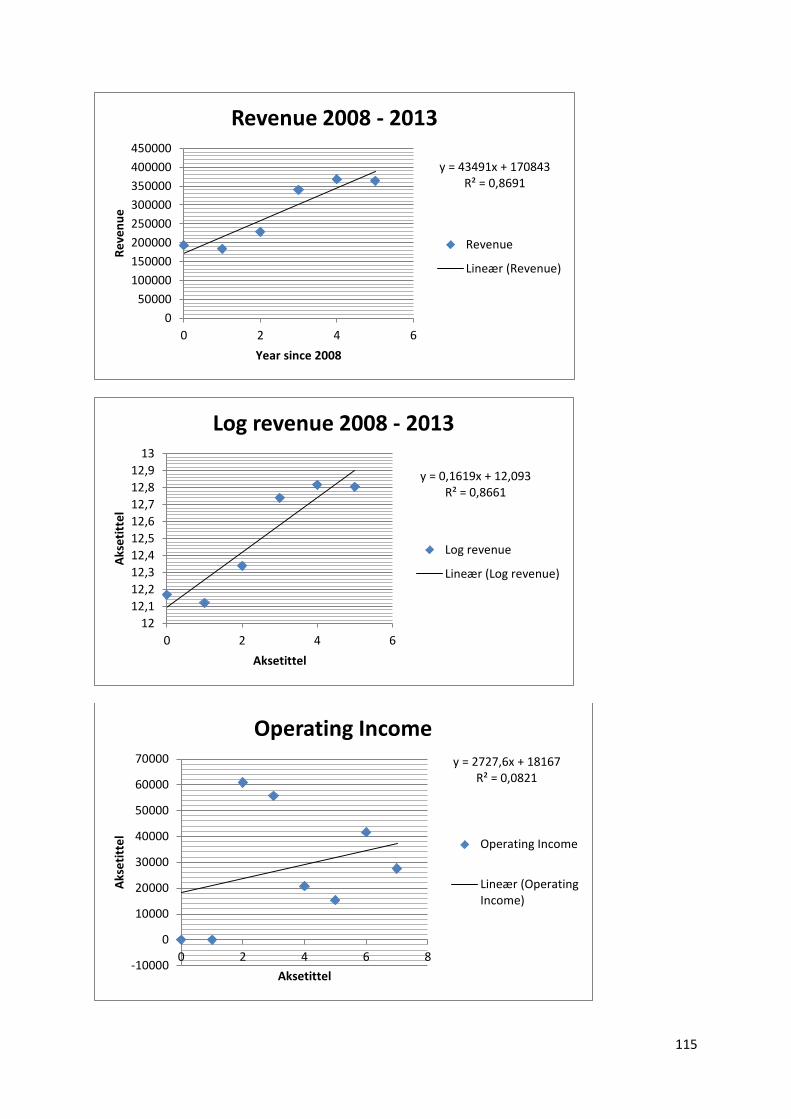
y = 43491x + 170843 R² = 0,8691
050000
100000150000200000250000300000350000400000450000
0 2 4 6
Reve
nue
Year since 2008
Revenue 2008 - 2013
Revenue
Lineær (Revenue)
y = 0,1619x + 12,093 R² = 0,8661
1212,112,212,312,412,512,612,712,812,9
13
0 2 4 6
Akse
titte
l
Aksetittel
Log revenue 2008 - 2013
Log revenue
Lineær (Log revenue)
y = 2727,6x + 18167 R² = 0,0821
-10000
0
10000
20000
30000
40000
50000
60000
70000
0 2 4 6 8
Akse
titte
l
Aksetittel
Operating Income
Operating Income
Lineær (OperatingIncome)
115
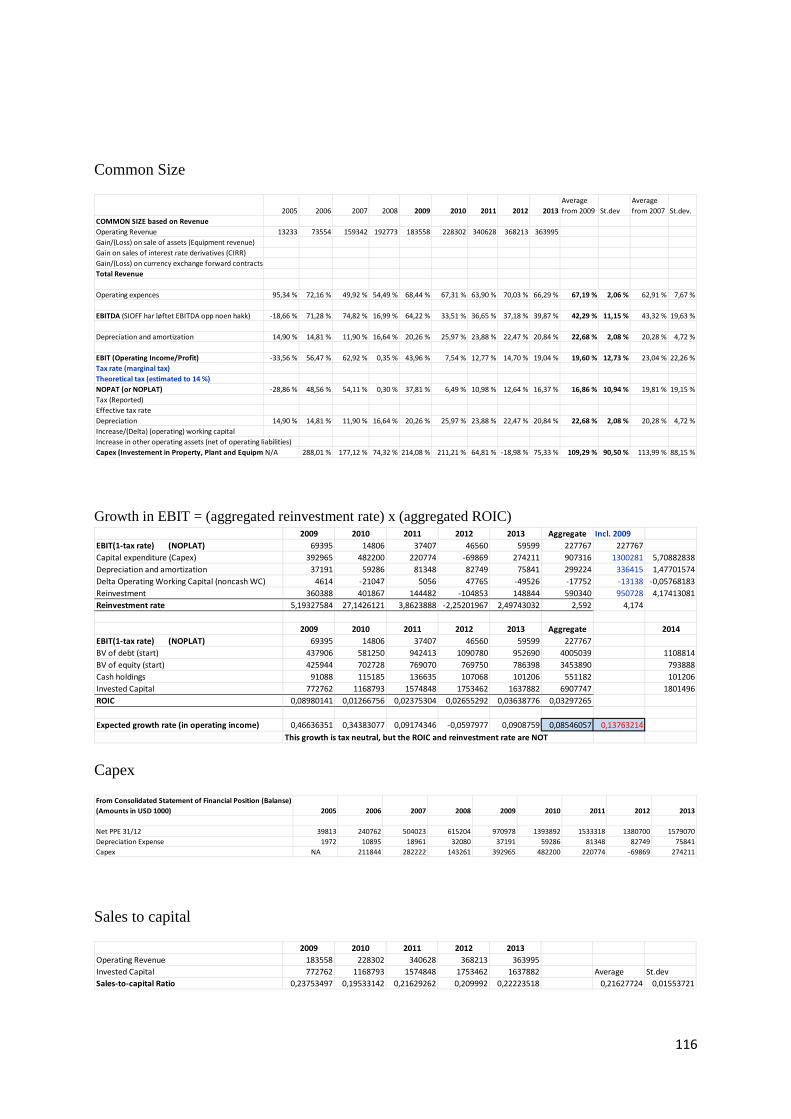
Common Size
Growth in EBIT = (aggregated reinvestment rate) x (aggregated ROIC)
Capex
Sales to capital
2005 2006 2007 2008 2009 2010 2011 2012 2013Average from 2009 St.dev
Average from 2007 St.dev.
COMMON SIZE based on RevenueOperating Revenue 13233 73554 159342 192773 183558 228302 340628 368213 363995Gain/(Loss) on sale of assets (Equipment revenue)Gain on sales of interest rate derivatives (CIRR)Gain/(Loss) on currency exchange forward contractsTotal Revenue
Operating expences 95,34 % 72,16 % 49,92 % 54,49 % 68,44 % 67,31 % 63,90 % 70,03 % 66,29 % 67,19 % 2,06 % 62,91 % 7,67 %
EBITDA (SIOFF har løftet EBITDA opp noen hakk) -18,66 % 71,28 % 74,82 % 16,99 % 64,22 % 33,51 % 36,65 % 37,18 % 39,87 % 42,29 % 11,15 % 43,32 % 19,63 %
Depreciation and amortization 14,90 % 14,81 % 11,90 % 16,64 % 20,26 % 25,97 % 23,88 % 22,47 % 20,84 % 22,68 % 2,08 % 20,28 % 4,72 %
EBIT (Operating Income/Profit) -33,56 % 56,47 % 62,92 % 0,35 % 43,96 % 7,54 % 12,77 % 14,70 % 19,04 % 19,60 % 12,73 % 23,04 % 22,26 %Tax rate (marginal tax)Theoretical tax (estimated to 14 %)NOPAT (or NOPLAT) -28,86 % 48,56 % 54,11 % 0,30 % 37,81 % 6,49 % 10,98 % 12,64 % 16,37 % 16,86 % 10,94 % 19,81 % 19,15 %Tax (Reported)Effective tax rate Depreciation 14,90 % 14,81 % 11,90 % 16,64 % 20,26 % 25,97 % 23,88 % 22,47 % 20,84 % 22,68 % 2,08 % 20,28 % 4,72 %Increase/(Delta) (operating) working capitalIncrease in other operating assets (net of operating liabilities)Capex (Investement in Property, Plant and Equipm N/A 288,01 % 177,12 % 74,32 % 214,08 % 211,21 % 64,81 % -18,98 % 75,33 % 109,29 % 90,50 % 113,99 % 88,15 %
2009 2010 2011 2012 2013 Aggregate Incl. 2009EBIT(1-tax rate) (NOPLAT) 69395 14806 37407 46560 59599 227767 227767Capital expenditure (Capex) 392965 482200 220774 -69869 274211 907316 1300281 5,70882838Depreciation and amortization 37191 59286 81348 82749 75841 299224 336415 1,47701574Delta Operating Working Capital (noncash WC) 4614 -21047 5056 47765 -49526 -17752 -13138 -0,05768183Reinvestment 360388 401867 144482 -104853 148844 590340 950728 4,17413081Reinvestment rate 5,19327584 27,1426121 3,8623888 -2,25201967 2,49743032 2,592 4,174
2009 2010 2011 2012 2013 Aggregate 2014EBIT(1-tax rate) (NOPLAT) 69395 14806 37407 46560 59599 227767BV of debt (start) 437906 581250 942413 1090780 952690 4005039 1108814BV of equity (start) 425944 702728 769070 769750 786398 3453890 793888Cash holdings 91088 115185 136635 107068 101206 551182 101206Invested Capital 772762 1168793 1574848 1753462 1637882 6907747 1801496ROIC 0,08980141 0,01266756 0,02375304 0,02655292 0,03638776 0,03297265
Expected growth rate (in operating income) 0,46636351 0,34383077 0,09174346 -0,0597977 0,0908759 0,08546057 0,13763214This growth is tax neutral, but the ROIC and reinvestment rate are NOT
From Consolidated Statement of Financial Position (Balanse) (Amounts in USD 1000) 2005 2006 2007 2008 2009 2010 2011 2012 2013
Net PPE 31/12 39813 240762 504023 615204 970978 1393892 1533318 1380700 1579070Depreciation Expense 1972 10895 18961 32080 37191 59286 81348 82749 75841Capex NA 211844 282222 143261 392965 482200 220774 -69869 274211
2009 2010 2011 2012 2013Operating Revenue 183558 228302 340628 368213 363995Invested Capital 772762 1168793 1574848 1753462 1637882 Average St.devSales-to-capital Ratio 0,23753497 0,19533142 0,21629262 0,209992 0,22223518 0,21627724 0,01553721
116
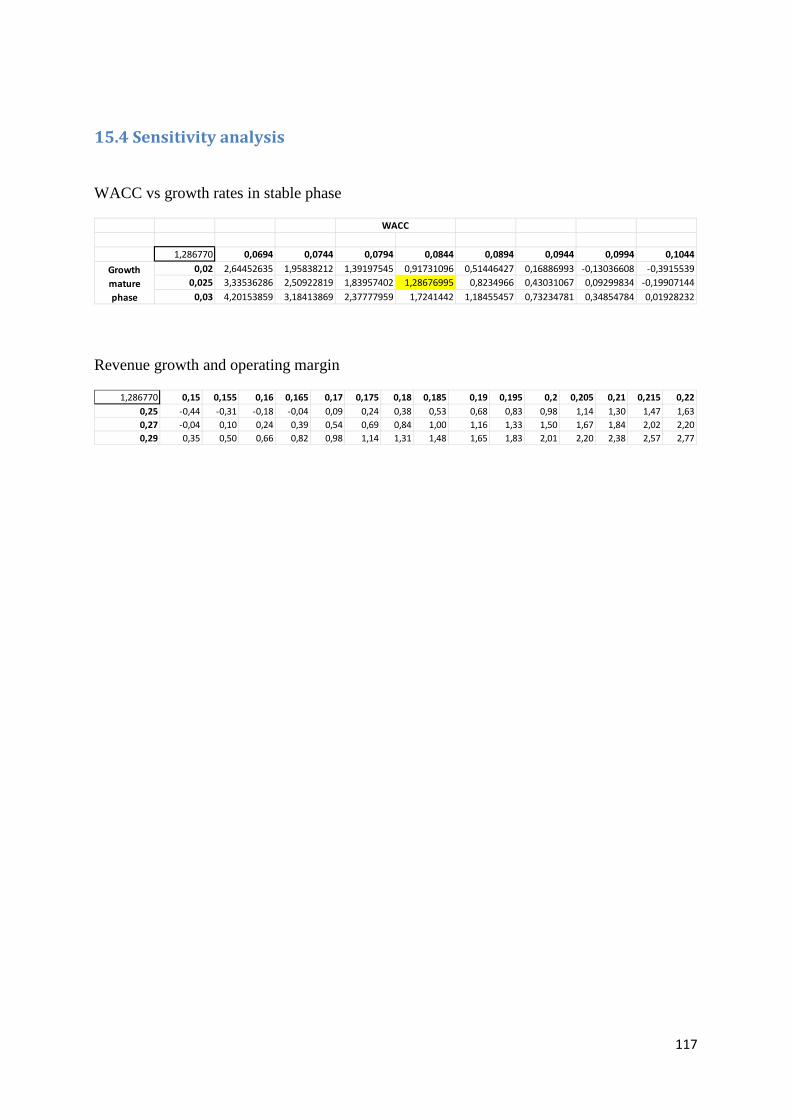
15.4 Sensitivity analysis
WACC vs growth rates in stable phase
Revenue growth and operating margin
1,286770 0,0694 0,0744 0,0794 0,0844 0,0894 0,0944 0,0994 0,10440,02 2,64452635 1,95838212 1,39197545 0,91731096 0,51446427 0,16886993 -0,13036608 -0,3915539
0,025 3,33536286 2,50922819 1,83957402 1,28676995 0,8234966 0,43031067 0,09299834 -0,199071440,03 4,20153859 3,18413869 2,37777959 1,7241442 1,18455457 0,73234781 0,34854784 0,01928232
WACC
Growth mature phase
1,286770 0,15 0,155 0,16 0,165 0,17 0,175 0,18 0,185 0,19 0,195 0,2 0,205 0,21 0,215 0,220,25 -0,44 -0,31 -0,18 -0,04 0,09 0,24 0,38 0,53 0,68 0,83 0,98 1,14 1,30 1,47 1,630,27 -0,04 0,10 0,24 0,39 0,54 0,69 0,84 1,00 1,16 1,33 1,50 1,67 1,84 2,02 2,200,29 0,35 0,50 0,66 0,82 0,98 1,14 1,31 1,48 1,65 1,83 2,01 2,20 2,38 2,57 2,77
117