1 3 1 1 6 8 sec registration number
TRANSCRIPT
1
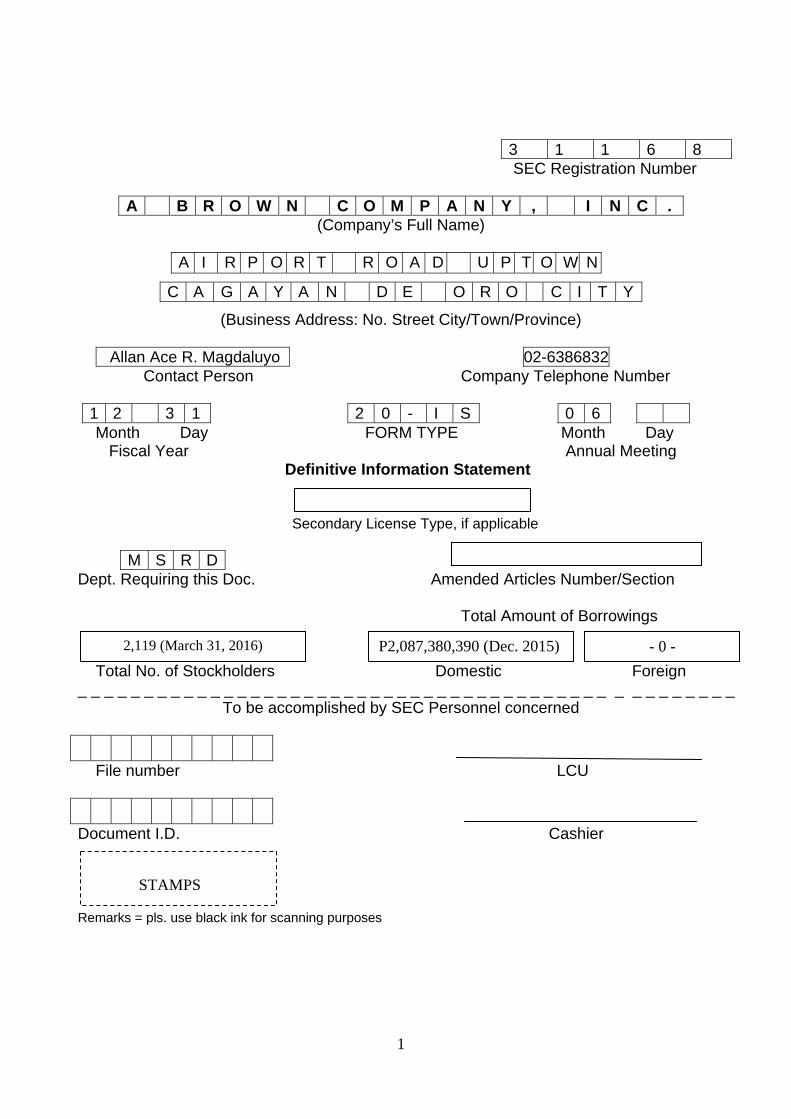
3 1 1 6 8 SEC Registration Number
A B R O W N C O M P A N Y , I N C .
(Company’s Full Name)
A I R P O R T R O A D U P T O W N
(Business Address: No. Street City/Town/Province)
Allan Ace R. Magdaluyo 02-6386832 Contact Person Company Telephone Number
1 2 3 1 2 0 - I S 0 6
Month Day FORM TYPE Month Day Fiscal Year Annual Meeting
Definitive Information Statement
Secondary License Type, if applicable
M S R D Dept. Requiring this Doc. Amended Articles Number/Section Total Amount of Borrowings Total No. of Stockholders Domestic Foreign _ _ _ _ _ _ _ _ _ _ _ _ _ _ _ _ _ _ _ _ _ _ _ _ _ _ _ _ _ _ _ _ _ _ _ _ _ _ _ _ _ _ _ _ _ _ _ _ _
To be accomplished by SEC Personnel concerned
File number LCU Document I.D. Cashier Remarks = pls. use black ink for scanning purposes
C A G A Y A N D E O R O C I T Y
STAMPS
2,119 (March 31, 2016) - 0 - P2,087,380,390 (Dec. 2015)

3
DETAILS AND RATIONALE OF THE AGENDA
1.) Call to Order The Chairman of the Board of Directors, and the chairman of the meeting, Dr. Walter W. Brown, will call the meeting to order.
2.) Certification of Notice and Quorum
The Corporate Secretary will certify the date when written notice of the date, time, place, and purpose of the meeting was sent to all stockholders of record as of April 29, 2016.
The Corporate Secretary will further certify the presence of a quorum. The holders of record for the time being of a majority of the stocks of the Company then issued and outstanding and entitled to vote, represented in person or by proxy, shall constitute a quorum for the transaction of the business.
The following are the Rules of Conduct and Voting Procedures: a. Anyone who wishes to make a remark or to make a query shall identify himself after
being acknowledged by the Chairman and shall limit his remarks and query to the item in the agenda under consideration.
b. Voting shall be done viva voce or by raising of hands and the votes for or against the
matter submitted per item in the agenda.
c. All the items in the agenda requiring approval by the stockholders will need the affirmative vote of stockholders representing at least a majority of the issued and outstanding voting capital stock. Each outstanding share of stock entitles the registered stockholder to one vote. All votes received shall be tabulated by the Office of the Corporate Secretary, and the results shall be validated by an independent party to be announced at the meeting.
In the forthcoming annual stockholders' meeting, stockholders shall be entitled to elect nine (9) members to the Board of Directors. Each stockholder may vote such number of shares for as many as nine (9) persons he may choose to be elected from the list of nominees, or he may cumulate said shares and give one candidate as many votes as the number of his shares multiplied by nine (9) shall equal, or he may distribute them on the same principle among as many candidates as he shall see fit, provided that the total number of votes cast by him shall not exceed the number of shares owned by him multiplied by nine (9). The election of the directors shall be by plurality of votes and every stockholder shall be entitled to cumulate his votes.
3.) Approval of the Minutes of the Previous Meeting of Stockholders
Copies of the minutes of the stockholders meeting held on June 19, 2015 will be distributed to the stockholders upon their registration for this meeting. The minutes are also available at the Company website, http://www.abrown.ph. The stockholders will be requested to approve the draft minutes of previous stockholders’ meeting and to acknowledge the completeness and accuracy thereof.

4
Below is the proposed resolution for this agenda item:
“RESOLVED, to dispense with the reading of the minutes of the previous Annual Shareholders’ Meeting of June 19, 2015 and to approve the same as circulated.”
4.) President’s Report and Presentation of Audited Financial Statements The Annual Report contains summaries on operations and the audited financial statements of the Company for the calendar year ended December 31, 2015. The President, Mr. Robertino E. Pizarro (for real estate and agri-business); the Executive Vice President – Business Development, Mr. Roel Z. Castro (for power) and the Chairman, Dr. Walter W. Brown (for mining and energy) will deliver their reports on the highlights of the Y2015 Company performance as reflected in the audited financial statements, and the outlook for Y2016. The Chairman will request the stockholders’ approval of the annual report and the audited financial statements as of December 31, 2015. The stockholders will be given opportunity to ask questions prior to submitting the Annual Report and the Audited Financial Statements for approval by the stockholders. Copies of the Annual Report and the Audited Financial Statements will be distributed to the stockholders before the meeting. Further, the Audited Financial Statements is released by the Company and made available at the Company’s website, http://www.abrown.ph.
Below is the proposed resolution for this agenda item:
“RESOLVED, to approve the Company’s operations and results for 2015 together with the Audited Financial Statements and the accompanying notes thereto.”
5.) Ratification of all Acts of the Board of Directors and Officers
The Chairman will request the stockholders to ratify all acts and resolutions adopted during the preceding year by the Board of Directors, the Board Committees, Management Committee and the officers of the Company. The acts and resolutions of the Board and its Committees are reflected in the minutes of meetings and they include approval of contracts and agreements, projects and investments, treasury matters and acts and resolutions covered by disclosures to the SEC and PSE. The acts of the Management and officers were those taken to implement the resolutions of the Board or its Committees or taken in the general conduct of business.
Below is the proposed resolution for this agenda item:
“RESOLVED, to approve and ratify all acts and resolutions of the Board of Directors, all the Board Committees, as well as all the acts of the Management and officers of the Company taken or adopted from the date of the last stockholders’ meeting up to the present (from June 19, 2015 until June 17, 2016).”
6.) Election of Directors
In accordance with Section 2, Article II of the Company’s By Laws, the directors shall be elected annually by the stockholders at the annual meeting and shall hold office until their successors are elected and qualified, unless removed from office as provided by law. The
5
Nomination Committee, in the exercised of its assigned task under its charter and the Manual of Corporate Governance of the Company, shall evaluate and determine whether the nominees for election to the Board of Directors including the independent directors, have all the qualifications and none of the disqualifications before submitting the nominees for election by the stockholders of the nine (9) members of the Board of Directors including the independent directors.
Copies of the curriculum vitae and profiles of the candidates to the Board of Directors are provided in the Preliminary Information Statement and in the Definitive Information Statement.
7.) Appointment or Re-appointment of External Auditor The external auditor of the Company is tasked with the issuance of audit opinion of the Company’s annual financial statements based on its audit. The stockholders approval for the re-appointment of Constantino Guadalquiver and Co. (CG & Co.), the Company’s external auditor, will be sought at the meeting. The Audit Committee will endorse to the stockholders the re-appointment of CG & Co. as external auditor for the ensuing year. The profile of the external auditor is provided in the Preliminary Information Statement and the Definitive Information Statement.
Below is the proposed resolution for this agenda item:
“RESOLVED, to approve the re-appointment of the firm of Constantino Guadalquiver & Co. as external auditor of the Company for the fiscal year 2016.”
8.) Other Matters
The Chairman will open the floor for comments and questions by the stockholders. Stockholders may also propose to consider such other relevant matters and issues.
9.) Adjournment
Upon determination by the Corporate Secretary that there are no other matters to be considered, and on motion by a stockholder duly seconded, the Chairman shall declare the meeting adjourned.

6
SECURITIES AND EXCHANGE COMMISSION SEC FORM 20-IS
INFORMATION STATEMENT PURSUANT TO SECTION 20 of the Securities Regulation Code
1. Check the appropriate box:
( ) Preliminary Information Statement ( x ) Definitive Information Statement
2. Name of the Registrant as specified in its charter:
A BROWN COMPANY, INC. (ABCI) 3. Province, country or other jurisdiction of incorporation or organization:
Metro Manila, Philippines 4. SEC Identification Number: 31168 5. BIR Tax Identification Code: 002-724-446-000 6. Address of Principal Office : Xavier Estates Uptown
Airport Road, Balulang, Cagayan de Oro City Postal Code : 9000 7. Registrant’s telephone number, including area code: (63)(088)-8588784 or (63)(02) 638-6832 (Liaison Office) 8. Date, time and place of the meeting of security holders:
Date : 17 June 2016 Time : 1 o’clock p.m. Place : Xavier Sports and Country Club
Xavier Estates, Balulang, Cagayan de Oro City
9. Approximate date on which the Information Statement is first to be sent or given to security holders: 20 May 2016 10. Securities registered pursuant to Sections 8 and 12 of the Code or Sections 4 and 8 of the RSA Titles of each Class Number of Shares of Stock Outstanding Common Shares 1,732,865,522 as of March 31, 2016 Amount of Debt Outstanding P2,695,862,035 as of December 31, 2015 11. Are any or all of the registrant’s securities listed on the Philippine Stock Exchange? ( x ) Yes ( ) No 12.
WE ARE NOT ASKING YOU FOR A PROXY AND YOU ARE REQUESTED NOT TO SEND US A PROXY

7
INFORMATION REQUIRED IN INFORMATION STATEMENT
GENERAL INFORMATION
Date, Time and Place Meeting of security holders.
Date : June 17, 2016 Time : 1 o’clock p.m.
Place : Xavier Sports and Country Club Xavier Estates, Balulang, Cagayan de Oro City
Registrant’s mailing address : Rm. 3304-C 33rd Floor West Tower Ortigas, Pasig City (Liaison Office) Approximate date on which the Information Statement is first sent or given to security holders: 20 May 2016
Dissenter’s Right of Appraisal There is no matter or item to be submitted to a vote or acted upon in the annual stockholders’ meeting of ABCI which falls under the instances provided by law when dissenting stockholders can exercise their appraisal right. Generally, however, the stockholders of ABCI have the right of appraisal in the following instances: (i) in case any amendment to the articles of incorporation has the effect of changing or restricting the rights of any stockholders or class of shares of authorizing preferences over the outstanding shares or of extending or shortening the term of corporate existence; (ii) in case any sale, lease, mortgage, pledge or other disposition of all or substantially all of the corporate property or assets as provided in the Corporation Code; and (iii) in case of merger or consolidation. The appraisal right may be exercised by any shareholder who shall have voted against the proposed corporate action by making a written demand on ABCI within thirty (30) days after the date on which the vote was taken for payment of the fair market value of his share: Provided, that failure to make the demand within such period shall be deemed a waiver of the appraisal right. If the proposed corporate action is implemented or effected, ABCI shall pay to such stockholder, upon surrender of the certificate(s) of stock representing his shares, the fair value thereof as of the day prior to the date on which the vote was taken, excluding any appreciation or depreciation in anticipation of such corporate action. If within a period of sixty (60) days from the date the corporate action was approved by the stockholders, the withdrawing stockholder and ABCI cannot agree on the fair value of the shares, it shall be determined and appraised by three (3) disinterested persons, one of whom shall be named by the stockholder, another by the corporation, and the third by the two thus chosen. The findings of the majority of the appraisers shall be final, and their award shall be paid by ABCI within thirty (30) days after such award is made: Provided, that no payment shall be made to any dissenting stockholder unless ABCI has unrestricted retained earnings in its book to cover such payment; Provided, further, That upon payment by ABCI of the agreed or awarded price, the stockholder shall forthwith transfer his shares to ABCI.

8
Interest of Certain Persons in or Opposition to Matters to be Acted Upon No current director or officer of ABCI, or nominee for election as director of ABCI or any associate thereof, has any substantial interest, direct or indirect, by security holdings or otherwise, in any matter to be acted upon other than election to office. No director has informed ABCI in writing that he intends to oppose any action to be taken by the registrant at the meeting.
CONTROL AND COMPENSATION INFORMATION Voting Securities and Principal Holders Thereof (a) Class of Voting Securities Common shares
Number of Shares Outstanding as of 31 March 2016 1,732,865,522
Common shares are the only equity securities registered and issued by the Company. As of March 31, 2016, 23,111,221 shares or 1.33% of the total outstanding shares are owned by Non-Filipinos.
(b) Record Date: All stockholders of record as of 29 April 2016 are entitled to notice and to vote
at the Annual Stockholders’ Meeting.
At present, ABCI’s Articles of Incorporation (AOI) provide that the Board of Directors shall have nine (9) members.
(c) Manner of Voting: In the forthcoming annual stockholders' meeting, stockholders shall be
entitled to elect nine (9) members to the Board of Directors. Each stockholder may vote such number of shares for as many as nine (9) persons he may choose to be elected from the list of nominees, or he may cumulate said shares and give one candidate as many votes as the number of his shares multiplied by nine (9) shall equal, or he may distribute them on the same principle among as many candidates as he shall see fit, provided that the total number of votes cast by him shall not exceed the number of shares owned by him multiplied by nine (9).
9
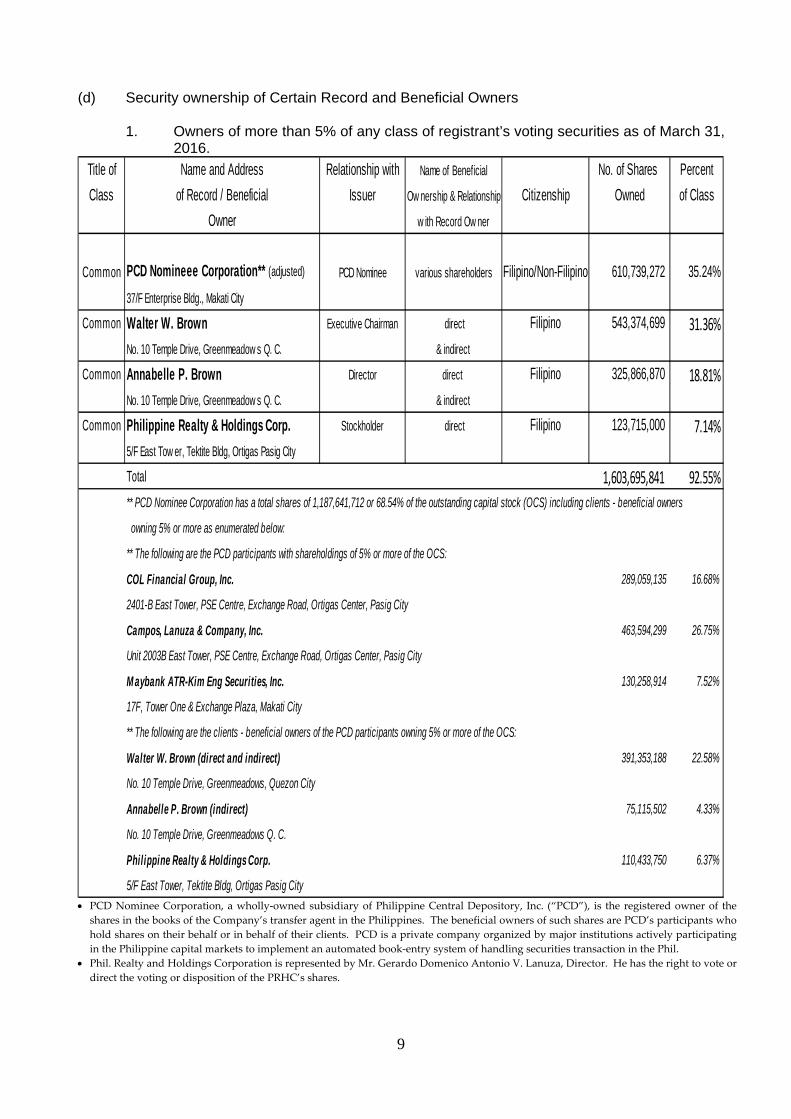
(d) Security ownership of Certain Record and Beneficial Owners
1. Owners of more than 5% of any class of registrant’s voting securities as of March 31, 2016.
Title of Name and Address Relationship with Name of Beneficial No. of Shares PercentClass of Record / Beneficial Issuer Ow nership & Relationship Citizenship Owned of Class
Owner w ith Record Ow ner
Common PCD Nomineee Corporation** (adjusted) PCD Nominee various shareholders Filipino/Non-Filipino 610,739,272 35.24%37/F Enterprise Bldg., Makati City
Common Walter W. Brown Executive Chairman direct Filipino 543,374,699 31.36%No. 10 Temple Drive, Greenmeadow s Q. C. & indirect
Common Annabelle P. Brown Director direct Filipino 325,866,870 18.81%No. 10 Temple Drive, Greenmeadow s Q. C. & indirect
Common Philippine Realty & Holdings Corp. Stockholder direct Filipino 123,715,000 7.14%5/F East Tow er, Tektite Bldg, Ortigas Pasig City
Total 1,603,695,841 92.55%** PCD Nominee Corporation has a total shares of 1,187,641,712 or 68.54% of the outstanding capital stock (OCS) including clients - beneficial owners
owning 5% or more as enumerated below:
** The following are the PCD participants with shareholdings of 5% or more of the OCS:
COL Financial Group, Inc. 289,059,135 16.68%
Campos, Lanuza & Company, Inc. 463,594,299 26.75%
M aybank ATR-Kim Eng Securities, Inc. 130,258,914 7.52%
17F, Tower One & Exchange Plaza, Makati City
** The following are the clients - beneficial owners of the PCD participants owning 5% or more of the OCS:
Walter W. Brown (direct and indirect) 391,353,188 22.58%
No. 10 Temple Drive, Greenmeadows, Quezon City
Annabelle P. Brown (indirect) 75,115,502 4.33%
No. 10 Temple Drive, Greenmeadows Q. C.
Philippine Realty & Holdings Corp. 110,433,750 6.37%
5/F East Tower, Tektite Bldg, Ortigas Pasig City
2401-B East Tower, PSE Centre, Exchange Road, Ortigas Center, Pasig City
Unit 2003B East Tower, PSE Centre, Exchange Road, Ortigas Center, Pasig City
• PCD Nominee Corporation, a wholly‐owned subsidiary of Philippine Central Depository, Inc. (“PCD”), is the registered owner of the
shares in the books of the Company’s transfer agent in the Philippines. The beneficial owners of such shares are PCD’s participants who hold shares on their behalf or in behalf of their clients. PCD is a private company organized by major institutions actively participating in the Philippine capital markets to implement an automated book‐entry system of handling securities transaction in the Phil.
• Phil. Realty and Holdings Corporation is represented by Mr. Gerardo Domenico Antonio V. Lanuza, Director. He has the right to vote or direct the voting or disposition of the PRHC’s shares.
10
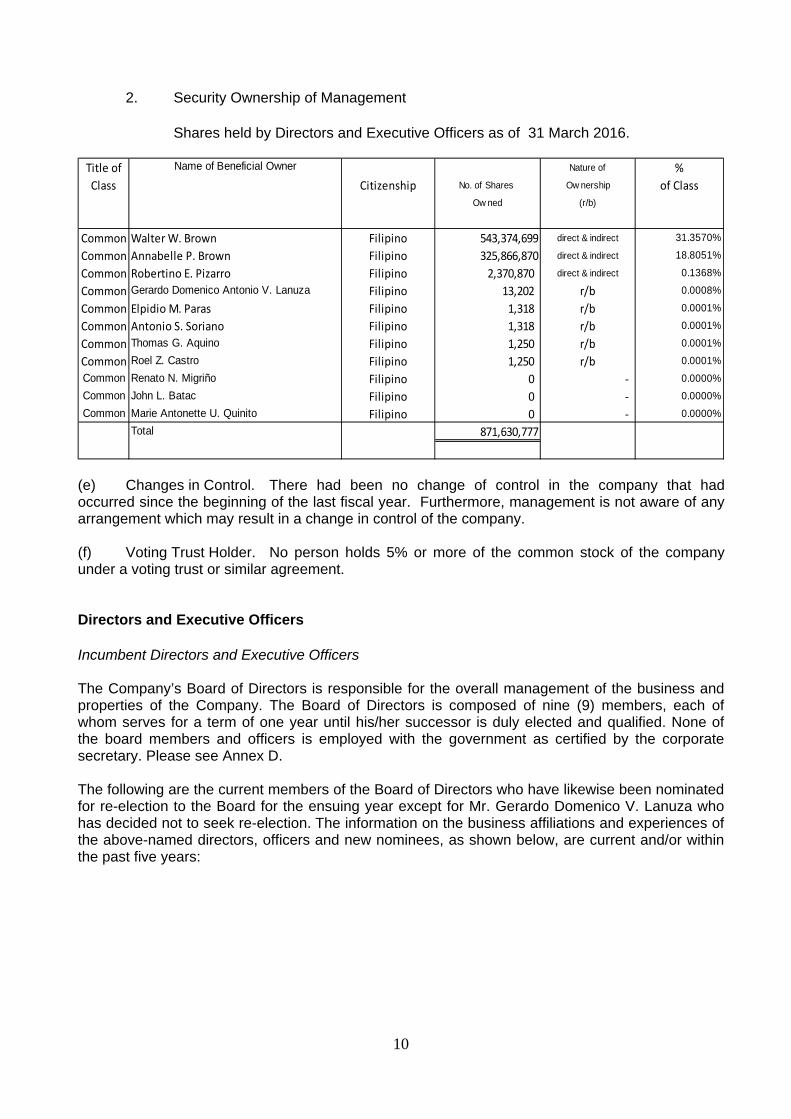
2. Security Ownership of Management
Shares held by Directors and Executive Officers as of 31 March 2016.
Title of Name of Beneficial Owner Nature of %Class Citizenship No. of Shares Ow nership of Class
Ow ned (r/b)
Common Walter W. Brown Filipino 543,374,699 direct & indirect 31.3570%
Common Annabelle P. Brown Filipino 325,866,870 direct & indirect 18.8051%
Common Robertino E. Pizarro Filipino 2,370,870 direct & indirect 0.1368%
Common Gerardo Domenico Antonio V. Lanuza Filipino 13,202 r/b 0.0008%
Common Elpidio M. Paras Filipino 1,318 r/b 0.0001%
Common Antonio S. Soriano Filipino 1,318 r/b 0.0001%
Common Thomas G. Aquino Filipino 1,250 r/b 0.0001%
Common Roel Z. Castro Filipino 1,250 r/b 0.0001%
Common Renato N. Migriño Filipino 0 ‐ 0.0000%Common John L. Batac Filipino 0 ‐ 0.0000%
Common Marie Antonette U. Quinito Filipino 0 ‐ 0.0000%Total 871,630,777
(e) Changes in Control. There had been no change of control in the company that had occurred since the beginning of the last fiscal year. Furthermore, management is not aware of any arrangement which may result in a change in control of the company. (f) Voting Trust Holder. No person holds 5% or more of the common stock of the company under a voting trust or similar agreement. Directors and Executive Officers Incumbent Directors and Executive Officers The Company’s Board of Directors is responsible for the overall management of the business and properties of the Company. The Board of Directors is composed of nine (9) members, each of whom serves for a term of one year until his/her successor is duly elected and qualified. None of the board members and officers is employed with the government as certified by the corporate secretary. Please see Annex D. The following are the current members of the Board of Directors who have likewise been nominated for re-election to the Board for the ensuing year except for Mr. Gerardo Domenico V. Lanuza who has decided not to seek re-election. The information on the business affiliations and experiences of the above-named directors, officers and new nominees, as shown below, are current and/or within the past five years:
11
WALTER W. BROWN, Executive Chairman
Walter W. Brown, Filipino, 76, Executive Chairman. He became Director of A Brown Company, Inc.* in December 1966. He is also the Chairman of Palm Thermal Consolidated Holdings Corporation, Palm Concepcion Power Corporation, PeakPower Energy Inc., A Brown Energy & Resources Dev’t. Inc. and Director of Monte Oro Resources and Energy, Inc. He also holds concurrent positions with other listed companies as Director/President and CEO of Apex Mining Company, Inc. and Director of Atok-Big Wedge Co., Inc.
He received two undergraduate degrees: B.S. Physical Science (1959) and B.S. Geology (1960), both from the University of the Philippines, and post graduate degrees from Stanford University: M.S. Economic Geology (1963), and Ph.D. in Geology, Major in Geochemistry (1965). He was also a candidate in Master of Business Economics (1980) from the University of Asia & Pacific (formerly Center for Research & Communications).
He was formerly associated with the following Philippine listed companies as Chairman or as President or Director: Philex Mining Corporation, Atlas Consolidated Mining Co., Petroenergy, Philippine Realty & Holdings Corporation, Dominion Asia Equities, Inc. (Belle Corp.), Palawan Oil & Gas Exploration (Vantage Equities), Sinophil Corporation (Premium Leisure Corp.), Semirara Coal Corporation (Semirara Mining Corp), and Vulcan Industrial and Mining Corporation. He also held a position in the following companies: National Grid Corporation of the Philippines, Philodrill Corporation,7 Seas Oil Company, Inc. (Abacus), Universal Petroleum (Universal Rightfield), Asian Petroleum Corporation, Acoje Mining Corporation, Surigao Consolidated Mining Inc., (Suricon), San Jose Oil, Seafront Petroleum, and Basic Petroleum. He was also Technical Director of Dragon Oil, a company listed on the London Stock Exchange.
He is currently the Chairman and Director of Family Farm School (PPAI), Chairman and President of Studium Theologiae Foundation, Member of the Board of Trustees of Xavier University from 2003 to 2014 as Vice Chairman from 2006-2014 and member of the Geological Society of the Philippines. * He was an incorporator/director when the company was incorporated on December 21, 1966 as Bendaña Brown Pizarro and Associates, Inc. The company was ultimately renamed to A Brown Company, Inc. on July 1, 1993. ANNABELLE P. BROWN, Director Ms. Annabelle P. Brown, Filipino, 73. She became Director of A Brown Company, Inc.* in December 1966. She holds the position of: Treasurer since 1993 to July 2011, Chairman of the Committee on Corporate Culture and Values Formation and Executive Committee and Member of the Compensation Committee. She is President and Director of PBJ Corporation; Chairman of the Board of Petwindra Media Inc.; Treasurer of Brown Resources Corporation; Treasurer/ Director of Bendana-Brown Holdings Corporation, Pine Mountain Properties Corporation. She is also a Director of the following corporations: North Kitanglad Agricultural Corp., Cogon Corporation and Shellac Petrol Corp. She has no directorship in other listed companies. Her civic involvement includes: Founding Chairperson of Alalay sa Pamilya at Bayan (APB) Foundation, Inc. (2009 to present), Development Advocacy for Women Volunteerism (DAWV) Foundation, Inc. (1988 to present), Professional and Cultural Development for Women (PCDW) Foundation, Inc. (1979 to present); Consultant/Moderator of EDUCHILD Foundation, Inc. (1985 to present) and Chair of the Rosevale School, CDO (2011 to present).
12
Mrs. Brown holds a Bachelor of Science in Business Administration degree from the University of the Philippines, Diliman, Quezon City and is a candidate for a degree in Masters in Business Economics at the University of Asia and Pacific (formerly CRC). For her outstanding contribution to the academe, business and socio-community development, Mrs. Brown is a recipient of several awards and citation, latest are the 2010 Soroptimists Award and 2010 UPCBA Distinguished Alumna Award. * She was an incorporator/director when the company was incorporated on December 21, 1966 as Bendaña Brown Pizarro and Associates, Inc. The company was ultimately renamed to A Brown Company, Inc. on July 1, 1993. . GERARDO DOMENICO V. LANUZA, Director Mr. Gerardo Domenico V. Lanuza, Filipino, 33, Director, August 3, 2009 to present. He has directorship in other listed and non-listed companies. He is a Director and Executive Vice-President and Chief Operating Officer of Philippine Realty and Holdings Corp., a company listed in the Philippine Stock Exchange; Director, Vice President and Treasurer of Campos, Lanuza & Co., Inc.; Director and Vice President of Greenhills Properties, Inc.; President & CEO of Meridian Assurance Corp. He was a former director of British United Automotive Corp.and Klassik Motors Corp. He finished his Legal Management course from the De La Salle University (2006). ANTONIO S. SORIANO, Director Atty. Antonio S. Soriano, Filipino, 67, Director from Aug 2007 to present and Corporate Secretary (June 2002 to Nov. 2008). He obtained his Bachelor of Laws Degree from the University of the East in 1974 and was admitted to the Bar in 1975. He is the Senior Managing Partner of Soriano, Saarenas & Llido Law Office. He acts as the Corporate Secretary of the following: RISE Foundation, Inc. (1994 to present), ICS Development Corporation (1980 to present), PACEMAN General Services (1993 to present), Kagayhaan-Davao Resources Management Corporation (1994 to present), Kagayhaan - Cagayan de Oro City Resources Management Corporation (1993 to present), Chairman of Xavier Sports and Country Club (2000 to present), and Roadside Shops, Inc. (2000 to present). He is the Chairman of Cagayan de Oro Medical Centre, Philippine National Red Cross-Misamis Oriental and First Industrial Plastic Ventures, Inc. (present). He is also active in civic and professional organizations like Integrated Bar of the Phils. – Misamis Oriental Chapter (Vice-President 1984-1986), Rotary Club of Cagayan de Oro City (IPP & SAG), Philippine Association of Voluntary Arbitrators (member - 1994) and Court of Appeals Mediation-Mindanao Station (member - 2007). He was also elected as Vice Mayor of Cagayan de Oro City from 1992-1995 and member of the City Council of the same city from 1988-1992. During his tenure he was able to pass several ordinances and resolutions that contributed to the development of the City. He has no directorship in other listed companies. ROBERTINO E. PIZARRO, Director/President Mr. Robertino E. Pizarro, Filipino, 61, August 2003 to present. He finished the course on Strategic Business Economic Program at University of Asia and the Pacific (Aug 2002–Aug 2003). He is also the President of ABERDI, Brown Resources Corporation, NAKEEN Corporation (February 26, 1997 to present), Xavier Sports and Country Club (1999 to present), Andesite Corporation, Bonsai Agricultural Corporation and Minpalm Agricultural Co., Inc. (2004 to present). Former President and now Director of Philippine Palmoil Development Council, Inc. (PPDCI). He has no directorship in other listed companies.
13
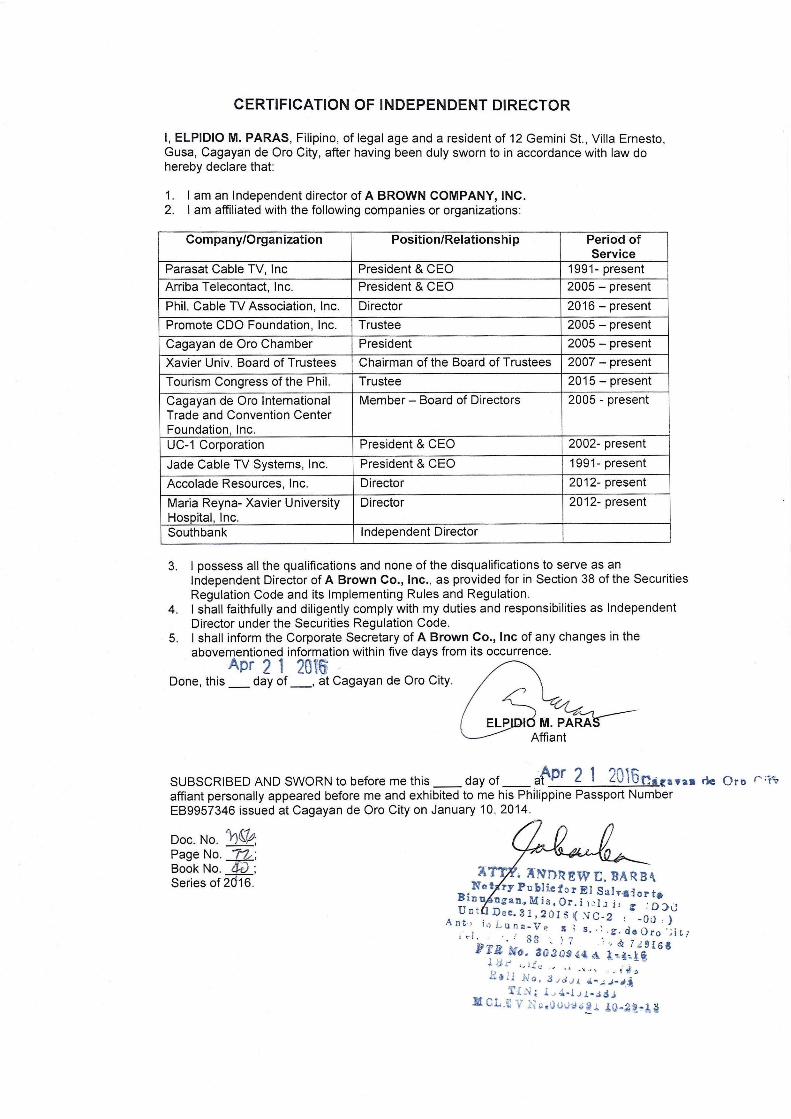
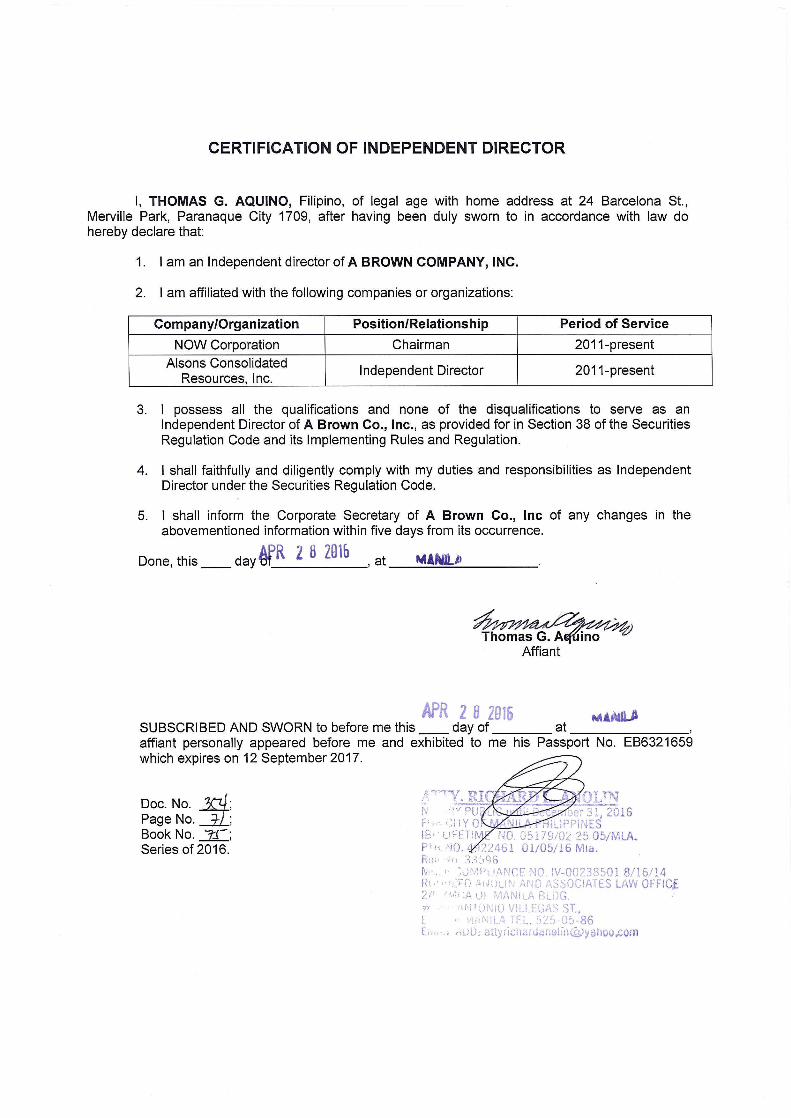
ELPIDIO M. PARAS, Independent Director Engr. Elpidio M. Paras, Filipino, 63, Independent Director, June 28, 2002 to present. He obtained his Bachelor of Science major in Mechanical Engineering from the De La Salle University (1974). He is the President and CEO of Parasat Cable TV, Inc. (1991 to present), UC-1 Corporation (2002 to present), Arriba Telecontact, Inc. (2005 - present). , Trustee - Promote CDO Foundation, Inc. (2005 to present), President – Cagayan de Oro Chamber (2007), Chairman of the Board of Trustees – Xavier University (2007 to present) and independent director of Southbank. He is a founding member of the Philippine Society for Orphan Disorders (PSOD). He was also a Board member of the Cagayan de Oro International Trade and Convention Center Foundation, Inc. (2005). He is also a member of PhilAAPA (Philippine Association of Amusement Parks& Attractions), and Member of the Board of trustees of Maria Reyna-Xavier University Hospital, Inc. (MRXUH).He was also three time Pres. and Chairman of the Philippine Cable TV Association. He has no directorship in other listed companies. THOMAS G. AQUINO, Independent Director Dr. Thomas G. Aquino, Filipino, 67, Independent Director from March 12, 2012 to present. He has professional expertise in several fields namely business strategy, trade, investments and technology promotions, industrial policy and international trade negotiations. Dr. Aquino has directorship in other listed and non-listed companies. He is the Chairman of NOW Corporation, a publicly listed firm engaged in telecommunications, media and technology, and an Independent Director of Alsons Consolidated Resources Inc., also a publicly listed firm involved in property development and power generation in Mindanao. He is Vice-Chairman of Knowledge Professionals Service Cooperative Inc., a cooperative among knowledge professionals committed to advance Philippine IT competencies in various fields of endeavor. He is also the Senior Fellow at the Center for Research and Communication of the University of Asia and the Pacific (UA&P) where he specializes in economic policy related to reinvigorating manufacturing for regional and global competition. Dr. Aquino was formerly Senior Undersecretary of the Philippine Department of Trade and Industry. He managed international trade promotions by assisting exporters to the country’s trade partners and led the country’s trade negotiations work in the World Trade Organization and Asean Free Trade Agreement and representation in Asia Pacific Economic Cooperation. He was the lead negotiator for the Philippines-Japan Economic Partnership Agreement, the first bilateral free trade agreement for the Philippines. He was conferred the Presidential Service Award (or Lingkod Bayan) for extraordinary contribution of national impact on public interest, security and patrimony and was recipient of the Gawad Mabini Award with the rank of Grand Cross (or Dakilang Kamanong) for distinguished service to the country at home and abroad by the President of the Republic of the Philippines. He obtained a Doctorate in Management from IESE Business School, University of Navarre (Spain) in 1980, an MS in Industrial Economics from the Graduate School of CRC (now UA&P) in 1972 and an AB in Economics from the School of Economics, University of the Philippines in 1970.

14
ROEL Z. CASTRO, Director/Executive Vice President – Business Development Mr. Roel Z. Castro, Filipino, 49, Director from December 2012 to present. He is the Executive Vice-President for Business Development who joined the company last May 2010 as Vice President for Business Development. He finished his Bachelor of Science in Agricultural Business degree at the University of the Philippines – Los Baños with Best Special Problem (Thesis) Award in 1988. He also earned his Master in Management at Asian Institute of Management with commendation from the faculty in 1997. He had written and presented technical articles such as Issues and Concerns in Agri-Enterprises Development in the Philippines and Investment Portfolio on Renewable Energy Projects in the Philippines, among others. His broad range of experience in general management covers: project management and development, brand marketing and management, financial management, financial valuation and modelling, agri-business systems, policy analysis, development banking and corporate planning, strategic planning and organizational development Currently, he is also the President of the following companies: Palm Thermal Consolidated Holdings Corp., Palm Concepcion Power Corporation, Peakpower Energy, Inc., Peakpower Soccsargen, Inc., Peakpower San Francisco, Inc., Peakpower Bukidnon, Inc. and Hydro Link Projects Corp. These companies are engaged in power generation such as coal-fired, bunker-fired and hydro power. He has no directorship in other listed companies. Before his stint as EVP for Business Development in ABCI, he was the Head of the Corporate Affairs Department and Concurrent Special Assistant to the President/CEO of National Grid Corporation of the Philippines (NGCP). He was appointed as the Chief Finance Officer of Monte Oro Resources and Energy, Inc. (MORE) and Monte Oro Grid Resources Corporation (MOGRC). He held also various posts in other local power consulting companies. He also became the Country Head for Marketing and Member of Country Leadership Team of Syngenta Philippines, Inc.; Enterprise and Investment Specialist and Area Head of Louie Berger International, Inc. (Phils.), Growth with Equity in Mindanao (GEM) Program. He rose from various positions in Mindanao Development Bank from Special Assistant to the Managing Director, Partnership Officer, Senior Manager of the Corporate Planning Unit and Assistant Vice President of the Corporate Support Division. New Nominees for Directorship RENATO N. MIGRIÑO, Treasurer Mr. Renato N. Migriño, 68, Filipino, was appointed as Treasurer of A Brown Company, Inc. effective September 1, 2015. Currently, he is also the Treasurer of Apex Mining Company, Inc. and an Independent Director of Mabuhay Vinyl Corporation. These companies are listed in the Philippine Stock Exchange. Prior to his joining A Brown, Mr. Migriño was Treasurer, Chief Financial Officer, Senior Vice President for Finance, and Compliance Officer of Philex Mining Corporation, Director and Chief Financial Officer of Philex Gold Inc., and Director of FEC Resources Inc., Silangan Mindanao Mining Co., Inc., Brixton Energy & Mining Corporation and Lascogon Mining Corporation. He was also formerly Senior Vice President & Controller of Benguet Corporation.

15
MARIE ANTONETTE U. QUINITO, Chief Finance Officer
Atty. Marie Antonette U. Quinito, 39, Filipino, joined the A Brown Group of Companies in November 2013 as Comptroller. She was appointed as Chief Finance Officer effective September 1, 2015. She finished her Bachelor of Science in Accountancy at the University of San Carlos Cum Laude in 1997 and became a Certified Public Accountant on the same year. She finished her Masters in Business Administration at Southwestern University last May 2003. She finished her Bachelor in Laws at Xavier University Ateneo de Cagayan and was admitted to the Bar last 2011. She has taken up twenty four (24) units in Doctor in Education Planning and Supervision at COC Phinma. She has also taken courses with institutions such as the Asian Institute of Management and American Management Association.
She started as a Staff Auditor of Sycip, Gorres Velayo and Company, CPAs then joined the SM Group of Companies for 15 years.
Nomination of Independent Directors and Procedure for Nomination Messrs. Elpidio Paras and Thomas Aquino, qualify as independent directors of the Company pursuant to Rule 38 of the Implementing Rules of the Securities Regulation Code and the Corporation’s Manual on Corporate Governance.
In compliance with the requirements of the Securities and Exchange Commission’s Guidelines on the Nomination and Election of Independent Directors which have been adopted and made part of the Corporation’s By-Laws, the Nomination Committee, in a meeting held on 19 April 2016, endorsed the nominations given in favor of Messrs. Paras (by Mr. Roel Z. Castro) and Aquino (by Robertino E. Pizarro). The Nomination Committee has determined that these nominees for independent directors possess all the qualifications and have none of the disqualifications for independent directors as set forth in Rule 38 of the Implementing Rules of the Securities Regulation Code. The nominated independent directors are in no way related to the stockholders who nominated them.
The Members of the Nomination Committee are as follows:
Chairman: Dr. Thomas G. Aquino, Independent Director Members: Engr. Elpidio M. Paras, Independent Director Dr. Walter W. Brown Please see pages 22 and 23 for the Certification of Qualification of Independent Directors Executive Officers of ABCI WALTER W. BROWN, Executive Chairman (refer above for his profile) ROBERTINO E. PIZARRO, President (refer above for his profile) ROEL Z. CASTRO, Vice-President – Executive Business Development (refer above for his profile) RENATO N. MIGRIÑO, Treasurer (refer above for his profile) MARIE ANTONETTE U. QUINITO, Chief Finance Officer (refer above for her profile)

16
JOHN L. BATAC, Vice-President – Construction and Development Engr. John L. Batac, Filipino, 47, AVP from Aug 2008 until he was appointed as VP effective June 2014. He is a Civil, Sanitary and Geodetic Engineer. He graduated from the University of the East in 1991 for his Civil Engineering course, at National University in 1994 for Sanitary Engineering and at The University of Northern Eastern Philippines in 1998 for Geodetic Engineering. He used to be an Instructor at International Training Center for Surveyors (Sept 1991 to April 1995), a Manager for Project Development of A Brown Company, Inc. (May 1995 to July 2000) and a Technical Consultant of Green Square Properties Corp. (2000 to 2008) . He is also a member of the following organizations: Philippine Institute of Civil Engineers (PICE), Philippine Society of Sanitary Engineers (PSSE) and Geodetic Engineers of the Philippines (GEP). JASON C. NALUPTA, Corporate Secretary Jason C. Nalupta, Filipino, 44, is the Corporate Secretary of the Corporation. He is also currently the Assistant Corporate Secretary of listed firm Pacific Online Systems Corporation. He is also either a Director and/or Corporate Secretary or Assistant Corporate Secretary of Lucky Circle Corporation, Loto Pacific Leisure Corporation, Total Gaming Technologies, Inc., Basic Leisure and Gaming Networks, Inc., and Stage Craft International, Inc. He is a Partner at Tan Venturanza Valdez Law Offices specializing on corporate, securities, and business laws. Mr. Nalupta earned his Juris Doctor degree, as well as his Bachelor of Science degree in Management (major in Legal Management), from the Ateneo de Manila University in 1996 and 1992, respectively. Mr. Nalupta was admitted to the Philippine Bar in 1997.
ANNA FRANCESCA C. RESPICIO, Asst. Corporate Secretary
Anna Francesca C. Respicio, Filipino, 30, is the Assistant Corporate Secretary. She is the incumbent Corporate Secretary or Assistant Corporate Secretary of the following listed firms: I-Remit, Inc., Jolliville Holdings Corporation, Discovery World Corporation, and First Abacus Financial Holdings Corporation, as well as the following registered corporations: Sterling Bank of Asia, Inc. (A Savings Bank), Tagaytay Highlands International Golf Club, Inc., The Spa and Lodge at Tagaytay Highlands, Inc., and Fidelity Securities, Inc.
Atty. Respicio obtained her Bachelor of Arts degree (major in Philosophy) in 2007 and her Juris Doctor degree in 2011 from the Ateneo de Manila University. She is currently a Senior Associate at Tan Venturansa Valdez. She was admitted to the Philippine bar in April 2012.
Significant Employees The Company values its human resources. It expects every employee to perform the function assigned to him and to contribute in achieving the Company’s goals. While each employee’s role is important, there is no employee, other than the executive officers, who is expected by the Company to make a significant contribution to the business.
17
Family Relationships Walter W. Brown, the Chairman of the Company, is married to Annabelle Pizarro Brown., Mr. Robertino E. Pizarro, the President of the Corporation, is the brother of Annabelle Pizarro Brown. Mrs. Ma. Cristina P. Pizarro, the General Manager of BRC is the wife of Mr. Robertino E. Pizarro. The Operations Consultant of ABERDI, Mr. Juan Paolo Pizarro is the son of Mr. Robertino E. Pizarro and Mrs. Cristina P. Pizarro.
Involvement in Certain Legal Proceedings
The Company has no knowledge of any involvement by the members of the Board of Directors or Executive Officers in any legal proceeding affecting or involving themselves or their properties, or of said persons being subject to any order, judgment or decree before any court of law or administrative body in the Philippines. Neither have said persons filed any petition for suspension of payments or bankruptcy/ insolvency nor have been convicted by final judgment of any violation of a securities or commodities law or any offense punishable by laws of the Republic of the Philippines or any other country during the past five (5) years up to the latest date. Certain Relationships and Related Transactions The company, being a parent company, in its regular course of trade or business, enters into transactions with its subsidiaries consisting of reimbursement of expenses, purchase of other assets, construction and development contracts, management, marketing and service agreements. Sales and purchases of goods and services to and from related parties are made at arms-length transaction. No other transaction was undertaken by the Company in which any Director or Executive Officers was involved or had a direct or indirect material interest except on the receipt of loan in 2012 from the family of Dr. Walter W. Brown amounting to P 107,280,000. ABCI availed additional loan amounting to P 60,000,000 and P 62,000,000 in 2014 and 2015, respectively. The parent company purchased 29,376,039 ordinary shares of PhiGold Limited on November 29, 2011. Before the transaction, Dr. Walter W. Brown, ABCI Chairman of the Board has an interest in PhiGold Limited through his shareholdings under Strait Fire Capital, Limited, the seller of the 18,230,833 ordinary shares. Strait Fire Capital, Limited is a company registered in the British Virgin Islands. As of the end of 2012, ABCI has paid the Strait Fire payable. For the past five years, the Company did not enter into any contract with promoters. Disagreement with Director None of the directors have resigned or declined to stand for re-election to the Board of Directors since the date of the last annual meeting of security holders because of disagreement with the Company on any matter relating to the Company’s operations, policies or practices.
18
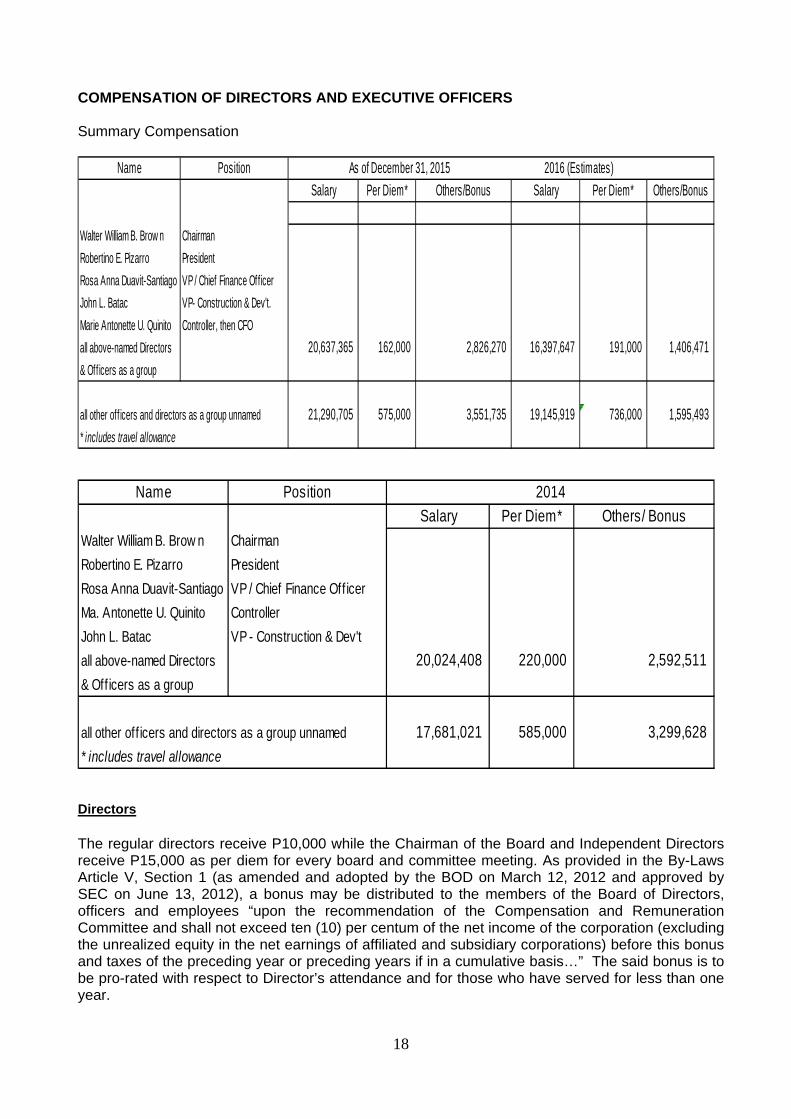
COMPENSATION OF DIRECTORS AND EXECUTIVE OFFICERS Summary Compensation
Name PositionSalary Per Diem* Others/Bonus Salary Per Diem* Others/Bonus
Walter William B. Brow n ChairmanRobertino E. Pizarro PresidentRosa Anna Duavit-Santiago VP / Chief Finance OfficerJohn L. Batac VP- Construction & Dev't.Marie Antonette U. Quinito Controller, then CFOall above-named Directors 20,637,365 162,000 2,826,270 16,397,647 191,000 1,406,471 & Off icers as a group
all other off icers and directors as a group unnamed 21,290,705 575,000 3,551,735 19,145,919 736,000 1,595,493 * includes travel allowance
As of December 31, 2015 2016 (Estimates)
Name PositionSalary Per Diem* Others/ Bonus
Walter William B. Brow n ChairmanRobertino E. Pizarro PresidentRosa Anna Duavit-Santiago VP / Chief Finance Off icerMa. Antonette U. Quinito ControllerJohn L. Batac VP - Construction & Dev'tall above-named Directors 20,024,408 220,000 2,592,511 & Off icers as a group
all other off icers and directors as a group unnamed 17,681,021 585,000 3,299,628 * includes travel allowance
2014
Directors The regular directors receive P10,000 while the Chairman of the Board and Independent Directors receive P15,000 as per diem for every board and committee meeting. As provided in the By-Laws Article V, Section 1 (as amended and adopted by the BOD on March 12, 2012 and approved by SEC on June 13, 2012), a bonus may be distributed to the members of the Board of Directors, officers and employees “upon the recommendation of the Compensation and Remuneration Committee and shall not exceed ten (10) per centum of the net income of the corporation (excluding the unrealized equity in the net earnings of affiliated and subsidiary corporations) before this bonus and taxes of the preceding year or preceding years if in a cumulative basis…” The said bonus is to be pro-rated with respect to Director’s attendance and for those who have served for less than one year.
19
Officers The Company adopts a performance-based compensation scheme as incentive. Payments to all senior personnel from Manager and up were all paid in cash. The total annual compensation includes the basic salary and other variable pay (performance bonus and other taxable income). Each executive officer executed an employment contract with the Company for an indefinite period (the terms and conditions of which are in accordance with existing laws) and is entitled to receive retirement benefits in accordance with the terms and conditions of the Company’s BIR-registered Employees’ Retirement Fund. Other than the previously exercised stock option plan, there are no stock, non-cash compensation, warrants or options granted to the officers and directors. There are no other material term or other arrangement, other than the above to which any Director / officer named above was compensated. INDEPENDENT PUBLIC ACCOUNTANTS The accounting firm of Constantino Guadalquiver & Co., (CG & Co.) was duly appointed as the Independent Public Accountants on 28 August 2009. Representatives of CG & Co. shall be present during annual meetings and will be given the opportunity to make a statement if they desire to do so. They are also expected to respond to appropriate questions if needed. There was no instance that CG & Co. had any disagreement relating to accounting principles or practices, financial statement disclosures or auditing scope or procedure. Per SEC Memo Circular of 2005 – Amendments to SRC Rules 68 and 68.1, “… the external auditors shall be rotated every after five (5) years of engagement. In case of a firm, the signing partner shall be rotated every after said period. The reckoning date for such rotation shall commence in year 2002…” For five consecutive years, Rogelio M. Guadalquiver has been the Partner-In-Charge of the independent examination. For the audit year 2014 and 2015, Annalyn B. Artuz is the Partner-In-Charge. The company is compliant with SRC Rule 68, paragraph 3(b)(iv) on the five (5) year rotation requirement for external auditors. Section IV of Annex C - Audit Committee Charter of our Revised Manual on Corporate Governance provides that the Audit Committee constituted by the Board of Directors shall be primarily responsible for the appointment, compensation, retention, rotation and oversight of the independent directors. Pursuant to this Manual provision, the Audit Committee approved the re-appointment of Constantino Guadalquiver & Co. (CG & Co.), a member practice of Baker Tilly International as the company’s independent directors. Members of the Audit Committee and Risk Committee are as follows: Chairman: Engr. Elpidio M. Paras, Independent Director Members: Dr. Thomas G. Aquino, Independent Director Atty. Antonio S. Soriano, Director

20
ISSUANCE AND EXCHANGE OF SECURITIES Financial and Other Information Please see Management Report and Annexes: Annex A – Management’s Discussion and Analysis Annex B – Audited Financial Statements for 2015 Annex C – Sample Proxy Form Annex D – Certification that none of the board members and officers is employed with the
Government Annex E – SEC 17-Q for the 1st Quarter of 2016
OTHER MATTERS Action with Respect to Reports The Company will seek the approval by the stockholders of the 2015 Operations and Results, contained and discussed in the annual report attached and made part of this Information Statement. Approval of the reports will constitute approval and ratification of the acts of Management and of the Board of Directors for the past year. Other Proposed Actions The following are to be proposed for approval during the stockholders’ meeting: 1. Minutes of the Previous Meeting of Stockholders 2. 2015 Operations and Results 3. Ratification of all Acts of the Board of Directors and Officers 4. Election of Directors for 2016-2017 5. Re-appointment of Constantino Guadalquiver & Co., CPAs as External Auditors 6. Other Matters The items covered with respect to the ratification of the acts of the Board of Directors and officers for the past year up to the date of the meeting are those items entered into in the ordinary course of business, with those of significance having been covered by appropriate disclosures such as:
a.) Membership in the relevant committees such as the Executive, Audit, Nomination, Governance, Compensation, Risk and Corporate Culture and Values Formation Committees;
b.) Designation of authorized signatories; c.) Financing activities; d.) Opening of accounts; e.) Appointments in compliance with corporate governance policies; and f.) Funding support for projects
Management reports which summarize the acts of management for the year 2015 are included in the company’s Annual Report to be sent to the stockholders together with this Information Statement and shall be submitted for approval by the stockholders at the meeting. Accordingly, approval of the Annual Report will constitute approval and ratification of the acts of Management stated in the Management Report during the period covered thereby.
21
Voting Procedure The procedure to be followed will be in accordance with the By-Laws (Article 1, Section 5) Voting: “At every meeting of stockholders, every stockholder with voting privilege shall be entitled to one vote for each share of stock standing in his name on the books of the Company, provided, however, that in the case of the election of Directors every stockholder with voting privilege shall be entitled to accumulate his votes in the manner provided by law. Every Stockholder entitled to vote any meeting of stockholders may vote by proxy, provided that the proxy shall have been appointed in writing by the stockholders himself, or by his duly authorized attorney. The instrument appointing a proxy shall be exhibited to the Secretary and the Inspectors of election shall be lodged with the Secretary at the time of the meeting if he shall so request.” For motions on other corporate matters that will be submitted for approval and for such other matters as may properly come before the Meeting, a vote of the majority of the shares present or represented by proxy at the meeting is necessary for their approval. Voting shall be done viva voce or by raising of hands and the votes for or against the matter submitted shall be tallied by the Corporate Secretary and shall be validated by an independent party. OMITTED ITEMS Items 9, 10, 12, 13, and 14 are not responded to herein the Corporation not intending to take any action with regard to the same during the stockholders’ meeting.

25
Annex A MANAGEMENT REPORT 2015
MANAGEMENT’S DISCUSSION AND ANALYSIS OR PLAN OF OPERATION Current Period (2015 & 2014) Operational and Financial Information Financial Condition
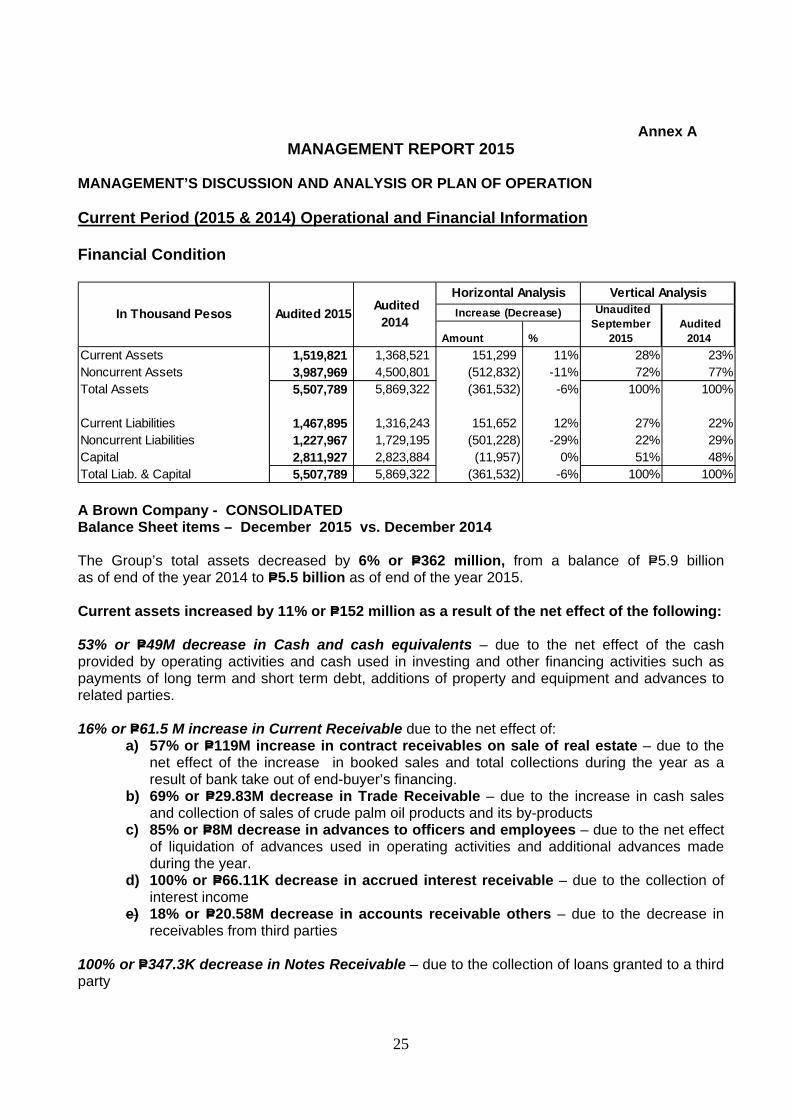
Amount %Current Assets 1,519,821 1,368,521 151,299 11% 28% 23%Noncurrent Assets 3,987,969 4,500,801 (512,832) -11% 72% 77%Total Assets 5,507,789 5,869,322 (361,532) -6% 100% 100%
Current Liabilities 1,467,895 1,316,243 151,652 12% 27% 22%Noncurrent Liabilities 1,227,967 1,729,195 (501,228) -29% 22% 29%Capital 2,811,927 2,823,884 (11,957) 0% 51% 48%Total Liab. & Capital 5,507,789 5,869,322 (361,532) -6% 100% 100%
In Thousand Pesos Audited 2015 Audited 2014
Horizontal Analysis Vertical AnalysisIncrease (Decrease) Unaudited
September 2015
Audited 2014
A Brown Company - CONSOLIDATED Balance Sheet items – December 2015 vs. December 2014 The Group’s total assets decreased by 6% or P=362 million, from a balance of P=5.9 billion as of end of the year 2014 to P=5.5 billion as of end of the year 2015. Current assets increased by 11% or P=152 million as a result of the net effect of the following: 53% or P=49M decrease in Cash and cash equivalents – due to the net effect of the cash provided by operating activities and cash used in investing and other financing activities such as payments of long term and short term debt, additions of property and equipment and advances to related parties. 16% or P=61.5 M increase in Current Receivable due to the net effect of:
a) 57% or P=119M increase in contract receivables on sale of real estate – due to the net effect of the increase in booked sales and total collections during the year as a result of bank take out of end-buyer’s financing.
b) 69% or P=29.83M decrease in Trade Receivable – due to the increase in cash sales and collection of sales of crude palm oil products and its by-products
c) 85% or P=8M decrease in advances to officers and employees – due to the net effect of liquidation of advances used in operating activities and additional advances made during the year.
d) 100% or P=66.11K decrease in accrued interest receivable – due to the collection of interest income
e) 18% or P=20.58M decrease in accounts receivable others – due to the decrease in receivables from third parties
100% or P=347.3K decrease in Notes Receivable – due to the collection of loans granted to a third party
26
11% or P=67.3M increase in Real estate held for sale – due to the net effect of the increase in development costs for horizontal and vertical development of the new projects. 18% or P=6.9M increase in Inventories – due to the group’s additional inventories on palm olein and its by-products such as refined bleach deodorized oil, palm olein, palm stearin, and increase in inventory of palm acid oil, fatty acid distillate, and aggregates. 16% or P=40.3M increase in Prepayments and other current assets – due to the net effect of:
a) 9% or P=6.12M increase in creditable withholding taxes – as a result of increase in real estate sales made during the year.
b) 2% or P=1.92M increase for deposit on land acquisition; c) 23% or P=10.68M decrease in prepaid expenses - due to the utilization of the prepayments d) 307% or P=30.36M increase in input VAT – due to increase in recognized input VAT from
various purchases made during the year. e) 42% or P=12.9M decrease in other deposits
Non-Current assets decreased by 11% or P=512.8 million as a result of the net effect of the following: 33% or P=53.6M decrease in noncurrent contract receivables – due to the net effect of the total collections during the year as a result of bank take out of end-buyer’s financing; increase in booked sales and changes in payment schemes of real estate buyers 100% or P=554.2M decrease in Investments and deposits – due to the application of deposits to subscription and reclassification to available for sale investment. 58% or P=362.4M increase in Available-for-sale investments – due to the net effect of the reclassification from investments and deposits (P=389M), decrease due to deconsolidation of subsidiary (P=480k) and the decline in the market value of investments (P=26M) 20% or P=245.3M decrease in Investment in Associates – mainly due to the reduction of subscription (P=252.8M) 11% or P=26.1M decrease in Investment Properties – due to the net effect of disposals made during the year (P=19.5M), impairment loss on properties held for capital appreciation (P=4.1M) and depreciation on the properties held under lease during the year (P=2.6M) 7% or P=30.5M increase in Property and Equipme nt - net due to the net effect in:
a) 34% or P=1.24M decrease in land improvements – due to the net effect of the additions and deconsolidation during the year.
b) 40% or P=36.45M decrease in Building and improvements – due to the deconsolidation during the year
c) 85% or P=255.62M increase in Machinery and equipment – due to the completion of construction of RBD and fractionation machines thereby having commercial operations which generated revenues producing Palm Olein and Stearin.
d) 26% or P= 7.6M decrease in furniture, fixtures and equipment – due to the net effect of the disposals and deconsolidation during the year.
e) 1% or P=555.9K increase in transportation equipment – due to the net effect of the disposal and purchases of various transportation equipment made during the year
f) 60% or P=2.15M decrease in tools and other equipment – due to the disposal during the year g) 10% or P=2.69M increase in other fixed assets – due to the net effect of additional purchases
made during the year as against deconsolidation. h) 84% or P=180.92M decrease in CIP – as a result of the additional capital expenditures
related to Refined, Bleached, and Deodorized (RBD) for the agri-business.
27
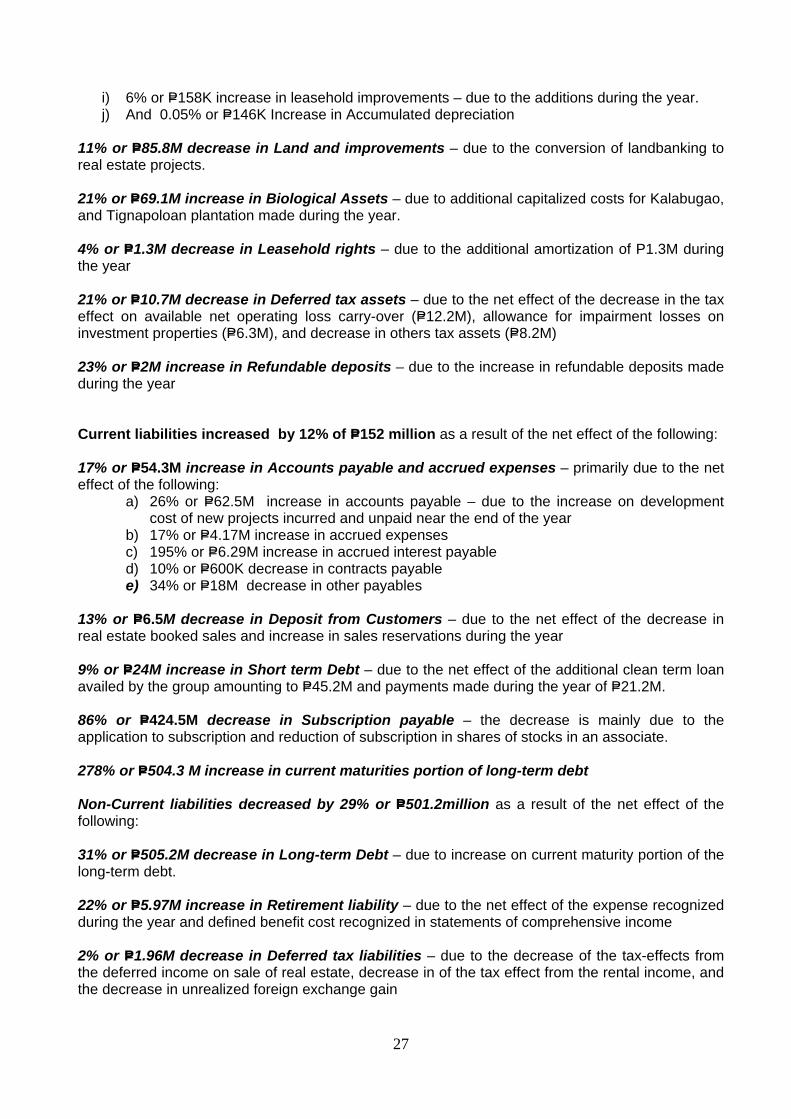
i) 6% or P=158K increase in leasehold improvements – due to the additions during the year. j) And 0.05% or P=146K Increase in Accumulated depreciation
11% or P=85.8M decrease in Land and improvements – due to the conversion of landbanking to real estate projects. 21% or P=69.1M increase in Biological Assets – due to additional capitalized costs for Kalabugao, and Tignapoloan plantation made during the year. 4% or P=1.3M decrease in Leasehold rights – due to the additional amortization of P1.3M during the year 21% or P=10.7M decrease in Deferred tax assets – due to the net effect of the decrease in the tax effect on available net operating loss carry-over (P=12.2M), allowance for impairment losses on investment properties (P=6.3M), and decrease in others tax assets (P=8.2M) 23% or P=2M increase in Refundable deposits – due to the increase in refundable deposits made during the year Current liabilities increased by 12% of P=152 million as a result of the net effect of the following: 17% or P=54.3M increase in Accounts payable and accrued expenses – primarily due to the net effect of the following:
a) 26% or P=62.5M increase in accounts payable – due to the increase on development cost of new projects incurred and unpaid near the end of the year
b) 17% or P=4.17M increase in accrued expenses c) 195% or P=6.29M increase in accrued interest payable d) 10% or P=600K decrease in contracts payable e) 34% or P=18M decrease in other payables
13% or P=6.5M decrease in Deposit from Customers – due to the net effect of the decrease in real estate booked sales and increase in sales reservations during the year 9% or P=24M increase in Short term Debt – due to the net effect of the additional clean term loan availed by the group amounting to P=45.2M and payments made during the year of P=21.2M. 86% or P=424.5M decrease in Subscription payable – the decrease is mainly due to the application to subscription and reduction of subscription in shares of stocks in an associate. 278% or P=504.3 M increase in current maturities portion of long-term debt Non-Current liabilities decreased by 29% or P=501.2million as a result of the net effect of the following: 31% or P=505.2M decrease in Long-term Debt – due to increase on current maturity portion of the long-term debt. 22% or P=5.97M increase in Retirement liability – due to the net effect of the expense recognized during the year and defined benefit cost recognized in statements of comprehensive income 2% or P=1.96M decrease in Deferred tax liabilities – due to the decrease of the tax-effects from the deferred income on sale of real estate, decrease in of the tax effect from the rental income, and the decrease in unrealized foreign exchange gain

28
Equity decreased by 0.4% or P=11.96 million as a result of the net effect of the following: 14% or P=25.6M decrease in Net unrealized gain on available for sale – due to the decrease in market value of investments 3% or P=674K increase in cumulative remeasurement loss on retirement benefits – due to the defined benefit cost recognized in other comprehensive income 4% or P=14.8M increase in the Retained Earnings – due to the effect of net income earned for the year
29
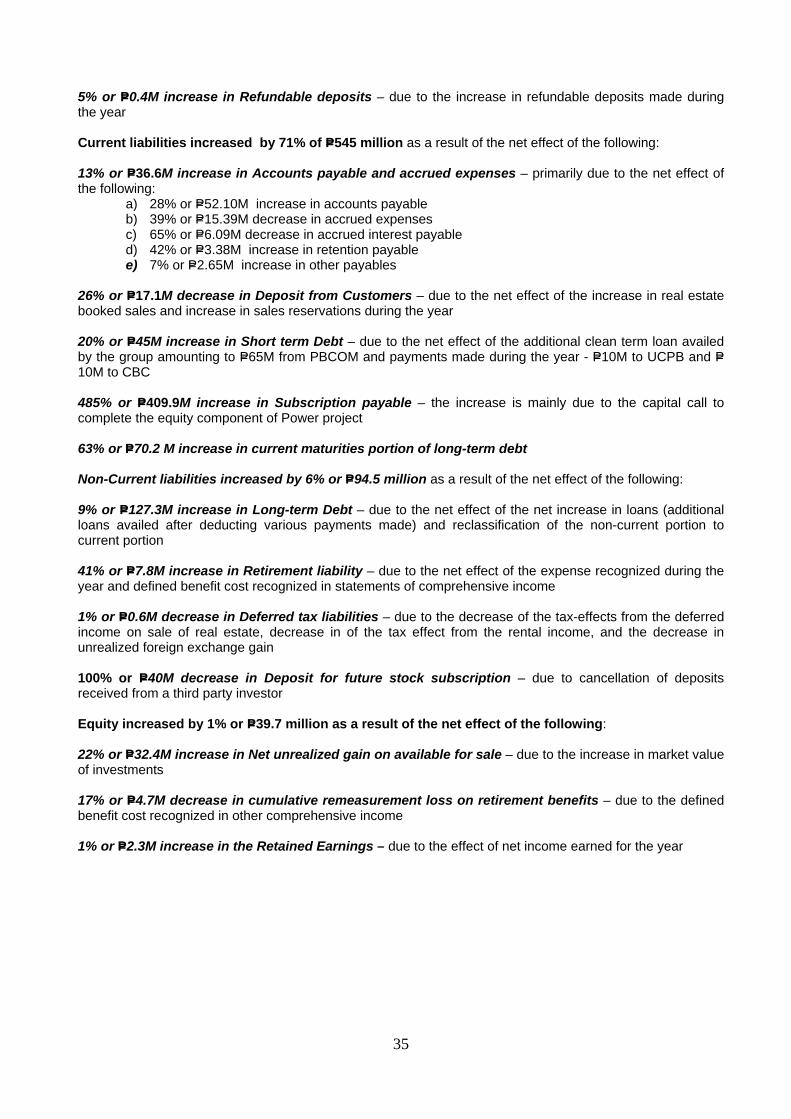
Results of Operation
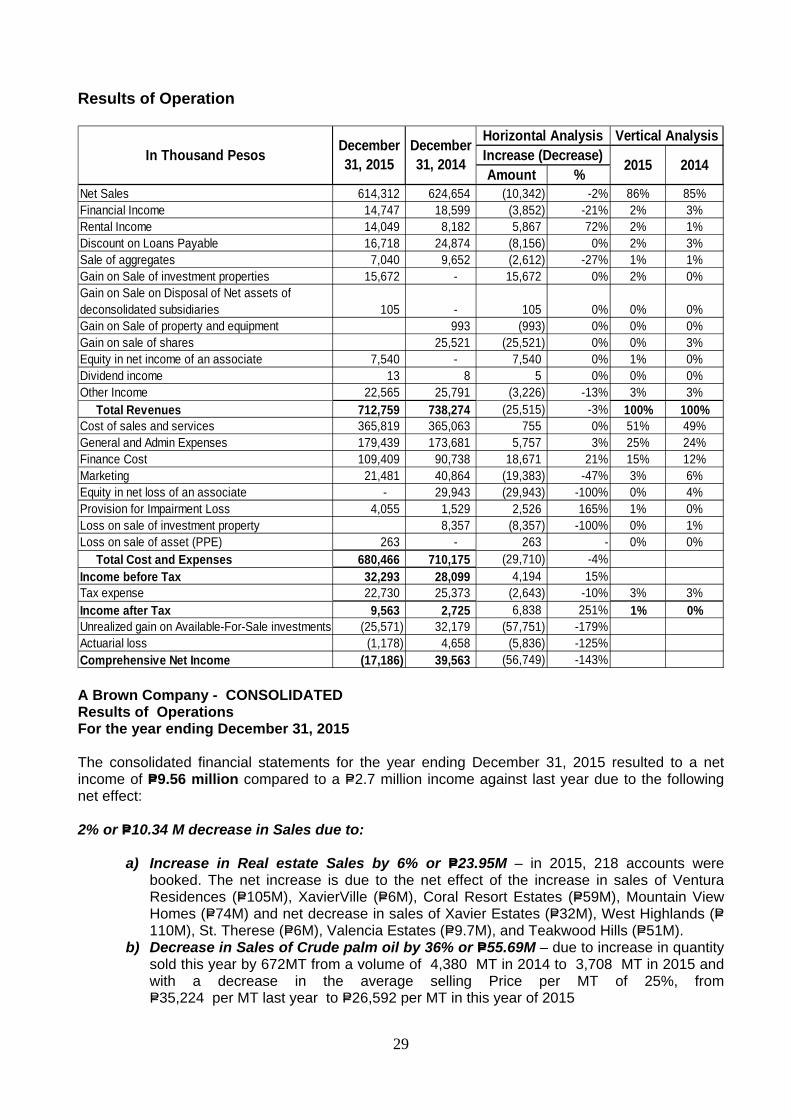
Amount %Net Sales 614,312 624,654 (10,342) -2% 86% 85%Financial Income 14,747 18,599 (3,852) -21% 2% 3%Rental Income 14,049 8,182 5,867 72% 2% 1%Discount on Loans Payable 16,718 24,874 (8,156) 0% 2% 3%Sale of aggregates 7,040 9,652 (2,612) -27% 1% 1%Gain on Sale of investment properties 15,672 - 15,672 0% 2% 0%Gain on Sale on Disposal of Net assets of deconsolidated subsidiaries 105 - 105 0% 0% 0%Gain on Sale of property and equipment 993 (993) 0% 0% 0%Gain on sale of shares 25,521 (25,521) 0% 0% 3%Equity in net income of an associate 7,540 - 7,540 0% 1% 0%Dividend income 13 8 5 0% 0% 0%Other Income 22,565 25,791 (3,226) -13% 3% 3% Total Revenues 712,759 738,274 (25,515) -3% 100% 100%Cost of sales and services 365,819 365,063 755 0% 51% 49%General and Admin Expenses 179,439 173,681 5,757 3% 25% 24%Finance Cost 109,409 90,738 18,671 21% 15% 12%Marketing 21,481 40,864 (19,383) -47% 3% 6%Equity in net loss of an associate - 29,943 (29,943) -100% 0% 4%Provision for Impairment Loss 4,055 1,529 2,526 165% 1% 0%Loss on sale of investment property 8,357 (8,357) -100% 0% 1%Loss on sale of asset (PPE) 263 - 263 - 0% 0% Total Cost and Expenses 680,466 710,175 (29,710) -4%Income before Tax 32,293 28,099 4,194 15%Tax expense 22,730 25,373 (2,643) -10% 3% 3%Income after Tax 9,563 2,725 6,838 251% 1% 0%Unrealized gain on Available-For-Sale investments (25,571) 32,179 (57,751) -179%Actuarial loss (1,178) 4,658 (5,836) -125%Comprehensive Net Income (17,186) 39,563 (56,749) -143%
In Thousand Pesos December 31, 2015
December 31, 2014
Horizontal Analysis Vertical AnalysisIncrease (Decrease) 2015 2014
A Brown Company - CONSOLIDATED Results of Operations For the year ending December 31, 2015 The consolidated financial statements for the year ending December 31, 2015 resulted to a net income of P=9.56 million compared to a P=2.7 million income against last year due to the following net effect: 2% or P=10.34 M decrease in Sales due to:
a) Increase in Real estate Sales by 6% or P=23.95M – in 2015, 218 accounts were booked. The net increase is due to the net effect of the increase in sales of Ventura Residences (P=105M), XavierVille (P=6M), Coral Resort Estates (P=59M), Mountain View Homes (P=74M) and net decrease in sales of Xavier Estates (P=32M), West Highlands (P=110M), St. Therese (P=6M), Valencia Estates (P=9.7M), and Teakwood Hills (P=51M).
b) Decrease in Sales of Crude palm oil by 36% or P=55.69M – due to increase in quantity sold this year by 672MT from a volume of 4,380 MT in 2014 to 3,708 MT in 2015 and with a decrease in the average selling Price per MT of 25%, from P=35,224 per MT last year to P=26,592 per MT in this year of 2015
30
c) Increase in sales from Water services by 19 % or P=2.6M – as a result of the increase in billed water consumption this year from 474,737 cubic meter (cu.m). in 2014 to 508,768 cu.m in 2015 with a corresponding average selling price of P=37 per cu.m; the increase in consumption is attributable to the new water connections in 2015.
d) Decrease in sales from Hotel operations by 100% or P=8.1M – due to the deconsolidation of a subsidiary holding the hotel operations
e) Decrease in sales of Crop and Palm Seedlings by 85% or P=3.4M – due to the decrease in sale of palm seedlings from 10,495 pcs in 2014 to 988 pcs in 2015 @ selling price of P=220/pc in 2014 and 2015
f) Decrease in sales of Kernel nuts and fertilizers by 2% or P=111.29K – due to the net effect of the decrease in quantity sold of kernel nuts this year by 6 MT from 575MT in 2014 to 569 MT in 2015; average selling price in 2015 decreased by 0.2% from P=9,748 in 2014 to P=9,727 in 2015; and decrease in fertilizers as there are no sales recognized during the year.
g) 17% or P=1.5M decrease in sales of Other By-products of CPO – due to the decrease in sale of recovered oil
h) 100% or P=24.4M increase in sales of Palm Olein – sales and production of Palm Olein started only in 2015
i) 100% or P=7.56M increase in sales of Palm Stearin– sales and production of Palm Stearin started only in 2015
100% or P=7.5M increase in equity in net income of an associate – this pertains to the group’s 20% share in the net income of PEI and PCPC 21% or P=3.85M decrease in Financial income – due to the decrease in interest income of from in-house financing of real estate sale (P=3.2M), decrease in interest from notes receivable (P=487K), and decrease in interest from cash in bank and cash equivalents (181K) Decrease in Sales of aggregates by 27% or P=2.6 M – due to disruption of operations in the first quarter of 2015 due to environmental concerns but was later resolved by the imposition of higher extraction tax by Bukidnon Environment and Natural Resources Office; with this, there is a decrease in sales volume from 12,880 cubic meter in 2014 with an average price of P=749 per cu.m to 12,502 cubic meter in 2015 with an average price of P=563 per cubic meter 72% or P=5.9M increase in Rental income – due to the additional space occupied by third parties and increase in rental of equipment 100% or P=993.13K increase in Gain on sale of property and equipment – this refers to the gain on disposal of transportation equipment 100% or P=25.5M decrease in Gain on sale of shares – due to the sale of various available-for-sale investments in 2014 33% of P=8.16 M decrease the Discount of Loans payable – discounted non-interest bearing loans availed from various stockholders is higher in 2014. 13% or P=3.2M decrease in other income – due to the following:
a) 55% or P=3.8 M decrease in income from forfeited deposits – due to the decrease in number of forfeited accounts this year as compared to last year
b) 31% or P=951.6K decrease in income from penalties and surcharges – payments received from customers with past due accounts
c) 9% or P=1.5 increase in other income – due to the additional earnings from lot staking and driving range fees
31
P=755.5K increase in Cost of Sales due to the net effect of the following:
a) 14% or P=30.2M increase in cost of real estate sales – directly related to the increase in real estate sales
b) 41% or P=46.93M decrease in cost of production of crude palm oil – directly related to the decrease in sale of crude palm oil
c) 58% or P=2.3M increase in cost of aggregates – relative to the increase in the cost of major repairs of the crushing plant.
d) 15% or P=754K increase in the production of water services – due to the repairs and maintenance of the water pump house
e) 8% or P=452K decrease in cost of crop and palm seedlings – directly related to the decrease in sales of crop and palm seedlings
f) 22% or P=799K increase in the cost of kernel nuts and fertilizers – due to the decrease in costs directly related to the sale of kernel nuts and fertilizers.
j) 100% or P=14.3M decrease in the hotel operation - due to the deconsolidation of a subsidiary holding the hotel operations
k) 100% or P=4.9M increase in production of Palm Stearin – commercial operation started in 2015
l) 100% or P=16.9M increase in production of Palm Olein – commercial operation started in 2015
g) 99%or P=5.9M decrease in other direct cost – due to the decrease in other cost directly related to the group’s operating activities.
3% or P=5.8M increase in general and administrative expenses due to the following net effect of:
a) 20% or P=11.3M increase in Personnel Expenses – the increase is due to net effect of the adjustment on the retirement liability, capitalized salaries and employee benefits of some personnel directly involved in the testing of RBD Oil production, and increase in salaries expense of the group
b) 19% or P=3.8M increase in Taxes and Licenses – due to the various taxes and licenses including SEC fees paid in 2015
c) 37% or P=9.9M decrease in Depreciation and Amortization – due to the net effect of the disposal of depreciable assets, full depreciation of a number of assets and additional depreciation of various new acquisitions of equipment and other depreciable assets during the year
d) 12% or P=883K decrease in Repairs and Maintenance – due to the decrease in various repairs of various equipment in 2015
e) 17% or P=1.4M decrease in Utilities and Supplies – due to the acquisition of Safety gear for mill and plantation and other consumable supplies for mill and plantation in 2014
f) 100% or P=0.8M decrease in provision for doubtful accounts – due to the increase in the provision for the various receivable accounts with high possibility of non-collection in 2014
g) 212% or P=4.6M increase in Rental expense – due to the additional office space occupied
h) 24% or P=856K increase in Retirement Benefits i) 70% or P=1.1M decrease in Representation and Entertainment – the frequency and
cost of providing comfort/convenience (i.e. meals) to the prospective clients and other stakeholders of the company’s future projects as well as various representations made to government in relation to the Group’s projects is lesser in 2015 as compared in 2014
j) 5% or P=430K increase in Professional fees/retainers fee – due to the additional required services related to the real estate operations
k) 28% or P=2.1M decrease in Travel and transportation – due to the decrease in various travels made related to the development of real estate projects in various locations during the year
l) 2% or P=300K decrease in Security services m) 0.2% or P=1.7K increase in Board meeting expenses
32
n) 15% or P=87K increase in Training and seminars – due to various training and seminars conducted and attended this year compared to last year.
o) 6% or P=38k increase in Subscription and dues – due to the increase in subscription of business magazines
p) 29% or P=331K decrease in Insurance expense – due to the decrease in properties insured
q) 56% or P=435K decrease in Litigation expenses – due to the incurrence of litigation expenses related to Bernardino and Yulo case in the prior year
r) 16% or P=197K increase in Directors’ fees s) 90% or P=501K decrease in Bank charges –due to the charges related to bank loans t) 20% or P=2.2M decrease in Miscellaneous expenses
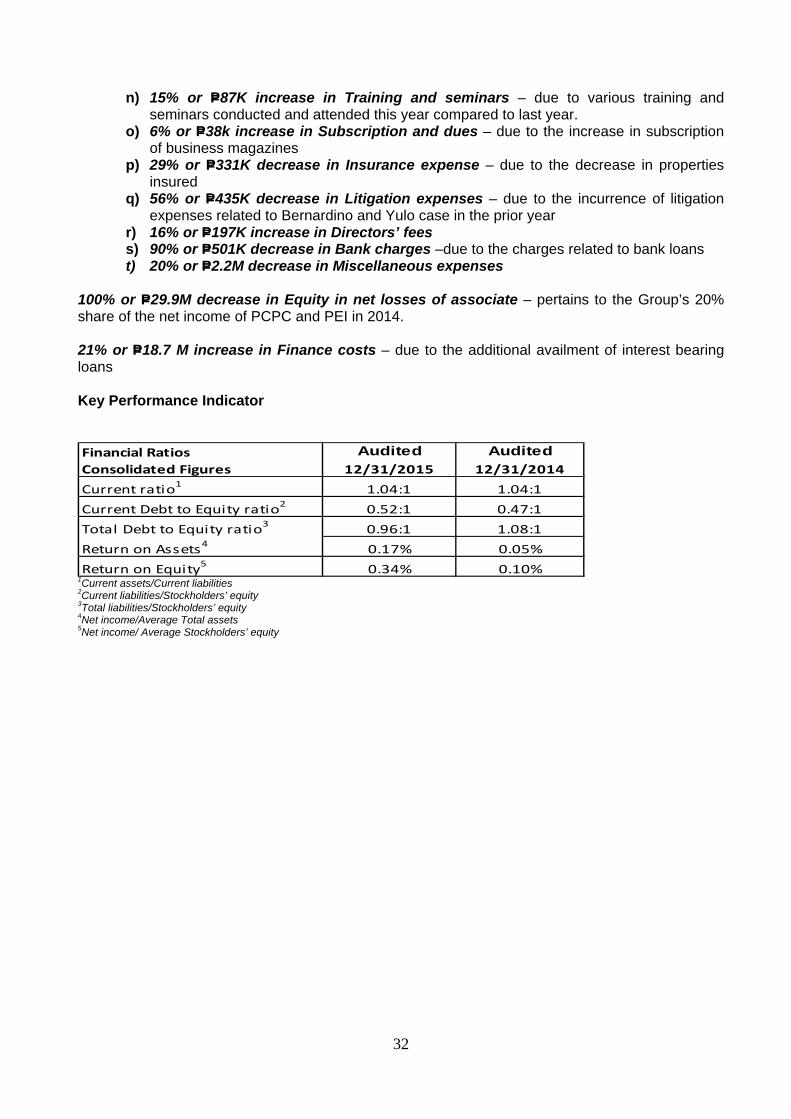
100% or P=29.9M decrease in Equity in net losses of associate – pertains to the Group’s 20% share of the net income of PCPC and PEI in 2014. 21% or P=18.7 M increase in Finance costs – due to the additional availment of interest bearing loans Key Performance Indicator Financial Ratios Audited AuditedConsolidated Figures 12/31/2015 12/31/2014
1.04:1 1.04:10.52:1 0.47:10.96:1 1.08:10.17% 0.05%0.34% 0.10%
Current ratio1
Current Debt to Equity ratio2
Total Debt to Equity ratio3
Return on Assets4
Return on Equity5 1Current assets/Current liabilities 2Current liabilities/Stockholders’ equity 3Total liabilities/Stockholders’ equity 4Net income/Average Total assets 5Net income/ Average Stockholders’ equity
33
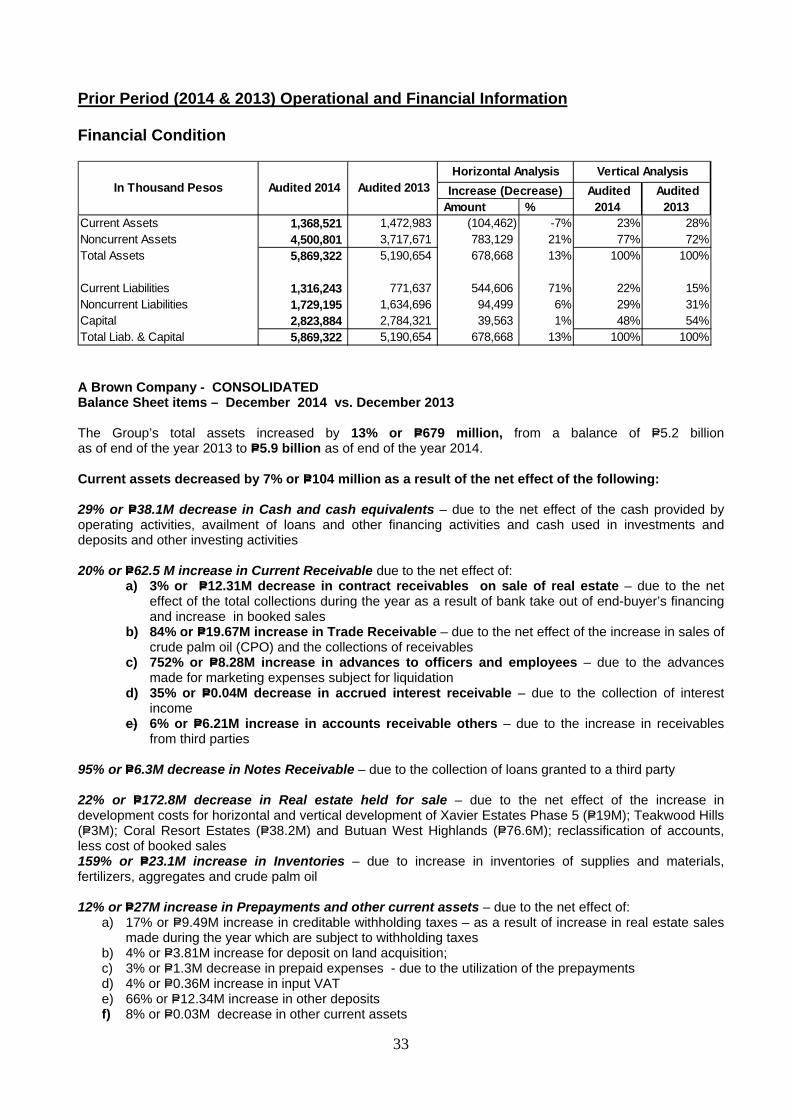
Prior Period (2014 & 2013) Operational and Financial Information Financial Condition
Amount %Current Assets 1,368,521 1,472,983 (104,462) -7% 23% 28%Noncurrent Assets 4,500,801 3,717,671 783,129 21% 77% 72%Total Assets 5,869,322 5,190,654 678,668 13% 100% 100%
Current Liabilities 1,316,243 771,637 544,606 71% 22% 15%Noncurrent Liabilities 1,729,195 1,634,696 94,499 6% 29% 31%Capital 2,823,884 2,784,321 39,563 1% 48% 54%Total Liab. & Capital 5,869,322 5,190,654 678,668 13% 100% 100%
Horizontal Analysis Vertical Analysis Audited
2014 Audited
2013 In Thousand Pesos Increase (Decrease) Audited 2014 Audited 2013
A Brown Company - CONSOLIDATED Balance Sheet items – December 2014 vs. December 2013 The Group’s total assets increased by 13% or P=679 million, from a balance of P=5.2 billion as of end of the year 2013 to P=5.9 billion as of end of the year 2014. Current assets decreased by 7% or P=104 million as a result of the net effect of the following: 29% or P=38.1M decrease in Cash and cash equivalents – due to the net effect of the cash provided by operating activities, availment of loans and other financing activities and cash used in investments and deposits and other investing activities 20% or P=62.5 M increase in Current Receivable due to the net effect of:
a) 3% or P=12.31M decrease in contract receivables on sale of real estate – due to the net effect of the total collections during the year as a result of bank take out of end-buyer’s financing and increase in booked sales
b) 84% or P=19.67M increase in Trade Receivable – due to the net effect of the increase in sales of crude palm oil (CPO) and the collections of receivables
c) 752% or P=8.28M increase in advances to officers and employees – due to the advances made for marketing expenses subject for liquidation
d) 35% or P=0.04M decrease in accrued interest receivable – due to the collection of interest income
e) 6% or P=6.21M increase in accounts receivable others – due to the increase in receivables from third parties
95% or P=6.3M decrease in Notes Receivable – due to the collection of loans granted to a third party 22% or P=172.8M decrease in Real estate held for sale – due to the net effect of the increase in development costs for horizontal and vertical development of Xavier Estates Phase 5 (P=19M); Teakwood Hills (P=3M); Coral Resort Estates (P=38.2M) and Butuan West Highlands (P=76.6M); reclassification of accounts, less cost of booked sales 159% or P=23.1M increase in Inventories – due to increase in inventories of supplies and materials, fertilizers, aggregates and crude palm oil 12% or P=27M increase in Prepayments and other current assets – due to the net effect of:
a) 17% or P=9.49M increase in creditable withholding taxes – as a result of increase in real estate sales made during the year which are subject to withholding taxes
b) 4% or P=3.81M increase for deposit on land acquisition; c) 3% or P=1.3M decrease in prepaid expenses - due to the utilization of the prepayments d) 4% or P=0.36M increase in input VAT e) 66% or P=12.34M increase in other deposits f) 8% or P=0.03M decrease in other current assets

34
Non-Current assets increased by 21% or P=783 million as a result of the net effect of the following: 20% or P=41.5M decrease in noncurrent contract receivables – due to the net effect of the total collections during the year as a result of bank take out of end-buyer’s financing; increase in booked sales and changes in payment schemes of real estate buyers 20% or P=141.7M decrease in Investments and deposits – due to the net effect of the application of deposits to subscription (P=696M), cancellation of deposits (P=40M), and additional deposits made during the year (P=594M) 31% or P=287.6M decrease in Available for sale investments – due to the net effect of the disposal of shares, net of changes in value (P=400M), additions made during the year (P=4M), application of deposits (P=94M) and the decline in the market value of investments (P=14M) 456% or P=1,014.5M increase in Investment in Associates – due to the net effect of the additional investments made, application of deposits to available for sale investments, increase due to merger and decrease due to Group’s share in equity in net loss on the investment in shares of stocks of Peakpower Energy, Inc. (PEI) and Palm Concepcion Power Corporation (PCPC) 17% or P=48.9M decrease in Investment Properties – due to the net effect of impairment loss in the properties held for capital appreciation and depreciation on the properties held under lease during the year, reclassification from Property and Equipment, and additions made during the year 11% or P=45.2M increase in Property and Equipment - net due to the net effect in:
a) 21% or P=3.43M decrease in land – due to the reclassification of a parcel of land to investment property which was also sold during the year
b) 8% or P=6.47M increase in Building and improvements – due to the net effect of the reclassification of Mill warehouse and staff house from construction in progress (CIP)
c) 8% or P=21.4M increase in Machinery and equipment – due to the net effect of the reclassification from CIP, purchase of additional and disposal of various construction equipment
d) 3% or P=0.90 M increase in furniture, fixtures and equipment – due to purchase of various office equipment and furniture and various computers and office equipment used by the Group
e) 4% or P=2.32M decrease in transportation equipment – due to the net effect of the disposal and purchases of various transportation equipment made during the year
f) 20% or P=0.59M increase in tools and other equipment – due to the various purchases made during the year
g) 23% or P=8.92M decrease in other fixed assets – due to the net effect of the reclassifications to building and improvements and machinery and equipment and the additional purchases of various depreciable assets made during the year
h) 52% or P=73.97M increase in CIP – as a result of the additional capital expenditures related to Refined, Bleached, Deodorized (RBD) for the agri-business.
i) And 17% or P=43.54M Increase in Accumulated depreciation 37% or P=215.8M increase in Land and improvements – due to the net effect in:
a) P=17.7 M additions to development costs b) P=173.3 M reclassification of accounts from real estate held for sale to land and improvements c) P=10.5 M reclassification of accounts from land and improvements to real estate held for sale
11% or P=32.9M increase in Biological Assets – due to additional capitalized costs for Kalabugao, and Tignapoloan plantation 4% or P=1.3M decrease in Leasehold rights – due to the additional amortization of P1.3M during the year 8% or P=4.5M decrease in Deferred tax assets – due to the net effect of the decrease in the tax effect on available net operating loss carry-over (P=13.1M), allowance for impairment losses on investment properties (P=4.6M), allowance for impairment losses on investment in real estate (P=5M), unrealized foreign exchange loss (P=388k), defined benefit cost (P=7.7M) and the decrease in the minimum corporate income tax (P=975k)
35
5% or P=0.4M increase in Refundable deposits – due to the increase in refundable deposits made during the year Current liabilities increased by 71% of P=545 million as a result of the net effect of the following: 13% or P=36.6M increase in Accounts payable and accrued expenses – primarily due to the net effect of the following:
a) 28% or P=52.10M increase in accounts payable b) 39% or P=15.39M decrease in accrued expenses c) 65% or P=6.09M decrease in accrued interest payable d) 42% or P=3.38M increase in retention payable e) 7% or P=2.65M increase in other payables
26% or P=17.1M decrease in Deposit from Customers – due to the net effect of the increase in real estate booked sales and increase in sales reservations during the year 20% or P=45M increase in Short term Debt – due to the net effect of the additional clean term loan availed by the group amounting to P=65M from PBCOM and payments made during the year - P=10M to UCPB and P=10M to CBC 485% or P=409.9M increase in Subscription payable – the increase is mainly due to the capital call to complete the equity component of Power project 63% or P=70.2 M increase in current maturities portion of long-term debt Non-Current liabilities increased by 6% or P=94.5 million as a result of the net effect of the following: 9% or P=127.3M increase in Long-term Debt – due to the net effect of the net increase in loans (additional loans availed after deducting various payments made) and reclassification of the non-current portion to current portion 41% or P=7.8M increase in Retirement liability – due to the net effect of the expense recognized during the year and defined benefit cost recognized in statements of comprehensive income 1% or P=0.6M decrease in Deferred tax liabilities – due to the decrease of the tax-effects from the deferred income on sale of real estate, decrease in of the tax effect from the rental income, and the decrease in unrealized foreign exchange gain 100% or P=40M decrease in Deposit for future stock subscription – due to cancellation of deposits received from a third party investor Equity increased by 1% or P=39.7 million as a result of the net effect of the following: 22% or P=32.4M increase in Net unrealized gain on available for sale – due to the increase in market value of investments 17% or P=4.7M decrease in cumulative remeasurement loss on retirement benefits – due to the defined benefit cost recognized in other comprehensive income 1% or P=2.3M increase in the Retained Earnings – due to the effect of net income earned for the year
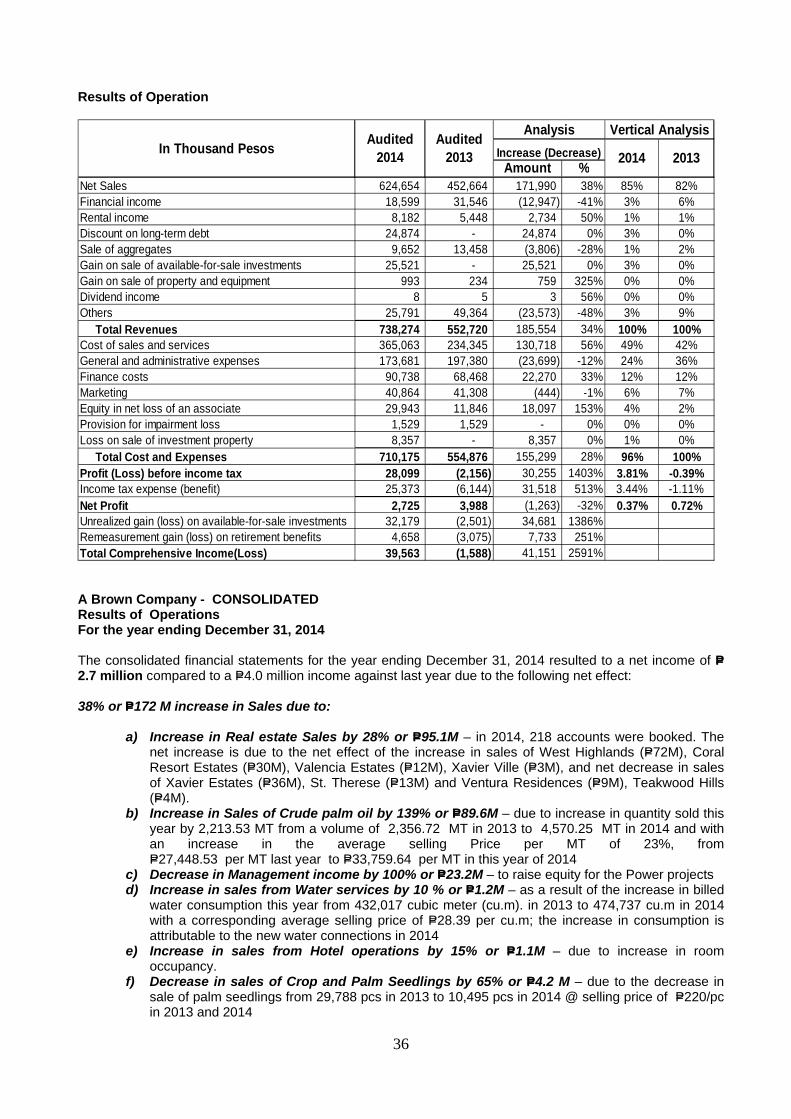
36
Results of Operation
Amount %Net Sales 624,654 452,664 171,990 38% 85% 82%Financial income 18,599 31,546 (12,947) -41% 3% 6%Rental income 8,182 5,448 2,734 50% 1% 1%Discount on long-term debt 24,874 - 24,874 0% 3% 0%Sale of aggregates 9,652 13,458 (3,806) -28% 1% 2%Gain on sale of available-for-sale investments 25,521 - 25,521 0% 3% 0%Gain on sale of property and equipment 993 234 759 325% 0% 0%Dividend income 8 5 3 56% 0% 0%Others 25,791 49,364 (23,573) -48% 3% 9% Total Revenues 738,274 552,720 185,554 34% 100% 100%Cost of sales and services 365,063 234,345 130,718 56% 49% 42%General and administrative expenses 173,681 197,380 (23,699) -12% 24% 36%Finance costs 90,738 68,468 22,270 33% 12% 12%Marketing 40,864 41,308 (444) -1% 6% 7%Equity in net loss of an associate 29,943 11,846 18,097 153% 4% 2%Provision for impairment loss 1,529 1,529 - 0% 0% 0%Loss on sale of investment property 8,357 - 8,357 0% 1% 0% Total Cost and Expenses 710,175 554,876 155,299 28% 96% 100%Profit (Loss) before income tax 28,099 (2,156) 30,255 1403% 3.81% -0.39%Income tax expense (benefit) 25,373 (6,144) 31,518 513% 3.44% -1.11%Net Profit 2,725 3,988 (1,263) -32% 0.37% 0.72%Unrealized gain (loss) on available-for-sale investments 32,179 (2,501) 34,681 1386%Remeasurement gain (loss) on retirement benefits 4,658 (3,075) 7,733 251%Total Comprehensive Income(Loss) 39,563 (1,588) 41,151 2591%
In Thousand Pesos Audited 2014
Audited 2013
Analysis Vertical AnalysisIncrease (Decrease) 2014 2013
A Brown Company - CONSOLIDATED Results of Operations For the year ending December 31, 2014 The consolidated financial statements for the year ending December 31, 2014 resulted to a net income of P=2.7 million compared to a P=4.0 million income against last year due to the following net effect: 38% or P=172 M increase in Sales due to:
a) Increase in Real estate Sales by 28% or P=95.1M – in 2014, 218 accounts were booked. The net increase is due to the net effect of the increase in sales of West Highlands (P=72M), Coral Resort Estates (P=30M), Valencia Estates (P=12M), Xavier Ville (P=3M), and net decrease in sales of Xavier Estates (P=36M), St. Therese (P=13M) and Ventura Residences (P=9M), Teakwood Hills (P=4M).
b) Increase in Sales of Crude palm oil by 139% or P=89.6M – due to increase in quantity sold this year by 2,213.53 MT from a volume of 2,356.72 MT in 2013 to 4,570.25 MT in 2014 and with an increase in the average selling Price per MT of 23%, from P=27,448.53 per MT last year to P=33,759.64 per MT in this year of 2014
c) Decrease in Management income by 100% or P=23.2M – to raise equity for the Power projects d) Increase in sales from Water services by 10 % or P=1.2M – as a result of the increase in billed
water consumption this year from 432,017 cubic meter (cu.m). in 2013 to 474,737 cu.m in 2014 with a corresponding average selling price of P=28.39 per cu.m; the increase in consumption is attributable to the new water connections in 2014
e) Increase in sales from Hotel operations by 15% or P=1.1M – due to increase in room occupancy.
f) Decrease in sales of Crop and Palm Seedlings by 65% or P=4.2 M – due to the decrease in sale of palm seedlings from 29,788 pcs in 2013 to 10,495 pcs in 2014 @ selling price of P=220/pc in 2013 and 2014
37
g) Increase in sales of Kernel nuts and fertilizers by 52% or P=1.9M – due to the net effect of the increase in quantity sold of kernel nuts this year by 172.52 MT from 402.6MT in 2013 to 575.12 MT in 2014; average selling price in 2014 increased by 10% from P=8,844.60 in 2013 to P=9,748.47 in 2014; and decrease in fertilizers due to 76% decrease in quantity sold from 195 bags in 2013 to 47 bags in 2014; average selling price is still at P=850 per bag
h) 100% or P=10.5M increase in sales of Other Byproducts of CPO – due to the production and sale of Feed oil and Palm acid oil as byproducts of CPO
41% or P=12.9M decrease in Financial income – due to the decrease in interest from savings and money market placements (P=8.1M), decrease in interest income of from in house financing of real estate sale (P=4.8M) and decrease in interest from notes receivable (P=93k) Decrease in Sales of aggregates by 28% or P=3.8 M – due to disruption of operations in the first quarter of 2014 due to environmental concerns but was later resolved by the imposition of higher extraction tax by Bukidnon Environment and Natural Resources Office; with this, there is a decrease in sales volume from 21,150 cubic meter in 2013 with an average price of P=636 per cu.m to 12,880 cubic meter in 2014 with an average price of P=749 per cubic meter 50% or P=2.7M increase in Rental income – due to the additional space occupied by third parties and increase in van rental 325% or P=0.8M increase in Gain on sale of property and equipment – this refers to the gain on disposal of transportation equipment 100% or P=25.5M increase in Gain on sale of shares – due to the sale of various available-for-sale investments in 2014 100% of P=24.9 M increase the Discount of Loans payable – due to the discounting of the additional non-interest bearing loans availed by the Group from shareholders 48% or P=23.6 M decrease in other income – due to the following:
a) 80% or P=3.0 M increase in income from forfeited deposits – due to the increase in number of forfeited accounts this year as compared to last year
b) 8% or P=0.2M increase in income from penalties and surcharges – payments received from customers with past due accounts
c) 63% or P=26.8M decrease in other income – due to the reimbursement of marketing expenses from XU in 2013
56% or P=130.7M increase in Cost of Sales due to:
a) 57% or P=78.4M increase in cost of real estate sales – directly related to the increase in real estate sales
b) 79% or P=51.2M increase in cost of production of crude palm oil – directly related to the increase in sale of crude palm oil
c) 3% or P=0.4M increase in cost of hotel operations – due to the fixed costs incurred regardless of the number of room occupancy
d) 50% or P=3.9M decrease in cost of aggregates – relative to the decrease in quantity sold of aggregates
e) 22% or P=0.9M increase in the production of water services – due to the repairs and maintenance of the water pump house
f) 45% or P=1.5M decrease in cost of crop and palm seedlings – directly related to the decrease in sales of crop and palm seedlings
g) 65% or P=1.4M increase in the cost of kernel nuts and fertilizers – due to the increase in costs directly related to the sale of kernel nuts and fertilizers
h) 176% or P=3.8M increase in other direct cost – due to the costs incurred related to the sale of other by products of CPO
38
12% or P=23.7M decrease in general and administrative expenses due to the following net effect of: a) 10% or P=6.7M decrease in Personnel Expenses – the decrease is due to net effect of the
adjustment on the retirement liability of Parent Company in 2013, capitalized salaries and employee benefits of some personnel directly involved in the testing of RBD Oil production, and increase in salaries expense of the group
b) 10% or P=2.1M decrease in Taxes and Licenses – due to the various taxes and licenses including SEC fees paid in 2013
c) 4% or P=1.2 M decrease in Depreciation and Amortization – due to the net effect of the disposal of depreciable assets, full depreciation of a number of assets and additional depreciation of various new acquisitions of equipment and other depreciable assets during the year
d) 47% or P=2.3M increase in Repairs and Maintenance – due to the various repairs of various equipment in 2014
e) 34% or P=2.2M increase in Utilities and Supplies – due to the acquisition of Safety gear for mill and plantation and other consumable supplies for mill and plantation, and increase in utilities due to additional office space occupied
f) 100% or P=0.8M increase in provision for doubtful accounts – due to the provision for the various receivable accounts with high possibility of non-collection
g) 135% or P=1.2M increase in Rental expense – due to the additional office space occupied h) 55% or P=0.6M increase in Representation and Entertainment – the frequency and cost of
providing comfort/convenience (i.e.meals) to the prospective clients and other stakeholders of the company’s future projects as well as various representations made to government in relation to the Group’s projects is higher in 2014 as compared in 2013
i) 75% or P=24.1M decrease in Professional fees/retainers fee – the decrease is related to the arrangers fee to solicit potential investors in the Power group incurred in 2013
j) 6% or P=0.4 M increase in Travel and transportation – due to various travels made related to the development of real estate projects in various locations
k) 8% or P=1.1M increase in Security services – due to the increase in number of security personnel assigned to real estate projects
l) 22% or P=0.3M decrease in Board meeting expenses m) 112% or P=0.3M increase in Training and seminars – due to various training and seminars
conducted and attended this year compared to last year. n) 6% or P=31k increase in Subscription and dues – due to the increase in subscription of
business magazines o) 16% or P=0.2M increase in Insurance expense – due to the increase in properties insured p) 29% or P=0.3M decrease in Litigation expenses – due to the incurrence of litigation expenses
related to Bernardino and Yulo case in the prior year q) 18% or P=0.3M decrease in Directors’ fees r) 538% or P=0.5M increase in Bank charges – due to the charges related to bank loans s) 19% or P=1.7M increase in Miscellaneous expenses – due to various expenses related to
corporate social responsibility
153% or P=18.1M increase in Equity in net losses of associate – pertains to the Group’s 30% share of the net loss of PCPC and 20% of the net loss of PEI 33% or P=22.3 M increase in Finance costs – due to the additional availment of loans 100% or P=8.4 M increase in Loss on sale of investment properties – this is related to the disposal of investment property located in Kamuning, Quezon City
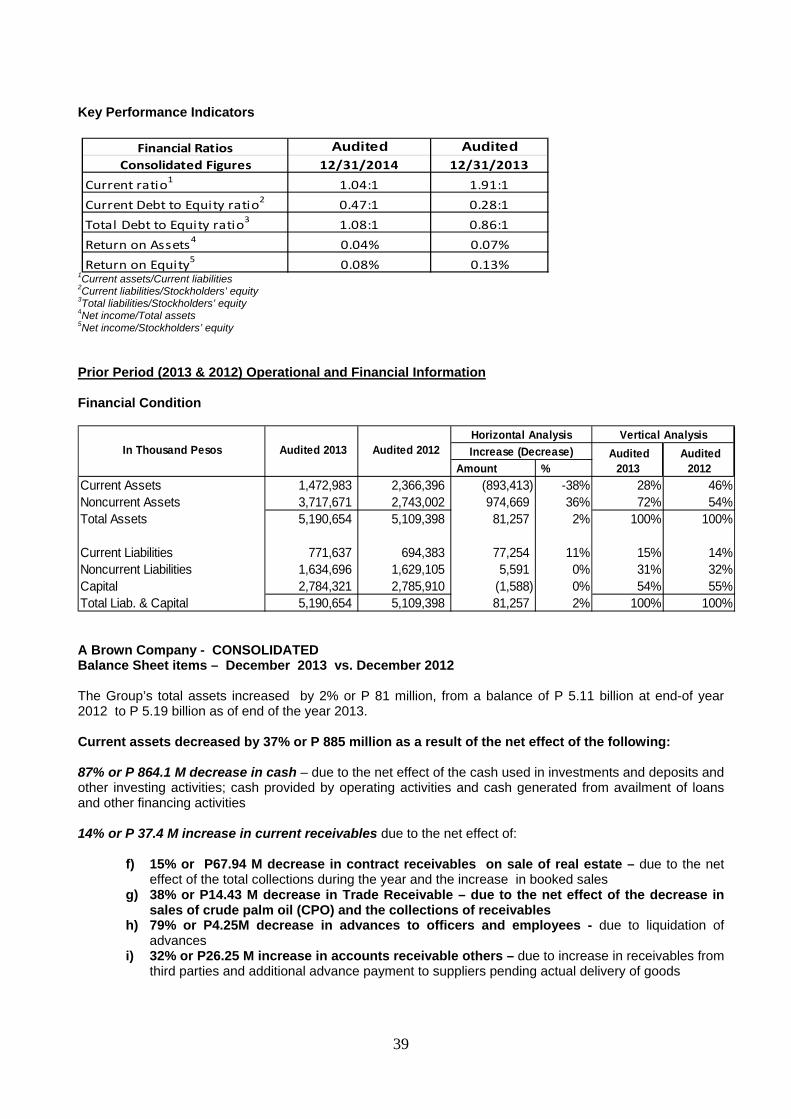
39
Key Performance Indicators
Financial Ratios Audited AuditedConsolidated Figures 12/31/2014 12/31/2013
Current ratio1 1.04:1 1.91:1Current Debt to Equity ratio2 0.47:1 0.28:1Total Debt to Equity ratio3 1.08:1 0.86:1Return on Assets4 0.04% 0.07%Return on Equity5 0.08% 0.13%
1Current assets/Current liabilities 2Current liabilities/Stockholders’ equity 3Total liabilities/Stockholders’ equity 4Net income/Total assets 5Net income/Stockholders’ equity Prior Period (2013 & 2012) Operational and Financial Information Financial Condition
Amount %Current Assets 1,472,983 2,366,396 (893,413) -38% 28% 46%Noncurrent Assets 3,717,671 2,743,002 974,669 36% 72% 54%Total Assets 5,190,654 5,109,398 81,257 2% 100% 100%
Current Liabilities 771,637 694,383 77,254 11% 15% 14%Noncurrent Liabilities 1,634,696 1,629,105 5,591 0% 31% 32%Capital 2,784,321 2,785,910 (1,588) 0% 54% 55%Total Liab. & Capital 5,190,654 5,109,398 81,257 2% 100% 100%
In Thousand Pesos Audited 2013 Audited 2012 Horizontal Analysis Vertical AnalysisIncrease (Decrease) Audited
2013 Audited
2012
A Brown Company - CONSOLIDATED Balance Sheet items – December 2013 vs. December 2012 The Group’s total assets increased by 2% or P 81 million, from a balance of P 5.11 billion at end-of year 2012 to P 5.19 billion as of end of the year 2013. Current assets decreased by 37% or P 885 million as a result of the net effect of the following: 87% or P 864.1 M decrease in cash – due to the net effect of the cash used in investments and deposits and other investing activities; cash provided by operating activities and cash generated from availment of loans and other financing activities 14% or P 37.4 M increase in current receivables due to the net effect of:
f) 15% or P67.94 M decrease in contract receivables on sale of real estate – due to the net effect of the total collections during the year and the increase in booked sales
g) 38% or P14.43 M decrease in Trade Receivable – due to the net effect of the decrease in sales of crude palm oil (CPO) and the collections of receivables
h) 79% or P4.25M decrease in advances to officers and employees - due to liquidation of advances
i) 32% or P26.25 M increase in accounts receivable others – due to increase in receivables from third parties and additional advance payment to suppliers pending actual delivery of goods
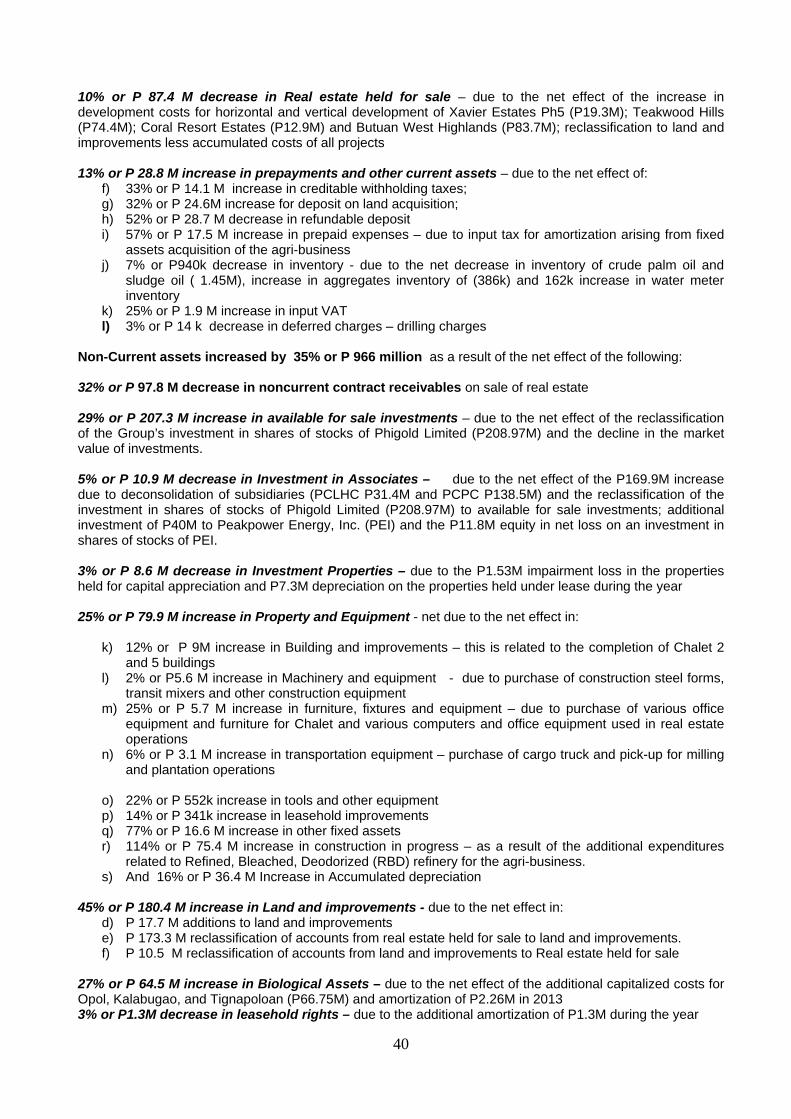
40
10% or P 87.4 M decrease in Real estate held for sale – due to the net effect of the increase in development costs for horizontal and vertical development of Xavier Estates Ph5 (P19.3M); Teakwood Hills (P74.4M); Coral Resort Estates (P12.9M) and Butuan West Highlands (P83.7M); reclassification to land and improvements less accumulated costs of all projects 13% or P 28.8 M increase in prepayments and other current assets – due to the net effect of:
f) 33% or P 14.1 M increase in creditable withholding taxes; g) 32% or P 24.6M increase for deposit on land acquisition; h) 52% or P 28.7 M decrease in refundable deposit i) 57% or P 17.5 M increase in prepaid expenses – due to input tax for amortization arising from fixed
assets acquisition of the agri-business j) 7% or P940k decrease in inventory - due to the net decrease in inventory of crude palm oil and
sludge oil ( 1.45M), increase in aggregates inventory of (386k) and 162k increase in water meter inventory
k) 25% or P 1.9 M increase in input VAT l) 3% or P 14 k decrease in deferred charges – drilling charges
Non-Current assets increased by 35% or P 966 million as a result of the net effect of the following: 32% or P 97.8 M decrease in noncurrent contract receivables on sale of real estate 29% or P 207.3 M increase in available for sale investments – due to the net effect of the reclassification of the Group’s investment in shares of stocks of Phigold Limited (P208.97M) and the decline in the market value of investments. 5% or P 10.9 M decrease in Investment in Associates – due to the net effect of the P169.9M increase due to deconsolidation of subsidiaries (PCLHC P31.4M and PCPC P138.5M) and the reclassification of the investment in shares of stocks of Phigold Limited (P208.97M) to available for sale investments; additional investment of P40M to Peakpower Energy, Inc. (PEI) and the P11.8M equity in net loss on an investment in shares of stocks of PEI. 3% or P 8.6 M decrease in Investment Properties – due to the P1.53M impairment loss in the properties held for capital appreciation and P7.3M depreciation on the properties held under lease during the year 25% or P 79.9 M increase in Property and Equipment - net due to the net effect in:
k) 12% or P 9M increase in Building and improvements – this is related to the completion of Chalet 2 and 5 buildings
l) 2% or P5.6 M increase in Machinery and equipment - due to purchase of construction steel forms, transit mixers and other construction equipment
m) 25% or P 5.7 M increase in furniture, fixtures and equipment – due to purchase of various office equipment and furniture for Chalet and various computers and office equipment used in real estate operations
n) 6% or P 3.1 M increase in transportation equipment – purchase of cargo truck and pick-up for milling and plantation operations
o) 22% or P 552k increase in tools and other equipment p) 14% or P 341k increase in leasehold improvements q) 77% or P 16.6 M increase in other fixed assets r) 114% or P 75.4 M increase in construction in progress – as a result of the additional expenditures
related to Refined, Bleached, Deodorized (RBD) refinery for the agri-business. s) And 16% or P 36.4 M Increase in Accumulated depreciation
45% or P 180.4 M increase in Land and improvements - due to the net effect in:
d) P 17.7 M additions to land and improvements e) P 173.3 M reclassification of accounts from real estate held for sale to land and improvements. f) P 10.5 M reclassification of accounts from land and improvements to Real estate held for sale
27% or P 64.5 M increase in Biological Assets – due to the net effect of the additional capitalized costs for Opol, Kalabugao, and Tignapoloan (P66.75M) and amortization of P2.26M in 2013 3% or P1.3M decrease in leasehold rights – due to the additional amortization of P1.3M during the year
41
339% or P 537.2M increase in Investments and deposits – deposits made for future subscription to its affiliates as follow: PCPC – P538.5M; MOREI – P93.6M; PEI – P63.8M 38% or P 15.4 M increase in deferred tax assets - due to the net effect of the increase of tax effect on available net operating loss carry-over (P14.6M), allowance for impairment losses on investment properties (P458k), unamortized past service cost (P565k) and the decrease in the minimum corporate income tax (P123k). Current liabilities increased by 11% of P 77.3 million as a result of the net effect of the following: 29% or P 50M increase in short term debt – due to the additional clean term loan availed by the group amounting to P30M from China Banking Corp. (CBC) and P20M from UCPB 385% or P 88 M increase in current maturities portion of long-term debt 15% or P 52.6 M decrease in accounts payable and accrued expenses – primarily due to the net effect of the following:
f) 24% or 61.2M decrease in accounts payable g) 133% or 23.4M increase in accrued expenses h) 56% or 3.5M increase in accrued interest payable i) 89% or P 3.8M increase in retention payable j) 38% or P 22.1M decrease in A/P-others
58% or P 24.2M increase in Deposit from Customers – increase due to increase in sales reservations. 100% or P 2.4M decrease in Dividends payable - due to the writing off of the long outstanding unclaimed issued checks 26% or P30 M decrease in Subscription payable – due to the full payment of the Group’s existing subscription to Monte Oro Resources Energy, Inc. Non-Current liabilities increased by P 5.6 million as a result of the net effect of the following: 3% or P 42.1M decrease in long-term debt – due to the net effect of the net increase in loans (additional loans availed after deducting various payments made), reclassifying the non-current portion to current portion. 6% or P1.0M increase in Retirement liability – due to the net effect of the expense recognized in 2013 (P3.0M); defined benefit cost recognized in statements of comprehensive income (P3.1M) and actual contributions (P5.1M) 9% or P 6.7 M increase in deferred tax liabilities – due to the net effect of the increase of the tax-effects from the deferred income on sale of real estate (P6.69M) and the decrease in of the tax effect from the rental income (P17.5k) P40M increase in Deposit for future stock subscription – due to additional deposits received from a prospective third party investor Equity decreased by P 1.6 million as a result of the net effect of the following: 25% or P 346.6 M increase in capital stock. – due to issuance of stocks related to the 25% stock dividend declared on June 7, 2013 and distributed on October 8, 2013 2% or P 2.5M decrease in net unrealized gain on available for sale- due to the decrease in market value of investments. 13% or P3.1M decrease in Cumulative actuarial loss reserve 50% or P 343M decrease in the retained earnings – net decrease on the effect of declaration of stock dividends and net income. Results of Operation

42
Amount %Net Sales 452,664 556,574 (103,910) -19% 82% 75%Financial Income 31,546 33,481 (1,935) -6% 6% 5%Rental Income 5,448 6,605 (1,157) -18% 1% 1%Discount on Loans Payable - 52,969 (52,969) 0% 0% 7%Sale of aggregates 13,458 19,804 (6,346) -32% 2% 3%Gain on Sale of property and equipment 234 294 (60) -20% 0% 0%Dividend Income 5 - 5 0% 0% 0%Other Income 49,364 70,726 (21,362) -30% 9% 10% Total Revenues 552,720 740,453 (187,733) -25% 100% 100%Cost of sales and services 234,345 348,732 (114,387) -33% 42% 47%General and Admin Expenses 197,380 183,383 13,997 8% 36% 25%Finance Cost 68,468 54,694 13,774 25% 12% 7%Marketing 41,308 41,329 (21) 0% 7% 6%Equity in net loss of an associate 11,846 9,349 2,498 27% 2% 1%Provision for Impairment Loss 1,529 1,529 - 0% 0% 0%Discount on Loans Receivable - 1,018 (1,018) 0% 0% 0% Total Cost and Expenses 554,876 640,034 (85,158) -13% 100% 86%Profit (Loss) before income tax (2,156) 100,419 (102,575) -102% -0.39% 13.56%Income tax expense (benefit) (6,144) 30,083 (36,227) -120% -1.11% 4.06%Net Profit 3,988 70,336 (66,348) -94% 0.72% 9.50%Unrealized gain (loss) on available-for-sale investments (2,501) (20,187) 17,686 -88%Remeasurement gain (loss) on retirement benefits (3,075) (14,217) 11,141 -78%Total Comprehensive Income(Loss) (1,588) 35,932 (37,521) -104%
In Thousand PesosAudited
2013Audited
2012 (restated)
Horizontal Vertical AnalysisIncrease 2013 2012
A Brown Company - CONSOLIDATED Results of Operations For the years ending December 31, 2013 vs December 31, 2012 The consolidated financial statements for the year ending December 31, 2013 resulted to a net income of P 4.0 Million compared to a P 70.3 M income against last year due to the following net effect: 19% or P 104 M decrease in Sales due to:
m) Decrease in real estate Sales by 25% or P 111 M – in 2013, 218 accounts were booked. Although this year is higher by 13 booked units as against 205 accounts booked last year, 26% or 57 units of the total booked units were from sale of the socialized housing units which is only 6% or P21.3M of the total sales.
n) Decrease in sales of crude palm oil by 22% or P 18M - due to decrease in quantity sold this year by 281.97 MT from a volume of 2,638.69 MT in 2012 to 2356.72 MT in 2013 and with a decrease in the average selling Price per MT of 12%, from P 31,319.75 per MT last year to P 27,448.53 per MT in this year of 2013
o) Increase in management income by 100% or P23.2M – fees paid to the parent company for the equity raising exercise of the power group.
p) Increase in sales from water services by 6 % or P 722k – as a result of the increase in cu.m. volume of consumption this year from 391,806 cu.m. in 2012 to 432,017 cu.m. in 2013 with corresponding average selling price of P 28.42 per cu.m; the increase in the volume of consumption is attributable to the new water connections in 2013
q) Decrease in sales from hotel operations by 23% or P 2.1M – due to decrease in room occupancy.
r) Increase in sales of Crop and Palm Seedlings by 18% or P 1.0 M – due to the increase in sale of palm seedlings from 21,380 pcs in 2012 to 29,788 pcs in 2013 @ selling price of P 220/pc; and
s) Increase in sales of kernel nuts and fertilizers by 152% or P2.3M – due to the net effect of the increase in quantity sold of kernel nuts this year by 303.61 MT from 98.99MT in 2012 to 402.60
43
MT in 2013; average selling price in 2013 decreased by 9.87% from P9,813.49 in 2012 to P8,844.60 in 2013; and decrease in fertilizers due to 70% decrease in quantity sold from 647 bags in 2012 to 195 bags in 2013; average selling price increased by 9% from P780.63 in 2012 to P850.00 in 2013
6% or P 1.9M decrease in financial income – due to net effect of the decrease in interest from savings and money market placements (P10.51M) and increase in interest income of from in house financing of real estate sale (P8.53M) and increase in interest from notes receivable (P45k) Decrease in Sales of aggregates by 32% or P 6.3 M – due to the decrese in sales volume from 35,420 cu.m. in 2012 with an average price of P563 per cu.m. to 21,150 cu.m in 2013 with an average price of P636 per cu.m. 18% or P 1.2M decrease in rental income - due to the termination of the lease contracts with CPGC Logistics Phils., Inc. 20 % or P 60k decrease in gain on sale of property and equipment - sale of fully depreciated multicab for the year as compared to the more property last year. 100% of P 53 M decrease the Discount of Loans payable – as a result of discounting of non-interest bearing loans from shareholders in 2012 30% or P 21.4 M decrease in other income – due to the following:
d) 63% or P 6.5 M decrease in income from forfeited deposits - due to the lesser number of forfeited accounts this year as compared to last year’s
e) 48% or P 2.7M decrease in income from penalties and surcharges - updated payments from customers and minimal foreclosed accounts
f) 22% or P 12.2M decrease in other income – due to the reimbursement of marketing expenses from JV partner
33% or P 114.4M decrease in Cost of Sales due to:
h) 81% or 58.2M decrease in land cost – the decrease is directly related to the decrease in sold units (excluding socialized housing units which has significantly lower cost as compared to other projects) multiplied by the cost factor of the land component
i) 28% or P 34.1M decrease in land development cost - the decrease is directly related to the decrease in sold units (excluding socialized housing units which has significantly lower cost as compared to other projects) multiplied by the cost factor of the land development
j) 2% or P 795k increase in building cost – as a result of the 57 houses from the socialized units k) 19% or P 15.5M decrease in cost of production of crude palm oil – basically due to the decrease
in quantity sold of crude palm oil by 281.97 MT from a volume of 2,638.69 MT in 2012 to 2356.72 MT in 2013
l) 10% or P1.3M increase in cost of hotel operations – due to the fixed costs incurred regardless of the number of room occupancy
m) 41% or P 5.5M decrease in cost of aggregates – relative to the decrease in quantity sold of aggregates
n) 14% or P649k decrease in the production of water services – due to the savings in electricity as an effect of the upgrade of the transformer at the pumping station
o) 56% or 4.1M decrease in cost of palm seedlings p) 22% or P 630k decrease in the cost of kernel nuts and fertilizers q) P 2.1M increase in other direct cost – due to amortization of biological assets of Nakeen
8% or P 14 M increase in general and administrative expenses due to the following net effect of:
u) 1% or P 909k decrease in personnel expenses v) 16% or P 4.2M decrease in Taxes and Licenses – due to SEC payment for increase
capitalization of ABERDI ( 202k) and the tax deficiency incurred of ( 2.10M) ; and registration of titles used as collaterals for the availment of loans in 2012
w) 14% or P3.3 M increase in Depreciation – due to the additional depreciation of various new acquisitions of transportation and machinery equipment and other office assets.
x) 45% or P 3.9M decrease in repairs and maintenance – due to the various repairs of heavy equipment in 2012
y) 6% or P 387k increase in utilities and supplies
44
z) 30% or P 210k increase in rental expense – due to the additional office space occupied aa) 81% or P 4.3M decrease in Representation and Entertainment – the frequency and cost of
providing comfort/convenience (i.e.meals) to the prospective clients and other stakeholders of the company’s future projects as well as various representations made to government in relation to the Group’s projects is higher in 2012 as compared in 2013
bb) 100% or P 143k written-off advances in 2012 cc) 237% or P 22.5 M increase in professional fees/retainers fee – the increase is related to the
arrangers fee to attract potential investors to Palm group dd) 19% or P 1.7 M decrease in travel and transportation - due to various travels made in 2012
related to the development of Butuan West Highlands being the new real estate project in 2012 ee) 14% or P 1.7 M increase in security services - due to the increase in number of security
personnel assigned to real estate projects ff) 30% or P 283k increase in board meeting expenses – due to the increase in the per diem of
the directors gg) 21% or P 74k decrease in training and seminars – there were minimal training and seminars
conducted and attended this year compared to last year. hh) 42% or P 167k increase in subscription and dues ii) 63% or P382k increase in insurance expense jj) 284% or P 805k increase in litigation expenses - due to the incurrence of litigation expenses
related to Bernardino and Yulo case kk) 49% or P 1.4M decrease in Directors’ fees – no bonus distribution covering this year ll) 12% or P 1M increase in miscellaneous expenses - due to various expenses for corporate
activities and CSR
27% or P 2.5M increase in Equity in net losses of associate - pertains to the 30% share of net loss of PCPC and 30% in PCLHC 25% or P 13.8 M increase in finance costs - due to increase in availment of loans 100% or P 1M decrease in discount on loan receivable – as a result of discounting the non-interest bearing loans granted to a third party in 2012 Key Performance Indicators
Financial Ratios Audited Audited (restated)Consolidated Figures 12/31/2013 12/31/2012
Current ratio1 1.92:1 3.41:1Current Debt to Equity ratio2 0.28:1 0.25:1Total Debt to Equity ratio3 0.86:1 0.83:1Return on Assets4 0.08% 3.03%Return on Equity5 0.14% 2.52% 1Current assets/Current liabilities decreased from 3.41:1 in 2012 to 1.92:1 in 2013 due to the proceeds of reissuance of the
treasury shares and new subscription in 2012 2Current liabilities/Stockholders’ equity 3Total liabilities/Stockholders’ equity 4Net income/Total assets decreased from 3.03% in 2012 to 0.08% in 2013 due to the discount on loans payable in 2012 5Net income/Stockholders’ equity decreased from 3.03% in 2012 to 0.08% in 2013 due to the discount on loans payable in 2012 Financial soundness indicators are also shown on Exhibit I, page 83
45
Material Event/s and Uncertainties The Company has no other events to report on the following: a) Any known trends, demands, commitments, events or uncertainties that will have a material
impact on its liquidity. b) Any material commitments for capital expenditures. c) Any known trends, events or uncertainties that have had or that are reasonably expected to have
a material favorable or unfavorable impact on net sales/revenues/income from continuing operations.
d) Any significant elements of income or loss that did not arise from the issuer’s continuing operations.
e) Any seasonal aspects that had a material effect on the financial condition or results of operations.
f) Events that will trigger direct or contingent financial obligation that is material to the company, including any default or acceleration of an obligation
g) All material off-balance sheet transactions, arrangement, obligations (including contingent obligations), and other relationships of the company with unconsolidated entities or other persons created during the reporting period.
Prospects of Real Property Development:
The Philippine economy has remained resilient as other countries faced their own economic difficulty. The continued remittances of Filipino overseas workers helped fuel household consumption, which contributes to economic growth. It primarily helped buffer the economy and government finances from the effects of the global financial crisis. Business Process Outsourcing (BPO) and off-shoring also remained to be a major economic and property industry driver of the country. Demand for offices will be sustained by BPOs. The housing market, especially the affordable ones, will be driven by both OFW money and attractive credit terms extended by banks to qualified borrowers. A big percentage of overseas Filipinos are not affected by the crisis since many of them are employed in the medical services. Thousands of Filipinos continue to leave for abroad every month and are still the preferred choice for seamen and in the services industry. Overseas inflow would likely to continue to grow.
The Philippines’ real estate sector is optimistic since developers continued to start new projects to provide the market’s increasing demand. Its resiliency has continued to defy the forecast of a possible recession due to tight lending rules, substantial up-front cash payment requirement, the banking sectors’ strict loan to collateral ratio for housing loans and non-usage of the same mortgage system as the US which is rising steadily in home foreclosures. The implementation of a contract-to-sell system instead of a mortgage origination to document sales and lot packages has helped the country from succumbing to the housing crisis that redounds to the US financial sector. Other economic fundamentals also proved to be better than expected.
There is also a growing demand for residential property by foreign nationals (retirees). They will continue to be attracted to own a property in the Philippines because of its relatively low cost of living, competitive labor costs, lower medical expenses and nice tropical climate.
It is also notable that a lot of overseas Filipinos are looking for ways to maximize their return on investments as they approach retirement. Investors are looking for more solid investments with potential for monthly income. There are developments that can be used for vacations and rent it out through when they are not using the unit thereby gaining rental income.
The availability of low interest rate financing has boosted the construction boom that the country particularly, the Metropolitan Manila has been experiencing. The large amount of foreign remittances from Filipinos working abroad and the need for more office space to accommodate the country’s growing outsourcing industry also added the increase in appetite for investing in real estate sector.
It was reported that with the population growing at an annual rate of 2.32 percent, demand for shelter is also expected to increase. Given this, government policy makers are bent on providing more shelter assistance and pursuing strategies to encourage more private sector participation in housing production. In fact, “jumpstarting” the housing construction sector is likewise seen by government as a major economic growth contributor that can help alleviation efforts. Jumpstarting the housing construction sector can spur economic growth and alleviate poverty by taking advantage of
46
its multiplier effect. Housing has a high multiplier effect of 16.6 times, meaning that every 10 billion worth of housing units, it can contribute a total of Php 166 billion of economic activity for the country.(MTDP 2004-2010).
Plan of Action
While pursuing new projects, the Company will continue to roll-out new phases in its existing project called Xavier Estates and venture into socialized housing. It will expand its product offerings to build up its portfolio across a wider market. This will be complemented by intensified sales and marketing efforts to broaden market reach and tap the growing market of overseas-based Filipinos and government employees. Short Term Prospects Real Property Development: Being at the forefront in real estate development in Mindanao, the management and the Board of ABCI will continue to pursue its real estate projects in key cities in the Land of Promise. Overtime, ABCI was able to build a reputation and credibility to deliver first class development. It has created a niche in Mindanao and has carved a name to beckon with when it comes to property development. It shall take advantage of the continuous demand in Xavier Estates lots since it is still the preferred place due to its aura. The strongest factor especially among the OFWs and foreigners married to a Filipino are its tree-lined streets now fully-grown, its in-house water system, strict security system, and the largest clubhouse in Mindanao as well as having a luxurious view of nature on top of a plateau. Teakwood sales are beginning to pick-up and are also the preferred place compared to its competitors due to its magnificent location which is overlooking the Macajalar Bay. Coral Resort Estates is gaining popularity among local residents due to the tranquility the water front offers. ABCI will continue to focus on increasing revenue generation, reduction of costs and expenses, and increasing efficiency in its operations to continuously provide the growth of shareholder value. Thru its subsidiaries’ diversified ventures, it will keep on pursuing businesses which will eventually replace the adhesive and chemical business ABCI was known for. Cagayan de Oro City projects: Teakwood Hills: Horizontal development has three (3) phases. Phase 1 & 2 are expected to produce a total of 522 saleable lots after an alteration has been made from the previous 795 and 59 saleable lots for the development area of 40 and 5.2 hectares, respectively. The company opted to put on hold the development of 13.34 hectares for Phase III momentarily. On the other hand, Xavierville Homes is already 100% complete as to horizontal works. There were 131 saleable lots that were subdivided from the 4.8 hectares of development. Xavier Estates Phase 5A – Ventura Residences is 84% complete. Cluster A is subdivided to produce 128 saleable house and lot packages of which 84 units were already completed. Cluster B is expected to provide 50 saleable lots while 91 saleable lots for Cluster C. Ventura Lane on the other hand is already 100% developed, it offers 30 lots with cuts starting at 110 sq.m. Socialized Housing project: St. Therese Subdivision located in mid- Balulang, Cagayan de Oro is a 1.6720-hectare socialized housing that will provide 155 lots of which 91 lots have row houses with an lot area of 50 sq.m. while 38 units are duplexes and 17 are single-attached with lot area of either 68 sq.m. or 75 sq.m. There are nine (9) units that are up for new design.
47
Mountain View Homes is located in mid-Balulang, Cagayan de Oro City, it’s the latest project offering of ABCI. This has a development area of 2.3179 hectares with 216 saleable house and lots. Project development is 85% accomplished with amenities. Its License to Sell was released on Feb. 2015. Misamis Oriental project: Another residential development is located in Initao, Misamis Oriental with a total land area of 10 hectares. This development, Coral Resort Estates is currently working on its Phase 1 with two clusters. Cluster A has 42 saleable lots with an area of 2.5 hectares. Cluster B has developmental area of 2.9 hectares. As of the end of the year, 97% has already been accomplished for Cluster A while Cluster B is already 88% done. Butuan project: West Highlands Phase 1 is a residential estate located in Brgy. Bonbon, Butuan City with a total development area of 25.9 hectares. Phase 1 of the project is expected to generate 293 saleable lots. The project development is 95% accomplished with spillway, concrete barrier, riprap and spine road which already 100% done. Medium to Long-Term Prospects. Real Property Development: A commercial building will be erected in the commercial strip of Xavier Estates to have a recurring rental income. There is a rise in the demand of housing requirements for middle income, starter families and single market. To address these markets, ABCI intends to develop socialized and economic housing in Cagayan de Oro City, Butuan City and in Tanay, Rizal. PROSPECTS OF PALM OIL:
The palm oil industry is a promising enterprise as the palm oil continuously being considered as the most important tropical vegetable oil in the global oils and fats industry, in terms of production and trade. It accounts for about 31%, ahead of soybean oil with 28% and rapeseed oil with 19%. Aside from its many food and non-food applications, it has been promoted as a feedstock for the production of biofuels in response to the depletion of world’s reserve on fossil fuels and skyrocketing price of petroleum oil in the world market. The significant growth of palm oil production, consumption and market share is also to a large extent due to its cost competitiveness and its inherent crop productivity yielding from 3.80 to 5 tons per hectare with minimum land utilization which is 9.3, 7.6 and 5.8 times higher than soybean oil, rapeseed oil and sunflower oil, respectively (Oil World 2008). Thus, it has been viewed as the cheapest, versatile and most productive oil among the three vegetable oils.
The Hamburg-based ISTA Mielke GmbH which publishes Oil World expects that the current world palm oil consumption from 38 million tonnes will surge to 63 million tonnes in 2015 and increase further to 77 million tonnes in 2020. This would translate into an annual average growth rate of 3.1 million tonnes. Oil World in its latest forecast expects world palm oil production to increase by 3.2 million tonnes to 3.4 million tonnes last year. However, the supply situation will not likely to recover in 2013 onwards should the existing production and depleting stocks not be replenished to meet the surging demand from China, India and other developing economies. (http://biz.thestar.com.my/news/story.asp?file=/2011/2/10/business/8031578&sec=business)
Over the past 3 decades, there has been a substantial growth in the global consumption of vegetable oil. Between 1980 and 2008 consumption increased more than threefold from 40 million
48
tones to over 130 million tones. In addition, there has been a significant shift in the relative market share of different vegetable oils. In 1980, the market share for palm oil was 11 percent; the main vegetable oil on world market was soybean, accounting approximately a third of total consumption. The market share of soybean has since fallen with palm oil becoming the major consumed vegetable oil. In 30 years, palm oil consumption has increased tenfold from 4.5 to 45 million tonnes (including growth of 100 percent in the last decade) and now comprises 34% of the world market. In 2009, despite consumption of soybean oil increasing by 22.5 million tonnes, its market share had fallen to 27 percent. Rapeseed and sunflower oil’s market shares were 16 percent and 10 percent, respectively.
World Consumption of Vegetable Oils, 1980-2009
Type of Vegetable OilQuantity % Quantity % Quantity % Quantity %
Soybean Oil 13.4 33.7 16.1 26.5 25.6 27.7 35.9 27.0 Palm Oil 4.5 11.3 11.0 18.1 21.9 23.7 45.1 34.0 Rapeseed Oil 3.5 8.8 8.2 13.5 14.5 15.7 21.5 16.2 Sunflower Oil 5.0 12.6 7.9 12.9 9.7 10.5 13.0 9.8 Palm Kernel Oil 0.6 1.5 1.5 2.5 2.7 2.9 5.2 3.9 Other Vegetable Oils 12.8 32.1 16.1 26.5 18.1 19.6 12.0 9.0 Total Vegetable Oils 39.8 60.8 92.5 132.8
Note; Quantity in millions of tonnesSource: Oil World (2010), in Hai Teoh (2010)
1980 1990 2000 2009
World Bank issued its commodity forecasts in current US$, for energy, beverages, fats and oil,
grains, other food, timber, other raw materials, fertilizers, and metals and minerals. They forecasted that the world prices of fats and oil which palm oil is included are shown below:
Commodity forecasts (current US$ prices)
Fats and oil (nominal) 2000 2010 2011 2012 2013 2015 2020 Coconut oil, $/mt, current 450 1,124 900 880 870 850 780 Groundnut oil, $/mt, current 714 1,404 1,340 1,345 1,350 1,325 1,200 Palm oil, $/mt, current 310 901 830 825 820 800 715 Soybean meal, $/mt, current 189 378 340 320 315 308 304 Soybean oil, $/mt, current 338 1,005 900 880 865 850 800 Soybeans, $/mt, current 212 450 420 410 400 390 375
Data for 2010 are actual and data for 2011 - 2020 are forecastsSource: World Bank. Forecasts were prepared December 14, 2010 - Development Prospects Group, World Bank.
As the growing population would keep consuming more oil palm products processed to products of higher value-added, increase in oil palm production is to be expected. Domestic demand for palm oil is seen five (5%) percent annually from 1995 to 2015 according to the study by the University of Asia and the Pacific (http://ppdci.org/?p=20). Since oil palm thrives in tropical countries where agro-climactic conditions favor its growth, the Philippines has been suitable for its production with its neighboring countries, Indonesia and Malaysia as the leaders, accounted for 86% of global production. Over the past years, and with the significant shortfall in supply for domestic demand for palm oil in the Philippines, there has been an upsurge of investment in the establishment of oil palm plantations and interest in establishing more palm oil mills. Local production can only supply 25% of what is needed by local industries; the remaining 75% is imported. Key industry players, particularly officers of the Philippine Palm Oil Industry Development Council, are enthusiastic about the bright prospect of increasing palm oil production amidst the soaring prices of this commodity on the world market, not to mention the great demand from the domestic market and the prospect of eventually

49
exporting palm oil globally. The promotional taglines for the growth of palm oil industry include palm oil as the “sunrise industry” and the oil palm tree as the “tree of peace”.
2009 Philippine Crude Palm Oil Production
Product Shortfall(%)
Palm Oil 42.5Palm Kernel 10.0
54,333 94,4006,544 7,277
Average Annual Production (MT)
Average Annual Usage (MT)
Based on 2009 industry data of CPO production and consumption, the shortfall in domestic consumption has an estimated worth of importation of palm oil of around PhP 840.03M (USD 14.83 M). With an annual increase of consumption at a conservative level at 5% and with a plantation gestation period of four years before harvest, the present trend of expansion of oil palm plantation is highly unlikely to catch up with the growing domestic demand. (http://www.forestpeoples.org/sites/fpp/files/publication/2011/11/chapter-4-oil-palm-expansion-philippines.pdf) The Philippines has 7.4 million hectares of idle land (Yosuf and Yew, 2009). In 1994, the Palm Oil Research Institute of Malaysia identified at least 300,000 hectares in eight provinces in Mindanao suitable for oil palm plantation. The Philippine Coconut Authority (PCA) and the Southern Philippines Development Authority (SPDA) have also identified some 447,000 hectares of potential areas in Visayas and Mindanao reqions suitable for oil palm planting. Based on the report presented during the mini-workshop on Oil Palm Planning conducted in June 2008, the Philippines has developed at least a total of more than 46,000 hectares of land for oil palm with only some 20,000 hectares of oil palm trees in year 2000. Caraga region registers as the largest area of more than 17,000 hectares or 37% of total oil palm area in the country. Major players include Filipinas Palm Oil Plantations, Inc., Agusan Plantations Inc. and Kenram Philippines Inc.
From 2003 to 2009, the area planted to oil palm increased from about 25,227 hectares to 46,608 hectares, an increase of about 85% within a 7-year period or about 14% per year. Growing at an average of 82,500 metric tons in 2000, it is projected to reach 171,700 metric tons in 2015. Along with this data, the palm oil industry players need to expand the current plantations and out grower farms to grow more by 38,934 hectares by 2015.
In 2008, although the crude palm oil production exceeded 50,000 metric tons, it was not enough to meet the local demand. Hence, the country imported about 300,000 metric tons. This volume of crude palm oil import translates to an immediate requirement of 80,000 hectares of mature oil palm plantation to cope with the domestic demand. (http://ppdci.org/wpcontent/uploads/2010/04/6thnpocreport.pdf)
The demand for palm oil is expected to increase by 25.7 million tons in 2020 based on the
projected 52.3 million tons in 2012 in consideration with the projected world population growth parallel to the increasing consumption of vegetable oil.
Source: PPDCI; Thomas M. (POTS KL, 2012)

50
Based on the statistics, world population is projected to grow from 7 billion in 2011 to 9 billion by 2043, an increase of 29%.(PPDCI; Basiron,2012). In 2012, the world market experienced a price reduction of the palm oil during the last quarter which reflected the same scenario in the Philippines. The palm oil industry was affected by the reduction of export tariff of Indonesia where local processors opted to buy from Indonesia rather from local producers who cannot offer a lower price due to VAT, technical smuggling and higher cost of transport to Manila, etc. due to poor road network.( http://ppdci.org/wp-content/uploads/2013/02/Coping-with-the-Price-Fluctuation-of-OP-and-Climate-Change.pdf)
Plan of Action
Given the current domestic demand and supply conditions and projected growth in incoming years, there will be disparity between production and consumption which needs to be addressed. To respond to the lack of adequate local production, the management has targeted to develop 2,000 hectares of oil palm plantation in Kalabugao, Impasug-ong, Bukidnon in 3-5 years time as targeted in 2010. As of the end of 2015, about 3,699.085 (gross area) hectares were already acquired for development, of which almost 1,547.96 hectares were planted while about 1,697.53 hectares total area for planting (are prepared to be available for planting for Nakeen Corp). ABERDI is targeting to plant additional 100 hectares. The company is anticipating the signing of agreements with local communities in Misamis Oriental for its expansion program aggregating to 3,000 hectares. Due to the synergy and tax efficiency, ABERDI and Nakeen Corp. have applied for an Amended Articles and Plan of Merger as approved by its Board of Directors and shareholders.
Our refinery with fractionation machine is now operational in full capacity 50 MT/day.
Likewise, we are producing Palm Olein, Palm Stearin and Palm Fatty Acid Distillate in bulk sales. Expansion will be determined and decided this year as we move forward in the coming years. This year, the company’s thrust is to engage in branding and packaging f premium cooking oil and shortening. Our strategic Route to Market design is divided into two (2) service packages.
First service package is direct serve outlets which will cover industrial or food processing
companies, supermarkets, hypermarts wholesalers / groceries, catering services, hotels and restaurants around Mindanao region.
Second service package will be indirect serve outlets like sari-sari stores, traditional food
outlets, mini marts, direct household consumptions or specials events markets will be served by our potential trade execution partners.
This way, our customer and consumers will enjoy our quality service to best quality
products. PROSPECTS OF POWER GENERATION: The energy requirements of the Philippines, especially Visayas and Mindanao, have been a significant undertaking of the government as it looks to attract more investments and pursue industrialization. In the energy sector, the objectives are to raise energy capacity, achieve a reliable and adequate supply of electric power, and expand rural electrification in the country. To sustain the current growth momentum and support the anticipated expansions in investment, power supply must be kept sufficient; policies and guidelines must remain harmonious across concerned government and private agencies regarding the exploration, development, utilization and conservation of natural resources for energy projects.
51
As was the case from the year prior, 2016 remains within the critical period for the Visayas Grid where additional capacity will be needed to avert shortages. This can be attributed to the strong economic growth in the region which can be seen in the fast demand expansion recorded in distribution utilities in Panay, Cebu, and Bohol. Based on projected figures by the Department of Energy, the five-year average annual growth rate (AAGR) from 2010-2014 stands at 5.79%, higher than the 20-year (1995-2014) AAGR of 5.68% and the 10-year (2005-2014) AAGR of 5.61%. The continued growth within the region will entail higher demands for power generation. Apart from increased economic activity, relief from generation deficiency in previous years is also another factor that pushed the demand to record levels. Power demand in the Visayas is expected to be at 5.05% Average Annual Compounded Growth Rate (AACGR) from 2014 until 2023. Meanwhile, the Mindanao grid posted an AACGR of 3.28% for 2001-2013. After recording high annual growth rates from 2000 to 2004 (an average of 5.76%), demand growth has been sluggish from 2005 to 2010 due to the overall reduced power requirement from large non-utility customers. In the recent years, demand dropped in 2008, 2010 and 2012. 2008 was characterized by the large decrease in the demand of non-utility customers, possibly a direct effect of the global financial crisis, which adversely affected exporting industries. On the other hand, due to the El Niño that hampered hydropower generation, the grid has been experiencing under-generation that has impeded demand growth in 2010 and 2012. The existing capacity in the region is composed of more than 50% hydroelectric power plant, along with bulk base load power from coal-fired power plants. Based on DOE projections, a total of 1.600MW additional capacity is needed in the planning period to meet the electricity demand and the required reserve margin of the grid. Even as the reported AAGR of 2014 (2.89%) was lower than 2013 (8.08%), the positive value can attest to the continued growth and positive forecasts within the Mindanao grid.
Plan of Action Coal-Fired Power Project: To fill the anticipated tight power supply situation in Panay and the Visayas grid by 2016 as economic activity continues to expand in the area, a 2 x 135MW coal-fired power plant project in Concepcion, Iloilo was proposed and project implementation is at 90% as of December 2015. The power plant will be synchronized with the Visayas grid in coordination with NGCP by last week of April 2016, and will be delivering power supply to Panay, Negros, and the rest of Visayas. Target date for commissioning of the first unit is June 2016. Once reliability tests have been completed, the first unit will be up for full commercial operations. Ten (10) distribution utilities and electric cooperatives have signed up with PCPC for their baseload power capacity requirements in order to deliver reliable and stable power generation supply to industrial, commercial, and residential consumers. Preparations for the second unit are also underway, with construction estimated to take two to three years after commissioning of the first unit. Bunker-Fired Power Project: The island of Mindanao has continuously experienced power shortage due to the inadequate supply of power generation capacities. This bunker-fired power project addresses the lack of base load power in the Mindanao grid for the next 2 to 3 years and in the future to allow the cooperatives to meet the needs for peaking power.
52
Peakpower Energy, Inc. was set up in 2013 to implement projects designed to generate peaking energy across various A+/Green rated electric cooperatives in Mindanao. These are Build-Operate-Maintain and Transfer agreements for brand new bunker-fired engines, which will last for 15 years. After signing a power purchase and transfer agreement for 20-megawatt of peaking power supply with South Cotabato II Electric Cooperative and 5-megawatt with Agusan del Sur Electric Cooperative in 2013, the respective plants Peakpower Soccsargen, Inc. (PSI) and Peakpower San Francisco, Inc. (PSFI) are commercially operational, supplying the very much needed power capacities in their franchise areas. Preparations are underway for the expansion of the two plants, with contracting and equipment procurement slated for first quarter of 2016. The necessary planning stages and studies are also being undertaken for a third plant, 2 x 5.2MW Peakpower Bukidnon, Inc. with Bukidnon Second Electric Cooperative (BUSECO). Hydro Power Project: The Carac-an Hydropower Project will explore the hydropower potential of the Carac-an River in the northern part of Surigao del Sur. After the signing of the hydropower service contract with the Department of Energy (DOE), the company has proceeded with the processing of the necessary permits in coordination with local government officials for their support of the project. The feasibility study has been completed as part of the pre-development activities, in compliance to the service contract requirements. The report projected an optimal capacity of 16.3 MW with estimated annual energy generation of 78.9 GWh. The output of the power station is proposed to be connected to the nearest substation of the Surigao del Sur Electric Cooperative II (SURSECO II) in Madrid substation. It currently has a peak demand of about 13MW; excess power can be sold to other customers around the Mindanao grid. For 2016, further studies and investigations will be conducted in compliance to all government requirements, such as environmental impacts study and presentations to local government units. Likewise, the company will continue to look for other projects similar to this, in the light of the much-needed additional power capacities for the green-rated cooperatives in Mindanao. Significant Change in the number of employees The Brown Group of Companies foresees significant change in the number of employees at around fifteen (15) new employees to cover new and/or additional positions, replacement for resigned/(ing) and retired/(ing) employees. Hiring of employees will continue in the regular course of the business as the need arises.
53
External Audit Fees and Services A) Aggregate fees billed for the calendar years 2015 and 2014 for the audit of financial statements:
2015 2014
1) Regular Annual Audit of Financial Statements P 470,400 P 414,400 (inclusive of VAT) 2) The nature of services comprising the fees includes the following:
a) Audit in accordance with generally accepted auditing standards. b) Examination of the company’s internal control structure for the purpose of
establishing a basis for determining the nature, timing and extent of auditing procedures necessary for expressing an opinion.
c) Procedures designed to provide reasonable assurance of detecting errors and irregularities that are material to the financial statements.
d) Audit and Business Advisory The audit fee of the parent’s seven (7) subsidiaries in 2015 and nine (9) subsidiaries in 2014 were P313,600 and P337,120, respectively. B) Aggregate fees billed for the calendar years 2015 and 2014 for Tax Compliance Audit are as follows:
2015 2014 1) Tax Compliance Audit (Inclusive of VAT) P - P -
2) The nature of services comprising the fees includes the following: a) In-depth review of company’s records to ascertain compliance with the rules and
regulations of the Bureau of Internal Revenue and the local government; b) Review completeness of documents for BIR and local government purposes; c) Evaluation of income and business tax positions based on past and current
operations to determine tax savings and/or exposures; d) Recommend corrective measures to ensure compliance with tax laws; and e) Recommend measures for tax- savings purposes.
C) There are no services other than the services reported under items (a) and (b). Reyes, Tacandong & Company is the external tax consulting firm who conducted the 2011 tax compliance audit of the parent and some of its subsidiaries. Currently, the firm is retained as tax consultant. The ABCI Audit Committee recommends to the Board and stockholders the appointment of the external auditor and the fixing of audit fees. The Board and stockholders approve the Audit Committee’s recommendation. During end-of-audit, an initial conference by the external auditors with the management’s authorized representatives discuss the initial findings. After the clarification conference, the external auditors together with the partner in-charge will discuss before the rest of the Audit Committee. If there are any revisions, another round of discussion will be set before the audited reports are finalized, accepted and approved.
54
CHANGES IN AND DISAGREEMENT WITH ACCOUNTANTS ON ACCOUNTING AND FINANCIAL DISCLOSURES The accounting firm of Constantino Guadalquiver & Co., (CG & Co.) was duly appointed as the Independent Public Accountants on 28 August 2009. Representatives of CG & Co. shall be present during annual meetings and will be given the opportunity to make a statement if they desire to do so. They are also expected to respond to appropriate questions if needed. There was no instance that CG & Co. had any disagreement relating to accounting principles or practices, financial statement disclosures or auditing scope or procedure. Per SEC Memo Circular of 2005 – Amendments to SRC Rules 68 and 68.1, “… the external auditors shall be rotated every after five (5) years of engagement. In case of a firm, the signing partner shall be rotated every after said period. The reckoning date for such rotation shall commence in year 2002 …”. For five consecutive years (2009 to 2013), Rogelio M. Guadalquiver is the Partner-In-Charge of the independent examination. For the audit year 2014 and 2015, Annalyn B. Artuz is the Partner-In-Charge. Discussion of Compliance with leading practices on Corporate Governance: a. The Company has participated in the Corporate Governance Survey per SEC Memorandum
Circular No. 8, series of 2008 and used the CG Scorecard as its performance evaluation checklist for year 2009 to 2012. With the issuance of SEC Memorandum Circular No. 5 Series of 2013, as amended, the Company submitted its Annual Corporate Governance Report (SEC Form ACGR) for 2012 on July 1, 2013. The Consolidated Changes in the Annual Corporate Governance Report for 2013 (with updates as of May 9, 2014) was submitted on May 13, 2014. The Consolidated ACGR for 2014 was submitted on January 9, 2015. The Consolidated ACGR for 2015 was submitted on January 8, 2016.
b. The Company’s Corporate Governance Compliance Officer submitted the Certification on
Compliance with its Revised Manual on Corporate Governance for Year 2012 to the SEC on January 29, 2013 and to the PSE on February 04, 2013 confirming that ABCI has conformed to and complied with the provisions and leading practices and principles on good corporate governance as set forth in the Manual and SEC Code of Corporate Governance, as amended. The Company likewise submitted its 2015 PSE Corporate Governance Guidelines Disclosure Template to the exchange and duly posted on the PSE website on March 29, 2016 reflecting the company’s level of adoption of the PSE recommended corporate governance guidelines as embodied under PSE Memorandum No. 2010-0574 dated November 26, 2010.
c. The Company’s Corporate Secretary submitted to the SEC on January 6, 2016 the Certification
on attendance of members of Board of Directors for the year 2015. The directors’ attendance to the nine (9) Board meetings held for the year is as follows:
Jan March June June June July Aug Oct Dec9 19 15 19 19* 29 25 27 8
Walter W. BrownAnnabelle P. BrownRobertino E. PizarroElpidio M. Paras - -Thomas G. AquinoAntonio S. Soriano - -Roel Z. CastroRosa Anna Trinidad Duavit-SantiagoGerardo Domenico Antonio V. Lanuza - - - -
Date of Meeting
55
d. Part of the measures being adopted by ABCI in order to comply with the leading practices is the participation and attendance by members of the Board and top level management in corporate governance initiated by accredited institutions. For 2015, fifteen (15) directors and officers attended a seminar on Corporate Governance in compliance with SEC Memorandum Circular No. 20 Series of 2013.
e. Annual self-assessment of the Board of Directors to determine compliance not only with its Manual of Corporate Governance but also all other regulations and rules prescribing good corporate governance is regularly being done.
f. Adoption of best practices and creation of different committees such as Audit, Nomination,
Compensation and Governance. The Board of Directors organized the committee - Committee on Corporate Culture and Values Formation to promote, foster, and institutionalize the corporate vision, mission, core values, good corporate governance and ethical conduct among the members of the Board, officers and employees of the company. The formation of the Risk Committee to effectively manage financial and business risks in accordance with company’s risk profile and risk culture will strengthen the company’s position in terms of mitigated exposures. The different board and management committees also perform oversight functions over compliance with the Manual and other corporate policies of ABCI.
g. The Board of Directors through the Governance Committee has approved in December 2014 the Company’s whistle blowing policy which provided the guidelines on handling employee disclosure or complaints of violation of the corporate governance rules which protects whistleblower from retaliation and ensures confidentiality and fairness in the handling of a disclosure or complaint. Likewise, the Insider Trading Policy has been approved to apprise and ensure compliance by all members of the Board of Directors, officers and employees of their obligations under the applicable securities laws to refrain from trading (buying and selling) the Issuer's securities based on inside information and tipping or passing information to someone who may use such information to trade Issuer's securities during prescribed blackout periods. The policy also includes the requirement to report their direct and indirect beneficial ownership of the Issuer's shares as well as any changes in such beneficial ownership within the prescribed period. The policy was adopted in keeping with the trend on sound corporate governance practices that support the integrity of capital market based on the principle of "equal opportunity based on equal access of information".
h. The Compliance Officer of ABCI coordinates with the Board and management committees in monitoring compliance with the Manual, determine the violations, if any, and recommend penalties for such violations. He/She also helps identify, monitor and control compliance risks.
There are no known material deviations from the Manual on Corporate Governance by ABCI.
56
Corporate Social Responsibility
Initiative Beneficiary 1.) Mind Diet (Communal Vegetable
Garden) ABCI implemented the mind diet program to Opol and Kalabugao Plantation workers by making a Communal Vegetable Garden planted with Eggplant, Beans, Atsal, Carrots, Tomato and Pechay. The purpose of this is to provide sustainable supply of organic vegetables for ABERDI Plantation workers and their families.
2.) Sportsfest (Opol, Kalabugao, ABERDI Mill)
ABERDI conducted its Sportsfest for Opol Plantation workers on July 25, 2015 at Xavier Sports and Country Club. Kalabugao Plantation workers on November 13-14, 2015 at Kalabugao Basketball Court, Kalabugao, Impasugong, Bukidnon. ABERDI Mill on December 12, 2015 at Impasugong Gymnasium, Impasugong, Bukidnon. The said sportsfest aims to develop a pool of physically fit plantation based workers and to engage workers in company wellness activities. Also to make them feel part of the Brown Group of Companies Family.
3.) Christmas Gift For former Typhoon Sendong Victims -December 2015
ABCI extended assistance of P 800,000 pesos worth of packed ham and queso de bola to more than 2,000 victims of Typhoon Sendong in Barangays Puntod, Macasandig and Indahag, Cagayan de Oro City on December 2015.
4.) Medical Mission AB Bulk Water Co., Inc. (ABWCI) , a subsidiary of ABCI, participated last December 30, 2015, in a one day Medical Dental Mission conducted by LGU-Opol in cooperation with the Rotary Club of Opol. A total of 1,200 indigent families, most of whom were fire victims have availed of the free clinic held at Taboc, Opol, Misamis Oriental.
5.) ABCI Scholarship Program – on going since 2011
Six (6) college students belonging to the Higaonon tribe from Kalabugao, Impasugong, Bukidnon are recipients of the ABCI Scholarship program. Of the six ABCI Scholars, four of them already graduated namely: 1.Brian Sanugan Camahay, 2. Mailyn Sanugan Lisboa, 3. Melanie Sanugan Sujetado, 4. Emegene Quinhayan Sanugan. One of the four who graduated (Brian
57
Sanugan Camahay) is now employed with ABERDI as ComRel Coordinator. The remaining two Scholars ( Shiela Mae Sanugan Camahay and Liezl Sanugan Salingay) are currently enrolled at Bukidnon State University to graduate this March 2016. Another new batch of Scholars this year, four freshmen students as replacement of the four graduates are currently enrolled at Misamis Oriental State College of Agriculture and Technology taking up Bachelor of Science in Agriculture.
6.) LET passers
Two among the four graduates of ABCI scholars namely: Mailyn Sanugan Lisboa and Melanie Sanugan Sujetado graduated with the degree of Bachelor of Science in Elementary Education at Bukidnon State University last March 2015. Fortunately, they had passed the Licensure Examination for Teachers taken last September 28, 2015.
7.) Breast Cancer Awareness Campaign Seminar
On June 23-24, 2015, A Breast Cancer Awareness Campaign Seminar (lecture and forum) with risk factor assessment, one-on-one consultation, and breast cancer screening was held at Xavier Estates, Cagayan de Oro City. This is to increase awareness and help resolve issues regarding breast cancer.
One Hundred Five employees from Brown Group of Companies, Rosevale School, XEHAI and agency workers in SPI and Interserve joined the 2 day seminar campaign and underwent the Physical Breast Cancer Examination with the assistance of the team of nurses and doctors of G2L. Gift2Life Inc. (G2L), is a community- and volunteer-based nonprofit, non-stock, healthcare catalytic innovator in knowledge and access to cause-related and chronic disease service processes.

58
8.) Blood-Letting Activity A Blood-Letting Activity was held at Xavier Estates & Salawaga, Opol, Misamis Oriental on Feb. 13 & 20, Oct. 20 & 23, 2015 in partnership with Red Cross, HR organized/facilitated Bloodletting activities at Xavier Estate, Cagayan de Oro City with 48 successful blood donors and 50 successful blood donors at Salawaga, Opol.
Participated by its employees, and friends and agency workers of the company. This blood-letting activity is an annual humanitarian activity of A Brown Group of Companies
59
BUSINESS AND GENERAL INFORMATION Item 1. BUSINESS On 01 October 1992, the Securities and Exchange Commission (SEC) approved the amended Articles of the Incorporation and By-laws of Bendana, Brown, Pizarro & Associates, Inc. (incorporated on December 21, 1966) which changed the parent Company’s name to Epic Holdings Corporation and effected a 5:1 stock split by reducing the par value of shares from P5 to P1 while increasing the total number of authorized shares from 20,000,000 to 100,000,000. On 25 June 1993, the SEC approved the plan of merger of Brown Chemical Corporation and Brown Chemical Sales Corporation (absorbed corporations) into Epic Holdings Corporation as the surviving corporation. Subsequently, Epic Holdings Corp. changed its name to A Brown Company, Inc. (its current name) as approved by SEC on 01 July 1993. ABCI was thereafter listed with the Philippine Stock Exchange on February 8, 1994 and became the holding company of the Brown Group of Companies. On 24 December 1999, the SEC approved the plan of merger of A Brown Company, Inc. (“ABCI”) (surviving company) and five of its wholly-owned subsidiaries, namely: A Brown Chemical Corporation, Geoex Farms, Inc., East Pacific Investors Corporation, Terra Asia Pacific Development Manager, Inc and Victorsons Trans Cargo System, Inc. (absorbed corporations). On 27 June 2002, the Securities and Exchange Commission approved the plan of merger of A Brown Company, Inc. (surviving corporation) and five (5) of its wholly owned subsidiaries (absorbed corporations) namely: Another Brown Co., Inc. (formerly W. Brown Co., Inc.), Geoex Drilling Corp., Northmin Mining and Development Corp., Manresa Golf and Country Club and Norphil Properties, Inc. Investment in Power Companies Mid 2006 marked the entry of ABCI in the energy business through its investment in Monte Oro Resources and Energy, Inc. (MORE). ABCI’s 11.70% equity interest in MORE was reduced to 7.59% after the non-subscription to the increase in authorized capital stock (ACS). In October 2014, the Parent Company sold all its 388,694,698 shares in MORE to Apex Mining Company, Inc. (APEX). In 2010, the Parent Company subscribed 2,850,000 shares and 3,000,000 shares of Palm Thermal Consolidated Holdings, Corp. (PTCHC) and Panay Consolidated Land Holdings, Corp. (PCLHC), respectively, at par value. The investment represented 95% and 100% shareholdings of PTCHC and PCLHC, respectively. PTCHC and PCLHC were newly organized subsidiaries of the Parent Company. In December 8, 2010, Palm Thermal Consolidated Holdings, Corp. (PTCHC) acquired 100% of the outstanding capital stock of DMCI Concepcion Power Corporation, the former corporate name of Palm Concepcion Power Corporation (PCPC). PCLHC acquired thirty (30) hectares of land from DMCI Power Corporation (“DPC”) with the intention of using it as the site for a coal-fired power plant project. PTCHC is the corporate entity that initiated the ABCI’s entry in the power generation business. PCPC is the corporate vehicle which will construct and operate a 1x135MW coal-fired power plant project in Concepcion, Iloilo. The Department of Energy (DOE) classified the project from “indicative” to “committed” in February 2012 after the progress report has been evaluated. In 2012, Palm Thermal entered into various agreements and deeds which decreased its shareholdings in Palm Concepcion Power Corporation (PCPC) from 100% to 30% and acquired 30% equity stake in Panay Consolidated Land Holdings Corporation (PCLHC) from the previous shares of the Parent Company as of December 31, 2012.
60
With the divestment of AC Energy Holdings, Inc. (ACEHI) in May 2013, PTCHC acquired ACEHI’s 40% interest in PCPC and PCLHC, increasing PTCHC interest in the coal-fired project to 70%. With the entry of new investor, Oriental Knight Limited (OKL) in PCPC and new subscription of the PTCHC and Jin Navitas Resources, Inc. (JNRI) in December 2013, the equity interest resulted to the following: PTCHC (39.54%); JNRI (30%) and OKL (30.46%). PTCHC’s interest in PCLHC remained at 70% as of December 31, 2013. During the third quarter of 2014, the SEC approved the Plan of Merger of PCPC and PCLHC with PCPC as the surviving entity as well as the increase in authorized capital stock (ACS) of PCPC. The merger and the increase in ACS resulted to the 30% equity interest of the Company in PCPC. On December 2014, PCPC applied for an increase in its authorized capital stock which was approved by SEC on January 6, 2015. Palm Thermal’s shareholdings have been reduced from 30% to 20% due to non-subscription on the increase of PCPC’s authorized capital stock. On January 12, 2011, ABCI and Hydro Link Projects Corp. (HLPC) entered into a deed of subscription with an aggregate share of 37,500 common shares which will be taken from the 150,000 increase of the authorized capital stock which represents 93.75% of the outstanding capital. HLPC amended its articles of incorporation to effect the deed of subscription and subsequently approved by the SEC on July 21, 2011. On December 2011, a deed of assignment was entered into by ABCI and HLPC’s stockholder, assigning the remaining 6.25% of HLPC shares to ABCI bringing the total subscription to 40,000 shares. On October 2012, ABCI subscribed to the remaining 120,000 unsubscribed share capital of HLPC. In February 2013, the company caused the incorporation of Peakpower Energy, Inc. (PEI), the holding company that will venture on projects designed to generate peaking energy in Mindanao using brand new bunker-fired engines. The company is working to develop, construct, and operate diesel power plants in Mindanao through PEI’s subsidiaries: Peakpower SOCCSARGEN, Inc. (PSI) and Peakpower San Francisco, Inc. (PSFI). On July 24, 2014, a new subsidiary, Peakpower Bukidnon Inc.(PBI), was incorporated for a 15-year Build-Operate-Maintain and Transfer agreement with the Bukidnon II Electric Cooperative Inc. (Buseco). PBI and Buseco signed a Power Purchase and Transfer Agreement for 10.4MW Diesel/Bunker-fired power plant to be constructed in Manolo Fortich, Bukidnon. On October 16, 2016, the company sold all its 100% interest in PBI to Peakpower Energy Inc. (PEI) to consolidate its investment in peaking project under one holding company. Investment in Mining Company In November 2011, ABCI acquired the 22.87% outstanding equity of PhiGold Limited. It is a holding company incorporated in the Cayman Islands on October 20, 2010 with its principal activity of investing in gold mining assets. It has invested 40% in the total voting rights in PhiGold Metallic Ore Inc. (PMOI), a gold mining company incorporated in the Philippines last January 7, 2008. PMOI is the contractor of its acquired mining property covered by Mineral Production Sharing Agreement 190-2009-XIII (MPSA 190) granted by the Philippine Government. As of December 31, 2014, the company’s equity interest was reduced to 18.7% with the entry of new investors. Last October 2014, the Parent company sold all its 388,694,698 shares in Monte Oro Resources and Energy Inc. (MORE) to Apex Mining Co., Inc. (Apex) and subsequently subscribed the same number of shares of Apex. The Parent Company has 8.89% shareholdings in Apex after the SEC approved the increase in its authorized capital stock on January 12, 2015. After the next round subscription, the company’s interest is reduced to 6.24%. Apex Mining Co., Inc. is principally engaged in the business of mining and production of gold, silver, copper,lead and other precious metals. Apex acquisition of MORE gives it access to another mineral processing plant, as well as
61
expansion opportunities in Jose Panganiban in Camarines Norte since Monte Oro fully owns Paracale Gold Ltd. that runs a mineral processing plant in Jose Panganiban, Camarines Norte, and 40 percent of Bunawan Mineral Resources Corporation which has two mining lease contracts covering 652.2891 hectares and pending applications for production sharing agreement and exploration permits. Moreover, Monte Oro has 30 percent participating interest in Service Contract no. 72 for natural gas in the Sampaguita gas field offshore northwest of Palawan in the West Philippine Sea, as well as a 52 percent stake in International Cleanvironment Systems Inc. that has a solid waste management contract with the Philippine government for Metro Manila. Monte Oro’s other assets include holdings in foreign firms engaged in mining and exploration work in Mongolia, Uganda and Sierra Leone in Africa and also in Myanmar. Apex Mining also has an expansion program that sought a production hike of 1,500 tons of ore per day in its Maco mine in Campostela Valley from 850 tons per day. The Maco mine produces bullions containing gold and silver which are smelted in a Metalor refinery in Switzerland. Apex also acquired Itogon-Suyoc Resources, Inc. which has mining claims and owns the mill and production facilities in Sangilo, Itogon, Benguet. Amendment to Articles of Incorporation and By-Laws The Board of Directors during their meeting held on November 28, 2011 and by the stockholders of the Parent Company holding at least two-thirds (2/3) of the outstanding capital stock, through written assent on December 27, 2011, amended the Articles of Incorporation, changing the principal office to Xavier Estates Uptown, Airport Road, Balulang, Cagayan de Oro City. The amendment was approved by SEC on December 28, 2011. On June 13, 2012, the SEC approved the amendment of the Company’s By-Laws to amend and define the functions of its Executive Chairman and President, remove the requirement that the Company’s vice presidents must be a member of the Board and to impose certain requirements on granting of bonuses to its BOD, officers and employees. In a Board of Directors meeting held on May 2, 2012 and the annual stockholders meeting on June 1, 2012, the Board of Directors and the shareholders representing 2/3 of the outstanding capital stock approved the following amendments in the Articles of Incorporation:
a. Amendment to paragraph 4: “That the term for which the Corporation is to exist is extended for another fifty (50) years from and after the date of the expiration of the original corporate term on 20 December 2016”.
b. Amendment to paragraph 6: “That the number of directors of this Corporation shall be Nine (9)……”
c. Amendment to paragraph 7: “That the amount of the capital stock of this Corporation is One Billion Six Hundred Twenty Million Pesos (P 1,620,000,000.00), Philippine Currency, and the said capital stock is divided into One Billion Six Hundred Twenty Million (1,620,000,000) shares with a par value of One Peso (P 1.00) each, provided that, stockholders shall have no pre-emptive right to subscribe to unissued shares unless otherwise approved by the Board of Directors”.
The SEC approved the said amendments on December 28, 2012. During the annual stockholders’ meeting on June 7, 2013, the shareholders approved the amendment of the Corporation’s Articles of Incorporation to increase the authorized capital stock from One Billion Six Hundred Twenty Million Pesos (P 1,620,000,000.00) and the declaration of 25% stock dividend, equivalent to 346,573,307 common shares which will be issued out of the increase in the Corporation’s authorized capital stock. The SEC approved the amendment on August 16, 2013.
62
In the Board of Directors meeting held on April 4, 2014 and the annual stockholders meeting on May 9, 2014, the Board of Directors and shareholders representing 2/3 of the outstanding capital stock approved the increase in authorized capital stock to Three Billion (P 3,000,000,000). The documents required on the application to the increase in authorized capital stock were not yet submitted to SEC as of March 18, 2016. The Company is not under bankruptcy, receivership or similar proceedings. There is no material reclassification, merger, consolidation, or purchase or sale of a significant amount of assets not in the ordinary course of business during the past three years. As a holding company, the following are the other businesses and investments (refer also to Note 2 - Principles of Consolidation of the attached Notes to Consolidated Financial Statement): A BROWN ENERGY AND RESOURCES DEVELOPMENT, INC. is 100% owned ABERDI (formerly A Brown Energy, Inc. amended on August 27, 2002) was registered with the Securities and Exchange Commission on 21 February 2001 under SEC Registration No. A200102288 and started commercial operations in April 2002. It may engage in the business of manufacturing and trading goods such as crude oil and petroleum products on wholesale/retail basis. Its principal place of business is at Malubog, Impasug-ong, Bukidnon. It has 75 employees as of December 31, 2015. Likewise, on August 2006, ABERDI entered into a Development Contract (DC) with Kapunungan Sa Mga Mag-Uuma sa Kaanibungan(KASAMAKA) now KAanibungan Farmers Association (KAFA) at the Barangay Kalabugao, Municipality of Impasugong, Bukidnon concerning the development of Oil Palm Commercial Plantation. The Peoples Organization (PO) has been granted Community Based Forest Management Agreement (CBFMA) No. 55093, by the Department of Environment and Natural Resources (DENR) on December 22, 2000, covering an area of 2,510.80 hectares of forest lands located at Sitio Kaanibungan, Barangay Kalabugao, Impasugong, Bukidnon. Under the said CBFMA No. 55093, the PO is mandated to develop, manage, and protect the allocated Community Forest Project Area. Article II, Sec. 2 (vii) of DENR Administrative Order (DAO) No. 96-29 dated October 10, 1966, otherwise known as the CBFM Implementing Rules and Regulations, the PO is allowed to “enter into agreements or contracts with private or government entities for the development of the whole or portion of the CBFM area; provided that the development is consistent with the approved Community Resource Management Framework (CRMF) Plan of the CBFM area. The PO is desirous in engaging the participation of ABERDI Inc. for the development of the said area into an Oil Palm commercial plantation. The project’s objective is to establish approximately 894 hectares into a commercial palm plantation. ABERDI (the Developer) may intercrop suitable agricultural crops in the plantation and raise livestock, the harvest and produce of which shall belong to the Developer. The responsibilities of KASAMAKA now KAFA in regard to the project are: 1) to provide the land area of 894 hectares within the CBFMA area 2) to provide manpower needs of the Developer in all developmental activities such as land preparation, planting, weeding, fertilization, harvesting, maintenance and others 3) To secure all the required documents pertinent to this agreement from concerned agencies. On the other hand, ABERDI will provide the technical and financial resources to develop the 894 hectares into Palm Oil Plantation. The rights and responsibilities of the Development Contract were transferred to Nakeen Corporation starting year 2006. The status of the other development contracts between ABERDI and other Peoples’ Organization are as follows:
• Kalabugao Ulayanon Farmer's Association (KUFA) – DENR survey of plantation perimeter map done. Tribal Resolution for FPIC-CP application on process with NCIP.

63
• Kapunungan sa mga Mag-uuma sa Barangay Tingalan (KMBT) – The CP-FPIC process has been expanded to cover two big tribal groups – the Dulanga Unified Tribal Council and the Unified Higaonon Tribal Council of Bagocboc. The CP-FPIC process has been done and the issuance of the certificate from NCIP is due within March 2016.
• Kapunungan sa mga Mag-uuma sa Barangay Tignapoloan (KMBT) – CBFM application submitted to DENR. Tribal resolution supporting CBFM application is done. CP-FPIC application on process with NCIP.
The Company has paid advance rental of P 6 million for 20 years up to 2026. On 26 March 2007, the Board of Directors passed and approved the transfer of its oil palm nursery and plantation operations to its subsidiary Nakeen Corporation (NC) effective 1 March 2007 to facilitate efficiency and profitability. Likewise, ABERDI is into palm oil milling operations. Its mini mill constructed in 2006 is located in Impasug-ong, Bukidnon. The refinery with fractionation machine is now operational in full capacity of 50 MT/day.
Fresh Fruit Bunches (FFB) processed for year 2015 was 27,550.54 MT, with 3.91% increase compared to 26,513.48 MT in 2014. A total of 6,061.12 MT of Crude Palm Oil (CPO) was recovered at an oil extraction rate (OER) of 22%. Total kernels produced for the year was 538.71 MT as compared to 590.14 MT in 2014. Sales were as follows: CPO was 3,708.06 MT, 569.06 MT of kernel, 406.23 MT of Palm Acid Oil, 276.83 MT of Palm Fatty Acid Distillate (PFAD), 751.16 MT of Palm Olein, 384.92 of Palm Stearin and 121.43 thousand kilos of Cassava.
On March 6, 2012, the BOD of ABERDI and NC approved and authorized the application of merger of the two subsidiaries. Before the SEC approved the Articles and Plan of Merger, the BOD and the stockholders of both companies approved and ratified the subscription of ABERDI to the 750,000 unsubscribed shares of Nakeen Corp. at P 1.00 per share with 50M as additional paid-in capital. The BOD and shareholders of the company also approved the filing with Securities and Exchange Commission (SEC) the amended Articles and Plan of Merger reflecting the new capital structure of the Nakeen Corp. and specifying the effectivity date of the revised merger to be the first day of the subsequent month following the SEC approval. On February 19, 2013, the BOD of Nakeen approved the filing of the amended Articles and Plan of Merger using the 2012 audited Financial Statements. The amended articles and plan was filed with the SEC on July 24, 2013 to amend certain provision on the articles and plan of merger as follows:
1. Issuance of the Company’s shares to Nakeen’s shareholders in exchange of the net assets of the latter as result of the merger.
2. Specify the effectivity date of the merger which will be the first day of the month succeeding the month of approval of the merger by the SEC.
On February 11, 2015, SEC denied the petition to amend plan of merger. The Company and Nakeen’s management filed a request for reconsideration to approve the petition. As of March 18, 2016, the request for reconsideration is still pending before the SEC. The Company entered into a lease agreement with Nakeen Corporation for the plantation area inclusive of the standing crops, properties and equipment effective January 1, 2013 and will expire on December 31, 2013 with an option to pre-terminate the lease agreement as agreed by both parties. Also provided in the lease agreement, from October 1, 2012 up to December 31, 2012, the Company shall be given access to enter Nakeen’s premises for the set-up, construction and preparation for its intended use of the plantation area. The lease was extended up to April 1, 2020.
64
The operating performance of the company for year 2015 decreased from previous year’s net income of P 5.9 million to 1.8 million. The sales of crude palm oil decreased by 36.09% from P154.29 million in 2014 to P 98.6 million this year. The quantity sold declined by 15.35% or 672.17 MT from a volume 4,380.23 MT in 2014 to 3,708.06 in 2015 and a decrease in the average selling Price per MT of 24.51% from P 35,224.18 per MT last year to P26,592 per MT this year. Sales volume variance is P23.7 million or is 15% unfavorable and sales price variance is P79 million or 21% unfavorable. Sales from kernels declined slightly to 1.27% or P 71 thousand and have a lower average price of P9,726.89 per MT as compared to the P 9,748 per MT from previous year. The quantity sold fell by 1.05% or 6.06 MT less than that of last year. Sales volume variance for palm kernel is P59 thousand or 1% unfavorable and sales price variance is P130 thousand or 0.22% unfavorable. There’s no sale of fertilizers and feed oil for the year compared to last year’s sales of P39 thousand and 4.7 million, respectively. Last year’s sales from fertilizers is 47 bags with an average price of P850 and from feed oil is 254 MT with an average price of P18,567.41. Sales of PFAD rose from 728 thousand last year to P 3.6M this year. Sales from palm acid oil is 406.23 MT compared from last year of 343.85 MT. Sales Volume variance is 602 thousand or 18% favorable. The price variance of palm acid oil is 996 thousand or 6% unfavorable.Sales of palm olein in 2015 is 751.16 MT amounted P 24 million while palm stearin is 384.92 MT amounted to P 7.6 million. Other services rendered last year amounted to P6,713,558. Other operating income reduced by 63.20%. Cost of sales decreased by 20.87% from last year’s P 126.39 million to P 100 million this year. Operating expenses reduced by P5.7 million or 12.43%.The net income before income tax amounted to P 8.77 million in 2014 dropped to 6.98 million this year. Total assets increased by 12% or 134.3 million from P 899.4 million in 2014 to P 1 billion in 2015. Receivables (net) were recorded at P 15.8 million in 2015, it dropped by P27 million or 63% as compared to P 43.1 million in 2014 since the sales of CPO are more on cash basis. Prepaid expenses rose to P35.7 million as compared to last year’s P33.5 million. This year, property and equipment increased by 18% or P 58.5 million based on the P 316.6 million last year. Total liabilities grew from P 524.50 million in 2014 to P 632.8 million in 2015. SIMPLE HOMES DEVELOPMENT INC. (formerly Andesite Corp.) is 100% owned by ABCI Andesite Corporation was originally registered as Andesite Holdings Corporation, it was incorporated in 1997 under SEC registration no. A199703502. Its registered office address is at Cagayan de Oro City. Its primary purpose prior to the new amendment application is to engage in the business of agriculture. ABCI bought Andesite Corporation from A Brown Energy Resources and Development Inc. (ABERDI) to undertake its socialized housing projects last December 2014. On March 13, 2015, an application to amend its Articles of incorporation was filed to the Securities and Exchange Commission (SEC) to amend its corporate name to Simple Homes Development, Inc. and its primary purpose to invest in, purchase or otherwise acquire and own, hold sell, assign, transfer, mortgage, pledge, exchange, or otherwise dispose of real and personal property of every kind and description, including shares of stocks, bonds, debentures, notes, evidences of indebtedness, and other securities or obligations of any other corporation or association, domestic or foreign, for whatever legal purpose or purposes the same may have been organized without being a stock broker or dealer, and to pay therefore in money or by exchanging therefore stocks, bonds, or other evidences of indebtedness or securities of this or any other corporation and while the owner or holder of any such real or personal property, stocks, bonds, debentures, contracts or obligations, to receive, collect and dispose of the interest, dividends, and income arising from such property and to possess and exercise in respect thereof all the rights, powers, and privileges of ownership, provided the corporation shall not exercise the functions of a trust corporation. This was approved by SEC on April 10, 2015.
65
As of March 18, 2016, the Company has not yet started its commercial operations and has no employee as of December 31, 2015. The company incurred a net loss of P 562,727 this year and P 31,320 last year. Total Assets remained at 10.30 million while total liability slightly increased from 9.6 million last year to 10.2 million this year. NAKEEN CORPORATION is 100% owned by ABERDI
The Company was incorporated on February 26, 1997 under SEC registration no. A199703509. The primary purpose of the Company as amended, is to engage in the business of agriculture in all aspects, including but not limited to, the operation of fishponds and fish pens, the raising of cattle, both large and small, the raising of hogs and chicken and any and all other activities related to or incidental to the foregoing, and to market, sell, or otherwise dispose of any and all produce and products in both local and foreign markets. At present, the Company is also engaged in selling palm seedlings and bunches. Its registered principal place of business is at Manolo Fortich, Bukidnon. It started its commercial operations on March 1, 2007 in line with the approval of the Board of Directors of ABERDI (parent company) to transfer the oil palm nursery and plantation operations. As of December 31, 2015, it has no employee. Its existing personnel were transferred to ABERDI in anticipation of the merger. The BOD of Nakeen approved the filing of the amended Articles and Plan of Merger on February 19, 2013. The amended articles and plan was filed to the SEC on July 24, 2013 to amend certain provision on the articles and plan of merger. On February 11, 2015, SEC denied the petition to amend the plan of merger. The Company filed for a request for reconsideration to approve the petition. As of March 18, 2016, the motion for reconsideration is still pending before the SEC.
ABERDI entered into a lease agreement with the Company for the plantation area inclusive of the standing crops, properties and equipment effective January 1, 2013 with the option to pre-terminate the lease agreement as agreed by both parties. Also, as provided in the lease agreement, that from October 1, 2012 up to December 31, 2012, ABERDI shall be given access to enter the Company’s premises for the set-up, construction and preparation for its intended use of the plantation area. The lease was extended up to April 1, 2020.
Currently, the plantation and nursery are in the following areas: Opol (630.77 has.= 623.27 has. planted & 7.50 has. for planting), plantations in Kalabugao (1,087.75 has. = 920.55 has. planted & 167.20 has. for planting), Impasug-ong (4.14 has. planted), and Tignapoloan (929.96 has. for planting). Kalabugao and Impasug-ong plantation and/or nursery are all located in Bukidnon, while Opol and Tignapoloan are located in Misamis Oriental. A total of 193,227 hills (exclusive of mortality and replanting hills) were planted as of December 31, 2015.
As of December 2015, there was no increase of land rights in Kalabugao, Bukidnon.
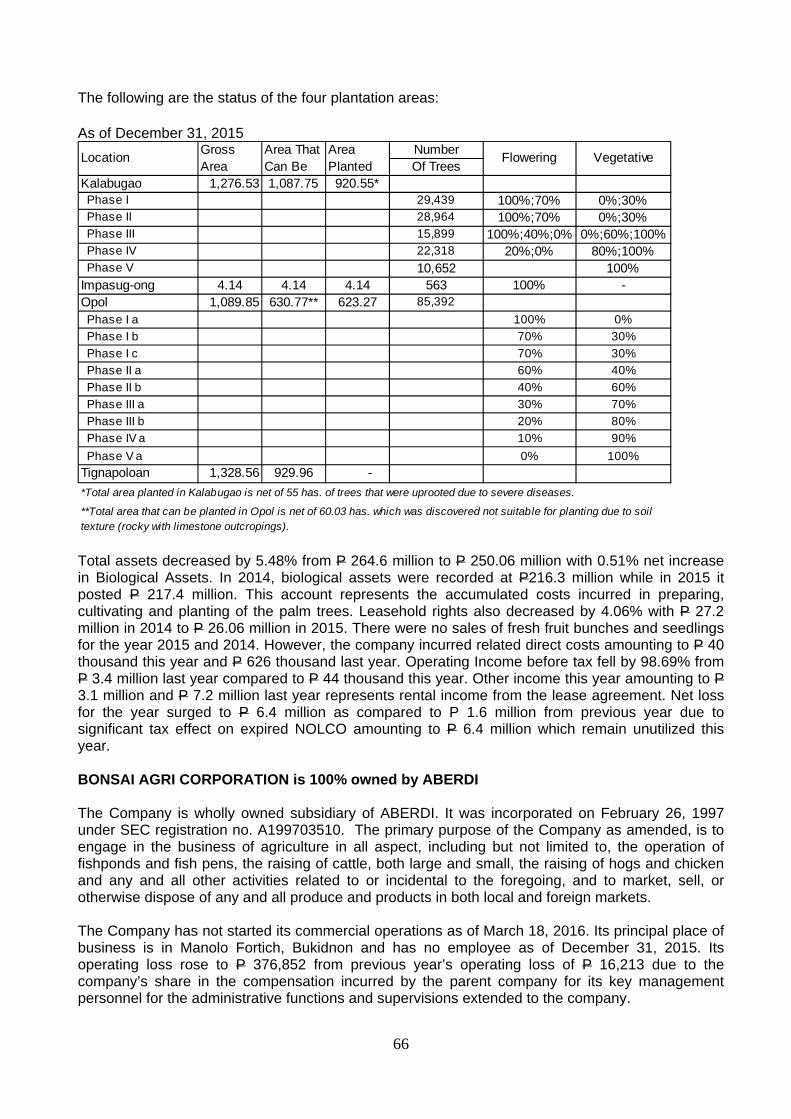
66
The following are the status of the four plantation areas:
As of December 31, 2015 NumberOf Trees
Kalabugao 1,276.53 1,087.75 920.55* Phase I 29,439 100%;70% 0%;30% Phase II 28,964 100%;70% 0%;30% Phase III 15,899 100%;40%;0% 0%;60%;100% Phase IV 22,318 20%;0% 80%;100% Phase V 10,652 100%Impasug-ong 4.14 4.14 4.14 563 100% -Opol 1,089.85 630.77** 623.27 85,392 Phase I a 100% 0% Phase I b 70% 30% Phase I c 70% 30% Phase II a 60% 40% Phase II b 40% 60% Phase III a 30% 70% Phase III b 20% 80% Phase IV a 10% 90% Phase V a 0% 100%Tignapoloan 1,328.56 929.96 -*Total area planted in Kalabugao is net of 55 has. of trees that were uprooted due to severe diseases.
**Total area that can be planted in Opol is net of 60.03 has. which was discovered not suitable for planting due to soil texture (rocky with limestone outcropings).
Location Gross Area
Area That Can Be
Area Planted
Flowering Vegetative
Total assets decreased by 5.48% from P 264.6 million to P 250.06 million with 0.51% net increase in Biological Assets. In 2014, biological assets were recorded at P216.3 million while in 2015 it posted P 217.4 million. This account represents the accumulated costs incurred in preparing, cultivating and planting of the palm trees. Leasehold rights also decreased by 4.06% with P 27.2 million in 2014 to P 26.06 million in 2015. There were no sales of fresh fruit bunches and seedlings for the year 2015 and 2014. However, the company incurred related direct costs amounting to P 40 thousand this year and P 626 thousand last year. Operating Income before tax fell by 98.69% from P 3.4 million last year compared to P 44 thousand this year. Other income this year amounting to P 3.1 million and P 7.2 million last year represents rental income from the lease agreement. Net loss for the year surged to P 6.4 million as compared to P 1.6 million from previous year due to significant tax effect on expired NOLCO amounting to P 6.4 million which remain unutilized this year. BONSAI AGRI CORPORATION is 100% owned by ABERDI The Company is wholly owned subsidiary of ABERDI. It was incorporated on February 26, 1997 under SEC registration no. A199703510. The primary purpose of the Company as amended, is to engage in the business of agriculture in all aspect, including but not limited to, the operation of fishponds and fish pens, the raising of cattle, both large and small, the raising of hogs and chicken and any and all other activities related to or incidental to the foregoing, and to market, sell, or otherwise dispose of any and all produce and products in both local and foreign markets. The Company has not started its commercial operations as of March 18, 2016. Its principal place of business is in Manolo Fortich, Bukidnon and has no employee as of December 31, 2015. Its operating loss rose to P 376,852 from previous year’s operating loss of P 16,213 due to the company’s share in the compensation incurred by the parent company for its key management personnel for the administrative functions and supervisions extended to the company.
67
BROWN RESOURCES CORP. – 100% sold to Angelus Agri Corporation BRC (formerly Brown Apartelle Corp. as amended on July 11, 2002) was registered with the Securities and Exchange Commission on 27 September 1999 with SEC Registration No. A1999-17099 and started commercial operations in March 2000. It can own or operate or both, hotels, apartelles, apartments and restaurants and all matters incident thereto. It may also engage in trading, purchase, own, lease, sell and convey real properties, real estate development and allied ventures. On October 1, 2009, operation of the Chalets/Hotel business (buildings, machineries and furniture) has been assumed by BRC. The Company leased the land at which its buildings are erected based on a percentage of the gross income generated from the use of the property for a period of 5 years. In January 2015, the Parent Company sold its 100% interest in Brown Resources Corporation to Angelus Agri Corporation at Net Book Value per share including several parcels of land where BRC’s chalets stand. MASINLOC CONSOLIDATED POWER, INC. (MCPI) 49% owned MCPI was registered with the Securities and Exchange Commission on 4 July 2007 with SEC Registration No. CS200710562. Its primary purpose is to engage in, conduct and carry on the business of construction, planning, purchasing, management and operation of power plants and the purchase, generation, production, supply and sale of electricity, to enter into all kinds of contracts for the accomplishment of the aforementioned purpose. Its principal address was transferred to 3301-A West Tower, PSE Centre, Ortigas Center, Pasig City on January 25, 2013 (as approved by SEC) from its previous registered address at Rm. 2104 Robinson Equitable Tower, ADB, Ortigas Ave., 1605 Pasig City, Metro Manila. The Company has not started its commercial operations as of March 18, 2016 and has no employee as of December 31, 2015. The company incurred net loss for the year amounting to P 422,681 as compared from last year’s net income of P332,156. The loss was significantly attributed to the P 704,869 amortization of discount on loans receivable. Other pre-operating expenses were P 31,619 in 2015 which slightly lower than the P 35,015 in 2014. Total assets as of December 31, 2015 amounted to P 6,604,211. PALM THERMAL CONSOLIDATED HOLDINGS CORP. (PTCHC) is 100% owned Palm Thermal Consolidated Holdings, Corp. (PTCHC) was registered with the Securities and Exchange Commission on 22 November 2010 with SEC Registration No. CS201018744. Its primary purpose is to purchase, acquire, own, hold, lease, sell and convey properties of every kind and description, including lands, buildings, factories and warehouses and machinery, equipment , the goodwill, shares of stock, equity, rights, and property of any person, firm, association, or corporation and other personal properties as may be necessary or incidental to the conduct of the corporate business, and to pay in cash, shares of its capital stock , debentures and other evidences of indebtedness, or other securities, as may be deemed expedient, for any business or property acquired by the corporation. The Company amended its articles of incorporation on January 19, 2011, changing its registered principal address from 3301-A West Tower, PSE Tektite Towers, Exchange Road, Ortigas Center, Pasig City, Philippines to 2903-B West Tower, PSE Tektite Tower, Exchange Road, Ortigas Center, Pasig City, Philippines. On December 22, 2014, the company changed its principal address to 3301-A West Tower, PSE Tektite Towers, Exchange Road, Ortigas Center, Pasig City through its submission of General Information Sheet (GIS) in compliance with SEC Memorandum Circular 16
68
series of 2014. As of December 31, 2015, the company has no employees since the manpower it merely serves as the corporate holding vehicle for investments in Palm Concepcion Power Corp. (PCPC). The Company acquired 100% of the outstanding capital stock of Palm Concepcion Power Corporation (formerly DMCI Concepcion Power Corporation) in line with the Parent Company’s move to pursue its plan in expanding into the power industry. PTCHC is the corporate entity for ABCI’s entry in the power generation business. In 2012, the company entered into various agreements and agreements which decreased its shareholdings in Palm Concepcion Power Corporation (PCPC) from 100% to 30% and also allowed PTCHC to acquire a 30% shareholding in Panay Consolidated Land Holdings Corporation (PCLHC) as of December 31, 2012. As a result of AC Energy Holdings, Inc. (ACEHI)’s decision to focus on its other existing power imminent in its development pipeline, PTCHC and ACEHI agreed in May 2013 to the acquisition of ACEHI’s 40% equity interest in PCPC and PCLHC. The said acquisition increased PTCHC interest to 70%. In December 2013, new subscription agreement was executed between PTCHC, Jin Navitas Resources, Inc. (JNRI) and the new investor, Oriental Knight Limited (OKL) for the joint venture project in PCPC which resulted to the following equity interest: PTCHC (39.54%); JNRI (30%) and OKL (30.46%). While PTCHC’s interest in PCPC was reduced to 39.54%, its equity interest in PCLHC remained at 70% as of December 31, 2013.
In the third quarter of 2014, the SEC approved the Plan of Merger of PCPC and PCLHC with PCPC as the surviving entity as well as the increase in authorized capital stock (ACS) of PCPC. The merger and the increase in ACS resulted to the Company’s 30% equity interest in PCPC. On January 6, 2015, the SEC approved PCPC’s application of the increase in authorized capital stock to 6,000,000,000 shares divided into 1,500,000,000 common shares and 4,500,000,000 redeemable preferred shares both with a par value of P1.00 per share which reduced PTCHC equity interest in PCPC to 20%. PTCHC incurred a net loss amounting to P 0.6 million and P 0.8 million for the year 2015 and 2014, respectively. The decrease in net loss was due to the tax effect of deferred income tax benefit and the booking of financial income from non-interest bearing loan. The operating expenses increased by 47.84% or P 0.5 million comparing from last year’s P 1 million versus this year’s P 1.5 million. Its total asset decreased to P 927 million as of the end of 2015 inclusive of a P 920.7 million investment in associates. As of the end of 2014, the assets of PTCHC reached P 1.35 billion inclusive of the P 1.17 billion investment in associates and P 165 million investments and deposits. Deposits for future subscription as of 2015 were classified as non-current liability amounting to P 818.3 million. PALM CONCEPCION POWER CORPORATION (PCPC) is 20% owned by PTCHC Palm Concepcion Power Corporation (formerly DMCI Concepcion Power Corporation) (PCPC) was registered with the Securities and Exchange Commission on 08 November 2007 with SEC Registration No. CS200718932. Its primary purpose is to acquire, design, construct, invest in, and operate power generating plants in the Municipality of Concepcion, Province of Iloilo and engage in the business of a Generation Company in accordance with Republic Act No. 9136 otherwise known as the Electric Power Industry Reform Act of 2001 (the “EPIRA”); and its implementing rules and regulations; and to design, develop assemble and operate other power related facilities, appliances and devices. Its principal place of business is at Sitio Puntales, Brgy. Nipa, Concepcion, Iloilo, Philippines (as amended on 07 January 2011 by the Board of Directors and approved by the SEC on 09 March 2011).
69
In 2010, PTCHC acquired 100% of the outstanding capital stock of PCPC as PCPC would be the corporate vehicle used to construct and operate a 1x135MW coal-fired power plant project in Concepcion, Iloilo. This project will be a base-load plant and will make use of Circulating Fluidized Bed Combustion (CFBC) technology. While only 135 megawatts is on a firm basis, the plant site and support units are programmed for 2 units. It was projected the preparations for the 2 unit to begin 2 to 3 years after commissioning of the first unit if the power market in the region continues to expand as projected. The target date for commissioning the first unit is June 2016. In September 2012 , ABCI together with its subsidiaries: PTCHC, PCPC and PCLHC signed a Memorandum of Agreement with AC Energy Holdings, Inc. (ACEHI) and a separate Memorandum of Agreement with Jin Navitas Resource, Inc. (JNRI). Towards the end of October 2012, PTCHC together with other principal stockholders of PCPC namely ACEHI and JNRI finalized and executed their Shareholders’ Agreement to document and implement their agreement on their joint investment in PCPC, including the constitution of PCPC as the Project Company for the 135MW coal-fired power plant as well as to confirm the terms and conditions by which PCPC will be owned, managed and controlled, and by which PCPC shall implement the development and operation of its power generation project. The divestment of AC Energy Holdings, Inc. (ACEHI) of its PCPC shares and the acquisition by PTCHC of the said shares in May 2013 increased PTCHC’s equity interest to 70%. In December 2013, a new investor entered into the joint venture in PCPC reducing PTCHC’s interest to 39.54%. PTCHC’s investment in PCPC was reduced from 30% to 20% due to non-subscription on the increase in authorized capital stock which was approved by SEC on January 6, 2015. HYDRO LINK PROJECTS CORP. (HLPC) is 100% owned Hydro Link Projects Corp. (HLPC) was registered with the Securities and Exchange Commission on 6 May 2010 with SEC Registration No. CS201006733. Its primary purpose is to engage in, conduct, and carry on the business of developing, constructing, operating, and maintaining hydro-electrical plants and system and other power generating or converting stations, manufacture, operation, and repair of related mechanical and electric equipment. Its principal address is at 3301-A West Tower, PSE Centre, Ortigas Center, Pasig City. HLPC is currently pursuing the 26MW Carac-an Hydroelectric Project. It has secured the Hydropower Service Contract from the Department of Energy (DOE) for the development of the Carac-an river in Cantilan, Surigao del Sur. The contract gives Hydro Link exclusive rights to explore, develop and utilize the hydropower potential of the Carac-an River. This project is ABCI’s first foray in the renewable energy market. It’s part of ABCI’s plans to provide much-needed additional power capacities for the electric cooperatives and the Mindanao Grid and to continue to look for other projects similar to it. The Hydropower Service Contract was signed last June 2013, after the Department of Energy (DOE) completed its financial, technical and legal evaluation of the service contract application. The results of the feasibility study conducted in compliance with the Service Contract shows that the project can derive an optimum capacity of 16.3MW and expected to generate an average of 78.9 GWh annual energy. The output of the power station will be connected to the nearest substation of the Surigao del Sur Electric Cooperative II. Being a registered DOE project, it will enjoy all the incentives accorded to this type of project which include a seven-year income tax holiday as provided by RA 9513 (Renewable Energy Act) and issued by Board of Investments (BOI).
70
The company has three (3) employees as of December 31, 2015 and has not started its commercial operations as of March 18, 2016. No income is reported for the year other than the unrealized foreign exchange gain of P3,772 and bank interest of P1,005 totaling P4,777 as compared to last year’s P 17,707 bank interest income since the company has not yet started its commercial operations. Deferred income tax expense amounted to P1,286,681 in 2015 increasing the net loss to P 4,468,884. The deferred income tax benefit of P 858,783 reduced the net loss to P 1,992,508 in 2014. Pre-operating expenses incurred in 2015 reached to P 3,186,980 compared to last year’s P 2,868,998. Total assets as of December 31, 2015 increased to P 19,996,670 from P 19,859,772 in 2014.
PEAKPOWER BUKIDNON, INC. (PBI) - 100% sold to Peakpower Energy, Inc. (PEI)
Peakpower Bukidnon Inc. (PBI) was registered with the Securities and Exchange Commission (SEC) on July 24, 2014 with SEC Registration No. CS201414293 primarily to acquire, develop, construct, invest in and operate power generating plants in Bukidnon and engage in the business of a generation company in accordance with Republic Act No. (RA) 9136 otherwise known as the Electric Power Industry Reform Act of 2001 (the “EPIRA”) and its implementing rules and regulations , and to develop, assemble and operate other power related facilities, appliances, and devices, and develop and operate conventional and renewable energy resources, sell electricity and carbon credits, act as a wholesale and retail electricity supplier and aggregator, operate and maintain power plants, securing any needed licenses to engage in such business activities and purchasing or otherwise acquiring, for the purpose of holding or disposing of the same, shares of stock, equity, rights, and property of any person, firm, association, or corporation engaged in industries or activities related to energy development, paying for the same in cash, shares of stocks, or bonds of this corporation. Its registered office address is located at Unit 3304-C West Tower, Philippine Stock Exchange Center, Exchange Road, Ortigas Center, Pasig City.
Peakpower Bukidnon Inc. (PBI) was incorporated for a 15-year Build-Operate-Maintain and Transfer agreement with the Bukidnon II Electric Cooperative Inc. (Buseco). Last August 22, 2014, PBI and Buseco signed a Power Purchase and Transfer Agreement for 10.4MW Diesel/Bunker-fired power plant to be constructed in Manolo Fortich, Bukidnon.
Buseco’s franchise area is located in the highlands of Bukidnon province, which is considered to be the food basket of the Philippines and is home to some of the largest food processing companies in the country. The franchise includes the municipalities of Baungon, Cabanglasan, Impasug-ong, Lantapan, Libona, Malitbog, Manolo Fortich, Sumilao, Talakag, and Barangay Lilingayon.
On July 29, 2015, the BOD approved the sale of company’s 100% interest in PBI to its associate Peakpower Energy, Inc. (PEI). This is to consolidate all its peaking projects under one holding company. The execution agreements were signed on October 16, 2015. PEAKPOWER ENERGY, INC. (PEI) is 20% owned Peakpower Energy, Inc. (PEI) was registered with the Securities and Exchange Commission on 19 February 2013 with SEC Registration No. CS201303004. Its primary purpose is to purchase, acquire, own and hold, shares of stock, equity, rights and property of energy companies and to others and to provide management services and/or shared services to its subsidiaries and affiliates or to third parties engaged in the energy business. Its principal place of business is at 3/F Joy-Nostalg Center, # 17 ADB Ave., Ortigas Center, Pasig City, Philippines.

71
PEI was set up to implement projects designed to generate peaking energy spread across various A+/Green rated electric cooperatives in Mindanao and the Visayas. These are Build-Operate-Maintain and Transfer Agreements for brand new bunker-fired engines, which will last for 15 years.
The salient points of the projects are: short gestation, ownership transfer to the electric cooperative after 15 years and a significant contribution to address the lack of base load power in the Mindanao grid for the next 2 to 3 years and in the future to allow cooperatives to meet the needs for peaking power.
Peakpower Energy, Inc. (PEI) is currently working to develop, construct and operate diesel power plants in Mindanao through its subsidiaries as operating units: Peakpower SOCCSARGEN, Inc. (PSI) and Peakpower San Francisco, Inc. (PSFI).
Last October 2013, ABCI along with Enterprise Holdings Corporation, World Power Alliance Limited and Power Mavens Holdings Limited finalized and executed a Shareholders’ Agreement for their joint investment in PEI. The Shareholders’ Agreement confirmed the terms and conditions, by which PEI will be owned, managed and controlled, and by which PEI shall implement the development and operation of its power generation project.
To consolidate all peaking projects under one holding company, ABCI sold its 100% equity interest in PBI to PEI on October 16, 2015. PEAKPOWER SOCCSARGEN, INC. (PSI) is 100% owned by PEI Peakpower SOCCSARGEN Inc. (PSI) was registered with the Securities and Exchange Commission on 18 February 2013 with SEC Registration No. CS201302468. Its primary purpose is to acquire, design, develop, invest in, and operate power generating plants in the General Santos City and engage in the business of a generation company in accordance with Republic Act No. 9136 otherwise known as the Electric Power Industry Reform Act of 2001 (EPIRA) and its implementing rules and regulations, develop and operate conventional and renewable energy resources, sell electricity and carbon credits, act as a wholesale and retail electricity supplier and aggregator and maintain power plants, among others. Its principal place of business is at SOCOTECO II Sub-Station Compound, Brgy. Apopong, General Santos City, Philippines.
The Peakpower Soccsargen Inc. (PSI) is a 20.9MW Power Plant located in General Santos City. PSI has a 15 year BOMT agreement with the South Cotabato II Electric Cooperative Inc. (Socoteco 2). Socoteco 2 is the largest distribution utility in Mindanao and its franchise area includes General Santos City, the municipalities of Glan, Malapatan, Alabel, Makungon, Kiamba, Maasim and Maitum in Saranggani and the municipalities of Polomolok and Tupi in South Cotabato. Its commercial operation started on January 27, 2015 while the preparations for the second unit are in progress. Contracting and equipment procurement are scheduled on the first quarter of 2016.
PEAKPOWER SAN FRANCISCO, INC. (PSFI) is 100% owned by PEI Peakpower San Francisco, Inc. (PSFI) was registered with the Securities and Exchange Commission on 22 May 2013 with SEC Registration No. CS201309160. Its primary purpose is to acquire, design, develop, invest in, and operate power generating plants in the Agusan del Sur and engage in the business of a generation company in accordance with Republic Act No. 9136 otherwise known as the Electric Power Industry Reform Act of 2001 (EPIRA) and its implementing rules and regulations, develop and operate conventional and renewable energy resources, sell electricity and carbon credits, act as a wholesale and retail electricity supplier and aggregator and maintain power plants, among others. Its principal place of business is at ASELCO Compound, Barangay San Isidro, San Francisco Municipality, Agusan del Sur, Philippines.
72
The Peakpower San Francisco Inc. (PSFI) is a 5.2MW Power Plant located in San Francisco, Agusan del Sur. PSFI has a 15-year BOMT agreement with the Agusan del Sur Electric Cooperative Inc. (ASELCO). ASELCO’s franchise area includes the municipalities of San Francisco, Prosperidad, Rosario, Trento, Bunawan, Veruela, Sta. Josefa, Loreto, Sibagat, Esperanza, Talacogon, La Paz, San Luis and Bayugan City. San Francisco serves as the primary commercial and service center in the province of Agusan del Sur, being situated at the crossroads leading to other production centers in the region. The power plant is now commercially operational. Preparations are underway for expansion with contracting and procurement slated first quarter of 2016. AB BULK WATER COMPANY, INC. (ABWCI) is 100% owned by ABCI
AB Bulk Water Company, Inc. (ABWCI) was incorporated on March 31, 2015 to engage in the business of holding and providing rights to water to public utilities and cooperatives or in water distribution in the Municipality of Opol, securing any needed licenses to engage in such business activities and purchasing or otherwise acquiring, for the purpose of holding or disposing of the same, shares of stock, equity, rights, and property of any person, firm, association, or corporation engaged in industries or activities related to water development, paying for the same in cash, shares of stocks, or bonds of this corporation.
ABWCI is pursuing the proposed Bulk Water Supply Project for the Municipality of Opol in Misamis Oriental. The Project which will tap the water resources of Lumayagan River aims to supply about 15 to 20 MLD of potable water to cater the present and future requirements of the municipality. Other potential service areas include the neighboring municipalities of Opol – the city of El Salvador, and the municipalities of Alubijid, Laguindingan, and Gitagum. Based on the study, these are potential growth areas.
Pre-feasibility study has been completed confirming the technical viability of the project. Currently, the detailed engineering design is on process. ABWCI presented the project to the LGU and it was endorsed by them for immediate implementation.
The new projects and expansions for power and infrastructure will be financed through a combination of self-generated equity, joint ventures and partnerships, and project financing.
APEX MINING COMPANY, INC.(APEX) – 6.24% owned by ABCI Apex Mining Company, Inc. was incorporated on February 26, 1970 listed in the Philippine Stock Exchange. It is principally engaged in the business of mining and production of gold, silver, copper, lead and other precious metals. In October 2014, the Parent company sold all its 388,694,698 shares in Monte Oro Resources and Energy Inc. (MORE) to Apex Mining Co., Inc. (Apex) and subsequently subscribed the same number of shares of Apex. The Parent Company has 8.89% shareholdings in Apex after the SEC approved the increase in its authorized capital stock on January 12, 2015. After the next round subscription, the company’s interest was reduced to 6.24%. Apex acquisition of MORE will expand the mining business of the corporation. It will be taking over the mining business under MORE which include the mineral processing plant and tenements in Jose Panganiban, in Camarines Norte and tenements in other provinces. It also include a 30 percent interest in Service Contract no. 72 that covers an offshore gas project in Palawan, as well as BOT Contract for solid waste management with the Philippine government for Metro Manila and mining interest in Myanmar, Mongolia, Uganda and Sierra Leone in Africa.
73
Apex Mining has an expansion program that sought a production hike of 1,500 tons of ore per day in its Maco mine in Campostela Valley from 850 tons per day. The Maco mine produces bullions containing gold and silver which are smelted in Switzerland. Apex also acquired Itogon-Suyoc Resources, Inc. which has mining claims and owns the mill and production facilities in Sangilo, Itogon, Benguet. PHIGOLD LTD. (PhiGold) - 18.70% PhiGold Limited, a company incorporated in the Cayman Islands on October 20, 2010, is the holding company of the Group comprising PhiGold Plc (100%) and its wholly owned subsidiary PhiGold Mining Limited, both incorporated in England and Wales. The two subsidiaries, however, are currently inactive. PhiGold with its principal activity of investing in gold mining assets has invested 40% in the total voting rights in PhiGold Metallic Ore Inc. (PMOI), a gold mining company incorporated in the Philippines last January 7, 2008. Upon the sale of PMOI shares from PhiGold Mining Limited to PhiGold Limited in March 2011, PMOI is already a direct subsidiary of PhiGold Limited. PMOI is the contractor of its acquired mining property covered by Mineral Production Sharing Agreement 190-2009-XIII (MPSA 190) granted by the Philippine Government through the Mines and Geosciences Bureau (MGB) under the Department of Environment and Natural Resources (DENR). It has a term of 25 years and is renewable for another term of 25 years. MPSA 190, which has gold and other mineral deposits, is situated in Barobo, Surigao del Sur and has an area of 449.49 hectares. Its exploration period is two (2) years initially and renewable every two years but not to exceed eight (8) years in total. On August 24, 2011, all documentary requirements submitted to MGB Regional Office in Surigao have been forwarded to MGB Central Office in Manila. These documents are required in the conversion of MPSA from Exploration status into Development and Production. On October 11, 2011, the provincial board of Surigao del Sur has resolved to approved and endorsed the mining operations of PMOI. The provincial board resolution has also been submitted to MGB. With the promising prospect in mining industry due to the increasing gold prices in the world market, A Brown Company's Board of Directors approved on November 29, 2011 the acquisition of 29,376,039 of PhiGold Limited shares representing 22.87% of its outstanding equity. With the entry of the new investor in Phigold, ABCI’s equity interest reduced to 18.7%. (2) Business of Issuer Principal Products and Services A Brown Company, Inc. (“ABCI”) is a publicly listed corporation which has major interest in the property development and investment in listed and non-listed companies. It is engaged in the business of real estate development located in Cagayan de Oro City and Initao in Misamis Oriental, Cainta, Rizal; Valencia City, Bukidnon and Butuan City, Agusan del Norte. ABCI, through its subsidiaries, also ventured into oil palm nursery and seedlings distribution, palm oil milling, operation of hotels and real estate brokerage. It has recently ventured into power generation and investment in gold mining assets. Xavier Estates (“XE”) - located in Fr. Masterson Avenue, Upper Balulang, is the pioneer in premier mixed use development in Northern Mindanao. This 220-hectare development sprawled on a panoramic plateau overlooking the City has now become 288 hectares through additional acquisitions of adjacent developable areas over the years. It is a perfectly master planned community which guarantees luxury, elegance, prestige, convenience and security. It has 24-hour security, tree-lined streets and landscaped roadways, high pressure sodium streetlamps,

74
telecommunications, own rotary garbage truck and maintenance crew, own fire truck, two of which are capable of storing up to 14,000 liters of water, centralized water supply system and water treatment facility, parks and playground, jogging and bicycle paths, forest park and bird sanctuary. Within the Estates, is a fully air-conditioned chapel, a school offering preparatory and elementary education, convenience stores, gasoline station and the Xavier Sports and Country Club – the first and only country club with proprietary membership. Other modern conveniences are also within reach such as SM mall and a par 72-hole golf course. Just across it, is Xavier University – a grade school and high school university run by the Jesuits. For year 2015, there were 7 lots sold. Ventura Residences (Phase V-A) is the first venture of A Brown Company, Inc. into the middle market house-and-lot package. Ventura Residences is nestled inside the Xavier Estates, a secluded place in a guarded gated community. Alicia-modified model house has three rooms and a master’s bedroom; three toilet and bath (T & B); a maid’s quarter with separate T & B; a carport and terrace. Ventura Residences has parks and playground and 6-meter wide service roads. There were 32 house & lot sold in 2015. Ventura Lanes is located beside Phase V-A Ventura Residences which also situated inside the Xavier Estate. It offers lots only with cuts starting at 110sq.m.for its 30 saleable lots. A total of 5 lots were sold in 2015. Xavierville Homes Subdivision is adjacent to the Xavier Estates project. It is an economic housing development under BP 220. Phase 1 has an area of 1.8 hectares while Phase 2 has an area of 0.60 hectares for a total of 131 saleable lots. There were 8 house and lot sold for the year. Teakwood Hills Subdivision located in Barangay Agusan, Cagayan de Oro City, some 2.3 kilometers from the national highway going uphill. This new and idyllic enclave has a breathtaking endless view of the mountains and the sea. It was inaugurated on September 22, 2007. Part of its master plan development is a perimeter fence with ingress and egress controlled by two gates, 24 hour security, private cul-de-sac with esplanades and parks designed to create a pastoral ambience. The roads are eight meters wide and lined with trees. It has a club house with recreational amenities such as swimming pool, billiards, darts and table tennis. A restaurant and village post will also serve the needs of the community. Lot sizes starts from a minimum cut of 250 sq.m., all with a 180-degree scenic view of the famous Macajalar bay and an elevation of 220 meters above sea level. A total of 28 lots were sold in 2015. Valencia Estates is located in Barangay Lumbo, Valencia City, Bukidnon officially launched on October 2008. It is a 11.7244 hectares project with an estimated 341 saleable lots ranging from 150 to 293 sq.m. each. Valencia Estates’ amenities are patterned after the excellent standards of a plush subdivision with a road network of 15 meters for the main road, 10 meters for the service roads complete with sodium street lamps; a basketball court, a clubhouse with a swimming pool. It also has open spaces and playground, perimeter fence and a 24-hour security service. There were 12 lots sold in 2015. East Cove Village is located in Barangay Sto. Domingo, Cainta, Rizal which is conveniently situated at the back of Robinsons shopping center and very accessible by public transportation along Ortigas Extension. This master planned mini subdivision will have the atmosphere of resolute safety and conspicuous ambiance of a first rate community and neighborhood, truly an affordable world of enclave living. It is a 2.6 hectares project with 140 lots. It was opened to the market in 2005 and was sold out in less than 2 years. It has a perimeter fence for security and privacy, landscaped entrance gate, wide cemented roads – 10 meters wide main road and 8 meters wide auxiliary roads, concrete curbs and gutters, paved sidewalks lined with trees, storm drainage system, mercury lamps along the road, park and playground, street lamps and centralized water system. The HLURB had issued the Certificate of Completion of the project in February 2009 and the Local Government Unit has already accepted the donation of its open spaces and road lots. On January

75
21, 2012, the village administration was turned over by ABCI to the new set of officers of the Homeowner’s Association. St. Therese Subdivision is a socialized housing project located in mid-Balulang, Cagayan de Oro City. It is about 1.672-hectare project with 155 saleable lots ranging from 50 to 75 sq. m. with floor area of 25 to 28 square meters. There are 91 units of row houses; 38 units of duplexes and 17 units of single-attached that have been for the project. Nine (9) units are up for new design. Sales booked in 2015 totaled to 16 lots. Coral Resort Estates is a mixed-use development located at Brgy. Pagahan, Initao, Misamis Oriental, between the cities of Cagayan de Oro and Iligan. The project is 60 kilometers from Cagayan de Oro and is 27 kilometers away from the Laguindingan International Airport. The development includes a P 30 million clubhouse. The total land area is 10 hectares with a total development area of 5.397 hectares with an average lot cut of 250 sqm. Phase 1 of the project will comprise 82 lots. ECC No. R-10-1001-0013 and Developmental Permit No. 2011-04-01 have been issued for the project. Cluster A has 42 saleable lots with an area of 2.5 hectares. There were 29 lots sold for the year. West Highlands is a residential estate located in Brgy. Bonbon, Butuan City. The project is just 3 kilometers from the JC Aquino Avenue junction and approximately a 5- kilometer drive to all major establishments and service facilities in the city. The total area of development of Phase 1 is 25.9 hectares and 289 feet above sea level which gives you an opportunity to have an exclusive view of the historic Mt. Mayapay or the cityscape. Situated at the delta of the mighty Agusan River, Butuan was a trading entrepot that flourished about 900-1000AD within the Southeast Asian maritime trading empire. It is also in Butuan that actual specimens of the ancient boats know as balanghai-today aptly renamed the Butuan Boats- were found. A total of 50 lots were booked as sales this year.
Mountain View Homes is the latest project offering of ABCI. This project has a development area of 2.3179 hectares with 216 saleable house and lots. Project development is 85% accomplished including the amenities. The guard house and basketball court is 100% completed. There were 162 lots sold in 2015.
Product Lines: Net Sales 86.19%Financial Income 4.41%Gain on Sale of Investment Property 2.20%Rental Income 1.97%Equity in Net Gain of an Associate 1.06%Sales of Aggregates 0.99%Others 3.18% The Company has seven categories for products and services. The first category covers real estate activities, sale of crude palm oil processed from the mill plant of ABERDI, hotel operations, water services, palm seedling, crop, fertilizers and kernels. The revenue from this category is known as net sales and accounts for about 86.19% of revenues. The second category covers interest income for in-house financed lot sales and discount on loans payable. The third covers the gain on sale of investment property. The fourth category is leasing activities of real properties. The fifth category is equity in net gain of an associate. The sixth category is revenue derived from the sale of aggregates. The seventh category derived from service fees, penalties on late payments, income from forfeited lots, retitling fees, collection of long outstanding accounts (reversal of allowance), gain on disposal of net assets of deconsolidated subsidiaries and increase in sale of
76
sludge oil and wet sludge. This also includes earnings being the marketing arm of Mountain Pines Farm1 located along the slope of Mt. Kitanglad in Dahilayan, Bukidnon.
1This property has a temperature of a gentle 20 to 270C in summer, similar to spring in some places of Europe and the US. January is 120C. The climate is ideal for raising strawberries and apples right in your backyard. It is a healthy and comfortable destination for camping, horseback riding and bird watching.
Foreign Sales not applicable Distribution Methods of Products and Services The Company’s products are distributed to a wide range of clients through various sales groups. For its Cagayan de Oro projects, it has existing contracts with the following realty companies: Chee Realty and Development Corporation, CDO Brokers and Associates, JCA’s Westbridge and Eagleridge groups. In Butuan, these aforementioned realties are joined by BCP Realty and JCA Westlands. The six (6) major realty brokerage firms also handle and take charge other affiliate realties focused in selling ABCI projects. For its Manila project, it has accredited nine (9) brokers: namely Oscar dela Cruz group and several individuals. They do the promotion and leg work to sell the projects of ABCI. The Company on the other hand gives them support through timely completion of the projects and easy access to different support groups such as – credit and collection, engineering, maintenance and homeowners’ association. Incentives in the form of commission and other perks are also well-thought of to properly commensurate the enthusiasm and dedication of its partners – the Brokers. The company is also broadening its market reach from traditional local marketing to the online marketplace where most real estate transactions begin with an internet search. By maximizing the use of ABCI’s website and direct link to clients through the use of technology (i.e. E-mail, cellphone texting, Search Engine Optimization (SEO), Facebook, etc.), it is able to provide its clientele the best available information. Moreover, marketing activities include roadshow and exhibits in other areas in Mindanao as well as publication in airline magazines. Annually, sales performance of accredited realties and brokers are recognized in a Sales Conference. Regular weekend activities are now conducted in partnership with accredited banks. Awards are given to each realty brokers to recognize their invaluable contribution to the success of ABCI’s real estate venture. Special citations are also given to top individual performers. Maintaining a strong and harmonious relationship with its business partners is of utmost importance to the company. For Palm Oil Operations, fresh fruit bunch suppliers are from nearby towns of Bukidnon, Misamis Oriental, Cagayan de Oro City, Sultan Kudarat, and North Cotabato while the buyers for the crude palm oil (CPO) are from Manila, Malaybalay and Valencia Bukidnon, Surigao de Norte, Iligan City and , Butuan City. The buyers for palm oil kernel/nuts are from Davao City and Manila while for the Palm Acid Oil, the buyers are from Batangas and General Santos. The buyers for Olein are from Bukidnon, Misamis Oriental, Butuan City, Cagayan de Oro City and Iloilo City. New Products or Services Xavier Estates is developing an additional 9.9 hectares which is called Ventura Residences (XE -Phase 5A). It is a combination of a relatively flat and gentle rolling terrain overlooking the Cagayan de Oro River. It will consist of house and lot packages with an average cut of 110 sq.m. Phase 5 is composed of three (3) clusters. Ventura Lanes is located beside Phase V-A Ventura Residences which also situated inside the Xavier Estate. Currently, it offers lots only with cuts starting 110 sq.m. Another residential development is located in Initao, Misamis Oriental with a total land area of 10 hectares. This development, Coral Resort Estates has 42 saleable lots for Phase 1 - Cluster A.
77
West Highlands Phase 1 is a residential estate located in Brgy. Bonbon, Butuan City. The project is just 3 kilometers from the JC Aquino Avenue junction and approximately a 5-kilometer drive to all major establishments and service facilities in the city. The project is 289 feet above sea level which gives an opportunity to have an exclusive view of the historic Mt. Mayapay or the cityscape. The whole project has a developmental area of 25.9 hectares which will produce 293 saleable lots. Mountain View Homes is a new venture into the socialized and economic housing. Located in Mid-Balulang, Cagayan de Oro City, Mountain View Homes is accessible to churches, schools, malls and commercial establishment. The socialized housing project has row houses with lot area of 50 sq.m. and floor area of 26sq.m. Single detached units for economic housing have a lot area of 75-80 sq.m. and floor area of 36-38 sq.m. Competition Among several real estate business developments in Cagayan de Oro City, the following are its competitors: Pueblo de Oro Development (mixed use development) is the dominant competitor since it is just across the project site and their product classification is at par with Xavier Estates specifically their golf estates and Philam Village, Robinsons Land Corporation - developer of Richmond Hills (middle-income residential community) launched in 2008 and Ayala Land Inc. launched in 2007 has a high-end residential subdivision called Alegria Hills. View-wise, Ayala Land’s Alegria Hills claim to be a competitor of Teakwood Hills’ magnificent and endless view. For the project in Valencia City, the other players are the developers of the following subdivisions: Sunkiss Subdivision, Edlimar Subdivision, Grandville Subdivision, Sugarland Subdivision and Grandmeadow Subdivision. For Butuan City, other players are the developers of Camella and Filinvest, both offering lots and house & lot packages with price range comparable with our project in West Highlands. Camella Homes and Johndorf Ventures Corporation are competitors in the socialized and economic housing category. Most buyers of ABCI real estate projects regard its value appreciation potentials as highly attractive. Another plus factor is the dynamism of its marketing group which is ably handled by its very able marketing personnel in tandem with its well-trained sales agents/brokers. This is the Company’s commitment to offer affordable lot packages for a well-planned project focused on family oriented and nature-themes environment. The key is good location and accessibility to basic locations (supermarkets, churches, public utilities, etc.). It is able to compete for its ability to attract customers which greatly depend on the quality and location of the projects, reputation as a developer and reasonable prices and the concept of a well-planned integrated community. For the Oil Palm Mill and Nursery operations, the competitors are Filipinas Palm Oil Plantation, Inc. (Rosario, Agusan del Sur), Kenram Industrial & Development, Inc. (Kenram, Isulan Kultan Kudarat), Agumil Philippines, Inc. (Trento, Agusan del Sur) and Univanich Palm Oil Inc.(Carmen, North Cotabato). Sources and Availability of Raw Materials Construction materials for the Cagayan de Oro project were mostly sourced within the city while those used for Manila Operations were also sourced in Manila. The company is not dependent upon any single supplier. Projects are awarded to qualified bidders. Thus, the Company’s suppliers are just related to supplies needed for maintenance and/or office needs. List of its principal suppliers are provided on Exhibit I, page 71-72. For its palm oil milling operation, fresh fruit bunches are supplied from Bukidnon, Misamis Oriental, Cagayan de Oro City, Sultan Kudarat, Agusan del Sur, North and South Cotabato, and Maguindanao. The oil palm seedlings are imported from Papua New Guinea.
78
Customer Profile ABCI’s clients are both from the local residents and OFWs, with dominant buyers from the U.S., London and Japan. 75% of the lot buyers in Mindanao projects come from Northern Mindanao, 15% are Filipinos married to a foreigner and 10% are classified as the “$-earner” group. This group is composed of Filipinos working abroad, majority are nurses, seamen, caregivers, IT and fiancées or married to a foreigner. Payment habits are good and very keen on the project’s completion. For East Cove Village, the lot buyers are 72 local and 68 from OFWs. On the other hand, the buyers for Teakwood Hills Subdivision, Valencia Estates and West Highlands are local businessmen and professionals who want to upgrade their location. Buyers for Mountain View Homes are teachers, government employees and professionals. Buyers for the crude palm oil (CPO) are from Manila, Malaybalay and Valencia Bukidnon, Cagayan de Oro City and Butuan City, Cebu City and Davao City. The buyers for palm oil kernel/nuts are from Agusan del Sur, Davao City and Manila while for the sludge or Palm Acid Oil, the buyers/exporter are from Bukidnon, General Santos, Manila and Quezon City. Related Parties The Company and its subsidiaries and certain affiliates, in the ordinary course of business have entered into transactions with each other principally consisting of reimbursement of expenses, and management agreements. All transactions were done on commercial terms and arms-length basis. See Note 20 of the attached Notes to the Consolidated Financial Statements. Patents, Trademarks, etc. Not applicable Government Regulations There are no existing governmental regulations which may have adverse effects on the business. Licenses to sell for all on-going projects have been secured. Phases 1 to 4 of Xavier Estates have accordingly been secured and compliance with all the requirements of HLURB have been undertaken. The existing real estate project called Xavier Estates has been granted an Environmental Clearance Certificate under the no. 10(43)00-01-31-1502-50110 released on January 31, 2000 consolidating the four phases (I, II, III, IV) of the project. Said certificate supersedes the ECCs previously issued to Phases I, II and III. Xavier Estates Block 62 and 63 belongs to Phase 1 of XE project, alteration permit is 026-2008 while its ECC is 10(43)00 01-31-1502-50110. Phase V of Xavier Estates has been issued an ECC No. R10-0912-0091. The project is being visited twice a year by the Multi-partite Monitoring Team to check the Company’s compliance to the ECC issued. ABCI pays an annual fee for its Mindanao projects and its being handled by the Guardians of the Earth Association, Inc. Teakwood Hills Subdivision’s ECC are (43)06 09-11 4294-50200 and R10-0912-0090, Development Permit No. is 014-2007, and License to Sell are 25268 and 030226 which amends LTS Nos. 18507/24800/28390. For Xavierville Homes Subdivision its ECC is 10(43)05 05-16 4004-50200, Development permit no. is 010-2007 and License to Sell are 18500/22399. Valencia Estates ECC license is R10-1001-0009/10(13)07 07-30 4456-50200 while its Development Permit is 07/01 and its License to Sell are 19846 and 24770. For the Cainta project, an ECC has been issued last November 6, 2003 under no. 4A-2003-1100-8410 and a development permit issued by the Sangguniang Bayan of Cainta, Rizal under Resolution No. 2003-084. The HLURB License to Sell No. 11990 was released in February 2005. Saint Therese Socialized Housing has been issued with ECC No. R10-0912-0089, Development Permit No. 002-2011 and License to Sell No. 24799 while Initao Coral Resort Estates has an ECC No. R10-1001-0013 with Development Permit No. 2011-04-01 and License to Sell Nos. 28380/28404/029461. Ventura Residences ECC License is R10-
79
0912-0091, Development Permit No. 007-2011 and License to Sell are 25834/25265/029473/030205 while for Ventura Lane’s ECC No. is R10-0912-0091, Development Permit is 007-2011 and License to Sell No. is 02469. In Butuan City’s West Highlands, the only golf and residential estates in Caraga region has an ECC No. R13-1204-037, Certificate of Registration No. 23586 and License to Sell Nos. 25889 which was amended to 28412, 28413 & 029465. Mt. View Homes has an ECC No. R10-1408-0217 with Development Permit No. 005-2014 and License to Sell No. 029442 for its Socialized Housing and License to Sell No. 029443 for its Economic Housing. The Palm Oil Mill’s ECC 10(13)06 04-19 4210-31171 was issued on April 19, 2006. It was amended to include Palm Oil Refinery with Fractionation Plant which was approved on February 6, 2013. For the oil palm plantation project, its ECC no. 10(13)07 03-20 4384-31171 was issued on March 20, 2007. For Kalabugao nursery, the Philippine Coconut Authority registration was approved and released last December 24, 2008. While the permit to import oil palm seeds were released on January 12, 2009. The Talakag Crushing Plant with ECC No. 10(43)99 05-21 1462-22330 in Talakag, Bukidnon has secured its business permit and quarrying permit that allows extraction and removal of allowable volume of basalt rock and other incidental activities thereto. Palm Concepcion Power Corp. (formerly DMCI Concepcion Power Corp.) was granted ECC No. 0606-006-4021 dated May 27, 2007 as amended in November 4, 2010 for the proposed construction of the power plant. Endorsements from different levels of the local government units were also issued for the project, namely: Sangguniang Barangay Resolution No. 2004-17 dated December 22, 2004; SB Resolution No. 2005-06 dated January 24, 2005 and SB Resolution No. 2011-068 dated June 13, 2011 (which affirms earlier Resolution and recognizing new corporate name), Provincial Development Council through Resolution No.2005-031 dated July 5, 2005 which favorably endorsing the project to the Regional Development Council; from the Office of the Provincial Governor of Iloilo dated November 10, 2011 and from the Office of the Municipal Mayor of Concepcion, Iloilo dated November 10, 2011. The Department of Energy (DOE) endorsed the project to the National Grid Corporation of the Philippines (NGCP) to conduct Grid Impact Study (GIS) on February 16, 2011 and classified the project from “Indicative” to “Committed” on February 10, 2012. The Department of Natural Resources (DENR) granted PCPC’s request for ECC extension on May 9, 2012 and likewise approved the request for ECC amendment for the increase in capacity from 100 MW to 135 MW and relocation of certain project components on October 12, 2012. With the ECC amendment, the company once again consulted the local government units and appropriate Resolutions interposing no objections were passed and issued as follows: “Sangguniang Barangay Resolution No. 2012-19 dated October 17, 2012 affirming Resolution No. 2012-04; Sangguniang Bayan Resolution No. 2012-99 dated November 5, 2012 affirming SB Resolution No, 2011-69 and Provincial Development Council Executive Committee Resolution No. 2013-034 dated March 13, 2013 affirming the Provincial Development Council’s Resolution No. 2005-031. The Board of Investments (BOI) issued the Certificate of Registration (2012-114) to PCPC on June 27, 2012 and approved PCPC’s request for amendment for the change in ownership and increase in capacity from 100 MW to 135 MW on October 2, 2012. The Environmental Management Bureau (EMB)- Region 6, granted PCPC the Authority to Construct (14-AC-F-0630-1258) and Permit to Operate (14-POA-F-0630-1258) Air Pollution Source and Control Installations on November 3, 2014. A Discharge Permit (15-DPW-F-0630-1258) was also issued by EMB on January 5, 2015, allowing PCPC to discharge treated wastewater to Concepcion Bay.

80
With the request of PCPC to DENR to amend its ECC for the extension of the 350 meter pier conveyor facility, DENR issued a new ECC (ECC-CO-1409-0022) to PCPC on June 19, 2015. The National Water Resources Board (NWRB) issued a Conditional Water Permit (CWP No. 11-26-14-036) to PCPC on November 26, 2014 granting PCPC to use Concepcion Bay as water source for its desalination plant. Thereafter, the CWP issued was superseded by NWRB as they issued a Water Permit to PCPC with No. 023707 on January 22, 2016. The Philippine Ports Authority (PPA) granted a Permit to Construct with No. 2015-001 to PCPC on April 24, 2015 granting PCPC to construct a Private Non-commercial port in Barangay Nipa, Concepcion, Iloilo. PPA, then, issued a Certificate of Registration/Permit to Operate (No.491) to PCPC effective February 29, 2016. Personnel complement of the Brown Group of Companies as of December 31, 2015 is presented below. As to position:
Positions No. of PersonnelSenior Officers 5Managers 23Supervisors 39Rank and File 132Total 199
As to function:
Functions No. of PersonnelOperations 87Sales and Marketing 16Accounting/Credit and Collection/fFinance 30Administration 65Other 1Total 199
The Company expects to increase its number of employees in the next 12 months. Risks A Brown Co., Inc. and its subsidiaries are exposed to financial, operational and administrative risks which are normal in the course of the business, depending on the business industry sector where each of the subsidiaries operate. It is subject to significant competition in each of its principal businesses. ABCI competes with other developers and developments to attract lot buyers and customers for its hotel and palm oil operation. Other risks that the company may be exposed to are the following: changes in Philippine interest rates, changes in the value of the Peso, changes in construction material and labor costs, power rates and other costs, changes in laws and regulations that apply to the Philippine real estate industry and changes in the country’s political and economic conditions. Please refer to Note 32 of the Notes to the Audited Consolidated Financial Statements for the discussion on Financial Risk Management and Policies. The Company and its subsidiaries have formed board committees composed by their respective directors to mitigate if not to avoid these risks. The Audit Committee and Risk Committee in cooperation with the Company’s external and internal auditors exercise the oversight role in managing these risks. It also manages the financial and business risks in accordance with the
81
company’s risk profile and risk culture to strengthen the company’s position when faced with these risks. Even larger economies are confronted with downside risk on its credit ratings. The US government has lost its sterling credit rating from Standard & Poor’s AAA rating to AA+ in August 2011 for the first time since granting it in 1917. The move came less than a week after a gridlocked Congress finally agreed to spending cuts that would reduce the debt by more than $2 trillion – a tumultuous process that contributed to convulsions in financial markets. Other sovereignties have also been feared to default on its obligations. Global financial crisis if not contained will have a ripple effect to other volatile economies as investors lost confidence and hold back investment. In recent years, the country enjoys an unprecedented level of confidence among international business community and has improved its global competitiveness rankings. It has received an investment grade and stable outlook on its long-term sovereign credit ratings among the three major credit ratings agencies. The improvement of credit ratings will provide a lower cost of capital on its borrowings. In spite of opportunities, downside risks to growth exist with the presence of external and domestic shocks. The slowdown in large emerging economies, weakness in the Euro area, recession in Japan and conflicts in Middle East are some of the external forces that would pull growth opportunities down. Disasters arising from natural hazards, delays in infrastructure and reconstruction projects, logistics bottlenecks and thin power reserves are perceived to be internal forces that will hamper growth. Philippine housing market did face a slight slowdown as consumers are force to hold off property purchases. The Asian property market felt the heat of the global recession, too. It is expected though that the country will be able to weather a global economic slowdown for as long as the fiscal reforms are sustained. Regulatory agencies are also key partners in combating financial crisis through continued vigilance in their examination of compliance to rules and regulations, pro-active in implementing economic programs to sustain pump-priming activities and responsive to the needs of time like the implementation of economic bail-out plan in order to curtail the systemic effect of sectoral crisis trickling down to the whole economy that will affect all local business sectors. Bangko Sentral ng Pilipinas in particular should remain steadfast in its mandate to maintain effective financial system and institute preventive and corrective measures to alleviate the ill-effects of the startling financial difficulty i.e. credit crunch resulting to home foreclosures that became the housing crisis which will ultimately affect the whole economy if not resolved in immediacy. The government should also have the capacity to fix and clean-up the mess that scandals and accusations of graft and corruption within the bureaucracy to encourage and boast foreign and domestic investors’ confidence. Although this may have an indirect impact on the company’s growth but if the economic slowdown will set in, inevitably this will weaken the business volume, revenue and profits. It may affect the Company’s business activity – low demand, higher interest rates and stiff competition. The company is also subject to risks inherent in real estate development. There is a risk that financing for development may not be available on favourable terms; that construction may not be completed on schedule or within budget due to shortages of materials, work stoppages due to unfavourable weather conditions, unforeseen engineering, environmental and geological problems and unanticipated cost increases; that new governmental regulations including changes in building and planning regulations and delays to obtain requisite construction and occupancy permits; and developed properties may not be leased or sold in profitable terms and the risk of purchaser and/or tenant defaults. On the other hand, there are also factors that expose the Plantation and Nursery to risks. These are the peace and order condition of the plantation sites, infestation of pests and diseases and farm to market road (provincial and barangay roads). Generally, the peace and order situation in the plantation area is stable. Coordination for security is made with the cooperation from the local
82
government. Weather disturbance which causes landslides making the roads impassable also delay transporting the seedlings and fertilizers. The company implements measures to assuage these risks such as i) strict adherence to sound nursery management practices such as source the seedlings only from reputable suppliers, hire a pathologist who is an expert on quarantine diseases, proper planning and land preparation for the nursery and plantation prior to ordering the germinated seeds; ii) conduct daily routine inspection following the steps of the Bureau of Plant and Industry. Risk factors for the mill business are as follows: i) breakdown of one major equipment such as steam boiler, turbo-alternator and/or fruit digester will paralyze the operation for days, weeks or months; ii) non-adherence to environmental restrictions may cause plant closure or work stoppage; iii) unplanned breakdown of High Power Boiler equipment for Refinery and Chiller for Fractionation can cause to cease operation. Research and Development The company is currently doing market studies for a possible expansion of its palm oil plantation and possible projects related to energy and power. The company does not expect to conduct any significant product research and development in the foreseeable future other than related to its existing operations. Item 2. PROPERTIES Real properties owned by A Brown Company, Inc. and its subsidiaries are shown on Exhibit IIa, IIb and IIc, page 80-83. Most of the properties were already transferred under ABCI’s name. The merger of ABCI and several of its subsidiaries in December 1999 and June 2002 as mentioned in Item 1 of Part 1, has caused the inclusion of properties under East Pacific Investors Corp. (EPIC), but legally, the owner is already ABCI. For properties with individual names indicated, the documentation on the transfer of ownership is still on process. Some real properties were on lease with contracts providing for renewal options subject to mutual agreement of the parties. Rental rates are based on prevailing market rates for the said properties. Other real properties that the Company intends to acquire are still under review depending on the factor/s such as demographics and accessibility to public transport. ABCI’s preferred mode of acquisition would be thru purchase or joint ventures with landowners. It continues to assess its landholdings to identify properties which no longer fit its overall business strategy and hence, can be disposed of.
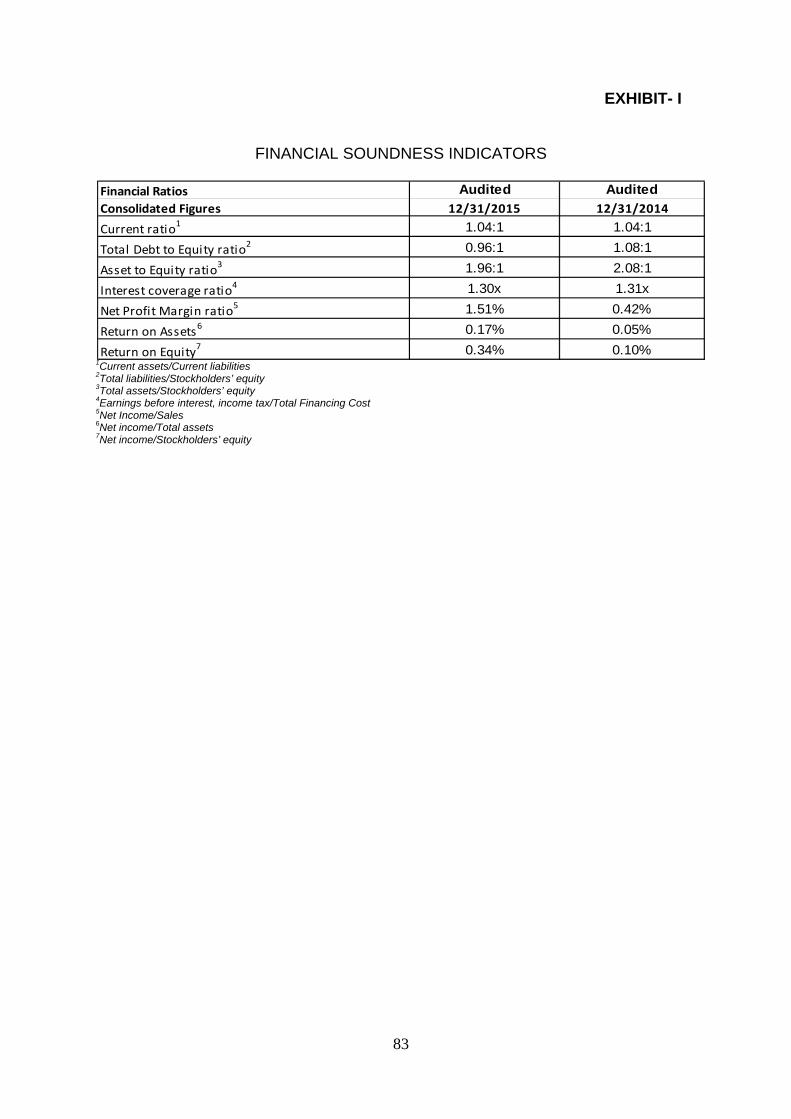
83
EXHIBIT- I
FINANCIAL SOUNDNESS INDICATORS
Financial Ratios Audited AuditedConsolidated Figures 12/31/2015 12/31/2014Current ratio1 1.04:1 1.04:1
Total Debt to Equity ratio2 0.96:1 1.08:1
Asset to Equity ratio3 1.96:1 2.08:1
Interest coverage ratio4 1.30x 1.31x
Net Profit Margin ratio5 1.51% 0.42%
Return on Assets6 0.17% 0.05%
Return on Equity7 0.34% 0.10% 1Current assets/Current liabilities 2Total liabilities/Stockholders’ equity 3Total assets/Stockholders’ equity 4Earnings before interest, income tax/Total Financing Cost 5Net Income/Sales 6Net income/Total assets 7Net income/Stockholders’ equity

84
EXHIBIT- II
LIST OF ACCREDITED SUPPLIERS (TOP 20) – ABCI FOR THE YEAR 2015
SUPPLIERS NAME
AVP Trading & ConstructionBME Partners, Inc.Carmen Lumber TradingDataworld Computer CenterDavao Citi Hardware (BULUA)De Oro Pacific Home Plus Corp. (BULUA)Desmark CorporationGoldtown Industrial Sales CorporationGTS Construction Supply & Dev't. Corp.Holcim Philippines, Inc.Isalama Industries Inc..Microtrade GCM CorporationMie Oro Plast CorporationMindanao Ace MarketingMonark Equipment CorporationOro Mighty EnterprisesOro Solid Hardware, Inc.Sharp Electrical Supply, Inc.Transway Sales CorporationUP Marketing
ADDRESS
Baloy, Cagayan de Oro CityDoor #7, GSC/RA Bldg., Gusa Hi-way, Cagayan de Oro CityVamenta Blvd, Carmen, Cagayan de Oro City#49 Don Tirso Neri St., Cagayan de Oro CityZone 1 Bulua, Cagayan de Oro CityNear Jetti Gas Station, Bulua Branch, CDO CityCapt. Vicente Roa St., Cagayan de Oro CityPres. S. Osmeña Sr. St., Cagayan de Oro CityCorrales Ext., Cagayan de Oro CityLugait, Misamis Oriental229 Pres. Sergio Osmeña St., Cagayan de Oro City092 /F ICS Bldg., Tiano-Montalvan Sts., Cagayan de Oro City#68 J.V Serina St., Zone 6 Carmen, Cagayan de Oro City
#11 Lapasan Highway, Cagayan de Oro City
MAM Bldg. Don S. Osmeña St., Cagayan de Oro CityKm. 3 Kauswagan Nat'l Hi-way, Cagayan de Oro City#196 Corrales Avenue, Cagayan de Oro CityDon S. Osmeña St., Cagayan de Oro City#6 Osmeña St., Cagayan de Oro CityKm. 3 Kauswagan Nat'l Hi-way, Cagayan de Oro City
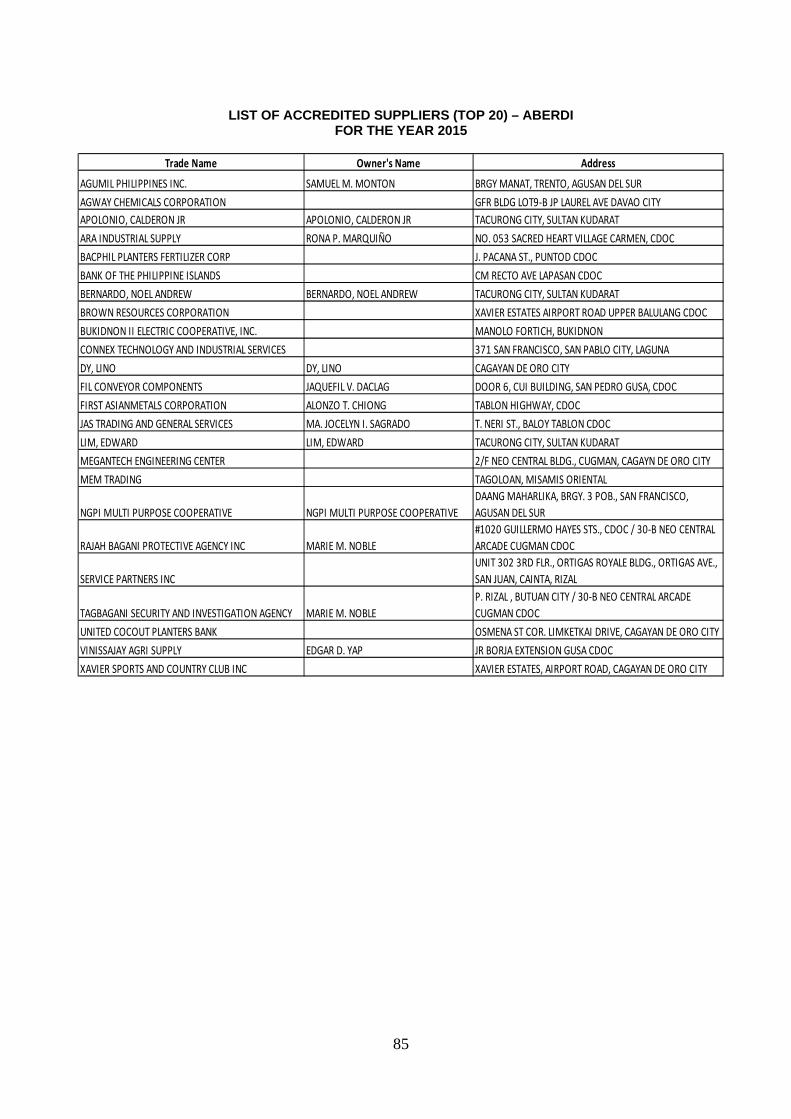
85
LIST OF ACCREDITED SUPPLIERS (TOP 20) – ABERDI
FOR THE YEAR 2015
Trade Name Owner's Name Address
AGUMIL PHILIPPINES INC. SAMUEL M. MONTON BRGY MANAT, TRENTO, AGUSAN DEL SURAGWAY CHEMICALS CORPORATION GFR BLDG LOT9‐B JP LAUREL AVE DAVAO CITYAPOLONIO, CALDERON JR APOLONIO, CALDERON JR TACURONG CITY, SULTAN KUDARATARA INDUSTRIAL SUPPLY RONA P. MARQUIÑO NO. 053 SACRED HEART VILLAGE CARMEN, CDOCBACPHIL PLANTERS FERTILIZER CORP J. PACANA ST., PUNTOD CDOCBANK OF THE PHILIPPINE ISLANDS CM RECTO AVE LAPASAN CDOCBERNARDO, NOEL ANDREW BERNARDO, NOEL ANDREW TACURONG CITY, SULTAN KUDARATBROWN RESOURCES CORPORATION XAVIER ESTATES AIRPORT ROAD UPPER BALULANG CDOCBUKIDNON II ELECTRIC COOPERATIVE, INC. MANOLO FORTICH, BUKIDNONCONNEX TECHNOLOGY AND INDUSTRIAL SERVICES 371 SAN FRANCISCO, SAN PABLO CITY, LAGUNA DY, LINO DY, LINO CAGAYAN DE ORO CITYFIL CONVEYOR COMPONENTS JAQUEFIL V. DACLAG DOOR 6, CUI BUILDING, SAN PEDRO GUSA, CDOCFIRST ASIANMETALS CORPORATION ALONZO T. CHIONG TABLON HIGHWAY, CDOCJAS TRADING AND GENERAL SERVICES MA. JOCELYN I. SAGRADO T. NERI ST., BALOY TABLON CDOCLIM, EDWARD LIM, EDWARD TACURONG CITY, SULTAN KUDARATMEGANTECH ENGINEERING CENTER 2/F NEO CENTRAL BLDG., CUGMAN, CAGAYN DE ORO CITYMEM TRADING TAGOLOAN, MISAMIS ORIENTAL
NGPI MULTI PURPOSE COOPERATIVE NGPI MULTI PURPOSE COOPERATIVEDAANG MAHARLIKA, BRGY. 3 POB., SAN FRANCISCO, AGUSAN DEL SUR
RAJAH BAGANI PROTECTIVE AGENCY INC MARIE M. NOBLE#1020 GUILLERMO HAYES STS., CDOC / 30‐B NEO CENTRAL ARCADE CUGMAN CDOC
SERVICE PARTNERS INCUNIT 302 3RD FLR., ORTIGAS ROYALE BLDG., ORTIGAS AVE., SAN JUAN, CAINTA, RIZAL
TAGBAGANI SECURITY AND INVESTIGATION AGENCY MARIE M. NOBLEP. RIZAL , BUTUAN CITY / 30‐B NEO CENTRAL ARCADE CUGMAN CDOC
UNITED COCOUT PLANTERS BANK OSMENA ST COR. LIMKETKAI DRIVE, CAGAYAN DE ORO CITYVINISSAJAY AGRI SUPPLY EDGAR D. YAP JR BORJA EXTENSION GUSA CDOCXAVIER SPORTS AND COUNTRY CLUB INC XAVIER ESTATES, AIRPORT ROAD, CAGAYAN DE ORO CITY
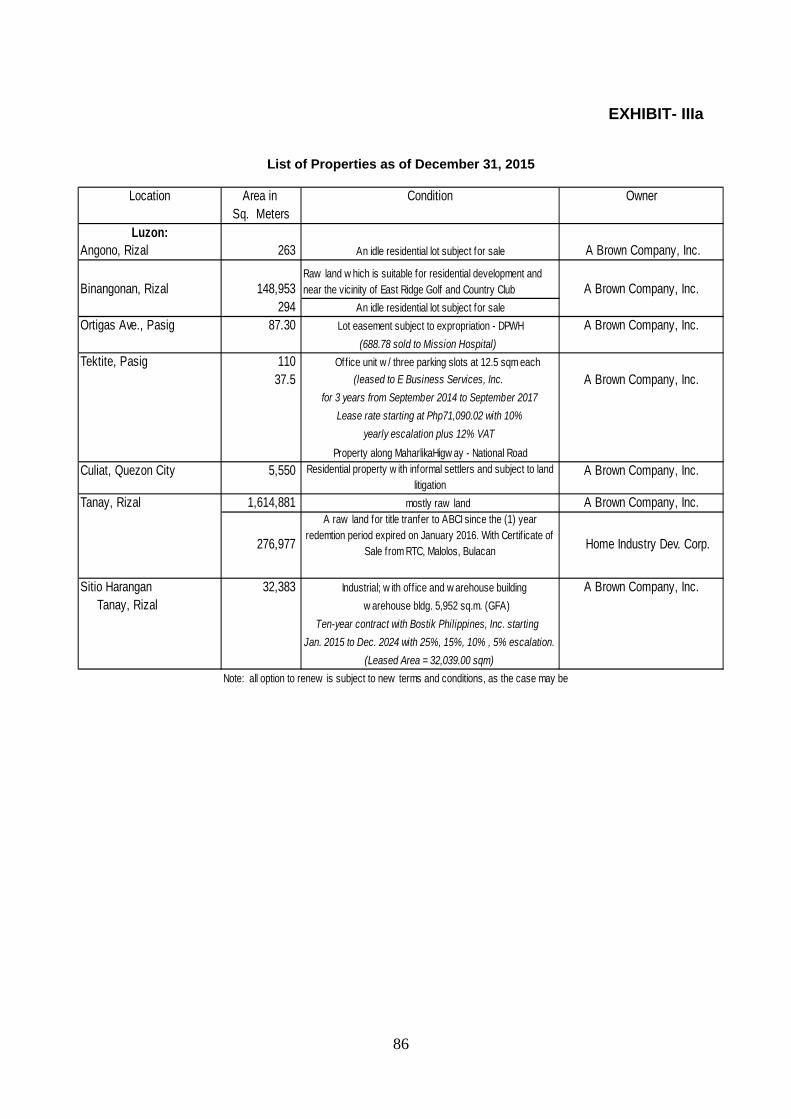
86
EXHIBIT- IIIa
List of Properties as of December 31, 2015
Location Area in Condition OwnerSq. Meters
Luzon:Angono, Rizal 263 An idle residential lot subject for sale A Brown Company, Inc.
Binangonan, Rizal 148,953 Raw land w hich is suitable for residential development and near the vicinity of East Ridge Golf and Country Club A Brown Company, Inc.
294 An idle residential lot subject for saleOrtigas Ave., Pasig 87.30 Lot easement subject to expropriation - DPWH A Brown Company, Inc.
(688.78 sold to Mission Hospital) Tektite, Pasig 110 Off ice unit w / three parking slots at 12.5 sqm each
37.5 (leased to E Business Services, Inc. A Brown Company, Inc.for 3 years from September 2014 to September 2017
Lease rate starting at Php71,090.02 with 10%yearly escalation plus 12% VAT
Property along MaharlikaHigw ay - National RoadCuliat, Quezon City 5,550 Residential property w ith informal settlers and subject to land
litigationA Brown Company, Inc.
Tanay, Rizal 1,614,881 mostly raw land A Brown Company, Inc.A raw land for title tranfer to ABCI since the (1) year
redemtion period expired on January 2016. With Certif icate of Sale from RTC, Malolos, Bulacan
Sitio Harangan 32,383 Industrial; w ith off ice and w arehouse building A Brown Company, Inc. Tanay, Rizal w arehouse bldg. 5,952 sq.m. (GFA)
Ten-year contract with Bostik Philippines, Inc. starting Jan. 2015 to Dec. 2024 with 25%, 15%, 10% , 5% escalation.
(Leased Area = 32,039.00 sqm)Note: all option to renew is subject to new terms and conditions, as the case may be
276,977 Home Industry Dev. Corp.
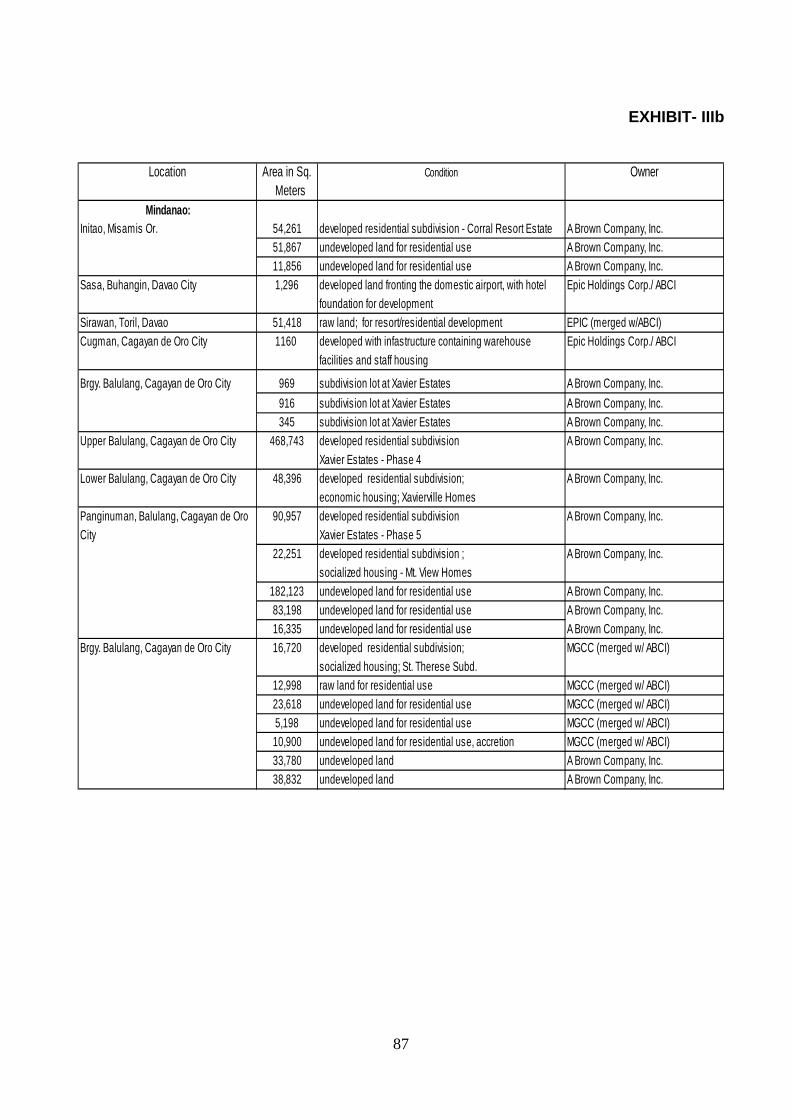
87
EXHIBIT- IIIb
Location Area in Sq. Condition Owner Meters
Mindanao: Initao, Misamis Or. 54,261 developed residential subdivision - Corral Resort Estate A Brown Company, Inc.
51,867 undeveloped land for residential use A Brown Company, Inc. 11,856 undeveloped land for residential use A Brown Company, Inc.
Sasa, Buhangin, Davao City 1,296 developed land fronting the domestic airport, with hotel Epic Holdings Corp./ ABCIfoundation for development
Sirawan, Toril, Davao 51,418 raw land; for resort/residential development EPIC (merged w/ABCI)Cugman, Cagayan de Oro City 1160 developed with infastructure containing warehouse Epic Holdings Corp./ ABCI
facilities and staff housing
Brgy. Balulang, Cagayan de Oro City 969 subdivision lot at Xavier Estates A Brown Company, Inc.916 subdivision lot at Xavier Estates A Brown Company, Inc.345 subdivision lot at Xavier Estates A Brown Company, Inc.
Upper Balulang, Cagayan de Oro City 468,743 developed residential subdivision A Brown Company, Inc. Xavier Estates - Phase 4
Lower Balulang, Cagayan de Oro City 48,396 developed residential subdivision; A Brown Company, Inc.economic housing; Xavierville Homes
Panginuman, Balulang, Cagayan de Oro 90,957 developed residential subdivision A Brown Company, Inc.City Xavier Estates - Phase 5
22,251 developed residential subdivision ; A Brown Company, Inc.socialized housing - Mt. View Homes
182,123 undeveloped land for residential use A Brown Company, Inc.83,198 undeveloped land for residential use A Brown Company, Inc.16,335 undeveloped land for residential use A Brown Company, Inc.
Brgy. Balulang, Cagayan de Oro City 16,720 developed residential subdivision; MGCC (merged w/ ABCI)socialized housing; St. Therese Subd.
12,998 raw land for residential use MGCC (merged w/ ABCI)23,618 undeveloped land for residential use MGCC (merged w/ ABCI)5,198 undeveloped land for residential use MGCC (merged w/ ABCI)10,900 undeveloped land for residential use, accretion MGCC (merged w/ ABCI)33,780 undeveloped land A Brown Company, Inc.38,832 undeveloped land A Brown Company, Inc.
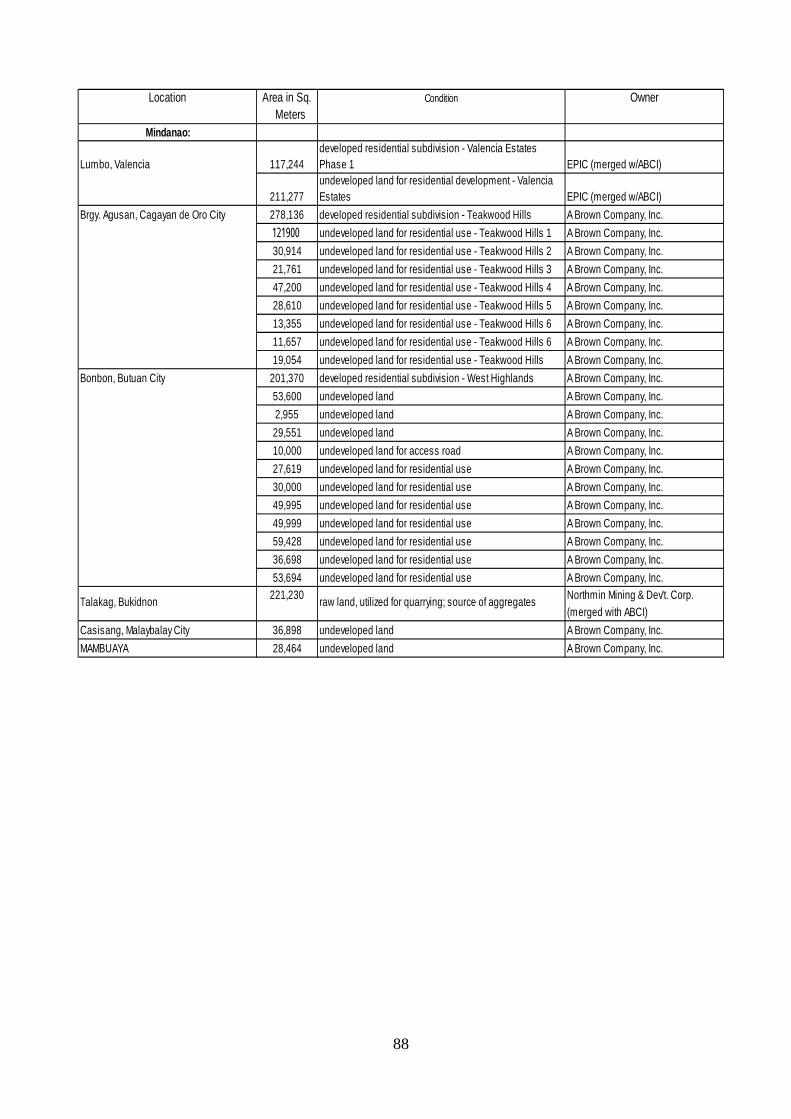
88
Location Area in Sq. Condition Owner Meters
Mindanao:
Lumbo, Valencia 117,244developed residential subdivision - Valencia Estates Phase 1 EPIC (merged w/ABCI)
211,277undeveloped land for residential development - Valencia Estates EPIC (merged w/ABCI)
Brgy. Agusan, Cagayan de Oro City 278,136 developed residential subdivision - Teakwood Hills A Brown Company, Inc.121900 undeveloped land for residential use - Teakwood Hills 1 A Brown Company, Inc.30,914 undeveloped land for residential use - Teakwood Hills 2 A Brown Company, Inc.21,761 undeveloped land for residential use - Teakwood Hills 3 A Brown Company, Inc.47,200 undeveloped land for residential use - Teakwood Hills 4 A Brown Company, Inc.28,610 undeveloped land for residential use - Teakwood Hills 5 A Brown Company, Inc.13,355 undeveloped land for residential use - Teakwood Hills 6 A Brown Company, Inc.11,657 undeveloped land for residential use - Teakwood Hills 6 A Brown Company, Inc.19,054 undeveloped land for residential use - Teakwood Hills A Brown Company, Inc.
Bonbon, Butuan City 201,370 developed residential subdivision - West Highlands A Brown Company, Inc.53,600 undeveloped land A Brown Company, Inc.2,955 undeveloped land A Brown Company, Inc.29,551 undeveloped land A Brown Company, Inc.10,000 undeveloped land for access road A Brown Company, Inc.27,619 undeveloped land for residential use A Brown Company, Inc.30,000 undeveloped land for residential use A Brown Company, Inc.49,995 undeveloped land for residential use A Brown Company, Inc.49,999 undeveloped land for residential use A Brown Company, Inc.59,428 undeveloped land for residential use A Brown Company, Inc.36,698 undeveloped land for residential use A Brown Company, Inc.53,694 undeveloped land for residential use A Brown Company, Inc.
221,230 Northmin Mining & Dev't. Corp.(merged with ABCI)
Casisang, Malaybalay City 36,898 undeveloped land A Brown Company, Inc.MAMBUAYA 28,464 undeveloped land A Brown Company, Inc.
Talakag, Bukidnon raw land, utilized for quarrying; source of aggregates
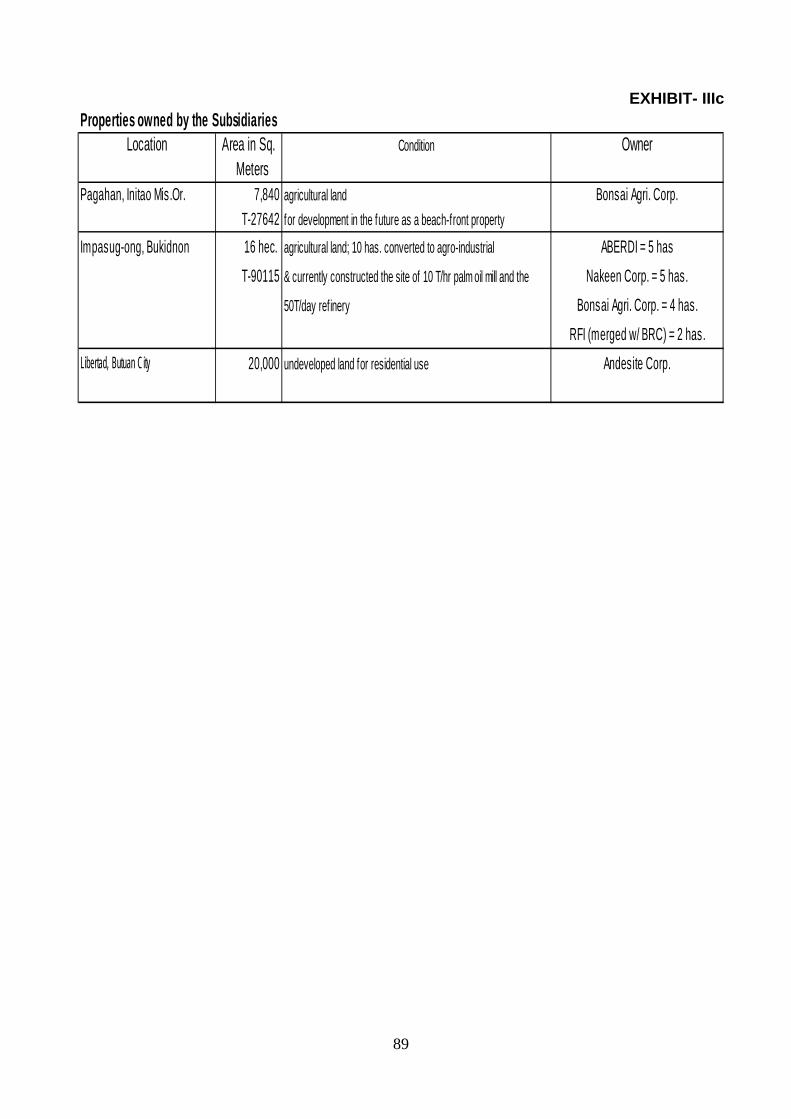
89
EXHIBIT- IIIc Properties owned by the Subsidiaries
Location Area in Sq. Condition Owner Meters
Pagahan, Initao Mis.Or. 7,840 agricultural land Bonsai Agri. Corp.T-27642 for development in the future as a beach-front property
Impasug-ong, Bukidnon 16 hec. agricultural land; 10 has. converted to agro-industrial ABERDI = 5 has
T-90115 & currently constructed the site of 10 T/hr palm oil mill and the Nakeen Corp. = 5 has.
50T/day refinery Bonsai Agri. Corp. = 4 has.
RFI (merged w/ BRC) = 2 has.Libertad, Butuan City 20,000 undeveloped land for residential use Andesite Corp.
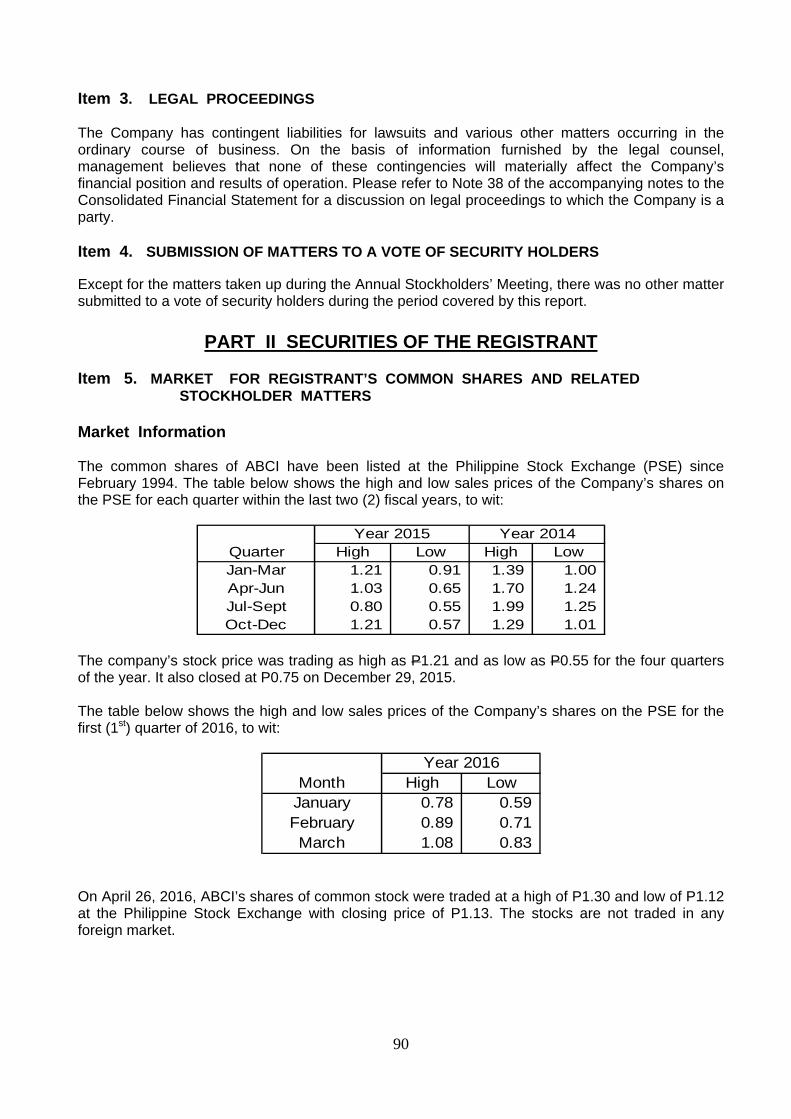
90
Item 3. LEGAL PROCEEDINGS
The Company has contingent liabilities for lawsuits and various other matters occurring in the ordinary course of business. On the basis of information furnished by the legal counsel, management believes that none of these contingencies will materially affect the Company’s financial position and results of operation. Please refer to Note 38 of the accompanying notes to the Consolidated Financial Statement for a discussion on legal proceedings to which the Company is a party.
Item 4. SUBMISSION OF MATTERS TO A VOTE OF SECURITY HOLDERS Except for the matters taken up during the Annual Stockholders’ Meeting, there was no other matter submitted to a vote of security holders during the period covered by this report.
PART II SECURITIES OF THE REGISTRANT
Item 5. MARKET FOR REGISTRANT’S COMMON SHARES AND RELATED STOCKHOLDER MATTERS Market Information The common shares of ABCI have been listed at the Philippine Stock Exchange (PSE) since February 1994. The table below shows the high and low sales prices of the Company’s shares on the PSE for each quarter within the last two (2) fiscal years, to wit:
Quarter High Low High LowJan-Mar 1.21 0.91 1.39 1.00 Apr-Jun 1.03 0.65 1.70 1.24 Jul-Sept 0.80 0.55 1.99 1.25 Oct-Dec 1.21 0.57 1.29 1.01
Year 2015 Year 2014
The company’s stock price was trading as high as P1.21 and as low as P0.55 for the four quarters of the year. It also closed at P0.75 on December 29, 2015. The table below shows the high and low sales prices of the Company’s shares on the PSE for the first (1st) quarter of 2016, to wit:
Month High LowJanuary 0.78 0.59 February 0.89 0.71 March 1.08 0.83
Year 2016
On April 26, 2016, ABCI’s shares of common stock were traded at a high of P1.30 and low of P1.12 at the Philippine Stock Exchange with closing price of P1.13. The stocks are not traded in any foreign market.
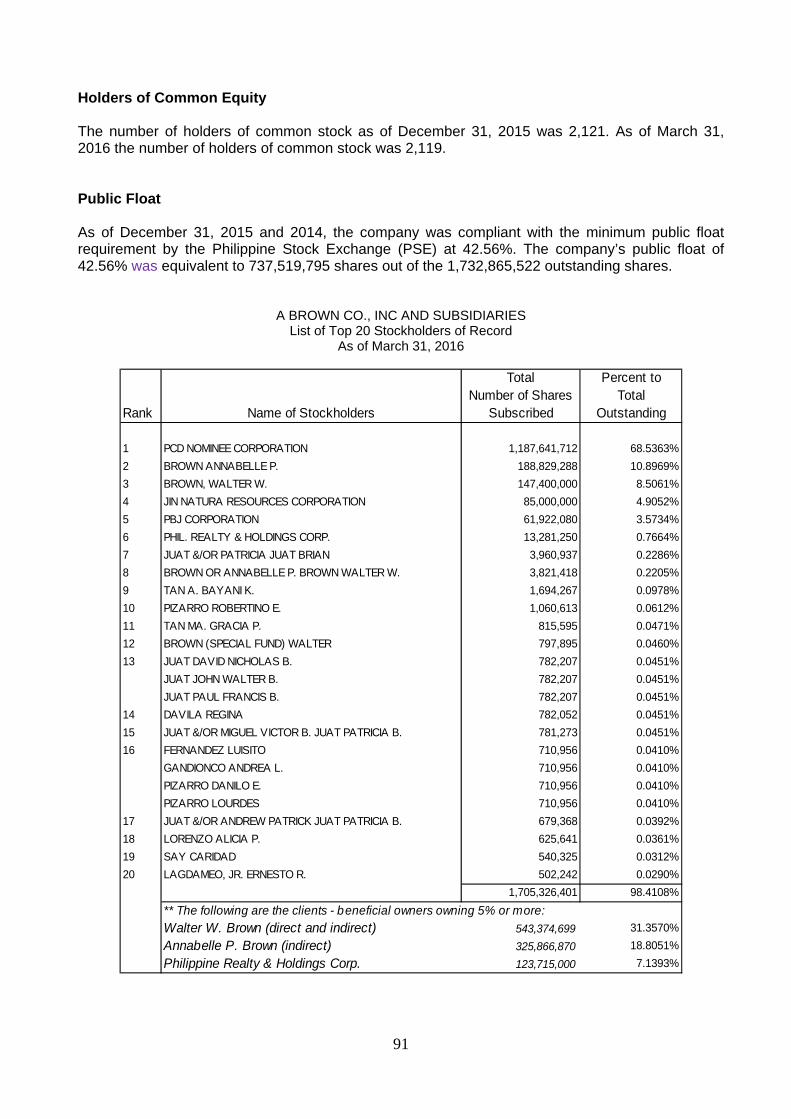
91
Holders of Common Equity The number of holders of common stock as of December 31, 2015 was 2,121. As of March 31, 2016 the number of holders of common stock was 2,119. Public Float As of December 31, 2015 and 2014, the company was compliant with the minimum public float requirement by the Philippine Stock Exchange (PSE) at 42.56%. The company’s public float of 42.56% was equivalent to 737,519,795 shares out of the 1,732,865,522 outstanding shares.
A BROWN CO., INC AND SUBSIDIARIES List of Top 20 Stockholders of Record
As of March 31, 2016
Total Percent toNumber of Shares Total
Rank Name of Stockholders Subscribed Outstanding
1 PCD NOMINEE CORPORATION 1,187,641,712 68.5363%2 BROWN ANNABELLE P. 188,829,288 10.8969%3 BROWN, WALTER W. 147,400,000 8.5061%4 JIN NATURA RESOURCES CORPORATION 85,000,000 4.9052%5 PBJ CORPORATION 61,922,080 3.5734%6 PHIL. REALTY & HOLDINGS CORP. 13,281,250 0.7664%7 JUAT &/OR PATRICIA JUAT BRIAN 3,960,937 0.2286%8 BROWN OR ANNABELLE P. BROWN WALTER W. 3,821,418 0.2205%9 TAN A. BAYANI K. 1,694,267 0.0978%10 PIZARRO ROBERTINO E. 1,060,613 0.0612%11 TAN MA. GRACIA P. 815,595 0.0471%12 BROWN (SPECIAL FUND) WALTER 797,895 0.0460%13 JUAT DAVID NICHOLAS B. 782,207 0.0451%
JUAT JOHN WALTER B. 782,207 0.0451%JUAT PAUL FRANCIS B. 782,207 0.0451%
14 DAVILA REGINA 782,052 0.0451%15 JUAT &/OR MIGUEL VICTOR B. JUAT PATRICIA B. 781,273 0.0451%16 FERNANDEZ LUISITO 710,956 0.0410%
GANDIONCO ANDREA L. 710,956 0.0410%PIZARRO DANILO E. 710,956 0.0410%PIZARRO LOURDES 710,956 0.0410%
17 JUAT &/OR ANDREW PATRICK JUAT PATRICIA B. 679,368 0.0392%18 LORENZO ALICIA P. 625,641 0.0361%19 SAY CARIDAD 540,325 0.0312%20 LAGDAMEO, JR. ERNESTO R. 502,242 0.0290%
1,705,326,401 98.4108%
Walter W. Brown (direct and indirect) 543,374,699 31.3570%Annabelle P. Brown (indirect) 325,866,870 18.8051%Philippine Realty & Holdings Corp. 123,715,000 7.1393%
** The following are the clients - beneficial owners owning 5% or more:
92
Dividend A Php 0.05 cash dividend was declared by the Company for the year 2006 and was given to stockholders of record as at the close of business on January 15, 2007 and paid on February 8, 2007. The previous declaration was on June 1998 where a 10% stock dividend was given to stockholders of record as at the close of business on July 17, 1998. On July 9, 2010, the BOD of the Parent Company resolved to declare a cash dividend equal to Php .20/share to shareholders of record as of August 6, 2010 payable on August 30, 2010. On August 18, 2010, the Parent Company’s Board of Directors has approved the declaration of a total 63,120,433 of the Parent’s treasury shares as property dividends. After the regulatory examination of the Securities and Exchange Commission (SEC), the Parent Company was directed on October 4, 2010 to set the record date. The Parent Company’s Board of Directors has set November 3, 2010 as the record date for the determination of Company’s shareholders entitled to receive the property dividend. Shareholders as of the record date owning sixteen (16) shares shall be entitled to one (1) BRN treasury share. No fractional shares shall be issued. The Company was expected to complete the distribution of the property dividends by November 29, 2010. The Board of Directors approved the 25% stock dividend equivalent to 346,573,307 shares on June 7, 2013. The record date was set on September 12, 2013 after the approval by the Securities and Exchange Commission of the Corporation’s increase of its authorized capital stock from which the stock dividends were to be issued. The Corporation was to issue the said stock dividend shares on or before October 8, 2013. On November 27, 2013, the company notified the investing public of the publication in a newspaper of general circulation of the Notice that the cash dividends which remain long outstanding will be reverted to the corporation after thirty (30) days from publication. The said Notice was published in Manila Bulletin on November 28, 2013. There was no dividend declaration in 2015. Dividend policy: Dividends are declared by the Company on its shares of stocks and are payable in cash or in additional shares of stock. The declaration and payment of dividends in the future will depend upon the earnings, cash flow and financial condition of the Company and other factors affecting the availability of unrestricted retained earnings, as prescribed under the Corporation Code. Dividend declaration must also take into account the Company’s capital expenditure and project requirements and settlement of its credit. Cash and property dividends are subject to approval by the Company’s Board of Directors while stock dividends require the approval of both the Company’s Board of Directors and Stockholders. In addition, the payment of stock dividends is likewise subject to the approval of the SEC and PSE, if shares are to be listed with the Exchange. Other than the restrictions imposed by the Corporation Code of the Philippines, there is no other restriction that limits the Company’s ability to pay dividends on common equity. Recent Sales of Unregistered Securities or Exempt Securities, Including Recent Issuance of Securities Constituting an Exempt Transaction The Board of Directors approved on October 5, 2012 the private placement of Two Hundred Fifty Million shares (250,000,000) of its listed common shares (“the Placement Tranche”) consisting of: Treasury Shares ---------- 173,633,704 common shares Walter W. Brown Shares ---------- 76,366,296 common shares
93
Each of the Placement Tranche shares has a par value of One Peso (P 1.00) per share and was sold at a price of Two Pesos and 89/100 (P 2.89) per share and was crossed in the Exchange on October 8, 2012. The Board likewise approved the issuance of an equal number of new shares of the Corporation (“the Subscription Tranche”), at an issue price equal to the net proceeds per share in favor of Dr. Walter W. Brown, the seller of the Placement Tranche and subscriber of the Subscription Tranche (the “Top-up Placement”). The Subscription Tranche was issued out of an increase in the Corporation’s authorized capital stock from the present One Billion Three Hundred Twenty Million Pesos (P1,320,000,000.00) to One Billion Six Hundred Twenty Million Pesos (P1,620,000,000.00) which increase was approved by the Corporation’s Board of Directors on 02 May 2012 and by the Shareholders on 01 June 2012. The Subscription Tranche constituted Five and 51/100 Percent (5.5087%) of the Corporation’s issued and outstanding capital stock after the completion of the Top-Up Placement. On February 1, 2013, the Company filed to the Philippine Stock Exchange the listing application of the said shares. The Corporation did not directly receive the proceeds from the sale of the Top Up Shares, but the Facilitating Stockholder has agreed to subscribe for, and the Corporation agreed to issue, new shares in an amount equal to the aggregate number of shares sold by the Facilitating Stockholder, at a subscription price equal to the net proceeds per share. The proceeds received by the Corporation from the sale of the treasury shares held by it, as well as from the subscription of the Facilitating Stockholder will be used by the Corporation to form part of its working capital as well as for investment in its present and future projects. The Top Up Shares (Placement Tranche) were offered and sold in the Philippines pursuant to the exemption under Section 10.1(k) & (l) of the Securities Regulation Code. The Top-up shares (Subscription Tranche) were subscribed by the Facilitating Stockholder and issued pursuant to the exemption under Section 10.1 (k) of the Securities Regulation Code. The SEC approved the Amended Articles of Incorporation on December 28, 2012. Subsequently, the Company has issued the 76,366,296 shares (Subscription Tranche) to Walter W. Brown. There was no sale of unregistered securities by the registrant during the past three years except as discussed above.
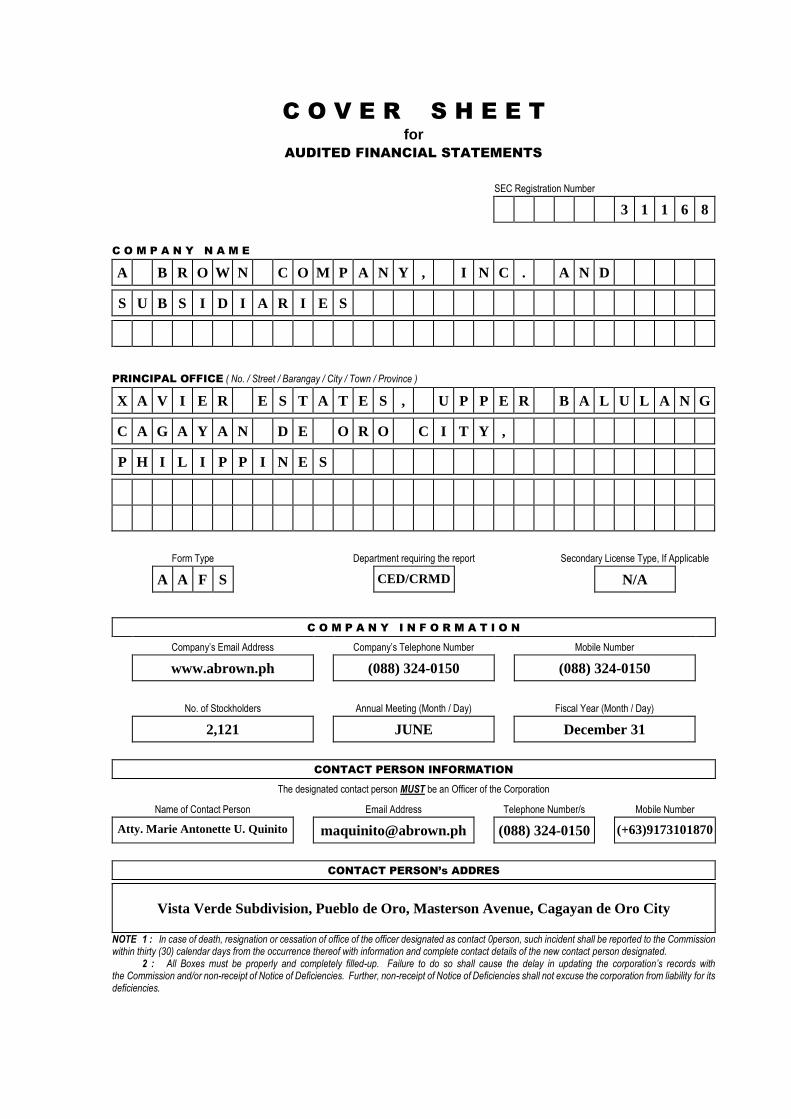
C O V E R S H E E T
for
AUDITED FINANCIAL STATEMENTS
SEC Registration Number
3 1 1 6 8
C O M P A N Y N A M E
A B R O W N C O M P A N Y , I N C . A N D
S U B S I D I A R I E S
PRINCIPAL OFFICE ( No. / Street / Barangay / City / Town / Province )
X A V I E R E S T A T E S , U P P E R B A L U L A N G
C A G A Y A N D E O R O C I T Y ,
P H I L I P P I N E S
Form Type Department requiring the report Secondary License Type, If Applicable
A A F S CED/CRMD N/A
C O M P A N Y I N F O R M A T I O N
Company’s Email Address Company’s Telephone Number Mobile Number
www.abrown.ph (088) 324-0150 (088) 324-0150
No. of Stockholders Annual Meeting (Month / Day) Fiscal Year (Month / Day)
2,121 JUNE December 31
CONTACT PERSON INFORMATION
The designated contact person MUST be an Officer of the Corporation
Name of Contact Person Email Address Telephone Number/s Mobile Number
Atty. Marie Antonette U. Quinito [email protected] (088) 324-0150 (+63)9173101870
CONTACT PERSON’s ADDRES
Vista Verde Subdivision, Pueblo de Oro, Masterson Avenue, Cagayan de Oro City
NOTE 1 : In case of death, resignation or cessation of office of the officer designated as contact 0person, such incident shall be reported to the Commission within thirty (30) calendar days from the occurrence thereof with information and complete contact details of the new contact person designated. 2 : All Boxes must be properly and completely filled-up. Failure to do so shall cause the delay in updating the corporation’s records with the Commission and/or non-receipt of Notice of Deficiencies. Further, non-receipt of Notice of Deficiencies shall not excuse the corporation from liability for its deficiencies.

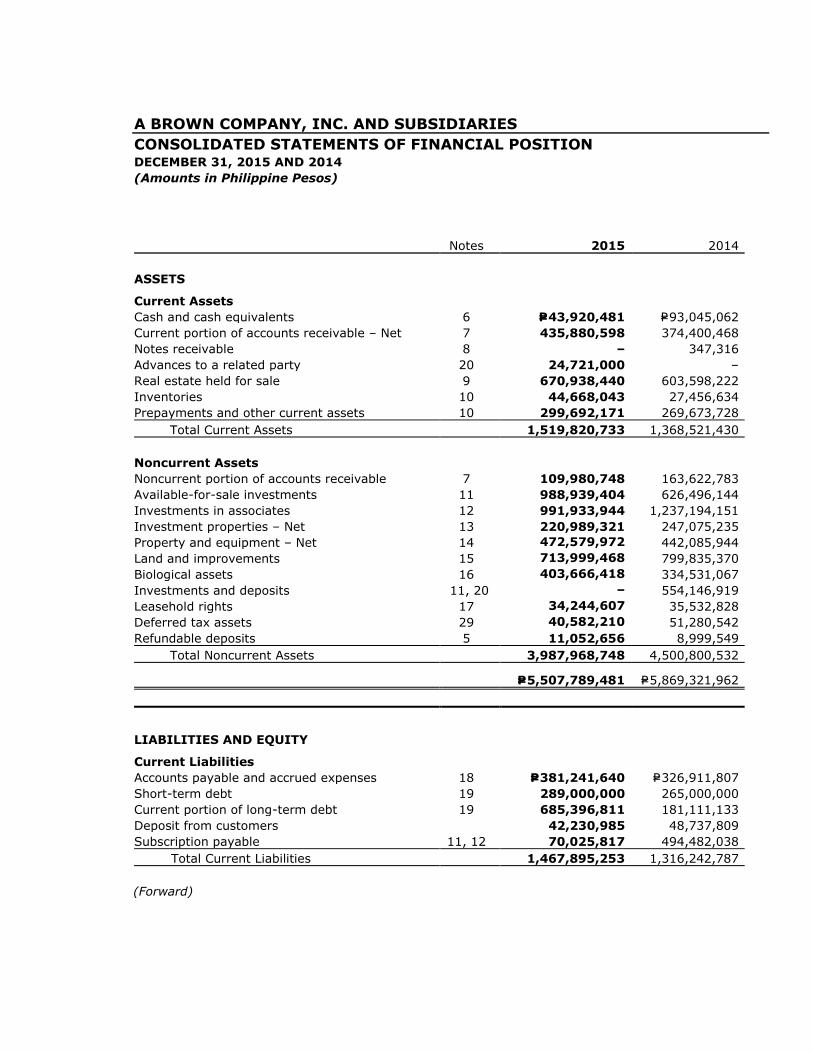
A BROWN COMPANY, INC. AND SUBSIDIARIES
CONSOLIDATED STATEMENTS OF FINANCIAL POSITION DECEMBER 31, 2015 AND 2014
(Amounts in Philippine Pesos)
Notes 2015 2014
ASSETS
Current Assets
Cash and cash equivalents 6 P=43,920,481 P=93,045,062
Current portion of accounts receivable – Net 7 435,880,598 374,400,468
Notes receivable 8 – 347,316
Advances to a related party 20 24,721,000 –
Real estate held for sale 9 670,938,440 603,598,222
Inventories 10 44,668,043 27,456,634
Prepayments and other current assets 10 299,692,171 269,673,728
Total Current Assets 1,519,820,733 1,368,521,430
Noncurrent Assets
Noncurrent portion of accounts receivable 7 109,980,748 163,622,783
Available-for-sale investments 11 988,939,404 626,496,144
Investments in associates 12 991,933,944 1,237,194,151
Investment properties – Net 13 220,989,321 247,075,235
Property and equipment – Net 14 472,579,972 442,085,944
Land and improvements 15 713,999,468 799,835,370
Biological assets 16 403,666,418 334,531,067
Investments and deposits 11, 20 – 554,146,919
Leasehold rights 17 34,244,607 35,532,828
Deferred tax assets 29 40,582,210 51,280,542
Refundable deposits 5 11,052,656 8,999,549
Total Noncurrent Assets 3,987,968,748 4,500,800,532
P=5,507,789,481 P=5,869,321,962
LIABILITIES AND EQUITY
Current Liabilities
Accounts payable and accrued expenses 18 P=381,241,640 P=326,911,807
Short-term debt 19 289,000,000 265,000,000
Current portion of long-term debt 19 685,396,811 181,111,133
Deposit from customers 42,230,985 48,737,809
Subscription payable 11, 12 70,025,817 494,482,038
Total Current Liabilities 1,467,895,253 1,316,242,787
(Forward)
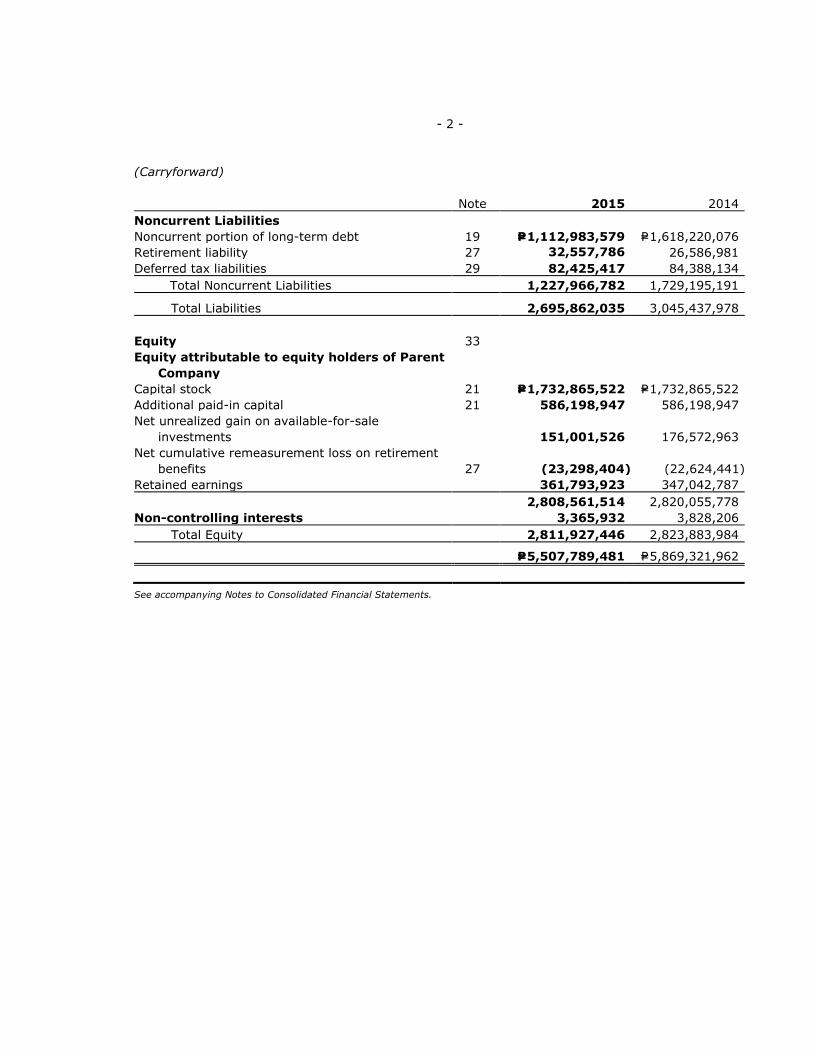
- 2 -
(Carryforward)
Note 2015 2014
Noncurrent Liabilities
Noncurrent portion of long-term debt 19 P=1,112,983,579 P=1,618,220,076
Retirement liability 27 32,557,786 26,586,981
Deferred tax liabilities 29 82,425,417 84,388,134
Total Noncurrent Liabilities 1,227,966,782 1,729,195,191
Total Liabilities 2,695,862,035 3,045,437,978
Equity 33
Equity attributable to equity holders of Parent
Company
Capital stock 21 P=1,732,865,522 P=1,732,865,522
Additional paid-in capital 21 586,198,947 586,198,947
Net unrealized gain on available-for-sale
investments 151,001,526 176,572,963
Net cumulative remeasurement loss on retirement
benefits 27 (23,298,404) (22,624,441)
Retained earnings 361,793,923 347,042,787
2,808,561,514 2,820,055,778
Non-controlling interests 3,365,932 3,828,206
Total Equity 2,811,927,446 2,823,883,984
P=5,507,789,481 P=5,869,321,962
See accompanying Notes to Consolidated Financial Statements.
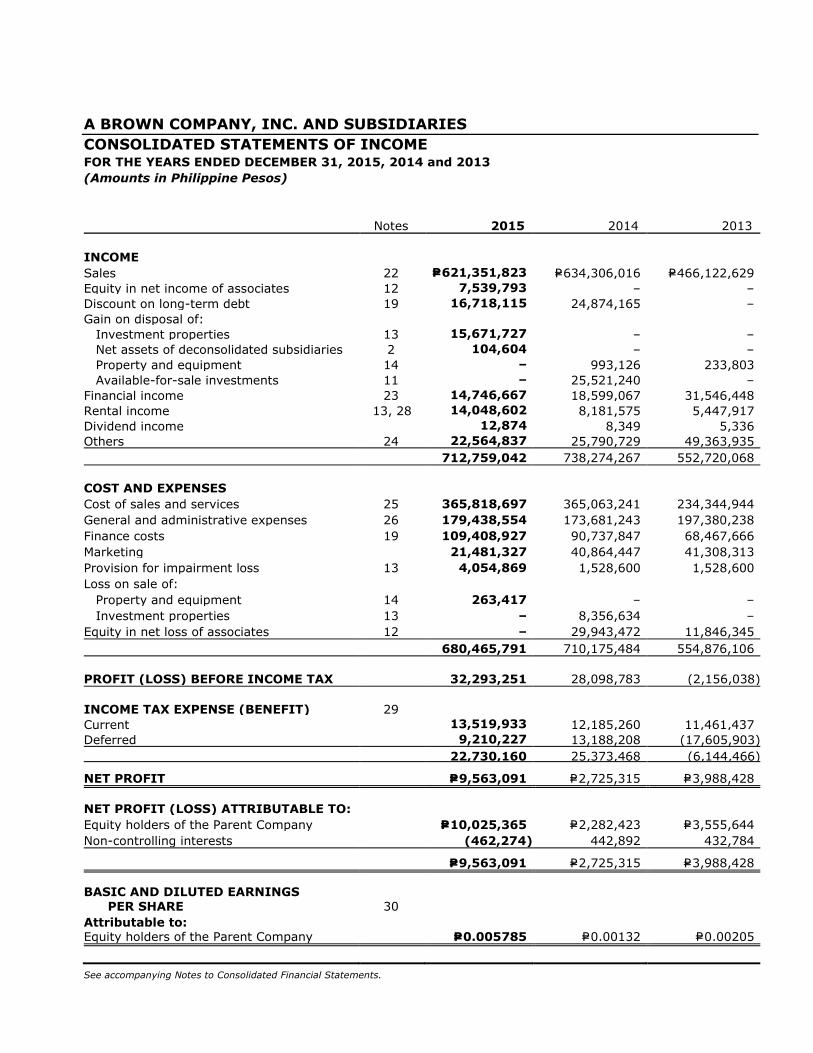
A BROWN COMPANY, INC. AND SUBSIDIARIES
CONSOLIDATED STATEMENTS OF INCOME FOR THE YEARS ENDED DECEMBER 31, 2015, 2014 and 2013
(Amounts in Philippine Pesos)
Notes 2015 2014 2013
INCOME
Sales 22 P=621,351,823 P=634,306,016 P=466,122,629
Equity in net income of associates 12 7,539,793 – –
Discount on long-term debt 19 16,718,115 24,874,165 –
Gain on disposal of:
Investment properties 13 15,671,727 – –
Net assets of deconsolidated subsidiaries 2 104,604 – –
Property and equipment 14 – 993,126 233,803
Available-for-sale investments 11 – 25,521,240 –
Financial income 23 14,746,667 18,599,067 31,546,448
Rental income 13, 28 14,048,602 8,181,575 5,447,917
Dividend income 12,874 8,349 5,336
Others 24 22,564,837 25,790,729 49,363,935
712,759,042 738,274,267 552,720,068
COST AND EXPENSES
Cost of sales and services 25 365,818,697 365,063,241 234,344,944
General and administrative expenses 26 179,438,554 173,681,243 197,380,238
Finance costs 19 109,408,927 90,737,847 68,467,666
Marketing 21,481,327 40,864,447 41,308,313
Provision for impairment loss 13 4,054,869 1,528,600 1,528,600
Loss on sale of:
Property and equipment 14 263,417 – –
Investment properties 13 – 8,356,634 –
Equity in net loss of associates 12 – 29,943,472 11,846,345
680,465,791 710,175,484 554,876,106
PROFIT (LOSS) BEFORE INCOME TAX 32,293,251 28,098,783 (2,156,038)
INCOME TAX EXPENSE (BENEFIT) 29
Current 13,519,933 12,185,260 11,461,437
Deferred 9,210,227 13,188,208 (17,605,903)
22,730,160 25,373,468 (6,144,466)
NET PROFIT P=9,563,091 P=2,725,315 P=3,988,428
NET PROFIT (LOSS) ATTRIBUTABLE TO:
Equity holders of the Parent Company P=10,025,365 P=2,282,423 P=3,555,644
Non-controlling interests (462,274) 442,892 432,784
P=9,563,091 P=2,725,315 P=3,988,428
BASIC AND DILUTED EARNINGS
PER SHARE 30
Attributable to: Equity holders of the Parent Company P=0.005785 P=0.00132 P=0.00205
See accompanying Notes to Consolidated Financial Statements.
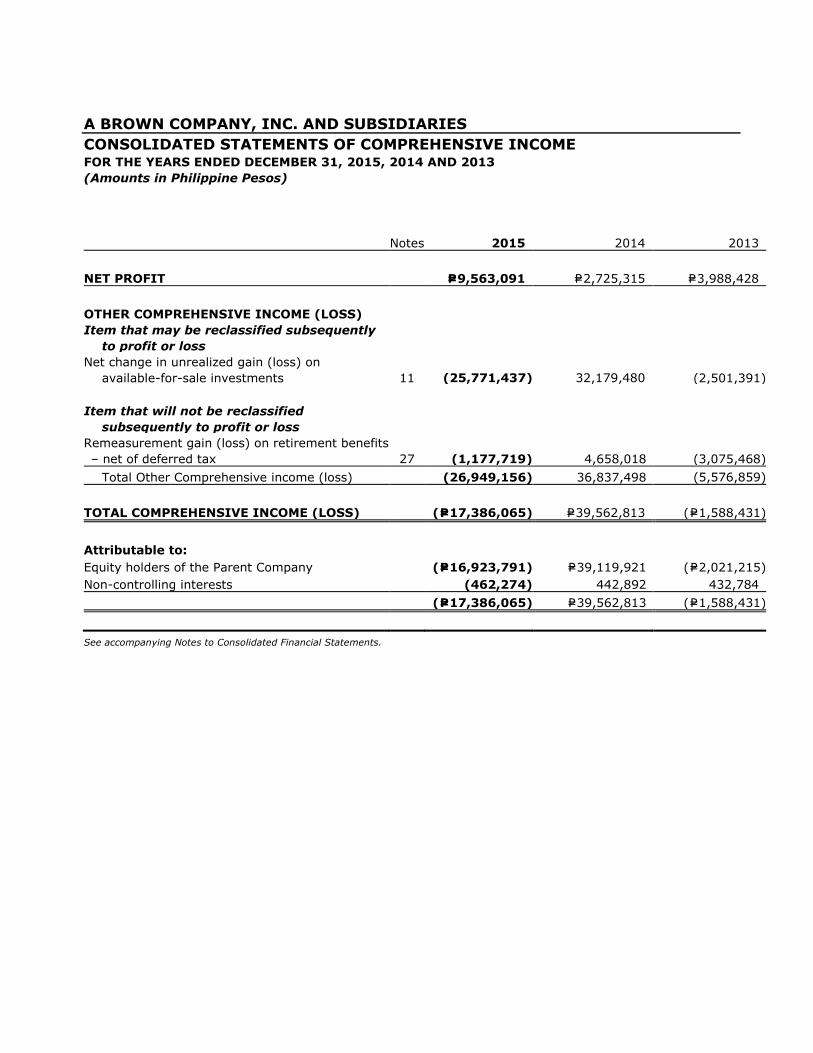
A BROWN COMPANY, INC. AND SUBSIDIARIES
CONSOLIDATED STATEMENTS OF COMPREHENSIVE INCOME FOR THE YEARS ENDED DECEMBER 31, 2015, 2014 AND 2013
(Amounts in Philippine Pesos)
Notes 2015 2014 2013
NET PROFIT P=9,563,091 P=2,725,315 P=3,988,428
OTHER COMPREHENSIVE INCOME (LOSS)
Item that may be reclassified subsequently
to profit or loss
Net change in unrealized gain (loss) on
available-for-sale investments 11 (25,771,437) 32,179,480 (2,501,391)
Item that will not be reclassified
subsequently to profit or loss
Remeasurement gain (loss) on retirement benefits
– net of deferred tax 27 (1,177,719) 4,658,018 (3,075,468)
Total Other Comprehensive income (loss) (26,949,156) 36,837,498 (5,576,859)
TOTAL COMPREHENSIVE INCOME (LOSS) (P=17,386,065) P=39,562,813 (P=1,588,431)
Attributable to:
Equity holders of the Parent Company (P=16,923,791) P=39,119,921 (P=2,021,215)
Non-controlling interests (462,274) 442,892 432,784
(P=17,386,065) P=39,562,813 (P=1,588,431)
See accompanying Notes to Consolidated Financial Statements.
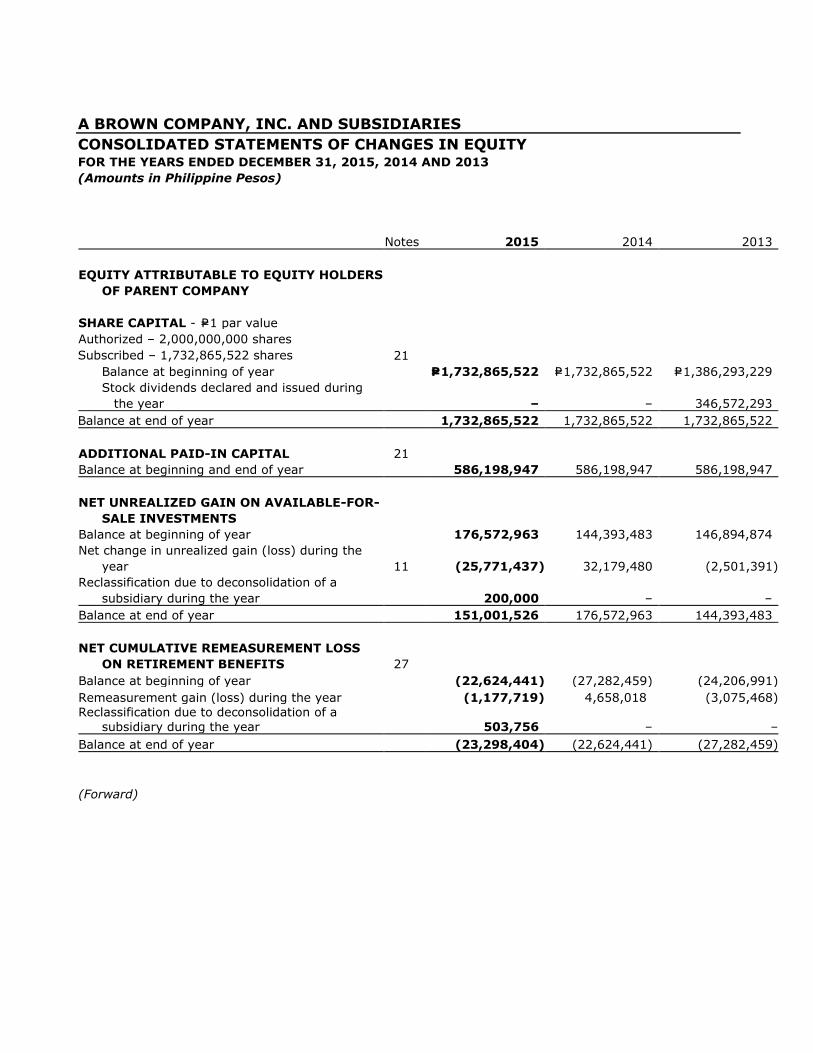
A BROWN COMPANY, INC. AND SUBSIDIARIES
CONSOLIDATED STATEMENTS OF CHANGES IN EQUITY FOR THE YEARS ENDED DECEMBER 31, 2015, 2014 AND 2013
(Amounts in Philippine Pesos)
Notes 2015 2014 2013
EQUITY ATTRIBUTABLE TO EQUITY HOLDERS
OF PARENT COMPANY
SHARE CAPITAL - P=1 par value
Authorized – 2,000,000,000 shares
Subscribed – 1,732,865,522 shares 21
Balance at beginning of year P=1,732,865,522 P=1,732,865,522 P=1,386,293,229
Stock dividends declared and issued during
the year – – 346,572,293
Balance at end of year 1,732,865,522 1,732,865,522 1,732,865,522
ADDITIONAL PAID-IN CAPITAL 21
Balance at beginning and end of year 586,198,947 586,198,947 586,198,947
NET UNREALIZED GAIN ON AVAILABLE-FOR-
SALE INVESTMENTS
Balance at beginning of year 176,572,963 144,393,483 146,894,874
Net change in unrealized gain (loss) during the
year 11 (25,771,437) 32,179,480 (2,501,391)
Reclassification due to deconsolidation of a
subsidiary during the year 200,000 – –
Balance at end of year 151,001,526 176,572,963 144,393,483
NET CUMULATIVE REMEASUREMENT LOSS
ON RETIREMENT BENEFITS 27
Balance at beginning of year (22,624,441) (27,282,459) (24,206,991)
Remeasurement gain (loss) during the year (1,177,719) 4,658,018 (3,075,468) Reclassification due to deconsolidation of a
subsidiary during the year 503,756 – –
Balance at end of year (23,298,404) (22,624,441) (27,282,459)
(Forward)
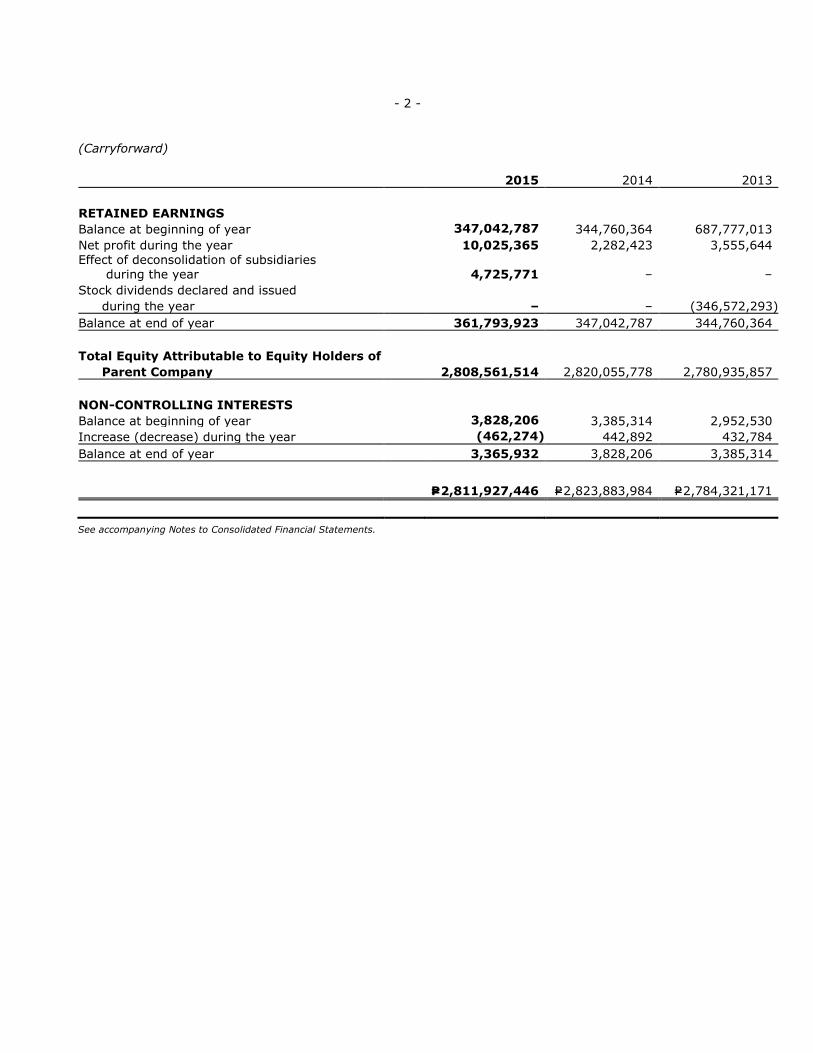
- 2 -
(Carryforward)
2015 2014 2013
RETAINED EARNINGS
Balance at beginning of year 347,042,787 344,760,364 687,777,013
Net profit during the year 10,025,365 2,282,423 3,555,644 Effect of deconsolidation of subsidiaries
during the year 4,725,771 – –
Stock dividends declared and issued
during the year – – (346,572,293)
Balance at end of year 361,793,923 347,042,787 344,760,364
Total Equity Attributable to Equity Holders of
Parent Company 2,808,561,514 2,820,055,778 2,780,935,857
NON-CONTROLLING INTERESTS
Balance at beginning of year 3,828,206 3,385,314 2,952,530
Increase (decrease) during the year (462,274) 442,892 432,784
Balance at end of year 3,365,932 3,828,206 3,385,314
P=2,811,927,446 P=2,823,883,984 P=2,784,321,171
See accompanying Notes to Consolidated Financial Statements.

A BROWN COMPANY, INC. AND SUBSIDIARIES
CONSOLIDATED STATEMENTS OF CASH FLOWS FOR THE YEARS ENDED DECEMBER 31, 2015, 2014 AND 2013
(Amounts in Philippine Pesos)
Note 2015 2014 2013
CASH FLOWS FROM OPERATING ACTIVITIES
Profit (loss) before income tax and non-controlling
interest P=32,293,254 P=28,098,783 (P=2,156,038)
Adjustments for:
Finance costs 19 109,408,927 90,737,847 68,467,666
Depreciation and amortization 13, 14 30,663,997 50,518,142 49,285,498
Equity in net loss (gain) of an associate 12 (7,539,793) 29,943,472 11,846,345
Discount on long-term debt 19 (16,718,115) (24,874,165) –
Loss (gain) on disposal of:
Investment property 13 (15,671,727) 8,356,634 –
Property and equipment 14 263,417 (993,126) (233,803)
Net assets of deconsolidated subsidiaries 2 (104,604)
Available-for-sale investments 11 – (25,521,240) –
Financial income 23 (14,746,667) (18,599,067) (31,546,448)
Retirement benefits expense 27 4,458,824 3,602,483 2,978,165
Provisions for impairment of:
Investment properties 13 4,054,869 1,528,600 1,528,600
Doubtful accounts 7, 26 – 769,679 –
Amortization of leasehold rights 17 1,288,221 1,328,366 1,331,078
Unrealized foreign exchange loss (gain) 32 (14,837) 110,259 (70,223)
Amortization of biological assets 16 – 120,072 2,257,728
Write-off of dividends payable – – (2,355,117)
Operating income before working capital changes 127,635,766 145,126,739 101,333,451
Decrease (increase) in:
Accounts receivable 7 (17,386,594) (21,779,284) 59,064,439
Real estate held for sale 9 50,671,368 19,108,250 (75,387,821)
Inventories 10 (17,424,712) (23,146,625) 3,472,114
Prepayments and other current assets 10 (27,177,813) (17,253,985) (5,438,888)
Increase (decrease) in:
Accounts payable and accrued expenses 18 51,888,307 43,135,646 (56,149,238)
Deposit from customers 31, 32 (5,353,287) (17,135,733) 24,227,187
Cash provided by operations 162,853,035 128,055,008 51,121,244
Income tax paid (19,639,922) (21,677,052) (16,673,370)
Interest received 14,812,778 18,195,593 31,310,478
Contributions to plan assets 27 – (424,010) (5,048,453)
Net cash provided by operating activities 158,025,891 124,149,539 60,709,899
(Forward)
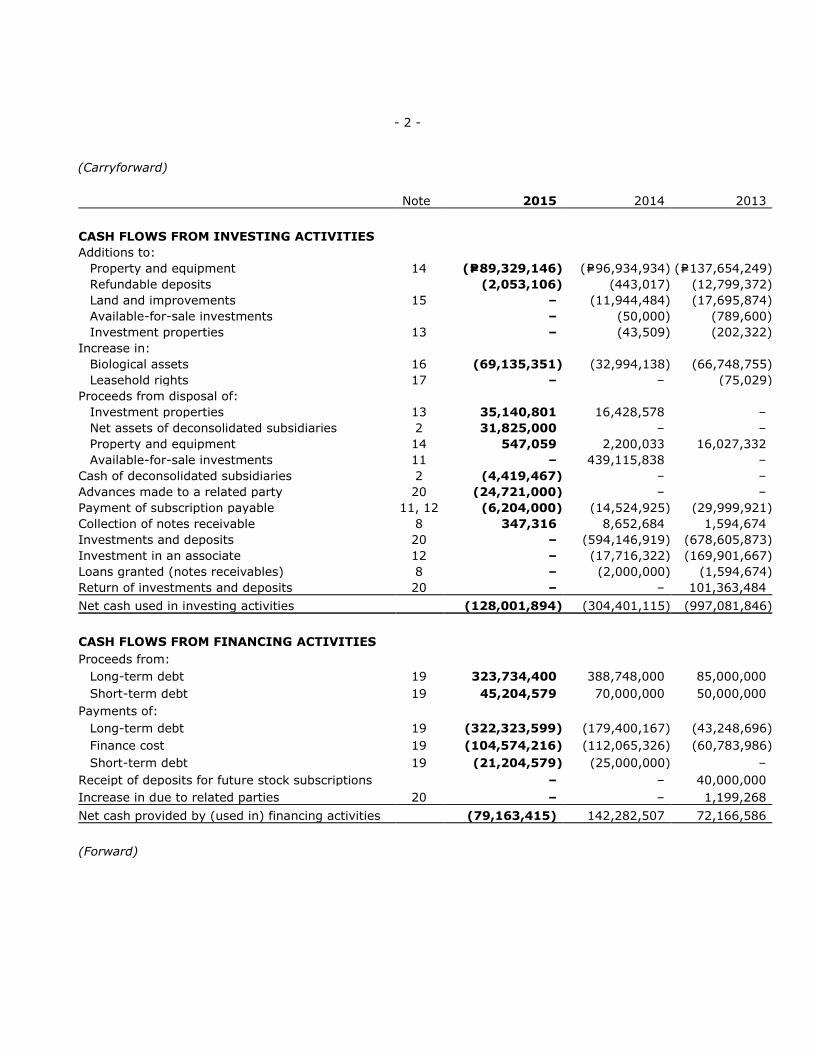
- 2 -
(Carryforward)
Note 2015 2014 2013
CASH FLOWS FROM INVESTING ACTIVITIES
Additions to:
Property and equipment 14 (P=89,329,146) (P=96,934,934) (P=137,654,249)
Refundable deposits (2,053,106) (443,017) (12,799,372)
Land and improvements 15 – (11,944,484) (17,695,874)
Available-for-sale investments – (50,000) (789,600)
Investment properties 13 – (43,509) (202,322)
Increase in:
Biological assets 16 (69,135,351) (32,994,138) (66,748,755)
Leasehold rights 17 – – (75,029)
Proceeds from disposal of:
Investment properties 13 35,140,801 16,428,578 –
Net assets of deconsolidated subsidiaries 2 31,825,000 – –
Property and equipment 14 547,059 2,200,033 16,027,332
Available-for-sale investments 11 – 439,115,838 –
Cash of deconsolidated subsidiaries 2 (4,419,467) – –
Advances made to a related party 20 (24,721,000) – –
Payment of subscription payable 11, 12 (6,204,000) (14,524,925) (29,999,921)
Collection of notes receivable 8 347,316 8,652,684 1,594,674
Investments and deposits 20 – (594,146,919) (678,605,873)
Investment in an associate 12 – (17,716,322) (169,901,667)
Loans granted (notes receivables) 8 – (2,000,000) (1,594,674)
Return of investments and deposits 20 – – 101,363,484
Net cash used in investing activities (128,001,894) (304,401,115) (997,081,846)
CASH FLOWS FROM FINANCING ACTIVITIES
Proceeds from:
Long-term debt 19 323,734,400 388,748,000 85,000,000
Short-term debt 19 45,204,579 70,000,000 50,000,000
Payments of:
Long-term debt 19 (322,323,599) (179,400,167) (43,248,696)
Finance cost 19 (104,574,216) (112,065,326) (60,783,986)
Short-term debt 19 (21,204,579) (25,000,000) –
Receipt of deposits for future stock subscriptions – – 40,000,000
Increase in due to related parties 20 – – 1,199,268
Net cash provided by (used in) financing activities (79,163,415) 142,282,507 72,166,586
(Forward)
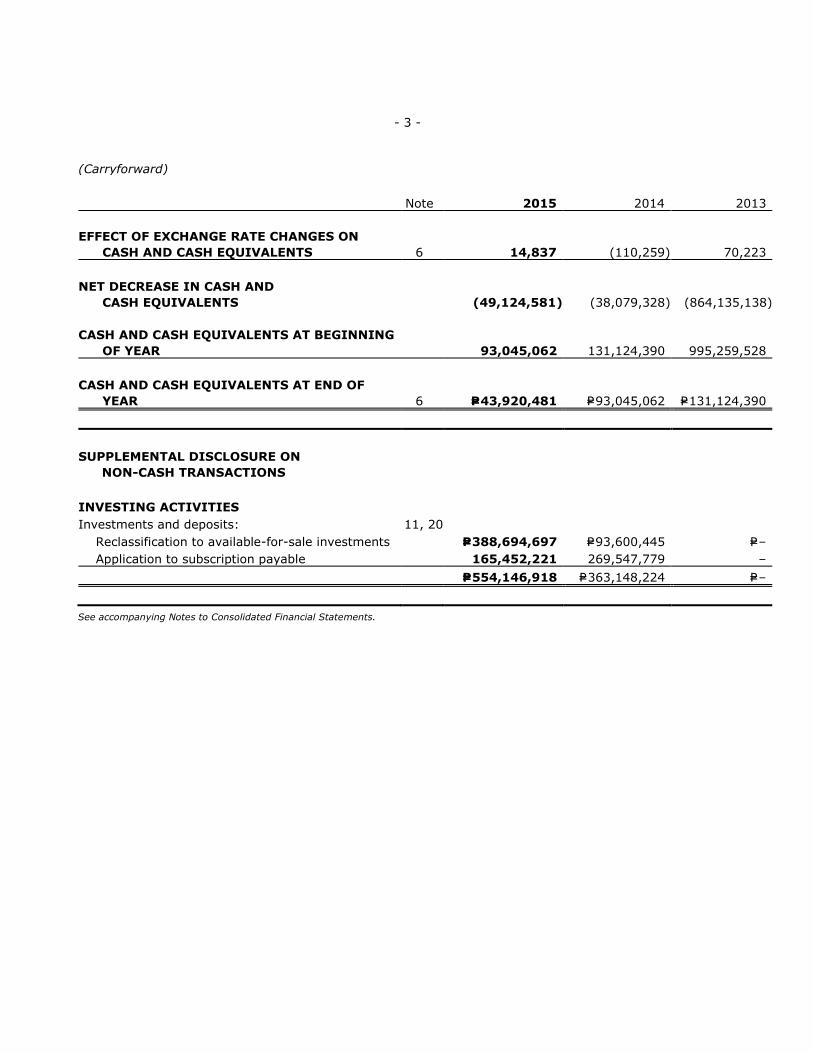
- 3 -
(Carryforward)
Note 2015 2014 2013
EFFECT OF EXCHANGE RATE CHANGES ON
CASH AND CASH EQUIVALENTS 6 14,837 (110,259) 70,223
NET DECREASE IN CASH AND
CASH EQUIVALENTS (49,124,581) (38,079,328) (864,135,138)
CASH AND CASH EQUIVALENTS AT BEGINNING
OF YEAR 93,045,062 131,124,390 995,259,528
CASH AND CASH EQUIVALENTS AT END OF
YEAR 6 P=43,920,481 P=93,045,062 P=131,124,390
SUPPLEMENTAL DISCLOSURE ON
NON-CASH TRANSACTIONS
INVESTING ACTIVITIES
Investments and deposits: 11, 20
Reclassification to available-for-sale investments P=388,694,697 P=93,600,445 P=–
Application to subscription payable 165,452,221 269,547,779 –
P=554,146,918 P=363,148,224 P=–
See accompanying Notes to Consolidated Financial Statements.

A BROWN COMPANY, INC. AND SUBSIDIARIES
NOTES TO CONSOLIDATED FINANCIAL STATEMENTS (Amounts in Philippine Pesos)
1. Corporate Information
A Brown Company, Inc. (Parent Company) was incorporated and registered with the Philippine
Securities and Exchange Commission (SEC) on December 21, 1966 as Bendana Brown Pizarro
and Associates, Inc. to primarily engage in the business of property development and to invest
in shares of stocks of listed companies. On October 1, 1992, the Parent Company amended its
articles of incorporation to change its registered name to EPIC Holdings Corporation, which was
further amended on July 1, 1993 to its current registered name. On February 8, 1994, the
Parent Company was listed in the Philippine Stock Exchange.
The Parent Company’s principal purpose is to invest in, purchase, or otherwise acquire and
own, hold, use, sell, assign, transfer, mortgage, pledge, exchange, or otherwise dispose of real
and personal property of every kind and description, including of shares of stock, bonds,
debentures, notes, evidences of indebtedness, and other securities or obligations of any other
corporation, associations, domestic or foreign, for whatever lawful purpose or purposes the
same may have been organized without being a stock broker or dealer, and to pay therefor in
money or by exchanging therefor stocks, bonds, or other evidences of indebtedness or
securities of this or any other corporation and while the owner or holder of any such real or
personal property, stocks, bonds, debentures, contracts or obligations, to receive, collect and
dispose of the interest, dividends, and income arising from such property and to possess and
exercise in respect thereof all the rights, powers and privileges of ownership, provided the
corporation shall not exercise the functions of a trust corporation. The principal activities of the
operating subsidiaries are as follows:
Name of Subsidiary Principal Activity
A Brown Energy and Resources Development,
Inc. (ABERDI) Manufacturing, trading of goods on wholesale and retail basis such as crude oil and petroleum products
Brown Resources Corporation (BRC)* Real estate holding and management of chalet operations
Bonsai Agri Corporation (BAC)** and Nakeen Corporation (NC)
Development of land for palm oil production and sale of palm seedlings and crude palm oil
Simple Homes Development, Inc. (SHDI), Formerly Andesite Corporation (AC)**
Development of socialized housing projects
AB Bulk Water Co., Inc. (ABBWCI)** Holding and providing rights to water to public utilities and cooperatives or in water distribution
Masinloc Consolidated Power, Inc. (MCPI)**
Operating of power plants and/or purchase, generation, production supply and sale of power
Palm Thermal Consolidated Holdings, Corp. (PTCHC)
Holding of properties of every kind and description
Hydro Link Projects Corp. (HLPC)** and Peakpower Bukidnon, Inc. (PBI)***
Developing, constructing and operating power generating plants
*Subsidiary up to January 2015
**Has not yet started commercial operations as of March 18, 2016.
*** Subsidiary up to October 2015
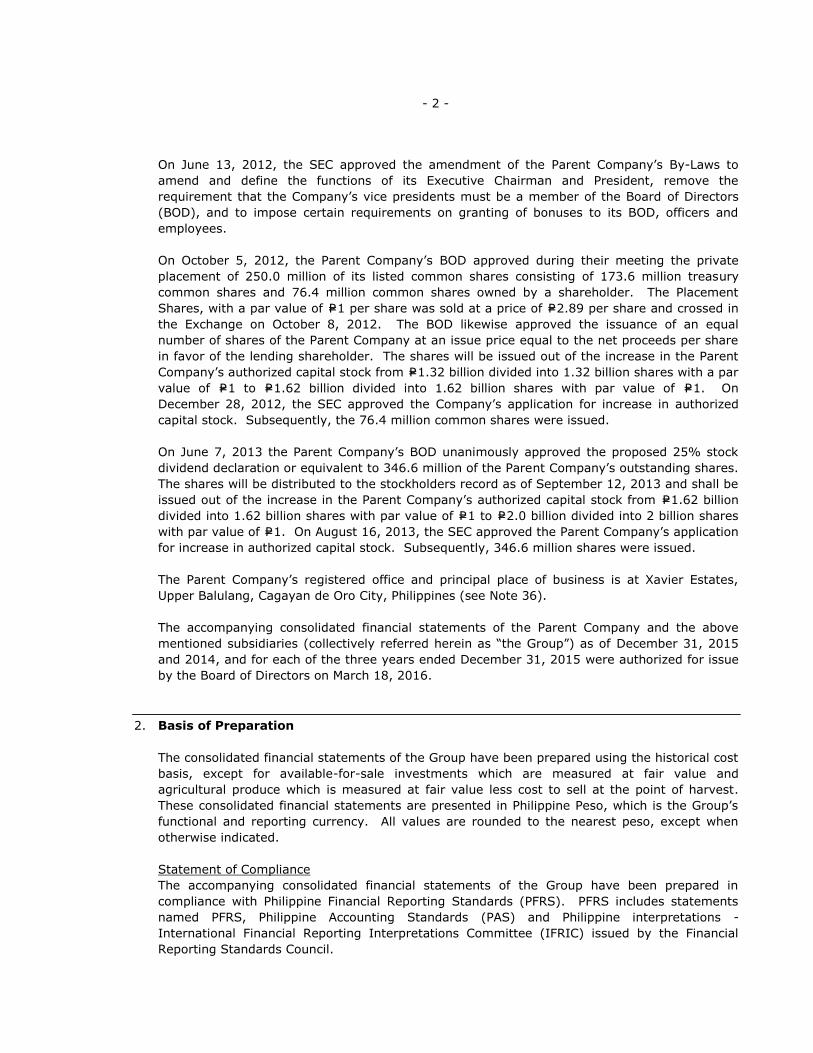
- 2 -
On June 13, 2012, the SEC approved the amendment of the Parent Company’s By-Laws to
amend and define the functions of its Executive Chairman and President, remove the
requirement that the Company’s vice presidents must be a member of the Board of Directors
(BOD), and to impose certain requirements on granting of bonuses to its BOD, officers and
employees.
On October 5, 2012, the Parent Company’s BOD approved during their meeting the private
placement of 250.0 million of its listed common shares consisting of 173.6 million treasury
common shares and 76.4 million common shares owned by a shareholder. The Placement
Shares, with a par value of P=1 per share was sold at a price of P=2.89 per share and crossed in
the Exchange on October 8, 2012. The BOD likewise approved the issuance of an equal
number of shares of the Parent Company at an issue price equal to the net proceeds per share
in favor of the lending shareholder. The shares will be issued out of the increase in the Parent
Company’s authorized capital stock from P=1.32 billion divided into 1.32 billion shares with a par
value of P=1 to P=1.62 billion divided into 1.62 billion shares with par value of P=1. On
December 28, 2012, the SEC approved the Company’s application for increase in authorized
capital stock. Subsequently, the 76.4 million common shares were issued.
On June 7, 2013 the Parent Company’s BOD unanimously approved the proposed 25% stock
dividend declaration or equivalent to 346.6 million of the Parent Company’s outstanding shares.
The shares will be distributed to the stockholders record as of September 12, 2013 and shall be
issued out of the increase in the Parent Company’s authorized capital stock from P=1.62 billion
divided into 1.62 billion shares with par value of P=1 to P=2.0 billion divided into 2 billion shares
with par value of P=1. On August 16, 2013, the SEC approved the Parent Company’s application
for increase in authorized capital stock. Subsequently, 346.6 million shares were issued.
The Parent Company’s registered office and principal place of business is at Xavier Estates,
Upper Balulang, Cagayan de Oro City, Philippines (see Note 36).
The accompanying consolidated financial statements of the Parent Company and the above
mentioned subsidiaries (collectively referred herein as “the Group”) as of December 31, 2015
and 2014, and for each of the three years ended December 31, 2015 were authorized for issue
by the Board of Directors on March 18, 2016.
2. Basis of Preparation
The consolidated financial statements of the Group have been prepared using the historical cost
basis, except for available-for-sale investments which are measured at fair value and
agricultural produce which is measured at fair value less cost to sell at the point of harvest.
These consolidated financial statements are presented in Philippine Peso, which is the Group’s
functional and reporting currency. All values are rounded to the nearest peso, except when
otherwise indicated.
Statement of Compliance
The accompanying consolidated financial statements of the Group have been prepared in
compliance with Philippine Financial Reporting Standards (PFRS). PFRS includes statements
named PFRS, Philippine Accounting Standards (PAS) and Philippine interpretations -
International Financial Reporting Interpretations Committee (IFRIC) issued by the Financial
Reporting Standards Council.
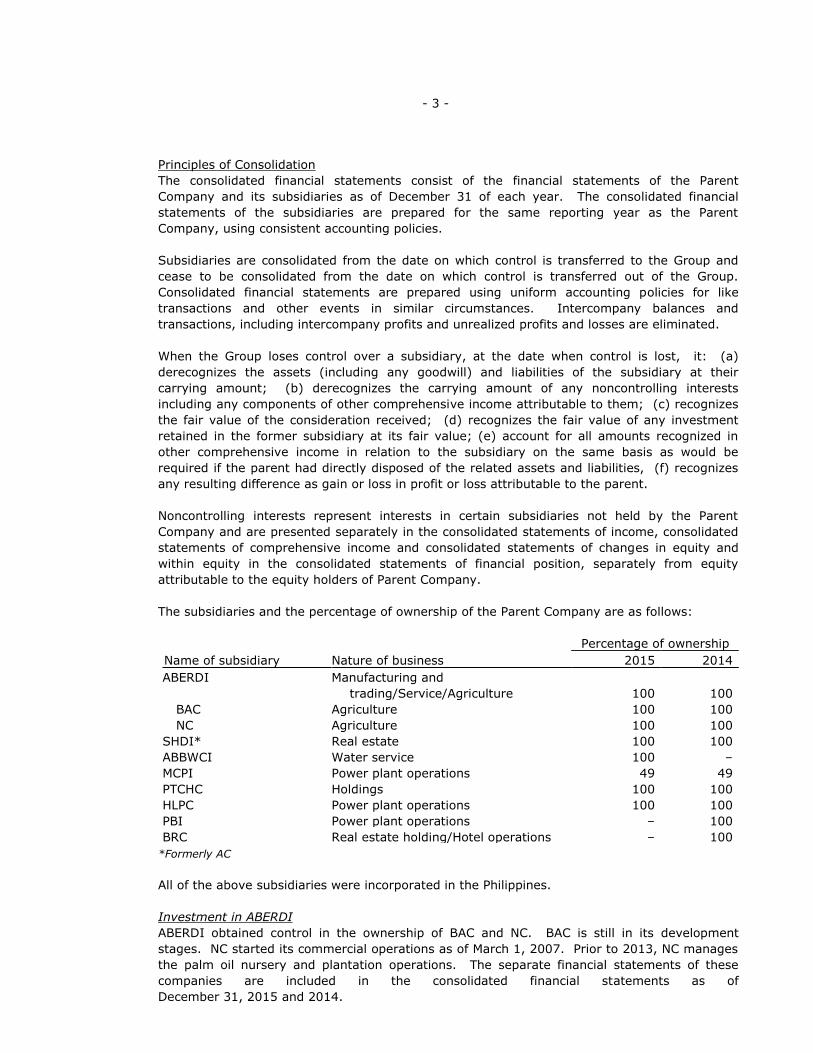
- 3 -
Principles of Consolidation
The consolidated financial statements consist of the financial statements of the Parent
Company and its subsidiaries as of December 31 of each year. The consolidated financial
statements of the subsidiaries are prepared for the same reporting year as the Parent
Company, using consistent accounting policies.
Subsidiaries are consolidated from the date on which control is transferred to the Group and
cease to be consolidated from the date on which control is transferred out of the Group.
Consolidated financial statements are prepared using uniform accounting policies for like
transactions and other events in similar circumstances. Intercompany balances and
transactions, including intercompany profits and unrealized profits and losses are eliminated.
When the Group loses control over a subsidiary, at the date when control is lost, it: (a)
derecognizes the assets (including any goodwill) and liabilities of the subsidiary at their
carrying amount; (b) derecognizes the carrying amount of any noncontrolling interests
including any components of other comprehensive income attributable to them; (c) recognizes
the fair value of the consideration received; (d) recognizes the fair value of any investment
retained in the former subsidiary at its fair value; (e) account for all amounts recognized in
other comprehensive income in relation to the subsidiary on the same basis as would be
required if the parent had directly disposed of the related assets and liabilities, (f) recognizes
any resulting difference as gain or loss in profit or loss attributable to the parent.
Noncontrolling interests represent interests in certain subsidiaries not held by the Parent
Company and are presented separately in the consolidated statements of income, consolidated
statements of comprehensive income and consolidated statements of changes in equity and
within equity in the consolidated statements of financial position, separately from equity
attributable to the equity holders of Parent Company.
The subsidiaries and the percentage of ownership of the Parent Company are as follows:
Percentage of ownership
Name of subsidiary Nature of business 2015 2014
ABERDI Manufacturing and
trading/Service/Agriculture 100 100
BAC Agriculture 100 100
NC Agriculture 100 100
SHDI* Real estate 100 100
ABBWCI Water service 100 –
MCPI Power plant operations 49 49
PTCHC Holdings 100 100
HLPC Power plant operations 100 100
PBI Power plant operations – 100
BRC Real estate holding/Hotel operations – 100
*Formerly AC
All of the above subsidiaries were incorporated in the Philippines.
Investment in ABERDI
ABERDI obtained control in the ownership of BAC and NC. BAC is still in its development
stages. NC started its commercial operations as of March 1, 2007. Prior to 2013, NC manages
the palm oil nursery and plantation operations. The separate financial statements of these
companies are included in the consolidated financial statements as of
December 31, 2015 and 2014.

- 4 -
On August 30, 2012, the Philippine Securities and Exchange Commission (SEC) approved the
Articles and Plan of Merger of the ABERDI and NC which was approved by their BOD, in their
meeting on March 6, 2012. However, on July 31, 2012, before the SEC approved ABERDI’s
Articles and Plan of Merger which was filed on July 12, 2012, the BOD and the stockholders of
NC approved and ratified the subscription by the ABERDI to the 750,000 unsubscribed shares
of NC at P=1 per share with P=50 million as additional paid-in capital. The BOD and the
stockholders of NC also approved the filing with SEC of the amended Articles and Plan of
Merger reflecting the new capital structure of NC and specifying the effectivity date of the
revised merger to be the first day of the subsequent month following the SEC approval.
On February 19, 2013, the BOD of NC approved the filing of the amended Articles and Plan of
Merger using the 2012 audited Financial Statements. The amended articles and plan was filed
with the SEC on July 24, 2013 to amend certain provisions on the articles and plan of merger
as follows:
1. Issuance of the ABERDI shares to NC shareholders in exchange of the net assets of the
latter as result of the merger.
2. Specify the effectivity date of the merger which will be the first day of the month succeeding
the month of approval of the merger by the SEC.
On February 11, 2015, SEC denied the petition to amend plan of merger. NC and ABERDI’s
management filed a request for reconsideration to approve the petition. As of
March 18, 2016 the request for reconsideration is still pending with SEC.
Investment in SHDI
In December 2014, the Parent Company bought SHDI from ABERDI to undertake its socialized
housing projects. As of March 18, 2016, SHDI has not yet started its commercial
operations. On March 13, 2015, SHDI filed an application with the SEC to amend its primary
purpose in the Articles of Incorporation from engaging business in agriculture to socialized
housing property development which was later approved on April 10, 2015.
Investment in ABBWCI
In March 2015, the Parent Company invested P=5.0 million in ABBWCI, representing 100%
equity holdings. ABBWCI engages in the business of holding and providing rights to water to
public utilities and cooperatives or in water distribution in the Municipality of Opol, Misamis
Oriental.
Investment in MCPI
In 2007, the Parent Company invested P=4.9 million in MCPI representing 49% equity holdings.
However, control over the operating and financial policies of MCPI is exercised by the Parent
Company through its representations in the BOD. Accordingly, MCPI qualifies as a subsidiary of
the Parent Company. The financial statements of MCPI as of and for each years ended
December 31, 2015 and 2014 are included in the consolidated financial statements.
The BOD in their meeting on February 6, 2009, unanimously decided to wind up the affairs of
MCPI, cease any and all of its operations; and close its business. Pursuant to the same, MCPI
shall do all acts legally that are necessary and required. However, on
October 29, 2009, the BOD resolved the revocation of its previous resolution to dissolve MCPI
and any act pursuant to the dissolution.
- 5 -
Investment in PTCHC
In 2010, the Parent Company subscribed 2,850,000 shares and 3,000,000 shares of PTCHC and
Panay Consolidated Land Holdings Corporation (PCLHC), respectively, at par value. The
investment represents 95% and 100% equity holdings of PTCHC and PCLHC, respectively.
PTCHC and PCLHC are newly organized companies in 2010.
On December 8, 2010, PTCHC acquired 100% of equity holdings of Palm Concepcion Power
Corporation (PCPC), formerly DMCI Concepcion Power Corporation. DMCI Power Corporation,
PCPC’s former parent company, transferred and conveyed to PTCHC all of the rights, title and
interest in and to the shares of stock of PCPC. The acquisition cost is higher than the fair value
of the identifiable net assets of the acquired subsidiary. Accordingly, goodwill of P=21,472,567
is recognized in the 2010 consolidated statements of financial position. In 2011, additional
acquisition cost amounting to P=1,199,375 was capitalized as investment in subsidiaries which
resulted to additional goodwill of the same amount. In 2012, when the Group’s equity interest
in PCPC was reduced to 30%, the entire goodwill was derecognized.
In September 2012, the Parent Company, together with its subsidiaries, PTCHC, Palm
Concepcion Power Corporation (PCPC) and PCLHC, has signed a Shareholders’ Agreement with
AC Energy Holdings, Inc. (ACEHI) and Jin Navitas Resource, Inc. (JNRI) to implement the
Memorandum of Agreement between the parties to build power generation plant in the Province
of Iloilo.
In relation to the above agreements, the Parent Company transferred all of its equity interest in
PCLHC to PTCHC. Likewise, PTCHC, ACEHI and JNRI subscribed on the remaining unissued
authorized share capital of PCLHC and PCPC. The subscription of ACEHI and JNRI to PCLHC and
PCPC reduced the Parent Company’s holdings, through PTCHC, to 30%.
In May 2013, ACEHI sold all its interest in PCPC and PCLHC to focus its investing power to its
existing power projects imminent in its development pipeline. In light of this event, PTCHC had
taken the opportunity to acquire the entire stake of ACEHI bringing its interest to 70% on both
entities. Later before the end of the year, Oriental Knight Limited (OKL) bought out and
subscribed to the 30.46% equity interest of PCPC from the PTCHC. Additional shares were
subscribed by the PTCHC bringing its equity interest to 39.54%. On the other hand, the
PTCHC’s interest in PCLHC as of December 31, 2013 remained at 70%. On December 11,
2013, the BOD and shareholders of PCLHC and PCPC approved the merger of the two entities,
with PCPC as the surviving entity. As of December 31, 2013, PTCHC still holds sufficient
interest in PCPC for it to be able to exercise significant influence. PTCHC’s interest in PCLHC
was presented under the investment in associate account as a result of the merger application
as of December 31, 2013. During the third quarter of 2014, the SEC approved the Plan of
Merger of PCPC and PCLHC as well as the increase in authorized capital stock of PCPC. After
the merger, the Parent Company’s holding through PTCHC retained its 30% interest in the
outstanding capital of PCPC as of December 31, 2014 (see Note 12).
On January 6, 2015, the SEC approved PCPC’s application of the increase in authorized capital
stock which reduced the Parent Company’s holding through PTCHC to 20% as of
December 31, 2015.
- 6 -
Investment in HLPC
On January 12, 2011, the Parent Company and HLPC entered to a deed of subscription, which
increased HLPC’s authorized share capital from 10,000 to 160,000 shares with par value of one
hundred pesos (P=100) per share. Out of the 150,000 increase in authorized shares of HLPC,
the Parent Company subscribed an aggregate share of 37,500 common shares which
represents ninety three and seventy five percent (93.75%) of the resulting total issued and
subscribed share capital of 40,000 shares. Accordingly, goodwill of P=250,000 is recognized in
the 2011 consolidated statements of financial position. In December 2011, a deed of
assignment was entered into by the Parent Company and HLPC’s stockholder, assigning the
remaining six and twenty five percent (6.25%) shares of HLPC to the Parent Company.
Investment in PBI
In July 2014, the Parent Company caused the incorporation of PBI with the primary purpose of
acquiring, developing, constructing, investing in, and operating power generating plants in
Bukidnon and engaging in the business of a generation company in accordance with Republic
Act No. 9136 otherwise known as the Electric Power Industry Reform Act of 2001
(the “EPIRA”).
In 2014, the Parent Company invested P=2.5 million in PBI representing 100% of the equity
holdings, of which the related subscription payable amounted to P=1.9 million. As of
December 31, 2014, the paid-up capital and deposits for future subscriptions made by the
Parent Company to PBI relative to this investment amounted to P=0.6 million and P=7.5 million,
respectively. In 2015, the Parent Company applied P=1.9 million of deposits for future
subscriptions against its subscription payable to PBI. Also in 2015, the Parent Company
assigned the remaining balance of deposit for future subscription of P=5.6 million and sold its
100% equity interest in capital stock of PBI to Peakpower Energy, Inc (PEI), an associate, for
P=2.5 million.
Investment in BRC
In January 2015, the Parent Company sold its 100% equity interest in BRC to Angelus Agri
Corporation, for P=23.7 million.
The net gain from the disposal of net assets of deconsolidated subsidiaries is shown below:
Amount
Consideration for the disposal P=31,825,000
Net assets disposed:
Assets 49,973,527
Liabilities 18,253,131
Net assets 31,720,396
Net gain P=104,604
- 7 -
3. Changes in Accounting Policies
The accounting policies adopted by the Group are consistent with those of the previous financial
year except for the following amended PFRS, amended PAS and interpretations issued by
International Financial Reporting Interpretations Committee (IFRIC) which became effective in
2015:
Amendments to PAS 19, "Employee Benefits - Defined Benefit Plans: Employee Contributions"
The amendments apply to contributions from employees or third parties to defined benefit
plans. Contributions that are set out in the formal terms of the plan shall be accounted for as
reductions to current service costs if they are linked to service or as part of the re-
measurements of the net defined benefit asset or liability if they are not linked to service.
Contributions that are discretionary shall be accounted for as reductions of current service cost
upon payment of these contributions to the plans.
The amendments have no significant impact to the Group’s financial statements as the Group’s
retirement plan is non-contributory.
Annual Improvements to PFRS (2010 to 2012 cycle)
The annual improvements to PFRS (2010-2012 cycle) contain non-urgent but necessary
amendments to the following standards:
PFRS 13, "Fair Value Measurement - Short-term Receivables and Payables"
The amendment clarifies that short-term receivables and payables with no stated interest
rates can be held at invoice amounts when the effect of discounting is immaterial.
The amendment has no significant impact on the Group's financial position or performance.
PFRS 2, "Share-based Payment - Definition of Vesting Condition"
The amendment revised the definitions of vesting condition and market condition and
added the definitions of performance condition and service condition to clarify various
issues.
The amendment does not apply to the Group as it currently has no share-based payments.
PFRS 3, "Business Combinations - Accounting for Contingent Consideration in a Business
Combination"
The amendment clarifies that a contingent consideration that meets the definition of a
financial instrument should be classified as a financial liability or as equity in accordance
with PAS 32, Contingent consideration that is not classified as equity is subsequently
measured at FVPL whether or not it falls within the scope of PFRS 9 (or PAS 39, if PFRS 9 is
not yet adopted).
The amendment does not apply to the Group as it has no business combination
transactions in 2015.
- 8 -
PFRS 8, "Operating Segments - Aggregation of Operating Segments and Reconciliation of
the Total of the Reportable Segments' Assets to the Entity's Assets"
The amendments require entities to disclose the judgment made by management in
aggregating two or more operating segments. This disclosure should include a brief
description of the operating segments that have been aggregated in this way and the
economic indicators that have been assessed in determining that the aggregated operating
segments share similar economic characteristics. The amendments also clarify that an
entity shall provide reconciliations of the total of the reportable segments' assets to the
entity's assets if such amounts are regularly provided to the chief operating decision
maker.
The amendments affect disclosures only and have no impact on the Group’s financial
position or performance.
PAS 16, "Property, Plant and Equipment: Revaluation Method - Proportionate Restatement
of Accumulated Depreciation"
The amendment clarifies that, upon revaluation of an item of property, plant and
equipment, the carrying amount of the asset shall be adjusted to the revalued amount, and
the asset shall be treated in one of the following ways:
a. The gross carrying amount is adjusted in a manner that is consistent with the
revaluation of the carrying amount of the asset. The accumulated depreciation at the
date of revaluation is adjusted to equal the difference between the gross carrying
amount and the carrying amount of the asset after taking into account any
accumulated impairment losses.
b. The accumulated depreciation is eliminated against the gross carrying amount of the
asset.
This applies to all revaluations recognized in annual periods beginning on or after the date
of initial application of this amendment and in the immediately preceding annual period.
The amendment has no impact on the Group's financial position or performance since it has
no property and equipment carried at revalued amounts.
PAS 24, "Related Party Disclosures - Key Management Personnel"
The amendments clarify that an entity is a related party of the reporting entity if the said
entity, or any member of a group for which it is a part of, provides key management
personnel services to the reporting entity or to the Parent Company of the reporting entity.
The amendments also clarify that a reporting entity that obtains management personnel
services from another entity (also referred to as management entity) is not required to
disclose the compensation paid or payable by the management entity to its employees or
directors. The reporting entity is required to disclose the amounts incurred for the key
management personnel services provided by a separate management entity.
The amendments affect disclosures only and have no impact on the Group's financial
position or performance.
- 9 -
PAS 38, "Intangible Assets: Revaluation Method - Proportionate Restatement of
Accumulated Amortization"
The amendments clarify that, upon revaluation of an intangible asset, the carrying amount
of the asset shall be adjusted to the revalued amount, and the asset shall be treated in one
of the following ways:
a. The gross carrying amount is adjusted in a manner that is consistent with the
revaluation of the carrying amount of the asset. The accumulated amortization at the
date of revaluation is adjusted to equal the difference between the gross carrying
amount and the carrying amount of the asset after taking into account any
accumulated impairment losses.
b. The accumulated amortization is eliminated against the gross carrying amount of the
asset.
The amendments also clarify that the amount of the adjustment of the accumulated
amortization should form part of the increase or decrease in the carrying amount
accounted for in accordance with the standard.
These amendments shall apply to all revaluations recognized in annual periods beginning
on or after the date of initial application of this amendment and in the immediately
preceding annual period.
The amendments have are currently not applicable to the Group since it has no intangible
assets carried at revalued amounts.
Annual Improvements to PFRS (2011 to 2013 cycle)
The annual improvements to PFRS (2011-2013 cycle) contain non-urgent but necessary
amendments to the following standards:
PFRS 1, "First-time Adoption of Philippine Financial Reporting Standards - Meaning of
Effective PFRS"
The amendment clarifies that an entity may choose to apply either a current standard or a
new standard that is not yet mandatory, but that permits early application, provided either
standard is applied consistently throughout the periods presented in the entity's first PFRS
financial statements.
This amendment is not applicable to the Group as it is not a first-time adopter of PFRS.
PFRS 3, "Business Combinations - Scope Exceptions for Joint Arrangements"
The amendment clarifies that PFRS 3 does not apply to the accounting for the formation of
a joint arrangement in the financial statements of the joint arrangement itself.
The amendment is currently not applicable to the Group.
PFRS 13, "Fair Value Measurement - Portfolio Exception"
The amendment clarifies that the portfolio exception in PFRS 13 can be applied to financial
assets, financial liabilities and other contracts.
The amendment has no impact on the Group's financial position or performance.
- 10 -
PAS 40, "Investment Property"
The amendment clarifies the interrelationship between PFRS 3 and PAS 40 when classifying
property as investment property or owner-occupied property. The amendment stated that
judgment is needed when determining whether the acquisition of investment property is
the acquisition of an asset or a group of assets or a business combination within the scope
of PFRS 3. This judgment is based on the guidance of PFRS 3.
The amendment has no significant impact on the Group’s financial statements.
New Accounting Standards, Amendments to Existing Standards Annual Improvements and
Interpretations Effective Subsequent to December 31, 2015
The standards, amendments, annual improvements and interpretations which have issued but
are not yet effective are discussed below and in the subsequent pages. The Group will adopt
these standards, amendments and annual improvements and interpretations when these
become effective and applicable to the Group. Except as otherwise indicated, the Group does
not expect the adoption of these new and amended standards, annual improvements and
interpretations to have a significant impact on its financial statements.
Effective in 2016
• PFRS 10, PFRS 12 and PAS 28, “Investment Entities”: Applying the Consolidation
Exception”
The amendments clarify that the exemption from preparing consolidated financial
statements is available to a parent entity that is subsidiary of an investment entity, even if
the investment entity measures all its subsidiaries at fair value in accordance with PFRS 10.
Consequential amendments have also been made to PAS 28 to clarify that the exemption
from applying the equity method is also applicable to an investor in an associate or joint
venture if that investor is a subsidiary of an investment entity that measures all its
subsidiaries at fair value.
The amendments further clarify that the requirement for an investment entity to
consolidate a subsidiary providing services related to the former’s investment activities
applies only to subsidiaries that are not investment entities themselves.
Moreover, the amendments clarify that in applying the equity method of accounting to an
associate or a joint venture that is an investment entity, an investor may retain the fair
value measurements that the associate or joint venture used for its subsidiaries.
Lastly, clarification is also made that an investment entity that measures all its subsidiaries
at fair value should provide the disclosures required by PFRS 12 Disclosure of Interests in
Other Entities.
The amendments to PFRS 10 are effective for annual periods beginning on or
after January 1, 2016, with early adoption permitted. The amendments are not relevant to
the Group.
- 11 -
• PFRS 11, “Accounting for Acquisitions of Interests in Joint Operations”
The amendments clarify the accounting for acquisitions of an interest in a joint operation
when the operation constitutes a business. The acquirer of an interest in a joint operation
in which the activity constitutes a business is required to apply the principles on business
combinations accounting. Previously held interest in joint operation is not remeasured on
the acquisition of an additional interest in the same joint operation while joint control is
retained. Amendments do not apply when the parties sharing joint control, including the
reporting entity, are under the common control of the same ultimate controlling party.
The amendments are effective for annual periods beginning on or after January 1, 2016,
with earlier adoption permitted. The amendments are currently not applicable to the
Group.
• PFRS 14, "Regulatory Deferral Accounts"
PFRS 14 is an optional standard that allows an entity whose activities are subject to
rate-regulation, to continue applying most of its existing accounting policies for regulatory
deferral account balances upon its first-time adoption of PFRS. Entities that adopt PFRS 14
must present the regulatory deferral accounts as separate line items on the statement of
financial position and present movements in these account balances as separate line items
in the statement of profit or loss and other comprehensive income. The standard requires
disclosures on the nature of, and risks associated with, the entity’s rate-regulation and the
effects of that rate-regulation on its financial statements.
The standard is currently not applicable to the Group.
• PAS 1, “Presentation of Financial Statements”: Disclosure Initiative
The amendments were a response to comments that there were difficulties in applying the
concept of materiality in practice as the wording of some of the requirements in PAS 1 had
in some cases been read to prevent the use of judgment. Certain key highlights in the
amendments are follows:
An entity should not reduce the understandability of its financial statements by
obscuring material information with immaterial information or by aggregating material
items that have different natures or functions.
An entity need not provide a specific disclosure required by a PFRS if the information
resulting from that disclosure is not material.
In the other comprehensive income section of a statement of profit or loss and other
comprehensive income, the amendments require separate disclosure for the following
items:
- The share of other comprehensive income of associates and joint ventures accounted
for using the equity method that will not be reclassified subsequently to profit or loss;
- The share of other comprehensive income of associates and joint ventures accounted
for using the equity method that will be reclassified subsequently to profit or loss.
The amendments to PAS 1 are effective for annual periods beginning on or
after January 1, 2016, with early adoption permitted. The Group does not expect that the
amendments will have significant impact on the financial statements.
- 12 -
• PAS 16, “Property, Plant and Equipment” and PAS 38, “Intangible Assets”: Classification of
Acceptable Methods of Depreciation and Amortization
The amendments clarify that revenue-based methods to calculate the depreciation of an
asset is inappropriate because revenue generated by an activity that includes the use of an
asset reflects factors other than the consumption of the economic benefits embodied in the
asset. As a result, a revenue-based method cannot be used to depreciate property, plant
and equipment and may only be used in very limited circumstances to amortize intangible
assets.
These amendments are effective from annual periods beginning on or after
January 1, 2016, with earlier application permitted and are applied prospectively. The
amendments are not expected to have an impact on the Group's financial position or
performance.
• PAS 16, “Property, Plant and Equipment” and PAS 41, “Agriculture”: Bearer Plants
The amendment clarifies that biological assets that meet the definition of bearer plants will
be accounted for in the same way as property, plant and equipment PAS 16 Property, Plant
and Equipment. The amendment also clarifies that produce growing on bearer plants
continues to be accounted under PAS 41. For government grants related to bearer plants,
PAS 20, Accounting for Government Grants and Disclosure of Government Assistance will
apply.
These amendments are effective from annual periods beginning on or after
January 1, 2016, with earlier application permitted. The Group will assess the impact of
the amendments on the financial statements.
• PAS 27, “Separate Financial Statements”: Equity Method in Separate Financial Statements
The amendments will allow entities to use the equity method to account for investments in
subsidiaries, joint ventures and associates in their separate financial statements. Entities
already applying PFRS and electing to change to the equity method in its separate financial
statements will have to apply the change retrospectively. For first time adopters of PFRS
electing to use the equity method in its separate financial statements, they will be required
to apply this method from the date of transition to PFRS.
These amendments are effective from annual periods beginning on or after
January 1, 2016, with earlier application permitted and to be applied retrospectively. The
Group does not expect that these amendments to have impact on the financial statements.
Annual Improvements to PFRS (2012 - 2014 Cycle)
The annual improvements to PFRS (2012-2014 cycle) contain non-urgent but necessary
amendments to the following standards:
PFRS 5,”Noncurrent Assets Held for Sale and Discontinued Operations”: Changes in
Methods of Disposal
The amendment clarify the accounting for a change in a disposal plan from a plan to sell to
a plan to distribute a dividend in kind to its shareholders (or vice versa) when an entity
reclassifies an asset (or disposal group) directly from one method of disposal to other
should not be considered a new plan rather as a continuation of the original plan. There is,
therefore, no interruption of the application of the requirements in PFRS 5. The
amendment also clarifies that changing the disposal method does not change date of
classification.
This is currently not applicable to the Group.
- 13 -
PFRS 7, “Financial Instruments: Disclosure – Servicing Contracts”
This amendment clarifies that a servicing contract that includes a fee can constitute
continuing involvement in a financial asset. An entity is required to disclose any continuing
involvement in a transferred asset that is derecognized in its entirety. The amendment is
to be applied such that the assessment of which servicing contracts constitute continuing
involvement will be applied retrospectively. An entity that first applies the amendments is
not required to provide comparative disclosures for any period beginning before the annual
period of first application.
The Group does not expect that this amendment will have significant impact on its financial
statements.
PFRS 7, “Applicability of the Amendments to PFRS 7 to Condensed Interim Financial
Statements”
The amendment clarifies that the disclosures on offsetting of financial assets and financial
liabilities are not required in the condensed interim financial report unless they provide a
significant update to the information reported in the most recent annual report. This
amendment is applied.
The Group does not expect that this amendment will have significant impact on its financial
statements.
PAS 19, “Employee Benefits”: Regional Market Issue Regarding Discount Rate
This amendment clarifies that the rate used to discount post-employment benefit
obligations (both funded and unfunded) shall be determined by reference to market yields
at the end of the reporting period on high quality corporate bonds. Where there is no deep
market in such high quality corporate bonds, the market yields (at the end of the reporting
period) on government bonds shall be used. The currency and term of the corporate bonds
or government bonds shall be consistent with the currency and estimated term of the
postemployment benefit obligations.
This amendment is not expected to have any impact on the Group’s financial statements.
PAS 34, “Interim Financial Reporting” Disclosure of information ‘elsewhere in the Interim
Financial Report’
These amendments clarify that an entity discloses information elsewhere in the interim
financial report when it incorporates disclosures by cross-reference to information in
another statement and wherever they are included within the greater interim financial
report (e.g., management commentary or risk report).
This amendment is not expected to have significant impact on the Group’s financial
statements.
- 14 -
Effective in 2018
PFRS 9, "Financial Instruments: Classification and Measurement"
PFRS 9 requires all financial assets to be measured at fair value at initial recognition. A debt
financial asset may, if the fair value option (FVO) is not invoked, be subsequently measured at
amortized cost if it is held within a business model that has the objective to hold the assets to
collect the contractual cash flows and its contractual terms give rise, on specified dates, to cash
flows that are solely payments of principal and interest on the principal outstanding. All other
debt instruments are subsequently measured at fair value through profit or loss. All equity
financial assets are measured at fair value either through OCI or profit or loss. Equity financial
assets held for trading must be measured at FVPL. For liabilities designated as at FVPL using
the FVO, the amount of change in the fair value of a liability that is attributable to changes in
credit risk must be presented in OCI.
The remainder of the change in fair value is presented in profit or loss, unless presentation of
the fair value change relating to the entity's own credit risk in OCI would create or enlarge an
accounting mismatch in profit or loss. All other PAS 39 classification and measurement
requirements for financial liabilities have been carried forward to PFRS 9, including the
embedded derivative bifurcation rules and the criteria for using the FVO. The adoption of the
first phase of PFRS 9 will have an effect on the classification and measurement of the Parent
Company's financial assets, but will potentially have no impact on the classification and
measurement of financial liabilities.
On hedge accounting, PFRS 9 replaces the rules-based hedge accounting model of PAS 39 with
a more principles-based approach. Changes include replacing the rules-based hedge
effectiveness test with an objectives-based test that focuses on the economic relationship
between the hedged item and the hedging instrument, and the effect of credit risk on that
economic relationship; allowing risk components to be designated as the hedged item, not only
for financial items, but also for nonfinancial items, provided that the risk component is
separately identifiable and reliably measurable; and allowing the time value of an option, the
forward element of a forward contract and any foreign currency basis spread to be excluded
from the designation of a financial instrument as the hedging instrument and accounted for as
costs of hedging. PFRS 9 also requires more extensive disclosures for hedge accounting. This
is not expected to have a significant impact on the Group’s financial statements.
Deferred
Philippine Interpretation IFRIC 15, "Agreements for the Construction of Real Estate"
This interpretation covers accounting for revenue and associated expenses by entities that
undertake the construction of real estate directly or through subcontractors. The Philippine
SEC and the Financial Reporting Standards Council (FRSC) have deferred the effectivity of
this interpretation until the final Revenue standard is issued by the International
Accounting Standards Board (IASB) and an evaluation of the requirements of the final
Revenue standard against the practices of the Philippine real estate industry is completed.
Management will continuously assess the impact of this interpretation. Currently,
management believes that the adoption of the interpretation will not have a significant
impact on the Group’s financial statements.
- 15 -
PFRS 10, “Consolidated Financial Statements” and PAS 28, Investments in Associates and
Joint Ventures”: Sale or Contribution of Assets between an Investor and its Associate or
Joint Venture
These amendments address an acknowledged inconsistency between the requirements in
PFRS 10 and those in PAS 28 (2011) in dealing with the sale or contribution of assets
between an investor and its associate or joint venture. The amendments require that full
gain or loss is recognized when a transaction involves a business (whether it is a housed in
a subsidiary or not). A partial gain or loss is recognized when a transaction involves assets
that do not constitute a business, even if these assets are housed in a subsidiary. These
amendments will be effective for annual periods beginning on or after January 1, 2016,
with early application permitted. The amendments are currently not expected to have
significant impact on the Group’s financial statements.
Standards issued by the IASB but not yet been adopted by the FRSC
IFRS 15, “Revenue from Contracts with Customers”
IFRS 15 was issued in May 2014 and establishes a new five-step model that will apply to
revenue arising from contracts with customers. Under IFRS 15, revenue is recognized at an
amount that reflects the consideration to which an entity expects to be entitled in exchange for
transferring goods or services to a customer. The principles in IFRS 15 provide a more
structured approach to measuring and recognizing revenue. The new revenue standard is
applicable to all entities and will supersede all current revenue recognition requirements under
IFRS. Either a full or modified retrospective application is required for annual periods
beginning on or after January 1, 2017 with early adoption permitted. The Group is currently
assessing the impact of IFRS 15 and plans to adopt the new standard once adopted locally.
The Group will continue to assess the relevance and impact of the above standards,
amendments to standards and interpretations. The revised disclosures on the financial
statements required by the above standards and interpretations will be included in the Group’s
financial statements when these are adopted.
4. Summary of Significant Accounting and Financial Reporting Policies
The principal accounting and financial reporting policies adopted in preparing the financial
statements of the Group are summarized below and in the succeeding pages. The policies
have been consistently applied to all years presented unless otherwise stated.
Fair Value Measurement
Fair value is the price that would be received to sell an asset or paid to transfer a liability in an
orderly transaction between market participants at the measurement date. The fair value
measurement is based on the presumption that the transaction to sell the asset or transfer the
liability takes place either:
In the principal market for the asset or liability, or In the absence of a principal market, in the most advantageous market for the asset or
liability.
The principal or the most advantageous market must be accessible to the Group.
The fair value of an asset or a liability is measured using the assumptions that market
participants would use when pricing the asset or liability, assuming that market participants act
in their economic best interest.
- 16 -
A fair value measurement of a nonfinancial asset takes into account a market participant's
ability to generate economic benefits by using the asset in its highest and best use or by selling
it to another market participant that would use the asset in its highest and best use.
The Group uses valuation techniques that are appropriate in the circumstances and for which
sufficient data are available to measure fair value, maximizing the use of relevant observable
inputs and minimizing the use of unobservable inputs.
All assets and liabilities for which fair value is measured or disclosed in the financial statements
are categorized within the fair value hierarchy, described as follows, based on the lowest level
input that is significant to the fair value measurement as a whole:
Level 1 - Quoted (unadjusted) market prices in active markets for identical assets or
liabilities
Level 2 - Valuation techniques for which the lowest level input that is significant to the fair
value measurement is directly or indirectly observable
Level 3 - Valuation techniques for which the lowest level input that is significant to the fair
value measurement is unobservable
For assets and liabilities that are recognized in the financial statements on a recurring basis,
the Group determines whether transfers have occurred between Levels in the hierarchy by re-
assessing categorization (based on the lowest level input that is significant to the fair value
measurement as a whole) at the end of each reporting period.
For the purpose of fair value disclosures, the Group has determined classes of assets and
liabilities on the basis of the nature, characteristics and risks of the assets or liabilities and the
level of the fair value hierarchy.
Financial Assets and Liabilities
Date of recognition
The Group recognizes a financial asset or a financial liability when it becomes a party to the
contractual provisions of the instrument. In the case of a regular way purchase or sale of
financial assets, recognition and derecognition, as applicable, is done using settlement date
accounting.
Initial recognition
Financial assets and financial liabilities are recognized initially at fair value, which is the fair
value of the consideration given (in case of an asset) or received (in case of a liability). The
fair value of the consideration given or received is determined by preference to the transaction
price or other market prices. If such market prices are not reliably determinable, the fair value
of the consideration is estimated as the sum of all future cash payments or receipts, discounted
using the prevailing market rate of interest for similar instruments with similar maturities. The
initial measurement of financial instruments, except for those designated at fair value through
profit and loss (FVPL), includes transaction costs.
- 17 -
Determination of fair value
Fair value is determined by preference to the transaction price or other market prices. If such
market prices are not reliably determinable, the fair value is determined by using appropriate
valuation techniques. Valuation techniques include net present value model where the fair
value of the consideration is estimated as the sum of all future cash payments or receipts,
discounted using the prevailing market rates of interest for a similar instruments with similar
maturities. Other valuation techniques include comparing to similar instruments for which
market observable prices exist; recent arm’s length market transaction; option pricing model
and other relevant valuation models.
Financial Assets
The Group determines the classification at initial recognition and, where allowance is
appropriate, re-evaluates this designation every reporting date. The classification depends on
the purpose for which the investments are acquired and whether they are quoted in an active
market. Subsequent to initial recognition, the Group classifies its financial assets in the
following categories:
Financial asset at fair value through profit or loss (FVPL)
A financial asset is classified in this category if acquired principally for the purpose of
selling or repurchasing in the near term or upon initial recognition, it is designated by the
management as at FVPL. Derivatives are also categorized as held at fair value through
profit or loss, except those derivatives designated as effective hedging instruments. Assets
classified in this category are carried at fair value in the consolidated statements of
financial position. Changes in the fair value of such assets are accounted for in
consolidated statements of income. Financial instruments held at fair value through profit
or loss are classified as current if they are expected to be realized within 12 months from
the end of financial reporting period.
As of December 31, 2015 and 2014, the Group has no financial asset at FVPL.
Loans and receivables
Loans and receivables are non-derivative financial assets with fixed or determinable
payments and are not quoted in an active market. They arise when the Group provides
money, goods or services directly to a debtor with no intention of trading the receivables.
Such assets are carried initially at cost and at amortized cost subsequent to initial
recognition in the consolidated statements of financial position. Amortization is determined
using the effective interest method. Loans and receivables are included in current assets if
maturity is within 12 months from the end of financial reporting period. Otherwise, these
are classified as noncurrent assets.
The Group’s cash on hand, cash in banks and cash equivalents, accounts receivable
(excluding advances to suppliers and contractors), notes receivable
and refundable deposits under noncurrent assets are included in this category
(see Notes 6, 7, 8, 20 and 31).

- 18 -
Held-to-maturity investments
Held-to-maturity investments are non-derivative financial assets with fixed or determinable
payments and fixed maturities wherein the Group has the positive intention and ability to
hold to maturity. Held-to-maturity investments are carried at cost or amortized cost in the
consolidated statements of financial position. Amortization is determined by using the
effective interest method. Assets under this category are classified as current assets if
maturity is within 12 months from the end of financial reporting period and as non-current
assets if maturity is more than a year from the end of financial reporting period.
As of December 31, 2015 and 2014, the Group has no held-to-maturity investments.
Available-for-sale financial assets
Available-for-sale financial assets are those non-derivative financial assets that are
designated as available-for-sale or are not classified in any of the three preceding
categories. After initial recognition, available-for-sale financial assets are measured at fair
value with gains or losses being recognized as separate component of equity until the
investment is derecognized or until the investment is determined to be impaired at which
time the cumulative gain or loss previously reported in equity is included in the
consolidated statements of income.
The fair value of investments that are actively traded in organized financial market is
determined by reference to quoted market bid prices at the close of business on the end of
financial reporting period. For investments where there is no active market, fair value is
determined using valuation techniques. Such techniques include reference to recent arm’s
length market transaction, reference to the current market value of another instrument
which is substantially the same, discounted cash flows analysis and option pricing models.
The Group’s investment in shares of stocks in golf, sports and country clubs, listed and
non-listed companies are included in this category (see Note 11).
Financial Liabilities
Financial liability at FVPL
Financial liabilities are classified in this category if these result from trading activities or
derivatives transaction that are not accounted for as accounting hedges, or when the Group
elects to designate a financial liability under this category.
As of December 31, 2015 and 2014, the Group has no financial liabilities at FVPL.
Other financial liabilities
This category pertains to financial liabilities that are not held for trading or not designated
as at FVPL upon the inception of the liability. These include liabilities arising from
operations (e.g. payables excluding statutory regulated payables, accruals) or borrowing
(e.g., long-term debt).
The financial liabilities are recognized initially at fair value and are subsequently carried at
amortized cost, taking into account the impact of applying the effective interest rate
method of amortization (or accretion) for any related premium, discount and any directly
attributable transaction costs.
The Group’s accounts payable and accrued expenses, short-term and long-term debt, and
subscription payable are included in this category (see Notes 18, and 19).
- 19 -
Impairment of Financial Assets
The Group assesses at each end of financial reporting period whether a financial asset or group
of financial assets is impaired.
Assets carried at amortized cost. If there is objective evidence that an impairment loss on
loans and receivables carried at amortized cost has been incurred, the amount of the loss is
measured as the difference between the asset’s carrying amount and the present value of
estimated future cash flows (excluding future credit losses that have not been incurred)
discounted at the financial asset’s original effective interest rate (i.e., the effective interest
rate computed at initial recognition). The carrying amount of the asset shall be reduced
either directly or through use of an allowance account. The amount of the loss shall be
recognized in the Group’s consolidated statements of income.
The Group first assesses whether objective evidence of impairment exists individually for
financial assets that are individually significant, and individually or collectively for financial
assets that are not individually significant. If it is determined that no objective evidence of
impairment exists for an individually assessed financial asset, whether significant or not,
the asset is included in a group of financial assets with similar credit risk characteristics and
that group of financial asset is collectively assessed for impairment. Assets that are
individually assessed for impairment and for which an impairment loss is or continues to be
recognized are not included in a collective assessment of impairment.
If, in a subsequent period, the amount of the impairment loss decrease can be related
objectively to an event occurring after the impairment was recognized, the previously
recognized impairment loss is reversed. Any subsequent reversal of an impairment loss is
recognized in the consolidated statements of income to the extent that the carrying value
of the asset does not exceed its amortized cost at the reversal date.
Assets carried at cost. If there is objective evidence that an impairment loss has been
incurred in an unquoted equity instrument that is not carried at fair value because its fair
value cannot be reliably measured, or on a derivative asset that is linked to and must be
settled by delivery of such an unquoted equity instrument, the amount of the loss is
measured as the difference between the asset’s carrying amount and the present value of
estimated future cash flows discounted at the current market rate of return for a similar
financial asset.
Available-for-sale financial assets. If an available-for-sale financial asset is impaired, an
amount comprising the difference between its cost (net of any principal payment and
amortization) and its current fair value, less any impairment loss previously recognized in
the consolidated statement of income, is transferred from consolidated equity to the
consolidated statement of income. Reversals in respect of equity instruments classified as
available-for-sale financial assets are not recognized in the consolidated statement of
income. For available-for-sale financial assets, the Group assesses at each reporting date
whether there is objective evidence that an investment or a group of investments is
impaired. In the case of equity investments classified as available-for-sale financial assets,
objective evidence would include a significant or prolonged decline in the fair value of the
investment below its cost.
- 20 -
Where there is evidence of impairment, the cumulative loss, measured as the difference
between the acquisition cost and the current fair value, less any impairment loss on that
investment previously recognized in the consolidated statement of income, is removed
from consolidated equity and recognized in the consolidated statement of income.
Impairment losses on equity investments are not reversed through the consolidated
statement of income; increases in their fair value after impairment are recognized directly
in consolidated equity.
Derecognition of Financial Assets and Liabilities
Financial Assets
A financial asset is derecognized when (1) the rights to receive cash flows from the financial
instruments expire, (2) the Group retains the right to receive cash flows from the asset, but
has assumed an obligation to pay them in full without material delay to a third party under a
“pass-through” arrangement, or (3) the Group has transferred its rights to receive cash flows
from the asset and either has transferred substantially all the risks and rewards of the asset, or
has neither transferred nor retained substantially all the risks and rewards of the asset, but has
transferred control of the asset.
Where the Group has transferred its rights to receive cash flows of an asset or has entered into
a pass-through arrangement and has neither transferred nor retained substantially all the risks
and rewards of an asset nor transferred control of the assets, the asset is recognized to the
extent of the Group’s continuing involvement in the asset. Continuing involvement that takes
the form of a guarantee over the transferred asset is measured at the lower of the original
carrying amount of the asset and the maximum amount of consideration that the Group could
be required to repay.
Financial Liabilities
A financial liability is derecognized when the obligation under the liability is discharged,
cancelled or expired. Where the existing financial liability is replaced by another from the same
lender on substantially different terms, or the terms of an existing liability are substantially
modified, such an exchange or modification is treated as a derecognition of the original liability
and the recognition of a new liability, and the difference in the respective carrying amounts is
recognized in consolidated statements of income.
Classification of Financial Instrument between Debt and Equity
Financial instruments are classified as liabilities or equity in accordance with the substance of
the contractual arrangement. Interest relating to a financial instrument or a component that is
a financial liability is reported as expenses.
A financial instrument is classified as debt if it provides for a contractual obligation to:
(a) deliver cash or another financial asset to another entity; or (b) exchange financial assets or
financial liabilities with another entity under conditions that are potentially unfavorable to the
Group; or (c) satisfy the obligation other than by exchange of a fixed amount of cash or other
financial asset for a fixed number of own equity shares.
If the Group does not have an unconditional right to avoid delivering cash or another financial
asset to settle its contractual obligation, the obligation meets the definition of a financial
liability.
- 21 -
Offsetting Financial Instruments
Financial assets and financial liabilities are offset and the net amount is reported in the
consolidated statements of financial position if, and only if, there is a currently enforceable
legal right to offset the recognized amounts and there is an intention to settle on a net basis, or
to realize the asset and settle the liability simultaneously. This is not generally the case with
master netting agreements, and the related assets and liabilities are presented gross in the
consolidated statements of financial position.
Cash and cash equivalents
Cash is stated at face value and includes cash on hand and in banks. Cash equivalents are
short-term highly liquid investments that are readily convertible to known amounts of cash with
original maturities of three months or less and that are subject to an insignificant risk of change
in value.
Advances to Contractors and Suppliers
Advances to contractors and suppliers represent amounts paid in advance for goods or services
that are yet to be delivered and from which future economic benefits are expected to flow to
the Group within the normal operating cycle or within 12 months from the financial reporting
date. These are initially recorded at actual cash advanced and are subsequently applied
against subsequent purchases. Advances to contractors and suppliers are stated at realizable
value.
Advances to Officers and Employees
Advances to employees for business expenses that are yet to be received such as purchases of
goods and services subject to liquidation are recognized at the actual cash amount advanced to
employees, less any impairment. These are subsequently applied to the related assets, costs
or expenses incurred.
Real Estate Held for Sale and Land and Improvements
Real estate held for sale and land and improvements consisting of properties held for future
development are initially recorded at cost. Subsequent to initial recognition, these are valued
at the lower of cost and net realizable value (NRV). Cost includes the acquisition cost of the
land plus all costs incurred directly attributable to the development and improvement of the
properties. NRV is the estimated selling price in the ordinary course of business, less estimated
cost of completion and estimated costs necessary to make the sale. Transfers to or from real
estate held for sale, or land improvements are measured at the carrying values of the assets
transferred.
Inventories
Inventories are initially recorded at cost. Subsequent to initial recognition, these are valued at
the lower of cost and net realizable value.
Costs incurred in bringing inventory to its present conditions are accounted for as follows:
Finished goods and goods in process – cost includes direct materials and labor and
proportion of manufacturing overhead costs based on normal operating capacity but
excluding borrowing costs. Cost is determined by the moving average method.
Materials and supplies – at cost using the first-in-first out method.
- 22 -
At each reporting date, inventories are assessed for impairment. If inventory is impaired, the
carrying amount is reduced to its selling price less cots to complete and sell. The impairment
loss is recognized immediately in profit or loss. Provision for inventory losses is established for
estimated losses on inventories which are determined based on specific identification of slow -
moving, damaged, and obsolete inventories and charged to operations.
When inventories are sold, the carrying amount of those inventories is recognized in the period
in which the related revenue is recognized. The amount of any write – down of inventories to
net realizable value and all losses of inventories is as an expense in the period the write –
down or loss occurs. The amount of any reversal of any write – down of inventories, arising
from an increase in net realizable value, shall be recognized as a reduction in the amount of
inventories recognized as an expense in the period in which the reversal occurs.
Prepayments and Other Current Assets
Prepayments are expenses paid in advance and recorded as asset before they are utilized. This
account comprises the following:
Input Tax. Input tax is recognized when an entity in the Group purchases goods or
services from a Value Added Tax (VAT)-registered supplier. This account is offset, on a per
entity basis, against any output tax previously recognized. Input tax is stated at its
realizable value.
Prepaid Expenses. Prepaid expenses are apportioned over the period covered by the
payment and charged to the appropriate account in the Group statements of income when
incurred. Prepaid expenses are stated at its realizable value.
Creditable Withholding Tax. Creditable withholding tax is recognized for income taxes
withheld by customers. The balance as of end of each reporting period represents the
unutilized amount after deducting any income tax payable. Creditable withholding tax is
stated at its realizable value.
Prepayments and other assets that are expected to be realized for no more than 12 months
after the reporting period are classified as current asset. Otherwise, these are classified as
other noncurrent asset.
Deferred Input VAT
Deferred input VAT represents portion of input VAT incurred and paid in connection with
purchase of capital assets in excess of P=1 million per month. As provided by Republic Act
No. 9337 which is implemented by Revenue Regulation 4-2007, said portion of the input VAT
shall be deferred and depreciated over the shorter of the expected useful lives of said capital
asset or five years. Deferred Input VAT is stated at its realizable value.
Investment in an Associate
Investment in shares of stock where the Group holds 20% or more ownership, or where it has
the ability to significantly influence the investee company’s operating activities is accounted for
under the equity method. Under the equity method, the cost of the investment is increased or
decreased by the Group’s equity in net earnings or losses of the investee company since the
date of acquisition.
Any excess of the cost of acquisition over the Group’s share in the fair value of the identifiable
net assets of the associate at date of acquisition is recognized as goodwill. Any excess of the
fair value of the identifiable assets, liabilities and contingent liabilities and assets of the
- 23 -
investee company over cost is included in the determination of the Group’s share of the profit
or loss in the period in which the investment is acquired.
Under the equity method, investment in shares of stock is carried at cost adjusted by
post-acquisition changes in the Group’s share of the net assets of the investee. The Group’s
share in the investee’s post-acquisition profits or losses is recognized in the statements of
income, and its share of post-acquisition movements in reserves is recognized in reserves, if
any. The cumulative post-acquisition movements are adjusted against the carrying amount of
investment. The carrying value is also decreased for any cash or property dividends received.
Investment Properties
Investment properties consist of properties held to earn rental income, for capital appreciation
or both. These are initially recorded at cost, including transaction cost. The carrying amount
includes the cost of replacing part of an existing property at the time the cost are incurred if
the recognition criteria are met, and excludes the costs of day-to-day servicing of investment
properties. Subsequent to initial recognition, investment properties are carried at cost less
accumulated depreciation and any impairment in value.
Depreciation and amortization are computed on a straight-line method over estimated useful
lives ranging from 2 to 20 years. The useful lives and depreciation method are reviewed
periodically to ensure that the period and the method of depreciation are consistent with the
expected pattern of economic benefits from the use of the properties for lease.
Investment properties are derecognized when these are disposed of or when the investment
property is permanently withdrawn from use and there is no future economic benefit expected
to arise from the continued use of the properties. Any gain or loss on the retirement or
disposal of said properties are recognized in the consolidated statements of income in the year
of retirement or disposal. Transfers to, or from, investment property shall be made when, and
only when, there is a change in use, evidenced by: (a) commencement of owner-occupation,
for a transfer from investment property to owner-occupied property; (b) commencement of
development with a view to sale, for a transfer from investment property to inventories;
(c) end of owner occupation, for a transfer from owner-occupied property to investment
property; or, (d) commencement of an operating lease to another party, for a transfer from
inventories to investment property. Transfers to or from investment properties are measured
at the carrying value of the assets transferred.
Property and Equipment
Property and equipment are initially recorded at cost. Subsequent to initial recognition,
property and equipment are stated at cost less accumulated depreciation, amortization and any
impairment in value.
The initial cost of property and equipment comprises its purchase price or construction cost and
any directly attributable costs of bringing the asset to its working condition and location for its
intended use. Expenses incurred after the property and equipment have been put into
operation, such as repairs and maintenance and overhaul costs, are normally charged to
operations in the period when the costs are incurred.
In situations where it can be clearly demonstrated that the expenditures have resulted in an
increase in the future economic benefits expected to be obtained from the use of an item of
property and equipment beyond its originally assessed standard of performance, the
expenditures are capitalized as an additional cost of property and equipment.
- 24 -
Depreciation and amortization are computed using the straight-line method over the following
estimated useful lives, except for leasehold improvements, which are amortized over their
estimated lives or term of the lease, whichever is shorter and crushing equipment, which is
depreciated using units of production method based on estimated recoverable reserves:
Category Estimated useful life
RBD and fractionation machineries 2 to 25 years
Land improvements 1 to 10 years
Building and improvements 10 to 20 years
Leasehold improvements 2 to 5 years
Machinery and equipment 2 to 10 years
Furniture, fixtures and equipment 2 to 9 years
Transportation equipment 2 to 5 years
Tools and other equipment 2 to 5 years
Other assets 3 to 5 years
The useful life and depreciation and amortization methods are reviewed periodically to ensure
the period and method of depreciation and amortization are consistent with the expected
pattern of economic benefits from items of property and equipment.
An item of property and equipment is derecognized upon disposal or when no future economic
benefits are expected from its use or disposal. Any gain or loss arising on derecognition of the
asset (calculated as the difference between the net disposal proceeds and the carrying amount
of the asset) is included in the consolidated statements of income in the year the asset is
derecognized.
Construction in progress represents structures under construction and is stated at cost. This
includes cost of construction and other direct costs. Construction in progress is not depreciated
until such time the relevant assets are completed and ready for operational use.
Intangibles
Intangible assets acquired separately are measured on initial recognition at cost. The cost of
intangible assets acquired in a business combination is recognized at fair value at acquisition
date. Following initial recognition, intangible assets are carried at cost less any accumulated
amortization and any accumulated impairment losses. Internally generated intangible assets
are not capitalized and expenditure is reflected in the consolidated statements of income in the
year in which the expenditure is incurred. The useful lives of intangible assets are assessed to
be either finite or indefinite. The intangible asset recognized and determined by the Group has
finite useful lives and represents leasehold rights.
Intangible assets with finite lives are amortized over the straight-line method over their useful
economic lives of three (3) to twenty (20) years and assessed for impairment whenever there
is an indication that the intangible assets may be impaired. The amortization period and
method for an intangible asset with a finite useful life is reviewed at least annually. Changes in
expected useful life or the expected pattern of consumption of future economic benefits
embodied in the asset is accounted for by changing the amortization period or method, as
appropriate, and treated as changes in accounting estimates. The amortization expense on
intangible assets with finite lives is capitalized as part of the “Biological assets” account in the
in the consolidated statements of financial position consistent with the function of the intangible
asset.
- 25 -
Biological Assets and Agricultural Produce The Group’s biological assets include growing palm oil seedlings, which are grouped according to their physical state, transformation capacity and location/areas. These are carried at
accumulated costs net of any amortization and impairment losses. The costs and expenses incurred up to the start of the productive stages are accumulated and amortized over the estimated produce of the palm trees. The Group uses the cost method of valuation since fair value cannot be measured reliably. The Group’s biological assets have no active market and no active market for similar assets is available in the Philippine industry.
The Group’s agricultural produce consists of those harvested from the biological assets and is
measured at fair value less costs to sell at the point of harvest. The fair value of the Group’s
agricultural produce approximates the costs.
The total estimated production of the Group’s biological assets is based on the expected crop
yield over its expected lifespan which is patterned on the scientific studies conducted on
neighboring countries wherein similar biological assets are also grown. Unit-of-harvest method
is used in determining the periodic amortization over the estimated yield of the crops over its
life span.
The carrying values of the biological assets are reviewed for impairment when events or changes in circumstances indicate that the carrying value may not be recoverable.
Goodwill
Goodwill arising from the acquisition of a subsidiary or a jointly controlled entity represents the
excess of the cost of acquisition over the Group’s interest in the net fair value of the identifiable
assets, liabilities and contingent liabilities of the subsidiary or jointly controlled entity
recognized at the date of acquisition. Goodwill is initially recognized as an asset at cost and is
subsequently measured at cost less any accumulated impairment losses. Goodwill is reviewed
for impairment annually or more frequently, if changes in circumstances indicate that the
carrying value may be impaired. An impairment loss is recognized for goodwill is not reversed
in a subsequent period. Negative goodwill, which is the excess of net fair value of subsidiaries’
identifiable assets, liabilities and contingent liabilities over the cost of the business combination,
is immediately recognized as income.
On disposal of a subsidiary or a jointly controlled entity, the attributable amount of goodwill is
included in the determination of the profit or loss on disposal.
Investments and Deposits
This account which represents amount paid for deposits for future stock subscriptions of the
capital stock of investee companies is stated at cost (actual amount of cash paid) less any
impairment.
- 26 -
Impairment of Non-financial Assets
The carrying values of nonfinancial assets such as prepayments and other current assets,
investment properties, property and equipment, biological assets carried at cost, leasehold
rights and investments and deposits are reviewed for impairment when events or changes in
circumstances indicate that the carrying values may not be recoverable. If any such indication
exists, and if the carrying value exceeds the estimated recoverable amount, the assets or cash
generating units are written down to their recoverable amounts. The recoverable amount of
the asset is the greater of net selling price or value in use. The net selling price is the amount
obtainable from the sale of an asset in an arm’s-length transaction less cost to sell. In
assessing value in use, the estimated future cash flows are discounted to their present value
using a pre-tax discount rate that reflects current market assessments of the time value of
money and the risks specific to the asset. For an asset that does not generate largely
independent cash flows, the recoverable amount is determined for the cash-generating unit to
which the asset belongs. An impairment loss is charged to operations in the period in which it
arises unless the asset is carried at a revalued amount in which case the impairment is charged
to the revaluation increment of the said asset.
An assessment is made at each end of financial reporting period to determine whether there is
any indication that an impairment loss previously recognized for an asset in prior years may no
longer exist or may have decreased. If any such indication exists, the asset’s recoverable
amount is estimated.
A previously recognized impairment loss is reversed only if there has been a change in the
estimates used to determine the recoverable amount of an asset, however, not to an amount
higher than the carrying amount that would have been determined (net of any depreciation),
had no impairment loss been recognized for the asset in prior years. Such reversal is
recognized in profit or loss. After such a reversal, the depreciation charge is adjusted in future
periods to allocate the asset’s revised carrying amount, less any residual value, on a systematic
basis over its remaining useful life.
Equity
Capital stock is determined using the nominal value of shares that have been issued.
Additional paid-in capital includes any premiums received on the initial issuance of share
capital. Any transaction costs associated with the issuance of shares are deducted from
additional paid-in capital, net of any related income tax benefits.
Net unrealized gain on available-for-sale investments accounts for the excess of the fair value
over the carrying amounts of these investments. When fluctuation is deemed permanent, the
gain or loss resulting from such fluctuation will be reversed and charged to consolidated
statements of income in the year that the permanent fluctuation is determined.
Remeasurement gains and losses on retirement benefits are recognized immediately in other
comprehensive income (loss) in equity in the period in which they arise. Remeasurements are
not reclassified to profit or loss in subsequent periods.
Treasury shares are stated at the cost of reacquiring such shares.
Retained earnings include all current and prior period results as disclosed in the consolidated
statements of income.
- 27 -
Non-controlling Interests
Non-controlling interest represents the interest in a subsidiary, which is not owned, directly or
indirectly through subsidiaries, by the Group. If losses applicable to the minority interest in a
subsidiary exceed the minority interest’s equity in the subsidiary, the excess, and any further
losses applicable to the minority interest, are charged against the majority interest except to
the extent that the minority has a binding obligation to, and is able to, make good the losses.
If the subsidiary subsequently reports profits, the majority interest is allocated all such profits
until the minority interest’s share of losses previously absorbed by the majority interest has
been recovered.
Earnings per Share (EPS)
Basic earnings per share is determined by dividing net profit for the year by weighted average
number of common shares outstanding during the year (after retroactive adjustment for any
stock dividends declared in the current year).
Diluted EPS is computed by dividing net profit for the year by the weighted average number of
common shares issued and outstanding during the year after giving effect to assumed
conversion of potential common shares.
In determining both the basic and diluted earnings per share, the effect of stock dividends, if
any, is accounted for retroactively.
Revenue Recognition
Revenue is recognized to the extent that it is probable that the economic benefits associated
with the transactions will flow to the Group and the amount of revenue, related cost incurred or
to be incurred/cost to complete the transactions can be measured reliably. The Group assesses
its revenue arrangements against specific criteria in order to determine if it is acting as a
principal or agent. The Group has concluded that it is acting as a principal in all of its revenue
arrangements. Revenue is measured at the fair value of the consideration received or
receivable taking into account any trade discounts, prompt settlement of discounts and volume
rebates allowed by the Group, if any. Revenue recognized excludes any value added
taxes. The following specific recognition criteria must also be met before revenue is
recognized:
Sale of real estate
Sale of real estate is recognized in full provided the profit is determinable, and the earning
process is virtually complete. Specifically, revenue recognition is applied to sale if
construction development is almost complete, sufficient cumulative down payment has
been received, and that collectability of sales price is reasonably assured.
The percentage of completion method is used to recognize revenue from sales of projects
where the Group has material obligations to complete the project after the property is sold.
Under this method, revenue is recognized as the related obligations are fulfilled, measured
principally on the basis of the estimated completion of a physical proportion of the contract
work.
Pending recognition of sale when conditions for recording a sale are not met, cash received
from buyers are presented under “Deposit from customers” in the liability section of the
consolidated statements of financial position. Any excess of collections over the recognized
receivables are also included in the said account.
- 28 -
Sale of goods (e.g. crude palm oil, agricultural produce, food and beverage items)
Revenue is recognized when the risks and rewards are transferred to the buyer, specifically,
upon delivery or shipment of goods to customers.
Cash received from the Group’s customers for sales that do not meet the revenue
recognition criteria (i.e., transfer of risk and rewards to customers through actual delivery
of inventories) as at reporting date are included in “Deposit from customers”. These
customers’ deposits will be applied against future deliveries of inventories which are
generally completed within the next twelve months.
Water service income
Revenue is recognized when services are rendered and normally when billed.
Hotel operations
Revenue is recognized when the services are rendered and when goods are delivered to the
buyer.
Interest income
Interest income is recognized as the interest accrues, taking into account the effective yield
on the asset. Interest income from bank deposits is recognized on a time proportion basis
on the principal outstanding and at the rate applicable.
Rental income
Rental income on leased properties arising from operating leases or investment properties
is accounted for on a straight-line basis over the lease term.
Dividend income
Dividend income is recognized when the shareholders’ right to receive payment is
established.
Realized gains and losses
Realized gains and losses are recognized when the sale transaction occurs.
Penalties, surcharges and other income
Revenue is recognized as these accrue.
Other services
Revenue is recognized the extent of services rendered.
Cost and Expense Recognition Contract costs include all direct materials and labor costs and those indirect costs related to
contract performance. Expected losses on contracts are recognized immediately when it is
probable that the total contract costs will exceed total contract revenue. Changes in contract
performance, contract conditions and estimated profitability, including those arising from
contract penalty provisions, and final contract settlements which may result in revisions to
estimated costs and gross margins are recognized in the year in which the changes are
determined.
Costs of sales of goods are recognized when goods are sold upon delivery to buyers. Cost of
service, operating and other expenses which include expenses related to administering and
operating the business and are expensed upon utilization of the service or at the date they are
incurred. Interest and similar expenses are reported on accrual basis.
- 29 -
Pre-operating Expenses
Pre-operating expenses are expensed as incurred.
VAT
Revenues, expenses and assets are recognized, net of the amount of VAT, except when VAT
incurred on a purchase of assets or services is not recoverable from the taxation authority, in
which case VAT is recognized as part of the cost of acquisition of the asset or as part of the
expense item, as applicable.
The net amount of VAT recoverable from, or payable to, the taxation authority is included as
part of "Prepayments and other current assets" or "Accounts payable and accrued expenses" in
the consolidated statement of financial position.
Operating Lease
Group as a lessee
Leases of assets under which the lessor effectively retains all the risks and reward of ownership
are classified as operating lease. Operating lease payments are recognized as expense in the
consolidated statements of income on a straight-line basis over the lease term. Associated
costs such as repairs and maintenance and business taxes are expensed when incurred.
Group as a lessor
Leases where the Group does not transfer substantially all the risks and benefits of the
ownership of the assets are classified as operating leases. Operating lease receipts are
recognized in the consolidated statements of income on a straight-line basis over the lease
term.
Employee Benefits
Short-Term Benefits
Short-term employee benefits are recognized as expense at undiscounted amount expected to
be paid in exchange of service in the period when the economic benefits are given. Unpaid
benefits at end of the accounting period are recognized as accrued expense while benefits paid
in advance are recognized as prepayment to the extent that it will lead to a reduction in future
payments. Short-term employee benefits given by the Company includes salaries and wages,
life and health insurances, social security system contributions, short-term compensated
absences, bonuses and other non-monetary benefits.
Retirement Benefit Costs
Pension asset or liability, as presented in the consolidated statement of financial position, is the
aggregate of the present value of the defined benefit obligation at the end of the reporting
period reduced by the fair value of plan assets, adjusted for the effect of limiting a net defined
benefit asset to the asset ceiling. The asset ceiling is the present value of any economic
benefits available in the form of refunds from the plan or reductions in future contributions to
the plan.
The cost of providing benefits under the defined benefit plan is actuarially determined using the
projected unit credit method. The retirement benefit costs comprise of the service cost, net
interest on the net defined benefit liability or asset and remeasurements of net defined benefit
liability or asset.
Service costs which include current service costs, past service costs and gains or losses on
nonroutine settlements are recognized as expense in profit or loss. Past service costs are
recognized when plan amendment or curtailment occurs. These amounts are calculated
periodically by independent qualified actuaries.
- 30 -
Net interest on the net defined benefit liability or asset is the change during the period in the
net defined benefit liability or asset that arises from the passage of time which is determined
by applying the discount rate based on government bonds to the net defined benefit liability or
asset. Net interest on the net defined benefit liability or asset is recognized as expense or
income in profit or loss.
Remeasurements comprising actuarial gains and losses, difference between return on plan
assets and interest income (calculated as part of the net interest) and any change in the effect
of the asset ceiling (excluding net interest on defined benefit liability) are recognized
immediately in other comprehensive income (loss) in the period in which they arise.
Remeasurements are not reclassified to profit or loss in subsequent periods.
Plan assets are assets that are held in trust and managed by a trustee bank. Plan assets are
not available to the creditors of the Group, nor can they be paid directly to the Group. The fair
value of plan assets is based on market price information. When no market price is available,
the fair value of plan assets is estimated by discounting expected future cash flows using a
discount rate that reflects both the risk associated with the plan assets and the maturity or
expected disposal date of those assets (or, if they have no maturity, the expected period until
the settlement of the related obligations). If the fair value of the plan assets is higher than the
present value of the defined benefit obligation, the measurement of the resulting defined
benefit asset is limited to the present value of economic benefits available in the form of
refunds from the plan or reductions in future contributions to the plan.
The Group's right to be reimbursed of some or all of the expenditure required to settle a
defined benefit obligation is recognized as a separate asset at fair value when and only when
reimbursement is virtually certain.
Termination Benefits
Termination benefits are employee benefits provided in exchange for the termination of an
employee's employment as a result of either an entity's decision to terminate an employee's
employment before the normal retirement date or an employee's decision to accept an offer of
benefits in exchange for the termination of employment.
A liability and expense for a termination benefit is recognized at the earlier of when the entity
can no longer withdraw the offer of those benefits and when the entity recognizes related
restructuring costs. Initial recognition and subsequent changes to termination benefits are
measured in accordance with the nature of the employee benefit, as either post-employment
benefits, short-term employee benefits, or other long-term employee benefits.
Employee Leave Entitlement
Employee entitlements to annual leave are recognized as a liability when they are accrued to
the employees. The undiscounted liability for leave expected to be settled wholly before twelve
months after the end of the annual reporting period is recognized for services rendered by
employees up to the end of the reporting period.
Borrowing Cost
Borrowing costs that are directly attributable to the acquisition or construction of a qualifying
asset while the asset, which includes intangibles and property and equipment, is being
constructed are capitalized as part of the cost of that asset. Capitalization of borrowing cost
should commence when: (i) expenditures for the asset and borrowing costs are being incurred;
and (ii) activities that are necessary to prepare the asset for its intended use or sale are in
progress. Capitalization ceases when the asset is substantially ready for its intended use or
sale. If active development is interrupted for an extended period, capitalization is suspended.
- 31 -
When construction occurs piecemeal and use of each part is possible as construction continues,
capitalization of each part ceases upon substantial completion of that part. For borrowing
associated with a specific asset, the actual rate on that borrowing is used. Otherwise, a
weighted average cost of borrowing is used.
All other borrowing costs are expensed as incurred.
Foreign Currency Transactions
The consolidated financial statements are presented in Philippine Pesos, which is the Group’s
functional and presentation currency. Items included in the consolidated financial statements
of each entity are measured using the functional currency. Transactions in foreign currencies
are initially recorded in the functional currency rate prevailing at the date of the transaction.
Monetary assets and liabilities denominated in foreign currencies are restated at the functional
currency rate of exchange as of the financial reporting date. Gains or losses arising from these
transactions and translations are recognized in the consolidated statements of income. Non-
monetary items measured at fair value in a foreign currency are translated using the exchange
rates at the date when the fair value was determined.
Income Tax
Income taxes represent the sum of the tax currently due and deferred tax.
The tax currently due is based on taxable income for the year. Taxable income differs from
income as reported in the consolidated statements of income because it excludes items of
income or expenses that are taxable or deductible in other years and it further excludes items
that are never taxable or deductible. The Group’s liability for current income tax is calculated
using tax rates that have been enacted or substantively enacted at the end of financial
reporting period.
Deferred tax is provided, using the liability method. Deferred tax assets and liabilities are
recognized for future tax consequence attributable to differences between the financial
reporting bases of assets and liabilities and their related tax bases. Deferred tax assets are
recognized for all deductible temporary differences, carryforward benefit of unused tax credits
from excess minimum corporate income tax (MCIT) and carryforward benefit of unused net
operating loss carryover (NOLCO), to the extent that it is probable that taxable profit will be
available against which the deductible temporary difference can be utilized. Deferred tax
liabilities are recognized for all taxable temporary differences. Deferred tax assets and
liabilities are measured using the tax rate that is expected to apply to the period when the
asset is realized or the liability is settled.
The carrying amount of deferred tax assets is reviewed at each end of financial reporting period
and reduced to the extent that it is no longer probable that sufficient taxable profit will be
available to allow all or part of the deferred income tax assets to be utilized.
Related Party Transactions and Relationships
Related party transactions are transfers of resources, services or obligations between the
company and its related parties, regardless whether a price is charged. Parties are considered
to be related if one party has the ability to control the other party or exercise significant
influence over the other party in making financial and operating decisions. These parties
include: (a) individuals owning, directly or indirectly through one or more intermediaries,
control or are controlled by, or under common control with the Group; (b) associates;
(c) and, individuals owning, directly or indirectly, an interest in the voting power of the Group
that gives them significant influence over the Group and close members of the family of any
such individual.

- 32 -
In considering each possible related party relationship, attention is directed to the substance of
the relationship and not merely on the legal form.
Deposit for Future Stock Subscription
Deposit for future stock subscriptions which are received in view of call for future subscriptions
are stated at actual amount of cash received.
Provisions
A provision is recognized when the Group has a present obligation (legal or constructive) as a
result of past event, it is probable that an outflow of resources embodying economic benefits
will be required to settle the obligation, and a reliable estimate can be made of the amount of
the obligation. If the effect of the time value of money is material, provisions are determined
by discounting the expected future cash flows at a pre-tax rate that reflects current market
assessment of the time value of money and, where appropriate, the risks specific to the
liability. Where discounting is used, the increase in the provision due to passage of time is
recognized as a financial expense.
Contingencies
Contingent liabilities are not recognized in the consolidated financial statements. They are
disclosed unless the possibility of an outflow of resources embodying economic benefits is
remote. A contingent asset is not recognized in the consolidated financial statements but
disclosed when an inflow of economic benefit is probable.
Segment Reporting
For management purposes, the Group is organized into six (6) major operating businesses
which comprise the bases on which the Group reports its primary segment information.
Financial information on business segments is presented in Note 35. The Group has no
geographical segments as all of the companies primarily operate in the Philippines only.
Segment revenue, expenses and performance include transfers between business segments.
The transfers are accounted for at competitive market prices charged to unaffiliated customers
for similar products and services. The measurement policies the Group used for segment
reporting are the same as those used in the consolidated financial statements. There have
been no changes from prior periods in the measurement methods used to determine profit and
loss. No asymmetrical allocations have been applied between segments.
Inter-segment assets, liabilities, revenue, expenses and results are eliminated in the
consolidated financial statements.
Events After End of Financial Reporting Period
Post year-end events that provide additional information about the Group’s position at the end
of financial reporting period, if any, are reflected in the consolidated financial statements.
However, post year-end events that are not adjusting events are disclosed in the notes to the
consolidated financial statements when material.
- 33 -
5. Significant Accounting Judgments, Estimates and Assumptions
The preparation of the Group’s consolidated financial statements in conformity with PFRS
requires management to make estimates and assumptions that affect the amounts reported in
the consolidated financial statements and accompanying notes. The estimates and
assumptions used in the accompanying consolidated financial statements are based upon
management’s evaluation of relevant facts and circumstances as of date of the consolidated
financial statements. Actual results could differ from such estimates, and such estimates will
be adjusted accordingly.
The following is a summary of these significant estimates and judgments and the related
impact and associated risks on the consolidated financial statements.
Judgments
In the process of applying the Group’s accounting policies, management has made the following
judgments, apart from those involving estimations, which have the most significant effect on
the amounts recognized in the financial statements:
Determination of Control
The Parent Company determines control when it is exposed, or has rights, to variable
returns from its involvement with an entity and has the ability to affect those returns
through its power over the equity. The Parent Company controls an entity if and only if the
Parent Company has all of the following:
Power over the entity;
Exposure, or rights, to variable returns from its involvement with the entity; and,
The ability to use its power over the entity to affect the amount of the Parent
Company's returns.
The Parent Company regularly reassesses whether it controls an investee if facts and
circumstances indicate that there are changes to one or more of the three elements of
control listed above.
Real Estate Revenue and Cost Recognition
In determining whether economic benefits will flow to the Group and the revenue can be
reliably measured, the Group assesses certain judgments based on buyers’ commitment on
sale which may be ascertained through the significance of the buyer’s initial down payment,
and stage of completion of the project development. Total costs of property development
are based on cost estimates made by the Group’s technical personnel made in concurrence
with management. These estimated costs are reviewed at least annually and are updated if
expectations differ from previous estimates. Changes are mainly due to adjustments in
development plan, materials and labor prices.
Also, the Group’s revenue recognition policies require management to make use of
estimates and assumptions that may affect the reported amounts of revenue and costs.
The Group’s revenue from real estate sales are recognized based on the percentage-of-
completion and the completion rate is measured principally on the basis of the estimated
completion of a physical proportion of the contract work, and by reference to the actual
costs incurred to date over the estimated total costs of projects. Revenue and costs from
sale of real estate are shown in Notes 22 and 25, respectively.
- 34 -
Determination of Fair Value of Financial Instruments
The Group carries certain financial instruments at fair value or discloses the fair values of
its financial instruments, which requires extensive use of accounting estimates and
judgment. While significant components of fair value measurement were determined using
verifiable objective evidence, the amount of changes in fair value would differ if the Group
utilized different valuation methodologies and assumptions. Any changes in fair value of
these financial assets and liabilities would affect income and loss and equity.
The summary of the carrying values and fair values of the Group’s financial instruments as
of December 31, 2015 and 2014 is shown in Note 31.
Classification of Financial Instruments
The Group classifies a financial instrument, or its component parts, on initial recognition
financial liability or an equity instrument in accordance with the substance of the
contractual definitions of a financial asset, a financial liability or an equity instrument. The
substance rather than its legal form, governs its classification in the consolidated
statements of financial position.
Classification of Leases
The Group has entered into various lease agreements as either a lessor or a lessee. Critical
judgment was exercised by management to distinguish each lease agreement as either an
operating or finance lease by looking at the transfer or retention of significant risk and
rewards of ownership of the properties covered by the agreements. Currently, all of the
Group’s lease agreements are determined to be operating leases.
Rental expense and income for 2015 and 2014 are shown in Notes 26 and 28.
Distinction Between Investment Property and Owner-Occupied Property
The Group determines whether a property qualifies as investment property. In making its
judgment, the Group considers whether the property generates cash flows largely
independent of the other assets held by an entity. Owner-occupied properties generate
cash flows that are attributable not only to property but also to the other assets used in the
supply process.
Some properties are held to earn rentals or for capital appreciation and other properties are
held for use in rendering of services or for administrative purposes. If these portions
cannot be sold separately, the property is accounted for as investment property only if an
insignificant portion is held for use in providing services or for administrative
purposes. Judgment is applied in determining whether ancillary services are so significant
that a property does not qualify as investment property. The Group considers each
property in making its judgment.
Operating Lease Commitments – Company as a Lessor
The Company has entered into various lease agreements as a lessor. The Company has
determined, based on an evaluation of the terms and conditions of the arrangements that it
retains all the significant risks and rewards of ownership of the properties and, thus,
accounts for the contracts as operating leases.
- 35 -
Operating Lease Commitments – Company as a Lessee
The Company has entered into various lease agreements as a lessee. Management has
determined that all the significant risk and benefits of ownership of the properties, which
the Company leases under operating lease arrangements, remain with the
lessor. Accordingly, the leases were accounted for as operating leases.
Determination of Functional Currency
Based on the economic substance of the underlying circumstances relevant to the Group,
the functional currency of the Group has been determined to be the Philippine Peso. The
Philippine Peso is the currency of the primary economic environment in which the Group
operates. It is the currency that mainly influences the sale of real properties, services, and
investments and the costs of providing the services and of the sold investments.
Measurement of Refundable Deposits and Utility Deposits
The fair value of refundable deposits under noncurrent assets which significantly include
utility deposits are not readily determinable nor reliably measured because the actual
timing of receipt is linked to the cessation of the service of the utility or service entities to
the Group which cannot be reasonably predicted. Accordingly, the refundable deposits are
carried at cost less any impairment. The carrying value of refundable deposits shown
under noncurrent assets amounted to P=11,052,656 and P=8,999,549 as of
December 31, 2015 and 2014, respectively.
Estimates
The key assumptions concerning the future and other key sources of estimation at the
reporting date that have a significant risk of causing a material adjustment to the carrying
amount of assets and liabilities within the next financial year are discussed below:
Estimation of Allowances for Doubtful Accounts
Recoverability of specific receivables including amounts due from related parties is
evaluated based on the best available facts and circumstances, the length of the Group’s
relationship with its customers and debtors, the customers or debtors’ payment behavior
and known market factors. These specific reserves are reevaluated and adjusted as
additional information received affects the amount estimated to be uncollectible. Any
increase in allowance would increase operating expenses and decrease related accounts.
The Group’s allowance for doubtful accounts amounted to P=453,225 and P=1,364,796 as of
December 31, 2015 and 2014, respectively (see Note 7). The carrying values of accounts
receivables and notes receivable as of December 31, 2015 and 2014 are shown in Notes 7
and 8, respectively.
Estimation of Impairment of Other Available-for-Sale Investments
The computation for the impairment of available-for-sale financial assets requires an
estimation of the present value of the expected future cash flows and the selection of an
appropriate discount rate. An impairment issue arises when there is an objective evidence
of impairment, which involves significant judgment and estimates. In making this
judgment, the Group evaluates the financial health of the issuer, among others. In the
case of available-for-sale equity instruments, the Group expands its analysis to consider
changes in the issuer’s industry and sector performance, legal and regulatory framework,
changes in technology, and other factors that affect the recoverability of the Group’s
investments. In the case of refundable utility deposits, the Group considers the utility
service companies’ ability to continuously provide the services. Any increase in impairment
on financial assets would increase operating expenses and decrease the related accounts.
- 36 -
The carrying values of available-for-sale investments amounted to P=988.9 million and
P=626.5 million as of December 31, 2015 and 2014, respectively (see Note 11).
Estimation of Useful Lives of Certain Assets
The Group estimates the useful lives of investment properties, property and equipment and
intangible assets based on the period over which the assets are expected to be available
for use. The useful lives of intangible assets are assessed at the individual asset level as
having either a finite or indefinite life. Intangible assets are regarded to have an indefinite
useful life when, based on analysis of all of the relevant factors, there is no foreseeable
limit to the period over which the asset is expected to generate net cash inflows for the
Group. The estimated useful lives of these assets are reviewed periodically and are
updated if expectations differ from previous estimates due to physical wear and tear,
technical or commercial obsolescence and legal or other limits on the use of the assets. In
addition, the estimation of the useful lives of these assets is based on collective
assessment of internal technical evaluation and experience with similar assets, if any. It is
possible, however, that future results of operations could be materially affected by changes
in estimates brought about by any changes in factors mentioned. The amounts and timing
of recorded expenses for any period would be affected by changes in these factors and
circumstances. A reduction in the estimated useful lives of investment properties, property
and equipment and intangible assets would increase recorded operating expenses and
decrease the related noncurrent assets. There were no significant changes on the
estimated useful lives of the abovementioned assets.
The carrying values of the Group’s depreciable investment properties, property and equipment, and leasehold rights as of December 31, 2015 and 2014 are shown in Notes 13, 14 and 17, respectively.
As of December 31, 2015 and 2014, the Group’s property and equipment have no residual
values.
Estimation of Net Realizable Value of Real Estate Held for Sale, Inventories and Land and
Improvements
In determining the net selling prices of real estate held for sale and other inventories, and
land and improvements, management takes into account the most reliable evidence of fair
value available at the time the estimates are made. The net realizable value is calculated
in an effort to prevent the Group from under or over estimating the value of such
assets. The Group adjusts the cost of the assets to the recoverable value at a level
considered adequate to reflect obsolescence or decline in value of the recorded amounts, if
any. Provision for obsolescence or decline in value is established based on the evaluation
of age and movement of inventories, and current selling prices of real estate held for sale
and land and improvements. Any increase in provision for decline in value or obsolescence
would increase recorded expenses and decrease the related assets.
As of December 31, 2015 and 2014, the carrying values of real estate held for sale,
inventories and land and improvements are shown in Notes 9, 10 and 15, respectively.

- 37 -
Estimation of Impairment and Recoverable Values of Non-financial Assets
The Group reviews prepayment and other current assets, investment in associates,
investment properties, property and equipment, biological assets and leasehold rights,
investment and deposits for impairment of value. This includes considering certain
indications of impairment such as significant changes in asset usage, significant decline in
assets’ market value, obsolescence or physical damage of an asset, plans in the real estate
projects, significant underperformance relative to expected historical or projected future
operating results and significant negative industry or economic trends. The Group
estimates the recoverable amount as the higher of the net selling price and value in use.
In determining the present value of estimated future cash flows expected to be generated
from the continued use of the assets, the Group is required to make estimates and
assumptions that may affect certain non-financial assets.
The Group’s allowance for impairment loss pertaining to an investment property amounted
to P=20.9 million and P=16.8 million as of December 31, 2015 and 2014, respectively
(see Note 13). Provision for impairment loss recognized in the consolidated statements of
income amounted to P=4.1 million in 2015 and P=1.5 million in 2014. As of December 31,
2015 and 2014, the recoverable values of the Group’s nonfinancial assets approximate their
carrying values.
The carrying amounts of investment properties, property and equipment, biological assets
and leasehold rights are disclosed in Notes 13, 14, 16 and 17, respectively.
Estimation of Pension and Other Retirement Benefits
The determination of the Group’s obligation and cost for pension and other retirement
benefits is dependent on management’s selection of certain assumptions used by actuaries
in calculating such amounts.
The assumptions for obligations and cost of retirement benefits are described in Note 27,
and include among others, discount rates and rates of compensation increase. In
accordance with PFRS, actual results that differ from our assumptions generally affect the
Group’s recognized expense and recorded obligation in such future periods. While
management believes that the assumptions are reasonable and appropriate, significant
differences in actual experience or significant changes in management assumptions may
materially affect the Group’s pension and other retirement obligations. Any changes in
assumptions would increase or decrease the net retirement liability and the amount
recognized in total comprehensive account.
Retirement liability amounted to P=32.7 million and P=26.6 million as of December 31, 2015
and 2014, respectively (see Note 27).
Estimation of Deferred Income Tax Assets and Deferred Tax Liabilities
Significant judgment is required in determining provision for income taxes. There are many
transactions and calculations for which the ultimate tax determination is uncertain during
the ordinary course of business. Where the final tax outcome of these matters is different
from the amounts that were initially recorded, such differences will impact the income tax
and deferred income tax in the period in which such determination is made.
The Group’s deferred income tax assets amounted to P=40.6 million and P=51.3 million as of
December 31, 2015 and 2014, respectively (see Note 29). The Group’s deferred tax
liabilities amounted to P=82.4 million and P=84.4 million as of December 31, 2015 and 2014,
respectively (see Note 29).
- 38 -
Estimation of Provisions for Contingencies
The estimate of the probable costs for the resolution of possible third party claims including
current tax assessments, if any, is developed in consultation with outside consultant
handling the Group’s defense on these matters and is based upon an analysis of potential
results. When management and its outside consultant/legal counsel believe that the
eventual liabilities under these claims, if any, will not have material effect on the Group’s
financial statements, no provision for probable losses is recognized in the Group’s financial
statements. The Group has an outstanding assessment for taxable year 2011 from the
Bureau of Internal Revenue amounting to P=24.9 million. The Group protested such
assessment which is currently re-investigated. No provision for losses is recognized in the
Group’s financial statements in 2015 and 2014 as management believes that there will be
no eventual liability for the current tax assessment.
Estimation of Production and Amortization of Biological Assets
The total estimated production of the Group’s biological assets is based on the expected
crop yield over its expected lifespan which is patterned on the scientific studies conducted
on neighboring countries wherein similar biological assets are also grown. Unit-of-harvest
method is used in determining the periodic amortization over the estimated yield of the
crops over its life span. Any decrease in estimated production would increase the
amortization per unit and decrease related assets.
As of December 31, 2015 and 2014, the net carrying value of the Group’s biological assets
amounted to P=403.7 million and P=335.0 million, respectively (see Note 16).
Estimation of the Number of Years of Various Stages of Life of Biological Assets
Management estimates the number of years of the various stages of the life of biological assets (i.e., planting, growing, productive/fruiting, harvesting and commercially fruiting
stages) based on certain factors including the elevation and climate conditions of the plantation area.
In 2015 and 2014, management has assessed that the reasonable growing stage in years
of biological assets in certain plantation area is longer compared to that of other areas.
The longer growing stage is due to the high elevation and colder climate condition of such
area (see Note 16).
6. Cash and Cash Equivalents
This account consists of:
2015 2014
Cash on hand P=861,629 P=950,258
Cash in banks 43,058,852 92,004,617
Cash equivalents – 90,187
P=43,920,481 P=93,045,062
Cash in banks pertain to savings and current accounts that generally earned interest based on
prevailing respective bank deposit rates of approximately less than 1% annually.
- 39 -
The Group’s cash in banks include dollar denominated accounts with Peso equivalents
amounting to P=389,395 and P=3,903,799 as of December 31, 2015 and 2014, respectively. The
Group’s foreign currency denominated cash account is translated to Peso equivalents using an
exchange rate of P=47.166/$1.00 and P=44.617/$1.00 as of December 31, 2015 and 2014,
respectively.
In 2013, the Parent Company established and opened a project deposit account with the
Development Bank of the Philippines for the purpose of complying with the requirements of
Republic Act No. 7279, otherwise known as the “Urban Development and Housing Act of 1992”
relative to the Parent Company’s socialized housing at West Highland Subdivision Project
located in Butuan, Agusan Del Norte. As of December 31, 2015 and 2014, total cash in bank
set-aside as project deposit account amounted to P=1.3 million and P=0.1 million, respectively.
Cash equivalents include short-term money market placements placed by the Group in a local
bank. These have a maturity of less than 90 days with an interest of 1.05% to 3.6% per
annum in 2014.
Financial income recognized in the consolidated statements of income on cash in banks and
cash equivalents amounted to P=64,506 in 2015, P=245,492 in 2014 and P=8,095,676 in 2013
(see Note 23).
7. Accounts Receivable - Net
This account consists of:
Note 2015 2014
Contract receivables on sale of real estate P=438,734,960 P=373,582,691
Trade receivables 13,130,365 42,960,188
Advances to officers and employees 1,427,312 9,382,960
Accrued interest receivable 8 – 66,111
Others 93,021,934 113,396,097
Total receivables 546,314,571 539,388,047
Allowance for doubtful accounts (453,225) (1,364,796)
Net carrying amount 545,861,346 538,023,251
Less: Noncurrent portion of contract receivables
on sale of real estates 109,980,748 163,622,783
Current accounts receivables P=435,880,598 P=374,400,468
Contract receivables on sale of real estate represent amounts due and collectible in monthly
installment over a period of 5 to 15 years, and bear interest ranging from 10% to 18% in 2015
and 2014. The transfers certificates of title remain in the possession of the Group until full
payment has been made by the customers. Interest income pertaining to sale of real estate
amounted to P=14.6 million in 2015, P=17.8 million in 2014 and P=23.0 million in 2013
(see Note 23).
Trade receivables include receivables from water service and sale of crude palm oil and its
by-products.
Advances to officers and employees include car loans to employees. Interest income pertaining
these loans amounted to P=0.1 million in 2015 and P=0.2 million 2014 (see Note 23).

- 40 -
Accrued interest receivable includes interest from contract receivables, notes receivable and
loans receivable.
Other receivables which are interest–free include receivables from various companies for the
sale of available-for-sale investments in 2008 and various advances to suppliers and
contractors in 2015 and 2014.
No receivable is collateralized to any of the Group’s debt as of December 31, 2015 and 2014.
The movement of allowance for doubtful accounts is as follows:
Note 2015 2014
Balance at beginning of year P=1,364,796 P=595,117
Decrease due to deconsolidation (911,571) –
Provision for doubtful accounts 26 – 769,679
Balance at end of year P=453,225 P=1,364,796
8. Notes Receivable
In January 2013, the Parent Company granted a loan to Xavier Sports and Country Club,
Inc. (XSCCI) amounting to P=1.0 million and bearing the same interest rate of 10% per
annum and collectible within one (1) year for twelve monthly equal installments. The loan
was fully paid in December 2013.
Subsequent to this, the Parent Company extended two other loans to XSCCI amounting to
P=394,674 and P=200,000 last February 2013 and July 2013, respectively. All of these were
fully paid in December 2013.
In January 2014, the Parent Company extended another loan to XSCCI amounting to
P=2 million. This unsecured loan bears an interest of 10% and collectible within one (1) year
for twelve monthly equal installments. The outstanding balance relative to this loan
amounted to P=347,316 as of December 31, 2014 which was fully paid in 2015.
Interest income on notes receivable amounted to P=95,082 in 2014 and P=73,994 in 2013
(see Note 23).
On February 2, 2012, the Group granted a noninterest-bearing loan to a third party debtor
amounting to P=7.0 million payable on or before December 31, 2014. The debtor fully settled
the account on December 29, 2014.

- 41 -
The loan was discounted at the prevailing interest rate applicable to the Group. The carrying
value of this loan is presented below:
2014
Principal
Balance at beginning of year P=7,000,000
Principal collections during the year (7,000,000)
P=–
Discount on loans receivable:
Balance at beginning of year 367,172
Amortization of discount on loans during the year
(Note 23) 367,172
Balance at end of year –
P=–
9. Real Estate Held for Sale
Real estate held for sale represents land, development costs and construction materials issued
to the Group’s various projects in Cagayan de Oro City, Initao, Valencia City, Bukidnon and
Butuan detailed as follows:
2015 2014
Land P=173,795,994 P=194,919,448
Development cost and materials 497,142,446 408,678,774
P=670,938,440 P=603,598,222
Real estate held for sale with carrying value of P=518.5 million and P=351.2 million as of
December 31, 2015 and 2014, respectively, are collateralized to the loans obtained from UBP,
AUB, BPI, UCPB and BPIF (see Note 19).
In 2014, investment properties with carrying value of P=22.3 million was reclassified to real
estate held for sale (see Note 13).
The Group reclassified real estate held for sale with a total cost of P=85.8 million and
P=203.8 million from and into land and improvements in 2015 and 2014, respectively
(see Note 15). The reclassification has no impact on the statements of cash flows.
In 2013, the Group reclassified land and improvements amounting to P=10.5 million into real
estate held for sale.

- 42 -
10. Inventories, Prepayments and Other Current Assets
a. Inventories
This account consists of:
2015 2014
Crude palm oil P=13,902,968 P=21,993,214
Refined bleached deodorized oil 11,569,301 –
Palm olein 6,354,518 –
Aggregates and water meter 5,008,799 4,812,025
Palm acid oil and fatty acid distillate 4,234,707 112,195
Palm stearin 3,597,750 –
Palm kernels – 325,897
Foods and beverages – 213,303
P=44,668,043 P=27,456,634
No allowance for inventory obsolescence was recognized as of December 31, 2015 and
2014. There are no inventories that are pledged as collateral for any of the Group’s debt.
b. Prepayments and Other Current Assets
This account consists of:
2015 2014
Deposit for land acquisition P=106,758,303 P=104,837,801
Creditable withholding taxes 72,679,535 66,559,546
Other deposits 43,966,440 31,063,027
Value-added input taxes 40,259,226 9,902,085
Prepaid expenses 26,311,717 46,706,472
Supplies and materials 9,716,950 10,269,828
Others – 334,969
P=299,692,171 P=269,673,728
In 2011, the Group entered into several contracts to sell with several sellers of land.
Installments made by the Group to the sellers were presented as deposit for land
acquisition as the transfers certificates of title were not yet transferred to the name of the
Group.
Other deposits pertain to payments made by the Group in connection with its engagement
of a third party to look for suitable parties for the Group to enter into a joint venture
agreement for acceptable agricultural and real estate development projects. Such payment
will be used to answer for the out-of-pocket expenses to be incurred in relation to and
during the engagement.
Prepaid expenses include prepaid commission related to the sale of real estate, supplies,
insurance and taxes and licenses which are applicable in the future period.
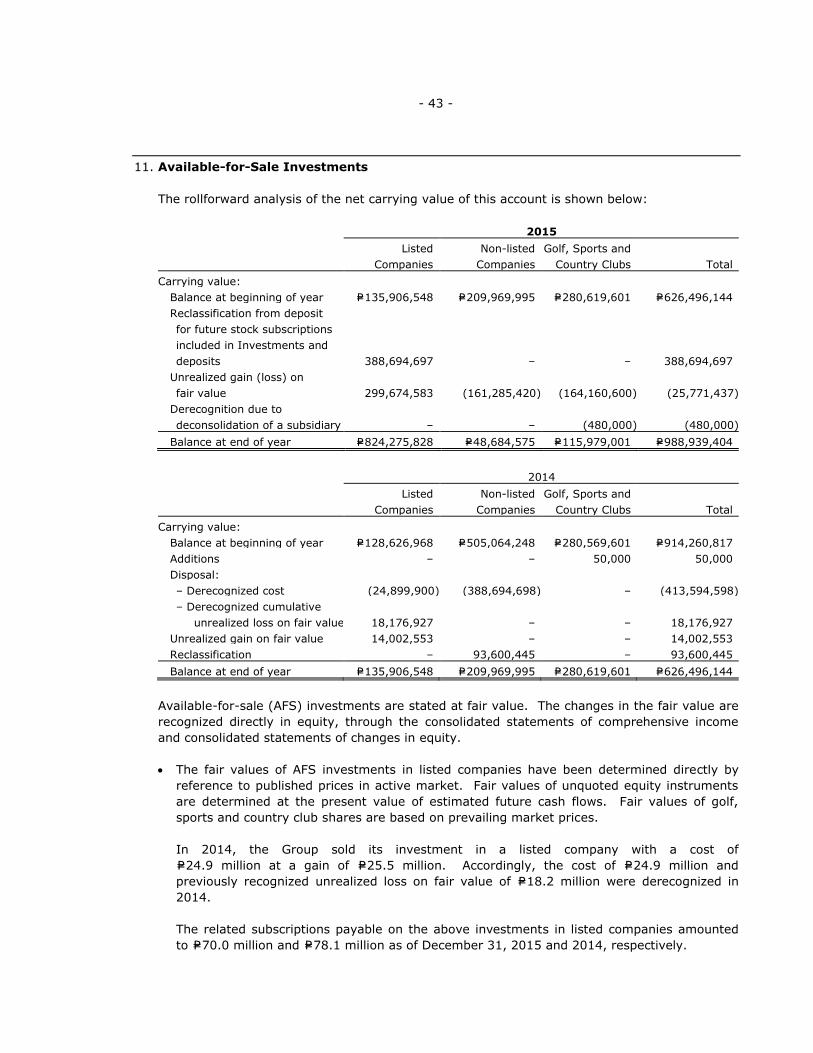
- 43 -
11. Available-for-Sale Investments
The rollforward analysis of the net carrying value of this account is shown below:
2015
Listed
Companies
Non-listed
Companies
Golf, Sports and
Country Clubs Total
Carrying value:
Balance at beginning of year P=135,906,548 P=209,969,995 P=280,619,601 P=626,496,144
Reclassification from deposit
for future stock subscriptions
included in Investments and
deposits 388,694,697 – – 388,694,697
Unrealized gain (loss) on
fair value 299,674,583 (161,285,420) (164,160,600) (25,771,437)
Derecognition due to
deconsolidation of a subsidiary – – (480,000) (480,000)
Balance at end of year P=824,275,828 P=48,684,575 P=115,979,001 P=988,939,404
2014
Listed
Companies
Non-listed
Companies
Golf, Sports and
Country Clubs Total
Carrying value:
Balance at beginning of year P=128,626,968 P=505,064,248 P=280,569,601 P=914,260,817
Additions – – 50,000 50,000
Disposal:
– Derecognized cost (24,899,900) (388,694,698) – (413,594,598)
– Derecognized cumulative
unrealized loss on fair value 18,176,927 – – 18,176,927
Unrealized gain on fair value 14,002,553 – – 14,002,553
Reclassification – 93,600,445 – 93,600,445
Balance at end of year P=135,906,548 P=209,969,995 P=280,619,601 P=626,496,144
Available-for-sale (AFS) investments are stated at fair value. The changes in the fair value are
recognized directly in equity, through the consolidated statements of comprehensive income
and consolidated statements of changes in equity.
The fair values of AFS investments in listed companies have been determined directly by
reference to published prices in active market. Fair values of unquoted equity instruments
are determined at the present value of estimated future cash flows. Fair values of golf,
sports and country club shares are based on prevailing market prices.
In 2014, the Group sold its investment in a listed company with a cost of
P=24.9 million at a gain of P=25.5 million. Accordingly, the cost of P=24.9 million and
previously recognized unrealized loss on fair value of P=18.2 million were derecognized in
2014.
The related subscriptions payable on the above investments in listed companies amounted
to P=70.0 million and P=78.1 million as of December 31, 2015 and 2014, respectively.
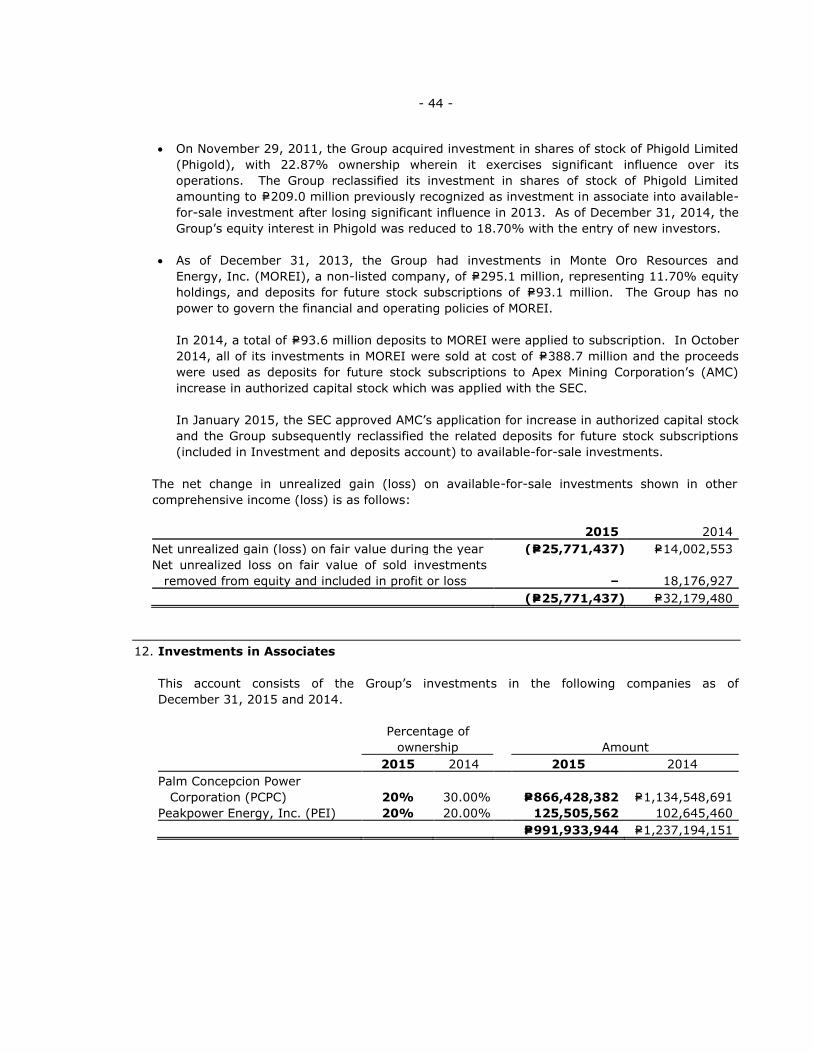
- 44 -
On November 29, 2011, the Group acquired investment in shares of stock of Phigold Limited
(Phigold), with 22.87% ownership wherein it exercises significant influence over its
operations. The Group reclassified its investment in shares of stock of Phigold Limited
amounting to P=209.0 million previously recognized as investment in associate into available-
for-sale investment after losing significant influence in 2013. As of December 31, 2014, the
Group’s equity interest in Phigold was reduced to 18.70% with the entry of new investors.
As of December 31, 2013, the Group had investments in Monte Oro Resources and
Energy, Inc. (MOREI), a non-listed company, of P=295.1 million, representing 11.70% equity
holdings, and deposits for future stock subscriptions of P=93.1 million. The Group has no
power to govern the financial and operating policies of MOREI.
In 2014, a total of P=93.6 million deposits to MOREI were applied to subscription. In October
2014, all of its investments in MOREI were sold at cost of P=388.7 million and the proceeds
were used as deposits for future stock subscriptions to Apex Mining Corporation’s (AMC)
increase in authorized capital stock which was applied with the SEC.
In January 2015, the SEC approved AMC’s application for increase in authorized capital stock
and the Group subsequently reclassified the related deposits for future stock subscriptions
(included in Investment and deposits account) to available-for-sale investments.
The net change in unrealized gain (loss) on available-for-sale investments shown in other
comprehensive income (loss) is as follows:
2015 2014
Net unrealized gain (loss) on fair value during the year (P=25,771,437) P=14,002,553
Net unrealized loss on fair value of sold investments
removed from equity and included in profit or loss
–
18,176,927
(P=25,771,437) P=32,179,480
12. Investments in Associates
This account consists of the Group’s investments in the following companies as of
December 31, 2015 and 2014.
Percentage of
ownership
Amount
2015 2014 2015 2014
Palm Concepcion Power
Corporation (PCPC) 20% 30.00%
P=866,428,382 P=1,134,548,691
Peakpower Energy, Inc. (PEI) 20% 20.00% 125,505,562 102,645,460
P=991,933,944 P=1,237,194,151
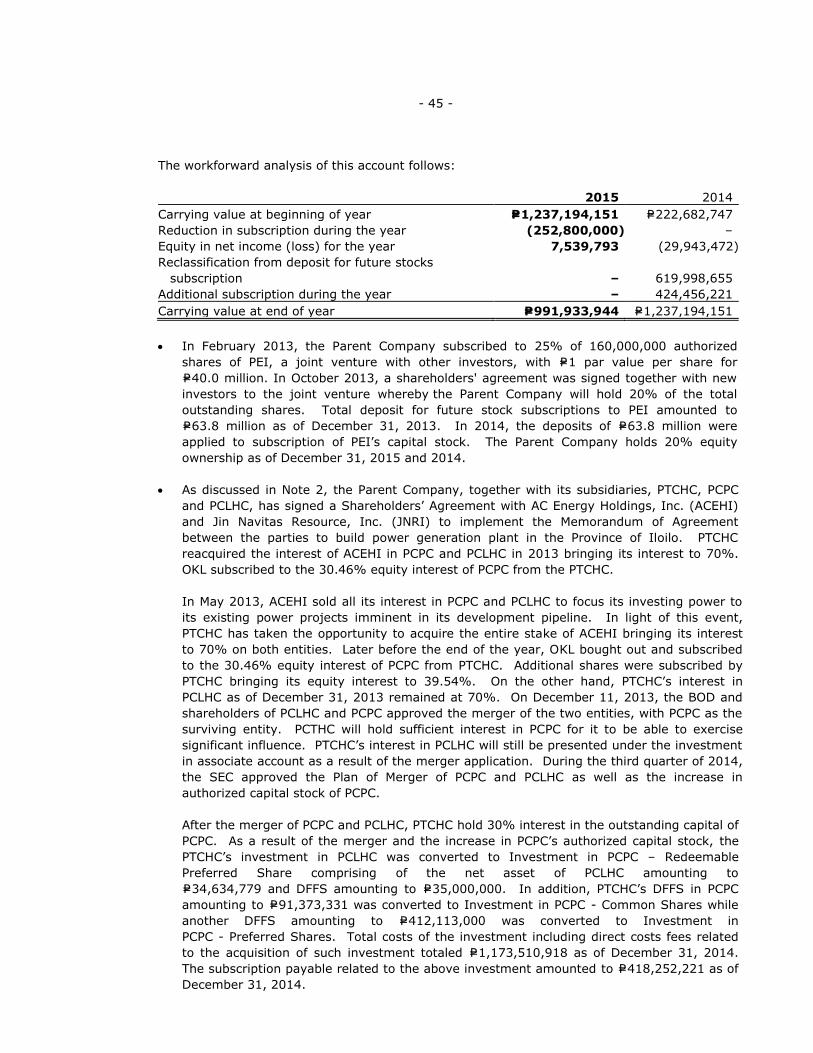
- 45 -
The workforward analysis of this account follows:
2015 2014
Carrying value at beginning of year P=1,237,194,151 P=222,682,747
Reduction in subscription during the year (252,800,000) –
Equity in net income (loss) for the year 7,539,793 (29,943,472)
Reclassification from deposit for future stocks
subscription – 619,998,655
Additional subscription during the year – 424,456,221
Carrying value at end of year P=991,933,944 P=1,237,194,151
In February 2013, the Parent Company subscribed to 25% of 160,000,000 authorized
shares of PEI, a joint venture with other investors, with P=1 par value per share for
P=40.0 million. In October 2013, a shareholders' agreement was signed together with new
investors to the joint venture whereby the Parent Company will hold 20% of the total
outstanding shares. Total deposit for future stock subscriptions to PEI amounted to
P=63.8 million as of December 31, 2013. In 2014, the deposits of P=63.8 million were
applied to subscription of PEI’s capital stock. The Parent Company holds 20% equity
ownership as of December 31, 2015 and 2014.
As discussed in Note 2, the Parent Company, together with its subsidiaries, PTCHC, PCPC
and PCLHC, has signed a Shareholders’ Agreement with AC Energy Holdings, Inc. (ACEHI)
and Jin Navitas Resource, Inc. (JNRI) to implement the Memorandum of Agreement
between the parties to build power generation plant in the Province of Iloilo. PTCHC
reacquired the interest of ACEHI in PCPC and PCLHC in 2013 bringing its interest to 70%.
OKL subscribed to the 30.46% equity interest of PCPC from the PTCHC.
In May 2013, ACEHI sold all its interest in PCPC and PCLHC to focus its investing power to
its existing power projects imminent in its development pipeline. In light of this event,
PTCHC has taken the opportunity to acquire the entire stake of ACEHI bringing its interest
to 70% on both entities. Later before the end of the year, OKL bought out and subscribed
to the 30.46% equity interest of PCPC from PTCHC. Additional shares were subscribed by
PTCHC bringing its equity interest to 39.54%. On the other hand, PTCHC’s interest in
PCLHC as of December 31, 2013 remained at 70%. On December 11, 2013, the BOD and
shareholders of PCLHC and PCPC approved the merger of the two entities, with PCPC as the
surviving entity. PCTHC will hold sufficient interest in PCPC for it to be able to exercise
significant influence. PTCHC’s interest in PCLHC will still be presented under the investment
in associate account as a result of the merger application. During the third quarter of 2014,
the SEC approved the Plan of Merger of PCPC and PCLHC as well as the increase in
authorized capital stock of PCPC.
After the merger of PCPC and PCLHC, PTCHC hold 30% interest in the outstanding capital of
PCPC. As a result of the merger and the increase in PCPC’s authorized capital stock, the
PTCHC’s investment in PCLHC was converted to Investment in PCPC – Redeemable
Preferred Share comprising of the net asset of PCLHC amounting to
P=34,634,779 and DFFS amounting to P=35,000,000. In addition, PTCHC’s DFFS in PCPC
amounting to P=91,373,331 was converted to Investment in PCPC - Common Shares while
another DFFS amounting to P=412,113,000 was converted to Investment in
PCPC - Preferred Shares. Total costs of the investment including direct costs fees related
to the acquisition of such investment totaled P=1,173,510,918 as of December 31, 2014.
The subscription payable related to the above investment amounted to P=418,252,221 as of
December 31, 2014.
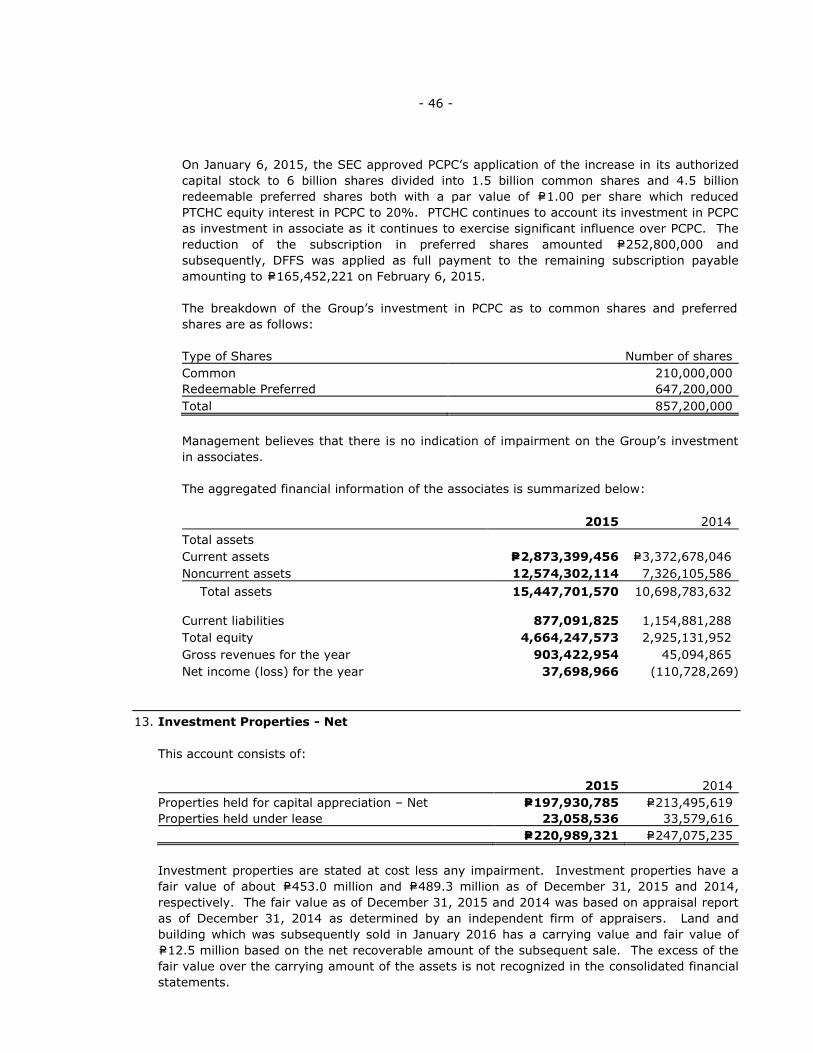
- 46 -
On January 6, 2015, the SEC approved PCPC’s application of the increase in its authorized
capital stock to 6 billion shares divided into 1.5 billion common shares and 4.5 billion
redeemable preferred shares both with a par value of P=1.00 per share which reduced
PTCHC equity interest in PCPC to 20%. PTCHC continues to account its investment in PCPC
as investment in associate as it continues to exercise significant influence over PCPC. The
reduction of the subscription in preferred shares amounted P=252,800,000 and
subsequently, DFFS was applied as full payment to the remaining subscription payable
amounting to P=165,452,221 on February 6, 2015.
The breakdown of the Group’s investment in PCPC as to common shares and preferred
shares are as follows:
Type of Shares Number of shares
Common 210,000,000
Redeemable Preferred 647,200,000
Total 857,200,000
Management believes that there is no indication of impairment on the Group’s investment
in associates.
The aggregated financial information of the associates is summarized below:
2015 2014
Total assets
Current assets P=2,873,399,456 P=3,372,678,046
Noncurrent assets 12,574,302,114 7,326,105,586
Total assets 15,447,701,570 10,698,783,632 Current liabilities 877,091,825 1,154,881,288
Total equity 4,664,247,573 2,925,131,952
Gross revenues for the year 903,422,954 45,094,865
Net income (loss) for the year 37,698,966 (110,728,269)
13. Investment Properties - Net
This account consists of:
2015 2014
Properties held for capital appreciation – Net P=197,930,785 P=213,495,619
Properties held under lease 23,058,536 33,579,616
P=220,989,321 P=247,075,235
Investment properties are stated at cost less any impairment. Investment properties have a
fair value of about P=453.0 million and P=489.3 million as of December 31, 2015 and 2014,
respectively. The fair value as of December 31, 2015 and 2014 was based on appraisal report
as of December 31, 2014 as determined by an independent firm of appraisers. Land and
building which was subsequently sold in January 2016 has a carrying value and fair value of
P=12.5 million based on the net recoverable amount of the subsequent sale. The excess of the
fair value over the carrying amount of the assets is not recognized in the consolidated financial
statements.

- 47 -
The rollforward analysis of properties held for capital appreciation as of and for the years ended
December 31, 2015 and 2014 follows:
2015
Land and
improvements Building Total
Cost:
Balance at beginning of year P=199,777,415 P=30,532,806 P=230,310,221
Disposal (11,509,965) – (11,509,965)
Balance at end of year 188,267,450 30,532,806 218,800,256
Allowance for impairment loss:
Balance at beginning of year – 16,814,602 16,814,602
Provision for impairment – 4,054,869 4,054,869
Balance at end of year – 20,869,471 20,869,471
Net carrying value P=188,267,450 P=9,663,335 P=197,930,785
2014
Note
Land and
improvements Building Total
Cost:
Balance at beginning of year P=218,597,272 P=30,532,806 P=249,130,078
Additions 43,508 – 43,508
Reclassification from property
and equipment 14 3,431,522 – 3,431,522
Reclassification to real estate
held for sale 9 (22,294,887) – (22,294,887)
Balance at end of year 199,777,415 30,532,806 230,310,221
Allowance for impairment loss:
Balance at beginning of year – 15,286,002 15,286,002
Provision for impairment – 1,528,600 1,528,600
Balance at end of year – 16,814,602 16,814,602
Net carrying value P=199,777,415 P=13,718,204 P=213,495,619
In 2015, disposals pertain to sale of various land properties which resulted to a total gain of
P=9,430,835.
In 2014, the Group reclassified land under property and equipment into investment property
which amounted to P=3,431,522 (see Note 14) and reclassified parcels of land under investment
properties to real estate held for sale (see Note 9) which amounted to P=22,294,887. The
reclassification has no impact on the statement of cash flows.
The provision for impairment loss of P=4,054,869 million in 2015 and P=1,528,600 million in
2014 and 2013 represents the write-down of an unfinished building to its estimated net
recoverable amount. The building with its land was subsequently sold in January 2016 at a loss
of P=2,526,269.

- 48 -
Direct operating expenses relative to investment properties which are not earning income are
as follows:
2015 2014 2013
Provision for impairment P=4,054,869 P=1,528,600 P=1,528,600
Security 1,856,752 2,224,435 1,557,286
Taxes and licenses 1,680,684 2,062,821 1,528,589
Repairs and maintenance 552,029 687,774 829,800
Professional fee 47,059 66,610 –
Utilities 38,727 28,095 –
Transportation 8,411 6,133 3,000
Insurance 2,864 – –
Others – 330 5,050
P=8,241,395 P=6,604,798 P=5,452,325
The details of the properties held under lease follows:
2015
Land
Building and
improvements Total
Cost:
Balance at beginning of year P=23,382,132 P=87,753,964 P=111,136,096
Disposals (7,959,109) – (7,959,109)
Balance at end of year 15,423,023 87,753,964 103,176,987
Accumulated depreciation:
Balance at beginning of year – 77,556,480 77,556,480
Additions – 2,561,971 2,561,971
Balance at end of year – 80,118,451 80,118,451
Net book value P=15,423,023 P=7,635,513 P=23,058,536
2014
Land
Building and
improvements Total
Cost:
Balance at beginning of year P=23,382,132 P=134,673,526 P=158,055,658
Disposals – (46,919,562) (46,919,562)
Balance at end of year 23,382,132 87,753,964 111,136,096
Accumulated depreciation:
Balance at beginning of year – 95,948,392 95,948,392
Additions – 3,742,444 3,742,444
Disposals – (22,134,356) (22,134,356)
Balance at end of year – 77,556,480 77,556,480
Net book value P=23,382,132 P=10,197,484 P=33,579,616
In 2015, the Group sold land property which resulted to a gain of P=6,240,892. In 2014, the
Group sold buildings and improvements with a carrying value of P=24,785,206 which resulted to
a loss of P=8,356,634.
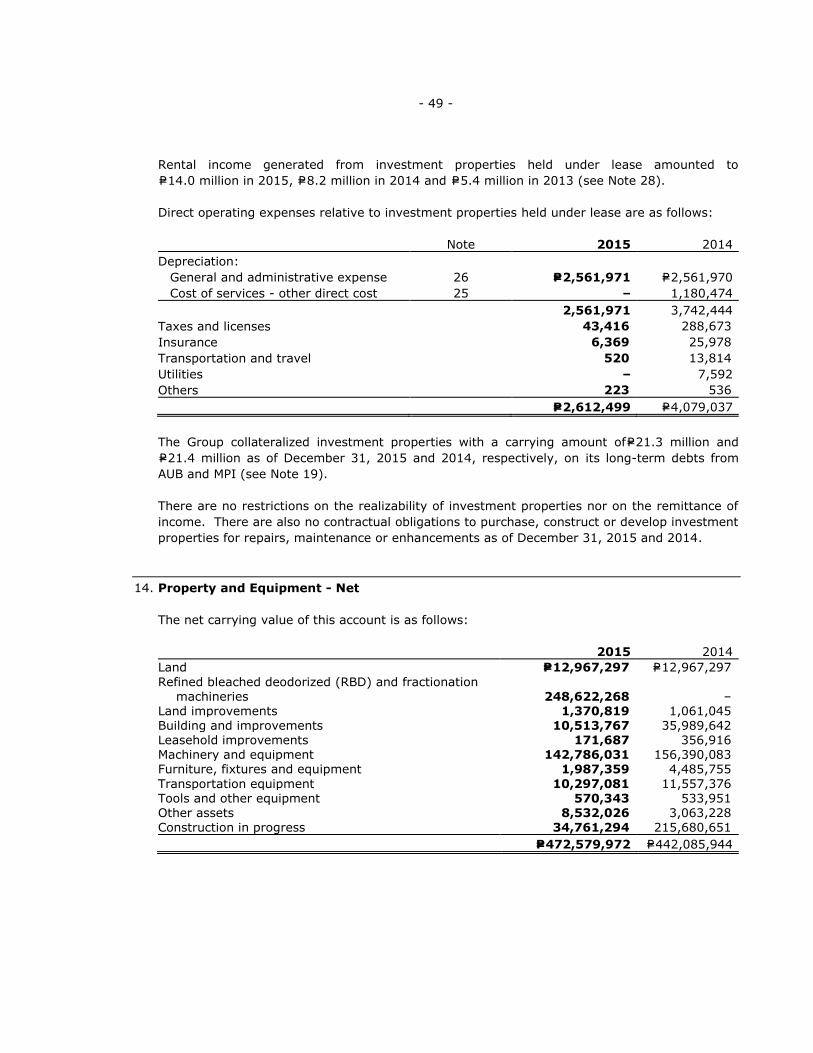
- 49 -
Rental income generated from investment properties held under lease amounted to
P=14.0 million in 2015, P=8.2 million in 2014 and P=5.4 million in 2013 (see Note 28).
Direct operating expenses relative to investment properties held under lease are as follows:
Note 2015 2014
Depreciation:
General and administrative expense 26 P=2,561,971 P=2,561,970
Cost of services - other direct cost 25 – 1,180,474
2,561,971 3,742,444
Taxes and licenses 43,416 288,673
Insurance 6,369 25,978
Transportation and travel 520 13,814
Utilities – 7,592
Others 223 536
P=2,612,499 P=4,079,037
The Group collateralized investment properties with a carrying amount ofP=21.3 million and
P=21.4 million as of December 31, 2015 and 2014, respectively, on its long-term debts from
AUB and MPI (see Note 19).
There are no restrictions on the realizability of investment properties nor on the remittance of
income. There are also no contractual obligations to purchase, construct or develop investment
properties for repairs, maintenance or enhancements as of December 31, 2015 and 2014.
14. Property and Equipment - Net
The net carrying value of this account is as follows:
2015 2014
Land P=12,967,297 P=12,967,297
Refined bleached deodorized (RBD) and fractionation machineries 248,622,268 –
Land improvements 1,370,819 1,061,045 Building and improvements 10,513,767 35,989,642 Leasehold improvements 171,687 356,916 Machinery and equipment 142,786,031 156,390,083 Furniture, fixtures and equipment 1,987,359 4,485,755
Transportation equipment 10,297,081 11,557,376 Tools and other equipment 570,343 533,951 Other assets 8,532,026 3,063,228
Construction in progress 34,761,294 215,680,651
P=472,579,972 P=442,085,944
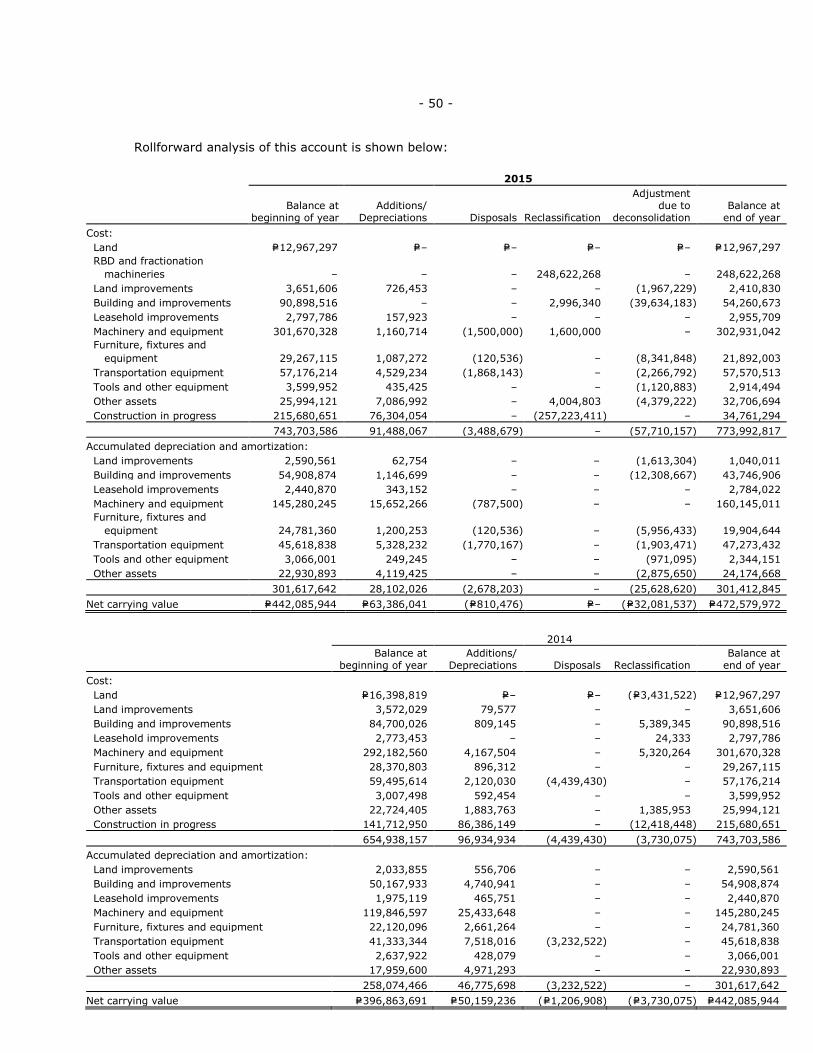
- 50 -
Rollforward analysis of this account is shown below:
2015
Balance at
beginning of year Additions/
Depreciations
Disposals
Reclassification
Adjustment due to
deconsolidation Balance at
end of year
Cost:
Land P=12,967,297 P=– P=– P=– P=– P=12,967,297
RBD and fractionation
machineries – – – 248,622,268 – 248,622,268
Land improvements 3,651,606 726,453 – – (1,967,229) 2,410,830
Building and improvements 90,898,516 – – 2,996,340 (39,634,183) 54,260,673
Leasehold improvements 2,797,786 157,923 – – – 2,955,709
Machinery and equipment 301,670,328 1,160,714 (1,500,000) 1,600,000 – 302,931,042
Furniture, fixtures and
equipment 29,267,115 1,087,272 (120,536) – (8,341,848) 21,892,003
Transportation equipment 57,176,214 4,529,234 (1,868,143) – (2,266,792) 57,570,513
Tools and other equipment 3,599,952 435,425 – – (1,120,883) 2,914,494
Other assets 25,994,121 7,086,992 – 4,004,803 (4,379,222) 32,706,694
Construction in progress 215,680,651 76,304,054 – (257,223,411) – 34,761,294
743,703,586 91,488,067 (3,488,679) – (57,710,157) 773,992,817
Accumulated depreciation and amortization:
Land improvements 2,590,561 62,754 – – (1,613,304) 1,040,011
Building and improvements 54,908,874 1,146,699 – – (12,308,667) 43,746,906
Leasehold improvements 2,440,870 343,152 – – – 2,784,022
Machinery and equipment 145,280,245 15,652,266 (787,500) – – 160,145,011
Furniture, fixtures and
equipment 24,781,360 1,200,253 (120,536) – (5,956,433) 19,904,644
Transportation equipment 45,618,838 5,328,232 (1,770,167) – (1,903,471) 47,273,432
Tools and other equipment 3,066,001 249,245 – – (971,095) 2,344,151
Other assets 22,930,893 4,119,425 – – (2,875,650) 24,174,668
301,617,642 28,102,026 (2,678,203) – (25,628,620) 301,412,845
Net carrying value P=442,085,944 P=63,386,041 (P=810,476) P=– (P=32,081,537) P=472,579,972
2014
Balance at
beginning of year Additions/
Depreciations
Disposals
Reclassification Balance at
end of year
Cost:
Land P=16,398,819 P=– P=– (P=3,431,522) P=12,967,297
Land improvements 3,572,029 79,577 – – 3,651,606
Building and improvements 84,700,026 809,145 – 5,389,345 90,898,516
Leasehold improvements 2,773,453 – – 24,333 2,797,786
Machinery and equipment 292,182,560 4,167,504 – 5,320,264 301,670,328
Furniture, fixtures and equipment 28,370,803 896,312 – – 29,267,115
Transportation equipment 59,495,614 2,120,030 (4,439,430) – 57,176,214
Tools and other equipment 3,007,498 592,454 – – 3,599,952
Other assets 22,724,405 1,883,763 – 1,385,953 25,994,121
Construction in progress 141,712,950 86,386,149 – (12,418,448) 215,680,651
654,938,157 96,934,934 (4,439,430) (3,730,075) 743,703,586
Accumulated depreciation and amortization:
Land improvements 2,033,855 556,706 – – 2,590,561
Building and improvements 50,167,933 4,740,941 – – 54,908,874
Leasehold improvements 1,975,119 465,751 – – 2,440,870
Machinery and equipment 119,846,597 25,433,648 – – 145,280,245
Furniture, fixtures and equipment 22,120,096 2,661,264 – – 24,781,360
Transportation equipment 41,333,344 7,518,016 (3,232,522) – 45,618,838
Tools and other equipment 2,637,922 428,079 – – 3,066,001
Other assets 17,959,600 4,971,293 – – 22,930,893
258,074,466 46,775,698 (3,232,522) – 301,617,642
Net carrying value P=396,863,691 P=50,159,236 (P=1,206,908) (P=3,730,075) P=442,085,944
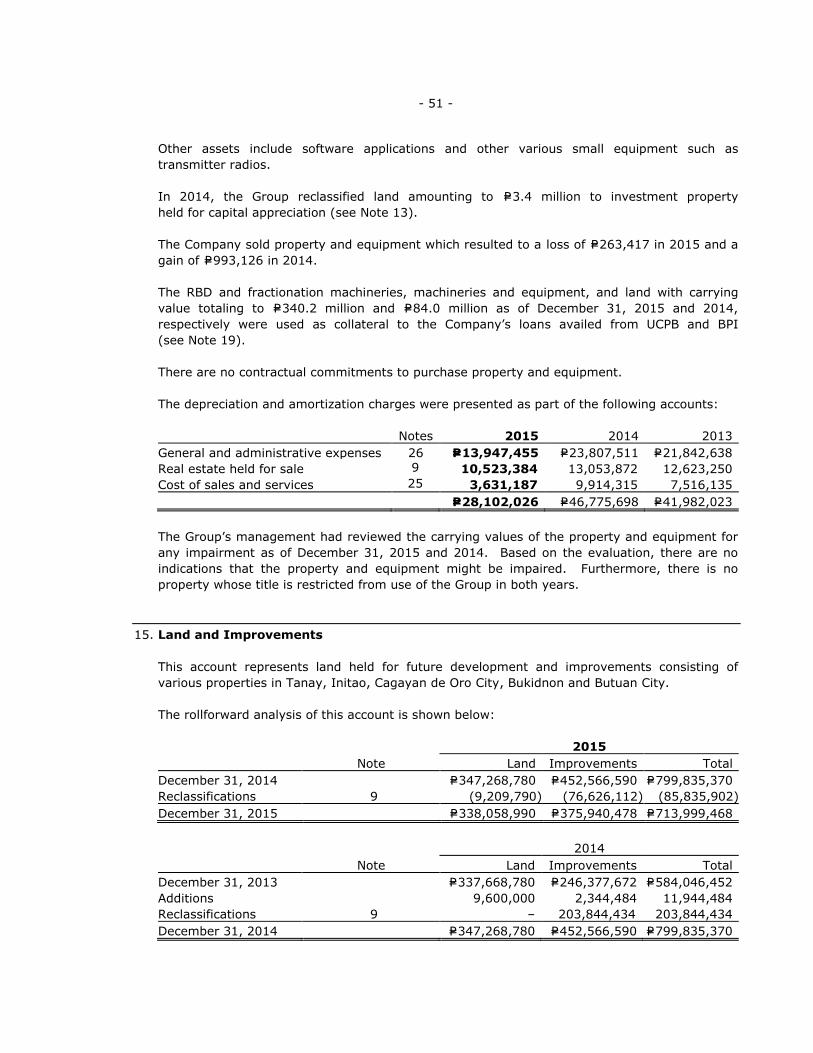
- 51 -
Other assets include software applications and other various small equipment such as
transmitter radios.
In 2014, the Group reclassified land amounting to P=3.4 million to investment property
held for capital appreciation (see Note 13).
The Company sold property and equipment which resulted to a loss of P=263,417 in 2015 and a
gain of P=993,126 in 2014.
The RBD and fractionation machineries, machineries and equipment, and land with carrying
value totaling to P=340.2 million and P=84.0 million as of December 31, 2015 and 2014,
respectively were used as collateral to the Company’s loans availed from UCPB and BPI
(see Note 19).
There are no contractual commitments to purchase property and equipment.
The depreciation and amortization charges were presented as part of the following accounts:
Notes 2015 2014 2013
General and administrative expenses 26 P=13,947,455 P=23,807,511 P=21,842,638
Real estate held for sale 9 10,523,384 13,053,872 12,623,250
Cost of sales and services 25 3,631,187 9,914,315 7,516,135
P=28,102,026 P=46,775,698 P=41,982,023
The Group’s management had reviewed the carrying values of the property and equipment for
any impairment as of December 31, 2015 and 2014. Based on the evaluation, there are no
indications that the property and equipment might be impaired. Furthermore, there is no
property whose title is restricted from use of the Group in both years.
15. Land and Improvements
This account represents land held for future development and improvements consisting of
various properties in Tanay, Initao, Cagayan de Oro City, Bukidnon and Butuan City.
The rollforward analysis of this account is shown below:
2015
Note Land Improvements Total
December 31, 2014 P=347,268,780 P=452,566,590 P=799,835,370
Reclassifications 9 (9,209,790) (76,626,112) (85,835,902)
December 31, 2015 P=338,058,990 P=375,940,478 P=713,999,468
2014
Note Land Improvements Total
December 31, 2013 P=337,668,780 P=246,377,672 P=584,046,452
Additions 9,600,000 2,344,484 11,944,484
Reclassifications 9 – 203,844,434 203,844,434
December 31, 2014 P=347,268,780 P=452,566,590 P=799,835,370
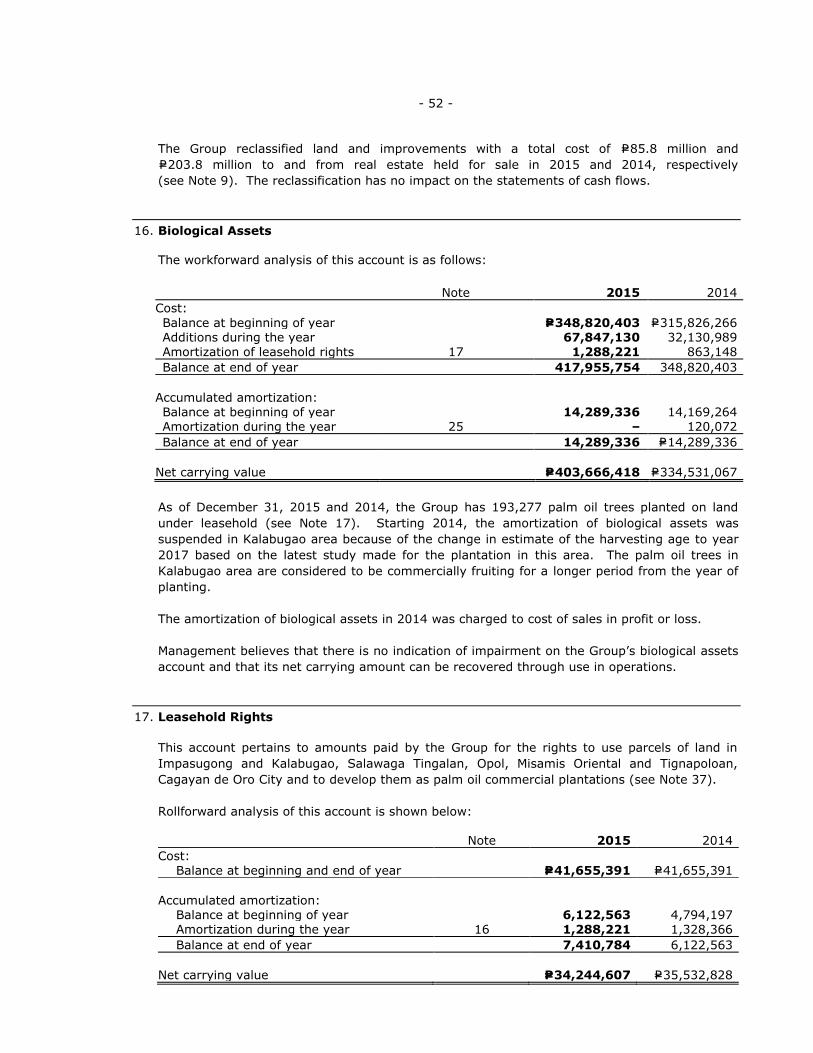
- 52 -
The Group reclassified land and improvements with a total cost of P=85.8 million and
P=203.8 million to and from real estate held for sale in 2015 and 2014, respectively
(see Note 9). The reclassification has no impact on the statements of cash flows.
16. Biological Assets
The workforward analysis of this account is as follows:
As of December 31, 2015 and 2014, the Group has 193,277 palm oil trees planted on land
under leasehold (see Note 17). Starting 2014, the amortization of biological assets was
suspended in Kalabugao area because of the change in estimate of the harvesting age to year
2017 based on the latest study made for the plantation in this area. The palm oil trees in
Kalabugao area are considered to be commercially fruiting for a longer period from the year of
planting.
The amortization of biological assets in 2014 was charged to cost of sales in profit or loss.
Management believes that there is no indication of impairment on the Group’s biological assets
account and that its net carrying amount can be recovered through use in operations.
17. Leasehold Rights
This account pertains to amounts paid by the Group for the rights to use parcels of land in
Impasugong and Kalabugao, Salawaga Tingalan, Opol, Misamis Oriental and Tignapoloan,
Cagayan de Oro City and to develop them as palm oil commercial plantations (see Note 37).
Rollforward analysis of this account is shown below:
Note 2015 2014
Cost: Balance at beginning and end of year P=41,655,391 P=41,655,391
Accumulated amortization:
Balance at beginning of year 6,122,563 4,794,197 Amortization during the year 16 1,288,221 1,328,366
Balance at end of year 7,410,784 6,122,563
Net carrying value P=34,244,607 P=35,532,828
Note 2015 2014
Cost:
Balance at beginning of year P=348,820,403 P=315,826,266 Additions during the year 67,847,130 32,130,989
Amortization of leasehold rights 17 1,288,221 863,148
Balance at end of year 417,955,754 348,820,403
Accumulated amortization: Balance at beginning of year 14,289,336 14,169,264 Amortization during the year 25 – 120,072
Balance at end of year 14,289,336 P=14,289,336
Net carrying value P=403,666,418 P=334,531,067
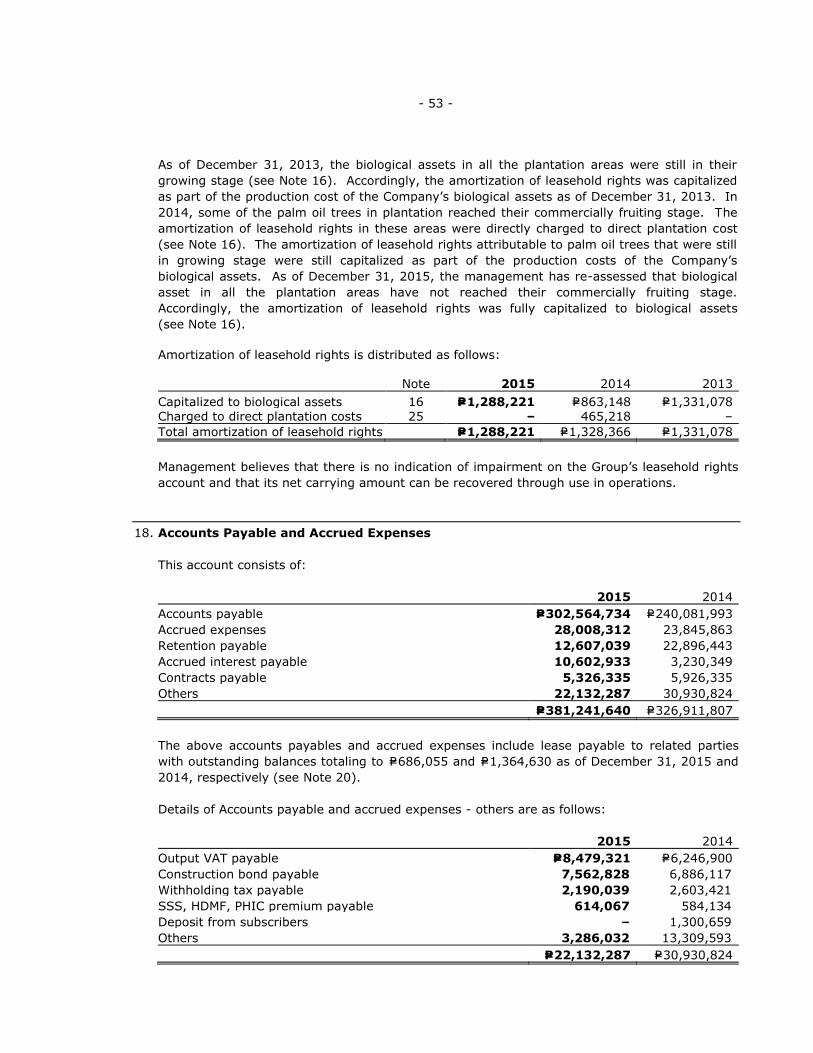
- 53 -
As of December 31, 2013, the biological assets in all the plantation areas were still in their
growing stage (see Note 16). Accordingly, the amortization of leasehold rights was capitalized
as part of the production cost of the Company’s biological assets as of December 31, 2013. In
2014, some of the palm oil trees in plantation reached their commercially fruiting stage. The
amortization of leasehold rights in these areas were directly charged to direct plantation cost
(see Note 16). The amortization of leasehold rights attributable to palm oil trees that were still
in growing stage were still capitalized as part of the production costs of the Company’s
biological assets. As of December 31, 2015, the management has re-assessed that biological
asset in all the plantation areas have not reached their commercially fruiting stage.
Accordingly, the amortization of leasehold rights was fully capitalized to biological assets
(see Note 16).
Amortization of leasehold rights is distributed as follows: Note 2015 2014 2013
Capitalized to biological assets 16 P=1,288,221 P=863,148 P=1,331,078 Charged to direct plantation costs 25 – 465,218 –
Total amortization of leasehold rights P=1,288,221 P=1,328,366 P=1,331,078
Management believes that there is no indication of impairment on the Group’s leasehold rights
account and that its net carrying amount can be recovered through use in operations.
18. Accounts Payable and Accrued Expenses
This account consists of:
2015 2014
Accounts payable P=302,564,734 P=240,081,993
Accrued expenses 28,008,312 23,845,863
Retention payable 12,607,039 22,896,443
Accrued interest payable 10,602,933 3,230,349
Contracts payable 5,326,335 5,926,335
Others 22,132,287 30,930,824
P=381,241,640 P=326,911,807
The above accounts payables and accrued expenses include lease payable to related parties
with outstanding balances totaling to P=686,055 and P=1,364,630 as of December 31, 2015 and
2014, respectively (see Note 20).
Details of Accounts payable and accrued expenses - others are as follows:
2015 2014
Output VAT payable P=8,479,321 P=6,246,900
Construction bond payable 7,562,828 6,886,117
Withholding tax payable 2,190,039 2,603,421
SSS, HDMF, PHIC premium payable 614,067 584,134
Deposit from subscribers – 1,300,659
Others 3,286,032 13,309,593
P=22,132,287 P=30,930,824
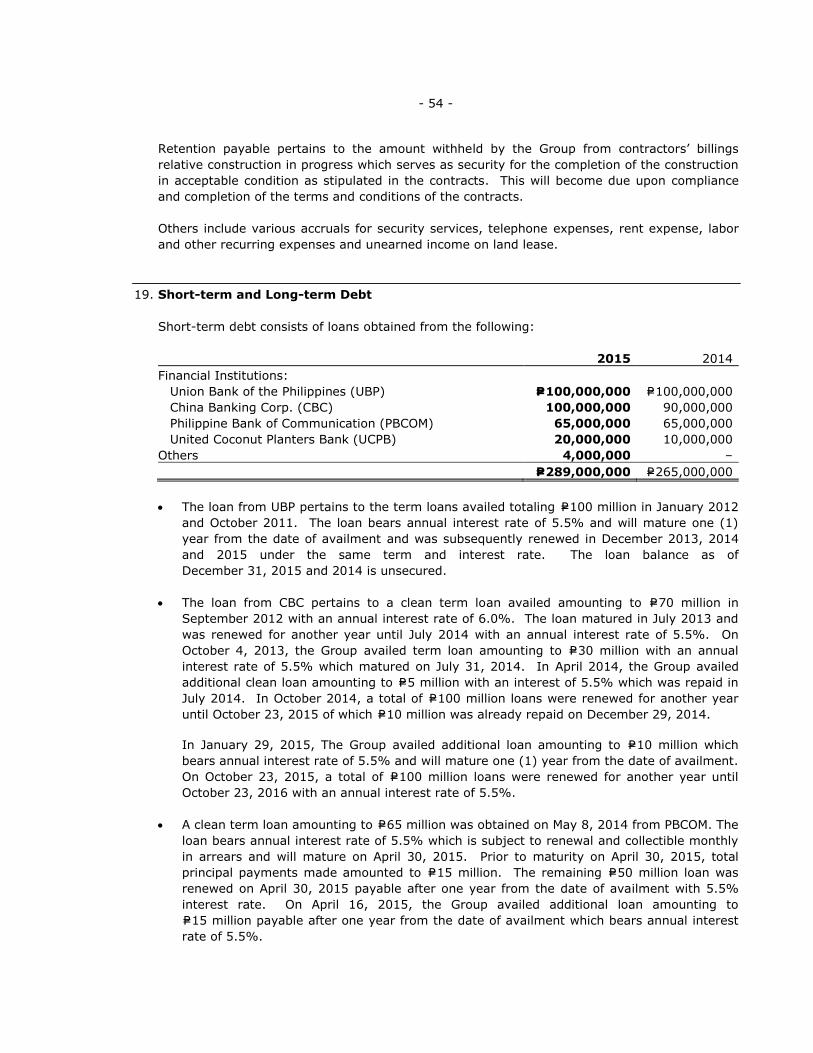
- 54 -
Retention payable pertains to the amount withheld by the Group from contractors’ billings
relative construction in progress which serves as security for the completion of the construction
in acceptable condition as stipulated in the contracts. This will become due upon compliance
and completion of the terms and conditions of the contracts.
Others include various accruals for security services, telephone expenses, rent expense, labor
and other recurring expenses and unearned income on land lease.
19. Short-term and Long-term Debt
Short-term debt consists of loans obtained from the following:
2015 2014
Financial Institutions:
Union Bank of the Philippines (UBP) P=100,000,000 P=100,000,000
China Banking Corp. (CBC) 100,000,000 90,000,000
Philippine Bank of Communication (PBCOM) 65,000,000 65,000,000
United Coconut Planters Bank (UCPB) 20,000,000 10,000,000
Others 4,000,000 –
P=289,000,000 P=265,000,000
The loan from UBP pertains to the term loans availed totaling P=100 million in January 2012
and October 2011. The loan bears annual interest rate of 5.5% and will mature one (1)
year from the date of availment and was subsequently renewed in December 2013, 2014
and 2015 under the same term and interest rate. The loan balance as of
December 31, 2015 and 2014 is unsecured.
The loan from CBC pertains to a clean term loan availed amounting to P=70 million in
September 2012 with an annual interest rate of 6.0%. The loan matured in July 2013 and
was renewed for another year until July 2014 with an annual interest rate of 5.5%. On
October 4, 2013, the Group availed term loan amounting to P=30 million with an annual
interest rate of 5.5% which matured on July 31, 2014. In April 2014, the Group availed
additional clean loan amounting to P=5 million with an interest of 5.5% which was repaid in
July 2014. In October 2014, a total of P=100 million loans were renewed for another year
until October 23, 2015 of which P=10 million was already repaid on December 29, 2014.
In January 29, 2015, The Group availed additional loan amounting to P=10 million which
bears annual interest rate of 5.5% and will mature one (1) year from the date of availment.
On October 23, 2015, a total of P=100 million loans were renewed for another year until
October 23, 2016 with an annual interest rate of 5.5%.
A clean term loan amounting to P=65 million was obtained on May 8, 2014 from PBCOM. The
loan bears annual interest rate of 5.5% which is subject to renewal and collectible monthly
in arrears and will mature on April 30, 2015. Prior to maturity on April 30, 2015, total
principal payments made amounted to P=15 million. The remaining P=50 million loan was
renewed on April 30, 2015 payable after one year from the date of availment with 5.5%
interest rate. On April 16, 2015, the Group availed additional loan amounting to
P=15 million payable after one year from the date of availment which bears annual interest
rate of 5.5%.
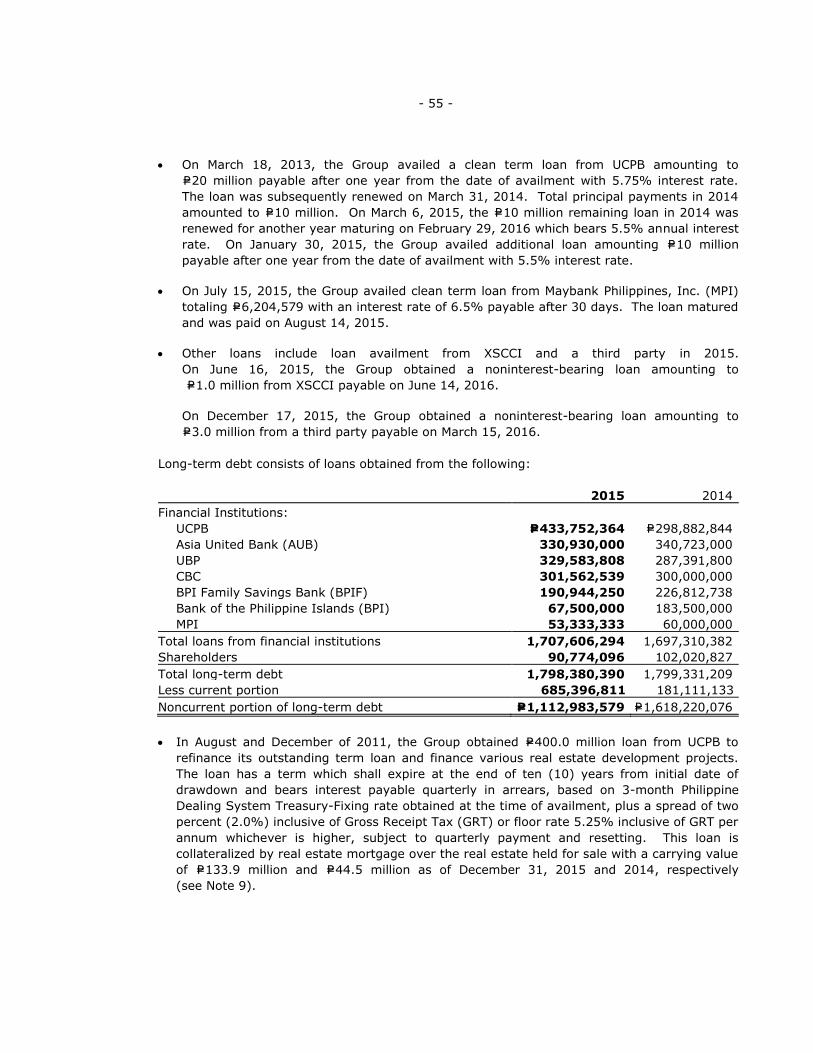
- 55 -
On March 18, 2013, the Group availed a clean term loan from UCPB amounting to
P=20 million payable after one year from the date of availment with 5.75% interest rate.
The loan was subsequently renewed on March 31, 2014. Total principal payments in 2014
amounted to P=10 million. On March 6, 2015, the P=10 million remaining loan in 2014 was
renewed for another year maturing on February 29, 2016 which bears 5.5% annual interest
rate. On January 30, 2015, the Group availed additional loan amounting P=10 million
payable after one year from the date of availment with 5.5% interest rate.
On July 15, 2015, the Group availed clean term loan from Maybank Philippines, Inc. (MPI)
totaling P=6,204,579 with an interest rate of 6.5% payable after 30 days. The loan matured
and was paid on August 14, 2015.
Other loans include loan availment from XSCCI and a third party in 2015.
On June 16, 2015, the Group obtained a noninterest-bearing loan amounting to
P=1.0 million from XSCCI payable on June 14, 2016.
On December 17, 2015, the Group obtained a noninterest-bearing loan amounting to
P=3.0 million from a third party payable on March 15, 2016.
Long-term debt consists of loans obtained from the following:
2015 2014
Financial Institutions:
UCPB P=433,752,364 P=298,882,844
Asia United Bank (AUB) 330,930,000 340,723,000
UBP 329,583,808 287,391,800
CBC 301,562,539 300,000,000
BPI Family Savings Bank (BPIF) 190,944,250 226,812,738
Bank of the Philippine Islands (BPI) 67,500,000 183,500,000
MPI 53,333,333 60,000,000
Total loans from financial institutions 1,707,606,294 1,697,310,382
Shareholders 90,774,096 102,020,827
Total long-term debt 1,798,380,390 1,799,331,209
Less current portion 685,396,811 181,111,133
Noncurrent portion of long-term debt P=1,112,983,579 P=1,618,220,076
In August and December of 2011, the Group obtained P=400.0 million loan from UCPB to
refinance its outstanding term loan and finance various real estate development projects.
The loan has a term which shall expire at the end of ten (10) years from initial date of
drawdown and bears interest payable quarterly in arrears, based on 3-month Philippine
Dealing System Treasury-Fixing rate obtained at the time of availment, plus a spread of two
percent (2.0%) inclusive of Gross Receipt Tax (GRT) or floor rate 5.25% inclusive of GRT per
annum whichever is higher, subject to quarterly payment and resetting. This loan is
collateralized by real estate mortgage over the real estate held for sale with a carrying value
of P=133.9 million and P=44.5 million as of December 31, 2015 and 2014, respectively
(see Note 9).
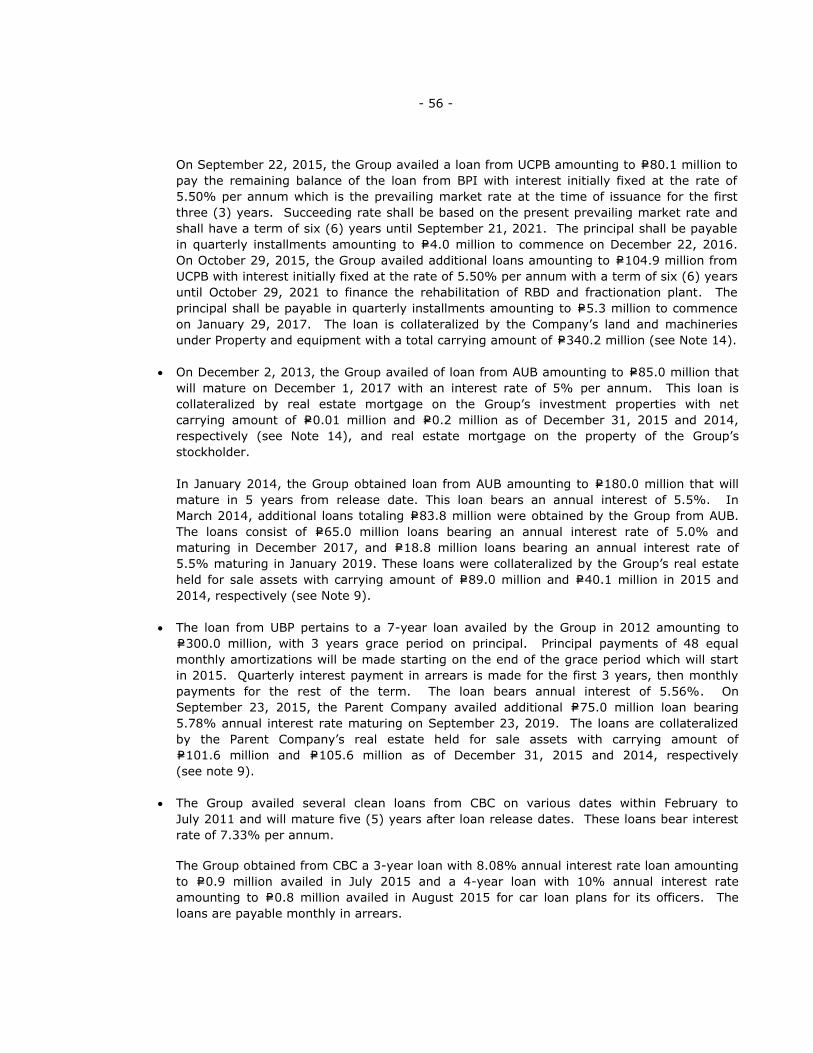
- 56 -
On September 22, 2015, the Group availed a loan from UCPB amounting to P=80.1 million to
pay the remaining balance of the loan from BPI with interest initially fixed at the rate of
5.50% per annum which is the prevailing market rate at the time of issuance for the first
three (3) years. Succeeding rate shall be based on the present prevailing market rate and
shall have a term of six (6) years until September 21, 2021. The principal shall be payable
in quarterly installments amounting to P=4.0 million to commence on December 22, 2016.
On October 29, 2015, the Group availed additional loans amounting to P=104.9 million from
UCPB with interest initially fixed at the rate of 5.50% per annum with a term of six (6) years
until October 29, 2021 to finance the rehabilitation of RBD and fractionation plant. The
principal shall be payable in quarterly installments amounting to P=5.3 million to commence
on January 29, 2017. The loan is collateralized by the Company’s land and machineries
under Property and equipment with a total carrying amount of P=340.2 million (see Note 14).
On December 2, 2013, the Group availed of loan from AUB amounting to P=85.0 million that
will mature on December 1, 2017 with an interest rate of 5% per annum. This loan is
collateralized by real estate mortgage on the Group’s investment properties with net
carrying amount of P=0.01 million and P=0.2 million as of December 31, 2015 and 2014,
respectively (see Note 14), and real estate mortgage on the property of the Group’s
stockholder.
In January 2014, the Group obtained loan from AUB amounting to P=180.0 million that will
mature in 5 years from release date. This loan bears an annual interest of 5.5%. In
March 2014, additional loans totaling P=83.8 million were obtained by the Group from AUB.
The loans consist of P=65.0 million loans bearing an annual interest rate of 5.0% and
maturing in December 2017, and P=18.8 million loans bearing an annual interest rate of
5.5% maturing in January 2019. These loans were collateralized by the Group’s real estate
held for sale assets with carrying amount of P=89.0 million and P=40.1 million in 2015 and
2014, respectively (see Note 9).
The loan from UBP pertains to a 7-year loan availed by the Group in 2012 amounting to
P=300.0 million, with 3 years grace period on principal. Principal payments of 48 equal
monthly amortizations will be made starting on the end of the grace period which will start
in 2015. Quarterly interest payment in arrears is made for the first 3 years, then monthly
payments for the rest of the term. The loan bears annual interest of 5.56%. On
September 23, 2015, the Parent Company availed additional P=75.0 million loan bearing
5.78% annual interest rate maturing on September 23, 2019. The loans are collateralized
by the Parent Company’s real estate held for sale assets with carrying amount of
P=101.6 million and P=105.6 million as of December 31, 2015 and 2014, respectively
(see note 9).
The Group availed several clean loans from CBC on various dates within February to
July 2011 and will mature five (5) years after loan release dates. These loans bear interest
rate of 7.33% per annum.
The Group obtained from CBC a 3-year loan with 8.08% annual interest rate loan amounting
to P=0.9 million availed in July 2015 and a 4-year loan with 10% annual interest rate
amounting to P=0.8 million availed in August 2015 for car loan plans for its officers. The
loans are payable monthly in arrears.
- 57 -
The loans from BPIF were obtained on various dates within 2004 to 2012 and will mature
ten (10) years after loan release dates, the last of which will be in 2022. These bear
interest at the rates ranging from 5.5% to 11.50% per annum. These are collateralized by
real estate mortgages over the real estate held for sale of the Group with a total carrying
value of P=98.0 million and P=50.8 million as of December 31, 2015 and 2014, respectively
(see Note 9).
The loans from BPI were obtained on various dates within 2011 and will mature five (5)
years after loan release dates, the last of which being 2016. These bear interest at
3-month Philippine Dealing System Treasury-R2 plus a spread of one and a half percent
(1.50%) per annum or the applicable bank floor lending rate at the time of availment,
whichever is higher, subject to monthly payment and quarterly resetting, with one time
option to fix rate based on 5-year Philippine Dealing System Treasury-R2 rate, plus a spread
of one and a quarter percent (1.25%) per annum. The interest rate is currently at 4.75%
per annum. These are collateralized by real estate mortgages over the real estate held for
sale of the Group with a total carrying value of P=96.0 million and P=110.2 million as of
December 31, 2015 and 2014, respectively (see Note 9).
On December 20, 2012, the Group availed a loan amounting to P=89.0 million with interest
initially fixed at the rate of 4.75% per annum which is the prevailing market rate at the time
of issuance hereof repriceable quarterly and payable monthly in arrears with option for rate
fixing for one (1) or three (3) or five (5) years and payable monthly in arrears and shall
have a term of seven (7) years until December 20, 2019. The principal is payable in
quarterly installments amounting to P=4.5 million to commence on March 20, 2015. The loan
is collateralized by the Company’s land with carrying value of P=84.0 million (see Note 14).
However, the loan was fully paid in 2015, P=80.1 million of which was paid from the
proceeds of loan from UCPB.
The Group availed of a P=60.0 million loan from MPI in August 2014 with an annual interest
rate of 5.5% subject to quarterly repricing and payable monthly in arrears that will mature
in August 2018. This loan is collateralized by the Group’s investment properties in
Binangonan, Rizal with carrying amount of P=21.2 million as of December 31, 2015 and 2014
(see Note 13).
The loans from shareholders represent a 10-year noninterest-bearing loan with a total
principal amount of P=129.3 million availed on various dates from October to November
2012. The loans are repayable in lump sum on or before maturity. The Group recognized
discount on loans payable amounting to P=52.9 million in the statements of income in 2012.
In September 2014, the Group availed of another 10-year noninterest-bearing loan from the
shareholders amounting to P=60.0 million. In 2015, the Parent Company availed from
shareholders additional noninterest-bearing loans totaling P=62.0 million with 5 and 10-year
term. A total of P=16.7 million and P=24.9 million was recognized as discount on loans
payable in the statements of income in 2015 and 2014, respectively. Amortization of
discount on loans recognized amounted to P=26.4 million in 2015, P=13.5 million in 2014 and
P=4.3 million in 2013. A total of P=12,014,533 loans payable was derecognized in 2015 in
view of the deconsolidation of a subsidiary.
- 58 -
The following table presents the contractual maturity of short-term and long-term debt as of
December 31, 2015 and 2014:
2015 2014
Due within 1 year P=974,396,811 P=446,111,133
Due beyond 1 year, not later than 5 years 1,017,826,614 436,547,886
Due beyond 5 years 95,156,965 1,181,672,190
P=2,087,380,390 P=2,064,331,209
The finance costs relative to the foregoing loans were presented as part of the following
accounts:
2015 2014
Finance costs under profit or loss P=109,408,927 P=90,737,847
Real estate held for sale 26,750,000 27,853,014
Construction in progress 2,158,921 4,123,260
P=138,317,848 P=122,714,121
20. Related Party Transactions
Related party relationship exists when one party has the ability to control, directly, or indirectly
through one or more intermediaries, the other party or exercise significant influence over the
other party making financial and operating decisions. Such relationship also exists between
and/or among entities, which are under common control with the reporting enterprise, or
between and/or among the reporting entities and key management personnel, directors, or its
shareholders. In considering each possible related party relationship, attention is directed to
the substance of relationship and not merely the legal form. For financial statements
disclosure purposes, an affiliate is an entity under common control of the Parent Company’s
stockholders.
The Group enters into transactions with related parties. Outstanding balances at year-end are
unsecured and noninterest-bearing and are settled based on agreed upon terms. The following
are the related party transactions.
a. Noninterest-bearing loans received from shareholders.
The Group received noninterest-bearing loans from shareholders (see Note 19).
b. Deposits for future stock subscription in an associate (included in investment and deposits).
The Group made deposits for future subscription to an associate which amounted to
P=165,452,221 as of December 31, 2014.
Deposits made to associate
Transaction 2015 2014
Outstanding balance at beginning of year P=165,452,221 P=538,486,333
Applied to subscription payable (165,452,221) –
Subscribed to capital during the year – (538,486,333)
Deposits made during the year – 435,000,000
Deposits returned during the year – (269,547,779)
Outstanding balance at end of year P=– P=165,452,221

- 59 -
c. Advances made to an associate.
The Group made unsecured and noninterest-bearing advances to PEI, an associate,
amounting to P=24,721,000 in 2015.
d. Lease of Parent Company’s office space from an affiliate.
2015 2014
Rent expense to profit or loss P=3,599,854 P=2,730,340
Rent expense capitalized to CIP 299,954 255,136
Total rent expense 3,899,808 2,985,476
Outstanding balances 686,055 236,732
e. Loan granted to an affiliate.
In January 2014, the Parent Company granted P=2,000,000 loan to XSCCI payable within
one year (see Note 8).
f. Loan availed from an affiliate.
On June 2015, the Parent Company availed P=1,000,000 noninterest-bearing loan from
XSCCI payable within one year from date of availment (see Note 19).
The summary of the above related party transactions follows:
2015
Category Amount/Volume Outstanding balance –
Asset (Liability) Terms and Conditions/ Settlement Guaranty/Provision
Shareholders 1. Loans received from
shareholders Loans received Discount on loans
received Payments made Amortization of
discount Adjustment due to
deconsolidation of subsidiary
(P=62,000,000)
16,718,115 70,885,110
(26,371,047)
12,014,553
(P=90,774,096)
Noninterest-bearing and repayable in lump sum on or before maturity after 10 years from 2012
Unsecured; no significant warranties and covenants
Associate 2. Deposit for future
stock subscription Applied to
subscription payable
(165,452,221)
– To be applied to equity call
No significant warranties or covenants
3. Advances Advances made
24,721,000
24,721,000 Payable on demand; noninterest-bearing
Unsecured; no significant warranties and covenants; no impairment
(Forward)

- 60 -
(Carryforward)
2015
Category Amount/ Volume
Outstanding balance – Asset (Liability)
Terms and Conditions/ Settlement Guaranty/Provision
Affiliate 4. Lease of office space
from an affiliate (Note 18) Rent expense
(3,899,808)
(686,055)
One year subject to annual review and renewable upon mutual agreement of parties; payable in cash every 15th of the month without necessity of demand
No guarantees
5. Loan granted Payments received
(347,316)
– Noninterest-bearing and repayable in cash within 1 year from date of availment
Unsecured; no significant warranties and covenants; no impairment
6. Loan availed Loan received
(1,000,000)
(1,000,000) Noninterest-bearing and repayable in cash within 1 year from date of availment
Unsecured; no significant warranties and covenants
2014
Category Amount/Volume Outstanding balance –
Asset (Liability) Terms and Conditions/ Settlement Guaranty/Provision
Shareholders 7. Loans received from
shareholders Loans received Discount on loans
received Payments made Amortization of
discount
(P=60,000,000)
24,874,165 28,000,000
(13,503,650)
(P=102,020,827) Noninterest-bearing and repayable in lump sum on or before maturity after 10 years from 2012
Unsecured; no significant covenants
Associate 8. Deposit for future
stock subscription Deposits made Deposits returned Subscribed to
capital
435,000,000 (269,547,779)
(602,282,333)
165,452,221 To be applied to equity call
No significant warranties or covenants
Affiliate 9. Lease of office space
from an affiliate Rent expense
(2,985,476)
(236,732)
One year subject to annual review and renewable upon mutual agreement of parties; payable in cash every 15th of the month without necessity of demand
No guarantees
10. Loan granted Loan granted Payments received
2,000,000 (1,652,684)
347,316 Noninterest-bearing and repayable in cash within 1 year from date of availment
Unsecured; no significant warranties and covenants
- 61 -
Below are the account balances as of December 31, 2015 and 2014 on the separate financial
statements of the companies within the Group which were eliminated upon consolidation:
Receivables/Payables
2015
Receivables
ABCI-Parent ABERDI MCPI Total
Payables:
ABBWCI P=7,971,853 P=– P=– P=7,971,853
PTCHC 21,094 – 6,508,784 6,529,878
ABERDI 1,535,235 – – 1,535,235
NC – 874,419 – 874,419
SHDC 167,941 403,938 – 571,879
BAC – 423,095 – 423,095
P=9,696,123 P=1,701,452 P=6,508,784 P=17,906,359
2014
Receivables
ABERDI NC Total
Payables:
ABCI-Parent P=1,050,662 P=– P=1,050,662
ABERDI – 3,079,857 3,079,857
SHDI 3,041 – 3,041
BAC 40,644 – 40,644
NC 11,200 – 11,200
P=1,105,547 P=3,079,857 P=4,185,404
Deposits for future stock subscription
2015
Deposits from
ABCI-Parent
Company ABERDI Total
Deposits to:
PTCHC P=818,305,221 P= – P=818,305,221
ABERDI 390,203,228 – 390,203,228
HLPC 10,355,922 – 10,355,922
AC 9,600,000 – 9,600,000
NC – 247,085,103 247,085,103
Total P=1,228,464,371 P=247,085,103 P=1,475,549,474
- 62 -
2014
Deposits from
ABCI-Parent
Company ABERDI Total
Deposits to:
PTCHC P=825,205,221 P= – P=825,205,221
ABERDI 376,303,228 – 376,303,228
AC 9,600,000 – 9,600,000
PBI 7,500,000 – 7,500,000
HLPC 5,500,000 – 5,500,000
NC – 255,485,103 255,485,103
Total P=1,224,108,449 P=255,485,103 P=1,479,593,552
The compensation of key management personnel by benefit type follows:
2015 2014
Salaries and wages P=43,761,687 P=31,695,594
Short-term employee benefits 9,345,652 6,730,258
Post-employment benefits 4,259,125 5,724,950
P=57,366,464 P=44,150,802
The Group has no transactions with its retirement fund involving loans (neither as creditor nor
debtor), investments (neither as investor nor investee), lease on services and guarantee or
surety made or received. The following information is shown in Note 27.
a. carrying value and fair value of fund,
b. amount of contributions to the fund,
c. description and composition of the fund, and
d. Trustee of the fund.
There are no other related party transactions.
21. Share Capital
The details of the number of shares of authorized and subscribed capital stock and additional
paid-in capital follows:
Note 2015 2014 2013
Authorized 1 2,000,000,000 2,000,000,000 2,000,000,000
Subscribed and issued 1 1,732,865,522 1,732,865,522 1,732,865,522
Additional paid-in-capital 586,198,947 586,198,947 586,198,947
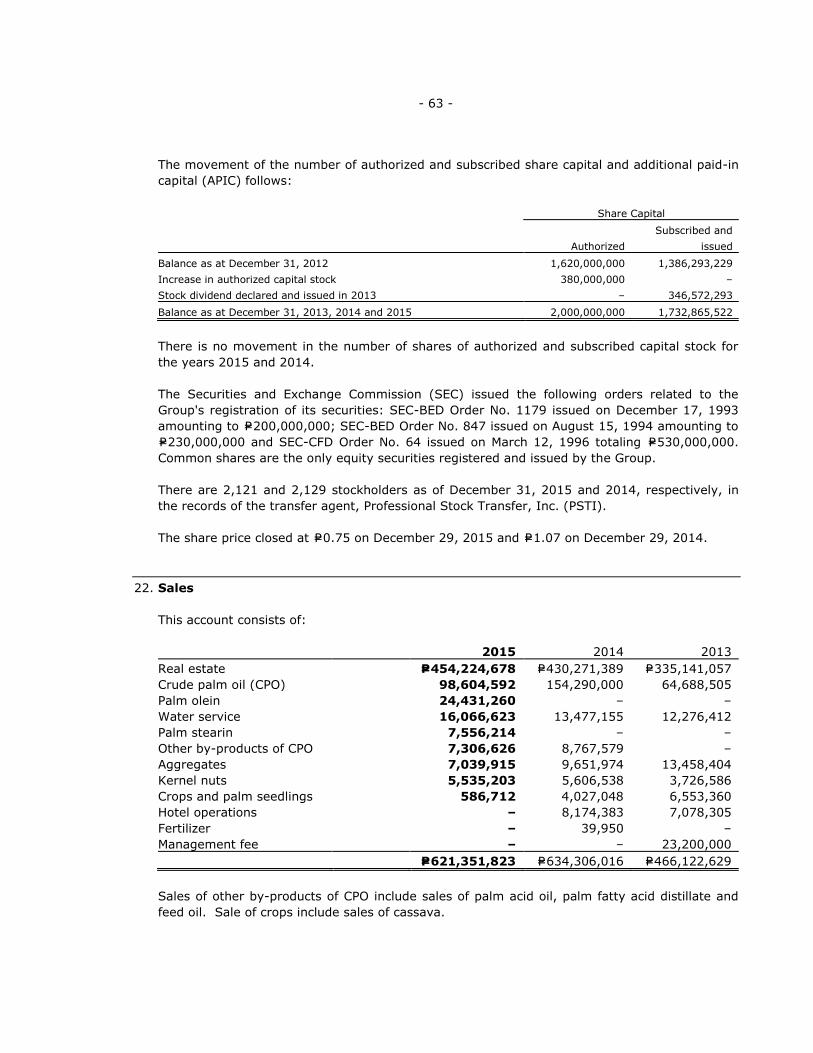
- 63 -
The movement of the number of authorized and subscribed share capital and additional paid-in
capital (APIC) follows:
Share Capital
Authorized
Subscribed and
issued
Balance as at December 31, 2012 1,620,000,000 1,386,293,229
Increase in authorized capital stock 380,000,000 –
Stock dividend declared and issued in 2013 – 346,572,293
Balance as at December 31, 2013, 2014 and 2015 2,000,000,000 1,732,865,522
There is no movement in the number of shares of authorized and subscribed capital stock for
the years 2015 and 2014.
The Securities and Exchange Commission (SEC) issued the following orders related to the
Group's registration of its securities: SEC-BED Order No. 1179 issued on December 17, 1993
amounting to P=200,000,000; SEC-BED Order No. 847 issued on August 15, 1994 amounting to
P=230,000,000 and SEC-CFD Order No. 64 issued on March 12, 1996 totaling P=530,000,000.
Common shares are the only equity securities registered and issued by the Group.
There are 2,121 and 2,129 stockholders as of December 31, 2015 and 2014, respectively, in
the records of the transfer agent, Professional Stock Transfer, Inc. (PSTI).
The share price closed at P=0.75 on December 29, 2015 and P=1.07 on December 29, 2014.
22. Sales
This account consists of:
2015 2014 2013
Real estate P=454,224,678 P=430,271,389 P=335,141,057
Crude palm oil (CPO) 98,604,592 154,290,000 64,688,505
Palm olein 24,431,260 – –
Water service 16,066,623 13,477,155 12,276,412
Palm stearin 7,556,214 – –
Other by-products of CPO 7,306,626 8,767,579 –
Aggregates 7,039,915 9,651,974 13,458,404
Kernel nuts 5,535,203 5,606,538 3,726,586
Crops and palm seedlings 586,712 4,027,048 6,553,360
Hotel operations – 8,174,383 7,078,305
Fertilizer – 39,950 –
Management fee – – 23,200,000
P=621,351,823 P=634,306,016 P=466,122,629
Sales of other by-products of CPO include sales of palm acid oil, palm fatty acid distillate and
feed oil. Sale of crops include sales of cassava.
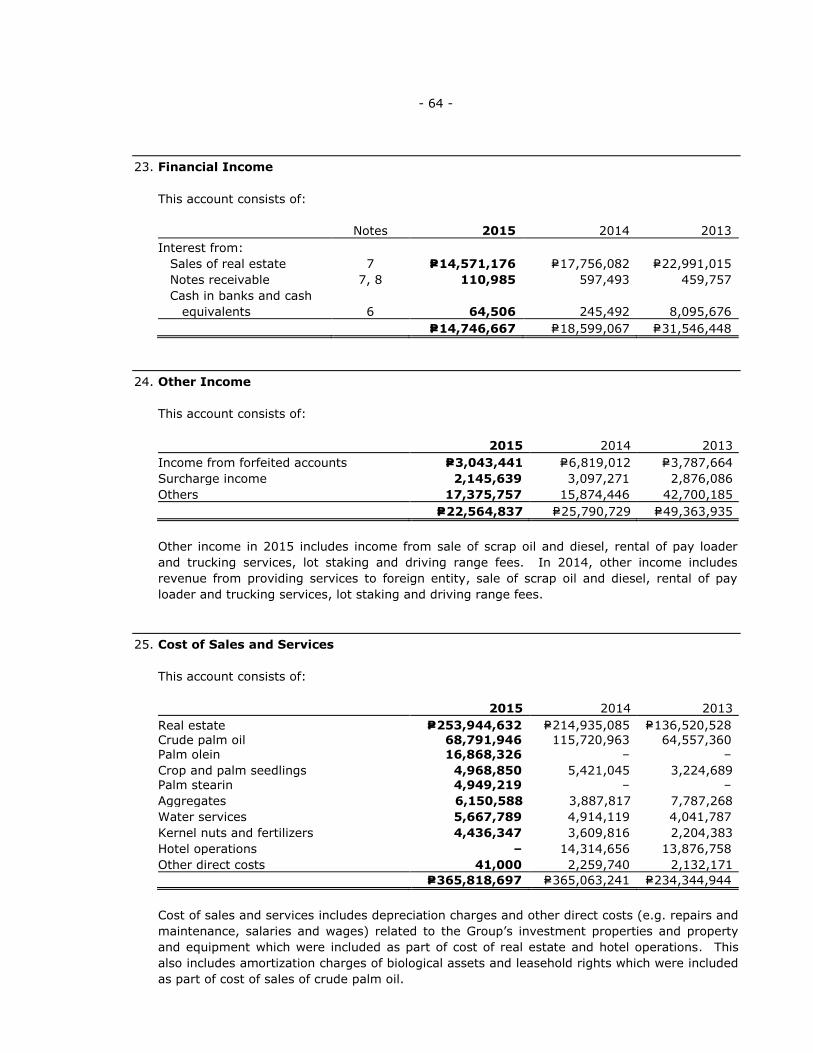
- 64 -
23. Financial Income
This account consists of:
Notes 2015 2014 2013
Interest from:
Sales of real estate 7 P=14,571,176 P=17,756,082 P=22,991,015
Notes receivable 7, 8 110,985 597,493 459,757
Cash in banks and cash
equivalents 6 64,506
245,492 8,095,676
P=14,746,667 P=18,599,067 P=31,546,448
24. Other Income
This account consists of:
2015 2014 2013
Income from forfeited accounts P=3,043,441 P=6,819,012 P=3,787,664
Surcharge income 2,145,639 3,097,271 2,876,086
Others 17,375,757 15,874,446 42,700,185
P=22,564,837 P=25,790,729 P=49,363,935
Other income in 2015 includes income from sale of scrap oil and diesel, rental of pay loader
and trucking services, lot staking and driving range fees. In 2014, other income includes
revenue from providing services to foreign entity, sale of scrap oil and diesel, rental of pay
loader and trucking services, lot staking and driving range fees.
25. Cost of Sales and Services
This account consists of:
2015 2014 2013
Real estate P=253,944,632 P=214,935,085 P=136,520,528
Crude palm oil 68,791,946 115,720,963 64,557,360 Palm olein 16,868,326 – –
Crop and palm seedlings 4,968,850 5,421,045 3,224,689 Palm stearin 4,949,219 – –
Aggregates 6,150,588 3,887,817 7,787,268
Water services 5,667,789 4,914,119 4,041,787
Kernel nuts and fertilizers 4,436,347 3,609,816 2,204,383
Hotel operations – 14,314,656 13,876,758
Other direct costs 41,000 2,259,740 2,132,171
P=365,818,697 P=365,063,241 P=234,344,944
Cost of sales and services includes depreciation charges and other direct costs (e.g. repairs and
maintenance, salaries and wages) related to the Group’s investment properties and property
and equipment which were included as part of cost of real estate and hotel operations. This
also includes amortization charges of biological assets and leasehold rights which were included
as part of cost of sales of crude palm oil.

- 65 -
26. General and Administrative Expenses
This account consists of:
Notes 2015 2014 2013
Personnel costs 20, 27 P=68,120,787 P=56,860,498 P=64,225,383
Depreciation and amortization 13, 14 16,509,426 26,369,481 27,572,145
Taxes and licenses 23,632,059 19,782,102 21,870,688
Utilities and supplies 7,225,509 8,666,516 6,449,370
Rental 20, 28 6,714,207 2,154,230 916,761
Repairs and maintenance 6,242,019 7,124,548 4,846,198
Retirement benefits 27 4,458,824 3,602,483 2,978,165
Entertainment, amusement
and recreation
475,855 1,591,208 1,023,868
Provision for doubtful accounts 7 – 769,679 –
Others 46,059,868 46,760,498 67,497,660
P=179,438,554 P=173,681,243 P=197,380,238
Personnel costs include salaries and wages, short-term employee benefits and SSS, PHIC and
HDMF contributions.
Depreciation and amortization are derived from:
Notes 2015 2014 2013
Investment properties 13 P=2,561,971 P=2,561,970 P=5,729,507
Property and equipment 14 13,947,455 23,807,511 21,842,638
P=16,509,426 P=26,369,481 P=27,572,145
Significant components of other operating expenses follow:
2015 2014 2013
Security services P=14,356,837 P=14,656,836 P=13,592,802
Professional fees 8,384,902 7,954,939 32,029,356
Transportation and travel 5,385,320 7,444,491 7,016,604
Director fees 1,413,882 1,216,882 1,489,480
Board meetings 942,807 941,109 1,210,254
Insurance 820,735 1,151,934 989,034
Trainings and seminars 677,196 590,374 278,973
Subscription and dues 634,099 596,379 565,201
Litigation fees 342,461 777,122 1,088,884
Bank charges 54,786 555,854 87,131
Miscellaneous 13,046,843 10,874,578 9,149,941
P=46,059,868 P=46,760,498 P=67,497,660
Miscellaneous expense includes supervision, regulation, notarization, listing and other fees.
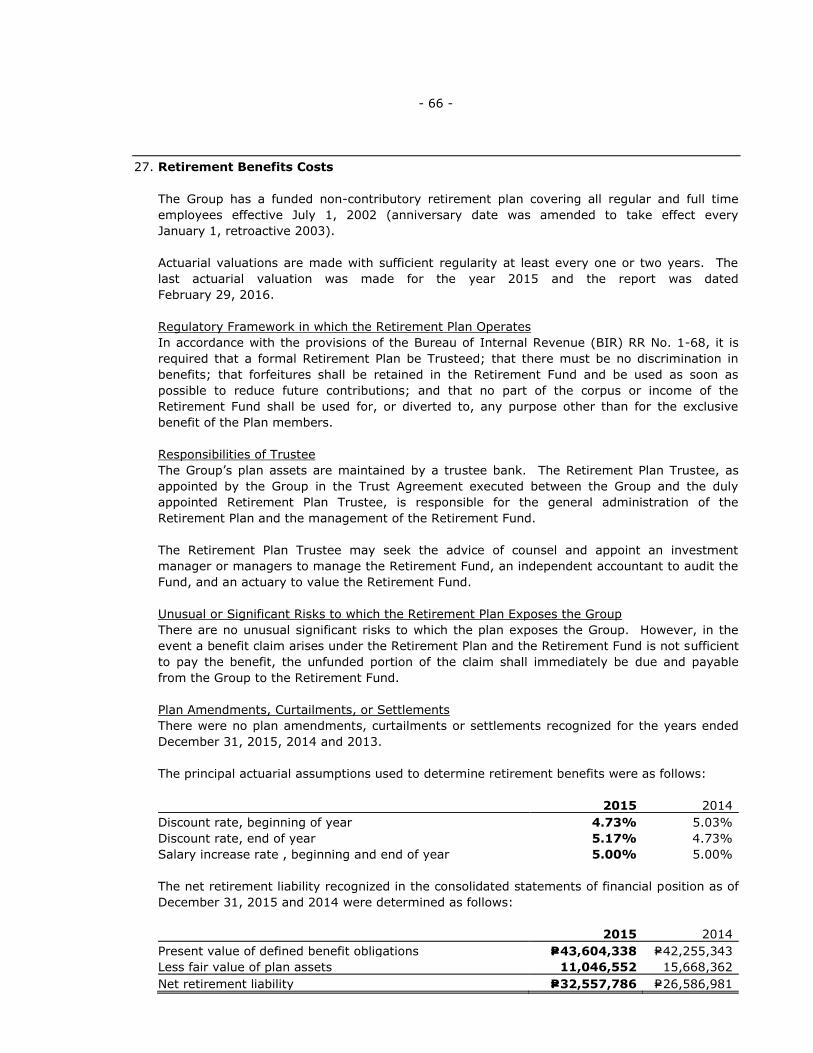
- 66 -
27. Retirement Benefits Costs
The Group has a funded non-contributory retirement plan covering all regular and full time
employees effective July 1, 2002 (anniversary date was amended to take effect every
January 1, retroactive 2003).
Actuarial valuations are made with sufficient regularity at least every one or two years. The
last actuarial valuation was made for the year 2015 and the report was dated
February 29, 2016.
Regulatory Framework in which the Retirement Plan Operates
In accordance with the provisions of the Bureau of Internal Revenue (BIR) RR No. 1-68, it is
required that a formal Retirement Plan be Trusteed; that there must be no discrimination in
benefits; that forfeitures shall be retained in the Retirement Fund and be used as soon as
possible to reduce future contributions; and that no part of the corpus or income of the
Retirement Fund shall be used for, or diverted to, any purpose other than for the exclusive
benefit of the Plan members.
Responsibilities of Trustee
The Group’s plan assets are maintained by a trustee bank. The Retirement Plan Trustee, as
appointed by the Group in the Trust Agreement executed between the Group and the duly
appointed Retirement Plan Trustee, is responsible for the general administration of the
Retirement Plan and the management of the Retirement Fund.
The Retirement Plan Trustee may seek the advice of counsel and appoint an investment
manager or managers to manage the Retirement Fund, an independent accountant to audit the
Fund, and an actuary to value the Retirement Fund.
Unusual or Significant Risks to which the Retirement Plan Exposes the Group
There are no unusual significant risks to which the plan exposes the Group. However, in the
event a benefit claim arises under the Retirement Plan and the Retirement Fund is not sufficient
to pay the benefit, the unfunded portion of the claim shall immediately be due and payable
from the Group to the Retirement Fund.
Plan Amendments, Curtailments, or Settlements
There were no plan amendments, curtailments or settlements recognized for the years ended
December 31, 2015, 2014 and 2013.
The principal actuarial assumptions used to determine retirement benefits were as follows:
2015 2014
Discount rate, beginning of year 4.73% 5.03%
Discount rate, end of year 5.17% 4.73%
Salary increase rate , beginning and end of year 5.00% 5.00%
The net retirement liability recognized in the consolidated statements of financial position as of
December 31, 2015 and 2014 were determined as follows:
2015 2014
Present value of defined benefit obligations P=43,604,338 P=42,255,343
Less fair value of plan assets 11,046,552 15,668,362
Net retirement liability P=32,557,786 P=26,586,981
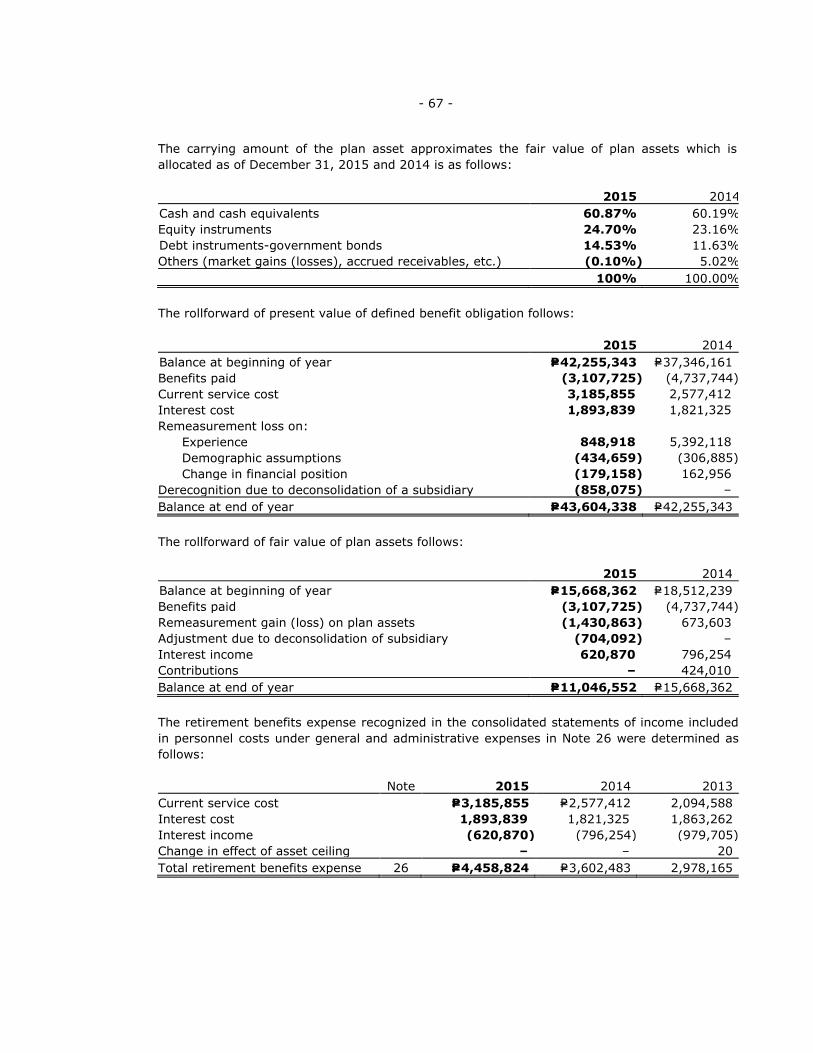
- 67 -
The carrying amount of the plan asset approximates the fair value of plan assets which is
allocated as of December 31, 2015 and 2014 is as follows:
2015 2014
Cash and cash equivalents 60.87% 60.19%
Equity instruments 24.70% 23.16%
Debt instruments-government bonds 14.53% 11.63%
Others (market gains (losses), accrued receivables, etc.) (0.10%) 5.02%
100% 100.00%
The rollforward of present value of defined benefit obligation follows:
2015 2014
Balance at beginning of year P=42,255,343 P=37,346,161
Benefits paid (3,107,725) (4,737,744)
Current service cost 3,185,855 2,577,412
Interest cost 1,893,839 1,821,325
Remeasurement loss on:
Experience 848,918 5,392,118
Demographic assumptions (434,659) (306,885)
Change in financial position (179,158) 162,956
Derecognition due to deconsolidation of a subsidiary (858,075) –
Balance at end of year P=43,604,338 P=42,255,343
The rollforward of fair value of plan assets follows:
2015 2014
Balance at beginning of year P=15,668,362 P=18,512,239
Benefits paid (3,107,725) (4,737,744)
Remeasurement gain (loss) on plan assets (1,430,863) 673,603
Adjustment due to deconsolidation of subsidiary (704,092) –
Interest income 620,870 796,254
Contributions – 424,010
Balance at end of year P=11,046,552 P=15,668,362
The retirement benefits expense recognized in the consolidated statements of income included
in personnel costs under general and administrative expenses in Note 26 were determined as
follows:
Note 2015 2014 2013
Current service cost P=3,185,855 P=2,577,412 2,094,588
Interest cost 1,893,839 1,821,325 1,863,262
Interest income (620,870) (796,254) (979,705)
Change in effect of asset ceiling – – 20
Total retirement benefits expense 26 P=4,458,824 P=3,602,483 2,978,165
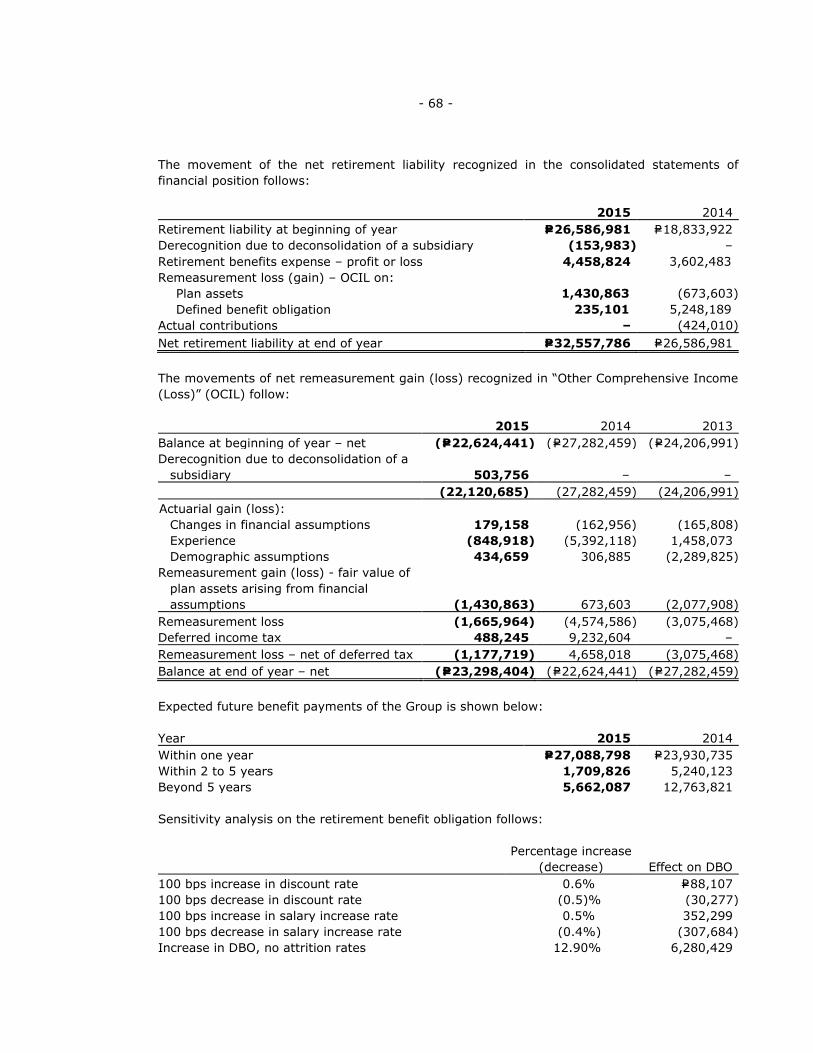
- 68 -
The movement of the net retirement liability recognized in the consolidated statements of
financial position follows:
2015 2014
Retirement liability at beginning of year P=26,586,981 P=18,833,922
Derecognition due to deconsolidation of a subsidiary (153,983) –
Retirement benefits expense – profit or loss 4,458,824 3,602,483
Remeasurement loss (gain) – OCIL on:
Plan assets 1,430,863 (673,603)
Defined benefit obligation 235,101 5,248,189
Actual contributions – (424,010)
Net retirement liability at end of year P=32,557,786 P=26,586,981
The movements of net remeasurement gain (loss) recognized in “Other Comprehensive Income
(Loss)” (OCIL) follow:
2015 2014 2013
Balance at beginning of year – net (P=22,624,441) (P=27,282,459) (P=24,206,991)
Derecognition due to deconsolidation of a
subsidiary 503,756 – –
(22,120,685) (27,282,459) (24,206,991)
Actuarial gain (loss):
Changes in financial assumptions 179,158 (162,956) (165,808)
Experience (848,918) (5,392,118) 1,458,073
Demographic assumptions 434,659 306,885 (2,289,825)
Remeasurement gain (loss) - fair value of
plan assets arising from financial
assumptions (1,430,863) 673,603 (2,077,908)
Remeasurement loss (1,665,964) (4,574,586) (3,075,468)
Deferred income tax 488,245 9,232,604 –
Remeasurement loss – net of deferred tax (1,177,719) 4,658,018 (3,075,468)
Balance at end of year – net (P=23,298,404) (P=22,624,441) (P=27,282,459)
Expected future benefit payments of the Group is shown below:
Year 2015 2014
Within one year P=27,088,798 P=23,930,735
Within 2 to 5 years 1,709,826 5,240,123
Beyond 5 years 5,662,087 12,763,821
Sensitivity analysis on the retirement benefit obligation follows:
Percentage increase
(decrease) Effect on DBO
100 bps increase in discount rate 0.6% P=88,107
100 bps decrease in discount rate (0.5)% (30,277)
100 bps increase in salary increase rate 0.5% 352,299
100 bps decrease in salary increase rate (0.4%) (307,684)
Increase in DBO, no attrition rates 12.90% 6,280,429
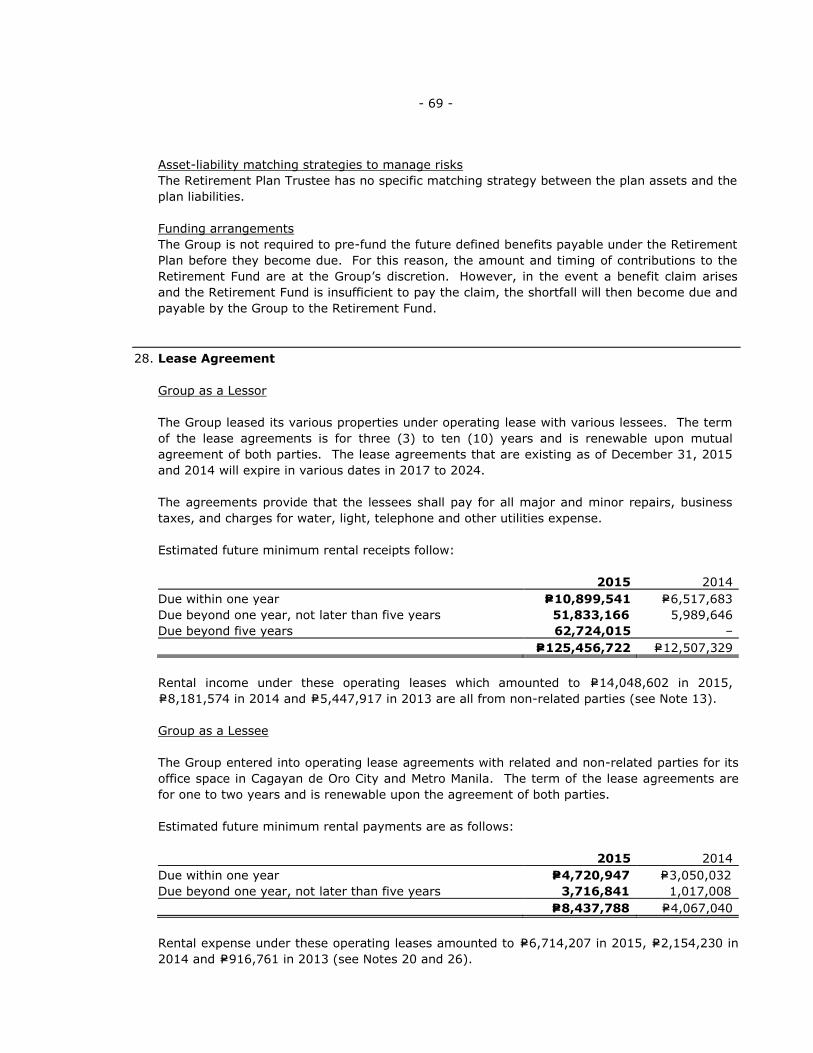
- 69 -
Asset-liability matching strategies to manage risks
The Retirement Plan Trustee has no specific matching strategy between the plan assets and the
plan liabilities.
Funding arrangements
The Group is not required to pre-fund the future defined benefits payable under the Retirement
Plan before they become due. For this reason, the amount and timing of contributions to the
Retirement Fund are at the Group’s discretion. However, in the event a benefit claim arises
and the Retirement Fund is insufficient to pay the claim, the shortfall will then become due and
payable by the Group to the Retirement Fund.
28. Lease Agreement
Group as a Lessor
The Group leased its various properties under operating lease with various lessees. The term
of the lease agreements is for three (3) to ten (10) years and is renewable upon mutual
agreement of both parties. The lease agreements that are existing as of December 31, 2015
and 2014 will expire in various dates in 2017 to 2024.
The agreements provide that the lessees shall pay for all major and minor repairs, business
taxes, and charges for water, light, telephone and other utilities expense.
Estimated future minimum rental receipts follow:
2015 2014
Due within one year P=10,899,541 P=6,517,683
Due beyond one year, not later than five years 51,833,166 5,989,646
Due beyond five years 62,724,015 –
P=125,456,722 P=12,507,329
Rental income under these operating leases which amounted to P=14,048,602 in 2015,
P=8,181,574 in 2014 and P=5,447,917 in 2013 are all from non-related parties (see Note 13).
Group as a Lessee
The Group entered into operating lease agreements with related and non-related parties for its
office space in Cagayan de Oro City and Metro Manila. The term of the lease agreements are
for one to two years and is renewable upon the agreement of both parties.
Estimated future minimum rental payments are as follows:
2015 2014
Due within one year P=4,720,947 P=3,050,032
Due beyond one year, not later than five years 3,716,841 1,017,008
P=8,437,788 P=4,067,040
Rental expense under these operating leases amounted to P=6,714,207 in 2015, P=2,154,230 in
2014 and P=916,761 in 2013 (see Notes 20 and 26).
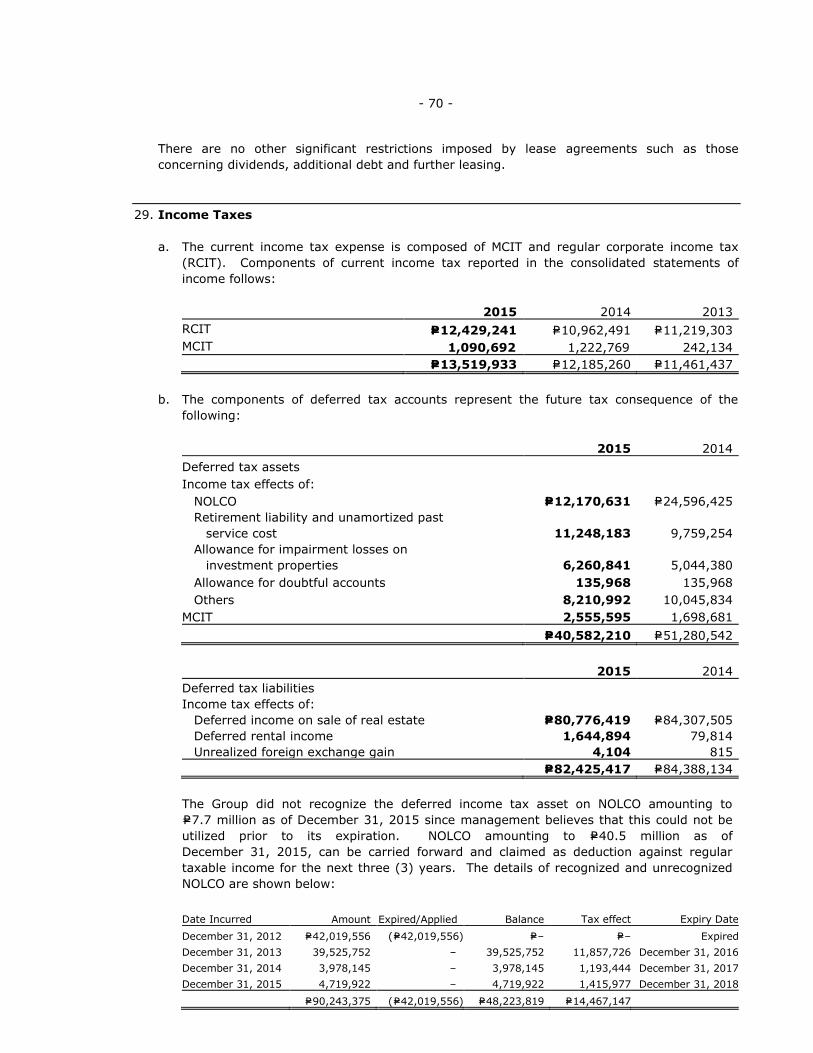
- 70 -
There are no other significant restrictions imposed by lease agreements such as those
concerning dividends, additional debt and further leasing.
29. Income Taxes
a. The current income tax expense is composed of MCIT and regular corporate income tax
(RCIT). Components of current income tax reported in the consolidated statements of
income follows:
2015 2014 2013
RCIT P=12,429,241 P=10,962,491 P=11,219,303
MCIT 1,090,692 1,222,769 242,134
P=13,519,933 P=12,185,260 P=11,461,437
b. The components of deferred tax accounts represent the future tax consequence of the
following:
2015 2014
Deferred tax assets
Income tax effects of:
NOLCO P=12,170,631 P=24,596,425
Retirement liability and unamortized past
service cost 11,248,183 9,759,254
Allowance for impairment losses on
investment properties 6,260,841 5,044,380
Allowance for doubtful accounts 135,968 135,968
Others 8,210,992 10,045,834
MCIT 2,555,595 1,698,681
P=40,582,210 P=51,280,542
2015 2014
Deferred tax liabilities
Income tax effects of:
Deferred income on sale of real estate P=80,776,419 P=84,307,505
Deferred rental income 1,644,894 79,814
Unrealized foreign exchange gain 4,104 815
P=82,425,417 P=84,388,134
The Group did not recognize the deferred income tax asset on NOLCO amounting to
P=7.7 million as of December 31, 2015 since management believes that this could not be
utilized prior to its expiration. NOLCO amounting to P=40.5 million as of
December 31, 2015, can be carried forward and claimed as deduction against regular
taxable income for the next three (3) years. The details of recognized and unrecognized
NOLCO are shown below:
Date Incurred Amount Expired/Applied Balance Tax effect Expiry Date
December 31, 2012 P=42,019,556 (P=42,019,556) P=– P=– Expired
December 31, 2013 39,525,752 – 39,525,752 11,857,726 December 31, 2016
December 31, 2014 3,978,145 – 3,978,145 1,193,444 December 31, 2017
December 31, 2015 4,719,922 – 4,719,922 1,415,977 December 31, 2018
P=90,243,375 (P=42,019,556) P=48,223,819 P=14,467,147
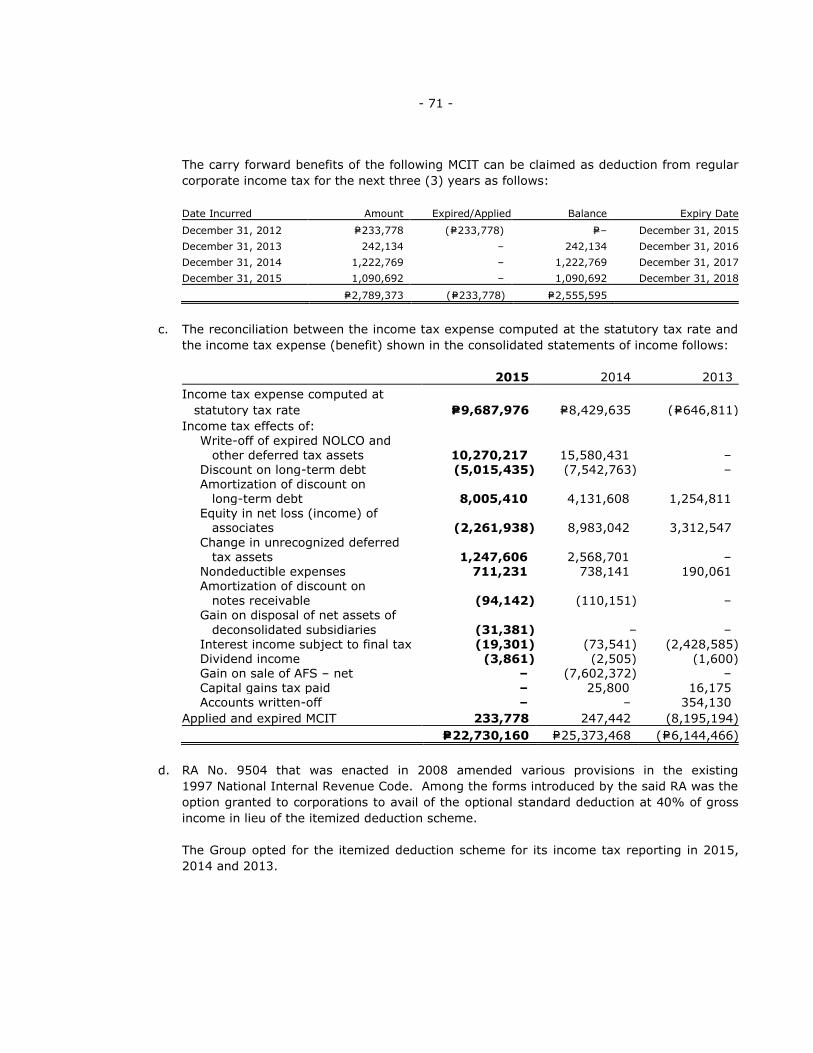
- 71 -
The carry forward benefits of the following MCIT can be claimed as deduction from regular
corporate income tax for the next three (3) years as follows:
Date Incurred Amount Expired/Applied Balance Expiry Date
December 31, 2012 P=233,778 (P=233,778) P=– December 31, 2015
December 31, 2013 242,134 – 242,134 December 31, 2016
December 31, 2014 1,222,769 – 1,222,769 December 31, 2017
December 31, 2015 1,090,692 – 1,090,692 December 31, 2018
P=2,789,373 (P=233,778) P=2,555,595
c. The reconciliation between the income tax expense computed at the statutory tax rate and
the income tax expense (benefit) shown in the consolidated statements of income follows:
2015 2014 2013
Income tax expense computed at
statutory tax rate P=9,687,976 P=8,429,635 (P=646,811)
Income tax effects of: Write-off of expired NOLCO and
other deferred tax assets 10,270,217 15,580,431 – Discount on long-term debt (5,015,435) (7,542,763) – Amortization of discount on
long-term debt 8,005,410 4,131,608 1,254,811 Equity in net loss (income) of
associates (2,261,938) 8,983,042 3,312,547
Change in unrecognized deferred tax assets 1,247,606 2,568,701 –
Nondeductible expenses 711,231 738,141 190,061 Amortization of discount on
notes receivable (94,142) (110,151) – Gain on disposal of net assets of
deconsolidated subsidiaries (31,381) – – Interest income subject to final tax (19,301) (73,541) (2,428,585) Dividend income (3,861) (2,505) (1,600) Gain on sale of AFS – net – (7,602,372) – Capital gains tax paid – 25,800 16,175 Accounts written-off – – 354,130
Applied and expired MCIT 233,778 247,442 (8,195,194)
P=22,730,160 P=25,373,468 (P=6,144,466)
d. RA No. 9504 that was enacted in 2008 amended various provisions in the existing
1997 National Internal Revenue Code. Among the forms introduced by the said RA was the
option granted to corporations to avail of the optional standard deduction at 40% of gross
income in lieu of the itemized deduction scheme.
The Group opted for the itemized deduction scheme for its income tax reporting in 2015,
2014 and 2013.

- 72 -
30. Earnings per Share (EPS)
Basic EPS is computed as follows:
2015 2014 2013
Net profit attributable to equity holders of
Parent Company
P=10,025,368
P=2,282,423 P=3,555,644
Divided by weighted average number of
shares outstanding 1,732,865,522 1,732,865,522 1,732,865,522
Basic earnings per share P=0.00579 P=0.00132 P=0.00205
The Group has no dilutive potential shares as of December 31, 2015, 2014 and 2013
(see Note 21).
31. Financial Instruments
Set out below is a comparison by category of carrying values and estimated fair values of
Group’s financial instruments as of December 31, 2015 and 2014:
2015
Note Carrying value Fair value
Quoted Prices
in Active
Markets
(Level 1)
Significant
Observable
Inputs
(Level 2)
Significant
Unobservable
Inputs
(Level 3)
Financial assets: Cash and cash equivalents 6 P=43,920,481 P=43,920,481 P=– P=43,920,481 P=–
Receivables* 7 533,964,983 533,964,983 – 533,964,983 –
Advances to a related party 20 24,721,000 24,721,000 – 24,721,000 –
Refundable deposits 5 11,052,656 11,052,656 – 11,052,656 –
AFS investments 12 988,939,404 988,939,404 824,275,828 – 164,633,576
P=1,602,598,524 P=1,602,598,524 P=824,275,828 P=613,659,120 P=164,633,576
Financial liabilities:
Accounts payable and
accrued expenses** 18 P=369,958,213 P=369,958,213 P=– P=369,958,213 P=–
Short-term debt 19 289,000,000 289,000,000 – 289,000,000 –
Long-term debt 19 1,798,380,390 1,798,380,390 – 1,798,380,390 –
Subscriptions payable 12 70,025,817 70,025,817 – 70,025,817 –
P=2,527,364,420 P=2,527,364,420 P=– P=2,527,364,420 P=–
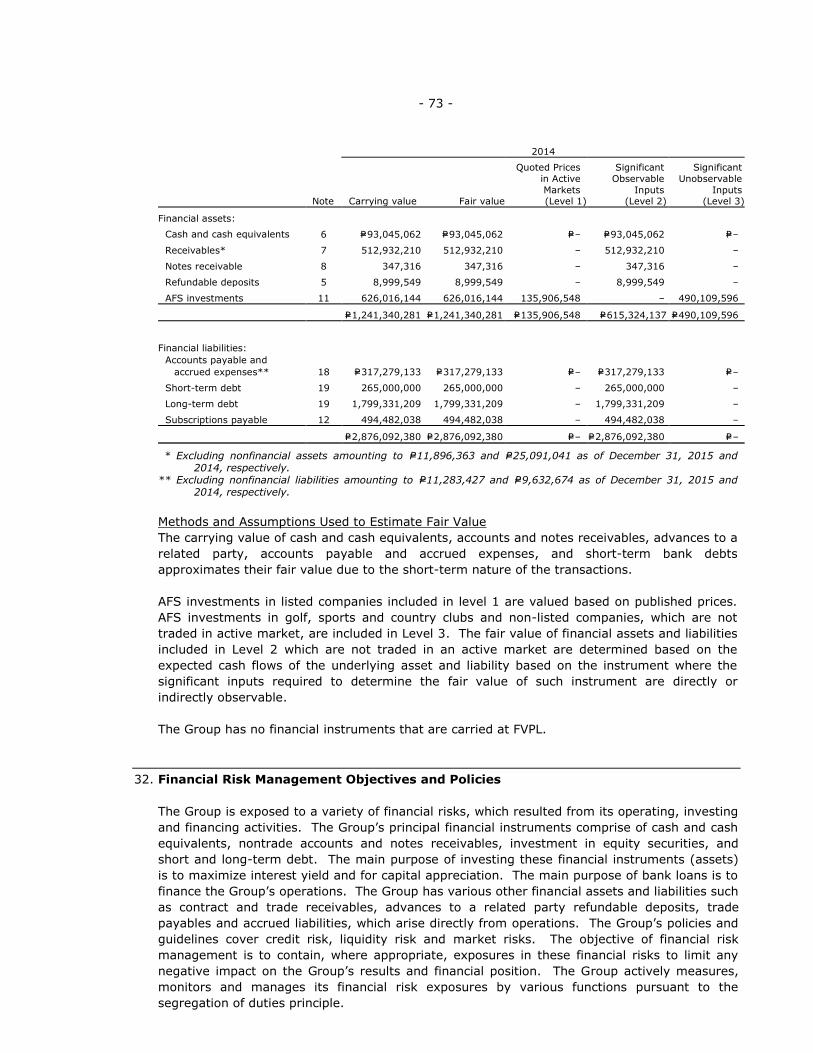
- 73 -
* Excluding nonfinancial assets amounting to P=11,896,363 and P=25,091,041 as of December 31, 2015 and 2014, respectively.
** Excluding nonfinancial liabilities amounting to P=11,283,427 and P=9,632,674 as of December 31, 2015 and 2014, respectively.
Methods and Assumptions Used to Estimate Fair Value
The carrying value of cash and cash equivalents, accounts and notes receivables, advances to a
related party, accounts payable and accrued expenses, and short-term bank debts
approximates their fair value due to the short-term nature of the transactions.
AFS investments in listed companies included in level 1 are valued based on published prices.
AFS investments in golf, sports and country clubs and non-listed companies, which are not
traded in active market, are included in Level 3. The fair value of financial assets and liabilities
included in Level 2 which are not traded in an active market are determined based on the
expected cash flows of the underlying asset and liability based on the instrument where the
significant inputs required to determine the fair value of such instrument are directly or
indirectly observable.
The Group has no financial instruments that are carried at FVPL.
32. Financial Risk Management Objectives and Policies
The Group is exposed to a variety of financial risks, which resulted from its operating, investing
and financing activities. The Group’s principal financial instruments comprise of cash and cash
equivalents, nontrade accounts and notes receivables, investment in equity securities, and
short and long-term debt. The main purpose of investing these financial instruments (assets)
is to maximize interest yield and for capital appreciation. The main purpose of bank loans is to
finance the Group’s operations. The Group has various other financial assets and liabilities such
as contract and trade receivables, advances to a related party refundable deposits, trade
payables and accrued liabilities, which arise directly from operations. The Group’s policies and
guidelines cover credit risk, liquidity risk and market risks. The objective of financial risk
management is to contain, where appropriate, exposures in these financial risks to limit any
negative impact on the Group’s results and financial position. The Group actively measures,
monitors and manages its financial risk exposures by various functions pursuant to the
segregation of duties principle.
2014
Note Carrying value Fair value
Quoted Prices
in Active
Markets (Level 1)
Significant
Observable
Inputs (Level 2)
Significant
Unobservable
Inputs (Level 3)
Financial assets:
Cash and cash equivalents 6 P=93,045,062 P=93,045,062 P=– P=93,045,062 P=–
Receivables* 7 512,932,210 512,932,210 – 512,932,210 –
Notes receivable 8 347,316 347,316 – 347,316 –
Refundable deposits 5 8,999,549 8,999,549 – 8,999,549 –
AFS investments 11 626,016,144 626,016,144 135,906,548 – 490,109,596
P=1,241,340,281 P=1,241,340,281 P=135,906,548 P=615,324,137 P=490,109,596
Financial liabilities:
Accounts payable and
accrued expenses** 18 P=317,279,133 P=317,279,133 P=– P=317,279,133 P=–
Short-term debt 19 265,000,000 265,000,000 – 265,000,000 –
Long-term debt 19 1,799,331,209 1,799,331,209 – 1,799,331,209 –
Subscriptions payable 12 494,482,038 494,482,038 – 494,482,038 –
P=2,876,092,380 P=2,876,092,380 P=– P=2,876,092,380 P=–

- 74 -
The main risks arising from the use of financial instruments are credit risk, liquidity risk,
interest rate risk, equity price risk, foreign currency risk and agricultural production and price
risk. The Group’s BOD reviews and agrees with policies for managing each of these risks.
These are summarized below:
Credit risk
Credit risk refers to the risk that a counterparty will default and/or fail to honor its financial
or contractual obligations, resulting in financial loss to the Group. The Group only transacts
with recognized and creditworthy counterparties, like investing in creditworthy equities.
Moreover, the Group follows strict credit policies and procedures in granting of credit to
customers, which are regularly reviewed and updated to reflect changing risk conditions,
which includes credit evaluation, administration, monitoring and collection guidelines. The
Group likewise monitors exposures through continuing assessment of creditworthiness of
customers, and monitoring of the aged schedules of receivables. In addition, real estate
buyers are subject to standard credit check procedures, which are calibrated based on
payment scheme offered.
a. Credit risk exposure
Generally, the maximum credit risk exposure of the financial assets is the carrying
amounts of the Group’s financial assets as summarized below:
2015 2014
Cash in banks and cash equivalents P=43,058,852 P=92,094,804
Accounts receivable 533,964,983 512,932,210
Available-for-sale investments 988,939,404 626,496,144
Advances to a related party 24,731,000 –
Refundable deposits 11,052,656 8,999,549
Notes receivable – 347,316
P=1,601,746,895 P=1,240,870,023
The Group’s cash and cash equivalents have been invested with various creditworthy
banks, thus limiting exposure to credit risk, in regard to its liquid assets. The Group’s
contract and trade receivables consist of significant number and various customers/lot
buyers. Customers of the Group have been subjected to credit evaluation prior to sale.
Moreover, ownership of the shares and title of the real estate sold on installment to
various customers/lot buyers are only transferred, upon full payment of the agreed
total contract price.
Available-for-sale investments include investment in shares that are actively traded in
the stock market. The Group uses other publicly available financial information to
monitor its investments.
With respect to credit risk arising from other financial assets, the Group’s exposure to
credit risk arises from default of the counterparties, with a maximum exposure equal to
the carrying value of these instruments.

- 75 -
b. Credit Quality
Below is the credit quality by class of financial assets as of December 31, 2015 and
2014, gross of allowance for impairment losses.
2015
Neither past due nor impaired
Note High Grade
Standard
Grade
Substandard
Grade
Past due
Not impaired Impaired Total
Loans and receivable
Cash and cash equivalents 6 P=43,920,481 P=– P=– P=– P=– P=43,920,481
Accounts receivable 7 463,855,378 7,828,700 519,094 61,761,811 453,225 534,418,208
Advances to a related party 20 24,721,000 – – – – 24,721,000
Refundable deposits 5 11,052,656 – – – – 11,052,656
Total loans and receivables 543,549,515 7,828,700 519,094 61,761,811 453,225 614,112,345
AFS investments
Equity securities 12 988,939,404 – – – – 988,939,404
P=1,532,488,919 P=7,828,700 P=519,094 P=61,761,811 P=453,225 P=1,603,051,749
2014
Neither past due nor impaired
Note High Grade
Standard
Grade
Substandard
Grade
Past due
Not impaired Impaired Total
Loans and receivable
Cash and cash equivalents 6 P=93,045,062 P=– P=– P=– P=– P=93,045,062
Accounts receivable 7 458,594,333 38,510,641 8,228,125 7,599,111 1,364,796 514,297,006
Refundable deposits 5 8,999,549 – – – – 8,999,549
Notes receivable 8 347,316 – – – – 347,316
Total loans and receivables 560,986,260 38,510,641 8,228,125 7,599,111 1,364,796 616,688,933
AFS investments
Equity securities 12 626,496,144 – – – – 626,496,144
P=1,187,482,404 P=38,510,641 P=8,228,125 P=7,599,111 P=1,364,796 P=1,243,185,077
High grade cash and cash equivalents are short-term placements and working capital
cash fund placed, invested, or deposited in local banks belonging to the top 25 banks in
the Philippines in terms of resources and profitability.
Other high grade accounts are accounts considered to be high value. The
counterparties have a very remote likelihood of default and have consistently exhibited
good paying habits. Standard grade accounts are active accounts with minimal to
regular instances of payment default, due to ordinary/common collection issues. These
accounts are typically not impaired as the counterparties generally respond to credit
actions and update their payments accordingly. Substandard grade accounts are
accounts which have a probability of impairment based on historical trend. These
accounts show propensity to default in payment despite regular follow-up and extended
payment terms.
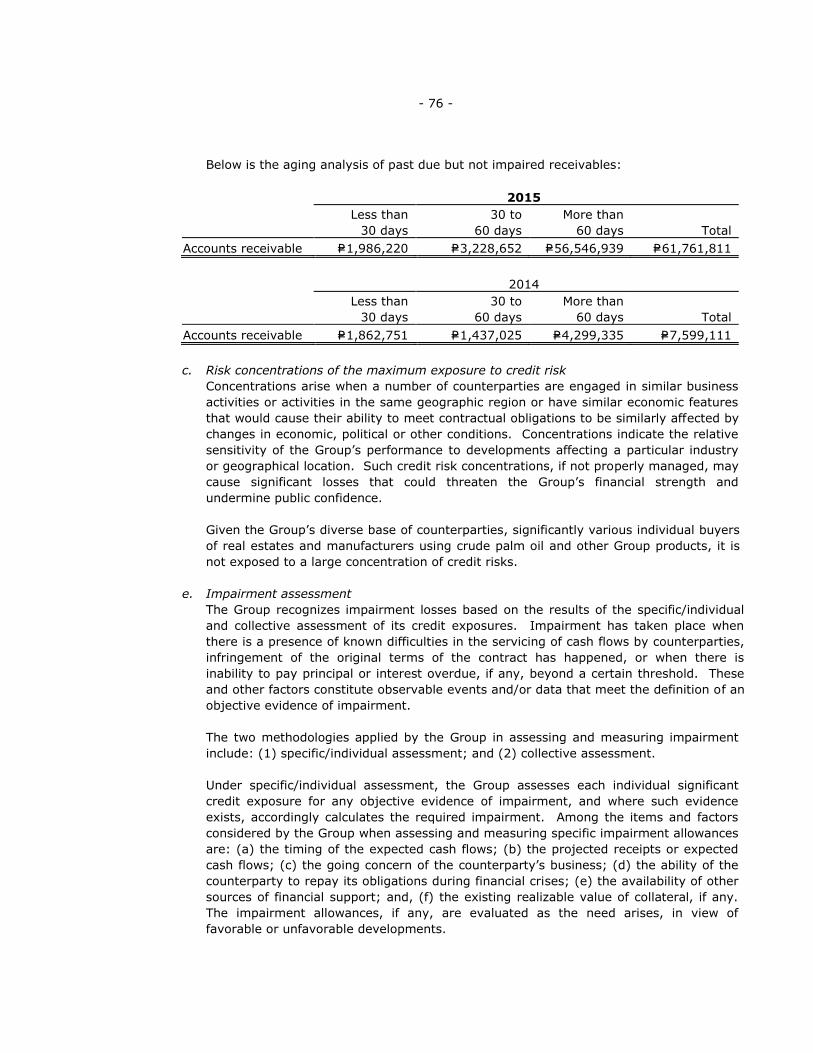
- 76 -
Below is the aging analysis of past due but not impaired receivables:
2015
Less than
30 days
30 to
60 days
More than
60 days Total
Accounts receivable P=1,986,220 P=3,228,652 P=56,546,939 P=61,761,811
2014
Less than
30 days
30 to
60 days
More than
60 days Total
Accounts receivable P=1,862,751 P=1,437,025 P=4,299,335 P=7,599,111
c. Risk concentrations of the maximum exposure to credit risk
Concentrations arise when a number of counterparties are engaged in similar business
activities or activities in the same geographic region or have similar economic features
that would cause their ability to meet contractual obligations to be similarly affected by
changes in economic, political or other conditions. Concentrations indicate the relative
sensitivity of the Group’s performance to developments affecting a particular industry
or geographical location. Such credit risk concentrations, if not properly managed, may
cause significant losses that could threaten the Group’s financial strength and
undermine public confidence.
Given the Group’s diverse base of counterparties, significantly various individual buyers
of real estates and manufacturers using crude palm oil and other Group products, it is
not exposed to a large concentration of credit risks.
e. Impairment assessment
The Group recognizes impairment losses based on the results of the specific/individual
and collective assessment of its credit exposures. Impairment has taken place when
there is a presence of known difficulties in the servicing of cash flows by counterparties,
infringement of the original terms of the contract has happened, or when there is
inability to pay principal or interest overdue, if any, beyond a certain threshold. These
and other factors constitute observable events and/or data that meet the definition of an
objective evidence of impairment.
The two methodologies applied by the Group in assessing and measuring impairment
include: (1) specific/individual assessment; and (2) collective assessment.
Under specific/individual assessment, the Group assesses each individual significant
credit exposure for any objective evidence of impairment, and where such evidence
exists, accordingly calculates the required impairment. Among the items and factors
considered by the Group when assessing and measuring specific impairment allowances
are: (a) the timing of the expected cash flows; (b) the projected receipts or expected
cash flows; (c) the going concern of the counterparty’s business; (d) the ability of the
counterparty to repay its obligations during financial crises; (e) the availability of other
sources of financial support; and, (f) the existing realizable value of collateral, if any.
The impairment allowances, if any, are evaluated as the need arises, in view of
favorable or unfavorable developments.
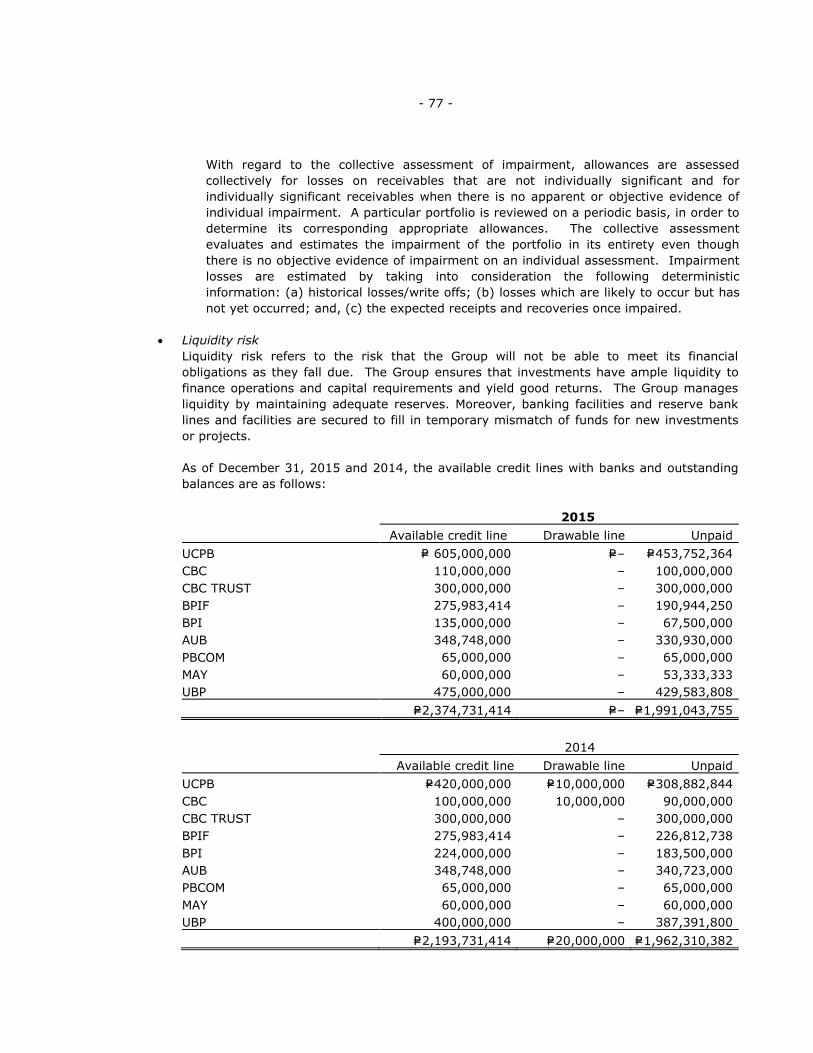
- 77 -
With regard to the collective assessment of impairment, allowances are assessed
collectively for losses on receivables that are not individually significant and for
individually significant receivables when there is no apparent or objective evidence of
individual impairment. A particular portfolio is reviewed on a periodic basis, in order to
determine its corresponding appropriate allowances. The collective assessment
evaluates and estimates the impairment of the portfolio in its entirety even though
there is no objective evidence of impairment on an individual assessment. Impairment
losses are estimated by taking into consideration the following deterministic
information: (a) historical losses/write offs; (b) losses which are likely to occur but has
not yet occurred; and, (c) the expected receipts and recoveries once impaired.
Liquidity risk
Liquidity risk refers to the risk that the Group will not be able to meet its financial
obligations as they fall due. The Group ensures that investments have ample liquidity to
finance operations and capital requirements and yield good returns. The Group manages
liquidity by maintaining adequate reserves. Moreover, banking facilities and reserve bank
lines and facilities are secured to fill in temporary mismatch of funds for new investments
or projects.
As of December 31, 2015 and 2014, the available credit lines with banks and outstanding
balances are as follows:
2015
Available credit line Drawable line Unpaid
UCPB P= 605,000,000 P=– P=453,752,364
CBC 110,000,000 – 100,000,000
CBC TRUST 300,000,000 – 300,000,000
BPIF 275,983,414 – 190,944,250
BPI 135,000,000 – 67,500,000
AUB 348,748,000 – 330,930,000
PBCOM 65,000,000 – 65,000,000
MAY 60,000,000 – 53,333,333
UBP 475,000,000 – 429,583,808
P=2,374,731,414 P=– P=1,991,043,755
2014
Available credit line Drawable line Unpaid
UCPB P=420,000,000 P=10,000,000 P=308,882,844
CBC 100,000,000 10,000,000 90,000,000
CBC TRUST 300,000,000 – 300,000,000
BPIF 275,983,414 – 226,812,738
BPI 224,000,000 – 183,500,000
AUB 348,748,000 – 340,723,000
PBCOM 65,000,000 – 65,000,000
MAY 60,000,000 – 60,000,000
UBP 400,000,000 – 387,391,800
P=2,193,731,414 P=20,000,000 P=1,962,310,382
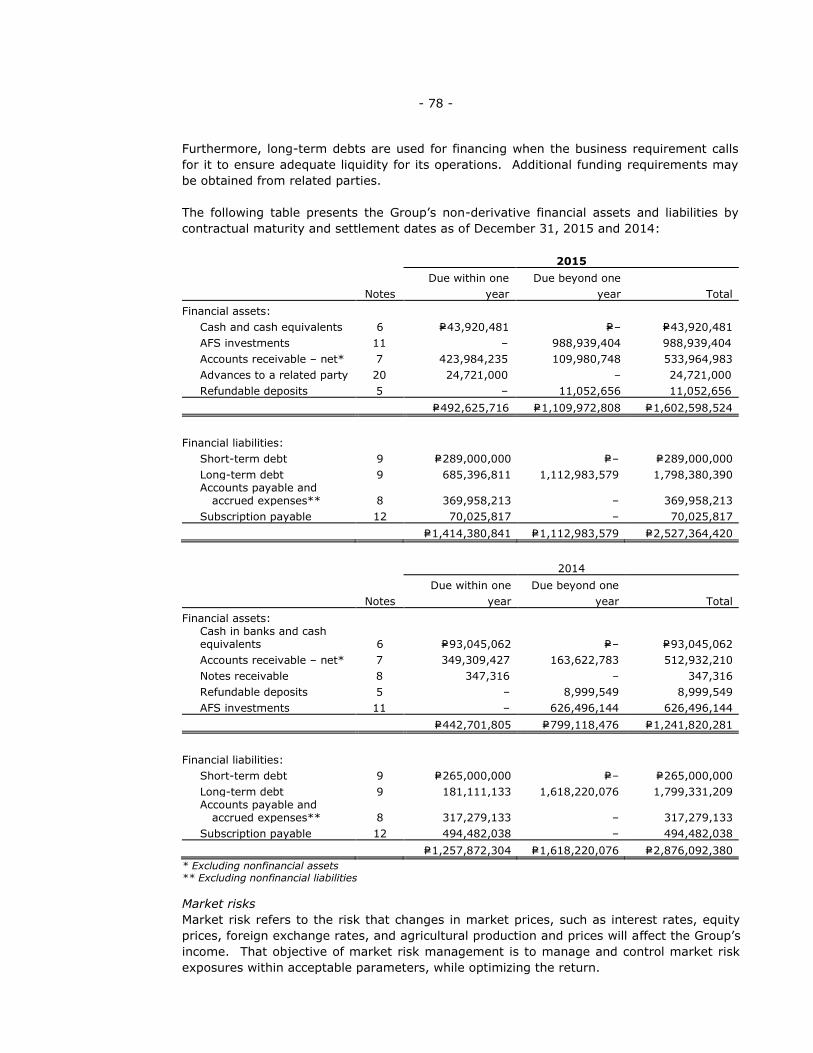
- 78 -
Furthermore, long-term debts are used for financing when the business requirement calls
for it to ensure adequate liquidity for its operations. Additional funding requirements may
be obtained from related parties.
The following table presents the Group’s non-derivative financial assets and liabilities by
contractual maturity and settlement dates as of December 31, 2015 and 2014:
2015
Notes
Due within one
year
Due beyond one
year Total
Financial assets:
Cash and cash equivalents 6 P=43,920,481 P=– P=43,920,481
AFS investments 11 – 988,939,404 988,939,404
Accounts receivable – net* 7 423,984,235 109,980,748 533,964,983
Advances to a related party 20 24,721,000 – 24,721,000
Refundable deposits 5 – 11,052,656 11,052,656
P=492,625,716 P=1,109,972,808 P=1,602,598,524
Financial liabilities:
Short-term debt 9 P=289,000,000 P=– P=289,000,000
Long-term debt 9 685,396,811 1,112,983,579 1,798,380,390 Accounts payable and
accrued expenses** 8 369,958,213 – 369,958,213
Subscription payable 12 70,025,817 – 70,025,817
P=1,414,380,841 P=1,112,983,579 P=2,527,364,420
2014
Notes
Due within one
year
Due beyond one
year Total
Financial assets: Cash in banks and cash equivalents 6 P=93,045,062 P=– P=93,045,062
Accounts receivable – net* 7 349,309,427 163,622,783 512,932,210
Notes receivable 8 347,316 – 347,316
Refundable deposits 5 – 8,999,549 8,999,549
AFS investments 11 – 626,496,144 626,496,144
P=442,701,805 P=799,118,476 P=1,241,820,281
Financial liabilities:
Short-term debt 9 P=265,000,000 P=– P=265,000,000
Long-term debt 9 181,111,133 1,618,220,076 1,799,331,209 Accounts payable and
accrued expenses** 8 317,279,133 – 317,279,133
Subscription payable 12 494,482,038 – 494,482,038
P=1,257,872,304 P=1,618,220,076 P=2,876,092,380
* Excluding nonfinancial assets ** Excluding nonfinancial liabilities
Market risks
Market risk refers to the risk that changes in market prices, such as interest rates, equity
prices, foreign exchange rates, and agricultural production and prices will affect the Group’s
income. That objective of market risk management is to manage and control market risk
exposures within acceptable parameters, while optimizing the return.
- 79 -
There has been no change to the Group’s exposure to market risk or the manner in which it
manages and measures the risk. The Group is subject to the following market risks:
a. Interest Rate Risk
The Group is exposed to interest rate fluctuations on their cash in bank and cash
equivalents, contract receivables on sale of real estate and short-term and long-term
debt. Other financial assets and liabilities which principally arise in the ordinary course
of its operations, are generally short-term and noninterest-bearing.
Historically, the rate of fluctuations relative to its cash in bank and cash equivalents is
minimal. Interest rates in 2015, 2014, 2013 are approximately less than 1% for cash
in banks and 1.05% to 3.60% for cash equivalents.
The contract receivables on sale of real estate are managed within the parameters
approved by management. Currently, these have been offered at approved fixed
rates. Interest rates, which are highly controllable by the Parent Company, ranged
from 10% to 18% in 2015 and 2014, depending on the terms and length of payment in
years. Any changes in the interest rate have been subjected to thorough review and
approval of the management.
Interest-bearing long-term debt carries interest rates which ranged from 4.75% to
11.5% in 2015 and 2014. Interest rates of certain debt are subject to quarterly
repricing or subject to variability based on agreed terms with bank. An increase in
interest rate by 1% would decrease equity by P=0.8 million as of December 31, 2015.
An equal change in the opposite would increase equity by the same amount.
b. Equity Price Risk
Equity price risk is the risk that the fair values of equities decrease as a result of
changes in the levels of equity indices and the value of individual stocks. Changes in
fair value of available-for-sale equity instruments due to a reasonably possible change
in equity indices, with all other variables held constant will increase equity by
P=8.3 million as of December 31, 2015, if equity prices will increase by 1%. An equal
change in the opposite direction would have decreased equity by the same amount.
c. Foreign Currency Risk
The Group’s exposure to foreign currency risk is very minimal. The Group’s policy is to
maintain a level of foreign currency-denominated cash in bank that would not
significantly affect the Group’s financial position and results of operations due to
movements in foreign exchange rates.
The following table demonstrates the sensitivity to a reasonable possible change in the
Philippine Peso – United States (US) dollar exchange rate, with all variable held
constant, the Group’s profit before tax and the Group’s equity on December 31, 2015.
Reasonably Possible Changes in US Dollar –
Philippine Peso Exchange Rate
Effect on
Profit before tax
Effect on Equity
7% P=27,258 P=19,080
-7% (27,258) (19,080)
The Group’s exposures to foreign currency rates vary during the year depending on the
dollar denominated cash deposited in banks. Nonetheless, the analysis above is
considered to be representative of the Group’s currency risk.
- 80 -
d. Agricultural Production and Price Risk
Agricultural production risks include all factors that affect the productivity of the crop
which also affect the profitability of biological assets. The variations in crop yields are
affected by a range of factors such as weather conditions/climate change, pests,
diseases, technological change as well as management of natural resources such as
water. Agricultural production price risk is associated with variability, mostly, in output
price and also in input price.
The Group reduces the agricultural production risk and price risk by implementing good
farm practices, developing and improving relevant infrastructure and access to
agricultural support practices, and by adopting social schemes. The Group also ensures
that proper selection of planting sites has been performed.
33. Capital Management
The primary objective of the Group’s capital management is to ensure its ability to continue as
a going concern and maintains healthy ratios in order to support its business and maximize
shareholders’ value.
The Group considers the following accounts as its capital:
2015 2014
Capital stock P=1,732,865,522 P=1,732,865,522
Additional paid-in capital 586,198,947 586,198,947
Retained earnings 361,793,923 347,042,787
P=2,680,858,392 P=2,666,107,256
The Group manages capital on the basis of the debt-to-equity ratio which is calculated as total
debt divided by total equity.
The debt-to-equity ratios as at December 31, 2015 and 2014 follow: 2015 2014
Total debt P=2,695,862,035 P=3,045,437,978
Divided by total equity 2,680,858,392 2,666,107,256
Debt-to-equity ratio 1.01:1.00 1.14:1.00
The Group had not been subjected to externally imposed capital requirements in 2015 and
2014. No changes were made in the objectives, policies, and processes during the years ended
December 31, 2015 and 2014.
34. Dividend Declaration
On June 7, 2013, the Parent Company declared stock dividends equivalent to 25% of
outstanding capital stock of the Corporation for the stockholders of record as of
September 12, 2013 and distributed the shares to the stockholders in October 2013.
In December 2010, the Parent Company distributed 62,500,591 shares which is net of
4,609,685 shares representing the final tax due on the treasury shares.
- 81 -
On August 18, 2010, the BOD approved the declaration of a total of 63,120,433 of the Parent
Company’s treasury shares as property dividends to be reissued at
P=3.20 per share. Shareholders as of record date owning 16 shares shall be entitled to one
treasury share. No fractional shares were issued. Since the property dividend was subject to
regulatory approval of the SEC, the record date was set on November 3, 2010 and the
distribution date was November 29, 2010 after an instruction was received from the SEC for
the BOD to set those pertinent dates.
On July 9, 2010, the Parent Company’s BOD, upon the recommendation of management,
declared a cash dividend of Twenty Centavos (P=0.20) per share. Conformably with the rules of
the Philippine Stock Exchange, the Record Date for the dividend was August 6, 2010 and
Payment Date was on August 31, 2010.
On December 27, 2006, the BOD declared cash dividends equal to P=0.05 per share or a total of
P=49,439,315 to shareholders of record as of January 15, 2007 payable on February 8, 2007.
Relative to this, dividend payable of P=45,852,178 (net of withholding tax) was recognized in
the December 31, 2006 Parent Company statements of financial position. As of
December 31, 2012, dividends payable amounted to P=2,420,541. In 2013, the unpaid
dividends of the Parent Company was closed to other income.
35. Business Segment Information
The operating subsidiaries of the Group engaged in varied principal activities or operations such
as real estate, quarry and mining, service/manufacturing/trading, agriculture, power and
holding of which two or more subsidiaries share the same line of business. The operating
results of these segments are regularly monitored by the President who is the chief operating
decision maker (CODM) of the Group for the purpose of making decisions about resource
allocation and performance assessment. However, as permitted by PFRS 8, Operating
Segments, the Group has aggregated these segments into a single operating segment to which
it derives its revenues and incurs expenses as these segments have the same economic
characteristics and are similar in the following respects:
a. Nature of products and services
b. Nature of operating processes
c. Methods used to distribute their products and services.
Operating segments are reported in a manner consistent with the internal reporting provided to
the Group’s CODM.
- 82 -
In identifying the operating segments, management generally follows the Group’s principal
activities or business operations, which represent the main products and services provided by
the Group as follows:
Real estate Development of land into commercial and residential subdivision, sale of lots
and residential houses and the provision of customer financing for sales
Quarry and Mining
Quarrying and mining of basalt rocks for production of construction aggregates
Service/ Manufacturing /Trading
Holding and providing rights to water to public utilities and cooperatives; Manufacturing of crude palm oil; Selling of goods on wholesale and retail basis
Hotel Management of hotel operations
Agriculture Development of land for palm oil production and sale of palm seedlings and sale of crude palm oil
Power Operating of power plants and/or purchase, generation, production supply and sale of power. However, there was no commercial operations yet in
2014.
Holding Holding of properties of every kind and description
The Group generally account for inter-segment sales and transfers as if the sales and transfers
were to third parties at current market prices.
The following tables regarding business segments present assets and liabilities as of
December 31, 2015 and revenue and profit information for each of the three years in the
period ended December 31, 2015 (in thousands).
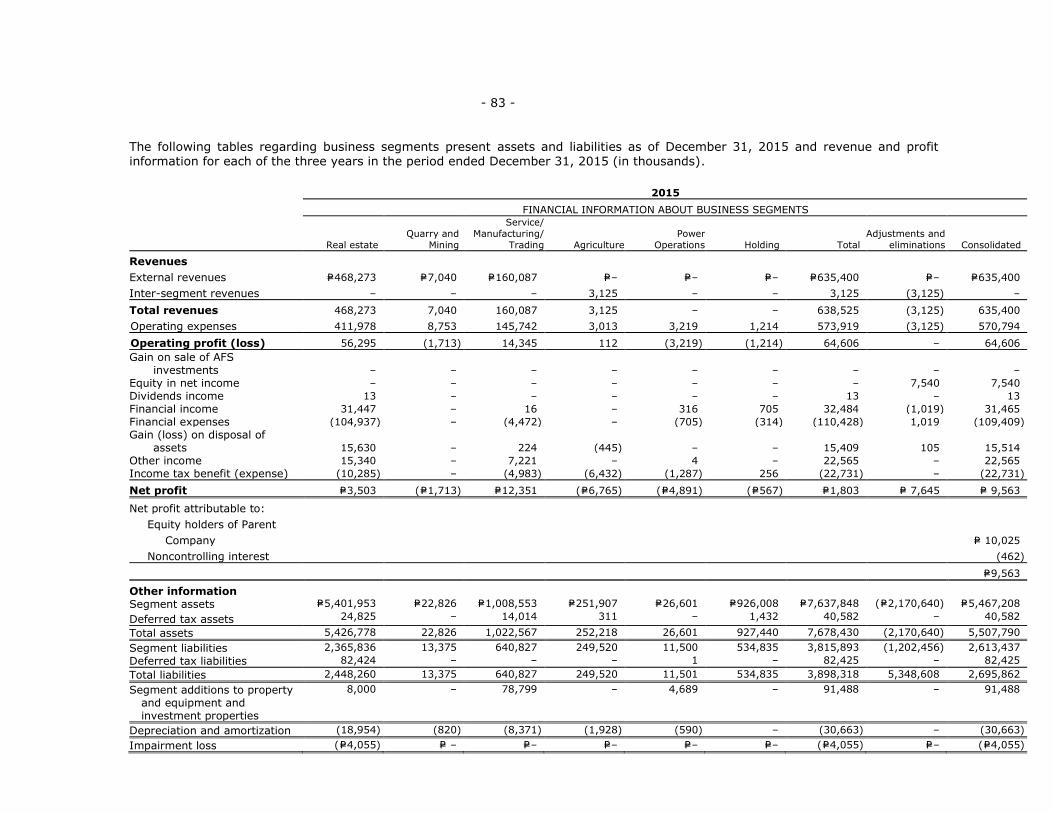
- 83 -
The following tables regarding business segments present assets and liabilities as of December 31, 2015 and revenue and profit information for each of the three years in the period ended December 31, 2015 (in thousands).
2015
FINANCIAL INFORMATION ABOUT BUSINESS SEGMENTS
Real estate
Quarry and
Mining
Service/
Manufacturing/
Trading Agriculture
Power
Operations Holding Total
Adjustments and
eliminations Consolidated
Revenues
External revenues P=468,273 P=7,040 P=160,087 P=– P=– P=– P=635,400 P=– P=635,400
Inter-segment revenues – – – 3,125 – – 3,125 (3,125) –
Total revenues 468,273 7,040 160,087 3,125 – – 638,525 (3,125) 635,400
Operating expenses 411,978 8,753 145,742 3,013 3,219 1,214 573,919 (3,125) 570,794
Operating profit (loss) 56,295 (1,713) 14,345 112 (3,219) (1,214) 64,606 – 64,606
Gain on sale of AFS investments – – – – – – – – –
Equity in net income – – – – – – – 7,540 7,540
Dividends income 13 – – – – – 13 – 13
Financial income 31,447 – 16 – 316 705 32,484 (1,019) 31,465
Financial expenses (104,937) – (4,472) – (705) (314) (110,428) 1,019 (109,409)
Gain (loss) on disposal of assets 15,630 – 224 (445) – – 15,409 105 15,514
Other income 15,340 – 7,221 – 4 – 22,565 – 22,565
Income tax benefit (expense) (10,285) – (4,983) (6,432) (1,287) 256 (22,731) – (22,731)
Net profit P=3,503 (P=1,713) P=12,351 (P=6,765) (P=4,891) (P=567) P=1,803 P= 7,645 P= 9,563
Net profit attributable to:
Equity holders of Parent
Company P= 10,025
Noncontrolling interest (462)
P=9,563
Other information
Segment assets P=5,401,953 P=22,826 P=1,008,553 P=251,907 P=26,601 P=926,008 P=7,637,848 (P=2,170,640) P=5,467,208
Deferred tax assets 24,825 – 14,014 311 – 1,432 40,582 – 40,582
Total assets 5,426,778 22,826 1,022,567 252,218 26,601 927,440 7,678,430 (2,170,640) 5,507,790
Segment liabilities 2,365,836 13,375 640,827 249,520 11,500 534,835 3,815,893 (1,202,456) 2,613,437
Deferred tax liabilities 82,424 – – – 1 – 82,425 – 82,425
Total liabilities 2,448,260 13,375 640,827 249,520 11,501 534,835 3,898,318 5,348,608 2,695,862
Segment additions to property and equipment and investment properties
8,000 – 78,799 – 4,689 – 91,488 – 91,488
Depreciation and amortization (18,954) (820) (8,371) (1,928) (590) – (30,663) – (30,663)
Impairment loss (P=4,055) P= – P=– P=– P=– P=– (P=4,055) P=– (P=4,055)

- 84 -
2014
FINANCIAL INFORMATION ABOUT BUSINESS SEGMENTS
Real estate
Quarry and
Mining
Service/
Manufacturing/
Trading Hotel Agriculture
Power
Operations Holding Total
Adjustments and
eliminations Consolidated
Revenues
External revenues P=438,453 P=9,652 P=186,208 P=8,174 P=– P=– P=– P=642,487 P=– P=642,487
Inter-segment revenues – – – 2,955 7,143 – – 10,098 (10,098) –
Total revenues 438,453 9,652 186,208 11,129 7,143 – – 652,585 (10,098) 642,487
Operating expenses 410,494 7,946 172,156 19,271 3,865 2,904 1,078 617,715 (36,577) 581,138
Operating profit (loss) 27,959 1,706 14,052 (8,142) 3,278 (2,904) (1,078) 34,871 26,479 61,350
Gain on sale of AFS investments 25,521 – – – – – – 25,521 – 25,521
Equity in net loss – – – – – – – – (29,943) (29,943)
Dividends income 8 – – – – – – 8 – 8
Financial income 43,337 – 14 5 – 384 1 43,741 (268) 43,473
Financial expenses (90,291) – – (715) – – – (91,006) 268 (90,738)
Gain (loss) on sale of assets 632 – 268 (8,356) 96 – – (7,360) (4) (7,364)
Other income 17,721 – 7,912 158 – – – 25,791 – 25,791
Income tax benefit (expense) (11,811) – (2,886) (6,551) (5,028) 659 244 (25,373) – (25,373)
Net profit P=13,076 P=1,706 P=19,360 (P=23,601) (P=1,654) (P=1,861) (P=833) P=6,193 (P=3,468) P=2,725
Net profit attributable to:
Equity holders of Parent
Company P=2,283
Noncontrolling interest 442
P=2,725
Other information
Segment assets P=5,418,627 P=24,043 P=878,747 P=41,864 P=270,350 P=25,634 P=1,352,857 P=8,012,122 (P=2,193,901) P=5,818,221
Deferred tax assets 24,218 – 17,906 – 6,682 1,085 1,190 51,081 200 51,281
Total assets 5,442,845 24,043 896,653 41,864 277,032 26,719 1,354,047 8,063,203 2,194,101 5,869,502
Segment liabilities 2,367,769 12,878 521,720 18,236 266,838 6,930 952,782 4,147,153 (1,186,103) 2,961,050
Deferred tax liabilities 84,388 – – – – – – 84,388 – 84,388
Total liabilities 2,452,157 12,878 521,720 18,236 266,838 6,930 952,782 4,231,541 (1,186,103) 3,045,438
Segment additions to property and equipment and investment properties 10,369 1,650 79,215 8,752 9,600 12,187 – 121,773 (12,850) 108,923
Depreciation and amortization (10,500) (169) (14,537) (8,583) (3,171) (502) (2) (37,464) – (37,464)
Impairment loss (P=27,829) P=– P=– P=– P=– P=– P=– (P=27,829) P=26,300 (P=1,529)
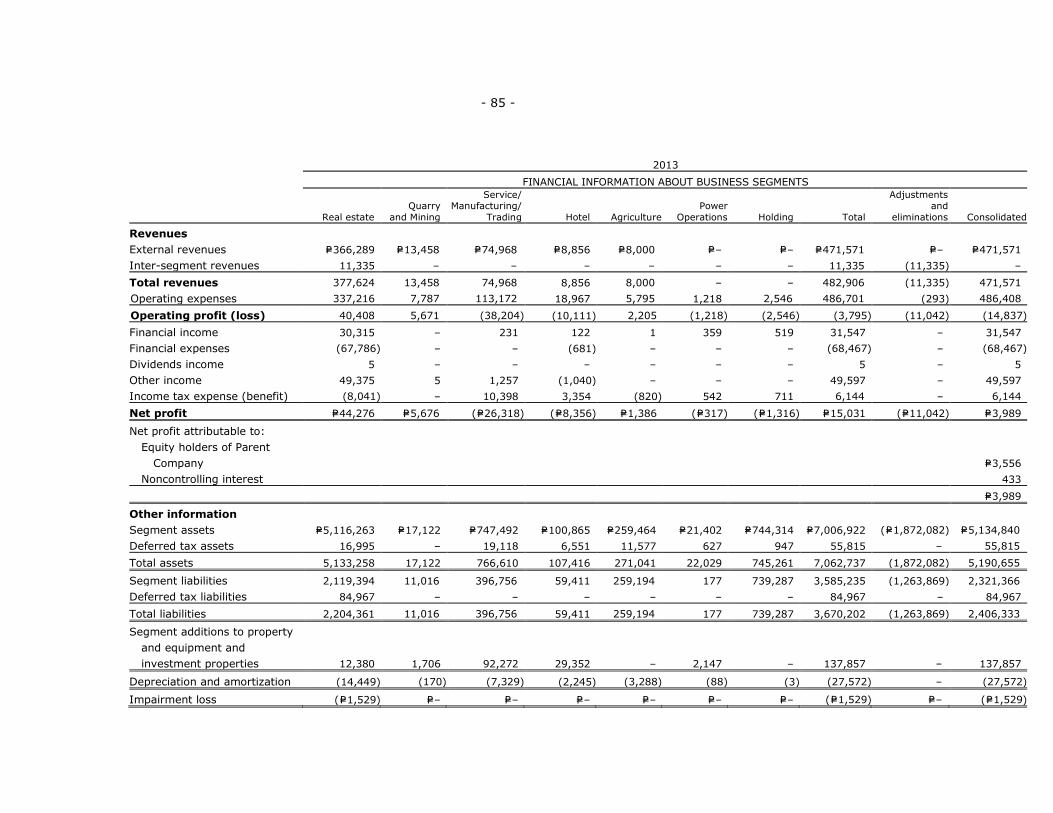
- 85 -
2013
FINANCIAL INFORMATION ABOUT BUSINESS SEGMENTS
Real estate
Quarry
and Mining
Service/ Manufacturing/
Trading Hotel Agriculture
Power
Operations Holding Total
Adjustments and
eliminations Consolidated
Revenues
External revenues P=366,289 P=13,458 P=74,968 P=8,856 P=8,000 P=– P=– P=471,571 P=– P=471,571
Inter-segment revenues 11,335 – – – – – – 11,335 (11,335) –
Total revenues 377,624 13,458 74,968 8,856 8,000 – – 482,906 (11,335) 471,571
Operating expenses 337,216 7,787 113,172 18,967 5,795 1,218 2,546 486,701 (293) 486,408
Operating profit (loss) 40,408 5,671 (38,204) (10,111) 2,205 (1,218) (2,546) (3,795) (11,042) (14,837)
Financial income 30,315 – 231 122 1 359 519 31,547 – 31,547
Financial expenses (67,786) – – (681) – – – (68,467) – (68,467)
Dividends income 5 – – – – – – 5 – 5
Other income 49,375 5 1,257 (1,040) – – – 49,597 – 49,597
Income tax expense (benefit) (8,041) – 10,398 3,354 (820) 542 711 6,144 – 6,144
Net profit P=44,276 P=5,676 (P=26,318) (P=8,356) P=1,386 (P=317) (P=1,316) P=15,031 (P=11,042) P=3,989
Net profit attributable to:
Equity holders of Parent
Company P=3,556
Noncontrolling interest 433
P=3,989
Other information
Segment assets P=5,116,263 P=17,122 P=747,492 P=100,865 P=259,464 P=21,402 P=744,314 P=7,006,922 (P=1,872,082) P=5,134,840
Deferred tax assets 16,995 – 19,118 6,551 11,577 627 947 55,815 – 55,815
Total assets 5,133,258 17,122 766,610 107,416 271,041 22,029 745,261 7,062,737 (1,872,082) 5,190,655
Segment liabilities 2,119,394 11,016 396,756 59,411 259,194 177 739,287 3,585,235 (1,263,869) 2,321,366
Deferred tax liabilities 84,967 – – – – – – 84,967 – 84,967
Total liabilities 2,204,361 11,016 396,756 59,411 259,194 177 739,287 3,670,202 (1,263,869) 2,406,333
Segment additions to property
and equipment and
investment properties 12,380 1,706 92,272 29,352 – 2,147 – 137,857 – 137,857
Depreciation and amortization (14,449) (170) (7,329) (2,245) (3,288) (88) (3) (27,572) – (27,572)
Impairment loss (P=1,529) P=– P=– P=– P=– P=– P=– (P=1,529) P=– (P=1,529)
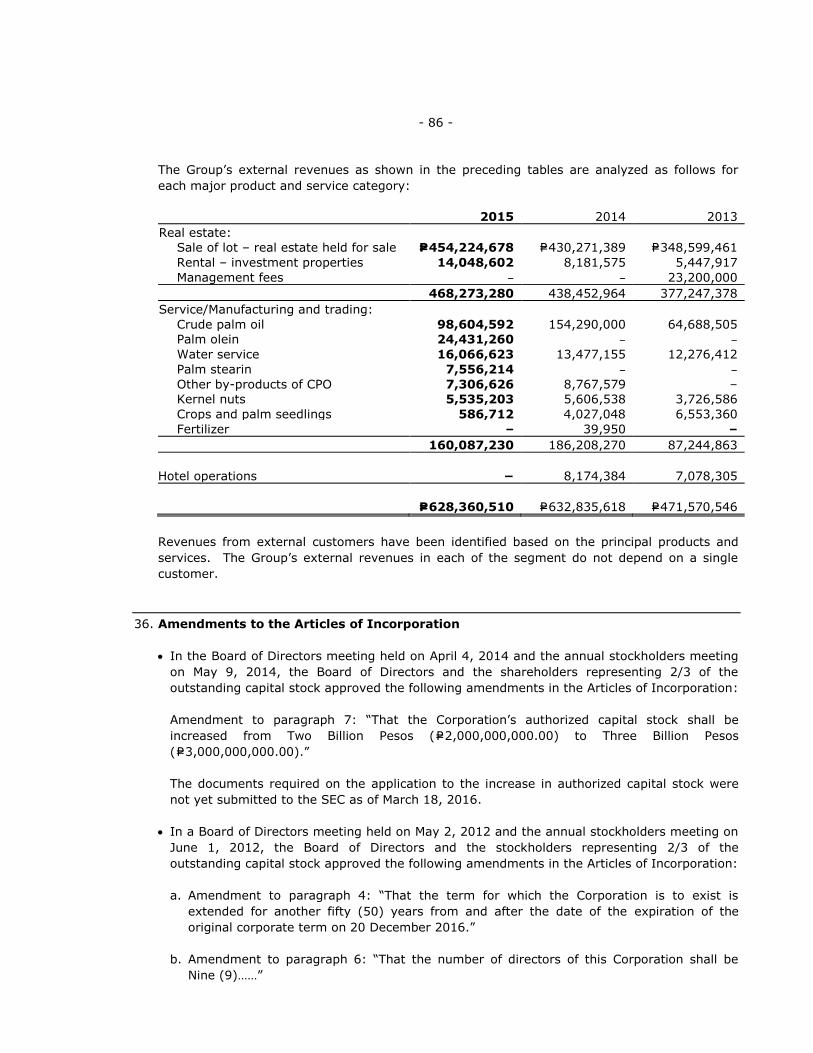
- 86 -
The Group’s external revenues as shown in the preceding tables are analyzed as follows for
each major product and service category:
2015 2014 2013
Real estate:
Sale of lot – real estate held for sale P=454,224,678 P=430,271,389 P=348,599,461
Rental – investment properties 14,048,602 8,181,575 5,447,917
Management fees – – 23,200,000
468,273,280 438,452,964 377,247,378
Service/Manufacturing and trading:
Crude palm oil 98,604,592 154,290,000 64,688,505
Palm olein 24,431,260 – –
Water service 16,066,623 13,477,155 12,276,412
Palm stearin 7,556,214 – –
Other by-products of CPO 7,306,626 8,767,579 –
Kernel nuts 5,535,203 5,606,538 3,726,586
Crops and palm seedlings 586,712 4,027,048 6,553,360
Fertilizer – 39,950 –
160,087,230 186,208,270 87,244,863
Hotel operations − 8,174,384 7,078,305
P=628,360,510 P=632,835,618 P=471,570,546
Revenues from external customers have been identified based on the principal products and
services. The Group’s external revenues in each of the segment do not depend on a single
customer.
36. Amendments to the Articles of Incorporation
In the Board of Directors meeting held on April 4, 2014 and the annual stockholders meeting
on May 9, 2014, the Board of Directors and the shareholders representing 2/3 of the
outstanding capital stock approved the following amendments in the Articles of Incorporation:
Amendment to paragraph 7: “That the Corporation’s authorized capital stock shall be
increased from Two Billion Pesos (P=2,000,000,000.00) to Three Billion Pesos
(P=3,000,000,000.00).”
The documents required on the application to the increase in authorized capital stock were
not yet submitted to the SEC as of March 18, 2016.
In a Board of Directors meeting held on May 2, 2012 and the annual stockholders meeting on
June 1, 2012, the Board of Directors and the stockholders representing 2/3 of the
outstanding capital stock approved the following amendments in the Articles of Incorporation:
a. Amendment to paragraph 4: “That the term for which the Corporation is to exist is
extended for another fifty (50) years from and after the date of the expiration of the
original corporate term on 20 December 2016.”
b. Amendment to paragraph 6: “That the number of directors of this Corporation shall be
Nine (9)……”
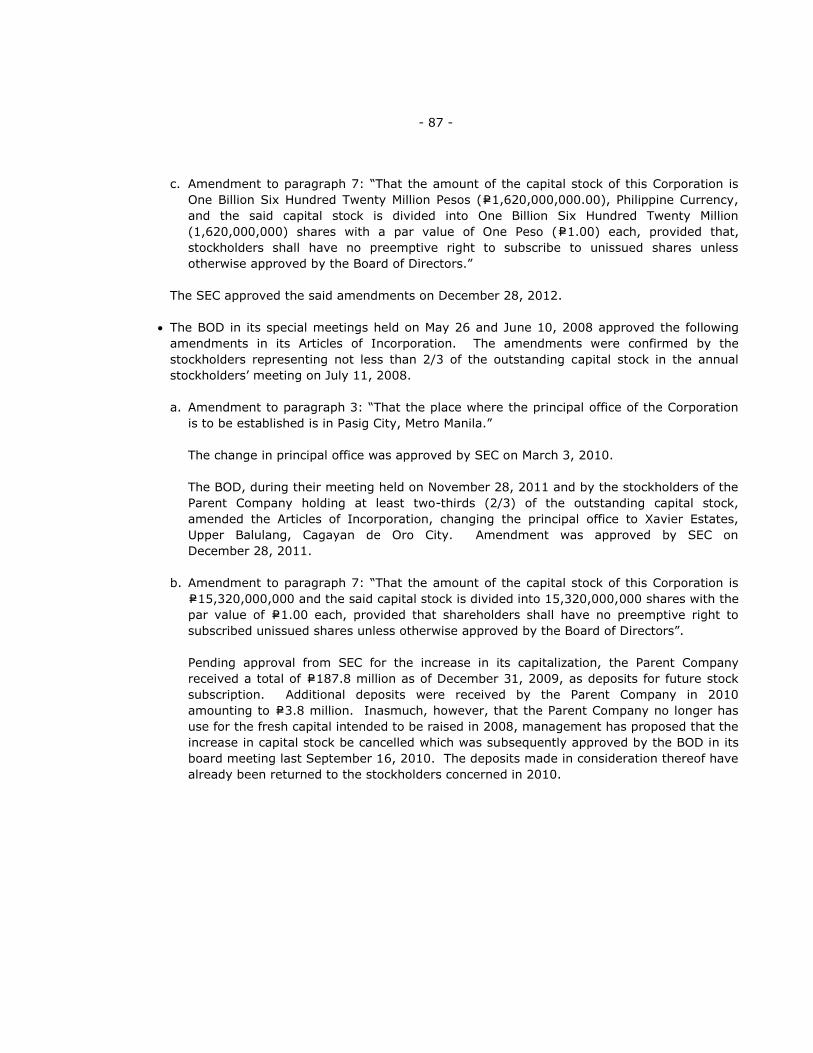
- 87 -
c. Amendment to paragraph 7: “That the amount of the capital stock of this Corporation is
One Billion Six Hundred Twenty Million Pesos (P=1,620,000,000.00), Philippine Currency,
and the said capital stock is divided into One Billion Six Hundred Twenty Million
(1,620,000,000) shares with a par value of One Peso (P=1.00) each, provided that,
stockholders shall have no preemptive right to subscribe to unissued shares unless
otherwise approved by the Board of Directors.”
The SEC approved the said amendments on December 28, 2012.
The BOD in its special meetings held on May 26 and June 10, 2008 approved the following
amendments in its Articles of Incorporation. The amendments were confirmed by the
stockholders representing not less than 2/3 of the outstanding capital stock in the annual
stockholders’ meeting on July 11, 2008.
a. Amendment to paragraph 3: “That the place where the principal office of the Corporation
is to be established is in Pasig City, Metro Manila.”
The change in principal office was approved by SEC on March 3, 2010.
The BOD, during their meeting held on November 28, 2011 and by the stockholders of the
Parent Company holding at least two-thirds (2/3) of the outstanding capital stock,
amended the Articles of Incorporation, changing the principal office to Xavier Estates,
Upper Balulang, Cagayan de Oro City. Amendment was approved by SEC on
December 28, 2011.
b. Amendment to paragraph 7: “That the amount of the capital stock of this Corporation is
P=15,320,000,000 and the said capital stock is divided into 15,320,000,000 shares with the
par value of P=1.00 each, provided that shareholders shall have no preemptive right to
subscribed unissued shares unless otherwise approved by the Board of Directors”.
Pending approval from SEC for the increase in its capitalization, the Parent Company
received a total of P=187.8 million as of December 31, 2009, as deposits for future stock
subscription. Additional deposits were received by the Parent Company in 2010
amounting to P=3.8 million. Inasmuch, however, that the Parent Company no longer has
use for the fresh capital intended to be raised in 2008, management has proposed that the
increase in capital stock be cancelled which was subsequently approved by the BOD in its
board meeting last September 16, 2010. The deposits made in consideration thereof have
already been returned to the stockholders concerned in 2010.
- 88 -
Moreover, the BOD on its meeting on March 26, 2007 and May 30, 2007, approved the
following:
Amendment to paragraph 5 of the secondary purpose of the Articles of Incorporation, to
read as follows:
“To engage in the power business, including but not limited to power generation, power
trading and power supply, and for this purpose, to bid for or acquire power generation and
power related assets, facilities, concessions and contracts, and to enter into other
transactions or agreements relating to power, by itself or through joint ventures or
partnerships, directly or through its subsidiaries or affiliates and to purchase, hold use,
sell, transfer, mortgage, exchange, or dispose of real and personal properties of every
kind and description, including all commercial papers and securities or obligations of
domestic/foreign corporation or associations without being a stockholder or dealer and to
pay or exchange therefore, stocks, bonds or other evidences of indebtedness or securities
for this or any other corporation and to exercise any and all rights and obligations as
owner or holder thereof, provided it shall not function as a trust corporation”.
The foregoing amendments were confirmed by the stockholders representing not less than
2/3 of the outstanding capital stock in the annual stockholders’ meeting on June 1, 2007.
On May 2, 2012, the BOD approved the cancellation of this amendment.
37. Other Matter
Impasug-Ong and Kalabugao Plantations
ABERDI entered into a Development Contract (DC) with Kapunungan Sa Mga Mag-uuma sa
Kaanibungan (KASAMAKA) at the Municipality of Impasug-ong, Bukidnon concerning the
development of Oil Palm Commercial Plantation.
KASAMAKA had been granted with Community Based Forest Management Agreement (CBFMA)
no. 55093, by the Department of Environment and National Resources (DENR) on
December 22, 2000 covering an area of 2,510.80 hectares. Under the CBFMA, KASAMAKA is
mandated to develop, manage and protect the allocated community forest project area.
Moreover, it is allowed to enter into agreements or contracts with private or government
entities for the development of the whole or portion of the CBFMA area.
The project’s objectives are to establish approximately 894 hectares into a commercial palm
plantation within 5 years (2006-2011). However, ABERDI may intercrop suitable agricultural
crops in the plantation and raise livestock, the harvest and produce of which shall belong to
ABERDI.
The responsibilities of KASAMAKA with regards to the project follow:
To provide the land area of 894 hectares within CBFMA area for oil palm plantation.
To provide manpower needs of the Group in all developmental activities such as land
preparation, planting, weeding, fertilization, harvesting, maintenance and others.
- 89 -
On the other hand, the responsibility of ABERDI in regard to the project is to provide technical
and financial resources to develop the 894 hectares into palm oil plantation for a period of 20
years up to 2026.
Relative to the agreement, the Group paid for leasehold rights on the land that are applicable
up to year 2026 (see Note 17).
Opol Plantation
NC entered into a Development Contract for the establishment of Palm Oil Plantation in
Tingalan, Opol, Misamis Oriental with Kahugpongan sa mga Mag-Uuma sa Barangay Tingalan
(KMBT).
KMBT has been granted CBFMA No. 56297 by DENR on December 31, 2000 covering a total
area of 1,000 hectares of forest lands located in Tingalan, Opol, Misamis Oriental to develop,
manage and protect the allocated Community Forest Project Area.
The roles and responsibilities of KMBT under the Development Contract are as follows:
To provide the land area within the CBFMA for oil plantation
To provide manpower needs of NC in all developmental activities such as land preparation,
planting, weeding, fertilization, harvesting, maintenance and others.
On the other hand, the responsibility of NC in regard to the project is to provide technical and
financial resources to develop the covered area into palm oil plantation for a period of 25 years.
38. Litigation
Yulo Case
On December 15, 2008, the First Division of the Supreme Court issued a resolution, denying
with finality the motion for reconsideration filed by the Parent Company on October 15, 2008
concerning the case involving a claim for sum of money, specific performance and damage by a
certain individual in November 2001. As a result, the Parent Company recognized an estimated
litigation loss of P=34.4 million, inclusive of 12% legal interest computed from default until
judgment is fully satisfied based on the Court of Appeals amended decision on July 23, 2008
and claimant.
On July 15, 2009, pursuant to the assailed Order of the trial court dated June 25, 2009, the
Parent Company paid the claimant the amount of P=22.4 million. The said payment was made
with the intention of putting closure to the case. The difference between the amount of
litigation liability and the amount of settlement has been recorded by the Parent Company as
withholding tax on compensation pursuant to the BIR ruling that the nature of the claim is
compensation income. In May 2010, the amount recorded by the Parent Company as
withholding tax on compensation was released to the Court of Appeals until the decision is final.
The presiding judge who handled the case was eventually replaced.
In an Order dated April 15, 2010, the new presiding judge, reversed the order of the former
presiding judge, declaring that the judgment award is not subject to income tax and, at the
same time, eliminating the threshold date of 15 July 2009 set by the former presiding judge in
the computation of the total amount payable to the claimant.
- 90 -
The new presiding judge ruled that the Parent Company was “still obligated to pay the amount
of P=14, 075,521.24 as of April 15, 2010, subject to daily interest at the rate of P=4,305.73 until
judgment is fully satisfied.”
The Parent Company moved for reconsideration of the said order but, to no avail. The matter is
elevated to the Court of Appeals and, thereafter, the Supreme Court.
In due course, the Court of Appeals and the Supreme Court confirmed that the award in favor
of Yulo is subject to 32% tax.
Plaintiff filed a motion for execution with the RTC seeking additional interest. The court granted
the said motion. On January 12, 2016, the Parent Company filed a Motion for Reconsideration
(MR) which was denied outright by the judge.
On February 5, 2016, the Parent Company filed a petition for certiorari with prayer for
temporary restraining order with Court of Appeals.
However, on March 10, 2016 through a Compromise Agreement, the Company settled the
additional interest. The Plaintiff's counsel executed a notice of satisfaction of judgment to
confirm the full and final satisfaction of the award on the same day.
Lustre Case
The Parent Company filed with the trial court a case for rescission with damages against
defendants Home Industries Development Corporation (“HIDC”) and/or Mr. Antonio Lustre. The
instant case was brought about by the defendants’ non-delivery of lots subject of a contract to
sell. The amount involved in the instant case is Six Million Four Hundred Sixty-Four Thousand
Four Hundred Twenty-Five Pesos (P=6,464,425.00) [(cash actually paid by the Parent Company)
P=794,425.00 + (present value of shares of stock) P=5,400,000.00 + (difference between value
of the shares of stock at the date of the execution of the Contract to Sell and the present value
of the shares of stock) P=270,000.00]. The trial court ruled in favor of the Parent Company.
The Parent Company learned that the shares of stock forming part of the trial court’s judgment
award had been disposed and were no longer in the name of Defendants Home Industries
Development Corporation (“HIDC”) and/or Mr. Antonio Lustre. As such, the Parent Company
filed an Omnibus Motion dated 18 April 2011 praying, among others, that Defendant HIDC pay
the value of the shares of stock, in lieu of the actual return of the same, which regrettably was
denied by the trial court.
Considering the trial court’s denial of the above-mentioned Omnibus Motion, the Parent
Company filed with the Court of Appeals a Motion for Amendment and/or Clarification of
Judgment Based on Supervening Events (“Motion”) dated 22 February 2012. This Motion was
subsequently denied in a Resolution dated 27 December 2012. Consequently, the Parent
Company filed a Motion for Reconsideration (Of the Resolution dated 27 December 2012).
- 91 -
On December 9, 2014, the Decision was executed through public sale wherein ABCI was
declared the highest bidder at the bid price of Three Million Nine Hundred Ninety-Four
Thousand Eight Hundred Thirty –Five Pesos & 31/100 (P=3,994,835.31). The Certificate of Sale
in favor of ABCI has already been registered with the Register of Deeds on January 12, 2015
and is duly annotated on the corresponding Transfer Certificated of Title involved. HIDC has
one (1) year from January 12, 2015 within which to redeem the property. However, the
redemption period lapsed without HIDC redeeming the properties. In view thereof, the Parent
Company is processing the payment of taxes due on the properties and the transfer of the
titles in the Parent Company’s name.
39. Treasury Shares
On June 1, 2010, the Parent Company acquired 300,000,000 treasury shares held by Baysfield
Investments Limited (BIL) at the purchase price of P=335,212,810, or about P=1.12 per share.
On October 12, 2010, the Parent Company sold 63,865,705 common shares held in treasury at
P=3.01 per share resulting to additional paid-in capital amounting to P=120,873,766.
As discussed in Note 1, the Parent Company’s Board of Directors (BOD) approved, during their
meeting on October 5, 2012, the private placement of 250.0 million of its listed common shares
consisting of 173.6 million treasury common shares and 76.4 million common shares owned by
a shareholder. The Placement Shares, with a par value of P=1 per share was sold at a price of
P=2.89 per share and crossed in the Exchange on October 8, 2012.
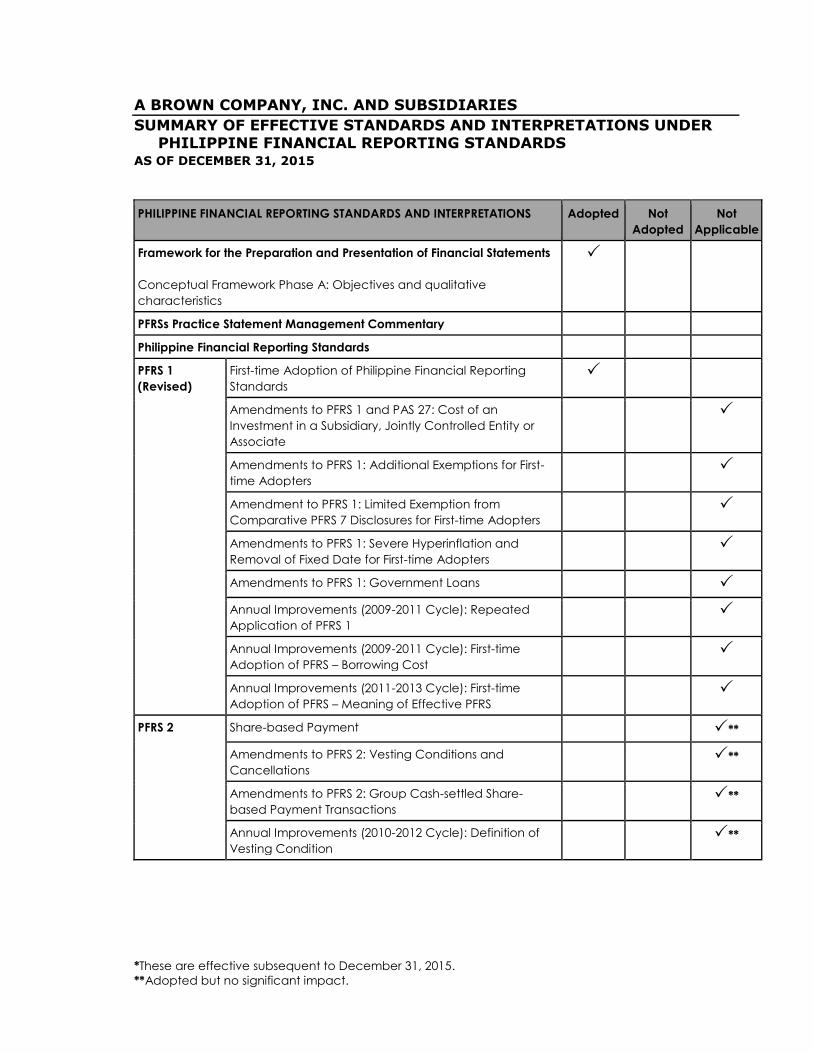
*These are effective subsequent to December 31, 2015.
**Adopted but no significant impact.
A BROWN COMPANY, INC. AND SUBSIDIARIES
SUMMARY OF EFFECTIVE STANDARDS AND INTERPRETATIONS UNDER PHILIPPINE FINANCIAL REPORTING STANDARDS
AS OF DECEMBER 31, 2015
PHILIPPINE FINANCIAL REPORTING STANDARDS AND INTERPRETATIONS
Adopted Not
Adopted
Not
Applicable
Framework for the Preparation and Presentation of Financial Statements
Conceptual Framework Phase A: Objectives and qualitative
characteristics
PFRSs Practice Statement Management Commentary
Philippine Financial Reporting Standards
PFRS 1
(Revised)
First-time Adoption of Philippine Financial Reporting
Standards
Amendments to PFRS 1 and PAS 27: Cost of an
Investment in a Subsidiary, Jointly Controlled Entity or
Associate
Amendments to PFRS 1: Additional Exemptions for First-
time Adopters
Amendment to PFRS 1: Limited Exemption from
Comparative PFRS 7 Disclosures for First-time Adopters
Amendments to PFRS 1: Severe Hyperinflation and
Removal of Fixed Date for First-time Adopters
Amendments to PFRS 1: Government Loans
Annual Improvements (2009-2011 Cycle): Repeated
Application of PFRS 1
Annual Improvements (2009-2011 Cycle): First-time
Adoption of PFRS – Borrowing Cost
Annual Improvements (2011-2013 Cycle): First-time
Adoption of PFRS – Meaning of Effective PFRS
PFRS 2 Share-based Payment **
Amendments to PFRS 2: Vesting Conditions and
Cancellations **
Amendments to PFRS 2: Group Cash-settled Share-
based Payment Transactions **
Annual Improvements (2010-2012 Cycle): Definition of
Vesting Condition **
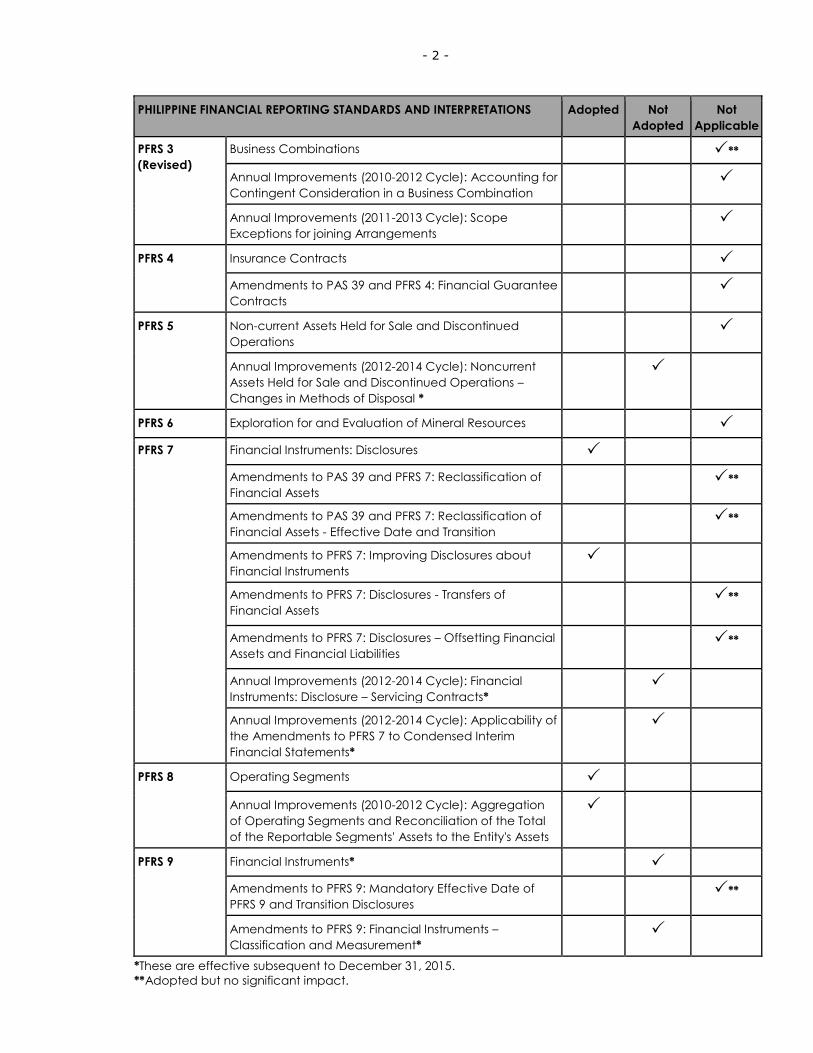
- 2 -
*These are effective subsequent to December 31, 2015.
**Adopted but no significant impact.
PHILIPPINE FINANCIAL REPORTING STANDARDS AND INTERPRETATIONS
Adopted Not
Adopted
Not
Applicable
PFRS 3
(Revised)
Business Combinations **
Annual Improvements (2010-2012 Cycle): Accounting for
Contingent Consideration in a Business Combination
Annual Improvements (2011-2013 Cycle): Scope
Exceptions for joining Arrangements
PFRS 4 Insurance Contracts
Amendments to PAS 39 and PFRS 4: Financial Guarantee
Contracts
PFRS 5 Non-current Assets Held for Sale and Discontinued
Operations
Annual Improvements (2012-2014 Cycle): Noncurrent
Assets Held for Sale and Discontinued Operations –
Changes in Methods of Disposal *
PFRS 6 Exploration for and Evaluation of Mineral Resources
PFRS 7 Financial Instruments: Disclosures
Amendments to PAS 39 and PFRS 7: Reclassification of
Financial Assets **
Amendments to PAS 39 and PFRS 7: Reclassification of
Financial Assets - Effective Date and Transition **
Amendments to PFRS 7: Improving Disclosures about
Financial Instruments
Amendments to PFRS 7: Disclosures - Transfers of
Financial Assets **
Amendments to PFRS 7: Disclosures – Offsetting Financial
Assets and Financial Liabilities **
Annual Improvements (2012-2014 Cycle): Financial
Instruments: Disclosure – Servicing Contracts*
Annual Improvements (2012-2014 Cycle): Applicability of
the Amendments to PFRS 7 to Condensed Interim
Financial Statements*
PFRS 8 Operating Segments
Annual Improvements (2010-2012 Cycle): Aggregation
of Operating Segments and Reconciliation of the Total
of the Reportable Segments' Assets to the Entity's Assets
PFRS 9 Financial Instruments*
Amendments to PFRS 9: Mandatory Effective Date of
PFRS 9 and Transition Disclosures **
Amendments to PFRS 9: Financial Instruments –
Classification and Measurement*
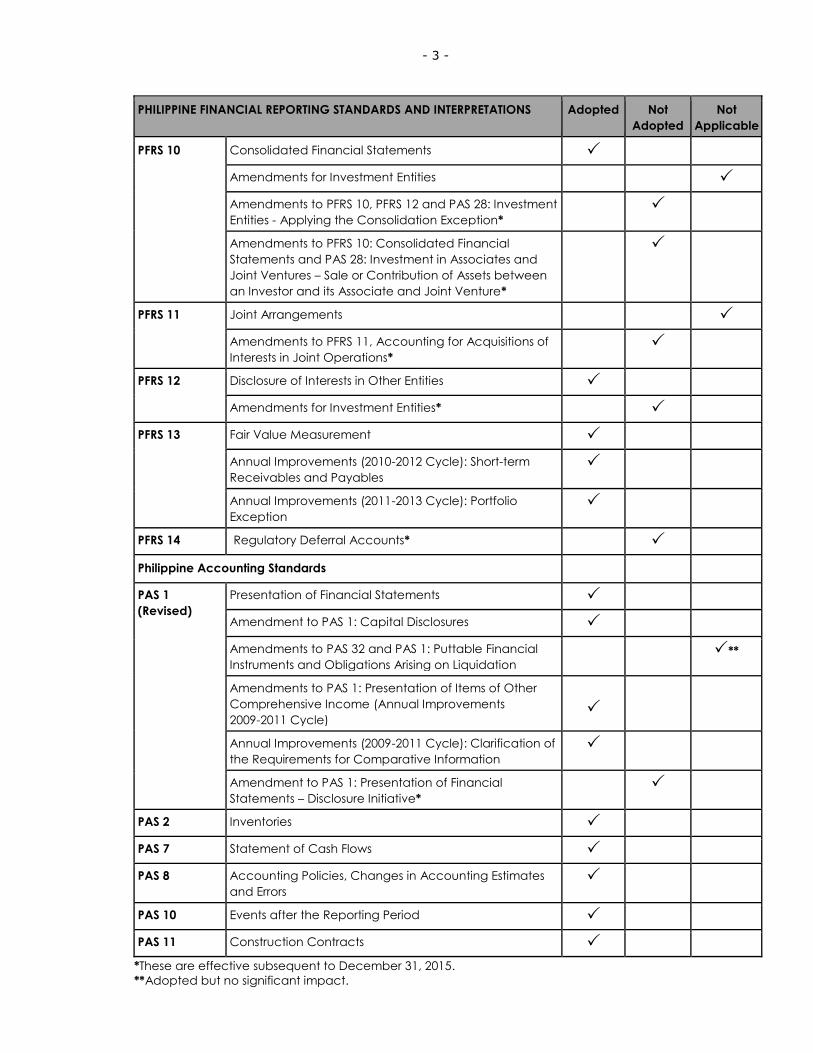
- 3 -
*These are effective subsequent to December 31, 2015.
**Adopted but no significant impact.
PHILIPPINE FINANCIAL REPORTING STANDARDS AND INTERPRETATIONS
Adopted Not
Adopted
Not
Applicable
PFRS 10 Consolidated Financial Statements
Amendments for Investment Entities
Amendments to PFRS 10, PFRS 12 and PAS 28: Investment
Entities - Applying the Consolidation Exception*
Amendments to PFRS 10: Consolidated Financial
Statements and PAS 28: Investment in Associates and
Joint Ventures – Sale or Contribution of Assets between
an Investor and its Associate and Joint Venture*
PFRS 11 Joint Arrangements
Amendments to PFRS 11, Accounting for Acquisitions of
Interests in Joint Operations*
PFRS 12 Disclosure of Interests in Other Entities
Amendments for Investment Entities*
PFRS 13 Fair Value Measurement
Annual Improvements (2010-2012 Cycle): Short-term
Receivables and Payables
Annual Improvements (2011-2013 Cycle): Portfolio
Exception
PFRS 14 Regulatory Deferral Accounts*
Philippine Accounting Standards
PAS 1
(Revised)
Presentation of Financial Statements
Amendment to PAS 1: Capital Disclosures
Amendments to PAS 32 and PAS 1: Puttable Financial
Instruments and Obligations Arising on Liquidation **
Amendments to PAS 1: Presentation of Items of Other
Comprehensive Income (Annual Improvements
2009-2011 Cycle)
Annual Improvements (2009-2011 Cycle): Clarification of
the Requirements for Comparative Information
Amendment to PAS 1: Presentation of Financial
Statements – Disclosure Initiative*
PAS 2 Inventories
PAS 7 Statement of Cash Flows
PAS 8 Accounting Policies, Changes in Accounting Estimates
and Errors
PAS 10 Events after the Reporting Period
PAS 11 Construction Contracts

- 4 -
*These are effective subsequent to December 31, 2015.
**Adopted but no significant impact.
PHILIPPINE FINANCIAL REPORTING STANDARDS AND INTERPRETATIONS
Adopted Not
Adopted
Not
Applicable
PAS 12 Income Taxes
Amendment to PAS 12 - Deferred Tax: Recovery of
Underlying Assets **
PAS 16
Property, Plant and Equipment
Annual Improvements (2009-2011 Cycle): Classification
of Servicing Equipment **
Annual Improvements (2010-2012 Cycle): Revaluation
Method – Proportionate Restatement of Accumulated
Depreciation
**
Amendment to PAS 16: Property, Plant and Equipment
and PAS 38: Intangible Assets – Classification of
Acceptable Methods of Depreciation and Amortization*
Amendment to PAS 16: Property, Plant and Equipment
and PAS 41: Agriculture – Bearer Plants*
PAS 17 Leases
PAS 18 Revenue
PAS 19 Employee Benefits
Amendments to PAS 19: Actuarial Gains and Losses,
Group Plans and Disclosures
PAS 19
(Amended)
Employee Benefits
Amendments to PAS 19 – Defined Benefit Plans:
Employee Contributions **
Annual Improvements (2012-2014 Cycle): Employee
Benefits – Regional Market Issue Regarding Discount
Rate*
PAS 20 Accounting for Government Grants and Disclosure of
Government Assistance
PAS 21 The Effects of Changes in Foreign Exchange Rates
Amendment: Net Investment in a Foreign Operation
PAS 23
(Revised)
Borrowing Costs
PAS 24
(Revised)
Related Party Disclosures
Annual Improvements (2010-2012 Cycle): Key
Management Personnel
PAS 26 Accounting and Reporting by Retirement Benefit Plans
PAS 27 Consolidated and Separate Financial Statements
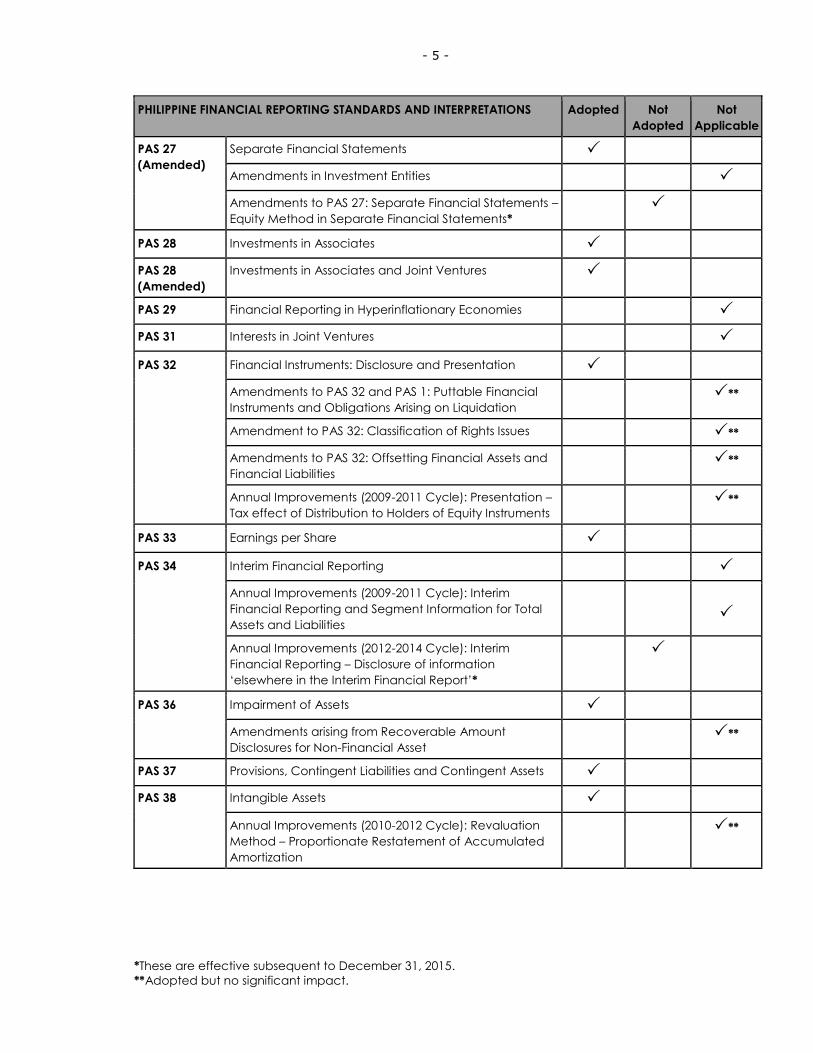
- 5 -
*These are effective subsequent to December 31, 2015.
**Adopted but no significant impact.
PHILIPPINE FINANCIAL REPORTING STANDARDS AND INTERPRETATIONS
Adopted Not
Adopted
Not
Applicable
PAS 27
(Amended)
Separate Financial Statements
Amendments in Investment Entities
Amendments to PAS 27: Separate Financial Statements –
Equity Method in Separate Financial Statements*
PAS 28 Investments in Associates
PAS 28
(Amended)
Investments in Associates and Joint Ventures
PAS 29 Financial Reporting in Hyperinflationary Economies
PAS 31 Interests in Joint Ventures
PAS 32 Financial Instruments: Disclosure and Presentation
Amendments to PAS 32 and PAS 1: Puttable Financial
Instruments and Obligations Arising on Liquidation **
Amendment to PAS 32: Classification of Rights Issues **
Amendments to PAS 32: Offsetting Financial Assets and
Financial Liabilities **
Annual Improvements (2009-2011 Cycle): Presentation –
Tax effect of Distribution to Holders of Equity Instruments **
PAS 33 Earnings per Share
PAS 34 Interim Financial Reporting
Annual Improvements (2009-2011 Cycle): Interim
Financial Reporting and Segment Information for Total
Assets and Liabilities
Annual Improvements (2012-2014 Cycle): Interim
Financial Reporting – Disclosure of information
‘elsewhere in the Interim Financial Report’*
PAS 36 Impairment of Assets
Amendments arising from Recoverable Amount
Disclosures for Non-Financial Asset **
PAS 37 Provisions, Contingent Liabilities and Contingent Assets
PAS 38 Intangible Assets
Annual Improvements (2010-2012 Cycle): Revaluation
Method – Proportionate Restatement of Accumulated
Amortization
**

- 6 -
*These are effective subsequent to December 31, 2015.
**Adopted but no significant impact.
PHILIPPINE FINANCIAL REPORTING STANDARDS AND INTERPRETATIONS
Adopted Not
Adopted
Not
Applicable
PAS 39 Financial Instruments: Recognition and Measurement
Amendments to PAS 39: Transition and Initial Recognition
of Financial Assets and Financial Liabilities **
Amendments to PAS 39: Cash Flow Hedge Accounting
of Forecast Intragroup Transactions **
Amendments to PAS 39: The Fair Value Option **
Amendments to PAS 39 and PFRS 4: Financial Guarantee
Contracts **
Amendments to PAS 39 and PFRS 7: Reclassification of
Financial Assets **
Amendments to PAS 39 and PFRS 7: Reclassification of
Financial Assets – Effective Date and Transition **
Amendments to Philippine Interpretation IFRIC–9 and
PAS 39: Embedded Derivatives **
Amendment to PAS 39: Eligible Hedged Items **
Amendment to PAS 39: Novations of Derivatives and
Continuation of Hedge Accounting **
PAS 40 Investment Property
Amendments to PAS 40 (2011-2013): Investment Property
PAS 41 Agriculture
Philippine Interpretations
IFRIC 1 Changes in Existing Decommissioning, Restoration and
Similar Liabilities
IFRIC 2 Members' Share in Co-operative Entities and Similar
Instruments
IFRIC 4 Determining Whether an Arrangement Contains a Lease
IFRIC 5 Rights to Interests arising from Decommissioning,
Restoration and Environmental Rehabilitation Funds
IFRIC 6 Liabilities arising from Participating in a Specific Market -
Waste Electrical and Electronic Equipment
IFRIC 7 Applying the Restatement Approach under PAS 29
Financial Reporting in Hyperinflationary Economies
IFRIC 8 Scope of PFRS 2
IFRIC 9 Reassessment of Embedded Derivatives **
Amendments to Philippine Interpretation IFRIC–9 and
PAS 39: Embedded Derivatives **
IFRIC 10 Interim Financial Reporting and Impairment **

- 7 -
*These are effective subsequent to December 31, 2015.
**Adopted but no significant impact.
PHILIPPINE FINANCIAL REPORTING STANDARDS AND INTERPRETATIONS
Adopted Not
Adopted
Not
Applicable
IFRIC 11 PFRS 2- Group and Treasury Share Transactions **
IFRIC 12 Service Concession Arrangements
IFRIC 13 Customer Loyalty Programmes
IFRIC 14 The Limit on a Defined Benefit Asset, Minimum Funding
Requirements and their Interaction **
Amendments to Philippine Interpretations IFRIC- 14,
Prepayments of a Minimum Funding Requirement **
IFRIC 15 Amendments to Philippine Interpretations IFRIC- 15,
Agreements for Construction of Real Estate*
IFRIC 16 Hedges of a Net Investment in a Foreign Operation
IFRIC 17 Distributions of Non-cash Assets to Owners **
IFRIC 18 Transfers of Assets from Customers **
IFRIC 19 Extinguishing Financial Liabilities with Equity Instruments **
IFRIC 20 Stripping Costs in the Production Phase of a Surface
Mine
IFRIC 21 Levies **
SIC-7 Introduction of the Euro
SIC-10 Government Assistance - No Specific Relation to
Operating Activities
SIC-12 Consolidation - Special Purpose Entities
Amendment to SIC - 12: Scope of SIC 12
SIC-13 Jointly Controlled Entities - Non-Monetary Contributions
by Venturers
SIC-15 Operating Leases - Incentives **
SIC-25 Income Taxes - Changes in the Tax Status of an Entity or
its Shareholders **
SIC-27 Evaluating the Substance of Transactions Involving the
Legal Form of a Lease **
SIC-29 Service Concession Arrangements: Disclosures
SIC-31 Revenue - Barter Transactions Involving Advertising
Services
SIC-32 Intangible Assets - Web Site Costs **
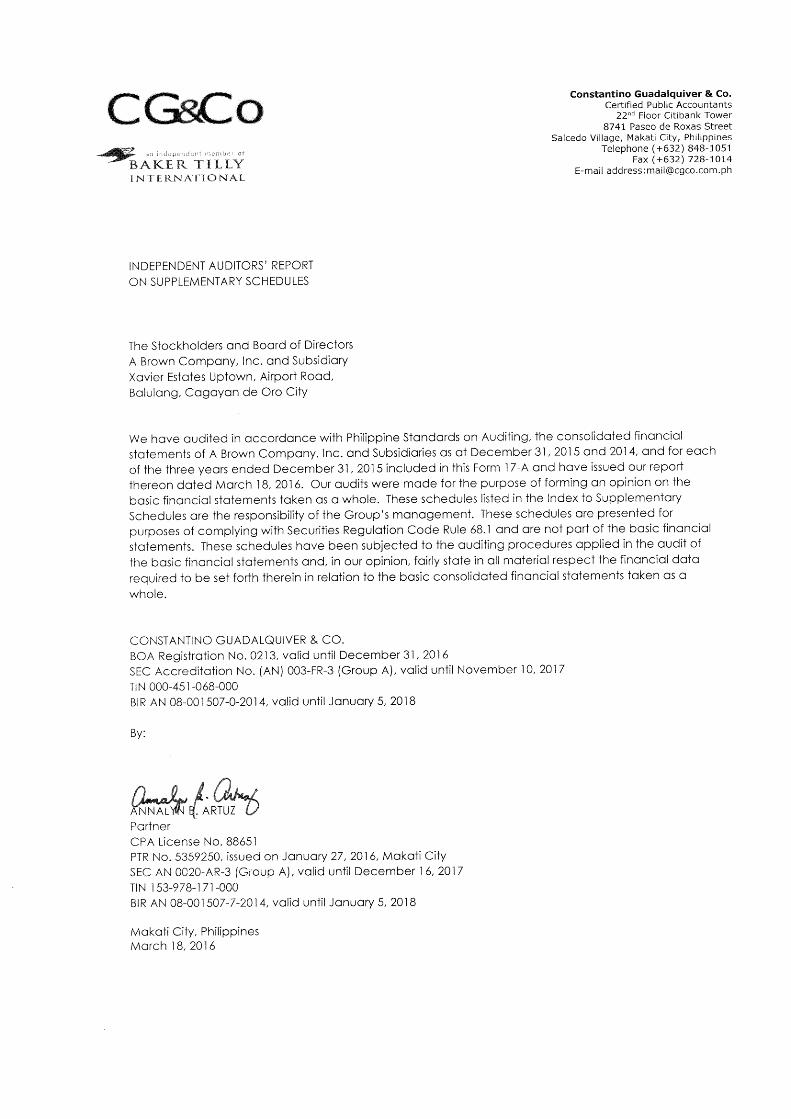
TABLE OF CONTENTS
PageTitle
9
6
7
8
4
5
1
Not Applicable
3
2
Financial Soundness Indicators
Top 20 Stockholders of Record
Retained Earnings Available for Dividend Declaration
Group Chart 11
Not Applicable
Indebtedness to Related Parties
Guarantees of Securities of Other Issuers
Capital Stock
Schedule
A
Intangible Assets - Other Assets
Long-term Debt
D
E
Amounts Receivable from Related Parties which are Eliminated during
F
B
C
G
H
the Consolidation of Financial Statements
A BROWN COMPANY, INC. AND SUBSIDIARIESSUPPLEMENTARY SCHEDULES REQUIRED BY THE SECURITIES AND EXCHANGE COMMISSION
DECEMBER 31, 2015
Financial Assets (Loans and Receivables, Fair Value Through Profit or Loss
Held-to-Maturity Investments and Available-for-Sale Securities)
Amounts Receivable from Directors, Officers Employees, Related Parties and
Principal Stockholders (Other than Related Parties)
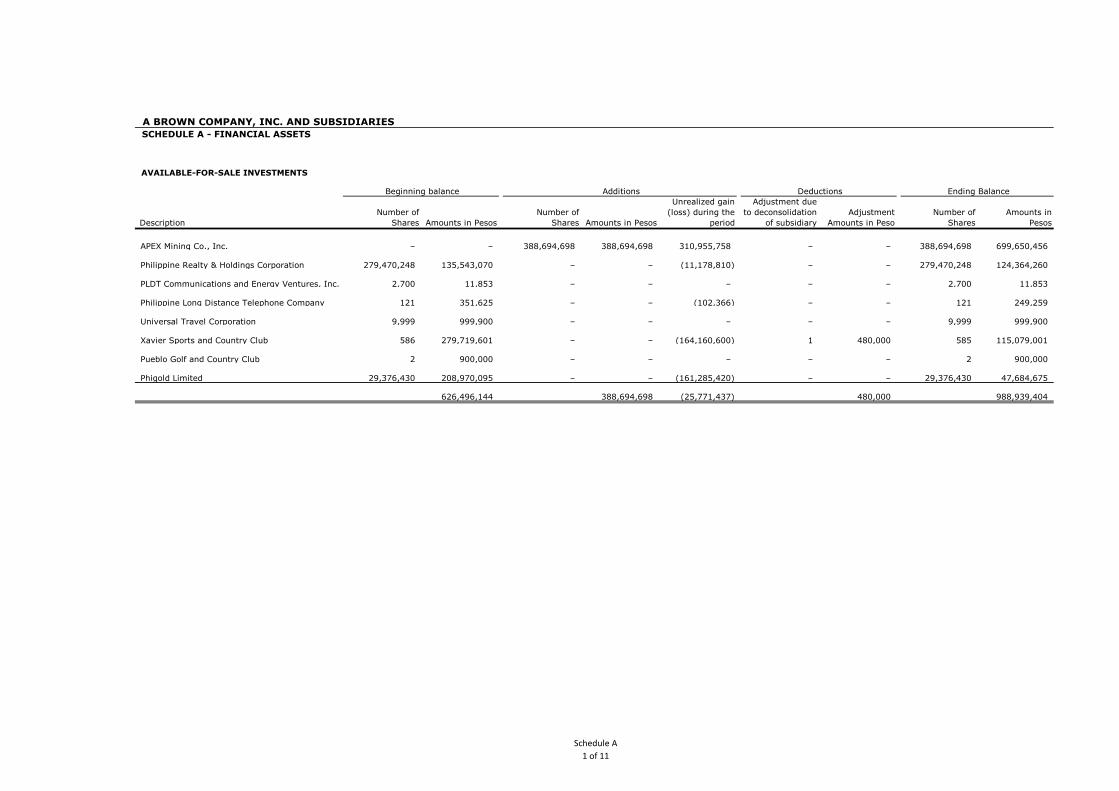
A BROWN COMPANY, INC. AND SUBSIDIARIES
SCHEDULE A - FINANCIAL ASSETS
AVAILABLE-FOR-SALE INVESTMENTS
Description
Number of
Shares Amounts in Pesos
Number of
Shares Amounts in Pesos
Unrealized gain
(loss) during the
period
Adjustment due
to deconsolidation
of subsidiary
Adjustment
Amounts in Peso
Number of
Shares
Amounts in
Pesos
APEX Mining Co., Inc. – – 388,694,698 388,694,698 310,955,758 – – 388,694,698 699,650,456
Philippine Realty & Holdings Corporation 279,470,248 135,543,070 – – (11,178,810) – – 279,470,248 124,364,260
PLDT Communications and Energy Ventures, Inc. 2,700 11,853 – – – – – 2,700 11,853
Philippine Long Distance Telephone Company 121 351,625 – – (102,366) – – 121 249,259
Universal Travel Corporation 9,999 999,900 – – – – – 9,999 999,900
Xavier Sports and Country Club 586 279,719,601 – – (164,160,600) 1 480,000 585 115,079,001
Pueblo Golf and Country Club 2 900,000 – – – – – 2 900,000
Phigold Limited 29,376,430 208,970,095 – – (161,285,420) – – 29,376,430 47,684,675
626,496,144 388,694,698 (25,771,437) 480,000 988,939,404
Beginning balance Additions Deductions Ending Balance
Schedule A
1 of 11
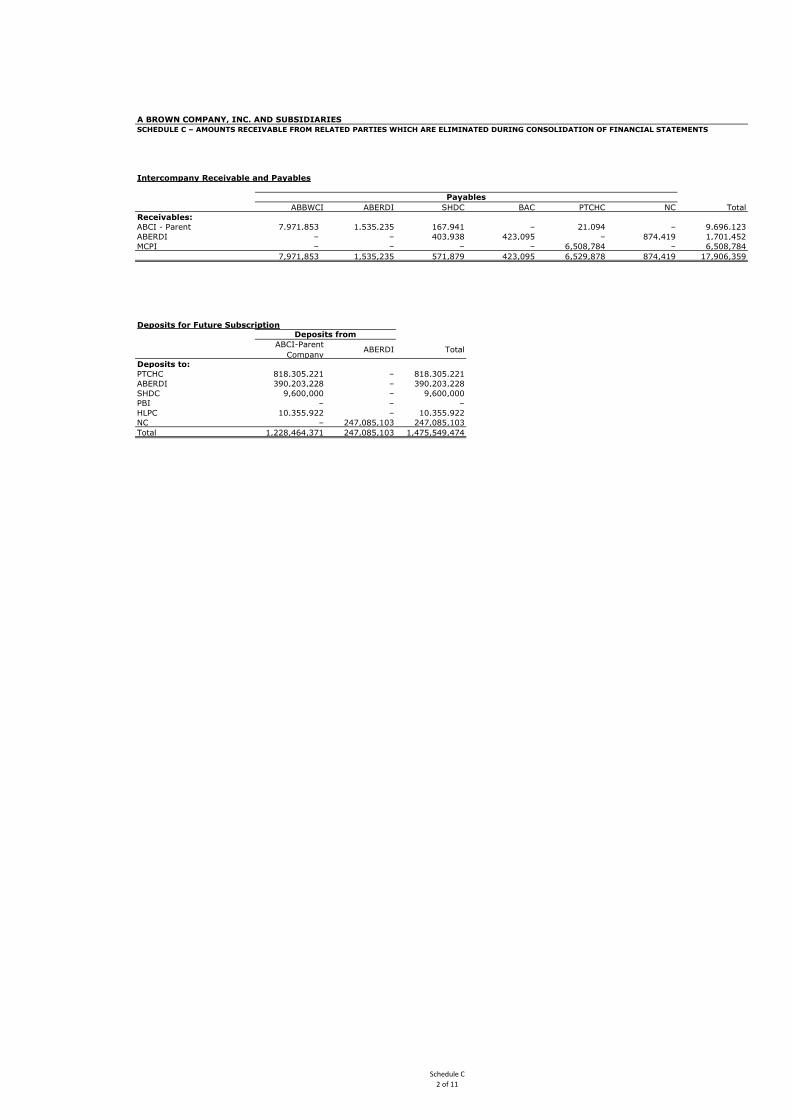
A BROWN COMPANY, INC. AND SUBSIDIARIES
SCHEDULE C – AMOUNTS RECEIVABLE FROM RELATED PARTIES WHICH ARE ELIMINATED DURING CONSOLIDATION OF FINANCIAL STATEMENTS
Intercompany Receivable and Payables
ABBWCI ABERDI SHDC BAC PTCHC NC Total
Receivables:
ABCI - Parent 7,971,853 1,535,235 167,941 – 21,094 – 9,696,123
ABERDI – – 403,938 423,095 – 874,419 1,701,452
MCPI – – – – 6,508,784 – 6,508,784
7,971,853 1,535,235 571,879 423,095 6,529,878 874,419 17,906,359
Deposits for Future Subscription
ABCI-Parent
Company ABERDI Total
Deposits to:
PTCHC 818,305,221 – 818,305,221
ABERDI 390,203,228 – 390,203,228
SHDC 9,600,000 – 9,600,000
PBI – – –
HLPC 10,355,922 – 10,355,922
NC – 247,085,103 247,085,103
Total 1,228,464,371 247,085,103 1,475,549,474
Payables
Deposits from
Schedule C
2 of 11
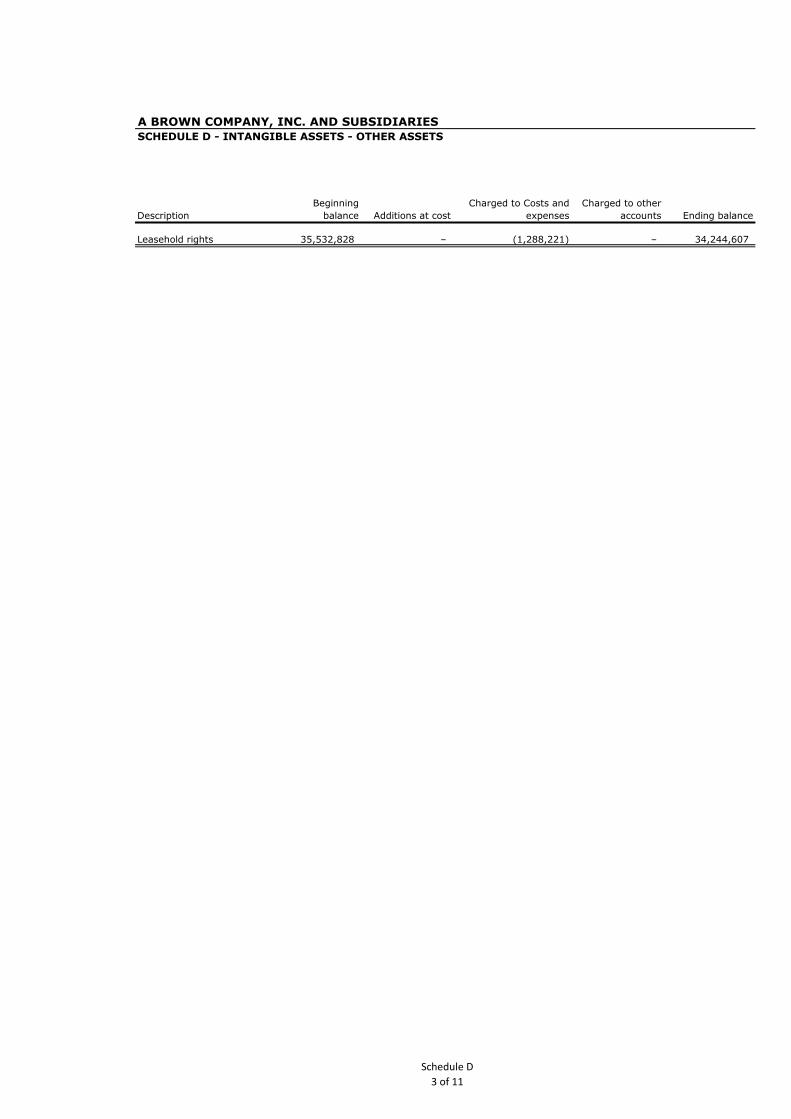
A BROWN COMPANY, INC. AND SUBSIDIARIES
SCHEDULE D - INTANGIBLE ASSETS - OTHER ASSETS
Description
Beginning
balance Additions at cost
Charged to Costs and
expenses
Charged to other
accounts Ending balance
Leasehold rights 35,532,828 – (1,288,221) – 34,244,607
Schedule D
3 of 11
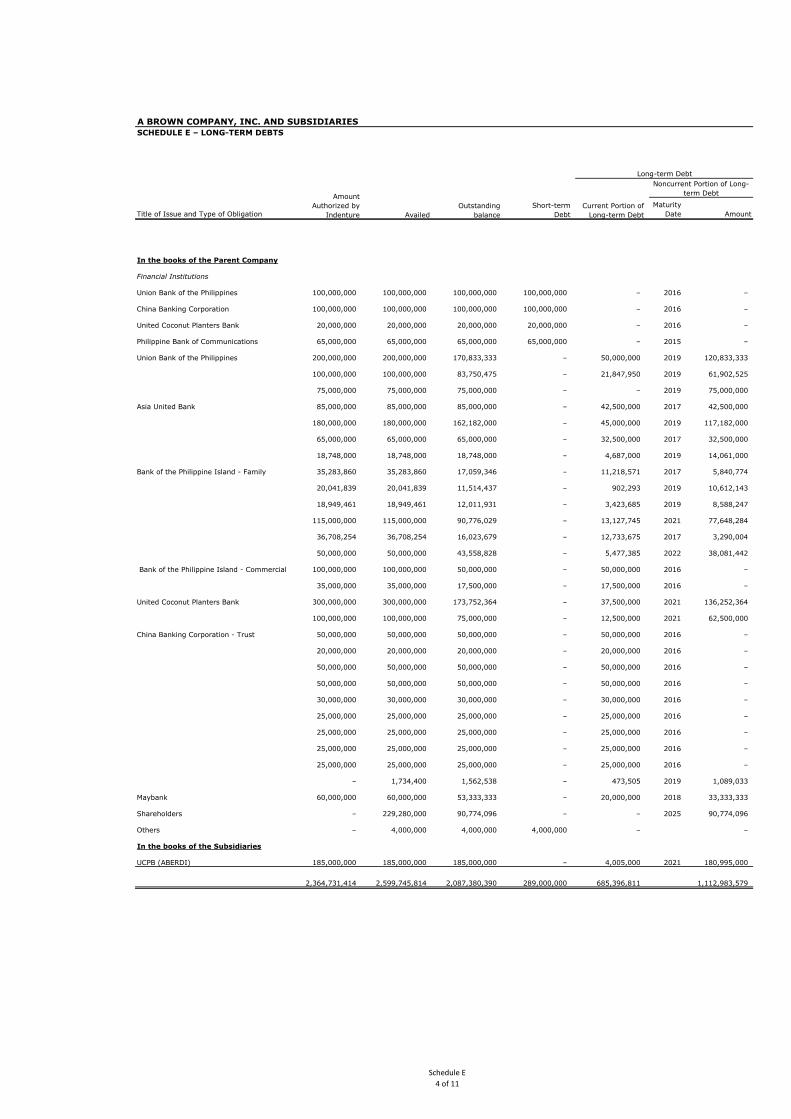
A BROWN COMPANY, INC. AND SUBSIDIARIES
SCHEDULE E – LONG-TERM DEBTS
Title of Issue and Type of Obligation
Maturity
Date Amount
In the books of the Parent Company
Financial Institutions
Union Bank of the Philippines 100,000,000 100,000,000 100,000,000 100,000,000 – 2016 –
China Banking Corporation 100,000,000 100,000,000 100,000,000 100,000,000 – 2016 –
United Coconut Planters Bank 20,000,000 20,000,000 20,000,000 20,000,000 – 2016 –
Philippine Bank of Communications 65,000,000 65,000,000 65,000,000 65,000,000 – 2015 –
Union Bank of the Philippines 200,000,000 200,000,000 170,833,333 – 50,000,000 2019 120,833,333
100,000,000 100,000,000 83,750,475 – 21,847,950 2019 61,902,525
75,000,000 75,000,000 75,000,000 – – 2019 75,000,000
Asia United Bank 85,000,000 85,000,000 85,000,000 – 42,500,000 2017 42,500,000
180,000,000 180,000,000 162,182,000 – 45,000,000 2019 117,182,000
65,000,000 65,000,000 65,000,000 – 32,500,000 2017 32,500,000
18,748,000 18,748,000 18,748,000 – 4,687,000 2019 14,061,000
Bank of the Philippine Island - Family 35,283,860 35,283,860 17,059,346 – 11,218,571 2017 5,840,774
20,041,839 20,041,839 11,514,437 – 902,293 2019 10,612,143
18,949,461 18,949,461 12,011,931 – 3,423,685 2019 8,588,247
115,000,000 115,000,000 90,776,029 – 13,127,745 2021 77,648,284
36,708,254 36,708,254 16,023,679 – 12,733,675 2017 3,290,004
50,000,000 50,000,000 43,558,828 – 5,477,385 2022 38,081,442
Bank of the Philippine Island - Commercial 100,000,000 100,000,000 50,000,000 – 50,000,000 2016 –
35,000,000 35,000,000 17,500,000 – 17,500,000 2016 –
United Coconut Planters Bank 300,000,000 300,000,000 173,752,364 – 37,500,000 2021 136,252,364
100,000,000 100,000,000 75,000,000 – 12,500,000 2021 62,500,000
China Banking Corporation - Trust 50,000,000 50,000,000 50,000,000 – 50,000,000 2016 –
20,000,000 20,000,000 20,000,000 – 20,000,000 2016 –
50,000,000 50,000,000 50,000,000 – 50,000,000 2016 –
50,000,000 50,000,000 50,000,000 – 50,000,000 2016 –
30,000,000 30,000,000 30,000,000 – 30,000,000 2016 –
25,000,000 25,000,000 25,000,000 – 25,000,000 2016 –
25,000,000 25,000,000 25,000,000 – 25,000,000 2016 –
25,000,000 25,000,000 25,000,000 – 25,000,000 2016 –
25,000,000 25,000,000 25,000,000 – 25,000,000 2016 –
– 1,734,400 1,562,538 – 473,505 2019 1,089,033
Maybank 60,000,000 60,000,000 53,333,333 – 20,000,000 2018 33,333,333
Shareholders – 229,280,000 90,774,096 – – 2025 90,774,096
Others – 4,000,000 4,000,000 4,000,000 – –
In the books of the Subsidiaries
UCPB (ABERDI) 185,000,000 185,000,000 185,000,000 – 4,005,000 2021 180,995,000
2,364,731,414 2,599,745,814 2,087,380,390 289,000,000 685,396,811 1,112,983,579
Short-term
Debt
Long-term Debt
Amount
Authorized by
Indenture Availed
Outstanding
balance
Current Portion of
Long-term Debt
Noncurrent Portion of Long-
term Debt
Schedule E
4 of 11

A BROWN COMPANY, INC. AND SUBSIDIARIES
SCHEDULE F – INDEBTEDNESS TO RELATED PARTIES
Title of Issue and Type of Obligation
Maturity
Date Amount
In the books of the Parent Company
Shareholders – 229,280,000 90,774,096 – – 2025 90,774,096
Affiliate - XSCCI – 1,000,000 1,000,000 1,000,000 – –
– 230,280,000 91,774,096 1,000,000 – 90,774,096
Short-term
Debt
Long-term Debt
Amount
Authorized by
Indenture Availed
Outstanding
balance
Current Portion of
Long-term Debt
Noncurrent Portion of Long-
term Debt
Schedule F
5 of 11
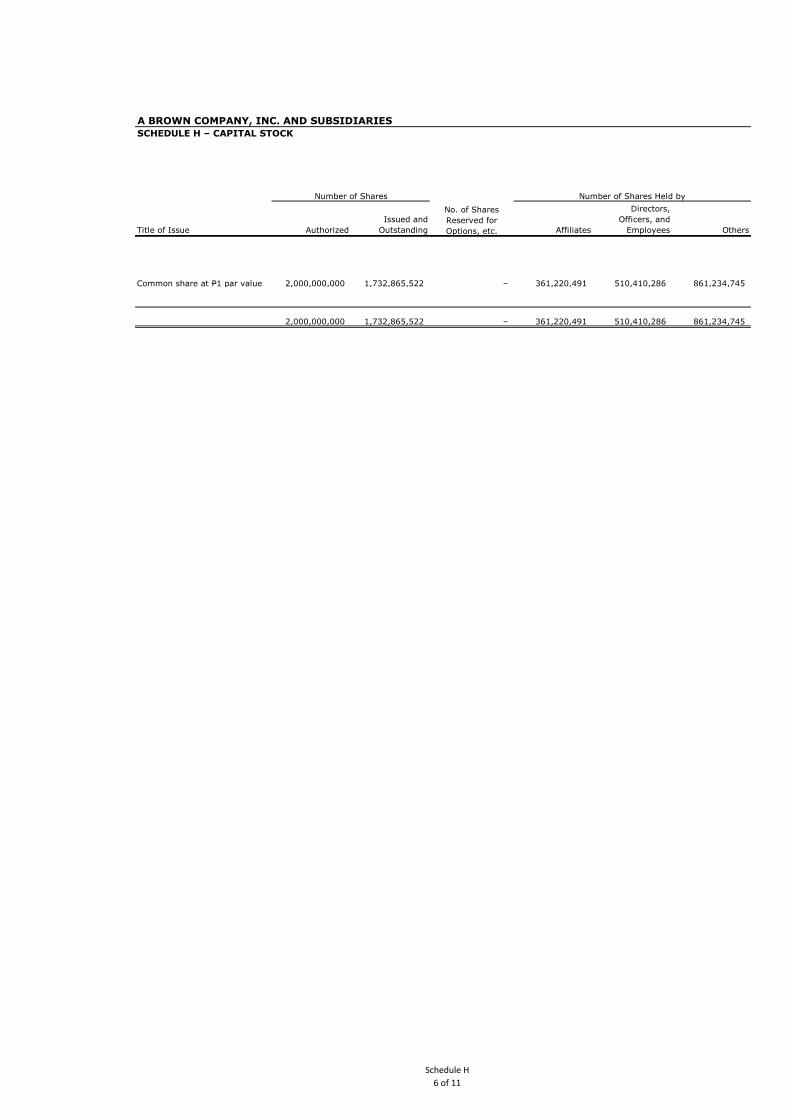
A BROWN COMPANY, INC. AND SUBSIDIARIES
SCHEDULE H – CAPITAL STOCK
Title of Issue Authorized
Issued and
Outstanding Affiliates
Directors,
Officers, and
Employees Others
Common share at P1 par value 2,000,000,000 1,732,865,522 – 361,220,491 510,410,286 861,234,745
2,000,000,000 1,732,865,522 – 361,220,491 510,410,286 861,234,745
Number of Shares
No. of Shares
Reserved for
Options, etc.
Number of Shares Held by
Schedule H
6 of 11
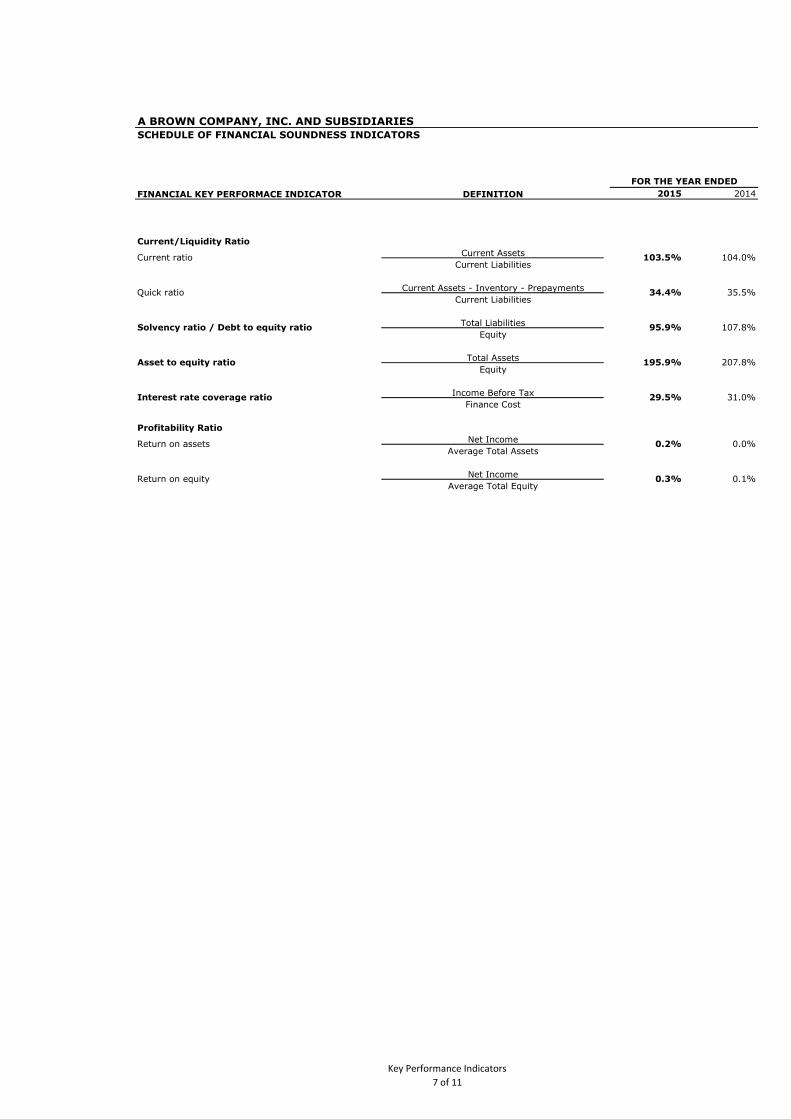
A BROWN COMPANY, INC. AND SUBSIDIARIES
SCHEDULE OF FINANCIAL SOUNDNESS INDICATORS
FINANCIAL KEY PERFORMACE INDICATOR DEFINITION 2015 2014
Current/Liquidity Ratio
Current Assets
Current Liabilities
Current Assets - Inventory - Prepayments
Current Liabilities
Total Liabilities
Equity
Total Assets
Equity
Income Before Tax
Finance Cost
Profitability Ratio
Net Income
Average Total Assets
Net Income
Average Total Equity
Current ratio 104.0%
Quick ratio 35.5%
Solvency ratio / Debt to equity ratio 107.8%
Interest rate coverage ratio 31.0%
Asset to equity ratio 207.8%
0.2%
0.3%
Return on assets 0.0%
195.9%
29.5%
Return on equity 0.1%
FOR THE YEAR ENDED
103.5%
34.4%
95.9%
Key Performance Indicators
7 of 11

A BROWN COMPANY, INC. AND SUBSIDIARIESLIST OF TOP 20 STOCKHOLDERS OF RECORD
Name of Stockholder
Total Numbers of Shares
Subscribed
Percent to Total
Outstanding
1 PCD NOMINEE CORPORATION 1,198,466,319 69.16%
2 ANNABELLE P. BROWN 188,829,288 10.90%
3 WALTER W. BROWN 136,200,000 7.86%
4 JIN NATURA RESOURCES CORPORATION 85,000,000 4.91%
5 PBJ CORPORATION 61,922,080 3.57%
6 PHILIPPINE REALTY & HOLDINGS CORP. 13,281,250 0.77%
7 BRIAN JUAT &/OR PATRICIA JUAT 3,960,937 0.23%
8 WALTER W. BROWN OR ANNABELLE BROWN 3,821,418 0.22%
9 A. BAYANI K. TAN 1,694,267 0.10%
10 ROBERTINO E. PIZARRO 1,060,613 0.06%
11 MA. GRACIA P. TAN 815,595 0.05%
12 WALTER BROWN (SPECIAL FUND) 797,895 0.05%
13 DAVID NICOLAS B. JUAT 782,207 0.05%
JOHN WALTER B. JUAT 782,207 0.05%
PAUL FRANCIS B. JUAT 782,207 0.05%
14 REGINA DAVILA 782,052 0.05%
15 PATRICIA B. JUAT &/OR MIGUEL VICTOR JUAT 781,273 0.05%
16 LUISITO FERNANDEZ 710,956 0.04%
ANDREA L. GANDIONCO 710,956 0.04%
DANILO E. PIZARRO 710,956 0.04%
710,956 0.04%
17 PATRICIA B. JUAT &/OR ANDREW PATRICK JUAT 679,368 0.04%
18 625,641 0.04%
19 CARIDAD SAY 540,325 0.03%20 ERNESTO R. LAGDAMEO, JR. 502,242 0.03%
1,704,951,008 98.39%
LOURDES PIZARRO
ALICIA P. LORENZO
Top 20
8 of 11
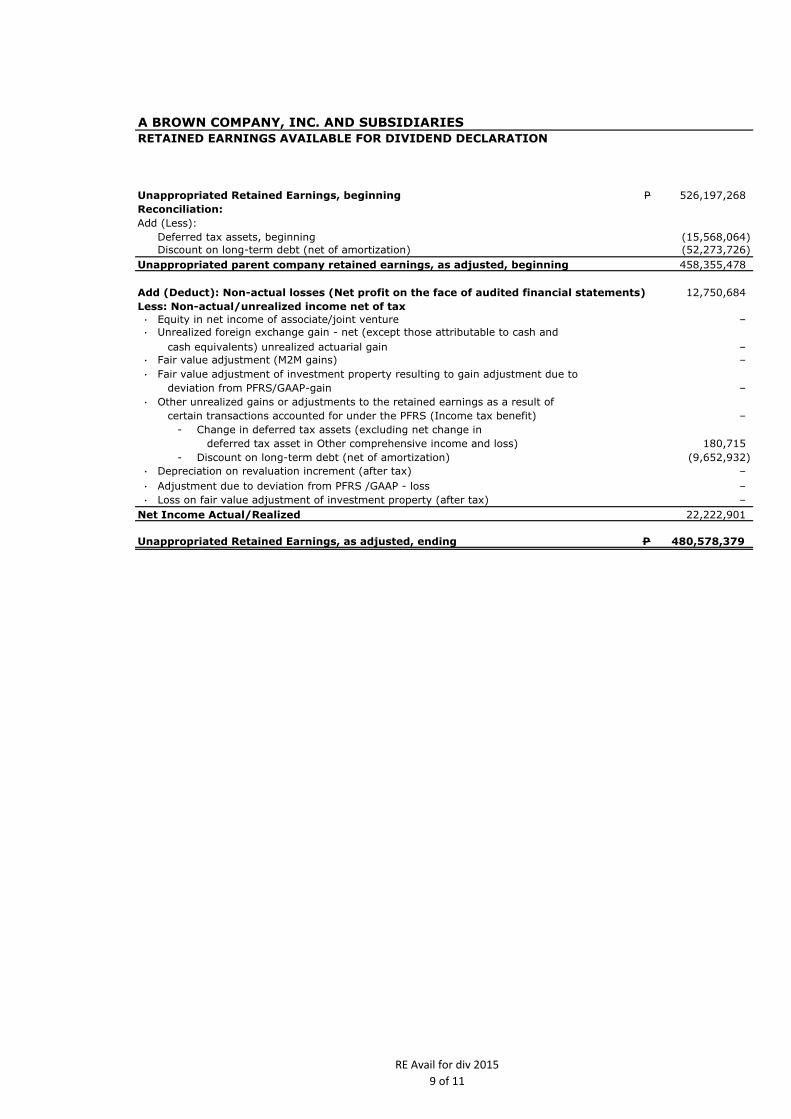
A BROWN COMPANY, INC. AND SUBSIDIARIES
RETAINED EARNINGS AVAILABLE FOR DIVIDEND DECLARATION
Unappropriated Retained Earnings, beginning P 526,197,268
Reconciliation:
Add (Less):
Deferred tax assets, beginning (15,568,064)
Discount on long-term debt (net of amortization) (52,273,726)
Unappropriated parent company retained earnings, as adjusted, beginning 458,355,478
Add (Deduct): Non-actual losses (Net profit on the face of audited financial statements) 12,750,684
Less: Non-actual/unrealized income net of tax
· Equity in net income of associate/joint venture –
· Unrealized foreign exchange gain - net (except those attributable to cash and
cash equivalents) unrealized actuarial gain –
· Fair value adjustment (M2M gains) –
· Fair value adjustment of investment property resulting to gain adjustment due to
deviation from PFRS/GAAP-gain –
· Other unrealized gains or adjustments to the retained earnings as a result of
certain transactions accounted for under the PFRS (Income tax benefit) –
- Change in deferred tax assets (excluding net change in
deferred tax asset in Other comprehensive income and loss) 180,715
- Discount on long-term debt (net of amortization) (9,652,932)
· Depreciation on revaluation increment (after tax) –
· Adjustment due to deviation from PFRS /GAAP - loss –
· Loss on fair value adjustment of investment property (after tax) –
Net Income Actual/Realized 22,222,901
Unappropriated Retained Earnings, as adjusted, ending P 480,578,379
RE Avail for div 2015
9 of 11

A BROWN COMPANY, INC. AND SUBSIDIARIES
RETAINED EARNINGS AVAILABLE FOR DIVIDEND DECLARATION
Unappropriated Retained Earnings, beginning P 497,390,581
Reconciliation:
Add (Less):
Deferred tax assets, beginning (16,995,009)
Discount on long-term debt (net of amortization) (40,188,232)
Unappropriated parent company retained earnings, as adjusted, beginning 440,207,340
Add (Deduct): Non-actual losses (Net profit on the face of audited financial statements) 28,806,687
Less: Non-actual/unrealized income net of tax
· Equity in net income of associate/joint venture –
· Unrealized foreign exchange gain - net (except those attributable to cash and
cash equivalents) unrealized actuarial gain –
· Fair value adjustment (M2M gains) –
· Fair value adjustment of investment property resulting to gain adjustment due to
deviation from PFRS/GAAP-gain –
· Other unrealized gains or adjustments to the retained earnings as a result of
certain transactions accounted for under the PFRS (Income tax benefit) –
- Change in deferred tax assets (excluding net change in
deferred tax asset in Other comprehensive income and loss) (1,426,945)
- Discount on long-term debt (net of amortization) 12,085,494
· Depreciation on revaluation increment (after tax) –
· Adjustment due to deviation from PFRS /GAAP - loss –
· Loss on fair value adjustment of investment property (after tax) –
Net Income Actual/Realized 18,148,138
Unappropriated Retained Earnings, as adjusted, ending P 458,355,478
RE Avail for div 2014
10 of 11
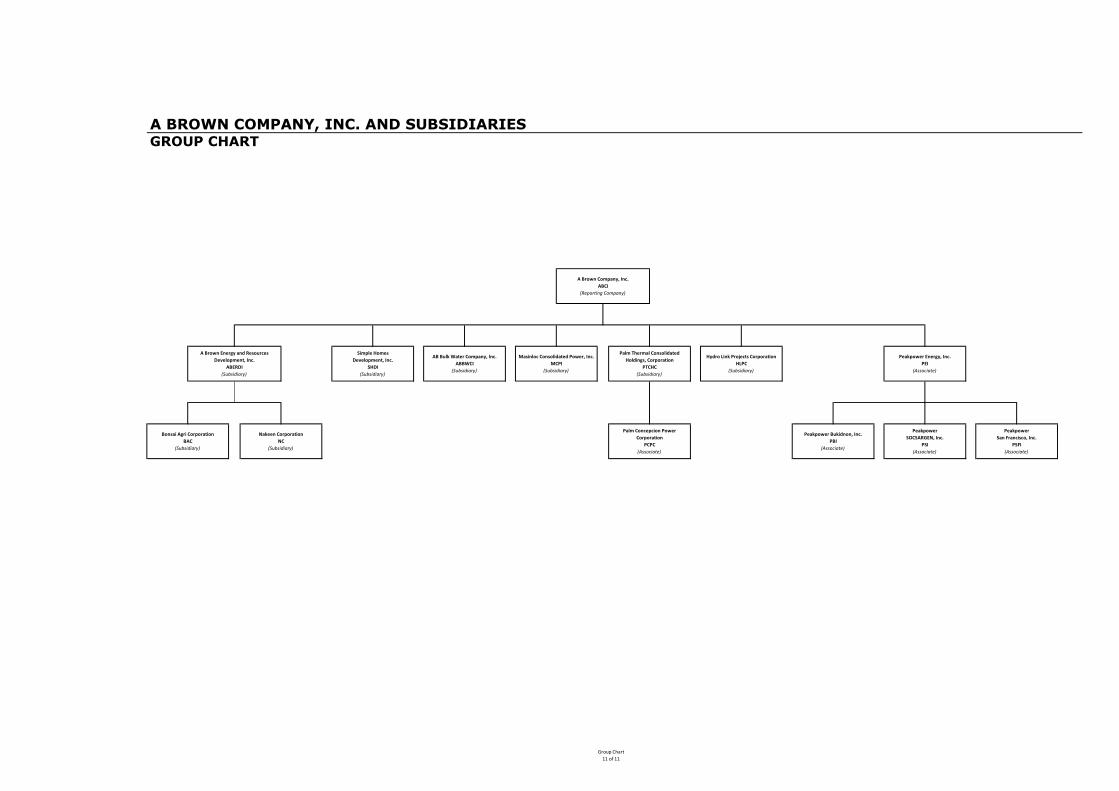
A BROWN COMPANY, INC. AND SUBSIDIARIESGROUP CHART
Bonsai Agri Corporation
BAC
(Subsidiary)
Nakeen Corporation
NC
(Subsidiary)
A Brown Energy and Resources
Development, Inc.
ABERDI
(Subsidiary)
Simple Homes
Development, Inc.
SHDI
(Subsidiary)
Peakpower
San Francisco, Inc.
PSFI
(Associate)
Peakpower
SOCSARGEN, Inc.
PSI
(Associate)
Peakpower Bukidnon, Inc.
PBI
(Associate)
Peakpower Energy, Inc.
PEI
(Associate)
A Brown Company, Inc.
ABCI
(Reporting Company)
AB Bulk Water Company, Inc.
ABBWCI
(Subsidiary)
Masinloc Consolidated Power, Inc.
MCPI
(Subsidiary)
Palm Thermal Consolidated
Holdings, Corporation
PTCHC
(Subsidiary)
Palm Concepcion Power
Corporation
PCPC
(Associate)
Hydro Link Projects Corporation
HLPC
(Subsidiary)
Group Chart
11 of 11
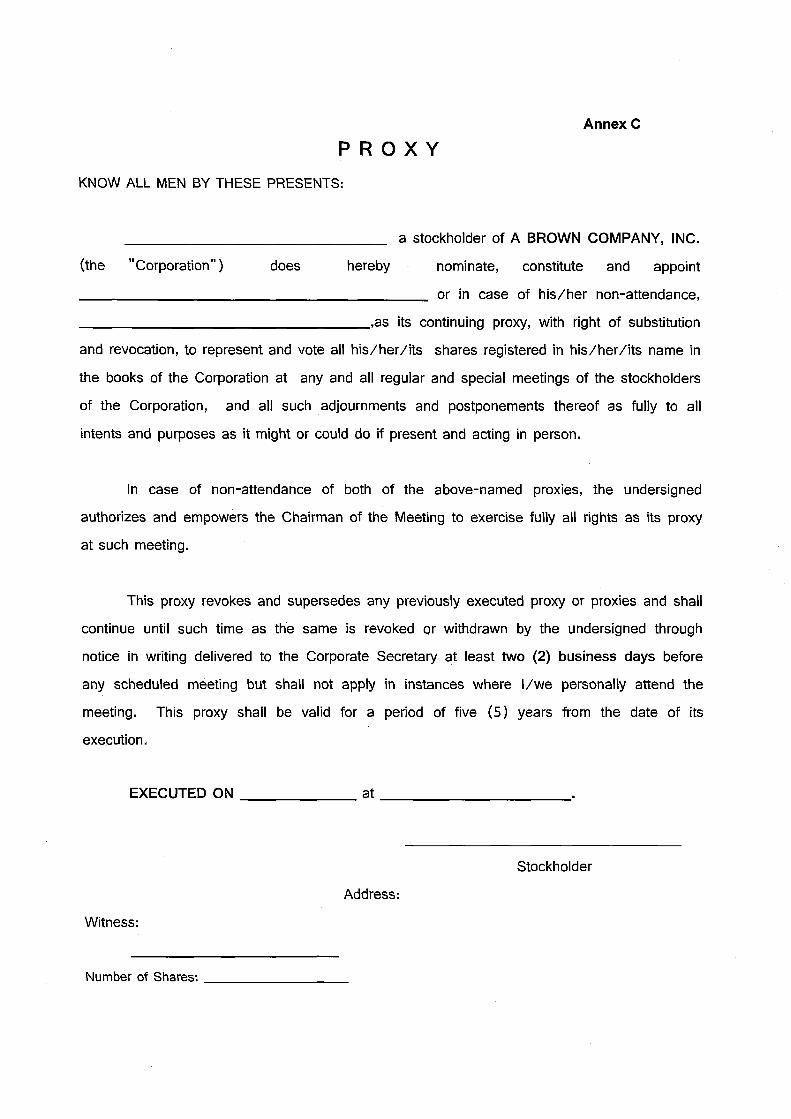
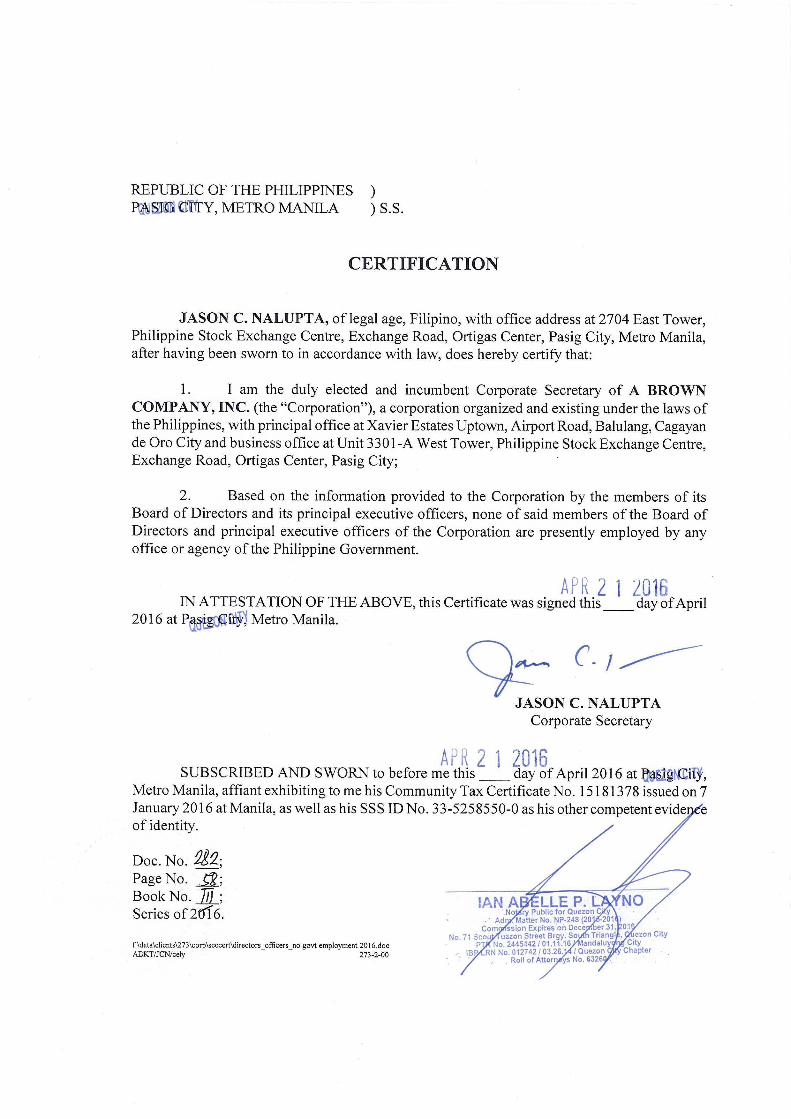
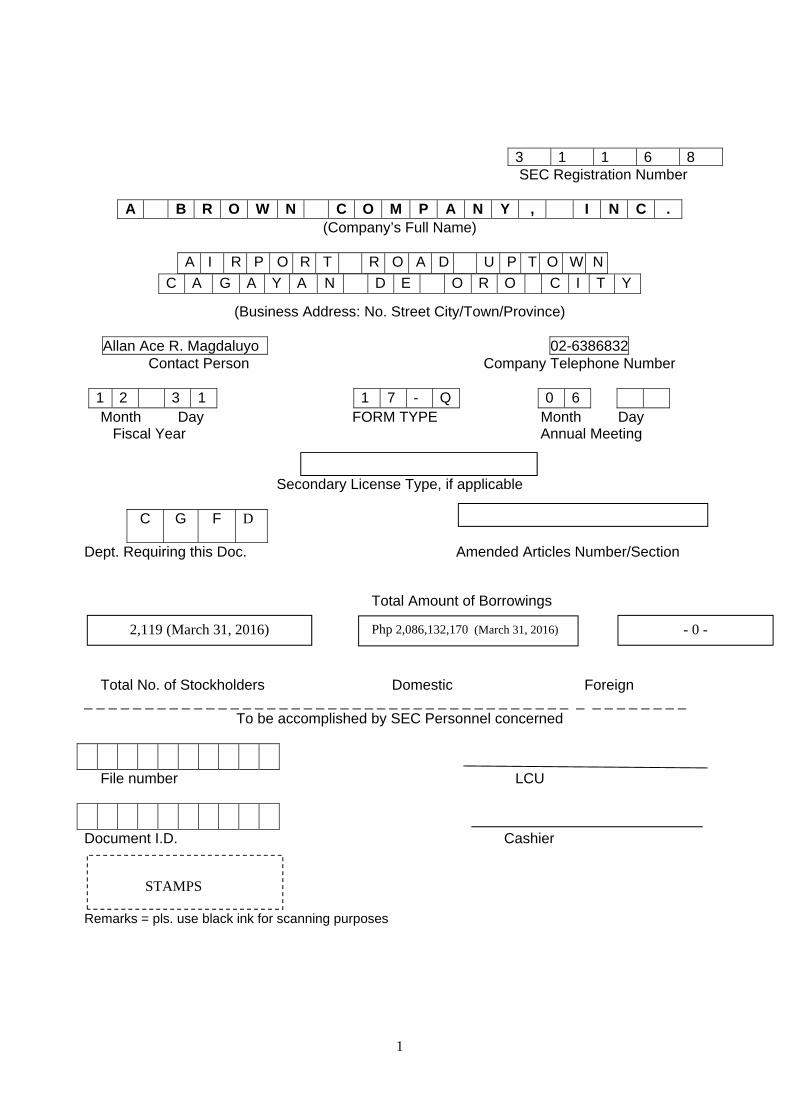
1
3 1 1 6 8 SEC Registration Number
A B R O W N C O M P A N Y , I N C .
(Company’s Full Name)
(Business Address: No. Street City/Town/Province)
Allan Ace R. Magdaluyo 02-6386832
Contact Person Company Telephone Number
1 2 3 1 1 7 - Q 0 6 Month Day FORM TYPE Month Day Fiscal Year Annual Meeting
Secondary License Type, if applicable
C G F D
Dept. Requiring this Doc. Amended Articles Number/Section Total Amount of Borrowings Total No. of Stockholders Domestic Foreign _ _ _ _ _ _ _ _ _ _ _ _ _ _ _ _ _ _ _ _ _ _ _ _ _ _ _ _ _ _ _ _ _ _ _ _ _ _ _ _ _ _ _ _ _ _ _ _ _
To be accomplished by SEC Personnel concerned
File number LCU
Document I.D. Cashier Remarks = pls. use black ink for scanning purposes
A I R P O R T R O A D U P T O W N C A G A Y A N D E O R O C I T Y
STAMPS
2,119 (March 31, 2016) - 0 - Php 2,086,132,170 (March 31, 2016)
2
SECURITIES AND EXCHANGE COMMISSION
SEC FORM 17-Q QUARTERLY REPORT PURSUANT TO SECTION 17 OF THE SECURITIES REGULATION
CODE AND SRC RULE 17(2)(b) THEREUNDER 1. For the 1st quarter ended March 31, 2016 2. Commission Identification Number: 31168 3. BIR Tax identification No. 002-724-446-000 4. A BROWN COMPANY, INCORPORATED 5. Metro Manila, Philippines 6. Industry Classification Code: (SEC use only) 7. Xavier Estates Uptown, Airport Road, Balulang, Cagayan de Oro City 9000 8. Telephone Nos. (088) 858-8784 or (02) 638-6832 9. Former address in last report is: Rm. 3304-C, 33rd Floor West Tower, PSE Centre Ortigas Center, Pasig City (Liaison Office) 10. Securities registered pursuant to Sections 8 and 12 of the Code, or Sections 4 and 8 of the
RSA Title of each class Number of shares outstanding Common shares 1,732,865,522 Amount of debt outstanding: P2,675,367,638 11. Are any or all of the securities listed on a Stock Exchange? Yes, all of the common securities are listed in the Philippine Stock Exchange 12.a Yes, we have filed all reports required to be filed by Section 17 of the Code and SRC
Rule 17 thereunder or Sections 11 of the RSA and the RSA Rule 11(a)-1 thereunder, and Sections 26 and 141 of the Corporation Code of the Philippines, during the preceding 12 months (or for such shorter period the registrant was required to file such reports).
12.b Yes, we have been subject to such filing requirements for the past 90 days.

3
TABLE OF CONTENTS
Page Part I. Financial Information Item 1. Financial Statements
• Unaudited Consolidated Financial Statements Exhibit 1 - Consolidated Statement of Financial Position as of
March 31, 2016 and December 31, 2015 - Consolidated Statement of Income for the Three Months Ended
and Year-to-Date Ended March 31, 2016 and March 31, 2015 - Consolidated Statement of Comprehensive Income for the Three Months
Ended and Year-to-Date Ended March 31, 2016 and March 31, 2015 - Consolidated Statement of Changes in Equity as of March 31, 2016,
March 31, 2015 and December 31, 2015 - Consolidated Statement of Cash Flows for the Three Months Ended
and Year-to-Date Ended March 31, 2016 and March 31, 2015 - Notes to Financial Statements - Aging of Receivables Exhibit 1-A - Segment Report Exhibit 1-B - ABCI Group Chart Exhibit 1-C
Item 2. Management Discussion and Analysis of Financial Condition
And Results of Operations 4-9 Part II. Other Information Item 3. Financial Soundness Indicators/Performance Indicators 10
Signature 24
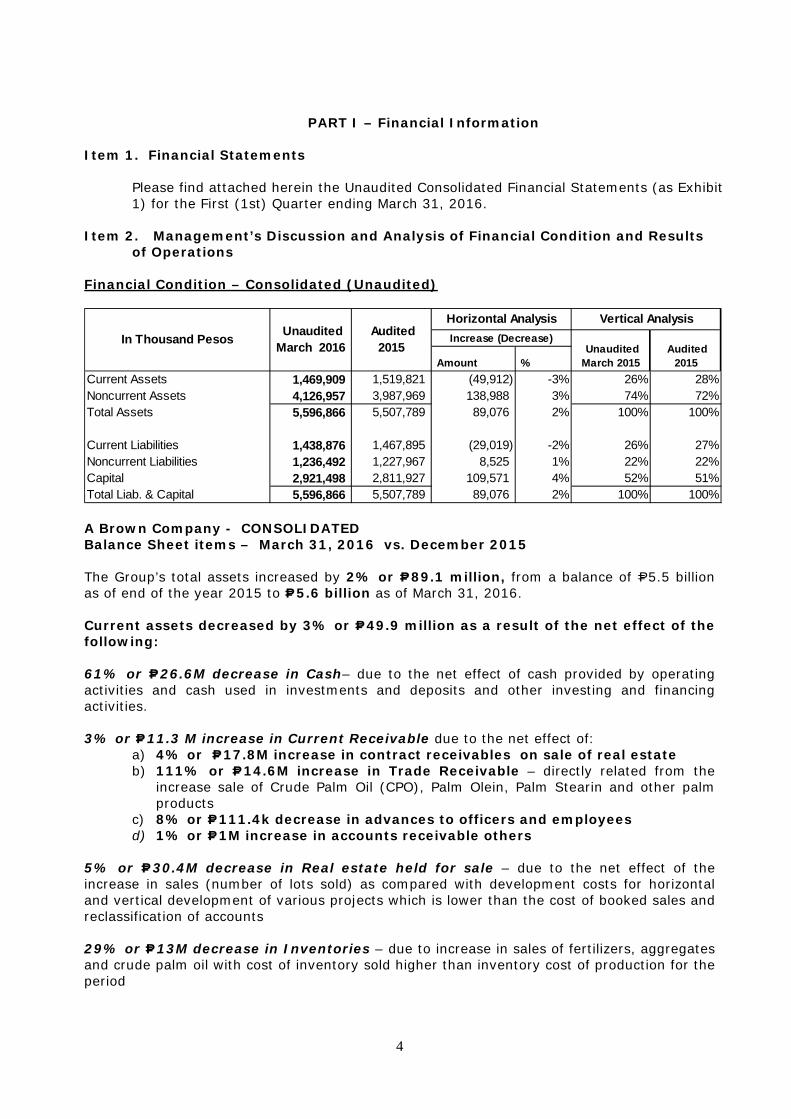
4
PART I – Financial Information Item 1. Financial Statements Please find attached herein the Unaudited Consolidated Financial Statements (as Exhibit
1) for the First (1st) Quarter ending March 31, 2016. Item 2. Management’s Discussion and Analysis of Financial Condition and Results
of Operations Financial Condition – Consolidated (Unaudited)
A Brown Company - CONSOLIDATED Balance Sheet items – March 31, 2016 vs. December 2015 The Group’s total assets increased by 2% or P=89.1 million, from a balance of P=5.5 billion as of end of the year 2015 to P=5.6 billion as of March 31, 2016. Current assets decreased by 3% or P=49.9 million as a result of the net effect of the following: 61% or P=26.6M decrease in Cash– due to the net effect of cash provided by operating activities and cash used in investments and deposits and other investing and financing activities. 3% or P=11.3 M increase in Current Receivable due to the net effect of:
a) 4% or P=17.8M increase in contract receivables on sale of real estate b) 111% or P=14.6M increase in Trade Receivable – directly related from the
increase sale of Crude Palm Oil (CPO), Palm Olein, Palm Stearin and other palm products
c) 8% or P=111.4k decrease in advances to officers and employees d) 1% or P=1M increase in accounts receivable others
5% or P=30.4M decrease in Real estate held for sale – due to the net effect of the increase in sales (number of lots sold) as compared with development costs for horizontal and vertical development of various projects which is lower than the cost of booked sales and reclassification of accounts 29% or P=13M decrease in Inventories – due to increase in sales of fertilizers, aggregates and crude palm oil with cost of inventory sold higher than inventory cost of production for the period
Amount %Current Assets 1,469,909 1,519,821 (49,912) -3% 26% 28%Noncurrent Assets 4,126,957 3,987,969 138,988 3% 74% 72%Total Assets 5,596,866 5,507,789 89,076 2% 100% 100%
Current Liabilities 1,438,876 1,467,895 (29,019) -2% 26% 27%Noncurrent Liabilities 1,236,492 1,227,967 8,525 1% 22% 22%Capital 2,921,498 2,811,927 109,571 4% 52% 51%Total Liab. & Capital 5,596,866 5,507,789 89,076 2% 100% 100%
In Thousand Pesos Unaudited March 2016
Audited 2015
Horizontal Analysis Vertical AnalysisIncrease (Decrease)
Unaudited March 2015
Audited 2015

5
3% or P=8.7M increase in Prepayments and Other Current Assets – due to the net effect of:
a) 5% or P=3.8M increase in creditable withholding taxes – as a result of increase in real estate sales made during the period.
b) 92% or P=24.3M increase in prepaid expenses – due to advance payments made by the group during the quarter in relation to various expenses.
c) 2% or P=767K increase in input VAT - due to increase in recognized input VAT from various purchases made during the period.
d) 28% or P=12.2M decrease in other deposits e) 100% or P=1.7M increase in other current assets
Non-Current assets increased by 3% or P=139 million as a result of the net effect of the following: 11% or P=105.5M increase in Available for sale Investments – due to the increase in the market value of investments. P=731K increase in Investment in Associates – due to the Group’s share in the net income of the associates 6% or P=13.1M decrease in Investment Properties – due to the net effect of disposals made and depreciation during the quarter. P=453K increase in Property and Equipment - net due to the net effect in:
a) 0.04% or P=209k increase in machinery and equipment b) 1% or P=108k increase in furniture and fixtures c) 5% or P=77k increase in tools and other equipment – related to additions made during
the quarter. d) 16% or P=5.4M increase in construction in progress – due to additional costs of the
refinery plant and water system e) 1% or P=148k increase in other fixed assets
1% or P=5.6M increase in Land and Improvements – due to the additional costs incurred for new real estate projects. 2% or P=8.5M increase in Biological Assets – due to additional capitalized costs for Kalabugao plantation 1% or P=0.3M decrease due to amortization of Leasehold Rights 25% or P=10.2M increase in Deferred Tax Assets – directly related to the increase in the net operating loss carry over (NOLCO) of the group during the quarter. 5% or P=522k decrease in Refundable Deposits – due to the return of deposits made during the quarter. Current liabilities decreased by 2% of P=29 million as a result of the net effect of the following: 2% or P=6.2M decrease in Accounts Payable and Accrued Expenses – primarily due to the net effect of the following:
a) 3% or P=9.8M decrease in accounts payable b) 4% or P=986k increase in accrued expenses c) 3% or P=150k decrease in contracts payable d) 5% or P=536k decrease in accrued interest payable e) 1% or P=66k increase in retention payable f) 15% or P=3.2M increase in other payables
6
52% or P=22.1M decrease in Deposit from Customers – due to increase in book sales settled through end buyer’s financing. 69% or P=200M increase in Short Term Debt – due to the net effect of the additional clean term loan availed by the group amounting to P=200M from CBC during the quarter 29% or P=200.7M decrease in Current maturities portion of long-term debt due to settlement of the current portion of the long term debt with China Bank Non-Current liabilities increased by 1% or P=8.5million as a result of the net effect of the following: P=0.6M decrease in Long-term Debt – due to the net effect of reclassification of the principal amount that will be due within one year and new long term loans availed. 11% or P=9M increase in Deferred Tax Liabilities - due to the increase in the tax effect of sales on deferred payment scheme. Equity increased by 4% or P=109.6 million as a result of the net effect of the following: 70% or P=105.5M increase in Net Unrealized Gain on Available for Sale – due to the increase in market value of available for sale investments 1% or P=4M increase in the Retained Earnings – due to the effect of net income earned during the period
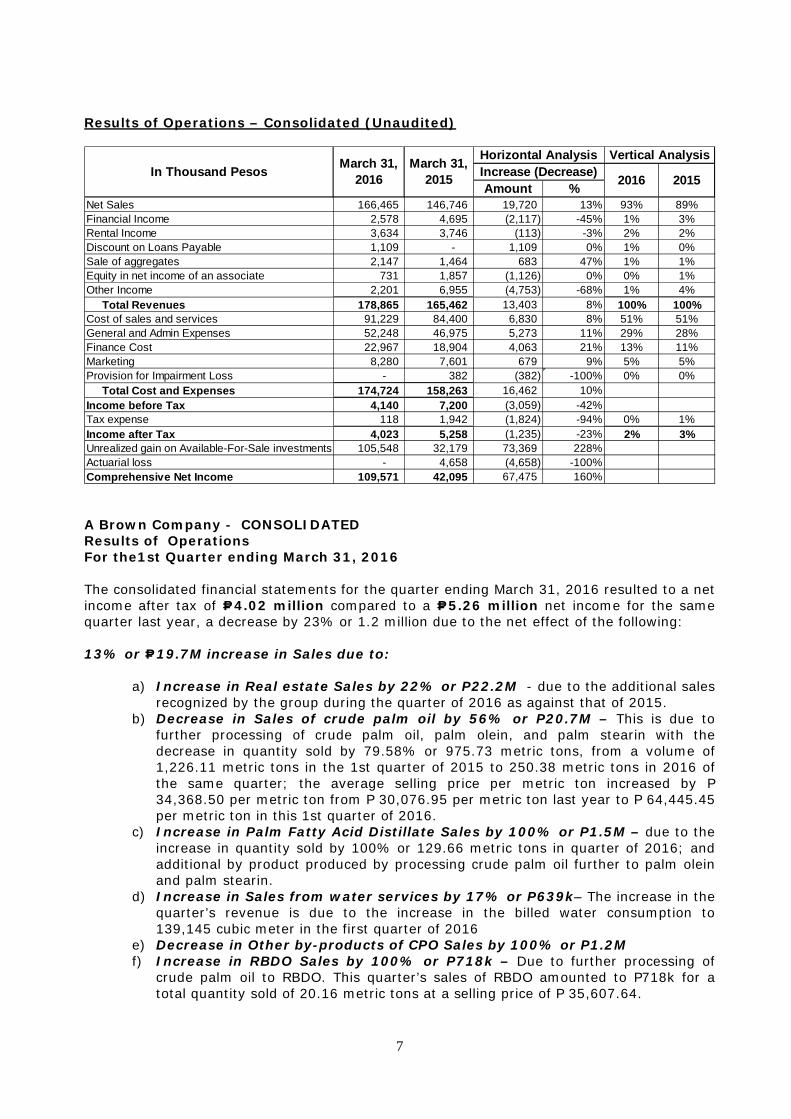
7
Results of Operations – Consolidated (Unaudited)
A Brown Company - CONSOLIDATED Results of Operations For the1st Quarter ending March 31, 2016 The consolidated financial statements for the quarter ending March 31, 2016 resulted to a net income after tax of P=4.02 million compared to a P=5.26 million net income for the same quarter last year, a decrease by 23% or 1.2 million due to the net effect of the following: 13% or P=19.7M increase in Sales due to:
a) Increase in Real estate Sales by 22% or P22.2M - due to the additional sales recognized by the group during the quarter of 2016 as against that of 2015.
b) Decrease in Sales of crude palm oil by 56% or P20.7M – This is due to further processing of crude palm oil, palm olein, and palm stearin with the decrease in quantity sold by 79.58% or 975.73 metric tons, from a volume of 1,226.11 metric tons in the 1st quarter of 2015 to 250.38 metric tons in 2016 of the same quarter; the average selling price per metric ton increased by P 34,368.50 per metric ton from P 30,076.95 per metric ton last year to P 64,445.45 per metric ton in this 1st quarter of 2016.
c) Increase in Palm Fatty Acid Distillate Sales by 100% or P1.5M – due to the increase in quantity sold by 100% or 129.66 metric tons in quarter of 2016; and additional by product produced by processing crude palm oil further to palm olein and palm stearin.
d) Increase in Sales from water services by 17% or P639k– The increase in the quarter’s revenue is due to the increase in the billed water consumption to 139,145 cubic meter in the first quarter of 2016
e) Decrease in Other by-products of CPO Sales by 100% or P1.2M f) Increase in RBDO Sales by 100% or P718k – Due to further processing of
crude palm oil to RBDO. This quarter’s sales of RBDO amounted to P718k for a total quantity sold of 20.16 metric tons at a selling price of P 35,607.64.
Amount %Net Sales 166,465 146,746 19,720 13% 93% 89%Financial Income 2,578 4,695 (2,117) -45% 1% 3%Rental Income 3,634 3,746 (113) -3% 2% 2%Discount on Loans Payable 1,109 - 1,109 0% 1% 0%Sale of aggregates 2,147 1,464 683 47% 1% 1%Equity in net income of an associate 731 1,857 (1,126) 0% 0% 1%Other Income 2,201 6,955 (4,753) -68% 1% 4% Total Revenues 178,865 165,462 13,403 8% 100% 100%Cost of sales and services 91,229 84,400 6,830 8% 51% 51%General and Admin Expenses 52,248 46,975 5,273 11% 29% 28%Finance Cost 22,967 18,904 4,063 21% 13% 11%Marketing 8,280 7,601 679 9% 5% 5%Provision for Impairment Loss - 382 (382) -100% 0% 0% Total Cost and Expenses 174,724 158,263 16,462 10%Income before Tax 4,140 7,200 (3,059) -42%Tax expense 118 1,942 (1,824) -94% 0% 1%Income after Tax 4,023 5,258 (1,235) -23% 2% 3%Unrealized gain on Available-For-Sale investments 105,548 32,179 73,369 228%Actuarial loss - 4,658 (4,658) -100%Comprehensive Net Income 109,571 42,095 67,475 160%
In Thousand Pesos March 31, 2016
March 31, 2015
Horizontal Analysis Vertical AnalysisIncrease (Decrease) 2016 2015
8
g) Increase in Palm Acid Oil Sales by 100% or P1M - This quarter’s sales of palm acid oil amounted to P1.05M for a total quantity sold of 122.24 metric tons at a selling price of P8,618.14.
h) Increase in Palm Olein Sales by 100% or P10.3M – Due to further processing of crude palm oil to palm olein
i) Increase in Palm Stearin Sales by 100% or P6.4M - Due to further processing of crude palm oil to palm stearin
j) Decrease in Kernel Nuts and Fertilizer Sales by 54% or P1M k) Decrease in Sales from crop and palm seedlings by 100% or P0.2M
45% or P2.1M decrease in Financial Income– due to the increase in end-buyer’s financing by the bank leading to decrease in the in-house financing of real estate sales. 61% or P1.1M decrease in Equity in Net Gain of an Associate – this pertains to the group’s 20% share on the net earnings of PCPC and PEI’s operating companies. 47% or P683k increase in Sales of Aggregates– in the first quarter of 2016, the Group sold a total of 3,726 cubic meters which is higher than the 3,354 cubic meters sold in the first quarter of 2015 3% or P113K decrease in Rental income – due to the reduction of rental of construction equipment. 100% or P1.1M increase in Discount on loans payable – due to the discounting of additional non-interest bearing loans availed from various stockholders during the first quarter of 2016 68% or P4.8M decrease in Other income– due to the net effect of the following:
a) Decrease in Income from forfeited deposits by 10% or P81K – foreclosed accounts in the first quarter of 2016 is lower compared to last year’s forfeited accounts of the same quarter.
b) Decrease in Income from penalties and surcharges by 46% or P324k – due to the increase in end-buyer’s financing by the bank leading to decrease in the collection of penalties and surcharges through the in- house financing of real estate sales.
c) Decrease in Other income by 80% or P4.3M – due to the decrease in scrap sales from empty fresh fruit bunches
8% or P6.8M increase in Cost of Sales due to:
a) 13% or P7M increase in cost of Real estate – the increase is relatively due to increase in lots sold
b) 53% or P13.34M decrease in cost of production of Crude palm oil – – This is due to further processing of Crude Palm Oil, Palm Olein, and Palm Stearin
c) Increase in cost of Palm Fatty Acid Distillate by 100% or P666k d) Increase in cost from Water services by 16% or P208k– The increase is
relatively due to increase in service income in water and increase in new connections during the quarter.
e) 110% or 1M increase in cost of Aggregates–the increase is relatively due to the increase in sales of aggregates
f) Decrease in cost of Kernel Nuts and Fertilizer by 100% or P1.8M - the decrease is relatively due to the decrease in sales of Kernel Nuts and Fertilizers
g) Increase in cost of RBDO by 100% or P419k h) Increase in cost of Palm Kernel by 100% or P675k i) Increase in cost of Palm Acid Oil by 100% or P755k j) Increase in cost of Palm Olein by 100% or P7.7M
9
k) Increase in cost of Palm Stearin by 100% or P4.4M l) Decrease in cost of Crop and palm seedlings by 100% or P89k – the decrease
is relatively due to the decrease in sales of crop and palm seedlings m) 87% or P845k decrease in Other direct cost – related to the increase in the direct
plantation cost
11% or P5.3M increase in General and Administrative Expenses - due to the following net effect of:
a) 9% or P1.4M increase in Personnel expenses - due to the net effect of the increase in manpower during the first quarter of 2016
b) 27% or P1.4M decrease in Depreciation and amortization– due to the net effect of the fully depreciated property and equipment items and various additions in the first quarter of 2016
c) 5% or P404k increase in Taxes and Licenses – the increase is due to the increase in monthly amortization of business permits and other taxes related to the new real estate projects
d) 45% or P1M decrease in Repairs and maintenance – due to the decrease in cost of repairs and maintenance during the quarter as against the first quarter of 2015.
e) 30% or P700k decrease in Utilities and supplies – due to the decrease in usage of supplies during the first quarter of 2016 as against that of 2015.
f) 14% or P276k increase in Rental expense – the increase pertains to the escalation of rental fees as charged by the lessor
g) 69% or P189k decrease in Representation and Entertainment – this refers to the cost of providing comfort/convenience (e.g. meals) to the prospective clients
h) 17% or P595k increase in security services - due to the increase in number of security personnel assigned to real estate projects
i) 51% or P1.7M decrease in professional fees– directly related to the various consultancy services incurred by the group
j) 39% or P691k decrease in travel and transportation – directly related to the various site visitation for mill and plantation operations and power group operations
k) 64% or P146k increase in board meeting expenses – due to the various materials and other expenses incurred related to board meetings and annual reports
l) 13% or P22.4k decrease in insurance m) 17% or P46k increase in director fees n) 6% or P5k decrease in training and seminars – due to the minimal trainings
and seminars conducted and attended the first quarter of 2015 as compared this year
o) 3% or P7k decrease in subscription and dues p) 3620% or P207k increase in bank charges – directly related to availment of
loans, cancellation of mortgages and various charges on interbank deposits q) 39211% or P7.3M increase in litigation expenses – the increase is directly
related to the settlement of Yulo case. r) 21% or P341k increase in miscellaneous expenses – includes community
relations expenses such as scholar’s tuition and other humanitarian assistance 21% or P4M increase in Finance costs – directly related to the group’s new loan availments during the first quarter of 2016. 9% or P679K increase in Marketing expenses – due to the increase in various sponsorships of events for ads and promotions.
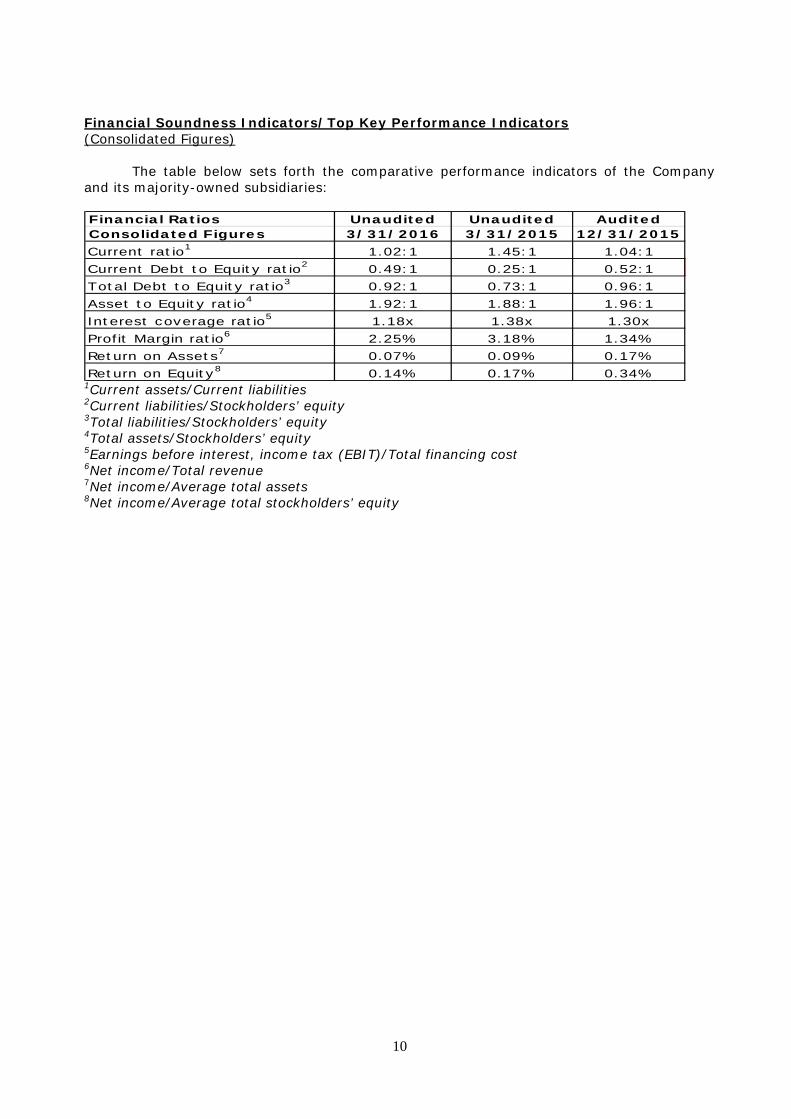
10
Financial Soundness Indicators/Top Key Performance Indicators (Consolidated Figures)
The table below sets forth the comparative performance indicators of the Company and its majority-owned subsidiaries:
1Current assets/Current liabilities 2Current liabilities/Stockholders’ equity 3Total liabilities/Stockholders’ equity 4Total assets/Stockholders’ equity 5Earnings before interest, income tax (EBIT)/Total financing cost 6Net income/Total revenue 7Net income/Average total assets 8Net income/Average total stockholders’ equity
Financial Ratios Unaudited Unaudited AuditedConsolidated Figures 3/31/2016 3/31/2015 12/31/2015Current ratio1 1.02:1 1.45:1 1.04:1Current Debt to Equity ratio2 0.49:1 0.25:1 0.52:1Total Debt to Equity ratio3 0.92:1 0.73:1 0.96:1Asset to Equity ratio4 1.92:1 1.88:1 1.96:1Interest coverage ratio5 1.18x 1.38x 1.30xProfit Margin ratio6 2.25% 3.18% 1.34%Return on Assets7 0.07% 0.09% 0.17%Return on Equity8 0.14% 0.17% 0.34%
11
Real Property Development:
Xavier Estates: The percentage of completion of Xavier Estates Phase 5- Ventura Residences is 91% as of March 31, 2016. This project has a saleable area of 5.8124 hectares. Cluster A is subdivided to produce 128 saleable house and lot packages of which 110 units are already completed. Cluster B is expected to provide 50 saleable lots while 91 saleable lots for Cluster C. For the 1st quarter of 2016, there were three (3) lots sold, the same number of lots were sold for the 1st quarter of last year in Xavier Estates. For Ventura Residences, there were four (4) house and lot packages recorded as sold in this quarter of the year while four (4) house and lots for the 1st quarter of 2015. For Ventura Lanes, there were four (4) lots sold this quarter.
Xavierville Homes: Phase 1 and 2 are 100% complete. Retouching of existing and
completed units is being done for its housing component when necessary. There were three (3) units sold for the 1st quarter of the current year.
Teakwood Hills: This project has three (3) phases. Phase 1 & 2 are expected to
produce a total of 522 saleable lots after an alteration has been made from the previous 795 and 59 saleable lots for the development area of 40 and 5.2 hectares, respectively. Percentage-of-completion is at 81%. For this year’s 1st quarter, sixteen (16) lots were sold compared to eight (8) lots for the same quarter last year.
St. Therese Subdivision: The subdivision is a 1.6720-hectare socialized housing
project located in mid- Balulang, Cagayan de Oro that will provide 155 lots of which 91 lots are row houses, 38 units are duplex, 17 single attached units and nine (9) units which have been allotted for a new design. There were four (4) units sold for this year’s 1st quarter while five (5) units for the 1st quarter of 2015.
Valencia Estates: The project is 100% done. The main gate, the multi-purpose hall and swimming pool were completed in 2012. Three (3) lot were sold for the 1st quarter of 2015 while Eight (8) for the 1st quarter of this year.
Coral Resort Estates: The project is considered as the first residential resort estates in Northern Mindanao. It is strategically located in Initao, Misamis Oriental with a total development area of 5.397 hectares. Phase 1-Cluster A of the project with a development area of 2.5361 hectares is 97% completed. Phase 1-Cluster B is currently 88% completed. There are five (5) lots that were sold for the 1st quarter of this year while four (4) lots for the 1st quarter of last year.
West Highlands is a golf and residential estate located in Brgy. Bonbon, Butuan City.
The estate has a total developmental area of 25.9 hectares and is 289 feet above sea level which gives lot owners a panoramic view of historic Mt. Mayapay or the cityscape. Phase 1 which is 99.62% is expected to generate 293 saleable lots. The spillway, concrete barrier, riprap, and spine road were completed this period. There were twenty seven (27) lots sold for this quarter as compared to the four (4) lots sold for the same quarter last year.
Mountain View Homes is located in mid-Balulang, Cagayan de Oro City and is the
latest project offering of ABCI. This has a development area of 2.3179 hectares with 216 saleable house and lots. Project development is 99% accomplished with amenities. There were twenty two (22) lots sold this quarter.
ABCI is engaged in quarrying and mining of basalt rocks for the production of
construction aggregates of four different sizes as follow: 1 1/2" gravel, 3/4" gravel 3/8" gravel and crushed sand. The quarry site which is rocky in nature is located in Sitio Balaon, San Isidro, Talakag, Bukidnon. A total of 2,410 cubic meters of aggregates were produced for the first quarter of this year. There was no production of aggregates for the same quarter of last year due to defective crushing plant equipment.
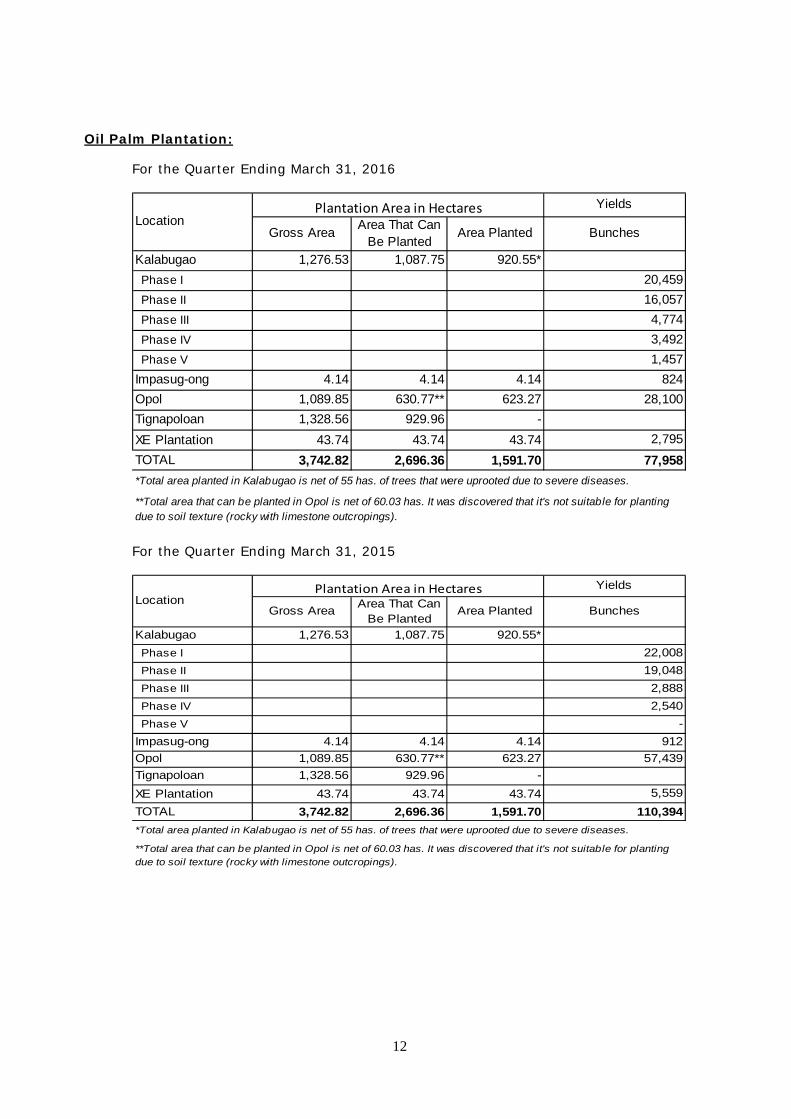
12
Oil Palm Plantation: For the Quarter Ending March 31, 2016
For the Quarter Ending March 31, 2015
Yields
Gross Area Area That Can Be Planted
Area Planted Bunches
Kalabugao 1,276.53 1,087.75 920.55* Phase I 20,459 Phase II 16,057 Phase III 4,774 Phase IV 3,492 Phase V 1,457Impasug-ong 4.14 4.14 4.14 824Opol 1,089.85 630.77** 623.27 28,100Tignapoloan 1,328.56 929.96 -XE Plantation 43.74 43.74 43.74 2,795TOTAL 3,742.82 2,696.36 1,591.70 77,958*Total area planted in Kalabugao is net of 55 has. of trees that were uprooted due to severe diseases.
LocationPlantation Area in Hectares
**Total area that can be planted in Opol is net of 60.03 has. It was discovered that it's not suitable for planting due to soil texture (rocky with limestone outcropings).
Yields
Gross Area Area That Can Be Planted
Area Planted Bunches
Kalabugao 1,276.53 1,087.75 920.55* Phase I 22,008 Phase II 19,048 Phase III 2,888 Phase IV 2,540 Phase V -Impasug-ong 4.14 4.14 4.14 912Opol 1,089.85 630.77** 623.27 57,439Tignapoloan 1,328.56 929.96 -XE Plantation 43.74 43.74 43.74 5,559TOTAL 3,742.82 2,696.36 1,591.70 110,394*Total area planted in Kalabugao is net of 55 has. of trees that were uprooted due to severe diseases.
LocationPlantation Area in Hectares
**Total area that can be planted in Opol is net of 60.03 has. It was discovered that it's not suitable for planting due to soil texture (rocky with limestone outcropings).
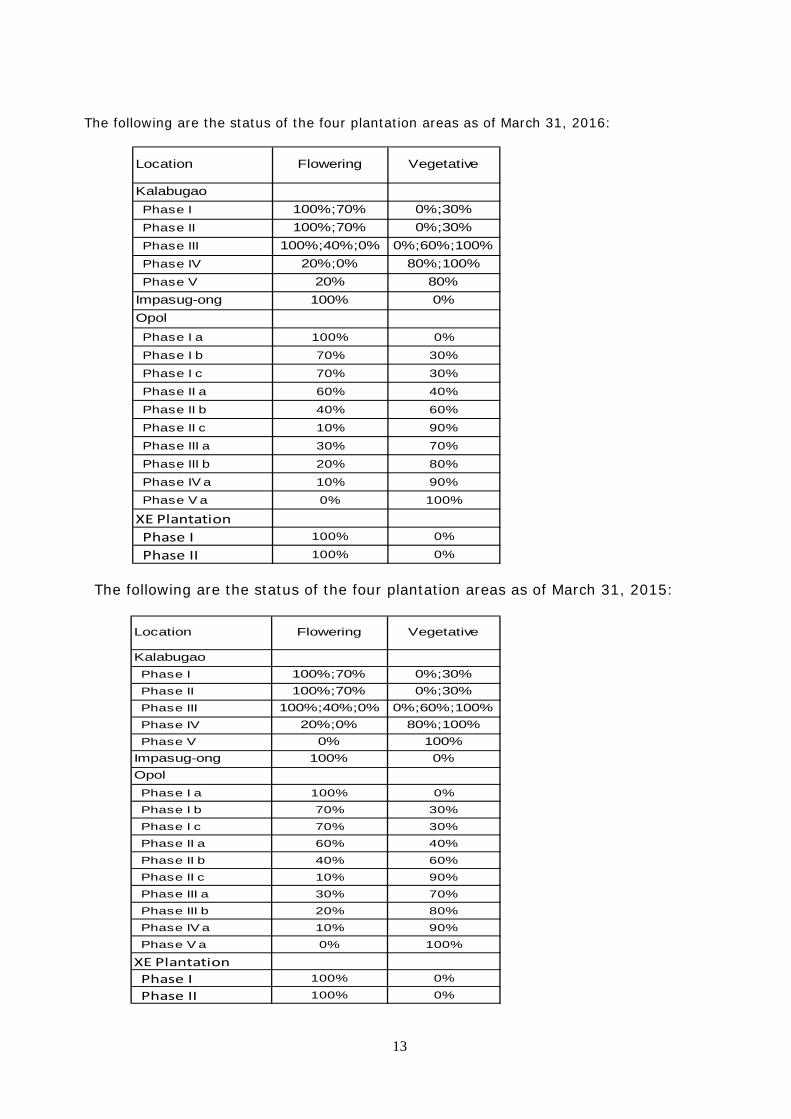
13
The following are the status of the four plantation areas as of March 31, 2016:
The following are the status of the four plantation areas as of March 31, 2015:
Kalabugao Phase I 100%;70% 0%;30% Phase II 100%;70% 0%;30% Phase III 100%;40%;0% 0%;60%;100% Phase IV 20%;0% 80%;100% Phase V 20% 80%Impasug-ong 100% 0%Opol Phase I a 100% 0%
Phase I b 70% 30%
Phase I c 70% 30%
Phase II a 60% 40%
Phase II b 40% 60%
Phase II c 10% 90%
Phase III a 30% 70%
Phase III b 20% 80%
Phase IV a 10% 90% Phase V a 0% 100%
XE Plantation Phase I 100% 0%
Phase II 100% 0%
Location Flowering Vegetative
Kalabugao Phase I 100%;70% 0%;30% Phase II 100%;70% 0%;30% Phase III 100%;40%;0% 0%;60%;100% Phase IV 20%;0% 80%;100% Phase V 0% 100%Impasug-ong 100% 0%Opol Phase I a 100% 0%
Phase I b 70% 30%
Phase I c 70% 30%
Phase II a 60% 40%
Phase II b 40% 60%
Phase II c 10% 90%
Phase III a 30% 70%
Phase III b 20% 80%
Phase IV a 10% 90%
Phase V a 0% 100%
XE Plantation Phase I 100% 0%
Phase II 100% 0%
Location Flowering Vegetative
14
Nursery Operation:
The 3rd batch of oil palm seeds are sourced from Thailand. All seedlings were already
sold. Palm Oil Mill
A total of 2,905.39 metric tons of fresh fruit bunches derived from internal and external sources were processed for the first quarter of 2016, compared to 6,675.83 metric tons in the same period of last year. This is average of 968.46 metric tons of fresh fruit bunch processed per month as against 2,225.28 of the same period last year. The yield for the first quarter of this year was 509.77 metric tons of crude palm oil with an average oil extraction rate of 17.55% as compared to 1,110.82 metric tons having an average extraction rate of 16.64% for the same period last year.
The kernels that produced totaled to 100.40 metric tons as compared to 161.04
metric tons of last year. Refined Bleached Deodorized Oil (RBDO) Plant For the 1st quarter of 2016, the refinery produced a total of 612.20 MT of RBDO compared to 419.71 MT of the same period last year. Of the 612.20 metric tons of RBDO produced, 20.16 metric tons were sold and the rest were processed further into Palm Olein and Palm Stearin. There were no production of Palm Olein and Palm Stearin in the same period of last year.
In addition, 45.99 metric tons of Palm Fatty Acid Distillate was produced and sold 129.66 metric tons in the first quarter of this year. This by product is generated during production of RBDO. Fractionation Plant The production of Palm Olein and Palm Stearin started in June 2015. Crude Palm Oil produced is further processed into Refined Bleached and Deodorized Oil, the raw material of Palm Olein and Palm Stearin. In the first quarter of 2016, there were 271.67 metric tons of Palm Olein and 106.91 metric tons of Palm Stearin produced. The quantity sold during the first quarter were 314.49 metric tons of Palm Olein and 309.06 metric tons of Palm Stearin. Power Generation Coal-Fired Power Project
Palm Concepcion Power Corporation (PCPC) whose outstanding capital stock has been acquired by Palm Thermal Consolidated Holdings Corp. (PTCHC) in 2010 – is the project company that is currently constructing and will be operating a 135-megawatt coal-fired power plant in Concepcion, Iloilo. This project will be a base-load plant and will make use of Circulating Fluidized Bed Combustion (CFBC) technology.
While only 135-megawatt is on a firm basis, the plant site and support units are programmed for two (2) units. The preparation for the second unit is projected to begin two to three (2 to 3) years after commissioning of the first unit if the power market in the region continues to expand as projected.
PCPC signed an agreement to tap the services of SNC - Lavalin, Inc., a global leader in the field of Engineering, Construction and Operations, as its Owner’s Engineer of the project in the early second quarter of 2012. SNC-Lavalin is providing technical advisory from the engineering stage up to the completion of the power project. Its services cover detailed engineering that will include review and evaluation of Engineering Procurement and Construction (EPC) specifications, system’s design parameters and operating features and
15
development of conceptual layouts, among others. In early October 2012, PCPC signed a Connection Agreement with the National Grid Corporation of the Philippines (NGCP). This connection agreement paves the way and ensures dispatch of PCPC’s generation output to its customers via the facilities of system operator NGCP.
ABCI together with its subsidiaries, by then: PTCHC, PCPC and Panay Consolidated Land Holdings Corporation (PCLHC) signed a Memorandum of Agreement with AC Energy Holdings, Inc. (ACEHI) last September 2012. Towards the end of October 2012, PTCHC together with other principal stockholders of PCPC namely: ACEHI and Jin Navitas Resource, Inc. (JNRI) finalized and executed their Shareholders’ Agreement to document and implement the PCPC shareholders’ respective agreements and undertakings, including the constitution of PCPC as the Project Company as well as to confirm the terms and conditions by which PCPC will be owned, managed and controlled, and by which PCPC shall implement the development and operation of its power generation project.
To implement the Shareholders Agreement, ABCI transferred all of its equity interest in PCLHC to its other wholly-owned subsidiary, PTCHC. With this, PCLHC ceased to be a direct subsidiary of ABCI. At the same time, ACEHI, JNRI and PTCHC subscribed to the remaining Nine Million shares (9 M shares) of PCLHC. As a result of these new subscriptions, PCLHC mirrored the same equity structure as that of PCPC, i.e. 30% PTCHC, 30% JNRI and 40% ACEHI as of end of 2012.
Last January 15, 2013, PCPC had its official ground breaking ceremony to launch the project. NLSC- the consortium of First Northeast Electric Power Engineering Corp. of China (NEPC), Liaoning Electric Power Survey & Design Institute and Shenyang Electric Power Design Institute Co., Ltd.- is the project’s general engineering, procurement and construction (EPC) contractor. Alstom Power of Europe, one of the world’s foremost suppliers of steam turbines and power generation equipment, will provide the steam turbine and generator for this project. SNC-Lavalin is also tapped as the Project Construction Manager.
However, as a result of ACEHI’s strategic decision to focus on its other existing power imminent in its development pipeline, PTCHC and ACEHI agreed the acquisition by PTCHC of ACEHI’s 40% interest in the 135-megawatt coal-fired power plant project in Iloilo on May 2013.
The financial closing was completed last July 2013 when lending banks: China Banking Corporation (Php 3.5B); Asian United Bank (Php 2.5B) and BDO Unibank, Inc. (Php 4B) signed the term loan financing totaling Php 10B to partially finance the Engineering, Procurement and Construction (EPC) and finance costs of the project. BDO Capital & Investment Corporation acted as the Lead Arranger and Sole Bookrunner for the term loan facilities.
During the third quarter of 2014, the SEC approved the Plan of Merger of PCPC and PCLHC with PCPC as the surviving entity as well as the increase in authorized capital stock (ACS) of PCPC. The merger and the increase in ACS resulted to the Company’s 30% equity interest in PCPC.
On January 6, 2015, the SEC approved PCPC’s application of the increase in authorized capital stock to 6,000,000,000 shares divided into 1,500,000,000 common shares and 4,500,000,000 redeemable preferred shares both with a par value of P1.00 per share which reduced PTCHC equity interest in PCPC to 20%.
PCPC’s power plant will be synchronized with the Visayas grid by last week of April 2016, and will be delivering power supply to its customers in Panay, Negros and the rest of Visayas. Synchronization will be done in coordination with NGCP. Currently, the planning for the second unit is in the advanced phase. The company is scheduled to have its reliability tests run in second quarter and once this is completed, the first unit of the 2 X 135-MW plant will be up for full commercial operations.

16
Bunker-Fired Power Project In 2013, Peakpower Energy, Inc. (PEI) was formed to implement projects designed to
generate peaking energy spread across various A+/Green rated electric cooperatives in Mindanao. These are Build-Operate-Maintain and Transfer agreements for brand new bunker-fired engines, which will last for 15 years through its subsidiaries as operating units: Peakpower Soccsargen (PSI) and Peakpower San Francisco, Inc.
Peakpower Soccsargen Inc. (PSI) Peakpower Soccsargen Inc. (PSI) is a 20.9MW Power Plant located in General Santos
City. It has a 15-year BOMT agreement with the South Cotabato II Electric Cooperative Inc. (Socoteco 2). Socoteco 2 is the largest distribution utility in Mindanao and its franchise area includes General Santos City, the municipalities of Glan, Malapatan, Alabel, Makungon, Kiamba, Maasim and Maitum in Saranggani and the municipalities of Polomolok and Tupi in South Cotabato.
The Energy Regulatory Commission issued the PSI Certificate of Compliance on
December 1, 2014. Its commercial operation started last January 27, 2015. Peakpower San Francisco Inc. (PSFI) Peakpower San Francisco Inc. (PSFI) is a 5.2MW Power Plant located in San Francisco,
Agusan del Sur. It has a 15-year BOMT agreement with the Agusan del Sur Electric Cooperative Inc. (Aselco). Aselco’s franchise area includes the municipalities of San Francisco, Prosperidad, Rosario, Trento, Bunawan, Veruela, Sta. Josefa, Loreto, Sibagat, Esperanza, Talacogon, La Paz, San Luis and Bayugan City. San Francisco serves as the primary commercial and service center in the province of Agusan del Sur, being situated at the crossroads leading to other production centers in the region.
The commercial operation of the 5.2MW power plant started on February 2015 as
targeted. Peakpower Bukidnon Inc. (PBI) Peakpower Bukidnon Inc. (PBI) was incorporated for a 15-year Build-Operate-Maintain
and Transfer agreement with the Bukidnon II Electric Cooperative Inc. (Buseco) on July 24, 2014. PBI and Buseco signed a Power Purchase and Transfer Agreement for 10.4MW Diesel/Bunker-fired power plant to be constructed in Manolo Fortich, Bukidnon on August 22, 2014. Buseco’s franchise area is located in the highlands of Bukidnon province, which is considered to be the food basket of the Philippines and is home to some of the largest food processing companies in the country. The franchise includes the municipalities of Baungon, Cabanglasan, Impasug-ong, Lantapan, Libona, Malitbog, Manolo Fortich, Sumilao, Talakag, and Barangay Lilingayon. The Environmental Compliance Certificate (ECC) was approved by the DENR-EMB X and issued on September 21, 2015. The PBI power plant target commercial operations was moved to December 2016.
On July 29, 2015, the BOD approved the sale of company’s 100% interest in PBI to its
associate Peakpower Energy, Inc. (PEI). This is to consolidate all its peaking projects under one holding company. The execution agreements were signed on October 16, 2015.
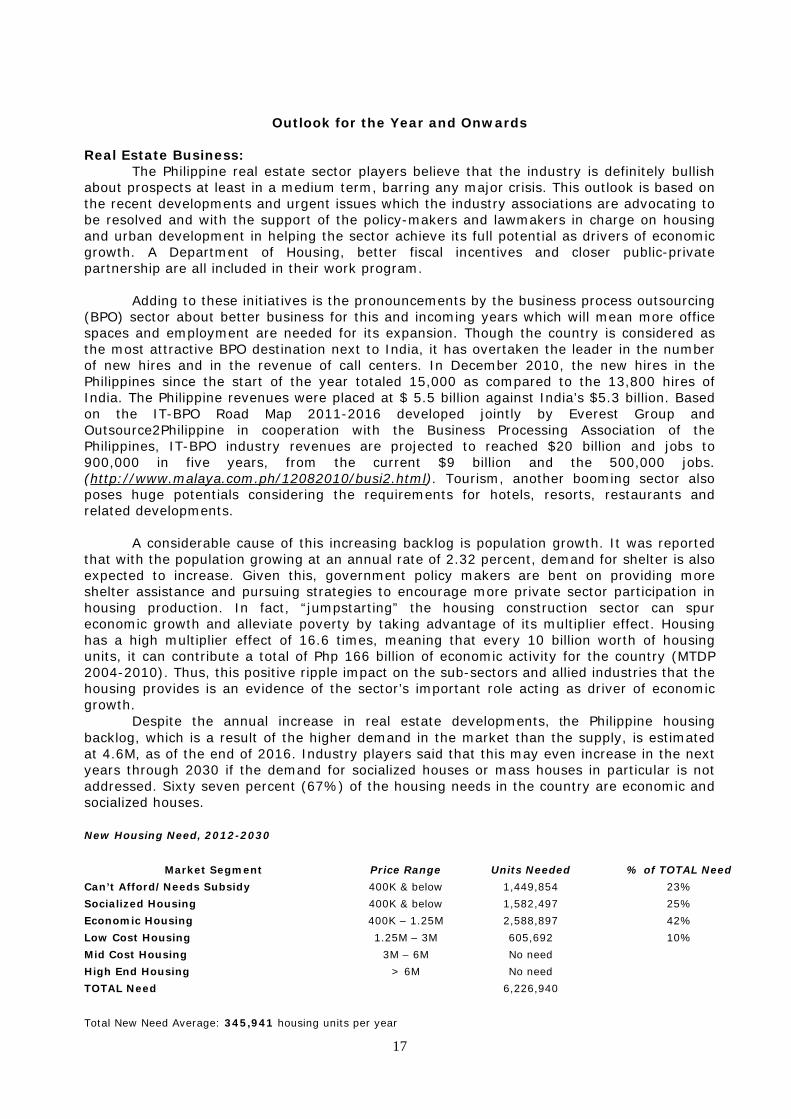
17
Outlook for the Year and Onwards
Real Estate Business: The Philippine real estate sector players believe that the industry is definitely bullish about prospects at least in a medium term, barring any major crisis. This outlook is based on the recent developments and urgent issues which the industry associations are advocating to be resolved and with the support of the policy-makers and lawmakers in charge on housing and urban development in helping the sector achieve its full potential as drivers of economic growth. A Department of Housing, better fiscal incentives and closer public-private partnership are all included in their work program.
Adding to these initiatives is the pronouncements by the business process outsourcing
(BPO) sector about better business for this and incoming years which will mean more office spaces and employment are needed for its expansion. Though the country is considered as the most attractive BPO destination next to India, it has overtaken the leader in the number of new hires and in the revenue of call centers. In December 2010, the new hires in the Philippines since the start of the year totaled 15,000 as compared to the 13,800 hires of India. The Philippine revenues were placed at $ 5.5 billion against India’s $5.3 billion. Based on the IT-BPO Road Map 2011-2016 developed jointly by Everest Group and Outsource2Philippine in cooperation with the Business Processing Association of the Philippines, IT-BPO industry revenues are projected to reached $20 billion and jobs to 900,000 in five years, from the current $9 billion and the 500,000 jobs. (http://www.malaya.com.ph/12082010/busi2.html). Tourism, another booming sector also poses huge potentials considering the requirements for hotels, resorts, restaurants and related developments.
A considerable cause of this increasing backlog is population growth. It was reported
that with the population growing at an annual rate of 2.32 percent, demand for shelter is also expected to increase. Given this, government policy makers are bent on providing more shelter assistance and pursuing strategies to encourage more private sector participation in housing production. In fact, “jumpstarting” the housing construction sector can spur economic growth and alleviate poverty by taking advantage of its multiplier effect. Housing has a high multiplier effect of 16.6 times, meaning that every 10 billion worth of housing units, it can contribute a total of Php 166 billion of economic activity for the country (MTDP 2004-2010). Thus, this positive ripple impact on the sub-sectors and allied industries that the housing provides is an evidence of the sector’s important role acting as driver of economic growth.
Despite the annual increase in real estate developments, the Philippine housing backlog, which is a result of the higher demand in the market than the supply, is estimated at 4.6M, as of the end of 2016. Industry players said that this may even increase in the next years through 2030 if the demand for socialized houses or mass houses in particular is not addressed. Sixty seven percent (67%) of the housing needs in the country are economic and socialized houses.
New Housing Need, 2012-2030
Market Segment Price Range Units Needed % of TOTAL Need Can’t Afford/Needs Subsidy 400K & below 1,449,854 23% Socialized Housing 400K & below 1,582,497 25% Economic Housing 400K – 1.25M 2,588,897 42% Low Cost Housing 1.25M – 3M 605,692 10% Mid Cost Housing 3M – 6M No need High End Housing > 6M No need TOTAL Need 6,226,940
Total New Need Average: 345,941 housing units per year

18
Estimated Backlog by 2030* Those who can’t afford 832,046 Backlog, as of 2011 3,087,520 Total Housing Backlog, as of 2011 3,919,566 New Housing Need, 2012-2030 (345,941 units/yr X 18 yrs.) 6,226,540 Housing Production Capacity (200,000 units/yr X 18 yrs.) 3,600,000 Backlog by 2030 6,546,106
*If no special housing program is created.
Source: http://industry.gov.ph/industry/housing/
The issuance of the BIR Revenue Regulation No.16-2011 dated October 27, 2011 which was effective starting January 1, 2012 eliminated the burden of those prospective clients who will acquire residential property to pay the value added tax (VAT) of 12% for the gross selling price not exceeding Php 1,919,500.00 for the sale of residential lot and the gross selling price not exceeding Php 3,199,200.00 for the sale of residential house and lot. The Bureau responded the call to ease the imposition of VAT in consideration of the inflation for the last six years from the time of the passage of Republic Act 9337.
While pursuing new projects, the Company will continue to roll-out new phases in its
existing project called Xavier Estates. It will expand its product offerings to build up its portfolio across a wider market. This will be complemented by intensified sales and marketing efforts to broaden market reach and tap the growing market of overseas-based Filipinos.
The management is also optimistic that sales will increase in 2016 due to steady
global demand for Filipino labor. There is also an increasing demand from local professionals investing in affordable housing projects especially with the support from the local banks and PAG-IBIG for more affordable housing loan rates.
ABCI will complete the development of the property in Initao, Misamis Oriental (Coral
Resort Estates) and in Butuan City (West Highlands). ABCI will also venture on socialized and economic housing projects tapping the facility of PAG-IBIG and the National Home Mortgage as well as the banks through end-buyers’ financing. For 2016 onwards, the company will launch Mountain View Homes expansion, Adelaida Residences and Simple Homes developments in Cagayan de Oro City (Mambuaya), Butuan City (Brgy. Bancasi), Bukidnon (Valencia City and Malaybalay City), Rizal (Tanay), and Davao City (Toril). The shift in focus from high-end real estate developments to middle income economic housing and socialized housing projects will take advantage of the housing backlog in these sectors.
Palm Oil Business: The palm oil industry is a promising enterprise as the palm oil continuously being considered as the most important tropical vegetable oil in the global oils and fats industry, in terms of production and trade. It accounts for about 31%, ahead of soybean oil with 28% and rapeseed oil with 19%. Aside from its many food and non-food applications, it has been promoted as a feedstock for the production of biofuels in response to the depletion of world’s reserve on fossil fuels and skyrocketing price of oil in the world market. The significant growth of palm oil production, consumption and market share is also to a large extent due to its cost competitiveness and its inherent crop productivity yielding from 3.80 to 5 tons per hectare with minimum land utilization which is 9.3, 7.6 and 5.8 times higher than soybean oil, rapeseed oil and sunflower oil, respectively (Oil World 2008). Thus, it has been viewed as the cheapest, versatile and most productive oil among the three vegetable oils.
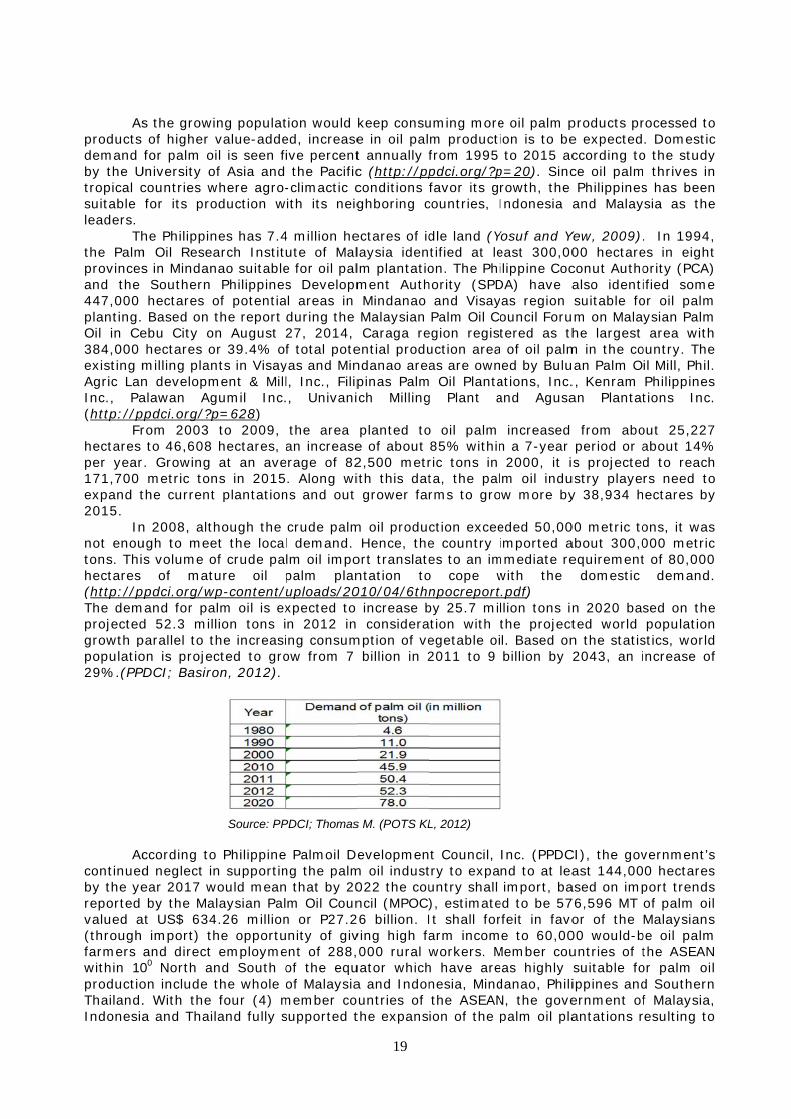
Asproducts demand by the Utropical csuitable leaders. Ththe Palmprovincesand the 447,000 planting. Oil in Ce384,000 existing mAgric LanInc., Pa(http://p
Frhectares per year171,700 expand t2015.
Innot enoutons. Thihectares (http://pThe demprojectedgrowth ppopulatio29%.(PPD
Ac
continuedby the yereported valued a(through farmers within 10productioThailand.Indonesia
s the growi of higher for palm o
University ocountries wfor its pro
he Philippinm Oil Reseas in Mindan Southern hectares o Based on ebu City o hectares omilling plann developmalawan Agppdci.org/?prom 2003 to 46,608 r. Growing metric tonthe current
n 2008, althugh to mees volume o of mat
ppdci.org/wmand for pad 52.3 milparallel to ton is projecDCI; Basiro
ccording tod neglect inear 2017 w by the Ma
at US$ 634 import) thand direct 00 North anon include t. With the a and Thai
ing populatvalue-addeil is seen f
of Asia and where agro-oduction w
nes has 7.4arch Institnao suitable Philippinesof potentiathe report n August
or 39.4% ofnts in Visayment & Millgumil Inc.p=628) to 2009,
hectares, at an ave
ns in 2015t plantation
hough the et the locaof crude paure oil
wp-content/alm oil is exlion tons ithe increasicted to groon, 2012).
Source: PP
o Philippinen supportin
would meanlaysian Pal
4.26 millionhe opportu employmend South othe whole four (4) mland fully s
tion would ed, increaseive percent the Pacific-climactic cith its neig
4 million heute of Male for oil pals Developml areas in during the 27, 2014, f total pote
yas and Minl, Inc., Filip., Univani
the area an increase
erage of 82. Along wi
ns and out
crude palml demand. lm oil impopalm planuploads/20xpected to n 2012 in ing consumow from 7
PDCI; Thomas
Palmoil Deng the palmn that by 20m Oil Counn or P27.2unity of givent of 288,of the equof Malaysia
member cosupported t
19
keep consue in oil palt annually fc (http://ppconditions ghboring c
ectares of idlaysia idenlm plantatioment Auth Mindanao Malaysian Caraga reential produndanao areapinas Palmch Milling
planted toe of about 2,500 metrith this dat grower fa
m oil produ Hence, theort translatentation to010/04/6thn increase b considera
mption of ve billion in 2
s M. (POTS KL
evelopmenm oil indust022 the council (MPOC
26 billion. Iving high fa000 rural
uator whicha and Indonuntries of the expans
uming morem productifrom 1995 pdci.org/?pfavor its g
countries, I
dle land (Ytified at leon. The Phihority (SPD and Visay Palm Oil Coegion registuction areaas are own
m Oil Plantag Plant a
o oil palm 85% withinric tons in ta, the palrms to gro
ction exceee country ies to an imo cope wnpocreportby 25.7 mition with egetable oi2011 to 9
L, 2012)
t Council, try to expauntry shall ), estimateIt shall forarm incomworkers. Mh have arenesia, Mindthe ASEANion of the
e oil palm pion is to be to 2015 acp=20). Sincrowth, the Indonesia
Yosuf and Yeast 300,00ilippine CocDA) have ayas region ouncil Forutered as th of oil palmed by Bulu
ations, Inc.and Agusa
increased n a 7-year 2000, it im oil induw more by
eded 50,00imported a
mmediate rewith the t.pdf) llion tons ithe projectl. Based onbillion by
Inc. (PPDCnd to at lea import, baed to be 57rfeit in favoe to 60,00
Member coueas highly danao, PhiliN, the govepalm oil pla
products pre expectedccording toce oil palm Philippinesand Malay
Yew, 2009)00 hectareconut Authoalso identisuitable fo
um on Malahe largest
m in the couan Palm O., Kenram an Plantat
from abo period or ais projectedustry playey 38,934 h
00 metric toabout 300,0equirement
domestic
n 2020 basted world n the statis2043, an i
CI), the govast 144,00
ased on imp76,596 MT or of the 00 would-buntries of tsuitable foippines andernment ofantations r
rocessed to. Domestic
o the studym thrives ins has been
ysia as the
. In 1994,es in eightority (PCA)ified someor oil palmysian Palm area withountry. Theil Mill, Phil.Philippinestions Inc.
out 25,227about 14%d to reachrs need to
hectares by
ons, it was000 metrict of 80,000
demand.
sed on thepopulation
stics, worldncrease of
vernment’s0 hectaresport trendsof palm oilMalaysians
be oil palmthe ASEANor palm oild Southernf Malaysia,resulting to
o c y
e
t
7
o y
e
f
20
significant reduction in poverty, and high export generation. In contrast, the Philippine government neglected the palm oil industry resulting to huge palm oil importation to meet domestic demands, now at P6.68 billion annually.
In the PPDCI report presented during the Malaysian Palm Oil Council Forum on Malaysian Palm Oil last August 2014, the country with an estimated 1,000,000 hectares of potential area for planting palm oil has only 73,340 (as of April 2013) hectares planted, lagging behind as compared to 625,000 hectares in Thailand. The neighboring countries has exported palm oil amounting to US$ 400 million (Thailand), US$ 17 billion (Malaysia), US$ 15 billion (Indonesia) while the Philippines imported US$ 225 million at P6.68 billion in 2010 and to increase to P27.26 billion in 2022. (http://ppdci.org/?p=628)
Given the current domestic demand and supply conditions and projected growth in incoming years, there will be disparity between production and consumption which needs to be addressed. To respond to the lack of adequate local production, the management has targeted to develop 2,000 hectares of oil palm plantation in Kalabugao, Impasug-ong, Bukidnon in 3-5 years time as targeted in 2010. As of the end of the 1st quarter of 2016, about 3,743 (gross area) hectares were already acquired for development, of which almost 1,592 hectares were planted while about 1,105 hectares are prepared to be available for planting. The company is anticipating the signing of agreements with local communities in Misamis Oriental for its expansion program aggregating to 3,000 hectares. Due to the synergy and tax efficiency, ABERDI and Nakeen Corp. applied for an Amended Articles and Plan of Merger as approved by its Board of Directors and shareholders.
Our refinery with fractionation machine is now operational in full capacity 50 MT/day. Likewise, we are producing Palm Olein, Palm Stearin and Palm Fatty Acid Distillate in bulk sales. Expansion will be determined and decided this year as we move forward in the coming years. This year, the company’s thrust is to engage in branding and packaging of premium cooking oil and shortening. Our strategic Route to Market design is divided into two (2) service packages. First service package is direct serve outlets which will cover industrial or food processing companies, supermarkets, hypermarts, wholesalers, groceries, catering services, hotels and restaurants around Mindanao region. Second service package will be indirect serve outlets like sari-sari stores, traditional food outlets, mini marts, direct household consumptions or specials events markets will serve by our potential trade execution partners. This way, our customer and consumers will enjoy our quality service to best quality products.
Power Generation: The energy requirements of the Philippines, especially Visayas and Mindanao, have been a significant undertaking of the government as it looks to attract more investments and pursue industrialization.
In the energy sector, the objectives are to raise energy capacity, achieve a reliable and adequate supply of electric power, and expand rural electrification in the country. To sustain the current growth momentum and support the anticipated expansions in investment, power supply must be kept sufficient; policies and guidelines must remain harmonious across concerned government and private agencies regarding the exploration, development, utilization and conservation of natural resources for energy projects.
As was the case from the year prior, 2016 remains within the critical period for the Visayas Grid where additional capacity will be needed to avert shortages. This can be attributed to the strong economic growth in the region which can be seen in the fast demand expansion recorded in distribution utilities in Panay, Cebu, and Bohol. Based on projected figures by the Department of Energy, the five-year average annual growth rate (AAGR) from 2010-2014 stands at 5.79%, higher than the 20-year (1995-2014) AAGR of 5.68% and the 10-year (2005-2014) AAGR of 5.61%. The continued growth within the region will entail higher demands for power generation. Apart from increased economic activity, relief from
21
generation deficiency in previous years is also another factor that pushed the demand to record levels. Power demand in the Visayas is expected to be at 5.05% Average Annual Compounded Growth Rate (AACGR) from 2014 until 2023.
Meanwhile, the Mindanao grid posted an AACGR of 3.28% for 2001-2013. After recording high annual growth rates from 2000 to 2004 (an average of 5.76%), demand growth has been sluggish from 2005 to 2010 due to the overall reduced power requirement from large non-utility customers. In the recent years, demand dropped in 2008, 2010 and 2012. 2008 was characterized by the large decrease in the demand of non-utility customers, possibly a direct effect of the global financial crisis, which adversely affected exporting industries. On the other hand, due to the El Niño that hampered hydropower generation, the grid has been experiencing under-generation that has impeded demand growth in 2010 and 2012. The existing capacity in the region is composed of more than 50% hydroelectric power plant, along with bulk base load power from coal-fired power plants. Based on DOE projections, a total of 1.600MW additional capacity is needed in the planning period to meet the electricity demand and the required reserve margin of the grid.
Even as the reported AAGR of 2014 (2.89%) was lower than 2013 (8.08%), the positive value can attest to the continued growth and positive forecasts within the Mindanao grid.
The new projects and expansions for power and infrastructure will be financed through a combination of self-generated equity, joint ventures and partnerships, and project financing.
Coal-Fired Power Project:
To fill the anticipated tight power supply situation in Panay and the Visayas grid by
2016 as economic activity continues to expand in the area, a 2 x 135MW coal-fired power plant project in Concepcion, Iloilo was proposed and project implementation is at 90% as of December 2015. The power plant will be synchronized with the Visayas grid in coordination with NGCP by last week of April 2016, and will be delivering power supply to Panay, Negros, and the rest of Visayas.
Target date for commissioning of the first unit is June 2016. Once reliability tests have been completed, the first unit will be up for full commercial operations. Ten (10) distribution utilities and electric cooperatives have signed up with PCPC for their baseload power capacity requirements in order to deliver reliable and stable power generation supply to industrial, commercial, and residential consumers.
Preparations for the second unit are also underway, with construction estimated to take two to three years after commissioning of the first unit. Bunker-Fired Power Project:
The island of Mindanao has continuously experienced power shortage due to the inadequate supply of power generation capacities. This bunker-fired power project addresses the lack of base load power in the Mindanao grid for the next 2 to 3 years and in the future to allow the cooperatives to meet the needs for peaking power.
Peakpower Energy, Inc. was set up in 2013 to implement projects designed to generate peaking energy across various A+/Green rated electric cooperatives in Mindanao. These are Build-Operate-Maintain and Transfer agreements for brand new bunker-fired engines, which will last for 15 years.
After signing a power purchase and transfer agreement for 20-megawatt of peaking power supply with South Cotabato II Electric Cooperative and 5-megawatt with Agusan del Sur Electric Cooperative in 2013, the respective plants Peakpower Soccsargen, Inc. (PSI) and

22
Peakpower San Francisco, Inc. (PSFI) are commercially operational, supplying the very much needed power capacities in their franchise areas.
Preparations are underway for the expansion of the two plants, with contracting and equipment procurement slated for first quarter of 2016. The necessary planning stages and studies are also being undertaken for a third plant, 2 x 5.2MW Peakpower Bukidnon, Inc. with Bukidnon Second Electric Cooperative (BUSECO).
Hydro Power Project:
The Carac-an Hydropower Project will explore the hydropower potential of the Carac-an River in the northern part of Surigao del Sur. After the signing of the hydropower service contract with the Department of Energy (DOE), the company has proceeded with the processing of the necessary permits in coordination with local government officials for their support of the project.
The feasibility study has been completed as part of the pre-development activities, in compliance to the service contract requirements. The report projected an optimal capacity of 16.3 MW with estimated annual energy generation of 78.9 GWh.
The output of the power station is proposed to be connected to the nearest substation of the Surigao del Sur Electric Cooperative II (SURSECO II) in Madrid substation. It currently has a peak demand of about 13MW; excess power can be sold to other customers around the Mindanao grid.
For 2016, further studies and investigations will be conducted in compliance to all government requirements, such as environmental impacts study and presentations to local government units.
Likewise, the company will continue to look for other projects similar to this, in the light of the much-needed additional power capacities for the green-rated cooperatives in Mindanao.
Bulk Water Project
AB Bulk Water Company, Inc. (ABWCI) was incorporated on March 31, 2015 to
engage in the business of holding and providing rights to water to public utilities and cooperatives or in water distribution in the Municipality of Opol, securing any needed licenses to engage in such business activities and purchasing or otherwise acquiring, for the purpose of holding or disposing of the same, shares of stock, equity, rights, and property of any person, firm, association, or corporation engaged in industries or activities related to water development, paying for the same in cash, shares of stocks, or bonds of this corporation.
ABWCI is pursuing the proposed Bulk Water Supply Project for the Municipality of Opol in Misamis Oriental. The Project which will tap the water resources of Lumayagan River aims to supply about 15 to 20 MLD of potable water to cater the present and future requirements of the municipality. Other potential service areas include the neighboring municipalities of Opol – the city of El Salvador, and the municipalities of Alubijid, Laguindingan, and Gitagum. Based on the study, these are potential growth areas.
Pre-feasibility study has been completed confirming the technical viability of the project. Likewise, the detailed engineering design has been completed
23
Impact of Economic/Political Uncertainties: The Company’s performance will continue to hinge on the overall economic
performance of the country. Interest rate movements may affect the performance of the real estate industry, including the Company. Good governance will definitely lead to better economy and better business environment and vice-versa. Political stability encourages people to work better and spend more and the investors to infuse funds for additional investment. Given the other positive economic indicators like recovery in exports, sustained rise in remittances and growing liquidity in the domestic financial market, the monetary officials agree that the government’s projected growth targets is attainable.
The average headline inflation rate for full year 2015 slowed down to 1.4% from the previous rate of 4.1% (using the 2006-base price). Inflation for 2015 was below the government’s target range of 2%-4%. The generally low inflation environment was largely due to favorable supply-side factors such as relatively lower domestic retail prices of corn, oil and rice; lower international oil prices and the contraction in the prices of housing and other utilities. Head inflation rate is the percent increase in the prices of goods and services commonly purchased by households, as measured by the Consumer Price Index (CPI). Core inflation represents a more long-term inflation trend, as it excludes certain items that have volatile price movements. The annual average core inflation declined at 2.1% in 2015 as compared to the 3.0% in 2014. For 2016, the inflation target of the Development Budget Coordination Committee (DBCC) is between 2 to 4 percent, (at 3% plus or minus 1 percentage point for 2016 to 2018). The current low inflation target could be sustained over the medium term as underlying structural inflation dynamics are favorable with the improved ability of the domestic economy to accommodate supply shocks.
In 2015, the country’s full year real GDP growth was 5.8% (growth rates at constant 2000 prices) short of the government’s 7% to 8% target and slower than the 6.1% in 2014 and 7.2% growth in 2013. Nonetheless, it still remains as one of the best performing economies in the Asian region. On the supply side, while the services remained the key driver of growth, industry output remained firm and agriculture sector managed to grow slightly amid extreme weather conditions. On the demand side, growth was driven by private demand, strong capital formation and remarkable improvement in government spending. Sustained low inflation environment, decline in oil prices, better employment figures, and continued remittance inflows provide strong support to household consumption. The impact of weak net exports dragged down the GDP growth rate with -3.1 percentage points. Philippine economy is perceived to remain strong in 2016 with the government’s 6.8% to 7.8% growth target which believed to be attainable given domestic demand remains firm and supported by brewing production efficiency and robust labor market dynamics. Structural and policy reforms will continue to be implemented by the new administration. Spending will accelerate due to the election season and implementation of government projects. Low prices will also help spur economic growth.
We believe that the Company’s available cash, including cash flow from operations and
drawings from existing and anticipated credit facilities, will provide sufficient liquidity to fund our projected operating, investment, capital expenditures and debt service requirements for the next twelve months. We have also implemented a number of initiatives under our liability management program to meet our debt service requirements in the short and medium term.
The Company does not expect to conduct any product research and development in
the foreseeable future. No extraordinary purchase or sale of plant and equipment are expected beyond those in the regular course of the Company’s operations. The Brown Group of Companies foresees change in the number of employees at around fifteen (15) new employees for 2016 to cover new and/or additional positions, replacement for resigned/(ing) and retired/(ing) employees. Hiring of employees will continue in the regular course of business. There are no events that will trigger direct or contingent financial obligation that is material to the company, including any default or acceleration of an obligation nor material

24
off-balance sheet transactions, arrangements, obligations (including contingent obligations), and other relationships of the company with unconsolidated entities or other persons created during the reporting period.
Material Event/s and Uncertainties: The Company has no other events to report on the following: a) Any known trends, demands, commitments, events or uncertainties that will have a
material impact on its liquidity. b) Any material commitments for capital expenditures. c) Any known trends, events or uncertainties that have had or that are reasonably
expected to have a material favorable or unfavorable impact on net sales/ revenues/ income from continuing operations.
d) Any significant elements of income or loss that did not arise from the issuer’s continuing operations.
e) Any seasonal aspects that had a material effect on the financial condition or results of operations.
f) Any event/s that will trigger direct or contingent financial obligation that is material to the company, including any default or acceleration of an obligation.
g) Any material off-balance sheet transactions, arrangements, obligations (including contingent obligations), and other relationships of the company with unconsolidated entities or other persons created during the reporting period.
The Company has no other information that needs to be disclosed other than disclosures made under SEC Form 17-C (if any).
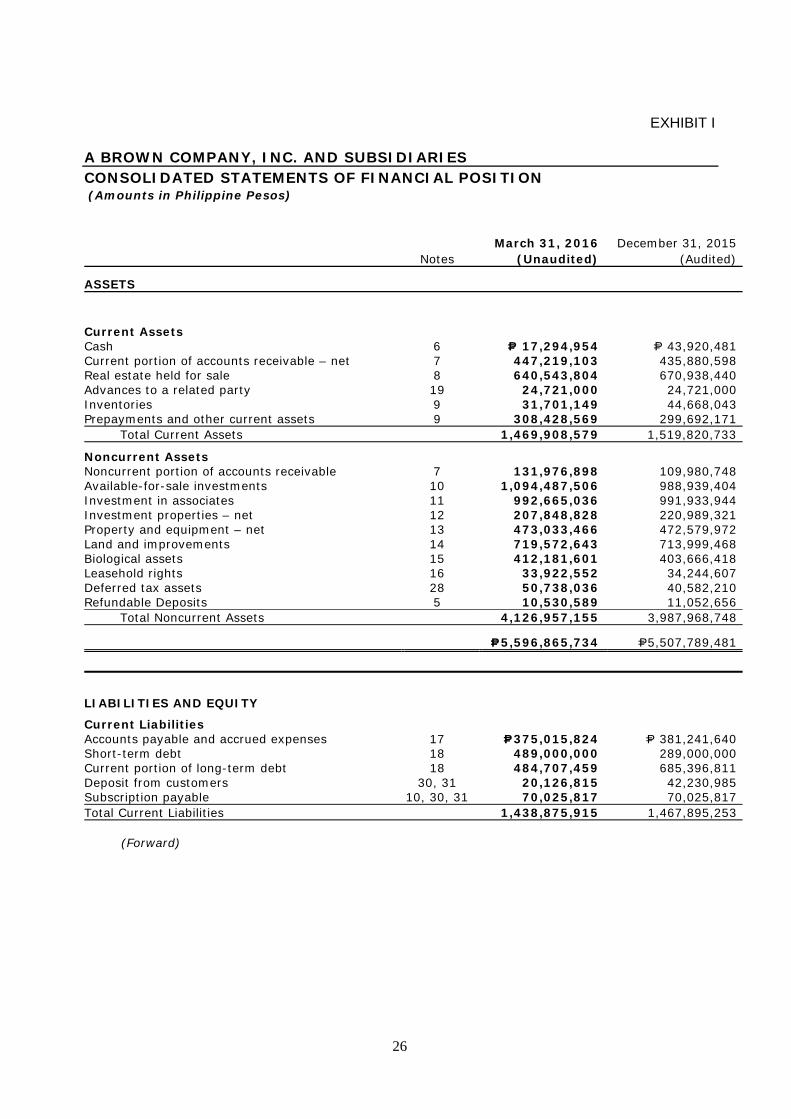
26
EXHIBIT I
A BROWN COMPANY, INC. AND SUBSIDIARIES CONSOLIDATED STATEMENTS OF FINANCIAL POSITION (Amounts in Philippine Pesos)
Notes March 31, 2016
(Unaudited) December 31, 2015
(Audited)
ASSETS
Current Assets Cash 6 P= 17,294,954 P= 43,920,481 Current portion of accounts receivable – net 7 447,219,103 435,880,598 Real estate held for sale 8 640,543,804 670,938,440 Advances to a related party 19 24,721,000 24,721,000 Inventories 9 31,701,149 44,668,043 Prepayments and other current assets 9 308,428,569 299,692,171
Total Current Assets 1,469,908,579 1,519,820,733
Noncurrent Assets Noncurrent portion of accounts receivable 7 131,976,898 109,980,748 Available-for-sale investments 10 1,094,487,506 988,939,404 Investment in associates 11 992,665,036 991,933,944 Investment properties – net 12 207,848,828 220,989,321 Property and equipment – net 13 473,033,466 472,579,972 Land and improvements 14 719,572,643 713,999,468 Biological assets 15 412,181,601 403,666,418 Leasehold rights 16 33,922,552 34,244,607 Deferred tax assets 28 50,738,036 40,582,210 Refundable Deposits 5 10,530,589 11,052,656
Total Noncurrent Assets 4,126,957,155 3,987,968,748
P=5,596,865,734 P=5,507,789,481
LIABILITIES AND EQUITY
Current Liabilities Accounts payable and accrued expenses 17 P=375,015,824 P= 381,241,640 Short-term debt 18 489,000,000 289,000,000 Current portion of long-term debt 18 484,707,459 685,396,811 Deposit from customers 30, 31 20,126,815 42,230,985 Subscription payable 10, 30, 31 70,025,817 70,025,817 Total Current Liabilities 1,438,875,915 1,467,895,253
(Forward)
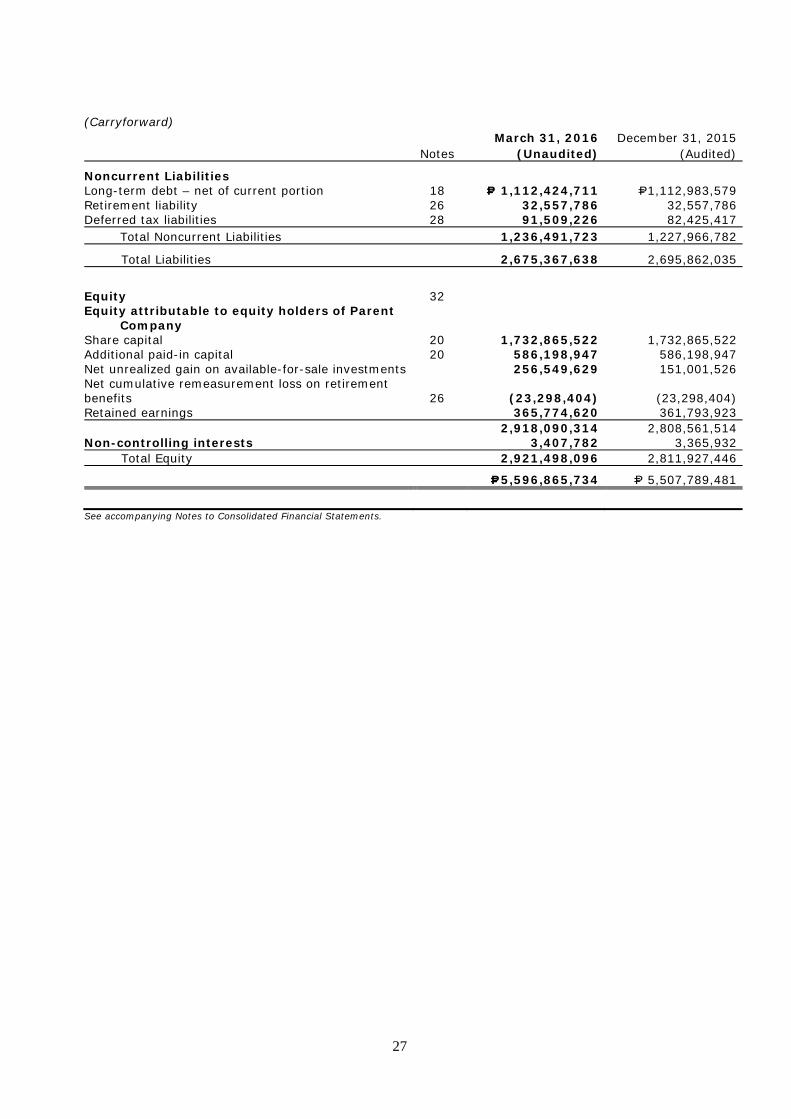
27
(Carryforward)
Notes March 31, 2016
(Unaudited) December 31, 2015
(Audited)
Noncurrent Liabilities Long-term debt – net of current portion 18 P= 1,112,424,711 P=1,112,983,579 Retirement liability 26 32,557,786 32,557,786 Deferred tax liabilities 28 91,509,226 82,425,417
Total Noncurrent Liabilities 1,236,491,723 1,227,966,782
Total Liabilities 2,675,367,638 2,695,862,035
Equity 32 Equity attributable to equity holders of Parent
Company Share capital 20 1,732,865,522 1,732,865,522 Additional paid-in capital 20 586,198,947 586,198,947 Net unrealized gain on available-for-sale investments 256,549,629 151,001,526 Net cumulative remeasurement loss on retirement benefits 26 (23,298,404) (23,298,404) Retained earnings 365,774,620 361,793,923 2,918,090,314 2,808,561,514 Non-controlling interests 3,407,782 3,365,932
Total Equity 2,921,498,096 2,811,927,446
P=5,596,865,734 P= 5,507,789,481
See accompanying Notes to Consolidated Financial Statements.
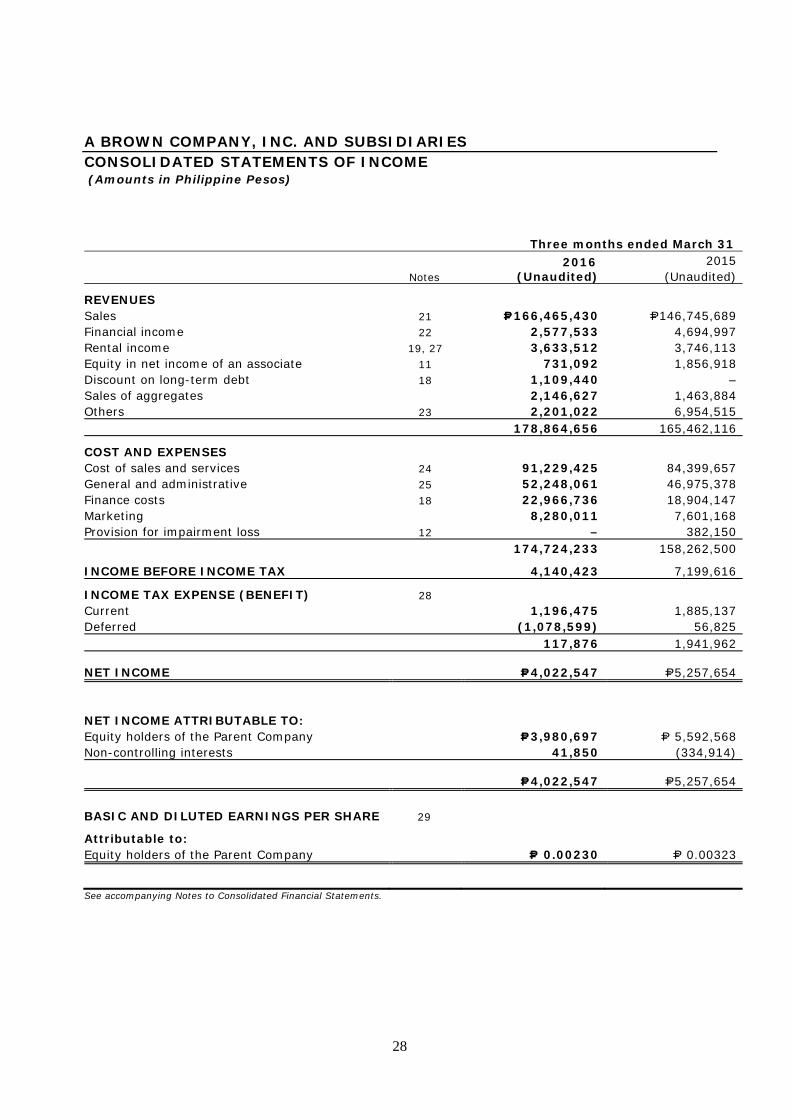
28
A BROWN COMPANY, INC. AND SUBSIDIARIES CONSOLIDATED STATEMENTS OF INCOME (Amounts in Philippine Pesos) Three months ended March 31
Notes 2016
(Unaudited) 2015
(Unaudited)
REVENUES Sales 21 P=166,465,430 P=146,745,689 Financial income 22 2,577,533 4,694,997 Rental income 19, 27 3,633,512 3,746,113 Equity in net income of an associate 11 731,092 1,856,918 Discount on long-term debt 18 1,109,440 – Sales of aggregates 2,146,627 1,463,884 Others 23 2,201,022 6,954,515 178,864,656 165,462,116
COST AND EXPENSES Cost of sales and services 24 91,229,425 84,399,657 General and administrative 25 52,248,061 46,975,378 Finance costs 18 22,966,736 18,904,147 Marketing 8,280,011 7,601,168 Provision for impairment loss 12 – 382,150 174,724,233 158,262,500
INCOME BEFORE INCOME TAX 4,140,423 7,199,616
INCOME TAX EXPENSE (BENEFIT) 28 Current 1,196,475 1,885,137 Deferred (1,078,599) 56,825 117,876 1,941,962
NET INCOME P=4,022,547 P=5,257,654
NET INCOME ATTRIBUTABLE TO: Equity holders of the Parent Company P=3,980,697 P= 5,592,568 Non-controlling interests 41,850 (334,914)
P=4,022,547 P=5,257,654 BASIC AND DILUTED EARNINGS PER SHARE 29
Attributable to:
Equity holders of the Parent Company P= 0.00230 P= 0.00323
See accompanying Notes to Consolidated Financial Statements.
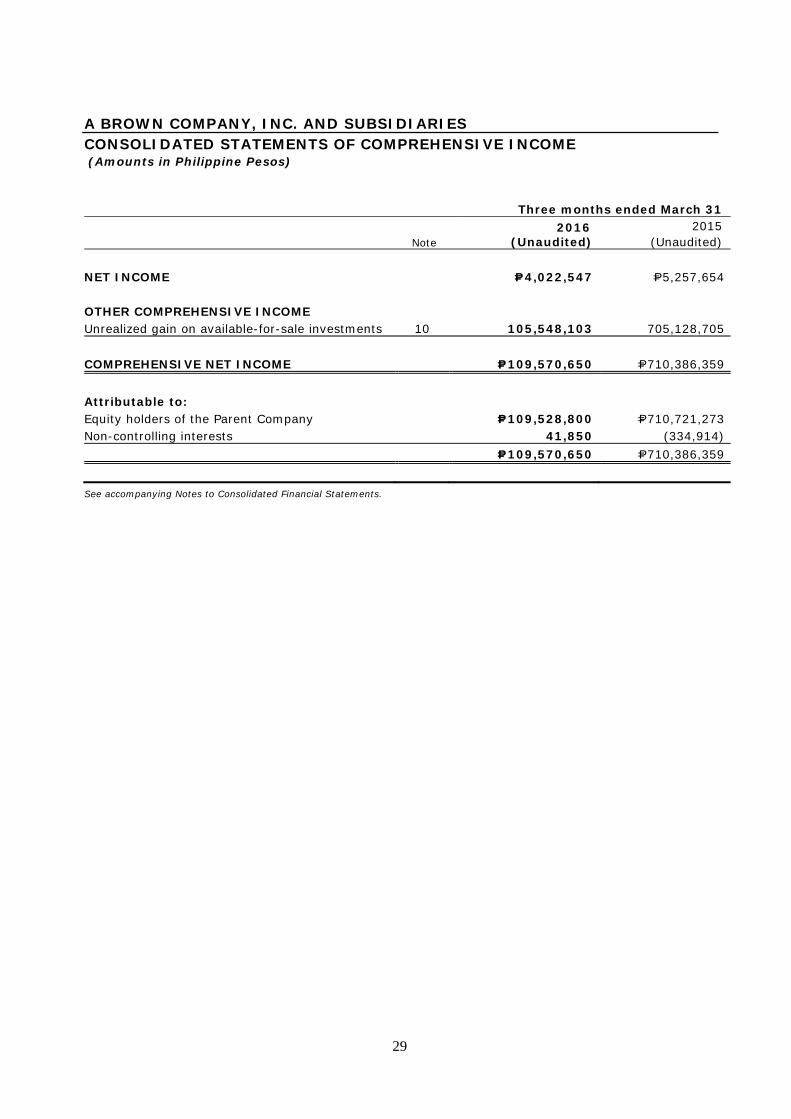
29
A BROWN COMPANY, INC. AND SUBSIDIARIES CONSOLIDATED STATEMENTS OF COMPREHENSIVE INCOME (Amounts in Philippine Pesos) Three months ended March 31
Note 2016
(Unaudited) 2015
(Unaudited)
NET INCOME P=4,022,547 P=5,257,654
OTHER COMPREHENSIVE INCOME Unrealized gain on available-for-sale investments 10 105,548,103 705,128,705
COMPREHENSIVE NET INCOME P=109,570,650 P=710,386,359
Attributable to: Equity holders of the Parent Company P=109,528,800 P=710,721,273 Non-controlling interests 41,850 (334,914)
P=109,570,650 P=710,386,359
See accompanying Notes to Consolidated Financial Statements.
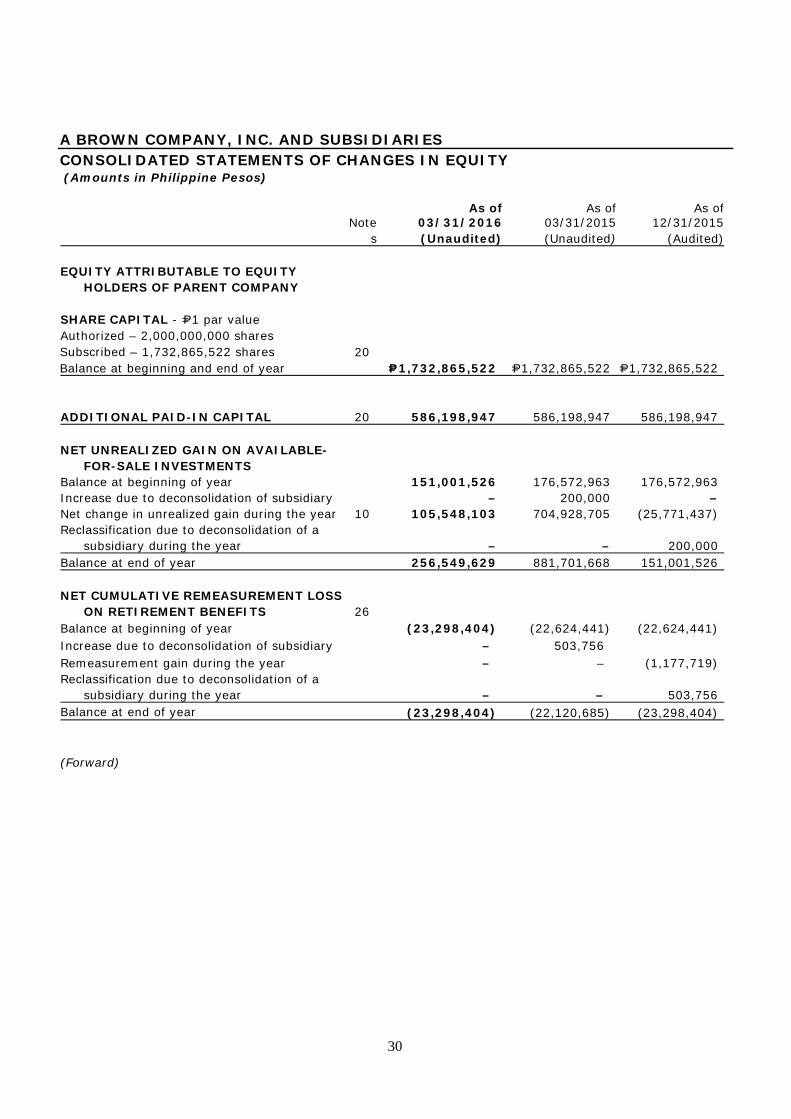
30
A BROWN COMPANY, INC. AND SUBSIDIARIES CONSOLIDATED STATEMENTS OF CHANGES IN EQUITY (Amounts in Philippine Pesos)
Note
s
As of03/31/2016(Unaudited)
As of03/31/2015(Unaudited)
As of12/31/2015
(Audited)
EQUITY ATTRIBUTABLE TO EQUITY HOLDERS OF PARENT COMPANY
SHARE CAPITAL - P=1 par value Authorized – 2,000,000,000 shares Subscribed – 1,732,865,522 shares 20 Balance at beginning and end of year P=1,732,865,522 P=1,732,865,522 P=1,732,865,522 ADDITIONAL PAID-IN CAPITAL 20 586,198,947 586,198,947 586,198,947 NET UNREALIZED GAIN ON AVAILABLE-
FOR-SALE INVESTMENTS Balance at beginning of year 151,001,526 176,572,963 176,572,963 Increase due to deconsolidation of subsidiary – 200,000 – Net change in unrealized gain during the year 10 105,548,103 704,928,705 (25,771,437) Reclassification due to deconsolidation of a
subsidiary during the year – – 200,000 Balance at end of year 256,549,629 881,701,668 151,001,526
NET CUMULATIVE REMEASUREMENT LOSS
ON RETIREMENT BENEFITS 26 Balance at beginning of year (23,298,404) (22,624,441) (22,624,441) Increase due to deconsolidation of subsidiary – 503,756 Remeasurement gain during the year – – (1,177,719) Reclassification due to deconsolidation of a
subsidiary during the year – – 503,756 Balance at end of year (23,298,404) (22,120,685) (23,298,404) (Forward)
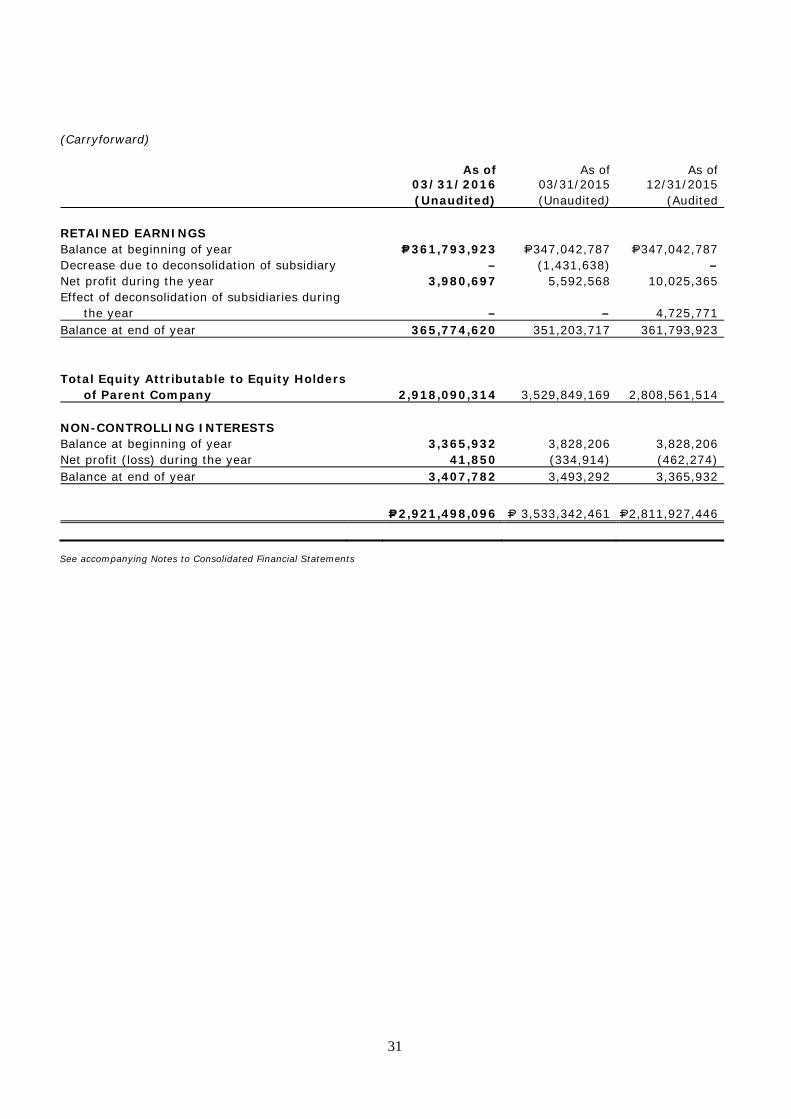
31
(Carryforward)
As of 03/31/2016 (Unaudited)
As of 03/31/2015 (Unaudited)
As of 12/31/2015
(Audited RETAINED EARNINGS Balance at beginning of year P=361,793,923 P=347,042,787 P=347,042,787 Decrease due to deconsolidation of subsidiary – (1,431,638) – Net profit during the year 3,980,697 5,592,568 10,025,365 Effect of deconsolidation of subsidiaries during
the year – – 4,725,771 Balance at end of year 365,774,620 351,203,717 361,793,923 Total Equity Attributable to Equity Holders
of Parent Company 2,918,090,314 3,529,849,169
2,808,561,514 NON-CONTROLLING INTERESTS Balance at beginning of year 3,365,932 3,828,206 3,828,206 Net profit (loss) during the year 41,850 (334,914) (462,274) Balance at end of year 3,407,782 3,493,292 3,365,932 P=2,921,498,096 P= 3,533,342,461 P=2,811,927,446 See accompanying Notes to Consolidated Financial Statements

32
A BROWN COMPANY, INC. AND SUBSIDIARIES CONSOLIDATED STATEMENTS OF CASH FLOWS (Amounts in Philippine Pesos) Three months ended March 31
Note 2016
(Unaudited) 2015
(Unaudited)
CASH FLOWS FROM OPERATING ACTIVITIES Income before income tax and non-controlling
interest P=4,140,423 P=7,199,616 Adjustments for:
Finance costs 18 22,966,736 18,904,147 Discount on long-term debt 18 2,818,759 846,556
Depreciation and amortization 12, 13 6,125,074 8,785,233 Financial income 22 (2,577,533) 4,694,997 Equity in net gain of associate 11 (731,092) (1,856,918) Amortization of leasehold rights 16 322,055 322,055 Provision for retirement benefits – 607,136 Provision for impairment losses 12 – 382,150 Unrealized foreign exchange loss 3,332 10,121
Operating income before working capital changes 33,067,754 39,895,093 Decrease (increase) in:
Accounts receivable 7 (33,328,047) 28,486,058 Real estate held for sale 8 30,394,636 11,001,239 Prepayments and other current assets 9 8,071,379 5,315,516
Increase (decrease) in: Accounts payable and accrued expenses 17 (5,689,501) (32,190,079) Deposit from customers 30, 31 (22,104,170) 1,698,781
Cash provided by operations 10,412,051 54,206,608 Interest received 2,577,533 4,694,997 Income tax paid (5,037,382) (6,679,686) Net cash provided by operating activities 7,952,202 52,221,919 (Forward)
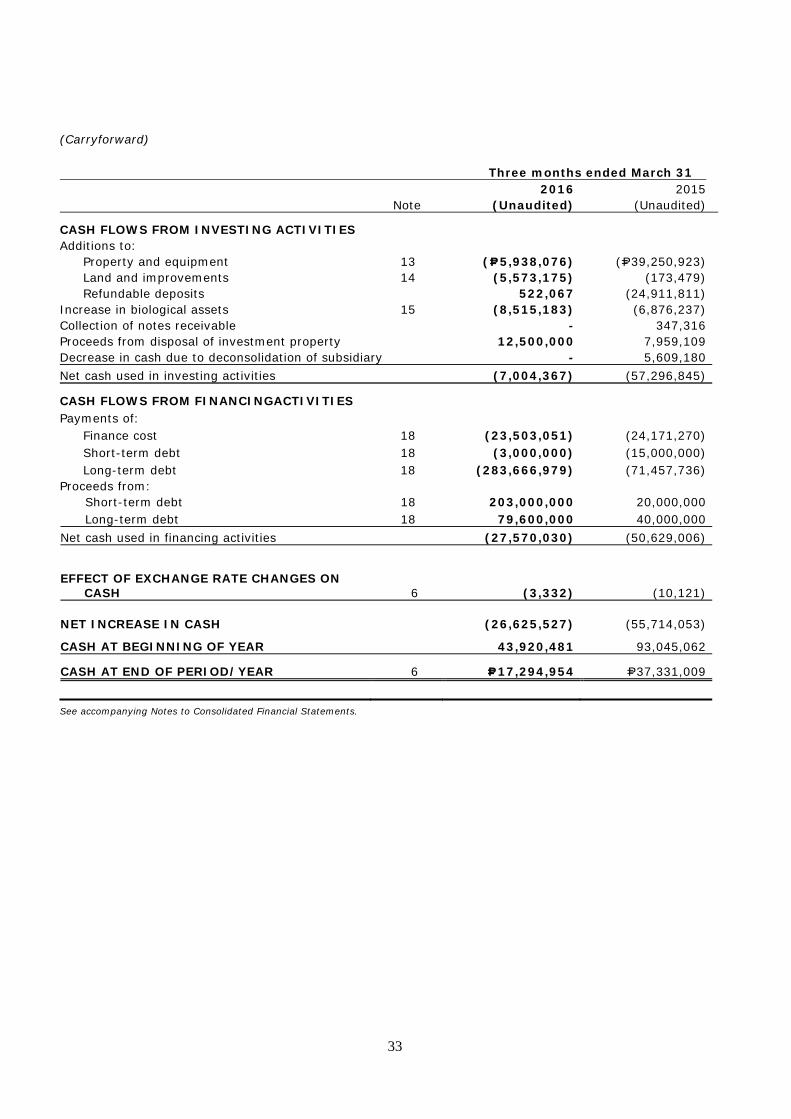
33
(Carryforward) Three months ended March 31
Note 2016
(Unaudited) 2015
(Unaudited)
CASH FLOWS FROM INVESTING ACTIVITIES Additions to:
Property and equipment 13 (P=5,938,076) (P=39,250,923) Land and improvements 14 (5,573,175) (173,479) Refundable deposits 522,067 (24,911,811)
Increase in biological assets 15 (8,515,183) (6,876,237) Collection of notes receivable - 347,316 Proceeds from disposal of investment property 12,500,000 7,959,109 Decrease in cash due to deconsolidation of subsidiary - 5,609,180 Net cash used in investing activities (7,004,367) (57,296,845)
CASH FLOWS FROM FINANCINGACTIVITIES Payments of:
Finance cost 18 (23,503,051) (24,171,270) Short-term debt 18 (3,000,000) (15,000,000) Long-term debt 18 (283,666,979) (71,457,736)
Proceeds from: Short-term debt 18 203,000,000 20,000,000 Long-term debt 18 79,600,000 40,000,000 Net cash used in financing activities (27,570,030) (50,629,006)
EFFECT OF EXCHANGE RATE CHANGES ON CASH 6 (3,332) (10,121)
NET INCREASE IN CASH (26,625,527) (55,714,053)
CASH AT BEGINNING OF YEAR 43,920,481 93,045,062
CASH AT END OF PERIOD/YEAR 6 P=17,294,954 P=37,331,009
See accompanying Notes to Consolidated Financial Statements.
34
A BROWN COMPANY, INC. AND SUBSIDIARIES NOTES TO CONSOLIDATED FINANCIAL STATEMENTS (Amounts in Philippine Pesos) 1. Corporate Information
A Brown Company, Inc. (Parent Company) was incorporated and registered with the Philippine Securities and Exchange Commission (SEC) on December 21, 1966 as Bendaña Brown Pizarro and Associates, Inc. to primarily engage in the business of property development and to invest in shares of stocks of listed companies. On October 1, 1992, the Parent Company amended its articles of incorporation to change its registered name to EPIC Holdings Corporation, which was further amended on July 1, 1993 to its current registered name. On February 8, 1994, the Parent Company was listed in the Philippine Stock Exchange. The Parent Company’s principal purpose is to invest in, purchase, or otherwise acquire and own, hold, use, sell, assign, transfer, mortgage, pledge, exchange, or otherwise dispose of real and personal property of every kind and description, including of shares of stock, bonds, debentures, notes, evidences of indebtedness, and other securities or obligations of any other corporation, associations, domestic or foreign, for whatever lawful purpose or purposes the same may have been organized without being a stock broker or dealer, and to pay therefor in money or by exchanging therefor stocks, bonds, or other evidences of indebtedness or securities of this or any other corporation and while the owner or holder of any such real or personal property, stocks, bonds, debentures, contracts or obligations, to receive, collect and dispose of the interest, dividends, and income arising from such property and to possess and exercise in respect thereof all the rights, powers and privileges of ownership, provided the corporation shall not exercise the functions of a trust corporation. The principal activities of the operating subsidiaries are as follows: Name of Subsidiary Principal Activity A Brown Energy and Resources
Development, Inc. (ABERDI) Manufacturing, trading of goods on wholesale and retail basis and other services.
Bonsai Agri Corporation (BAC) and Nakeen
Corporation (NC) Development of land for palm oil production and sale of palm seedlings and crude palm oil.
Masinloc Consolidated Power, Inc. (MCPI) Operating of power plants and/or purchase, generation,
production supply and sale of power. However, as of March 31, 2016, the Company has not yet started its commercial operations.
Simple Homes Development, Inc. (SHDI)
Development of socialized housing properties.
Palm Thermal Consolidated Holdings, Corp.
(PTCHC)
Holding of properties of every kind and description.
Hydro Link Projects Corp. (HLPC) Developing, constructing and operating power generating plants
AB Bulk Water Company, Inc. (ABWCI)
Holding and providing rights to water to pubic utilities and cooperatives
On June 13, 2012, the SEC approved the amendment of the Company’s By-Laws to amend and define the functions of its Executive Chairman and President, remove the requirement that the Company’s vice presidents must be a member of the Board, and to impose certain requirements on granting of bonuses to its BOD, officers and employees.
35
On October 5, 2012, the Parent Company’s Board of Directors (BOD) approved during their meeting the private placement of 250.0 million of its listed common shares consisting of 173.6 million treasury common shares and 76.4 million common shares owned by a shareholder. The Placement Shares, with a par value of P=1 per share was sold at a price of P=2.89 per share and crossed in the Exchange on October 8, 2012. The BOD likewise approved the issuance of an equal number of shares of the Parent Company at an issue price equal to the net proceeds per share in favor of the lending shareholder. The shares will be issued out of the increase in the Parent Company’s authorized capital stock fromP=1.32 billion divided into 1.32 billion shares with a par value of P=1 to P=1.62 billion divided into 1.62 billion shares with par value of P=1. On December 28, 2012, the SEC approved the Company’s application for increase in authorized capital stock. Subsequently, the 76.4 million common shares were issued. On June 7, 2013 the Parent Company’s Board of Directors (BOD) unanimously approved the proposed 25% stock dividend declaration or equivalent to 346.6 million of the Parent Company’s outstanding shares. The shares will be distributed to the stockholders record as of September 12, 2013 and shall be issued out of the increase in the Parent Company’s authorized capital stock from P=1.62 billion divided into 1.62 billion shares with par value of P=1 to P=2.0 billion divided into 2 billion shares with par value of P=1. On August 16, 2013, the SEC approved the Parent Company’s application for increase in authorized capital stock. Subsequently, 346.6 million shares were issued. The Parent Company’s registered office and principal place of business is at Xavier Estates, Upper Balulang, Cagayan de Oro City, Philippines (see Note 35).
2. Basis of Preparation
The consolidated financial statements of the Group have been prepared using the historical cost basis, except for available-for-sale investments which are measured at fair values. These consolidated financial statements are presented in Philippine Peso, which is the Group’s functional and reporting currency. All values are rounded to the nearest peso, except when otherwise indicated. Statement of Compliance The accompanying consolidated financial statements of the Group have been prepared in compliance with Philippine Financial Reporting Standards (PFRS). PFRS includes statements named PFRS, Philippine Accounting Standards (PAS) and International Financial Reporting Interpretations Committee (IFRIC) interpretations issued by the Financial Reporting Standards Council. Principles of Consolidation The consolidated unaudited financial statements consist of the financial statements of the Parent Company and its subsidiaries as of end of the first three quarters of each year. This report covers the period ending March 31, 2016. The consolidated financial statements of the subsidiaries are prepared for the same reporting year as the Parent Company, using consistent accounting policies. Subsidiaries are consolidated from the date on which control is transferred to the Group and cease to be consolidated from the date on which control is transferred out of the Group. Consolidated financial statements are prepared using uniform accounting policies for like transactions and other events in similar circumstances. Intercompany balances and transactions, including intercompany profits and unrealized profits and losses are eliminated. Noncontrolling interests represent interests in certain subsidiaries not held by the Parent Company and are presented separately in the consolidated statements of income, consolidated statements of comprehensive income and consolidated statements of changes in equity and within equity in the consolidated statements of financial position, separately from equity attributable to the Parent Company.
36
The subsidiaries and the percentage of ownership of the Parent Company are as follows: Percentage of ownership
Name of subsidiary Nature of business 03/31/2016 12/31/2015 ABERDI Manufacturing and
trading/Service/Agriculture 100 100 BAC Agriculture 100 100 NC Agriculture 100 100 SHDI Real Estate 100 100 MCPI Power plant operations 49 49 PTCHC Holdings 100 100 HLPC Power plant operations 100 100 ABWI Service 100 100
All of the above subsidiaries were incorporated in the Philippines.
ABERDI obtained control in the ownership of AC, BAC and NC. AC and BAC are still in their development stages. NC started its commercial operations as of March 1, 2007. Prior to 2013, NC manages the palm oil nursery and plantations operations. The separate financial statements of these companies are included in the consolidated financial statements as of March 31, 2016 and December 31, 2015. In December 2014, the Parent Company bought AC from ABERDI to undertake its socialized housing projects. On March 13, 2015, SHDI filed an application with the SEC to amend its primary purpose in the Articles of Incorporation from engaging business in agriculture to socialized housing property development and to change its name from AC to SHDI. This was later approved on April 10, 2015. As of March 31, 2016, AC has not yet started its commercial operations. On August 30, 2012, the SEC approved the ABERDI’s and NC’s Articles and Plan of Merger which was approved by their Board of Directors (BOD), in their meeting on March 6, 2012. However, on July 31, 2012, before the SEC approved the ABERDI’s Articles and Plan of Merger which was filed on July 12, 2012, the BOD and the Stockholders of Nakeen approved and ratified the subscription by ABERDI to the 750,000 unsubscribed shares of Nakeen at P=1 per share with P=50 million as Additional Paid-in Capital. The BOD and the Stockholders of Nakeen also approved the filing with SEC the amended Articles and Plan of Merger reflecting the new capital structure of Nakeen and specifying the effectivity date of the revised merger to be the first day of the subsequent month following the SEC approval. On February 19, 2013, the BOD of Nakeen approved the filing of the amended Articles and Plan of Merger using the 2012 audited Financial Statements. The amended articles and plan was filed to the SEC on July 24, 2013 to amend certain provision on the articles and plan of merger as follows: 1. Issuance of the ABERDI shares to NC shareholders in exchange of the net assets of the latter as
result of the merger. 2. Specify the effectivity date of the merger which will be the first day of the month succeeding the month
of approval of the merger by the SEC. On February 11, 2015, SEC denied the petition to amend plan of merger. NC and ABERDI’s management filed a request for reconsideration to approve the petition. As of March 31, 2016, the request for reconsideration is still pending with SEC. In 2007, the Parent Company invested P=4.9 million in MCPI representing 49% equity holdings. However, control over the operating and financial policies of MCPI is exercised by the Parent Company through its representations in the Board. Accordingly, MCPI qualifies as a subsidiary of the Parent Company. The financial statements of MCPI as of and for each the three years ended December 31, 2015, 2014 and 2013 are included in the consolidated financial statements. The BOD in their meeting on February 6, 2009, unanimously decided to wind up the affairs of MCPI, cease any and all of its operations; and close its business. Pursuant to the same, MCPI shall do all acts legally
37
that are necessary and required. However, on October 29, 2009, the Board of Directors resolved the revocation of its previous resolution to dissolve the MCPI and any act pursuant to the dissolution. In 2010, the Parent Company subscribed 2,850,000 shares and 3,000,000 shares of PTCHC and PCLHC, respectively, at par value. The investment represents 95% and 100% equity holdings of PTCHC and PCLHC, respectively. PTCHC and PCLHC are newly organized companies in 2010. On December 8, 2010, PTCHC acquired 100% of equity holdings of Palm Concepcion Power Corporation (PCPC), formerly DMCI Concepcion Power Corporation. DMCI Power Corporation, PCPC’s former parent company, transferred and conveyed to PTCHC all of the rights, title and interest in and to the shares of stock of PCPC. The acquisition cost is higher than the fair value of the identifiable net assets of the acquired subsidiary. Accordingly, goodwill of P=21,472,567 is recognized in the 2010 consolidated statements of financial position. In 2011, additional acquisition cost amounting to P=1,199,375 was capitalized as investment in subsidiaries which resulted to additional goodwill of the same amount. In 2012, when the Group’s equity interest in PCPC was reduced to 30%, the entire goodwill was derecognized. On January 12, 2011, the Parent Company and HLPC entered to a deed of subscription, which increased HLPC’s authorized share capital from 10,000 to 160,000 shares with par value of one hundred pesos (P=100) per share. Out of the 150,000 increase in authorized shares of HLPC, the Parent Company subscribe an aggregate share of 37,500 common shares which represents ninety three and seventy five percent (93.75%) of the resulting total issued and subscribed share capital of 40,000 shares. Accordingly, goodwill of P=250,000 is recognized in the 2011 consolidated statements of financial position. In December 2011, a deed of assignment was entered into by the Parent Company and HLPC’s stockholder, assigning the remaining six and twenty five percent (6.25%) shares of HLPC to the Parent Company. In September 2012, the Parent Company, together with its subsidiaries, PTCHC, Palm Concepcion Power Corporation (PCPC) and Panay Consolidated Land Holdings Corporation (PCLHC), has signed a Shareholders’ Agreement with AC Energy Holdings, Inc. (ACEHI) and Jin Navitas Resource, Inc. (JNRI) to implement the Memorandum of Agreement between the parties to build power generation plant in the Province of Iloilo. In relation to the above agreements, the Parent Company transferred all of its equity interest in PCLHC to PTCHC. Likewise, PTCHC, ACEHI and JNRI subscribed on the remaining unissued authorized share capital of PCLHC and PCPC. The subscription of ACEHI and JNRI to PCLHC and PCPC reduced the Parent Company’s holdings, through PTCHC, to 30%. In May 2013, ACEHI sold all its interest in PCPC and PCLHC to focus its investing power to its existing power projects imminent in its development pipeline. In the light of this event, PTCHC has taken the opportunity to acquire the entire stake of ACEHI bringing PTCHC’s interest to 70% on both entities. Later before the end of the year, Oriental Knight Limited bought out and subscribed to the 30.46% equity interest of PCPC from PTCHC. Additional shares were subscribed by PTCHC bringing its equity interest to 39.54%. On the other hand, PTCHC’s interest in PCLHC as of December 31, 2013 remained at 70%. On December 11, 2013, the BOD and shareholders of PCLHC and PCPC approved the merger of the two entities, with PCPC as the surviving entity. PTCHC will hold sufficient interest in PCPC for it to be able to exercise significant influence. PTCHC’s interest in PCLHC will still be presented under the investment in associate account (see Note 11). In July 2014, the Parent Company caused the incorporation of PBI with the primary purpose of acquiring, developing, constructing, investing in, and operating power generating plants in Bukidnon and engaging in the business of a generation company in accordance with Republic Act No. 9136 otherwise known as the Electric Power Industry Reform Act of 2001(the “EPIRA”). In 2014, the Parent Company invested P=2.5 million in PBI representing 100% of the equity holdings, of which the related subscription payable amounted to P=1.9 million. As of December 31, 2014, the paid-up capital and deposits for future subscriptions made by the Parent Company to PBI relative to this investment
38
amounted to P=0.6 million and P=7.5 million, respectively. In 2015, the Parent Company applied P=1.9 million of deposits for future subscriptions against its subscription payable to PBI. Also in 2015, the Parent Company sold its 100% equity interest in capital stock of PBI and assigned the remaining balance of deposit for future subscription of P=5.6 million to Peakpower Energy, Inc. (PEI), an associate. In January 2015, the Parent Company sold its 100% equity interest in BRC to Angelus Agri Corporation, an affiliate, for P=23.7 million. In March 2015, the Parent Company invested P=5.0 million in AB Bulk Water Company, Inc. representing 100% equity holdings. AB Bulk Water Company, Inc. engages in the business of holding and providing rights to water to public utilities and cooperatives or in water distribution in the Municipality of Opol, Misamis Oriental.
3. Changes in Accounting Policies Changes in Accounting Policies The accounting policies adopted by the Group are consistent with those of the previous financial years except for the following amended PFRS, amended PAS and interpretations issued by International Financial Reporting Interpretations Committee (IFRIC) which became effective in 2015: • Amendments to PAS 19, "Employee Benefits - Defined Benefit Plans: Employee Contributions"
The amendments apply to contributions from employees or third parties to defined benefit plans. Contributions that are set out in the formal terms of the plan shall be accounted for as reductions to current service costs if they are linked to service or as part of the re-measurements of the net defined benefit asset or liability if they are not linked to service. Contributions that are discretionary shall be accounted for as reductions of current service cost upon payment of these contributions to the plans. The amendments will not have any significant impact on the financial statements of the Group.
• PFRS 9, Financial Instruments: Classification and Measurement
PFRS 9 reflects the first phase on the replacement of PAS 39, Financial Instruments: Recognition and Measurement and applies to classification and measurement of financial assets and financial liabilities as defined in PAS 39. In subsequent phases, hedge accounting and impairment of financial assets will be addressed with the completion of this project expected on the first half of 2012. The Group will quantify the effect, if any, in conjunction with other phases, when issued, to present a comprehensive picture.
Annual Improvements to PFRS (2010 to 2012 cycle) The Annual Improvements to PFRSs (2010-2012 cycle) contain non-urgent but necessary amendments to the following standards: • PFRS 2, "Share-based Payment - Definition of Vesting Condition"
The amendment revised the definitions of vesting condition and market condition and added the definitions of performance condition and service condition to clarify various issues. This amendment shall be prospectively applied to share-based payment transactions for which the grant date is on or after July 1, 2014. This amendment does not apply to the Group as it currently has no share-based payments.
• PFRS 3, "Business Combinations - Accounting for Contingent Consideration in a Business Combination"
The amendment clarifies that a contingent consideration that meets the definition of a financial instrument should be classified as a financial liability or as equity in accordance with PAS 32, Contingent consideration that is not classified as equity is subsequently measured at FVPL whether or not it falls within the scope of PFRS 9 (or PAS 39, if PFRS 9 is not yet adopted). The amendment shall be prospectively applied to business combinations for which the acquisition date is on or after July 1, 2014. The Group shall consider this amendment for future business combinations, if any.
39
• PFRS 8, "Operating Segments - Aggregation of Operating Segments and Reconciliation of the Total of the Reportable Segments' Assets to the Entity's Assets"
The amendments require entities to disclose the judgment made by management in aggregating two or more operating segments. This disclosure should include a brief description of the operating segments that have been aggregated in this way and the economic indicators that have been assessed in determining that the aggregated operating segments share similar economic characteristics. The amendments also clarify that an entity shall provide reconciliations of the total of the reportable segments' assets to the entity's assets if such amounts are regularly provided to the chief operating decision maker. These amendments are effective for annual periods beginning on or after July 1, 2014 and are applied retrospectively. The amendments are not relevant to the Group since it is not one of the entities required to adopt PFRS 8.
• PFRS 13, "Fair Value Measurement - Short-term Receivables and Payables"
The amendment clarifies that short-term receivables and payables with no stated interest rates can be held at invoice amounts when the effect of discounting is immaterial.
• PAS 16, "Property, Plant and Equipment: Revaluation Method - Proportionate Restatement of Accumulated Depreciation"
The amendment clarifies that, upon revaluation of an item of property, plant and equipment, the carrying amount of the asset shall be adjusted to the revalued amount, and the asset shall be treated in one of the following ways: a. The gross carrying amount is adjusted in a manner that is consistent with the revaluation of the
carrying amount of the asset. The accumulated depreciation at the date of revaluation is adjusted to equal the difference between the gross carrying amount and the carrying amount of the asset after taking into account any accumulated impairment losses.
b. The accumulated depreciation is eliminated against the gross carrying amount of the asset.
The amendment is effective for annual periods beginning on or after July 1, 2014. The amendment shall apply to all revaluations recognized in annual periods beginning on or after the date of initial application of this amendment and in the immediately preceding annual period. The amendment will have no impact on the Group's financial position or performance since it currently has no property and equipment at revalued amounts.
• PAS 24, "Related Party Disclosures - Key Management Personnel"
The amendments clarify that an entity is a related party of the reporting entity if the said entity, or any member of a group for which it is a part of, provides key management personnel services to the reporting entity or to the parent company of the reporting entity. The amendments also clarify that a reporting entity that obtains management personnel services from another entity (also referred to as management entity) is not required to disclose the compensation paid or payable by the management entity to its employees or directors. The reporting entity is required to disclose the amounts incurred for the key management personnel services provided by a separate management entity. The amendments are effective for annual periods beginning on or after July 1, 2014 and are applied retrospectively. The amendments will affect disclosures only and will have no impact on the Group's financial position or performance.
• PAS 38, "Intangible Assets: Revaluation Method - Proportionate Restatement of Accumulated
Amortization" The amendments clarify that, upon revaluation of an intangible asset, the carrying amount of the asset shall be adjusted to the revalued amount, and the asset shall be treated in one of the following ways: a. The gross carrying amount is adjusted in a manner that is consistent with the revaluation of the
carrying amount of the asset. The accumulated amortization at the date of revaluation is adjusted to equal the difference between the gross carrying amount and the carrying amount of the asset
40
after taking into account any accumulated impairment losses. b. The accumulated amortization is eliminated against the gross carrying amount of the asset.
The amendments also clarify that the amount of the adjustment of the accumulated amortization should form part of the increase or decrease in the carrying amount accounted for in accordance with the standard.
The amendments are effective for annual periods beginning on or after July 1, 2014. These amendments shall apply to all revaluations recognized in annual periods beginning on or after the date of initial application of this amendment and in the immediately preceding annual period. The amendments will have no impact on the Group's financial position or performance.
Annual Improvements to PFRS (2011 to 2013 cycle) The Annual Improvements to PFRSs (2011-2013 cycle) contain non-urgent but necessary amendments to the following standards:
• PFRS 1, "First-time Adoption of Philippine Financial Reporting Standards - Meaning of Effective PFRS"
The amendment clarifies that an entity may choose to apply either a current standard or a new standard that is not yet mandatory, but that permits early application, provided either standard is applied consistently throughout the periods presented in the entity's first PFRS financial statements. This amendment is not applicable to the Group as it is not a first-time adopter of PFRS.
• PFRS 3, "Business Combinations - Scope Exceptions for Joint Arrangements" The amendment clarifies that PFRS 3 does not apply to the accounting for the formation of a joint arrangement in the financial statements of the joint arrangement itself. The amendment is effective for annual periods beginning on or after July 1, 2014 and is applied prospectively. The amendment is currently not relevant to the Group.
• PFRS 13, "Fair Value Measurement - Portfolio Exception"
The amendment clarifies that the portfolio exception in PFRS 13 can be applied to financial assets, financial liabilities and other contracts. The amendment is effective for annual periods beginning on or after July 1, 2014 and is applied prospectively. The amendment will have no impact on the Group's financial position or performance.
• PAS 40, "Investment Property" The amendment clarifies the interrelationship between PFRS 3 and PAS 40 when classifying property as investment property or owner-occupied property. The amendment stated that judgment is needed when determining whether the acquisition of investment property is the acquisition of an asset or a group of assets or a business combination within the scope of PFRS 3. This judgment is based on the guidance of PFRS 3. This amendment is effective for annual periods beginning on or after July 1, 2014 and is applied prospectively. The amendment will not have a significant impact on the Group’s financial statements.
Amendments to PFRS 10, "Consolidated Financial Statements", PFRS 11, "Joint Arrangements" and PAS 27, "Separate Financial Statements": Investment Entities
The amendments provide an exception to the consolidation requirement for entities that meet the definition of an investment entity under PFRS 10. The exception to consolidation requires investment entities to account for subsidiaries at fair value through profit or loss (FVPL). The amendments have no impact on the Group since it does not qualify as investment entities within the scope of this amendment.
• Amendment to PAS 32, Financial Instruments: Presentation - Offsetting Financial Assets and Financial Liabilities
41
The amendments clarify the meaning of “currently has a legally enforceable right to set-off” and also clarify the application of the PAS 32 offsetting criteria to settlement systems (such as central clearing house systems) which apply gross settlement mechanisms that are not simultaneous. The amendments have no impact on the Group’s financial position or performance since it has no financial assets and liabilities that are offset.
• Amendments to PAS 36, Impairment of Assets - Recoverable Amount Disclosures for Non-Financial Assets The amendments remove the unintended consequences of PFRS 13 on the disclosures required under PAS 36. In addition, these amendments require disclosure of the recoverable amounts for the assets or cash-generating units (CGUs) for which impairment loss has been recognized or reversed during the period. The amendments require additional disclosure only and have no impact on the Group’s financial statements.
• Amendments to PAS 39, Financial Instruments: Recognition and Measurement - Novation of Derivatives and Continuation of Hedge Accounting The amendments provide relief from discontinuing hedge accounting when novation of a derivative designated as a hedging instrument meets certain criteria. The amendments have no impact to the Group’s financial statements since it has no derivatives nor has applied hedge accounting to its accounts.
• Philippine Interpretation IFRIC 21, "Levies" The interpretation clarifies that an entity recognizes a liability for a levy when the activity that triggers payment, as identified by the relevant legislation, occurs. For a levy that is triggered upon reaching a minimum threshold, the interpretation clarifies that no liability should be anticipated before the specified minimum threshold is reached. The interpretation does not have a material financial impact on the Group’s financial statements.
New Accounting Standards, Amendments to Existing Standards Annual Improvements and Interpretations Effective Subsequent to December 31, 2015 The standards, amendments, annual improvements and interpretations which have issued but are not yet effective are discussed below and in the subsequent pages. The Group will adopt these standards, amendments and annual improvements and interpretations when these become effective and applicable to the Group. Except as otherwise indicated, the Group does not expect the adoption of these new and amended standards, annual improvements and interpretations to have a significant impact on its financial statements. Effective in 2016 • PFRS 10, PFRS 12 and PAS 28, “Investment Entities”: Applying the Consolidation Exception” The amendments clarify that the exemption from preparing consolidated financial statements is available to a parent entity that is subsidiary of an investment entity, even if the investment entity measures all its subsidiaries at fair value in accordance with PFRS 10. Consequential amendments have also been made to PAS 28 to clarify that the exemption from applying the equity method is also applicable to an investor in an associate or joint venture if that investor is a subsidiary of an investment entity that measures all its subsidiaries at fair value. The amendments further clarify that the requirement for an investment entity to consolidate a subsidiary providing services related to the former’s investment activities applies only to subsidiaries that are not investment entities themselves. Moreover, the amendments clarify that in applying the equity method of accounting to an associate or a joint venture that is an investment entity, an investor may retain the fair value measurements that the associate or joint venture used for its subsidiaries.
42
Lastly, clarification is also made that an investment entity that measures all its subsidiaries at fair value should provide the disclosures required by PFRS 12 Disclosure of Interests in Other Entities. The amendments to PFRS 10 are effective for annual periods beginning on or after January 1, 2016, with early adoption permitted. The amendments are not relevant to the Group. • PFRS 11, “Accounting for Acquisitions of Interests in Joint Operations” The amendments clarify the accounting for acquisitions of an interest in a joint operation when the operation constitutes a business. The acquirer of an interest in a joint operation in which the activity constitutes a business is required to apply the principles on business combinations accounting. Previously held interest in joint operation is not remeasured on the acquisition of an additional interest in the same joint operation while joint control is retained. Amendments do not apply when the parties sharing joint control, including the reporting entity, are under the common control of the same ultimate controlling party. The amendments are effective for annual periods beginning on or after January 1, 2016, with earlier adoption permitted. The amendments are currently not applicable to the Group. • PFRS 14, "Regulatory Deferral Accounts" PFRS 14 is an optional standard that allows an entity whose activities are subject to rate-regulation, to continue applying most of its existing accounting policies for regulatory deferral account balances upon its first-time adoption of PFRS. Entities that adopt PFRS 14 must present the regulatory deferral accounts as separate line items on the statement of financial position and present movements in these account balances as separate line items in the statement of profit or loss and other comprehensive income. The standard requires disclosures on the nature of, and risks associated with, the entity’s rate-regulation and the effects of that rate-regulation on its financial statements. The standard is currently not applicable to the Group. • PAS 1, “Presentation of Financial Statements”: Disclosure Initiative The amendments were a response to comments that there were difficulties in applying the concept of materiality in practice as the wording of some of the requirements in PAS 1 had in some cases been read to prevent the use of judgment. Certain key highlights in the amendments are follows:
o An entity should not reduce the understandability of its financial statements by obscuring material information with immaterial information or by aggregating material items that have different natures or functions.
o An entity need not provide a specific disclosure required by a PFRS if the information resulting from that disclosure is not material.
o In the other comprehensive income section of a statement of profit or loss and other comprehensive income, the amendments require separate disclosure for the following items:
- The share of other comprehensive income of associates and joint ventures accounted for using the equity method that will not be reclassified subsequently to profit or loss; - The share of other comprehensive income of associates and joint ventures accounted for using the equity method that will be reclassified subsequently to profit or loss.
The amendments to PAS 1 are effective for annual periods beginning on or after January 1, 2016, with early adoption permitted. The Group does not expect that the amendments will have significant impact on the financial statements. • PAS 16, “Property, Plant and Equipment” and PAS 38, “Intangible Assets”: Classification of Acceptable Methods of Depreciation and Amortization The amendments clarify that revenue-based methods to calculate the depreciation of an asset is inappropriate because revenue generated by an activity that includes the use of an asset reflects factors other than the consumption of the economic benefits embodied in the asset. As a result, a revenue-based method cannot be used to depreciate property, plant and equipment and may only be used in very limited circumstances to amortize intangible assets.

43
These amendments are effective from annual periods beginning on or after January 1, 2016, with earlier application permitted and are applied prospectively. The amendments are not expected to have an impact on the Group's financial position or performance. • PAS 16, “Property, Plant and Equipment” and PAS 41, “Agriculture”: Bearer Plants The amendment clarifies that biological assets that meet the definition of bearer plants will be accounted for in the same way as property, plant and equipment PAS 16 Property, Plant and Equipment. The amendment also clarifies that produce growing on bearer plants continues to be accounted under PAS 41. For government grants related to bearer plants, PAS 20, Accounting for Government Grants and Disclosure of Government Assistance will apply. These amendments are effective from annual periods beginning on or after January 1, 2016, with earlier application permitted. The Group will assess the impact of the amendments on the financial statements. • PAS 27, “Separate Financial Statements”: Equity Method in Separate Financial Statements The amendments will allow entities to use the equity method to account for investments in subsidiaries, joint ventures and associates in their separate financial statements. Entities already applying PFRS and electing to change to the equity method in its separate financial statements will have to apply the change retrospectively. For first time adopters of PFRS electing to use the equity method in its separate financial statements, they will be required to apply this method from the date of transition to PFRS. These amendments are effective from annual periods beginning on or after January 1, 2016, with earlier application permitted and to be applied retrospectively. The Group does not expect that these amendments to have impact on the financial statements. Annual Improvements to PFRS (2012 - 2014 Cycle) The annual improvements to PFRS (2012-2014 cycle) contain non-urgent but necessary amendments to the following standards: • PFRS 5,”Noncurrent Assets Held for Sale and Discontinued Operations”: Changes in Methods of
Disposal The amendment clarify the accounting for a change in a disposal plan from a plan to sell to a plan to distribute a dividend in kind to its shareholders (or vice versa) when an entity reclassifies an asset (or disposal group) directly from one method of disposal to other should not be considered a new plan rather as a continuation of the original plan. There is, therefore, no interruption of the application of the requirements in PFRS 5. The amendment also clarifies that changing the disposal method does not change date of classification.
This is currently not applicable to the Group. • PFRS 7, “Financial Instruments: Disclosure – Servicing Contracts” This amendment clarifies that a
servicing contract that includes a fee can constitute continuing involvement in a financial asset. An entity is required to disclose any continuing involvement in a transferred asset that is derecognized in its entirety. The amendment is to be applied such that the assessment of which servicing contracts constitute continuing involvement will be applied retrospectively. An entity that first applies the amendments is not required to provide comparative disclosures for any period beginning before the annual period of first application.
The Group does not expect that this amendment will have significant impact on its financial statements. • PFRS 7, “Applicability of the Amendments to PFRS 7 to Condensed Interim Financial Statements” The
amendment clarifies that the disclosures on offsetting of financial assets and financial liabilities are not required in the condensed interim financial report unless they provide a significant update to the information reported in the most recent annual report. This amendment is applied.
The Group does not expect that this amendment will have significant impact on its financial statements. • PAS 19, “Employee Benefits”: Regional Market Issue Regarding Discount Rate This amendment
clarifies that the rate used to discount post-employment benefit obligations (both funded and unfunded) shall be determined by reference to market yields at the end of the reporting period on high quality corporate bonds. Where there is no deep market in such high quality corporate bonds, the market yields (at the end of the reporting period) on government bonds shall be used. The currency and term of the corporate bonds or government bonds shall be consistent with the currency and estimated term of the postemployment benefit obligations.
44
This amendment is not expected to have any impact on the Group’s financial statements. • PAS 34, “Interim Financial Reporting” Disclosure of information ‘elsewhere in the Interim Financial
Report’ These amendments clarify that an entity discloses information elsewhere in the interim financial report when it incorporates disclosures by cross-reference to information in another statement and wherever they are included within the greater interim financial report (e.g., management commentary or risk report).
This amendment is not expected to have significant impact on the Group’s financial statements. Effective in 2018 PFRS 9, "Financial Instruments: Classification and Measurement" PFRS 9 requires all financial assets to be measured at fair value at initial recognition. A debt financial asset may, if the fair value option (FVO) is not invoked, be subsequently measured at amortized cost if it is held within a business model that has the objective to hold the assets to collect the contractual cash flows and its contractual terms give rise, on specified dates, to cash flows that are solely payments of principal and interest on the principal outstanding. All other debt instruments are subsequently measured at fair value through profit or loss. All equity financial assets are measured at fair value either through OCI or profit or loss. Equity financial assets held for trading must be measured at FVPL. For liabilities designated as at FVPL using the FVO, the amount of change in the fair value of a liability that is attributable to changes in credit risk must be presented in OCI. The remainder of the change in fair value is presented in profit or loss, unless presentation of the fair value change relating to the entity's own credit risk in OCI would create or enlarge an accounting mismatch in profit or loss. All other PAS 39 classification and measurement requirements for financial liabilities have been carried forward to PFRS 9, including the embedded derivative bifurcation rules and the criteria for using the FVO. The adoption of the first phase of PFRS 9 will have an effect on the classification and measurement of the Parent Company's financial assets, but will potentially have no impact on the classification and measurement of financial liabilities. On hedge accounting, PFRS 9 replaces the rules-based hedge accounting model of PAS 39 with a more principles-based approach. Changes include replacing the rules-based hedge effectiveness test with an objectives-based test that focuses on the economic relationship between the hedged item and the hedging instrument, and the effect of credit risk on that economic relationship; allowing risk components to be designated as the hedged item, not only for financial items, but also for nonfinancial items, provided that the risk component is separately identifiable and reliably measurable; and allowing the time value of an option, the forward element of a forward contract and any foreign currency basis spread to be excluded from the designation of a financial instrument as the hedging instrument and accounted for as costs of hedging. PFRS 9 also requires more extensive disclosures for hedge accounting. This is not expected to have a significant impact on the Group’s financial statements. Deferred • Philippine Interpretation IFRIC 15, "Agreements for the Construction of Real Estate" This
interpretation covers accounting for revenue and associated expenses by entities that undertake the construction of real estate directly or through subcontractors. The Philippine SEC and the Financial Reporting Standards Council (FRSC) have deferred the effectivity of this interpretation until the final Revenue standard is issued by the International Accounting Standards Board (IASB) and an evaluation of the requirements of the final Revenue standard against the practices of the Philippine real estate industry is completed. Management will continuously assess the impact of this interpretation. Currently, management believes that the adoption of the interpretation will not have a significant impact on the Group’s financial statements.
• PFRS 10, “Consolidated Financial Statements” and PAS 28, Investments in Associates and Joint
Ventures”: Sale or Contribution of Assets between an Investor and its Associate or Joint Venture These amendments address an acknowledged inconsistency between the requirements in PFRS 10 and those in PAS 28 (2011) in dealing with the sale or contribution of assets between an investor and its associate or joint venture. The amendments require that full gain or loss is recognized when a transaction involves a business (whether it is a housed in a subsidiary or not). A partial gain or loss is recognized when a transaction involves assets that do not constitute a business, even if these assets

45
are housed in a subsidiary. These amendments will be effective for annual periods beginning on or after January 1, 2016, with early application permitted. The amendments are currently not expected to have significant impact on the Group’s financial statements.
Standards issued by the IASB but not yet been adopted by the FRSC IFRS 15, “Revenue from Contracts with Customers” IFRS 15 was issued in May 2014 and establishes a new five-step model that will apply to revenue arising from contracts with customers. Under IFRS 15, revenue is recognized at an amount that reflects the consideration to which an entity expects to be entitled in exchange for transferring goods or services to a customer. The principles in IFRS 15 provide a more structured approach to measuring and recognizing revenue. The new revenue standard is applicable to all entities and will supersede all current revenue recognition requirements under IFRS. Either a full or modified retrospective application is required for annual periods beginning on or after January 1, 2017 with early adoption permitted. The Group is currently assessing the impact of IFRS 15 and plans to adopt the new standard once adopted locally. The Group will continue to assess the relevance and impact of the above standards, amendments to standards and interpretations. The revised disclosures on the financial statements required by the above standards and interpretations will be included in the Group’s financial statements when these are adopted.
4. Summary of Significant Accounting and Financial Reporting Policies Revenue Recognition Revenue is recognized to the extent that is probable that the economic benefits will flow to the Group and the revenue can be reliably measured. Revenue is recognized when the significant risks and rewards of ownership of the goods have passed to the buyer and the amount of revenue can be measured reliably. The following specific recognition criteria must also be met before revenue is recognized:
• Sale of real estate
Sale of real estate is recognized in full provided the profit is determinable, and the earning process is virtually complete. Specifically, revenue recognition is applied to sale if construction development is almost complete, sufficient cumulative down payment has been received, and that collectibility of sales price is reasonably assured. The percentage of completion method is used to recognize revenue from sales of projects where the Group has material obligations to complete the project after the property is sold. Under this method, revenue is recognized as the related obligations are fulfilled, measured principally on the basis of the estimated completion of a physical proportion of the contract work. Pending recognition of sale when conditions for recording a sale are not met, cash received from buyers are presented under “Deposit from customers” in the liability section of the consolidated statements of financial position. Any excess of collections over the recognized receivables are also included in the said account.
• Sale of crude palm oil. Revenue is recognized upon delivery or shipment of goods to customers at invoice.
• Sale of aggregates, seedlings and fresh fruit bunch. Revenue is recognized when goods are delivered to the buyer.
• Water service income. Revenue is recognized when services are rendered and normally when billed.
• Interest income. Interest income is recognized as the interest accrues, taking into account the effective yield on the asset. Interest income from bank deposits is recognized on a time proportion basis on the principal outstanding and at the rate applicable.
46
• Rental income. Rental income on leased properties arising from operating leases or investment properties is accounted for on a straight-line basis over the lease term.
• Dividend income. Dividend income is recognized when the shareholders’ right to receive payment is established.
• Other income. Revenue is recognized as other income accrues.
• Realized gains and losses. Realized gains and losses are recognized when the sale transaction occurs.
Cost and Expense Recognition Contract costs include all direct materials and labor costs and those indirect costs related to contract performance. Expected losses on contracts are recognized immediately when it is probable that the total contract costs will exceed total contract revenue. Changes in contract performance, contract conditions and estimated profitability, including those arising from contract penalty provisions, and final contract settlements which may result in revisions to estimated costs and gross margins are recognized in the year in which the changes are determined. Expenses are recognized in the consolidated statements of income upon utilization of the assets or services or at the date they are incurred.
Preoperating Expenses Preoperating expenses are expensed as incurred. Cash Cash is stated at face value and includes cash on hand and in banks. Financial Assets and Liabilities Date of recognition The Group recognizes a financial asset or a financial liability when it becomes a party to the contractual provisions of the instrument. In the case of a regular way purchase or sale of financial assets, recognition and derecognition, as applicable, is done using settlement date accounting. Initial recognition Financial assets and financial liabilities are recognized initially at fair value, which is the fair value of the consideration given (in case of an asset) or received (in case of a liability). The fair value of the consideration given or received is determined by reference to the transaction price or other market prices. If such market prices are not reliably determinable, the fair value of the consideration is estimated as the sum of all future cash payments or receipts, discounted using the prevailing market rate of interest for similar instruments with similar maturities. The initial measurement of financial instruments, except for those designated at fair value through profit and loss (FVPL), includes transaction costs.
Determination of fair value Fair value is determined by preference to the transaction price or other market prices. If such market prices are not reliably determinable, the fair value is determined by using appropriate valuation techniques. Valuation techniques include net present value model where the fair value of the consideration is estimated as the sum of all future cash payments or receipts, discounted using the prevailing market rates of interest for a similar instruments with similar maturities. Other valuation techniques include comparing to similar instruments for which market observable prices exist; recent arm’s length market transaction; option pricing model and other relevant valuation models.
47
Financial Assets The Group determines the classification at initial recognition and, where allowance is appropriate, re-evaluates this designation every reporting date. The classification depends on the purpose for which the investments are acquired and whether they are quoted in an active market. Subsequent to initial recognition, the Group classifies its financial assets in the following categories:
• Financial asset at fair value through profit or loss (FVPL)
A financial asset is classified in this category if acquired principally for the purpose of selling or repurchasing in the near term or upon initial recognition, it is designated by the management as at FVPL. Derivatives are also categorized as held at fair value through profit or loss, except those derivatives designated as effective hedging instruments. Assets classified in this category are carried at fair value in the consolidated statements of financial position. Changes in the fair value of such assets are accounted for in consolidated statements of income. Financial instruments held at fair value through profit or loss are classified as current if they are expected to be realized within 12 months from the end of financial reporting period. As of March 31, 2016 and December 31, 2015, the Group has no financial asset at FVPL.
• Loans and receivables
Loans and receivables are non-derivative financial assets with fixed or determinable payments and are not quoted in an active market. They arise when the Group provides money, goods or services directly to a debtor with no intention of trading the receivables. Such assets are carried at cost or amortized cost in the consolidated statements of financial position. Amortization is determined using the effective interest method. Loans and receivables are included in current assets if maturity is within 12 months from the end of financial reporting period. Otherwise, these are classified as non-current assets.
The Group’s cash, accounts receivable, due from related parties and refundable deposits are included in this category (see Notes 6, 7, 19 and 30).
• Held-to-maturity investments Held-to-maturity investments are non-derivative financial assets with fixed or determinable payments and fixed maturities wherein the Group has the positive intention and ability to hold to maturity. Held-to-maturity investments are carried at cost or amortized cost in the consolidated statements of financial position. Amortization is determined by using the effective interest method. Assets under this category are classified as current assets if maturity is within 12 months from the end of financial reporting period and as non-current assets if maturity is more than a year from the end of financial reporting period. As of March 31, 2016 and December 31, 2015, the Group has no held-to-maturity investments.
• Available-for-sale financial assets
Available-for-sale financial assets are those non-derivative financial assets that are designated as available-for-sale or are not classified in any of the three preceding categories. After initial recognition, available-for-sale financial assets are measured at fair value with gains or losses being recognized as separate component of equity until the investment is derecognized or until the investment is determined to be impaired at which time the cumulative gain or loss previously reported in equity is included in the consolidated statements of income. The fair value of investments that are actively traded in organized financial market is determined by reference to quoted market bid prices at the close of business on the end of financial reporting period. For investments where there is no active market, fair value is determined using valuation techniques. Such techniques include reference to recent arm’s length market transaction, reference to the current market value of another instrument which is substantially the same, discounted cash flows analysis and option pricing models.

48
The Group’s investment in shares of stocks in golf, sports and country clubs, listed and non-listed companies are included in this category (see Note 10).
Financial Liabilities • Financial liability at FVPL
Financial liabilities are classified in this category if these result from trading activities or derivatives transaction that are not accounted for as accounting hedges, or when the Group elects to designate a financial liability under this category.
As of March 31, 2016 and December 31, 2015, the Group has no financial liabilities at FVPL.
• Other financial liabilities
This category pertains to financial liabilities that are not held for trading or not designated as at FVPL upon the inception of the liability. These include liabilities arising from operations (e.g. payables, accruals) or borrowing (e.g., long-term debt). The financial liabilities are recognized initially at fair value and are subsequently carried at amortized cost, taking into account the impact of applying the effective interest rate method of amortization (or accretion) for any related premium, discount and any directly attributable transaction costs.
The Group’s accounts payable and accrued expenses, dividends payable, due to related parties, deposit from customers, subscriptions payable and long-term debt are included in this category (see Notes 17, 18, 19 & 31).
Impairment of Financial Assets The Group assesses at each end of financial reporting period whether a financial asset or group of financial assets is impaired.
• Assets carried at amortized cost. If there is objective evidence that an impairment loss on loans and
receivables carried at amortized cost has been incurred, the amount of the loss is measured as the difference between the asset’s carrying amount and the present value of estimated future cash flows (excluding future credit losses that have not been incurred) discounted at the financial asset’s original effective interest rate (i.e., the effective interest rate computed at initial recognition). The carrying amount of the asset shall be reduced either directly or through use of an allowance account. The amount of the loss shall be recognized in the Group’s consolidated statements of income.
The Group first assesses whether objective evidence of impairment exists individually for financial assets that are individually significant, and individually or collectively for financial assets that are not individually significant. If it is determined that no objective evidence of impairment exists for an individually assessed financial asset, whether significant or not, the asset is included in a group of financial assets with similar credit risk characteristics and that group of financial asset is collectively assessed for impairment. Assets that are individually assessed for impairment and for which an impairment loss is or continues to be recognized are not included in a collective assessment of impairment. If, in a subsequent period, the amount of the impairment loss decrease can be related objectively to an event occurring after the impairment was recognized, the previously recognized impairment loss is reversed. Any subsequent reversal of an impairment loss is recognized in the consolidated statements of income to the extent that the carrying value of the asset does not exceed its amortized cost at the reversal date.
• Assets carried at cost. If there is objective evidence that an impairment loss has been incurred in an unquoted equity instrument that is not carried at fair value because its fair value cannot be reliably measured, or on a derivative asset that is linked to and must be settled by delivery of such an unquoted equity instrument, the amount of the loss is measured as the difference between the asset’s
49
carrying amount and the present value of estimated future cash flows discounted at the current market rate of return for a similar financial asset.
• Available-for-Sale Financial Assets. If an available-for-sale financial asset is impaired, an amount
comprising the difference between its cost (net of any principal payment and amortization) and its current fair value, less any impairment loss previously recognized in the consolidated statement of income, is transferred from consolidated equity to the consolidated statement of income. Reversals in respect of equity instruments classified as available-for-sale financial assets are not recognized in the consolidated statement of income. For available-for-sale financial assets, the Group assesses at each reporting date whether there is objective evidence that an investment or a group of investments is impaired. In the case of equity investments classified as available-for-sale financial assets, objective evidence would include a significant or prolonged decline in the fair value of the investment below its cost. Where there is evidence of impairment, the cumulative loss, measured as the difference between the acquisition cost and the current fair value, less any impairment loss on that investment previously recognized in the consolidated statement of income, is removed from consolidated equity and recognized in the consolidated statement of income. Impairment losses on equity investments are not reversed through the consolidated statement of income; increases in their fair value after impairment are recognized directly in consolidated equity.
Derecognition of Financial Assets and Liabilities Financial Assets A financial asset is derecognized when (1) the rights to receive cash flows from the financial instruments expire, (2) the Group retains the right to receive cash flows from the asset, but has assumed an obligation to pay them in full without material delay to a third party under a “pass-through” arrangement, or (3) the Group has transferred its rights to receive cash flows from the asset and either has transferred substantially all the risks and rewards of the asset, or has neither transferred nor retained substantially all the risks and rewards of the asset, but has transferred control of the asset.
Where the Group has transferred its rights to receive cash flows of an asset or has entered into a pass-through arrangement and has neither transferred nor retained substantially all the risks and rewards of an asset nor transferred control of the assets, the asset is recognized to the extent of the Group’s continuing involvement in the asset. Continuing involvement that takes the form of a guarantee over the transferred asset is measured at the lower of the original carrying amount of the asset and the maximum amount of consideration that the Group could be required to repay. Financial Liabilities A financial liability is derecognized when the obligation under the liability is discharged, cancelled or expired. Where the existing financial liability is replaced by another from the same lender on substantially different terms, or the terms of an existing liability are substantially modified, such an exchange or modification is treated as a derecognition of the original liability and the recognition of a new liability, and the difference in the respective carrying amounts is recognized in consolidated statements of income. Classification of Financial Instrument between Debt and Equity Financial instruments are classified as liabilities or equity in accordance with the substance of the contractual arrangement. Interest relating to a financial instrument or a component that is a financial liability is reported as expenses. A financial instrument is classified as debt if it provides for a contractual obligation to: (a) deliver cash or another financial asset to another entity; or (b) exchange financial assets or financial liabilities with another entity under conditions that are potentially unfavorable to the Group; or (c) satisfy the obligation other than by exchange of a fixed amount of cash or other financial asset for a fixed number of own equity shares. If the Group does not have an unconditional right to avoid delivering cash or another financial asset to settle its contractual obligation, the obligation meets the definition of a financial liability.
50
Offsetting Financial Instruments Financial assets and financial liabilities are offset and the net amount is reported in the consolidated statements of financial position if, and only if, there is a currently enforceable legal right to offset the recognized amounts and there is an intention to settle on a net basis, or to realize the asset and settle the liability simultaneously. This is not generally the case with master netting agreements, and the related assets and liabilities are presented gross in the consolidated statements of financial position.
Real Estate Held for Sale and Land and Improvements Real estate held for sale, and land and improvements consisting of properties held for future development are valued at the lower of cost and net realizable value (NRV). Cost includes the acquisition cost of the land plus all costs incurred directly attributable to the development and improvement of the properties. NRV is the estimated selling price in the ordinary course of business, less estimated cost of completion and estimated costs necessary to make the sale. Inventories Finished goods are valued at the lower of cost and net realizable value. Costs incurred in bringing inventory to its present conditions are accounted for as follows: • Finished goods and goods in process – cost includes direct materials and labor and proportion of
manufacturing overhead costs based on normal operating capacity but excluding borrowing costs. Cost is determined by the moving average method.
• Materials and supplies – at cost using the first-in-first out method. Prepayments and Other Current Assets Prepayments are expenses paid in advance and recorded as asset before they are utilized. This account comprises the following: • Input Tax. Input tax is recognized when an entity in the Group purchases goods or services from a
Value Added Tax (VAT)-registered supplier. This account is offset, on a per entity basis, against any output tax previously recognized.
• Prepaid Commission and Other Expenses. Prepaid commission and other expenses are apportioned
over the period covered by the payment and charged to the appropriate account in the consolidated statements of income when incurred.
• Creditable Withholding Tax. Creditable withholding tax is recognized for income taxes withheld by
customers. The balance as of end of each reporting period represents the unutilized amount after deducting any income tax payable.
Prepayments and other assets that are expected to be realized for no more than 12 months after the reporting period are classified as current asset. Otherwise, these are classified as other noncurrent asset. Investment in an Associate Investment in shares of stock where the Group holds 20% or more ownership, or where it has the ability to significantly influence the investee company’s operating activities is accounted for under the equity method. Under the equity method, the cost of the investment is increased or decreased by the Group’s equity in net earnings or losses of the investee company since the date of acquisition. Any excess of the cost of acquisition over the Group’s share in the fair value of the identifiable net assets of the associate at date of acquisition is recognized as goodwill. Any excess of the fair value of the identifiable assets, liabilities and contingent liabilities and assets of the investee company over cost is included in the determination of the Group’s share of the profit or loss in the period in which the investment is acquired.
51
Under the equity method, investment in shares of stock is carried at cost adjusted by post-acquisition changes in the Group’s share of the net assets of the investee. The Group’s share in the investee’s post-acquisition profits or losses is recognized in the statements of income, and its share of post-acquisition movements in reserves is recognized in reserves, if any. The cumulative post-acquisition movements are adjusted against the carrying amount of investment. The carrying value is also decreased for any cash or property dividends received. Investment in a Joint Venture Investment in joint venture is initially accounted for at cost and is reviewed for impairment when events or changes in circumstances indicate that the carrying values may not be recoverable. The Group has an investment in jointly controlled operations whereby the venturers have a contractual arrangement that establishes joint control. The operation of the joint venture involves the use of the assets and other resources of the venturers rather than the establishment of a corporation, partnership or other entity, or a financial structure that is separate from the venturers themselves. Each venturer uses its own property plant and equipment and carries its own inventories. It also incurs its own expenses and liabilities and raises its own finance, which represent its own obligations. The joint venture activities may be carried out by the venturer’s employees alongside the venturer’s similar activities. The joint venture agreement usually provides a means by which the revenue from the sale of the joint venture product and any expenses in common are shared among the venturers. Investment Properties Investment properties consist of properties held to earn rental income, for capital appreciation or both. These are initially recorded at cost, including transaction cost. The carrying amount includes the cost of replacing part of an existing property at the time the cost are incurred if the recognition criteria are met, and excludes the costs of day-to-day servicing of investment properties. Subsequent to initial recognition, investment properties are carried at cost less accumulated depreciation and any impairment in value. Depreciation and amortization are computed on a straight-line method over estimated useful lives ranging from 2 to 20 years. The useful lives and depreciation method are reviewed periodically to ensure that the period and the method of depreciation are consistent with the expected pattern of economic benefits from the use of the properties for lease. Investment properties are derecognized when these are disposed of or when the investment property is permanently withdrawn from use and there is no future economic benefit expected to arise from the continued use of the properties. Any gain or loss on the retirement or disposal of said properties are recognized in the consolidated statements of income in the year of retirement or disposal. Property and Equipment Property and equipment are stated at cost less accumulated depreciation, amortization and any impairment in value.
The initial cost of property and equipment comprises its purchase price or construction cost and any directly attributable costs of bringing the asset to its working condition and location for its intended use. Expenses incurred after the property and equipment have been put into operation, such as repairs and maintenance and overhaul costs, are normally charged to operations in the period when the costs are incurred. In situations where it can be clearly demonstrated that the expenditures have resulted in an increase in the future economic benefits expected to be obtained from the use of an item of property and equipment beyond its originally assessed standard of performance, the expenditures are capitalized as an additional cost of property and equipment. Depreciation of crushing properties is calculated using units-of-production method based on estimated recoverable reserve. Depreciation and amortization of other items of property, plant and equipment are computed using the straight-line method over the following estimated useful lives, except for leasehold improvements, which are amortized over their estimated lives or term of the lease, whichever is shorter:
52
Category Estimated useful life Land improvements 3 to 25 years Building and improvements 10 to 20 years Leasehold improvements 2 to 5 years Machinery and equipment 2 to 10 years Furniture, fixture and equipment 2 to 9 years Transportation equipment 2 to 7 years Tools and other equipment 2 to 5 years Other fixed assets 3 to 15 years The useful life and depreciation and amortization methods are reviewed periodically to ensure the period and method of depreciation and amortization are consistent with the expected pattern of economic benefits from items of property and equipment. An item of property and equipment is derecognized upon disposal or when no future economic benefits are expected from its use or disposal. Any gain or loss arising on derecognition of the asset (calculated as the difference between the net disposal proceeds and the carrying amount of the asset) is included in the consolidated statements of income in the year the asset is derecognized. Construction in progress represents structures under construction and is stated at cost. This includes cost of construction and other direct costs. Construction in progress is not depreciated until such time the relevant assets are completed and ready for operational use. Intangibles Intangible assets acquired separately are measured on initial recognition at cost. The cost of intangible assets acquired in a business combination is recognized at fair value at acquisition date. Following initial recognition, intangible assets are carried at cost less any accumulated amortization and any accumulated impairment losses. Internally generated intangible assets are not capitalized and expenditure is reflected in the consolidated statements of income in the year in which the expenditure is incurred. The useful lives of intangible assets are assessed to be either finite or indefinite. The intangible asset recognized and determined by the Group has finite useful lives and represents leasehold rights. Intangible assets with finite lives are amortized over the straight-line method over their useful economic lives of three (3) to twenty (20) years and assessed for impairment whenever there is an indication that the intangible assets may be impaired. The amortization period and method for an intangible asset with a finite useful life is reviewed at least annually. Changes in expected useful life or the expected pattern of consumption of future economic benefits embodied in the asset is accounted for by changing the amortization period or method, as appropriate, and treated as changes in accounting estimates. The amortization expense on intangible assets with finite lives is capitalized as part of the “Biological assets” account in the in the consolidated statements of financial position consistent with the function of the intangible asset.
Biological Assets and Agricultural Produce
The Group’s biological assets include growing palm oil seedlings, which are grouped according to their physical state, transformation capacity and location/areas. These are carried at its fair value with any resultant gain or loss recognized in the statements of income. The fair value of the biological assets is determined using the cost approach of fair valuation. It involves valuing based on the original cost plus improvements to the biological assets. The Group’s agricultural produce consists of those harvested from the biological assets and is measured at fair value less point-of-sale costs at the point of harvest. The fair value is based on the quoted price in the market at any given time.

53
Goodwill Goodwill arising from the acquisition of a subsidiary or a jointly controlled entity represents the excess of the cost of acquisition over the Group’s interest in the net fair value of the identifiable assets, liabilities and contingent liabilities of the subsidiary or jointly controlled entity recognized at the date of acquisition. Goodwill is initially recognized as an asset at cost and is subsequently measured at cost less any accumulated impairment losses. Goodwill is reviewed for impairment annually or more frequently, if event of changes in circumstances indicate that the carrying value may be impaired. An impairment loss recognized for goodwill is not reversed in a subsequent period. Negative goodwill which is the excess of net fair value of subsidiaries’ identifiable assets, liabilities and contingent liabilities over the cost of the business combination is immediately recognized as income. On disposal of a subsidiary or a jointly controlled entity, the attributable amount of goodwill is included in the determination of the profit or loss on disposal. Impairment of Nonfinancial Assets The carrying values of assets such as investment properties, property and equipment, leasehold rights and biological assets are reviewed for impairment when events or changes in circumstances indicate that the carrying values may not be recoverable. If any such indication exists, and if the carrying value exceeds the estimated recoverable amount, the assets or cash generating units are written down to their recoverable amounts. The recoverable amount of the asset is the greater of net selling price or value in use. The net selling price is the amount obtainable from the sale of an asset in an arm’s-length transaction less cost to sell. In assessing value in use, the estimated future cash flows are discounted to their present value using a pre-tax discount rate that reflects current market assessments of the time value of money and the risks specific to the asset. For an asset that does not generate largely independent cash flows, the recoverable amount is determined for the cash-generating unit to which the asset belongs. An impairment loss is charged to operations in the period in which it arises unless the asset is carried at a revalued amount in which case the impairment is charged to the revaluation increment of the said asset. An assessment is made at each end of financial reporting period to determine whether there is any indication that an impairment loss previously recognized for an asset in prior years may no longer exist or may have decreased. If any such indication exists, the asset’s recoverable amount is estimated. A previously recognized impairment loss is reversed only if there has been a change in the estimates used to determine the recoverable amount of an asset, however, not to an amount higher than the carrying amount that would have been determined (net of any depreciation), had no impairment loss been recognized for the asset in prior years. Such reversal is recognized in profit or loss. After such a reversal, the depreciation charge is adjusted in future periods to allocate the asset’s revised carrying amount, less any residual value, on a systematic basis over its remaining useful life. Employee benefits Short-term benefits Short-term employee benefits are recognized as expense in the period when the economic benefits are given. Unpaid benefits at the end of the accounting period are recognized as accrued expense while benefits paid in advance are recognized as prepayment to the extent that it will lead to a reduction in future payments. Short-term benefits given by the Group to its employees include salaries and wage, social security contributions, short-term compensated absences, bonuses and other non-monetary benefits.
Retirement benefits Retirement benefit cost is actuarially determined using projected unit credit method. Actuarial gains or losses are recognized as income or expense when the net cumulative unrecognized actuarial gains and losses for the plan at the end of the previous reporting year exceeded 10% of the higher of the present value of the defined benefit obligation and the fair value of the plan assets at that date. These gains and losses are recognized over the expected average remaining working lives of the employees participating in the plan.
54
Past service cost is recognized as an expense on a straight line basis over the average period until the benefits become vested. If the benefits are already vested immediately following the introduction of, or changes to a retirement plan, past service cost is recognized immediately. The define benefit obligation is the aggregate of the present value of the defined benefit contribution and actuarial gains and losses not recognized, reduced by past service costs not yet recognized, and the fair value of plan assets, out of which the obligation are to be settled directly. If such aggregate is negative, the asset is measured at the lower of such aggregate or the aggregate of cumulative unrecognized net actuarial losses and past service cost and the present value of any economic benefits available in the form of refunds from the plan or reductions in the future contributions to the plan. If the asset is measured at the aggregate of cumulative unrecognized net actuarial losses and past service cost and the present value of any economic benefits available in the form of refunds from the plan or reductions in the future contributions to the plan, net actuarial losses of the current period and past service cost of the current period are recognized immediately to the extent that these exceed any reduction in the present value of those economic benefits. If there is no change or increase in the present value of the economic benefits, the entire net actuarial losses or the current period and past service cost of the current period and past service cost of the current period are recognized immediately. Similarly, net actuarial gains of the current period after the deduction of past service cost of the current period exceeding any increase in the present value of the economic benefits stated above are recognized immediately if the asset is measured at the aggregate of cumulative unrecognized net actuarial losses and past service cost and the present value of economic benefits available in the form of refunds from the plan or reductions in the future contributions to the plan. If there is no change or decrease in the present value of the economic benefits, the entire net actuarial gains of the current period after the deduction of past service cost of the current period are recognized immediately. The Group has defined benefit pension plan, which requires contributions to be made to a separately administered fund. The cost of providing benefits under the defined benefit plan is determined by using the projected unit credit actuarial valuation method. Actuarial gains and losses are recognized as income or expense when the net cumulative unrecognized actuarial gains and losses for each individual plan at the end of the previous reporting year exceeded 10% of the higher of the defined benefit obligation and the fair value of plan assets at that date. These gains or losses are recognized over the expected average remaining working lives of the employees participating in the plan.
Termination benefits Termination benefits are payable when employment is terminated by the Group before the normal retirement date, or whenever the employee accepts voluntary redundancy in exchange for these benefits.
Compensated absences Compensated absences are recognized for the number of paid leave days (including holiday entitlement) remaining at the end of the financial reporting period. Operating Lease Group as a lessee Leases of assets under which the lessor effectively retains all the risks and reward of ownership are classified as operating lease. Operating lease payments are recognized as expense in the consolidated statements of income on a monthly basis based on the contractual agreement. Associated costs such as repairs and maintenance and business taxes are expense when incurred. Group as a lessor Leases where the Group does not transfer substantially all the risks and benefits of the ownership of the assets are classified as operating leases. Operating lease receipts are recognized in the consolidated statements of income on a straight line basis over the lease term.
55
Borrowing Cost Borrowing costs that are directly attributable to the acquisition or construction of a qualifying asset while the asset, which includes intangibles and property and equipment, is being constructed are capitalized as part of the cost of that asset. Capitalization of borrowing cost should commence when: (i) expenditures for the asset and borrowing costs are being incurred; and (ii) activities that are necessary to prepare the asset for its intended use or sale are in progress. Capitalization ceases when the asset is substantially ready for its intended use or sale. If active development is interrupted for an extended period, capitalization is suspended. When construction occurs piecemeal and use of each part is possible as construction continues, capitalization of each part ceases upon substantial completion of that part. For borrowing associated with a specific asset, the actual rate on that borrowing is used. Otherwise, a weighted average cost of borrowing is used. All other borrowing costs are expensed as incurred.
Foreign Currency Transactions The consolidated financial statements are presented in Philippine Pesos, which is the Group’s functional and presentation currency. Items included in the consolidated financial statements of each entity are measured using the functional currency. Transactions in foreign currencies are initially recorded in the functional currency rate prevailing at the date of the transaction. Monetary assets and liabilities denominated in foreign currencies are restated at the functional currency rate of exchange as of the financial reporting date. Gains or losses arising from these transactions and translations are recognized in the consolidated statements of income. Non-monetary items measured at fair value in a foreign currency are translated using the exchange rates at the date when the fair value was determined. Income Tax Income taxes represent the sum of the tax currently due and deferred tax. The tax currently due is based on taxable income for the year. Taxable income differs from income as reported in the consolidated statements of income because it excludes items of income or expenses that are taxable or deductible in other years and it further excludes items that are never taxable or deductible. The Group’s liability for current income tax is calculated using tax rates that have been enacted or substantively enacted at the end of financial reporting period. Deferred tax is provided, using the liability method. Deferred tax assets and liabilities are recognized for future tax consequence attributable to differences between the financial reporting bases of assets and liabilities and their related tax bases. Deferred tax assets are recognized for all deductible temporary differences, carry forward benefit of unused tax credits from excess minimum corporate income tax (MCIT) and carry forward benefit of unused net operating loss carryover (NOLCO), to the extent that it is probable that taxable profit will be available against which the deductible temporary difference can be utilized. Deferred tax liabilities are recognized for all taxable temporary differences. Deferred tax assets and liabilities are measured using the tax rate that is expected to apply to the period when the asset is realized or the liability is settled. The carrying amount of deferred tax assets is reviewed at each end of financial reporting period and reduced to the extent that it is no longer probable that sufficient taxable profit will be available to allow all or part of the deferred income tax assets to be utilized. Related Party Transactions Transactions between related parties are based on terms similar to those offered to non-related parties. Parties are considered to be related if one party has the ability, directly or indirectly, to control the other party or exercise significant influence over the other party in making financial and operating decisions and the parties are subject to common control or common significant influence. Related parties may be individuals or corporate entities.
56
Provisions A provision is recognized when the Group has a present obligation (legal or constructive) as a result of past event, it is probable that an outflow of resources embodying economic benefits will be required to settle the obligation, and a reliable estimate can be made of the amount of the obligation. If the effect of the time value of money is material, provisions are determined by discounting the expected the expected future cash flows at a pre-tax rate that reflects current market assessment of the time value of money and, where appropriate, the risks specific to the liability. Where discounting is used, the increase in the provision due to passage of time is recognized as a borrowing cost. Contingencies Contingent liabilities are not recognized in the consolidated financial statements. They are disclosed unless the possibility of an outflow of resources embodying economic benefits is remote. A contingent asset is not recognized in the consolidated financial statements but disclosed when an inflow of economic benefit is probable. Equity Share capital is determined using the nominal value of shares that have been issued. Additional paid-in capital includes any premiums received on the initial issuance of capital stock. Any transaction costs associated with the issuance of shares are deducted from additional paid-in capital, net of any related income tax benefits. Net unrealized gain on available-for-sale investment accounts for the excess of the fair market value over the carrying amounts of these investments. When fluctuation is deemed permanent, the gain or loss resulting from such fluctuation will be reversed and charged to consolidated statements of income in the year that the permanent fluctuation is determined. Treasury shares are stated at the cost of re-acquiring such shares. Retained earnings include all current and prior period results as disclosed in the consolidated statements of income. Noncontrolling Interests Noncontrolling interest represents the interest in a subsidiary, which is not owned, directly or indirectly through subsidiaries, by the Group. If losses applicable to the minority interest in a subsidiary exceed the minority interest’s equity in the subsidiary, the excess, and any further losses applicable to the minority interest, are charged against the majority interest except to the extent that the minority has a binding obligation to, and is able to, make good the losses. If the subsidiary subsequently reports profits, the majority interest is allocated all such profits until the minority interest’s share of losses previously absorbed by the majority interest has been recovered. Earnings per share Basic earnings per share is determined by dividing net income for the year by weighted average number of common shares outstanding during the year (after retroactive adjustment for any stock dividends declared in the current year). Diluted EPS is computed by dividing net income for the year by the weighted average number of common shares issued and outstanding during the year after giving effect to assumed conversion of potential common shares. In determining both the basic and diluted earnings per share, the effect of stock dividends, if any, is accounted for retroactively.

57
Segment reporting For management purposes, the Group is organized into six (6) major operating businesses which comprise the bases on which the Group reports its primary segment information. Financial information on business segments is presented in Note 35. The Group has no geographical segments as all of the companies primarily operate only in the Philippines. Segment revenue, expenses and performance include transfers between business segments. The transfers are accounted for at competitive market prices charged to unaffiliated customers for similar products and services. The measurement policies the Group used for segment reporting are the same as those used in the consolidated financial statements. There have been no changes from prior periods in the measurement methods used to determine profit and loss. No asymmetrical allocations have been applied between segments. Inter-segment assets, liabilities, revenue, expenses and results are eliminated in the consolidated financial statements. Events After End of Financial Reporting Period Post year-end events that provide additional information about the Group’s position at the end of financial reporting period, if any, are reflected in the consolidated financial statements. However, post year-end events that are not adjusting events are disclosed in the notes to the consolidated financial statements when material.
5. Significant Accounting Judgments, Estimates and Assumptions
The preparation of the Group’s consolidated financial statements in conformity with PFRS requires management to make estimates and assumptions that affect the amounts reported in the consolidated financial statements and accompanying notes. The estimates and assumptions used in the accompanying consolidated financial statements are based upon management’s evaluation of relevant facts and circumstances as of date of the consolidated financial statements. Actual results could differ from such estimates. The following is a summary of these significant estimates and judgments and the related impact and associated risks on the consolidated financial statements. Judgments • Determination of Control.
The Parent Company determines control when it is exposed, or has rights, to variable returns from its involvement with an entity and has the ability to affect those returns through its power over the equity. The Parent Company controls an entity if and only if the Parent Company has all of the following:
• Power over the entity; • Exposure, or rights, to variable returns from its involvement with the entity; and, • The ability to use its power over the entity to affect the amount of the Parent Company's
returns.
The Parent Company regularly reassesses whether it controls an investee if facts and circumstances indicate that there are changes to one or more of the three elements of control listed above.
• Real Estate Revenue and Cost Recognition In determining whether economic benefits will flow to the Group and the revenue can be reliably measured, the Group assesses certain judgments based on buyers’ commitment on sale which may be ascertained through the significance of the buyer’s initial down payment, and stage of completion of the project development. Total costs of property development are based on cost estimates made by the Group’s technical personnel made in concurrence with management. These estimated costs are
58
reviewed at least annually and are updated if expectations differ from previous estimates. Changes are mainly due to adjustments in development plan, materials and labor prices. Also, the Group’s revenue recognition policies require management to make use of estimates and assumptions that may affect the reported amounts of revenue and costs. The Group’s revenue from real estate sales are recognized based on the percentage-of-completion and the completion rate is measured principally on the basis of the estimated completion of a physical proportion of the contract work, and by reference to the actual costs incurred to date over the estimated total costs of projects. Revenue and costs from sale of real estate are shown in Notes 22 and 25, respectively.
• Classification of Financial Instruments
The Group classifies a financial instrument, or its component parts, on initial recognition financial liability or an equity instrument in accordance with the substance of the contractual definitions of a financial asset, a financial liability or an equity instrument. The substance rather than its legal form, governs its classification in the consolidated statements of financial position.
• Classification of Leases The Group has entered into various lease agreements as either a lessor or a lessee. Critical judgment was exercised by management to distinguish each lease agreement as either an operating or finance lease by looking at the transfer or retention of significant risk and rewards of ownership of the properties covered by the agreements. Currently, all of the Group’s lease agreements are determined to be operating leases. Rental expense and income for the first quarter of 2016 and 2015 are shown in Notes 19 and 27, respectively.
• Distinction Between Investment Property and Owner-Occupied Property The Group determines whether a property qualifies as investment property. In making its judgment, the Group considers whether the property generates cash flows largely independent of the other assets held by an entity. Owner-occupied properties generate cash flows that are attributable not only to property but also to the other assets used in the supply process.
Some properties are held to earn rentals or for capital appreciation and other properties are held for use in rendering of services or for administrative purposes. If these portions cannot be sold separately, the property is accounted for as investment property only if an insignificant portion is held for use in providing services or for administrative purposes. Judgment is applied in determining whether ancillary services are so significant that a property does not qualify as investment property. The Group considers each property in making its judgment.
• Determination of Fair Value of Financial Instruments The Group carries certain financial assets and liabilities at fair value, which requires extensive use of accounting estimates and judgment. While significant components of fair value measurement were determined using verifiable objective evidence, the amount of changes in fair value would differ if the Group utilized different valuation methodologies and assumptions. Any changes in fair value of these financial assets and liabilities would affect income and loss and equity.
The summary of the carrying values and fair values of the Group’s financial instruments as of March 31, 2016 and December 31, 2015 is shown in Note 30.
Estimates
• Estimation of Allowances for Doubtful Accounts
Recoverability of specific receivables including amounts due from related parties is evaluated based on the best available facts and circumstances, the length of the Group’s relationship with its debtors, the debtors’ payment behavior and known market factors. These specific reserves are reevaluated and adjusted as additional information received affects the amount estimated to be uncollectible.

59
The Group’s allowance for doubtful accounts amounted to P=0.4 million as of March 31, 2016 and December 31, 2015 (see Note 7). The carrying values of accounts receivables and amounts due from related parties as of March 31, 2016 and December 31, 2015 are shown in Notes 7 and 19, respectively.
• Estimation of Impairment of Financial Assets The computation for the impairment of available-for-sale financial assets and refundable deposits requires an estimation of the present value of the expected future cash flows and the selection of an appropriate discount rate. An impairment issue arises when there is an objective evidence of impairment, which involves significant judgment. In making this judgment, the Group evaluates the financial health of the issuer, among others. In the case of available-for-sale equity instruments, the Group expands its analysis to consider changes in the issuer’s industry and sector performance, legal and regulatory framework, changes in technology, and other factors that affect the recoverability of the Group’s investments. No impairment losses on financial assets were recognized in the first quarter of 2016 and December 2015.
• Estimation of Useful Lives of Certain Assets The Group estimates the useful lives of investment properties, property and equipment and intangible assets based on the period over which the assets are expected to be available for use. The estimated useful lives of these assets are reviewed periodically and are updated if expectations differ from previous estimates due to physical wear and tear, technical or commercial obsolescence and legal or other limits on the use of the assets. In addition, the estimation of the useful lives of these assets is based on collective assessment of internal technical evaluation and experience with similar assets. It is possible, however, that future results of operations could be materially affected by changes in estimates brought about by any changes in factors mentioned. The amounts and timing of recorded expenses for any period would be affected by changes in these factors and circumstances. A reduction in the estimated useful lives of investment properties, property and equipment and intangible assets would increase recorded operating expenses and decrease noncurrent assets. There were no significant changes on the estimated useful lives of the above mentioned assets. The carrying value of the Group’s investment properties, depreciable property and equipment, and leasehold rights amounted to P=208 million, P=461 million and P=34 million, respectively as of March 31, 2016 and P=221 million, P=460 million and P=34 million, respectively as of December 31, 2015, (see Notes 12, 13 and 16). As of March 31, 2016 and December 31, 2015, the Group’s property and equipment have no residual values.
• Determination of Net Realizable Value of Inventories The Parent Company uses the fair value to determine how much it could gain by selling its real estate held-for-sale inventories, agricultural produce and other inventories. The net realizable value is calculated in an effort to prevent the Parent Company from under or overestimating the value of its real estate held-for-sale inventories, agricultural produce and other inventories.
• Impairment of Non-financial Assets The Group reviews inventories, land and improvements, investment properties, property and equipment, biological assets, leasehold rights and other assets for impairment of value. This includes considering certain indications of impairment such as significant changes in asset usage, significant decline in assets’ market value, obsolescence or physical damage of an asset, plans in the real estate projects, significant underperformance relative to expected historical or projected future operating results and significant negative industry or economic trends. As described in the accounting policy, the Group estimates the recoverable amount as the higher of the net selling price and value in use. In determining the present value of estimated future cash flows expected to be generated from the continued use of the assets, the Group is required to make estimates and assumptions that may affect
60
land and improvements, investment properties, property and equipment, biological assets and other assets. The Group’s allowance for impairment loss pertaining to an investment property amounted to P=20 million as of March 31, 2016 and December 31, 2015, respectively (see Note 12). Provision for impairment loss recognized in the consolidated statements of income amounted to P=0.6 million in the first quarter of 2015. The carrying amounts of investment properties, property and equipment, biological assets and leasehold rights are disclosed in Notes 13, 14, 16 and 17, respectively.
• Estimation of Pension and Other Retirement Benefits The determination of the Group’s obligation and cost for pension and other retirement benefits is dependent on management’s selection of certain assumptions used by actuaries in calculating such amounts. The assumptions for pension costs and other retirement benefits are described in Note 25, and include among others, expected returns on plan assets and rates of compensation increase. In accordance with PFRS, actual results that differ from our assumptions are accumulated and amortized over future periods and therefore, generally affect the Group’s recognized expense and recorded obligation in such future periods. While management believes that the assumptions are reasonable and appropriate, significant differences in actual experience or significant changes in management assumptions may materially affect the Group’s pension and other retirement obligations.
• Estimation of Deferred Income Tax Assets and Deferred Tax Liabilities Significant judgment is required in determining provision for income taxes. There are many transactions and calculations for which the ultimate tax determination is uncertain during the ordinary course of business. Where the final tax outcome of these matters is different from the amounts that were initially recorded, such differences will impact the income tax and deferred tax provisions in the period in which such determination is made. The Group’s deferred income tax assets amounted to P=50.7 million and P=40.6 million as of March 31, 2016 and December 31, 2015, respectively (see Note 28). The Group’s deferred tax liabilities amounted to P=91.5 million and P=82.4 million as of March 31, 2016 and December 31, 2015, respectively (see Note 28).
• Estimation of Provisions for Contingencies The Group is a party to certain lawsuits involving recoveries of sum of money arising from the ordinary course of business. The estimate of the probable costs for the resolution of possible claims has been developed in consultation with outside counsel handling the Group’s defense in these matters and is based upon an analysis of potential results. These are recognized in the books only when the claims are finally settled or when judgment is rendered. There is no provision for probable losses recognized in the consolidated financial statements in 2016 and 2015.
• Estimation of Fair Value of Biological Assets and Agricultural Produce The total estimated production of the Company’s biological assets is based on the expected crop yield over its expected lifespan which patterned on the scientific studies conducted on neighboring countries wherein similar biological assets are also grown. Unit-of-harvest method is used in determining the periodic amortization over the estimated yield of the crops over its life span. As of March 31, 2016 and December 31, 2015, the Group’s biological assets have a carrying value of P=412 million and P=404 million, respectively (see Note 15).
61
6. Cash This account consists of:
As of 03/31/2016 (Unaudited)
As of 12/31/2015
(Audited) Cash on hand P= 1,138,635 P=861,629 Cash in banks 16,156,319 43,058,852 P= 17,294,954 P=43,920,481 Cash in banks pertain to savings and current account that generally earned interest based on prevailing respective bank deposit rates of approximately less than 1% per annum in 2016 and 2015. The Group’s cash in banks include dollar-denominated accounts with Peso equivalent amounting to P=348,721 and P=389,395 as of March 31, 2016 and December 31, 2015, respectively. The Group’s foreign currency denominated cash account is translated to Peso equivalents using an exchange rate of P=46.108/$1.00 and P=44.166/$1.00 as at March 31, 2016 and December 31, 2015, respectively. In 2013, the Parent Company established and opened a project deposit account with the Development Bank of the Philippines for the purpose of complying with the requirements of Republic Act No. 7279, otherwise known as the “Urban Development and Housing Act of 1992” relative to the Parent Company’s socialized housing at West Highland Subdivision Project located in Butuan, Agusan Del Norte. Total cash in bank restricted for other purposes except those related to the project amounted to P=0.1 million as of March 31, 2016 and December 31, 2015, respectively. Financial income recognized in the consolidated statements of income on cash in banks amounted to P=1,207 and P=16,285 for the quarters ending March 31, 2016 and March 31, 2015 respectively (see Note 21).
7. Accounts Receivable
This account consists of:
As of 03/31/2016 (Unaudited)
As of 12/31/2015
(Audited) Contract receivables on sale of real estate P=456,524,150 P=438,734,960 Trade receivable 27,748,330 13,130,365 Advances to officers and employees 1,315,921 1,427,312 Others 94,060,825 93,021,934 Total receivables 579,649,226 546,314,571 Allowance for doubtful accounts (453,225) (453,225) 579,196,001 545,861,346 Noncurrent portion of receivables:
Contract receivables on sale of real estates (131,976,898) (109,980,748)
P=447,219,103 P=435,880,598
Contract receivables on sale of real estate represent amounts due and collectible in monthly installment over a period of 5 to 15 years, and bear interest ranging from less than 10% to 18% in 2016 and 2015. The transfer certificates of title remain in the possession of the Group until full payment has been made by the customers. Interest income on contract receivables on sale of real estate amounted to P=2.6 million and P=4.6 million for the first quarter in 2016 and 2015, respectively (see Note 21).
62
No contract receivables on sale of real estate are collateralized as of March 31, 2016 and December 31, 2015. Accrued interest receivable includes interest from contract receivables, notes receivable and loans receivable.
Other receivables are interest-free. These include receivables from various companies for the sale of available-for-sale investments in 2008 and various advances to suppliers and contractors in 2016 and 2015. Other receivables amounting to P=0.5 million as of March 31, 2016 and December 31, 2015, were impaired and fully provided for. There was no additional provision for doubtful accounts in the first quarter of 2016.
8. Real Estate Held for Sale
Real estate held for sale represents land, development costs and construction materials issued to the Group’s various projects in Cagayan de Oro City, Initao, Valencia City, Bukidnon and Butuan detailed as follows: As of
03/31/2016 (Unaudited)
As of 12/31/2015
(Audited) Land P= 178,008,435 P=173,795,994 Development cost and materials 462,535,369 497,142,446 P=640,543,804 P=670,938,440
Real estate held for sale with carrying value of P=550.8 million and P=518.5 million as of March 31, 2016 and December 31, 2015, respectively, are collateralized to the loans obtained from UCPB, BPI, BPIF, UBP, and DBP (see Note 18). In 2013, the Group reclassified land and improvements amounting to P=10.5 million into real estate held for sale. Also, investment property with carrying value of P=22.3 million was reclassified to real estate held for sale. The Group reclassified land cost of P=107.1 million in 2012 into real estate held for sale previously accounted for as land and improvements and investment properties (see Notes 12 and 14). The Group also reclassified real estate held for sale with a total cost of P=13.8 million in 2015, P=203.8 million in 2014 and P=173.3 million in 2013 into land and improvements (see Note 14).
9. Inventories, Prepayments and Other Current Assets a. Inventories
This account consists of: As of
03/31/2016 (Unaudited)
As of 12/31/2015
(Audited) Refined bleached deodorized oil P=12,630,854 P=11,569,301 Palm Olein 5,608,551 6,354,518 Aggregates and water meter 4,354,081 5,008,799 Palm acid oil and fatty acid distillate 4,286,351 4,234,707 Crude palm oil 3,349,611 13,902,968 Palm Stearin 1,373,212 3,597,750 Palm kernels 98,489 - P=31,701,149 P=44,668,043
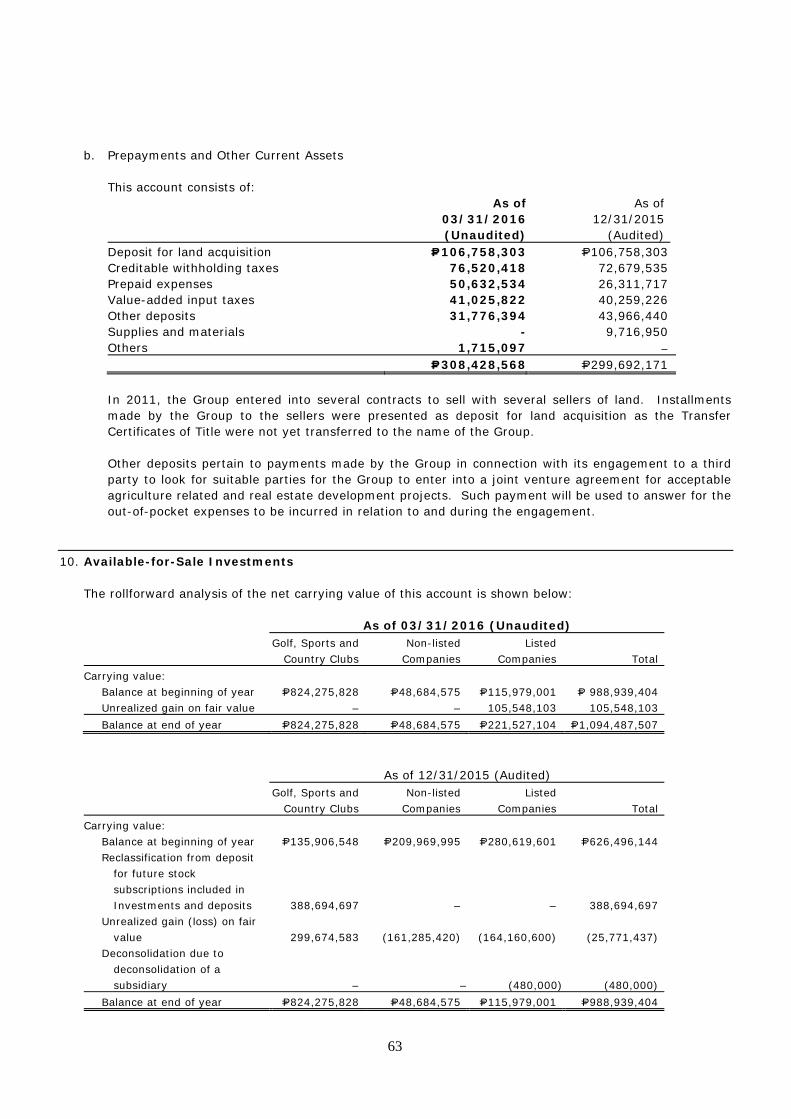
63
b. Prepayments and Other Current Assets
This account consists of:
As of03/31/2016(Unaudited)
As of 12/31/2015
(Audited) Deposit for land acquisition P=106,758,303 P=106,758,303 Creditable withholding taxes 76,520,418 72,679,535 Prepaid expenses 50,632,534 26,311,717 Value-added input taxes 41,025,822 40,259,226 Other deposits 31,776,394 43,966,440 Supplies and materials - 9,716,950 Others 1,715,097 – P=308,428,568 P=299,692,171
In 2011, the Group entered into several contracts to sell with several sellers of land. Installments made by the Group to the sellers were presented as deposit for land acquisition as the Transfer Certificates of Title were not yet transferred to the name of the Group.
Other deposits pertain to payments made by the Group in connection with its engagement to a third party to look for suitable parties for the Group to enter into a joint venture agreement for acceptable agriculture related and real estate development projects. Such payment will be used to answer for the out-of-pocket expenses to be incurred in relation to and during the engagement.
10. Available-for-Sale Investments
The rollforward analysis of the net carrying value of this account is shown below: As of 03/31/2016 (Unaudited) Golf, Sports and
Country Clubs Non-listed
Companies Listed
Companies Total Carrying value:
Balance at beginning of year P=824,275,828 P=48,684,575 P=115,979,001 P= 988,939,404 Unrealized gain on fair value – – 105,548,103 105,548,103 Balance at end of year P=824,275,828 P=48,684,575 P=221,527,104 P=1,094,487,507
As of 12/31/2015 (Audited) Golf, Sports and
Country Clubs Non-listed
Companies Listed
Companies Total Carrying value:
Balance at beginning of year P=135,906,548 P=209,969,995 P=280,619,601 P=626,496,144 Reclassification from deposit
for future stock subscriptions included in Investments and deposits 388,694,697 – – 388,694,697
Unrealized gain (loss) on fair value 299,674,583 (161,285,420) (164,160,600) (25,771,437)
Deconsolidation due to deconsolidation of a subsidiary – – (480,000) (480,000)
Balance at end of year P=824,275,828 P=48,684,575 P=115,979,001 P=988,939,404
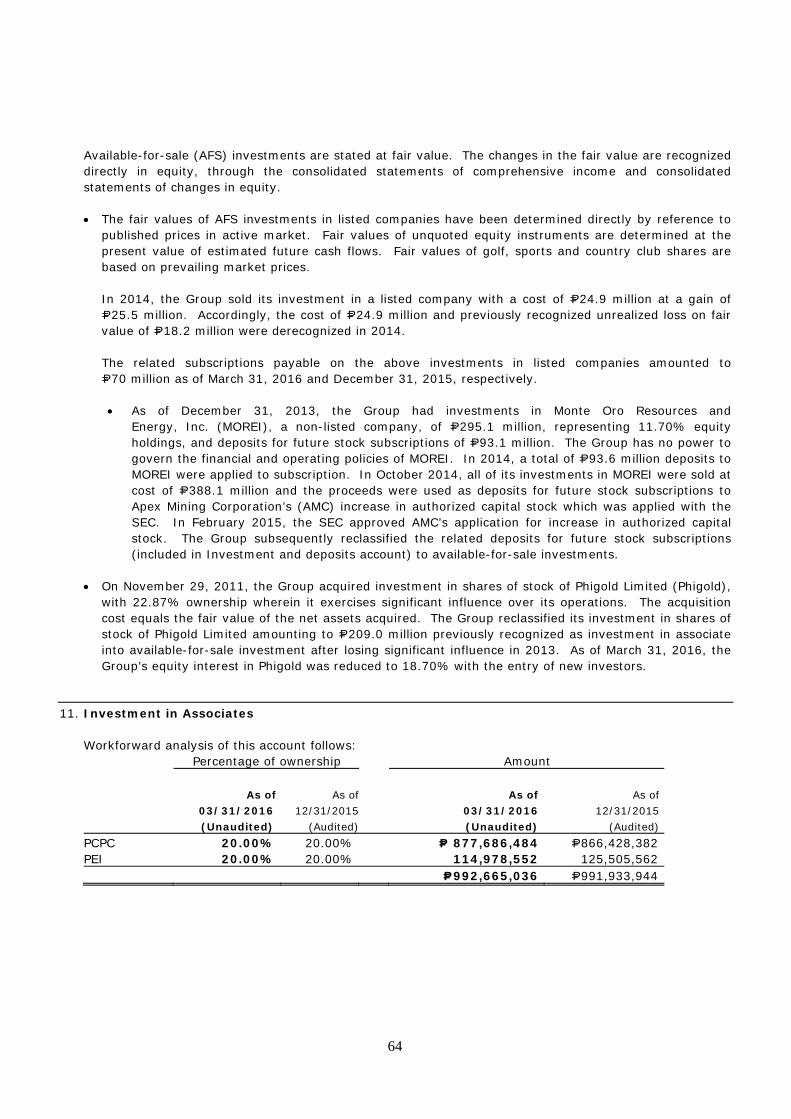
64
Available-for-sale (AFS) investments are stated at fair value. The changes in the fair value are recognized directly in equity, through the consolidated statements of comprehensive income and consolidated statements of changes in equity. • The fair values of AFS investments in listed companies have been determined directly by reference to
published prices in active market. Fair values of unquoted equity instruments are determined at the present value of estimated future cash flows. Fair values of golf, sports and country club shares are based on prevailing market prices. In 2014, the Group sold its investment in a listed company with a cost of P=24.9 million at a gain of P=25.5 million. Accordingly, the cost of P=24.9 million and previously recognized unrealized loss on fair value of P=18.2 million were derecognized in 2014. The related subscriptions payable on the above investments in listed companies amounted to P=70 million as of March 31, 2016 and December 31, 2015, respectively. • As of December 31, 2013, the Group had investments in Monte Oro Resources and
Energy, Inc. (MOREI), a non-listed company, of P=295.1 million, representing 11.70% equity holdings, and deposits for future stock subscriptions of P=93.1 million. The Group has no power to govern the financial and operating policies of MOREI. In 2014, a total of P=93.6 million deposits to MOREI were applied to subscription. In October 2014, all of its investments in MOREI were sold at cost of P=388.1 million and the proceeds were used as deposits for future stock subscriptions to Apex Mining Corporation’s (AMC) increase in authorized capital stock which was applied with the SEC. In February 2015, the SEC approved AMC’s application for increase in authorized capital stock. The Group subsequently reclassified the related deposits for future stock subscriptions (included in Investment and deposits account) to available-for-sale investments.
• On November 29, 2011, the Group acquired investment in shares of stock of Phigold Limited (Phigold),
with 22.87% ownership wherein it exercises significant influence over its operations. The acquisition cost equals the fair value of the net assets acquired. The Group reclassified its investment in shares of stock of Phigold Limited amounting to P=209.0 million previously recognized as investment in associate into available-for-sale investment after losing significant influence in 2013. As of March 31, 2016, the Group’s equity interest in Phigold was reduced to 18.70% with the entry of new investors.
11. Investment in Associates
Workforward analysis of this account follows: Percentage of ownership Amount
As of 03/31/2016 (Unaudited)
As of 12/31/2015
(Audited)
As of
03/31/2016 (Unaudited)
As of
12/31/2015 (Audited)
PCPC 20.00% 20.00% P= 877,686,484 P=866,428,382 PEI 20.00% 20.00% 114,978,552 125,505,562 P=992,665,036 P=991,933,944
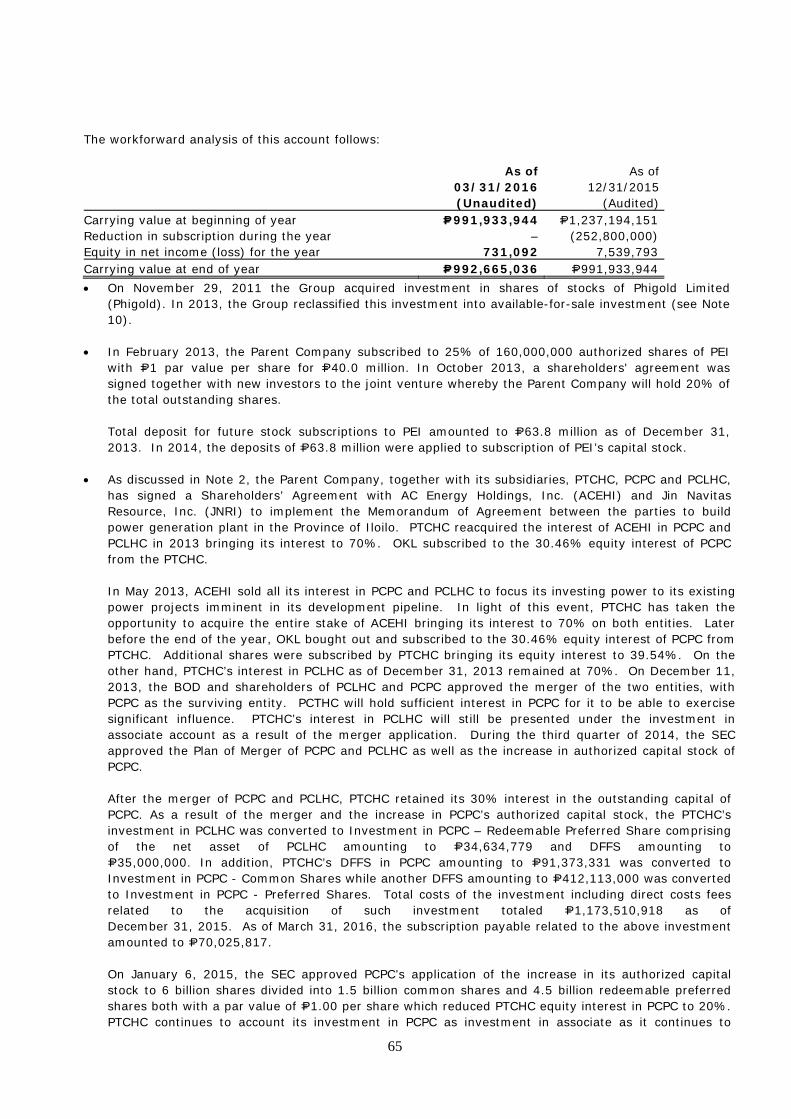
65
The workforward analysis of this account follows:
As of 03/31/2016 (Unaudited)
As of 12/31/2015
(Audited) Carrying value at beginning of year P=991,933,944 P=1,237,194,151 Reduction in subscription during the year – (252,800,000) Equity in net income (loss) for the year 731,092 7,539,793 Carrying value at end of year P=992,665,036 P=991,933,944 • On November 29, 2011 the Group acquired investment in shares of stocks of Phigold Limited
(Phigold). In 2013, the Group reclassified this investment into available-for-sale investment (see Note 10).
• In February 2013, the Parent Company subscribed to 25% of 160,000,000 authorized shares of PEI
with P=1 par value per share for P=40.0 million. In October 2013, a shareholders' agreement was signed together with new investors to the joint venture whereby the Parent Company will hold 20% of the total outstanding shares.
Total deposit for future stock subscriptions to PEI amounted to P=63.8 million as of December 31, 2013. In 2014, the deposits of P=63.8 million were applied to subscription of PEI’s capital stock.
• As discussed in Note 2, the Parent Company, together with its subsidiaries, PTCHC, PCPC and PCLHC, has signed a Shareholders’ Agreement with AC Energy Holdings, Inc. (ACEHI) and Jin Navitas Resource, Inc. (JNRI) to implement the Memorandum of Agreement between the parties to build power generation plant in the Province of Iloilo. PTCHC reacquired the interest of ACEHI in PCPC and PCLHC in 2013 bringing its interest to 70%. OKL subscribed to the 30.46% equity interest of PCPC from the PTCHC.
In May 2013, ACEHI sold all its interest in PCPC and PCLHC to focus its investing power to its existing power projects imminent in its development pipeline. In light of this event, PTCHC has taken the opportunity to acquire the entire stake of ACEHI bringing its interest to 70% on both entities. Later before the end of the year, OKL bought out and subscribed to the 30.46% equity interest of PCPC from PTCHC. Additional shares were subscribed by PTCHC bringing its equity interest to 39.54%. On the other hand, PTCHC’s interest in PCLHC as of December 31, 2013 remained at 70%. On December 11, 2013, the BOD and shareholders of PCLHC and PCPC approved the merger of the two entities, with PCPC as the surviving entity. PCTHC will hold sufficient interest in PCPC for it to be able to exercise significant influence. PTCHC’s interest in PCLHC will still be presented under the investment in associate account as a result of the merger application. During the third quarter of 2014, the SEC approved the Plan of Merger of PCPC and PCLHC as well as the increase in authorized capital stock of PCPC. After the merger of PCPC and PCLHC, PTCHC retained its 30% interest in the outstanding capital of PCPC. As a result of the merger and the increase in PCPC’s authorized capital stock, the PTCHC’s investment in PCLHC was converted to Investment in PCPC – Redeemable Preferred Share comprising of the net asset of PCLHC amounting to P=34,634,779 and DFFS amounting to P=35,000,000. In addition, PTCHC’s DFFS in PCPC amounting to P=91,373,331 was converted to Investment in PCPC - Common Shares while another DFFS amounting to P=412,113,000 was converted to Investment in PCPC - Preferred Shares. Total costs of the investment including direct costs fees related to the acquisition of such investment totaled P=1,173,510,918 as of December 31, 2015. As of March 31, 2016, the subscription payable related to the above investment amounted to P=70,025,817.
On January 6, 2015, the SEC approved PCPC’s application of the increase in its authorized capital stock to 6 billion shares divided into 1.5 billion common shares and 4.5 billion redeemable preferred shares both with a par value of P=1.00 per share which reduced PTCHC equity interest in PCPC to 20%. PTCHC continues to account its investment in PCPC as investment in associate as it continues to
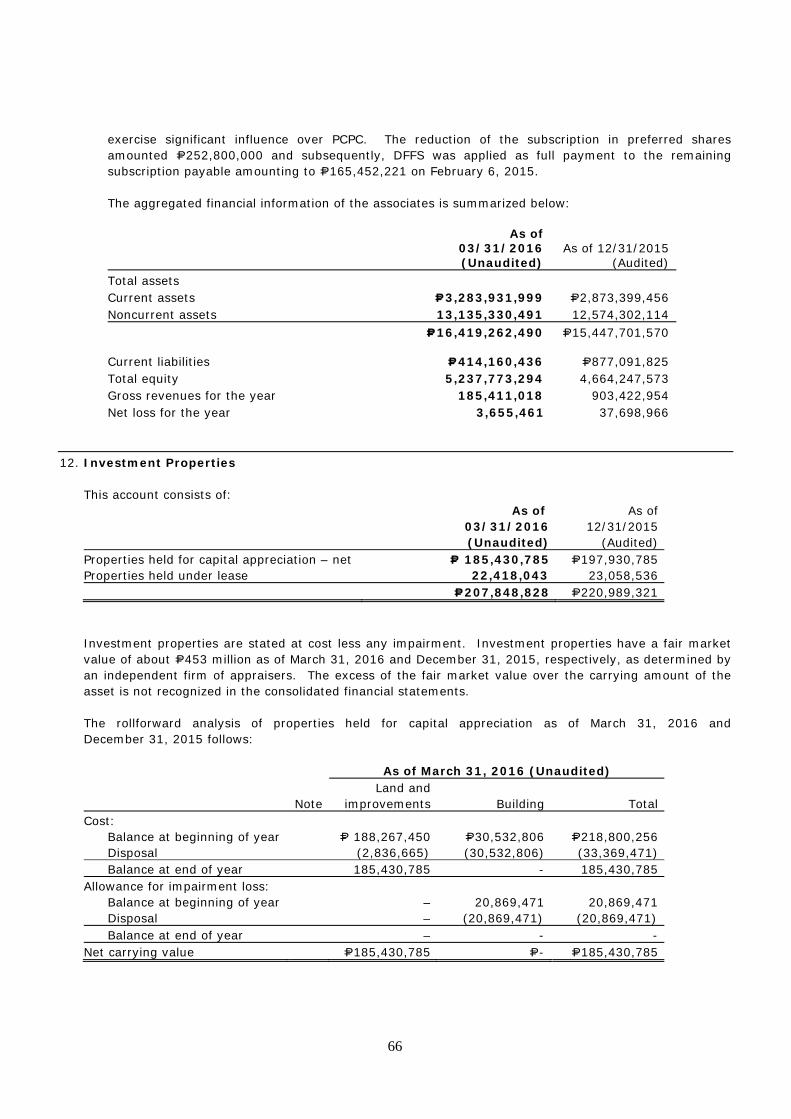
66
exercise significant influence over PCPC. The reduction of the subscription in preferred shares amounted P=252,800,000 and subsequently, DFFS was applied as full payment to the remaining subscription payable amounting to P=165,452,221 on February 6, 2015.
The aggregated financial information of the associates is summarized below:
As of 03/31/2016 (Unaudited)
As of 12/31/2015 (Audited)
Total assets Current assets P=3,283,931,999 P=2,873,399,456 Noncurrent assets 13,135,330,491 12,574,302,114 P=16,419,262,490 P=15,447,701,570 Current liabilities P=414,160,436 P=877,091,825 Total equity 5,237,773,294 4,664,247,573 Gross revenues for the year 185,411,018 903,422,954 Net loss for the year 3,655,461 37,698,966
12. Investment Properties
This account consists of:
As of 03/31/2016 (Unaudited)
As of 12/31/2015
(Audited) Properties held for capital appreciation – net P= 185,430,785 P=197,930,785 Properties held under lease 22,418,043 23,058,536 P=207,848,828 P=220,989,321
Investment properties are stated at cost less any impairment. Investment properties have a fair market value of about P=453 million as of March 31, 2016 and December 31, 2015, respectively, as determined by an independent firm of appraisers. The excess of the fair market value over the carrying amount of the asset is not recognized in the consolidated financial statements. The rollforward analysis of properties held for capital appreciation as of March 31, 2016 and December 31, 2015 follows:
As of March 31, 2016 (Unaudited)
Note Land and
improvements Building Total Cost:
Balance at beginning of year P= 188,267,450 P=30,532,806 P=218,800,256 Disposal (2,836,665) (30,532,806) (33,369,471) Balance at end of year 185,430,785 - 185,430,785
Allowance for impairment loss: Balance at beginning of year – 20,869,471 20,869,471 Disposal – (20,869,471) (20,869,471) Balance at end of year – - -
Net carrying value P=185,430,785 P=- P=185,430,785
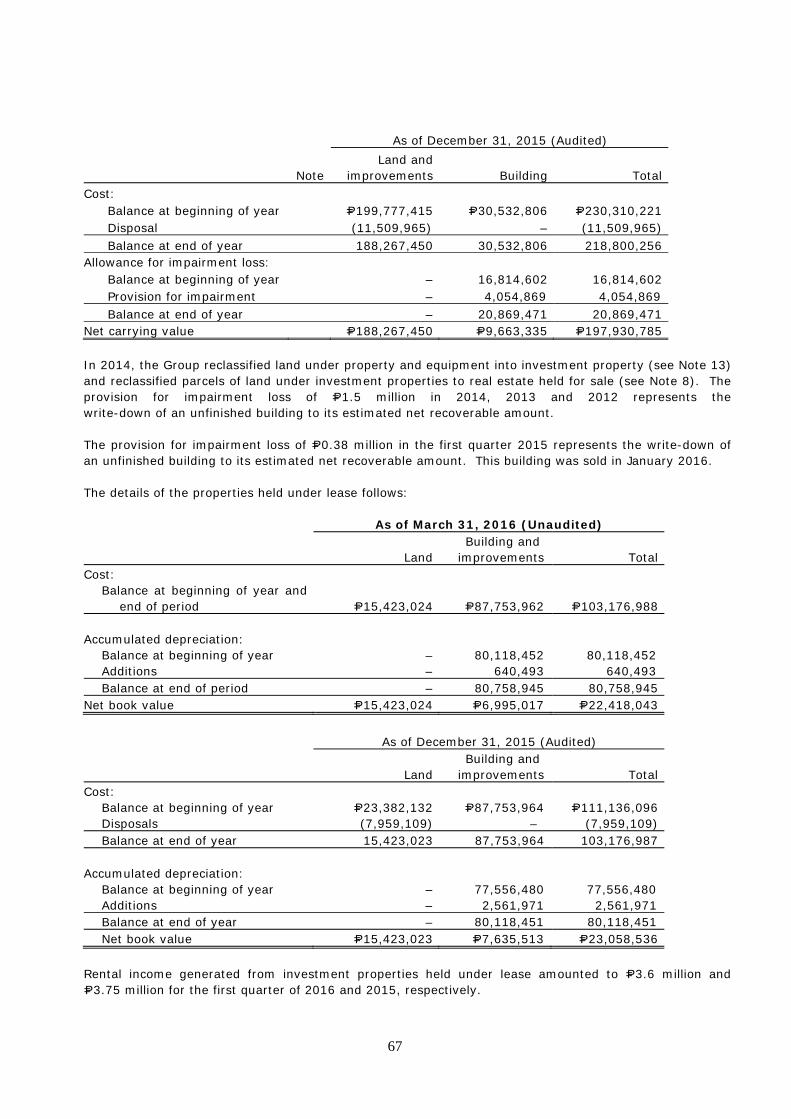
67
As of December 31, 2015 (Audited)
Note Land and
improvements Building Total Cost:
Balance at beginning of year P=199,777,415 P=30,532,806 P=230,310,221 Disposal (11,509,965) – (11,509,965) Balance at end of year 188,267,450 30,532,806 218,800,256
Allowance for impairment loss: Balance at beginning of year – 16,814,602 16,814,602 Provision for impairment – 4,054,869 4,054,869 Balance at end of year – 20,869,471 20,869,471
Net carrying value P=188,267,450 P=9,663,335 P=197,930,785 In 2014, the Group reclassified land under property and equipment into investment property (see Note 13) and reclassified parcels of land under investment properties to real estate held for sale (see Note 8). The provision for impairment loss of P=1.5 million in 2014, 2013 and 2012 represents the write-down of an unfinished building to its estimated net recoverable amount. The provision for impairment loss of P=0.38 million in the first quarter 2015 represents the write-down of an unfinished building to its estimated net recoverable amount. This building was sold in January 2016. The details of the properties held under lease follows:
As of March 31, 2016 (Unaudited)
Land Building and
improvements Total Cost:
Balance at beginning of year and end of period P=15,423,024 P=87,753,962 P=103,176,988
Accumulated depreciation:
Balance at beginning of year – 80,118,452 80,118,452 Additions – 640,493 640,493 Balance at end of period – 80,758,945 80,758,945
Net book value P=15,423,024 P=6,995,017 P=22,418,043
As of December 31, 2015 (Audited)
Land Building and
improvements Total Cost:
Balance at beginning of year P=23,382,132 P=87,753,964 P=111,136,096 Disposals (7,959,109) – (7,959,109) Balance at end of year 15,423,023 87,753,964 103,176,987
Accumulated depreciation: Balance at beginning of year – 77,556,480 77,556,480 Additions – 2,561,971 2,561,971 Balance at end of year – 80,118,451 80,118,451 Net book value P=15,423,023 P=7,635,513 P=23,058,536
Rental income generated from investment properties held under lease amounted to P=3.6 million and P=3.75 million for the first quarter of 2016 and 2015, respectively.
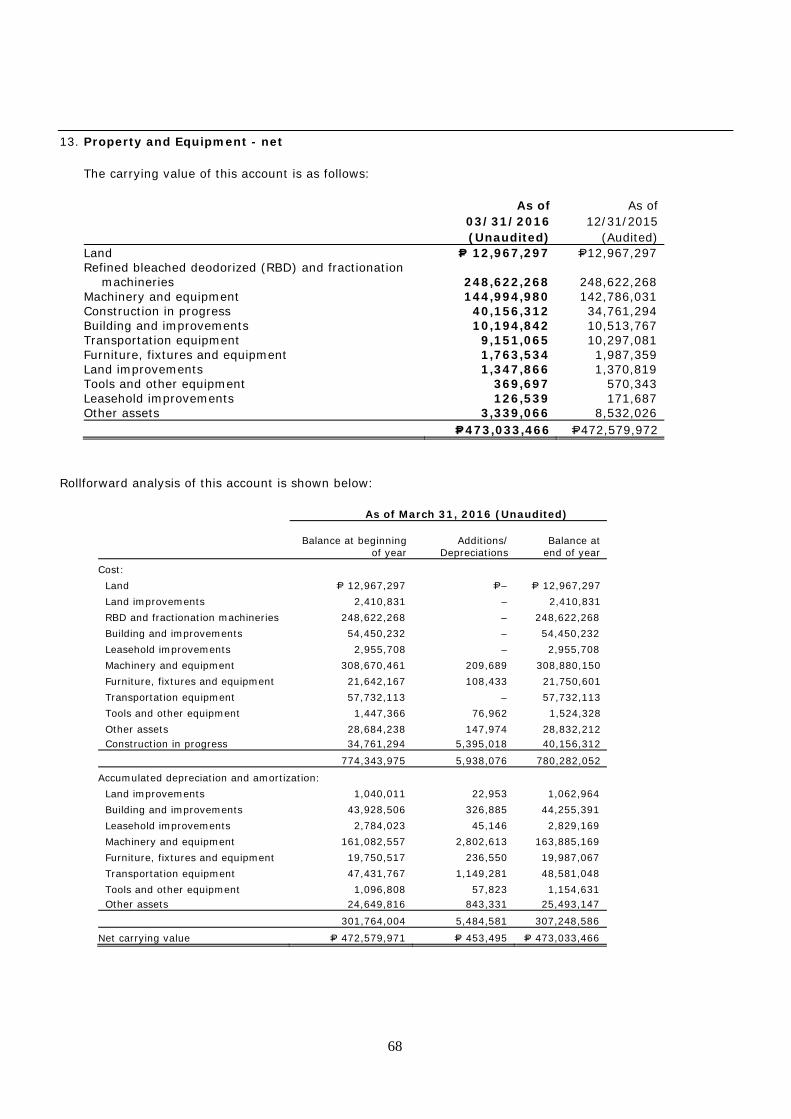
68
13. Property and Equipment - net
The carrying value of this account is as follows:
As of 03/31/2016 (Unaudited)
As of
12/31/2015 (Audited)
Land P= 12,967,297 P=12,967,297 Refined bleached deodorized (RBD) and fractionation
machineries
248,622,268 248,622,268 Machinery and equipment 144,994,980 142,786,031 Construction in progress 40,156,312 34,761,294 Building and improvements 10,194,842 10,513,767 Transportation equipment 9,151,065 10,297,081 Furniture, fixtures and equipment 1,763,534 1,987,359 Land improvements 1,347,866 1,370,819 Tools and other equipment 369,697 570,343 Leasehold improvements 126,539 171,687 Other assets 3,339,066 8,532,026 P=473,033,466 P=472,579,972
Rollforward analysis of this account is shown below:
As of March 31, 2016 (Unaudited)
Balance at beginning
of year Additions/
Depreciations Balance at
end of year
Cost: Land P= 12,967,297 P=– P= 12,967,297 Land improvements 2,410,831 – 2,410,831 RBD and fractionation machineries 248,622,268 – 248,622,268 Building and improvements 54,450,232 – 54,450,232 Leasehold improvements 2,955,708 – 2,955,708 Machinery and equipment 308,670,461 209,689 308,880,150 Furniture, fixtures and equipment 21,642,167 108,433 21,750,601 Transportation equipment 57,732,113 – 57,732,113 Tools and other equipment 1,447,366 76,962 1,524,328 Other assets 28,684,238 147,974 28,832,212 Construction in progress 34,761,294 5,395,018 40,156,312
774,343,975 5,938,076 780,282,052
Accumulated depreciation and amortization: Land improvements 1,040,011 22,953 1,062,964 Building and improvements 43,928,506 326,885 44,255,391 Leasehold improvements 2,784,023 45,146 2,829,169 Machinery and equipment 161,082,557 2,802,613 163,885,169 Furniture, fixtures and equipment 19,750,517 236,550 19,987,067 Transportation equipment 47,431,767 1,149,281 48,581,048 Tools and other equipment 1,096,808 57,823 1,154,631 Other assets 24,649,816 843,331 25,493,147
301,764,004 5,484,581 307,248,586
Net carrying value P= 472,579,971 P= 453,495 P= 473,033,466
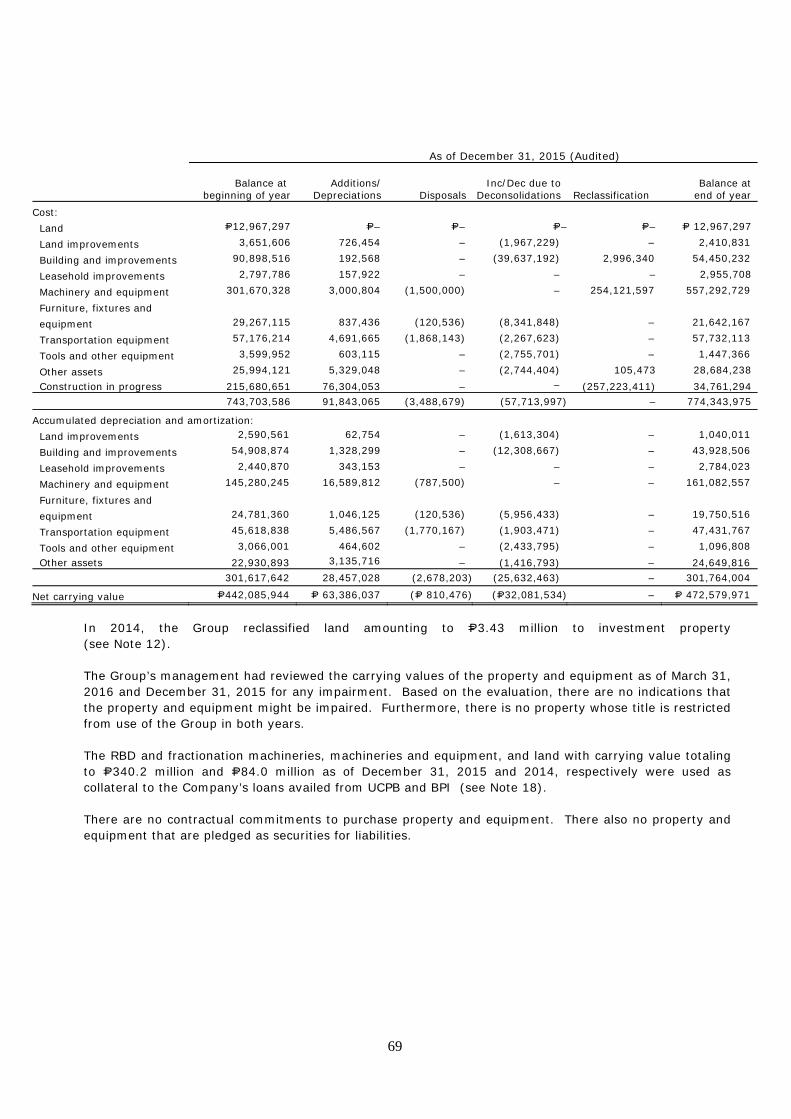
69
In 2014, the Group reclassified land amounting to P=3.43 million to investment property (see Note 12). The Group’s management had reviewed the carrying values of the property and equipment as of March 31, 2016 and December 31, 2015 for any impairment. Based on the evaluation, there are no indications that the property and equipment might be impaired. Furthermore, there is no property whose title is restricted from use of the Group in both years. The RBD and fractionation machineries, machineries and equipment, and land with carrying value totaling to P=340.2 million and P=84.0 million as of December 31, 2015 and 2014, respectively were used as collateral to the Company’s loans availed from UCPB and BPI (see Note 18). There are no contractual commitments to purchase property and equipment. There also no property and equipment that are pledged as securities for liabilities.
As of December 31, 2015 (Audited)
Balance at
beginning of year Additions/
Depreciations
Disposals
Inc/Dec due to
Deconsolidations Reclassification Balance at
end of year
Cost: Land P=12,967,297 P=– P=– P=– P=– P= 12,967,297
Land improvements 3,651,606 726,454 – (1,967,229) – 2,410,831
Building and improvements 90,898,516 192,568 – (39,637,192) 2,996,340 54,450,232
Leasehold improvements 2,797,786 157,922 – – – 2,955,708
Machinery and equipment 301,670,328 3,000,804 (1,500,000) – 254,121,597 557,292,729
Furniture, fixtures and equipment 29,267,115 837,436 (120,536) (8,341,848) – 21,642,167
Transportation equipment 57,176,214 4,691,665 (1,868,143) (2,267,623) – 57,732,113
Tools and other equipment 3,599,952 603,115 – (2,755,701) – 1,447,366
Other assets 25,994,121 5,329,048 – (2,744,404) 105,473 28,684,238 Construction in progress 215,680,651 76,304,053 – – (257,223,411) 34,761,294
743,703,586 91,843,065 (3,488,679) (57,713,997) – 774,343,975
Accumulated depreciation and amortization: Land improvements 2,590,561 62,754 – (1,613,304) – 1,040,011
Building and improvements 54,908,874 1,328,299 – (12,308,667) – 43,928,506
Leasehold improvements 2,440,870 343,153 – – – 2,784,023
Machinery and equipment 145,280,245 16,589,812 (787,500) – – 161,082,557
Furniture, fixtures and equipment 24,781,360 1,046,125 (120,536) (5,956,433) – 19,750,516
Transportation equipment 45,618,838 5,486,567 (1,770,167) (1,903,471) – 47,431,767
Tools and other equipment 3,066,001 464,602 – (2,433,795) – 1,096,808 Other assets 22,930,893 3,135,716 – (1,416,793) – 24,649,816
301,617,642 28,457,028 (2,678,203) (25,632,463) – 301,764,004
Net carrying value P=442,085,944 P= 63,386,037 (P= 810,476) (P=32,081,534) – P= 472,579,971
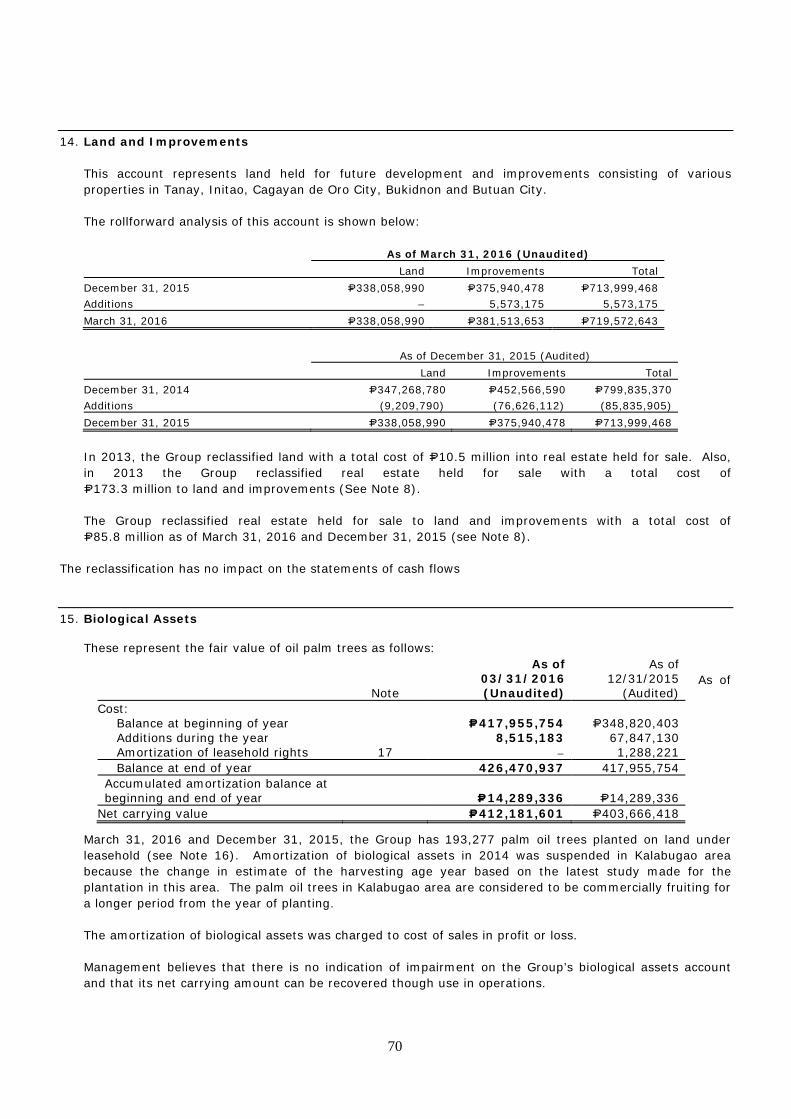
70
14. Land and Improvements This account represents land held for future development and improvements consisting of various properties in Tanay, Initao, Cagayan de Oro City, Bukidnon and Butuan City. The rollforward analysis of this account is shown below: As of March 31, 2016 (Unaudited) Land Improvements Total
December 31, 2015 P=338,058,990 P=375,940,478 P=713,999,468 Additions – 5,573,175 5,573,175 March 31, 2016 P=338,058,990 P=381,513,653 P=719,572,643
As of December 31, 2015 (Audited) Land Improvements Total
December 31, 2014 P=347,268,780 P=452,566,590 P=799,835,370 Additions (9,209,790) (76,626,112) (85,835,905) December 31, 2015 P=338,058,990 P=375,940,478 P=713,999,468
In 2013, the Group reclassified land with a total cost of P=10.5 million into real estate held for sale. Also, in 2013 the Group reclassified real estate held for sale with a total cost of P=173.3 million to land and improvements (See Note 8). The Group reclassified real estate held for sale to land and improvements with a total cost of P=85.8 million as of March 31, 2016 and December 31, 2015 (see Note 8).
The reclassification has no impact on the statements of cash flows 15. Biological Assets
These represent the fair value of oil palm trees as follows:
As of
March 31, 2016 and December 31, 2015, the Group has 193,277 palm oil trees planted on land under leasehold (see Note 16). Amortization of biological assets in 2014 was suspended in Kalabugao area because the change in estimate of the harvesting age year based on the latest study made for the plantation in this area. The palm oil trees in Kalabugao area are considered to be commercially fruiting for a longer period from the year of planting. The amortization of biological assets was charged to cost of sales in profit or loss. Management believes that there is no indication of impairment on the Group’s biological assets account and that its net carrying amount can be recovered though use in operations.
Note
As of 03/31/2016 (Unaudited)
As of 12/31/2015
(Audited) Cost:
Balance at beginning of year P=417,955,754 P=348,820,403 Additions during the year 8,515,183 67,847,130 Amortization of leasehold rights 17 – 1,288,221 Balance at end of year 426,470,937 417,955,754
Accumulated amortization balance at beginning and end of year
P=14,289,336 P=14,289,336
Net carrying value P=412,181,601 P=403,666,418
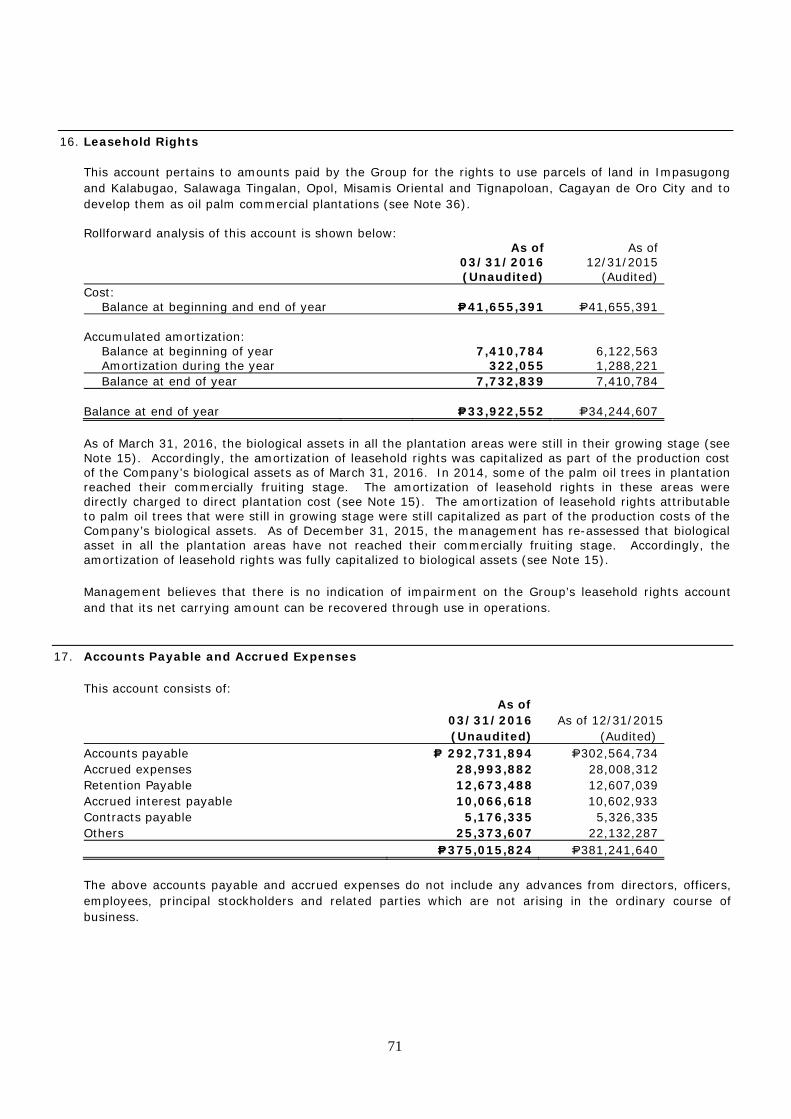
71
16. Leasehold Rights
This account pertains to amounts paid by the Group for the rights to use parcels of land in Impasugong and Kalabugao, Salawaga Tingalan, Opol, Misamis Oriental and Tignapoloan, Cagayan de Oro City and to develop them as oil palm commercial plantations (see Note 36).
Rollforward analysis of this account is shown below:
As of 03/31/2016 (Unaudited)
As of 12/31/2015
(Audited) Cost:
Balance at beginning and end of year P=41,655,391 P=41,655,391 Accumulated amortization:
Balance at beginning of year 7,410,784 6,122,563 Amortization during the year 322,055 1,288,221 Balance at end of year 7,732,839 7,410,784
Balance at end of year P=33,922,552 P=34,244,607 As of March 31, 2016, the biological assets in all the plantation areas were still in their growing stage (see Note 15). Accordingly, the amortization of leasehold rights was capitalized as part of the production cost of the Company’s biological assets as of March 31, 2016. In 2014, some of the palm oil trees in plantation reached their commercially fruiting stage. The amortization of leasehold rights in these areas were directly charged to direct plantation cost (see Note 15). The amortization of leasehold rights attributable to palm oil trees that were still in growing stage were still capitalized as part of the production costs of the Company’s biological assets. As of December 31, 2015, the management has re-assessed that biological asset in all the plantation areas have not reached their commercially fruiting stage. Accordingly, the amortization of leasehold rights was fully capitalized to biological assets (see Note 15). Management believes that there is no indication of impairment on the Group’s leasehold rights account and that its net carrying amount can be recovered through use in operations.
17. Accounts Payable and Accrued Expenses
This account consists of:
As of 03/31/2016 (Unaudited)
As of 12/31/2015
(Audited) Accounts payable P= 292,731,894 P=302,564,734 Accrued expenses 28,993,882 28,008,312 Retention Payable 12,673,488 12,607,039 Accrued interest payable 10,066,618 10,602,933 Contracts payable 5,176,335 5,326,335 Others 25,373,607 22,132,287 P=375,015,824 P=381,241,640 The above accounts payable and accrued expenses do not include any advances from directors, officers, employees, principal stockholders and related parties which are not arising in the ordinary course of business.
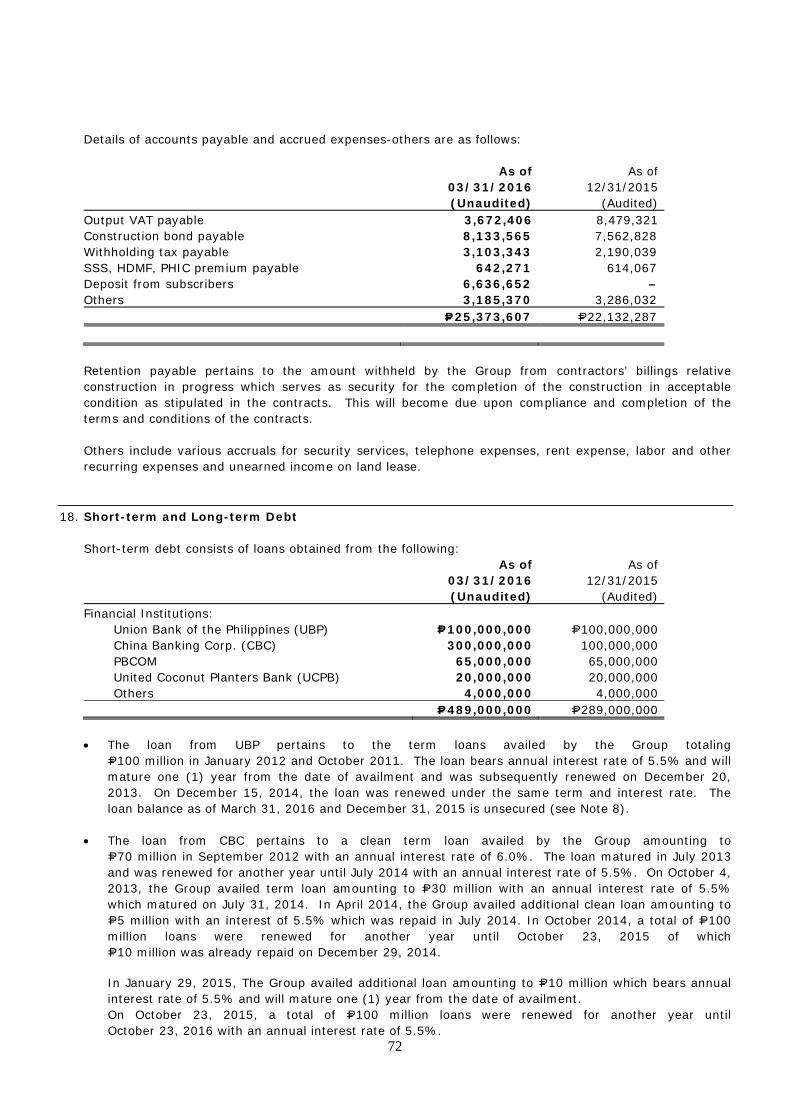
72
Details of accounts payable and accrued expenses-others are as follows:
As of 03/31/2016 (Unaudited)
As of 12/31/2015
(Audited) Output VAT payable 3,672,406 8,479,321 Construction bond payable 8,133,565 7,562,828 Withholding tax payable 3,103,343 2,190,039 SSS, HDMF, PHIC premium payable 642,271 614,067 Deposit from subscribers 6,636,652 – Others 3,185,370 3,286,032 P=25,373,607 P=22,132,287 Retention payable pertains to the amount withheld by the Group from contractors’ billings relative construction in progress which serves as security for the completion of the construction in acceptable condition as stipulated in the contracts. This will become due upon compliance and completion of the terms and conditions of the contracts. Others include various accruals for security services, telephone expenses, rent expense, labor and other recurring expenses and unearned income on land lease.
18. Short-term and Long-term Debt Short-term debt consists of loans obtained from the following: As of
03/31/2016 (Unaudited)
As of 12/31/2015
(Audited) Financial Institutions:
Union Bank of the Philippines (UBP) P=100,000,000 P=100,000,000 China Banking Corp. (CBC) 300,000,000 100,000,000 PBCOM 65,000,000 65,000,000 United Coconut Planters Bank (UCPB) 20,000,000 20,000,000 Others 4,000,000 4,000,000
P=489,000,000 P=289,000,000
• The loan from UBP pertains to the term loans availed by the Group totaling P=100 million in January 2012 and October 2011. The loan bears annual interest rate of 5.5% and will mature one (1) year from the date of availment and was subsequently renewed on December 20, 2013. On December 15, 2014, the loan was renewed under the same term and interest rate. The loan balance as of March 31, 2016 and December 31, 2015 is unsecured (see Note 8).
• The loan from CBC pertains to a clean term loan availed by the Group amounting to
P=70 million in September 2012 with an annual interest rate of 6.0%. The loan matured in July 2013 and was renewed for another year until July 2014 with an annual interest rate of 5.5%. On October 4, 2013, the Group availed term loan amounting to P=30 million with an annual interest rate of 5.5% which matured on July 31, 2014. In April 2014, the Group availed additional clean loan amounting to P=5 million with an interest of 5.5% which was repaid in July 2014. In October 2014, a total of P=100 million loans were renewed for another year until October 23, 2015 of which P=10 million was already repaid on December 29, 2014. In January 29, 2015, The Group availed additional loan amounting to P=10 million which bears annual interest rate of 5.5% and will mature one (1) year from the date of availment. On October 23, 2015, a total of P=100 million loans were renewed for another year until October 23, 2016 with an annual interest rate of 5.5%.
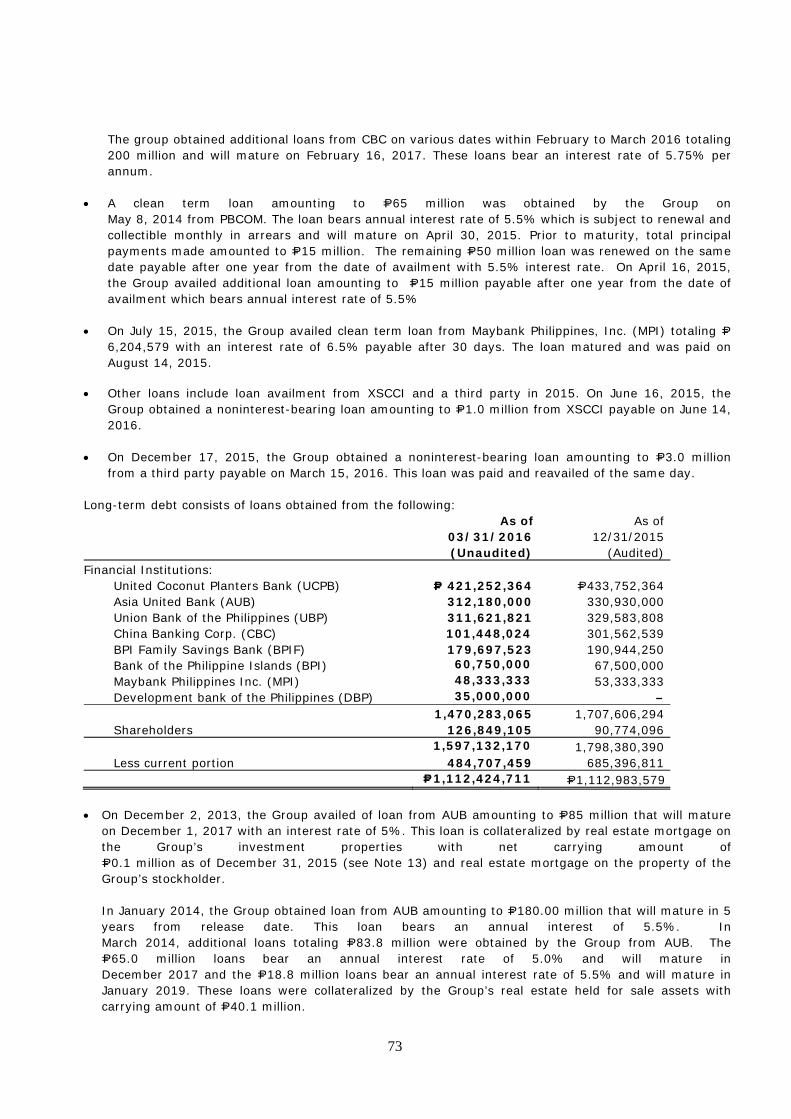
73
The group obtained additional loans from CBC on various dates within February to March 2016 totaling 200 million and will mature on February 16, 2017. These loans bear an interest rate of 5.75% per annum.
• A clean term loan amounting to P=65 million was obtained by the Group on May 8, 2014 from PBCOM. The loan bears annual interest rate of 5.5% which is subject to renewal and collectible monthly in arrears and will mature on April 30, 2015. Prior to maturity, total principal payments made amounted to P=15 million. The remaining P=50 million loan was renewed on the same date payable after one year from the date of availment with 5.5% interest rate. On April 16, 2015, the Group availed additional loan amounting to P=15 million payable after one year from the date of availment which bears annual interest rate of 5.5%
• On July 15, 2015, the Group availed clean term loan from Maybank Philippines, Inc. (MPI) totaling P=6,204,579 with an interest rate of 6.5% payable after 30 days. The loan matured and was paid on August 14, 2015.
• Other loans include loan availment from XSCCI and a third party in 2015. On June 16, 2015, the Group obtained a noninterest-bearing loan amounting to P=1.0 million from XSCCI payable on June 14, 2016.
• On December 17, 2015, the Group obtained a noninterest-bearing loan amounting to P=3.0 million from a third party payable on March 15, 2016. This loan was paid and reavailed of the same day.
Long-term debt consists of loans obtained from the following: As of
03/31/2016 (Unaudited)
As of 12/31/2015
(Audited) Financial Institutions:
United Coconut Planters Bank (UCPB) P= 421,252,364 P=433,752,364 Asia United Bank (AUB) 312,180,000 330,930,000 Union Bank of the Philippines (UBP) 311,621,821 329,583,808 China Banking Corp. (CBC) 101,448,024 301,562,539 BPI Family Savings Bank (BPIF) 179,697,523 190,944,250 Bank of the Philippine Islands (BPI) 60,750,000 67,500,000 Maybank Philippines Inc. (MPI) 48,333,333 53,333,333 Development bank of the Philippines (DBP) 35,000,000 – 1,470,283,065 1,707,606,294 Shareholders 126,849,105 90,774,096
1,597,132,170 1,798,380,390 Less current portion 484,707,459 685,396,811
P=1,112,424,711 P=1,112,983,579 • On December 2, 2013, the Group availed of loan from AUB amounting to P=85 million that will mature
on December 1, 2017 with an interest rate of 5%. This loan is collateralized by real estate mortgage on the Group’s investment properties with net carrying amount of P=0.1 million as of December 31, 2015 (see Note 13) and real estate mortgage on the property of the Group’s stockholder.
In January 2014, the Group obtained loan from AUB amounting to P=180.00 million that will mature in 5 years from release date. This loan bears an annual interest of 5.5%. In March 2014, additional loans totaling P=83.8 million were obtained by the Group from AUB. The P=65.0 million loans bear an annual interest rate of 5.0% and will mature in December 2017 and the P=18.8 million loans bear an annual interest rate of 5.5% and will mature in January 2019. These loans were collateralized by the Group’s real estate held for sale assets with carrying amount of P=40.1 million.
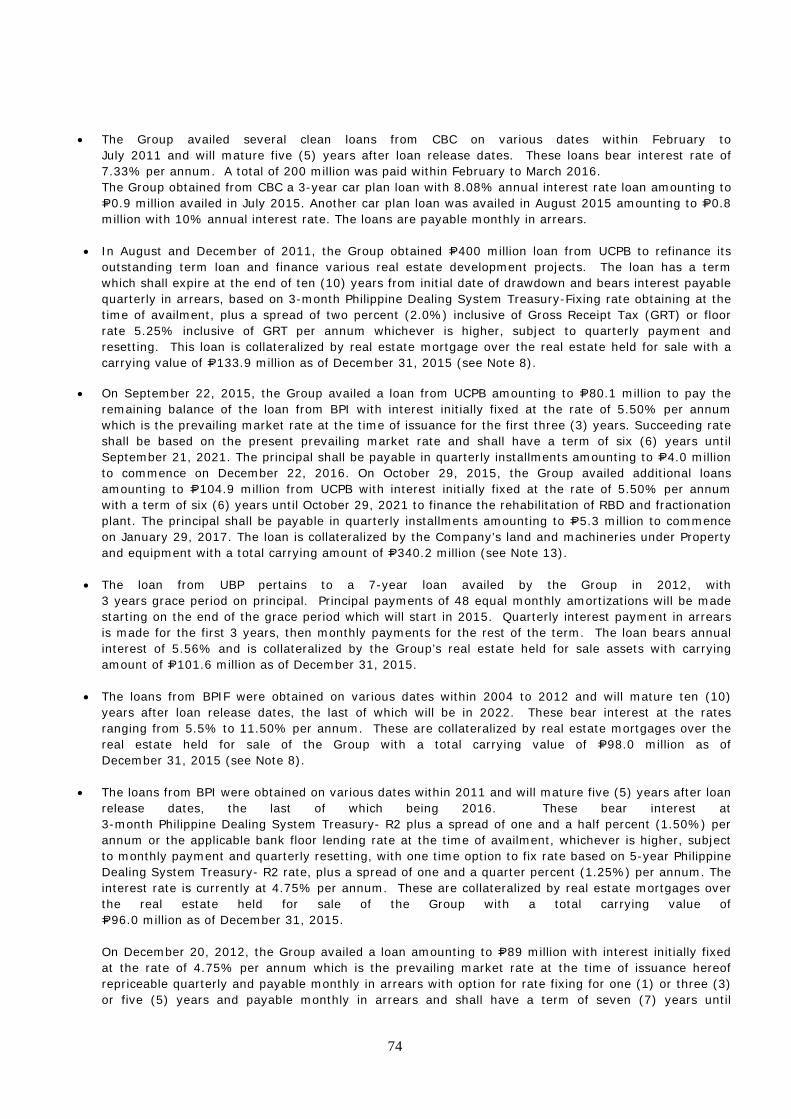
74
• The Group availed several clean loans from CBC on various dates within February to July 2011 and will mature five (5) years after loan release dates. These loans bear interest rate of 7.33% per annum. A total of 200 million was paid within February to March 2016. The Group obtained from CBC a 3-year car plan loan with 8.08% annual interest rate loan amounting to P=0.9 million availed in July 2015. Another car plan loan was availed in August 2015 amounting to P=0.8 million with 10% annual interest rate. The loans are payable monthly in arrears.
• In August and December of 2011, the Group obtained P=400 million loan from UCPB to refinance its outstanding term loan and finance various real estate development projects. The loan has a term which shall expire at the end of ten (10) years from initial date of drawdown and bears interest payable quarterly in arrears, based on 3-month Philippine Dealing System Treasury-Fixing rate obtaining at the time of availment, plus a spread of two percent (2.0%) inclusive of Gross Receipt Tax (GRT) or floor rate 5.25% inclusive of GRT per annum whichever is higher, subject to quarterly payment and resetting. This loan is collateralized by real estate mortgage over the real estate held for sale with a carrying value of P=133.9 million as of December 31, 2015 (see Note 8).
• On September 22, 2015, the Group availed a loan from UCPB amounting to P=80.1 million to pay the remaining balance of the loan from BPI with interest initially fixed at the rate of 5.50% per annum which is the prevailing market rate at the time of issuance for the first three (3) years. Succeeding rate shall be based on the present prevailing market rate and shall have a term of six (6) years until September 21, 2021. The principal shall be payable in quarterly installments amounting to P=4.0 million to commence on December 22, 2016. On October 29, 2015, the Group availed additional loans amounting to P=104.9 million from UCPB with interest initially fixed at the rate of 5.50% per annum with a term of six (6) years until October 29, 2021 to finance the rehabilitation of RBD and fractionation plant. The principal shall be payable in quarterly installments amounting to P=5.3 million to commence on January 29, 2017. The loan is collateralized by the Company’s land and machineries under Property and equipment with a total carrying amount of P=340.2 million (see Note 13).
• The loan from UBP pertains to a 7-year loan availed by the Group in 2012, with
3 years grace period on principal. Principal payments of 48 equal monthly amortizations will be made starting on the end of the grace period which will start in 2015. Quarterly interest payment in arrears is made for the first 3 years, then monthly payments for the rest of the term. The loan bears annual interest of 5.56% and is collateralized by the Group’s real estate held for sale assets with carrying amount of P=101.6 million as of December 31, 2015.
• The loans from BPIF were obtained on various dates within 2004 to 2012 and will mature ten (10)
years after loan release dates, the last of which will be in 2022. These bear interest at the rates ranging from 5.5% to 11.50% per annum. These are collateralized by real estate mortgages over the real estate held for sale of the Group with a total carrying value of P=98.0 million as of December 31, 2015 (see Note 8).
• The loans from BPI were obtained on various dates within 2011 and will mature five (5) years after loan
release dates, the last of which being 2016. These bear interest at 3-month Philippine Dealing System Treasury- R2 plus a spread of one and a half percent (1.50%) per annum or the applicable bank floor lending rate at the time of availment, whichever is higher, subject to monthly payment and quarterly resetting, with one time option to fix rate based on 5-year Philippine Dealing System Treasury- R2 rate, plus a spread of one and a quarter percent (1.25%) per annum. The interest rate is currently at 4.75% per annum. These are collateralized by real estate mortgages over the real estate held for sale of the Group with a total carrying value of P=96.0 million as of December 31, 2015. On December 20, 2012, the Group availed a loan amounting to P=89 million with interest initially fixed at the rate of 4.75% per annum which is the prevailing market rate at the time of issuance hereof repriceable quarterly and payable monthly in arrears with option for rate fixing for one (1) or three (3) or five (5) years and payable monthly in arrears and shall have a term of seven (7) years until
75
December 20, 2019. This loan was settled by the UCPB loan availed by the Group last September 22, 2015.
• The Group availed of a P=60.0 million loan from MPI in August 2014 with an annual interest rate of
5.5% subject to quarterly repricing and payable monthly in arrears that will mature in August 2018. This loan is collateralized by the Group’s investment properties in Binangonan, Rizal with carrying amount of P=21.2 million.
• On March 18, 2016, the Group obtained a loan from DBP amounting to P=35 million that will mature on
March 18, 2022 with 2 years grace period on principal. This loan bears an interest of 5.25% per annum (exclusive of GRT). Quarterly interest payment in arrears. The principal shall be payable in quarterly installments amounting to P=2.2 million to start on June 18, 2018. The loans are collateralized by the Group’s real estate held for sale assets with carrying amount of P=32.5 million.
• The loans from shareholders represent a 10-year noninterest-bearing loan with a total principal amount of P=129.3 million availed on various dates from October to November 2012. The loans are repayable in lump sum on or before maturity. The Group recognized discount on loans payable amounting to P=52.9 million in the statements of income in 2012. In September 2014, the Group availed of another 10-year noninterest-bearing loan from the shareholders amounting to P=60.0 million. In 2015, the Parent Company availed from shareholders additional noninterest-bearing loans totaling P=62.0 million with 5 and 10-year term. A total of P=16.7 million and P=24.9 million was recognized as discount on loans payable in the statements of income in 2015 and 2014, respectively. Amortization of discount on loans recognized amounted to P=26.4 million in 2015, P=13.5 million in 2014 and P=4.3 million in 2013. A total of P=12,014,533 loans payable was derecognized in 2015 in view of the deconsolidation of a subsidiary.
19. Related Party Transactions Related party relationship exists when one party has the ability to control, directly, or indirectly through one or more intermediaries, the other party or exercise significant influence over the other party making financial and operating decisions . Such relationship also exists between and/or among entities, which are under common control with the reporting enterprise, or between and/or among the reporting entities and key management personnel, directors, or its shareholders. In considering each possible related party relationship, attention is directed to the substance of relationship and not merely the legal form. For financial statements disclosure purposes, an affiliate is an entity under common control of the Parent Company’s stockholders. The Parent Company enters into transactions with related parties. Outstanding balances at year-end are unsecured and noninterest-bearing and are settled based on agreed upon terms. The following are the related party transactions.
a. Lease of Parent Company’s office space from an affiliate
For the quarters ending March 31 2016 2015
Amount of rent expense P=781,212 P=710,198 Outstanding balances 358,082 236,733
b. Noninterest-bearing loans received from shareholders
The loans from the shareholders represent a 10-year noninterest-bearing loan with a total principal amount of P=129.28 million availed on various dates from October to November 2012. The loan is re-payable in lump sum on or before maturity (see Note 18).
76
c. Advances made to an associate. The Group made unsecured and noninterest-bearing advances to PEI, an associate, amounting to P=24,721,000 in 2015
d. Loan availed from an affiliate. On June 2015, the Parent Company availed P=1,000,000 noninterest-bearing loan from XSCCI payable within one year from date of availment (see Note 18).
The summary of the above related party transactions follows: March 31, 2016
Category Amount/Volume Outstanding balance Terms and Condition
Guaranty/Settlement/Provision
Shareholders 1. Loans received
from shareholders
P=41,600,000 P=126,849,105 Noninterest-bearing and repayable in lump sum on or before maturity after 10 years from 2012
Unsecured; no significant covenants
Affiliates 2. Lease of office
space from an affiliate
P=781,212 P=358,082 One year subject to annual review and renewable upon mutual agreement of parties; payable in cash every 15th of the month without necessity of demand
No guarantees
3. Loans availed P=- 1,000,000 Noninterest-bearing and repayable in cash within 1 year from date of availment
Unsecured; no significant warranties and covenants
4. Collection of notes receivable from an affiliate
P=347,316 - One year and to be collected in twelve monthly installments at 10% per annum.
No guarantees
Associate 5. Advances
made
P=-
24,721,000
Payable on demand; noninterest-bearing
Unsecured; no significant warranties and covenants; no impairment
March 31, 2015
Category Amount/Volume Outstanding balance Terms and Condition
Guaranty/Settlement/Provision
Shareholders 1. Loans received
from shareholders
P=40,000,000 P=89,152,830 Noninterest-bearing and repayable in lump sum on or before maturity after 10 years from 2012
Unsecured; no significant covenants
Affiliates 2. Lease of office
space from an affiliate
P=710,198 P=236,732 One year subject to annual review and renewable upon mutual agreement of parties; payable in cash every 15th of the month without necessity of demand
No guarantees
3. Collection of notes receivable from an affiliate
P=347,316 - One year and to be collected in twelve monthly installments at 10% per annum.
No guarantees
77
Below are the account balances as of March 31, 2016 and December 31, 2015 on the separate financial statements of the companies within the Group which were eliminated upon consolidation:
• Receivables/Payables
As of March 31, 2016 (Unaudited)
Payable
ABCI-Parent MCPI SHDI ABERDI Total
Receivable:
ABCI-Parent
Company
P=– P=–
P=– P= 9,877,208 P=1,083,713
ABERDI – – 278,826 – 7,773,940
BAC – – – 460,377 51,555
SHDI 167,941 – – – 32,299
PTCHC – 6,568,367 – – 6,251,013
NC – – – 87,253 12,964
P=167,941 P=6,568,367 P=278,826 P=10,424,838 P=15,205,484
As of December 31, 2015 (Audited)
Payable
ABCI - PARENT ABERDI MCPI Total
Receivable:
ABBWCI P=7,971,853 P=– P=– P=7,971,853
PTCHC 21,094 – 6,508,784 6,529,878
ABERDI 1,535,235 – – 1,535,235
NC – 874,419 – 874,419
SHDC 167,941 403,938 – 571,870
BAC – 423,095 – 423,095
P= 9,696,123 P= 1,701,452 P=6,508,784 P=17,906,359
• Deposits for future stock subscription
As of March 31, 2016
(Unaudited) Deposits from
ABCI-Parent
Company ABERDI Total Deposits to: PTCHC P= 818,368,221 P= – P=818,368,221 ABERDI 414,603,584 – 414,603,584 SHDI 9,600,000 – 9,600,000 HLPC 13,132,708 – 13,132,708 NC 700,000 247,165,103 247,865,103 Total P=1,256,404,513 P= 247,165,103 P=1,503,569,616
78
As of December 31, 2015
(Audited) Deposits from
ABCI-Parent
Company ABERDI Total Deposits to: PTCHC P=818,305,221 P= – P=818,305,221 ABERDI 376,303,228 – 376,303,228 HLPC 10,355,922 – 10,355,922 AC 9,600,000 – 9,600,000 NC – 247,085,103 247,085,103 Total P=1,228,464,371 P=247,085,103 P= 1,475,549,474
20. Share Capital
The details of the number of shares of authorized and subscribed capital stock follows:
As of 03/31/2016 (Unaudited)
As of 12/31/2016
(Audited) Authorized (Note 1) 2,000,000,000 2,000,000,000 Subscribed and issued (Note 1) 1,732,865,522 1,732,865,522
All subscribed shares are issued and outstanding as of March 31, 2016 and December 31, 2015 Movements of the amount of subscribed capital stock and additional paid in capital (APIC) during the quarter ending March 31, 2016 follow: CAPITAL STOCK
Additional paid in capital
Subscribed and issued
Subscribed but not issued Total
Balance as at January 1, 2016 and March 31, 2016 P= 1,732,865,522 P=– P=1,732,865,522 P=586,198,947
The Securities and Exchange Commission (SEC) issued the following orders related to the Group's registration of its securities: SEC-BED Order No. 1179 issued on December 17, 1993 amounting to P=200,000,000; SEC-BED Order No. 847 issued on August 15, 1994 amounting to P=230,000,000 and SEC-CFD Order No. 64 issued on March 12, 1996 totaling P=530,000,000. Common shares are the only equity securities registered and issued by the Group. As of December 31, 2015 and 2014, there are 2,121 and 2,129 stockholders in the records of the transfer agent, Professional Stock Transfers, Inc. (PSTI), respectively. As of March 31, 2016, there are two thousand one hundred nineteen (2,119) stockholders in the books of the transfer agent.
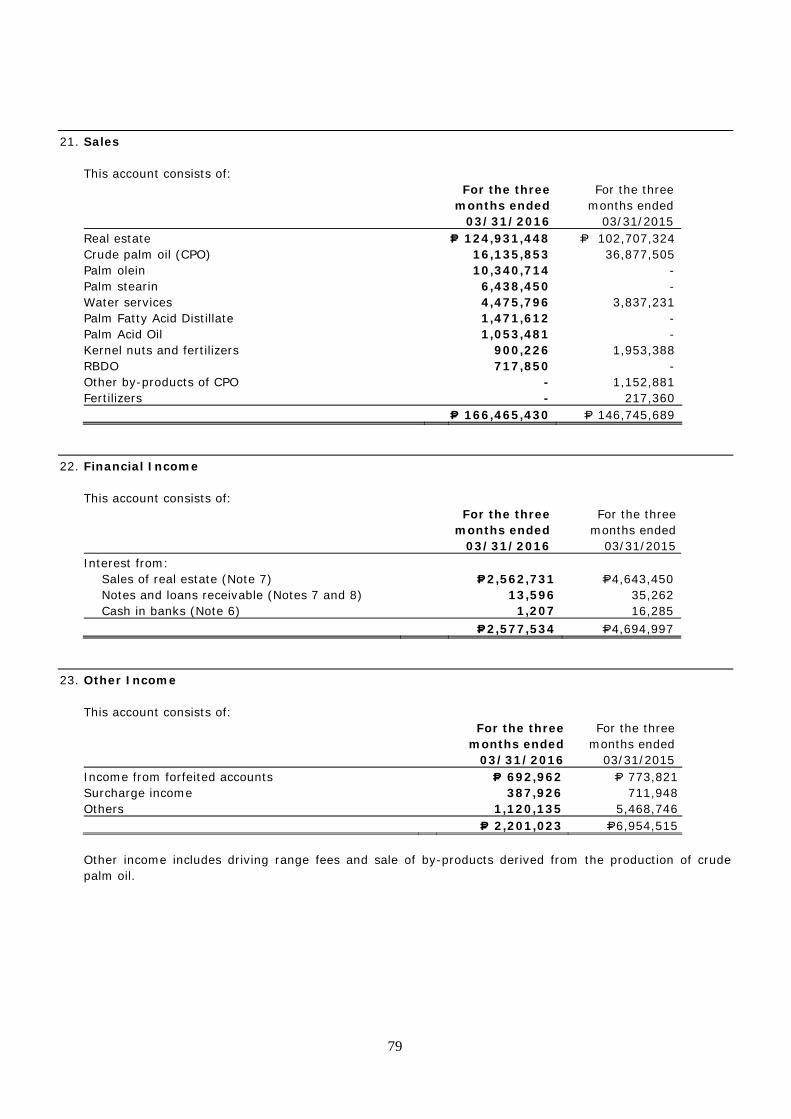
79
21. Sales
This account consists of: For the three
months ended 03/31/2016
For the three months ended
03/31/2015 Real estate P= 124,931,448 P= 102,707,324 Crude palm oil (CPO) 16,135,853 36,877,505 Palm olein 10,340,714 - Palm stearin 6,438,450 - Water services 4,475,796 3,837,231 Palm Fatty Acid Distillate 1,471,612 - Palm Acid Oil 1,053,481 - Kernel nuts and fertilizers 900,226 1,953,388 RBDO 717,850 - Other by-products of CPO - 1,152,881 Fertilizers - 217,360 P= 166,465,430 P= 146,745,689
22. Financial Income
This account consists of: For the three
months ended 03/31/2016
For the three months ended
03/31/2015 Interest from:
Sales of real estate (Note 7) P=2,562,731 P=4,643,450 Notes and loans receivable (Notes 7 and 8) 13,596 35,262 Cash in banks (Note 6) 1,207 16,285
P=2,577,534 P=4,694,997
23. Other Income
This account consists of:
For the three months ended
03/31/2016
For the three months ended
03/31/2015 Income from forfeited accounts P= 692,962 P= 773,821 Surcharge income 387,926 711,948 Others 1,120,135 5,468,746 P= 2,201,023 P=6,954,515
Other income includes driving range fees and sale of by-products derived from the production of crude palm oil.
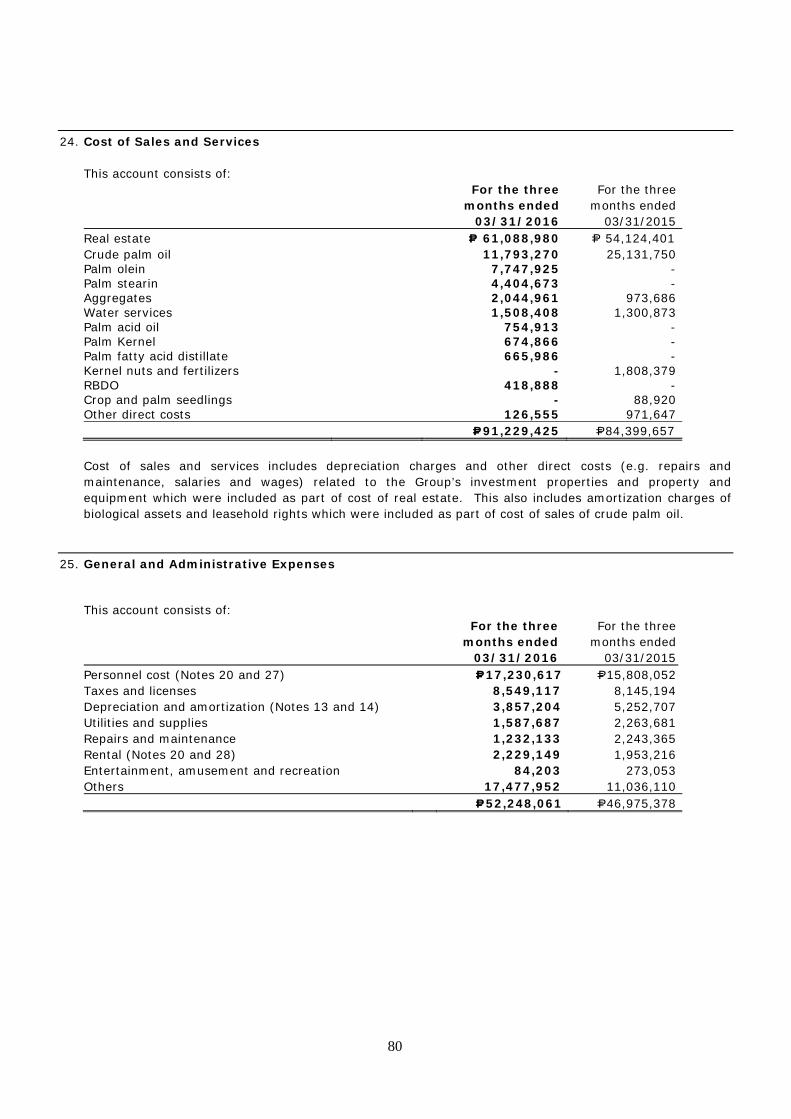
80
24. Cost of Sales and Services This account consists of: For the three
months ended 03/31/2016
For the three months ended
03/31/2015 Real estate P= 61,088,980 P= 54,124,401 Crude palm oil 11,793,270 25,131,750 Palm olein 7,747,925 - Palm stearin 4,404,673 - Aggregates 2,044,961 973,686 Water services 1,508,408 1,300,873 Palm acid oil 754,913 - Palm Kernel 674,866 - Palm fatty acid distillate 665,986 - Kernel nuts and fertilizers - 1,808,379 RBDO 418,888 - Crop and palm seedlings - 88,920 Other direct costs 126,555 971,647 P=91,229,425 P=84,399,657
Cost of sales and services includes depreciation charges and other direct costs (e.g. repairs and maintenance, salaries and wages) related to the Group’s investment properties and property and equipment which were included as part of cost of real estate. This also includes amortization charges of biological assets and leasehold rights which were included as part of cost of sales of crude palm oil.
25. General and Administrative Expenses
This account consists of: For the three
months ended 03/31/2016
For the three months ended
03/31/2015 Personnel cost (Notes 20 and 27) P=17,230,617 P=15,808,052 Taxes and licenses 8,549,117 8,145,194 Depreciation and amortization (Notes 13 and 14) 3,857,204 5,252,707 Utilities and supplies 1,587,687 2,263,681 Repairs and maintenance 1,232,133 2,243,365 Rental (Notes 20 and 28) 2,229,149 1,953,216 Entertainment, amusement and recreation 84,203 273,053 Others 17,477,952 11,036,110 P=52,248,061 P=46,975,378
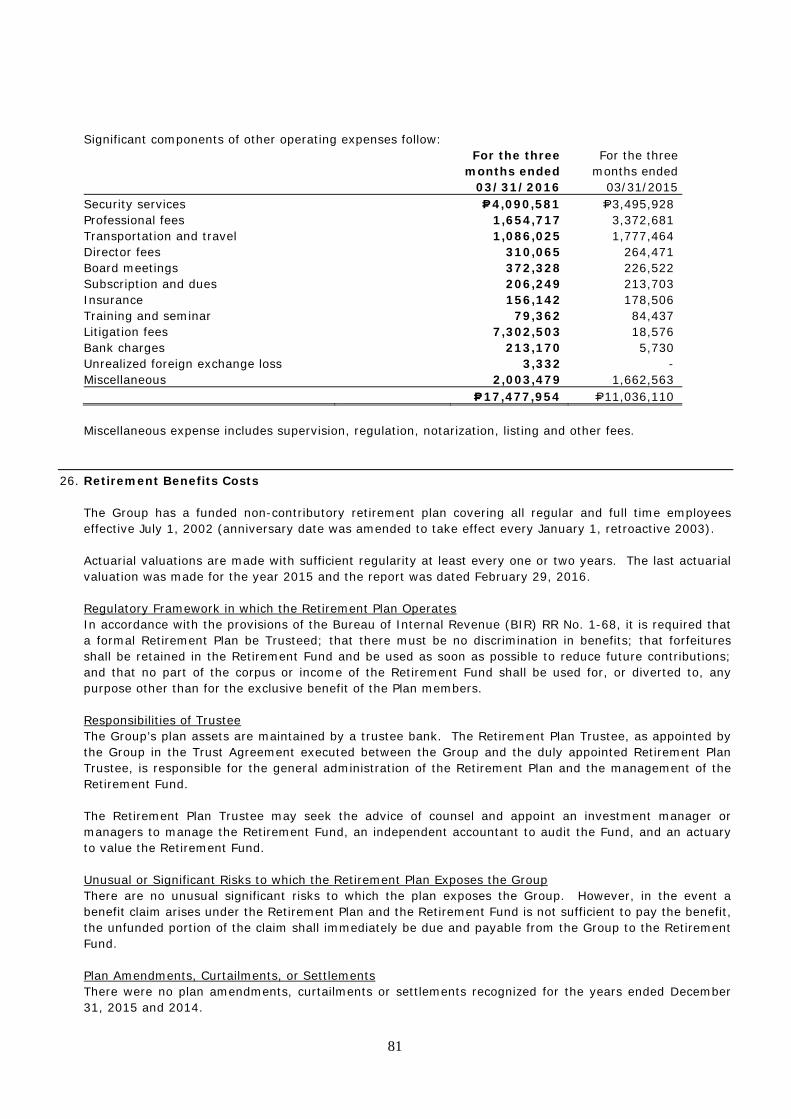
81
Significant components of other operating expenses follow: For the three
months ended 03/31/2016
For the three months ended
03/31/2015 Security services P=4,090,581 P=3,495,928 Professional fees 1,654,717 3,372,681 Transportation and travel 1,086,025 1,777,464 Director fees 310,065 264,471 Board meetings 372,328 226,522 Subscription and dues 206,249 213,703 Insurance 156,142 178,506 Training and seminar 79,362 84,437 Litigation fees 7,302,503 18,576 Bank charges 213,170 5,730 Unrealized foreign exchange loss 3,332 - Miscellaneous 2,003,479 1,662,563 P=17,477,954 P=11,036,110
Miscellaneous expense includes supervision, regulation, notarization, listing and other fees.
26. Retirement Benefits Costs The Group has a funded non-contributory retirement plan covering all regular and full time employees effective July 1, 2002 (anniversary date was amended to take effect every January 1, retroactive 2003). Actuarial valuations are made with sufficient regularity at least every one or two years. The last actuarial valuation was made for the year 2015 and the report was dated February 29, 2016. Regulatory Framework in which the Retirement Plan Operates In accordance with the provisions of the Bureau of Internal Revenue (BIR) RR No. 1-68, it is required that a formal Retirement Plan be Trusteed; that there must be no discrimination in benefits; that forfeitures shall be retained in the Retirement Fund and be used as soon as possible to reduce future contributions; and that no part of the corpus or income of the Retirement Fund shall be used for, or diverted to, any purpose other than for the exclusive benefit of the Plan members. Responsibilities of Trustee The Group’s plan assets are maintained by a trustee bank. The Retirement Plan Trustee, as appointed by the Group in the Trust Agreement executed between the Group and the duly appointed Retirement Plan Trustee, is responsible for the general administration of the Retirement Plan and the management of the Retirement Fund. The Retirement Plan Trustee may seek the advice of counsel and appoint an investment manager or managers to manage the Retirement Fund, an independent accountant to audit the Fund, and an actuary to value the Retirement Fund. Unusual or Significant Risks to which the Retirement Plan Exposes the Group There are no unusual significant risks to which the plan exposes the Group. However, in the event a benefit claim arises under the Retirement Plan and the Retirement Fund is not sufficient to pay the benefit, the unfunded portion of the claim shall immediately be due and payable from the Group to the Retirement Fund. Plan Amendments, Curtailments, or Settlements There were no plan amendments, curtailments or settlements recognized for the years ended December 31, 2015 and 2014.
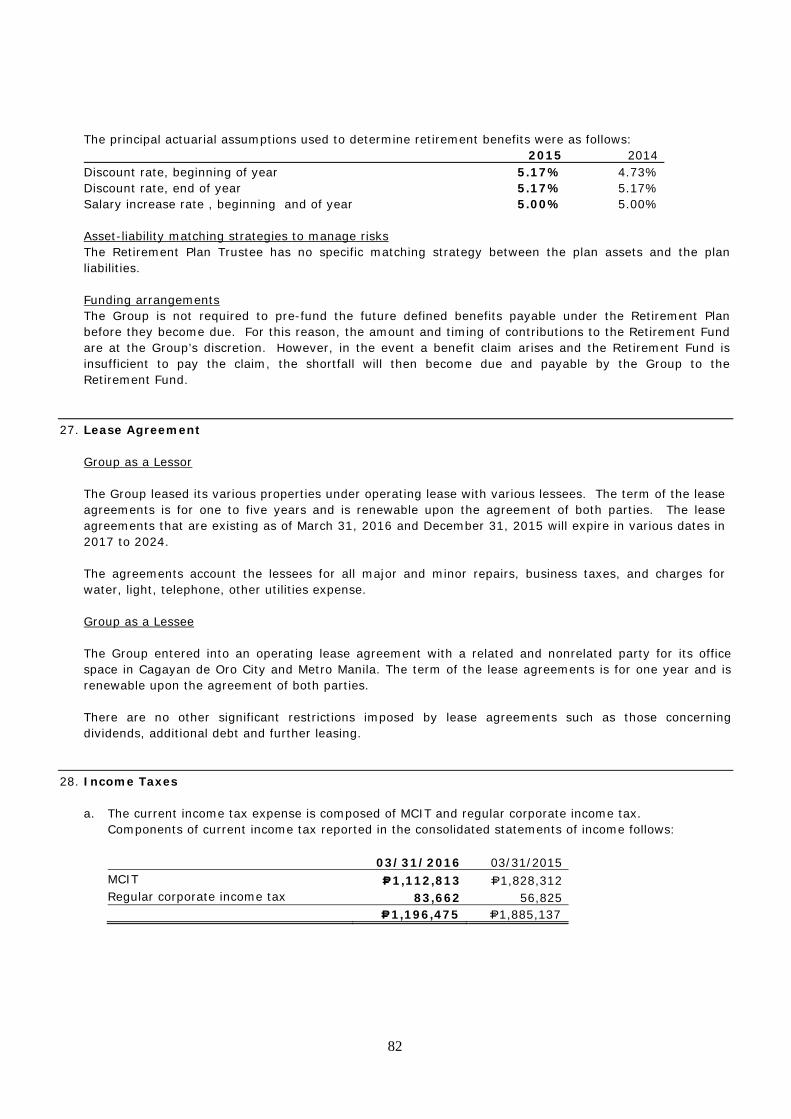
82
The principal actuarial assumptions used to determine retirement benefits were as follows: 2015 2014 Discount rate, beginning of year 5.17% 4.73% Discount rate, end of year 5.17% 5.17% Salary increase rate , beginning and of year 5.00% 5.00% Asset-liability matching strategies to manage risks The Retirement Plan Trustee has no specific matching strategy between the plan assets and the plan liabilities. Funding arrangements The Group is not required to pre-fund the future defined benefits payable under the Retirement Plan before they become due. For this reason, the amount and timing of contributions to the Retirement Fund are at the Group’s discretion. However, in the event a benefit claim arises and the Retirement Fund is insufficient to pay the claim, the shortfall will then become due and payable by the Group to the Retirement Fund.
27. Lease Agreement
Group as a Lessor The Group leased its various properties under operating lease with various lessees. The term of the lease agreements is for one to five years and is renewable upon the agreement of both parties. The lease agreements that are existing as of March 31, 2016 and December 31, 2015 will expire in various dates in 2017 to 2024. The agreements account the lessees for all major and minor repairs, business taxes, and charges for water, light, telephone, other utilities expense.
Group as a Lessee The Group entered into an operating lease agreement with a related and nonrelated party for its office space in Cagayan de Oro City and Metro Manila. The term of the lease agreements is for one year and is renewable upon the agreement of both parties. There are no other significant restrictions imposed by lease agreements such as those concerning dividends, additional debt and further leasing.
28. Income Taxes
a. The current income tax expense is composed of MCIT and regular corporate income tax. Components of current income tax reported in the consolidated statements of income follows: 03/31/2016 03/31/2015
MCIT P=1,112,813 P=1,828,312 Regular corporate income tax 83,662 56,825 P=1,196,475 P=1,885,137
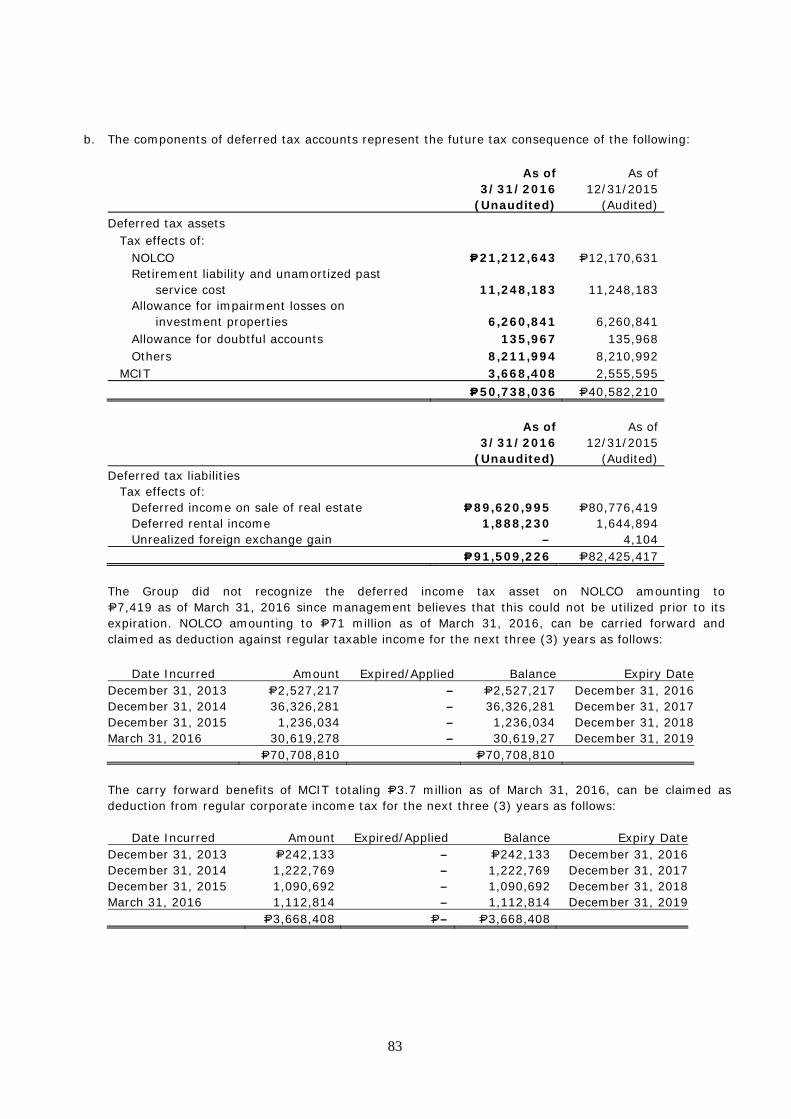
83
b. The components of deferred tax accounts represent the future tax consequence of the following:
As of 3/31/2016
(Unaudited)
As of 12/31/2015
(Audited) Deferred tax assets
Tax effects of: NOLCO P=21,212,643 P=12,170,631 Retirement liability and unamortized past
service cost 11,248,183 11,248,183 Allowance for impairment losses on
investment properties 6,260,841 6,260,841 Allowance for doubtful accounts 135,967 135,968 Others 8,211,994 8,210,992
MCIT 3,668,408 2,555,595 P=50,738,036 P=40,582,210 As of
3/31/2016(Unaudited)
As of 12/31/2015
(Audited) Deferred tax liabilities
Tax effects of: Deferred income on sale of real estate P=89,620,995 P=80,776,419 Deferred rental income 1,888,230 1,644,894 Unrealized foreign exchange gain – 4,104 P=91,509,226 P=82,425,417
The Group did not recognize the deferred income tax asset on NOLCO amounting to P=7,419 as of March 31, 2016 since management believes that this could not be utilized prior to its expiration. NOLCO amounting to P=71 million as of March 31, 2016, can be carried forward and claimed as deduction against regular taxable income for the next three (3) years as follows:
Date Incurred Amount Expired/Applied Balance Expiry DateDecember 31, 2013 P=2,527,217 – P=2,527,217 December 31, 2016December 31, 2014 36,326,281 – 36,326,281 December 31, 2017December 31, 2015 1,236,034 – 1,236,034 December 31, 2018March 31, 2016 30,619,278 – 30,619,27 December 31, 2019 P=70,708,810 P=70,708,810
The carry forward benefits of MCIT totaling P=3.7 million as of March 31, 2016, can be claimed as deduction from regular corporate income tax for the next three (3) years as follows:
Date Incurred Amount Expired/Applied Balance Expiry DateDecember 31, 2013 P=242,133 – P=242,133 December 31, 2016December 31, 2014 1,222,769 – 1,222,769 December 31, 2017December 31, 2015 1,090,692 – 1,090,692 December 31, 2018March 31, 2016 1,112,814 – 1,112,814 December 31, 2019 P=3,668,408 P=– P=3,668,408
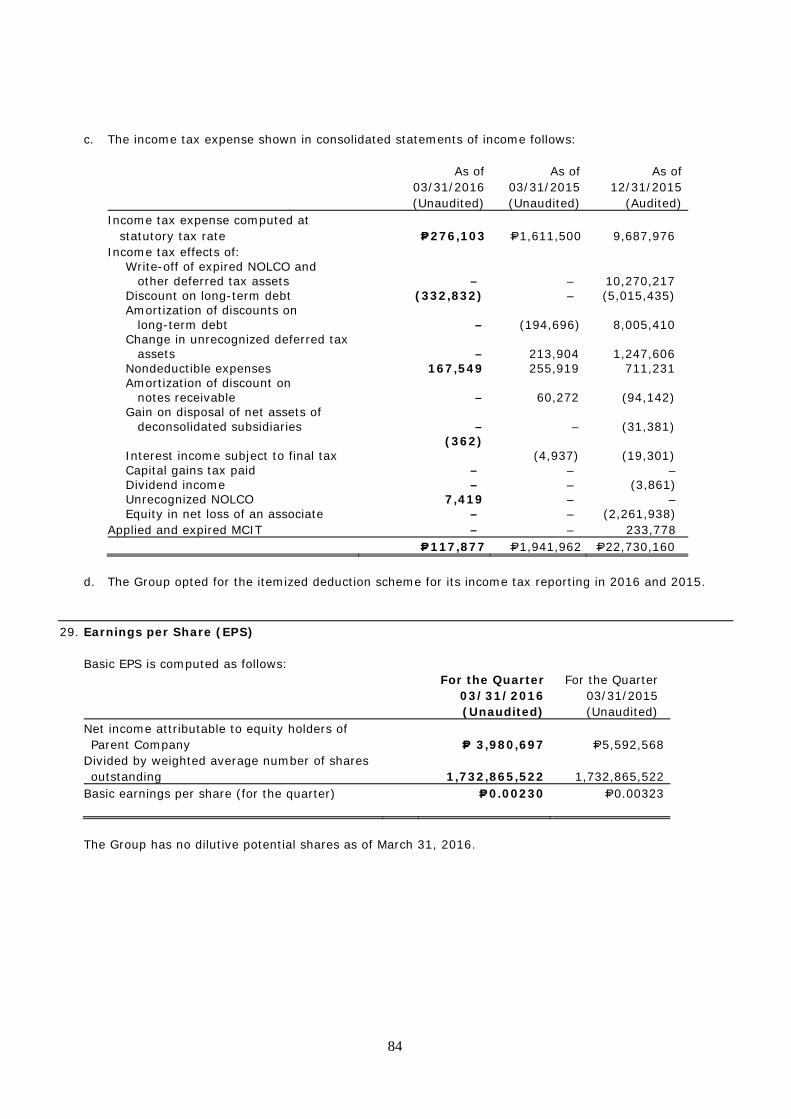
84
c. The income tax expense shown in consolidated statements of income follows: As of
03/31/2016 (Unaudited)
As of 03/31/2015 (Unaudited)
As of 12/31/2015
(Audited) Income tax expense computed at
statutory tax rate P=276,103 P=1,611,500 9,687,976 Income tax effects of:
Write-off of expired NOLCO and other deferred tax assets – – 10,270,217
Discount on long-term debt (332,832) – (5,015,435) Amortization of discounts on
long-term debt – (194,696) 8,005,410 Change in unrecognized deferred tax
assets – 213,904 1,247,606 Nondeductible expenses 167,549 255,919 711,231 Amortization of discount on
notes receivable – 60,272 (94,142) Gain on disposal of net assets of
deconsolidated subsidiaries – – (31,381)
Interest income subject to final tax (362)
(4,937) (19,301) Capital gains tax paid – – – Dividend income – – (3,861) Unrecognized NOLCO 7,419 – – Equity in net loss of an associate – – (2,261,938)
Applied and expired MCIT – – 233,778 P=117,877 P=1,941,962 P=22,730,160
d. The Group opted for the itemized deduction scheme for its income tax reporting in 2016 and 2015.
29. Earnings per Share (EPS) Basic EPS is computed as follows: For the Quarter
03/31/2016 (Unaudited)
For the Quarter 03/31/2015 (Unaudited)
Net income attributable to equity holders of Parent Company P= 3,980,697 P=5,592,568
Divided by weighted average number of shares outstanding 1,732,865,522 1,732,865,522
Basic earnings per share (for the quarter) P=0.00230
P=0.00323
The Group has no dilutive potential shares as of March 31, 2016.
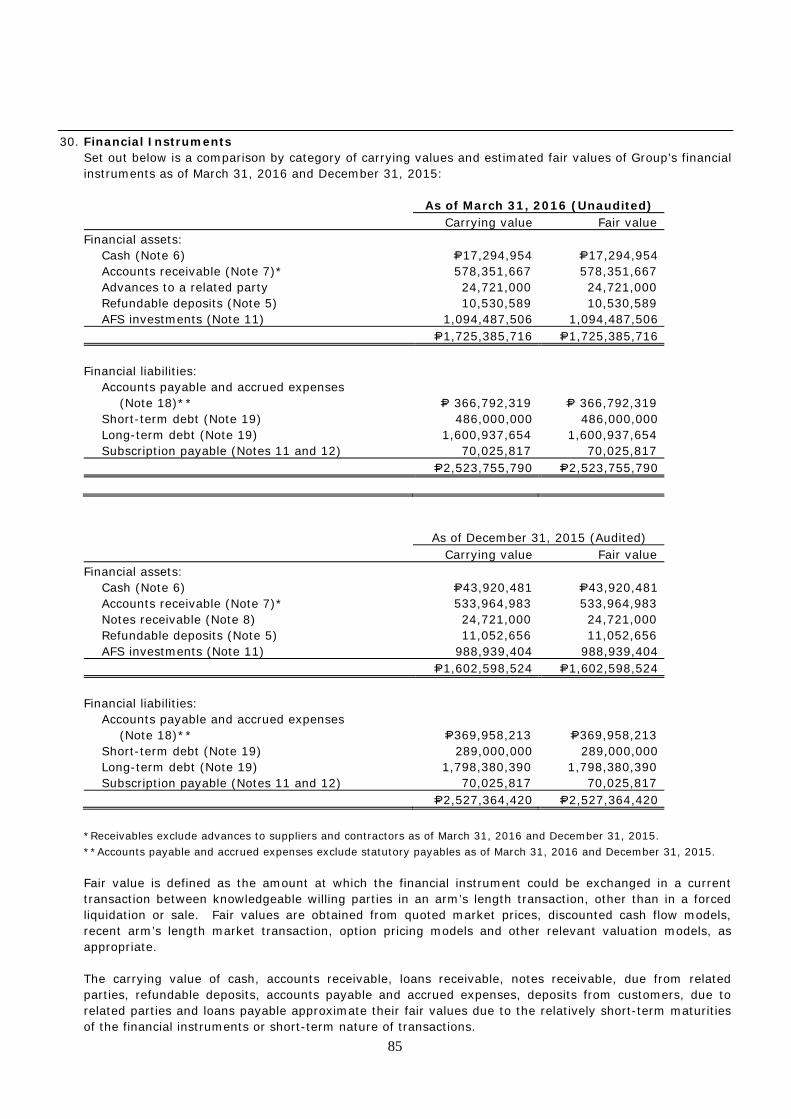
85
30. Financial Instruments Set out below is a comparison by category of carrying values and estimated fair values of Group’s financial instruments as of March 31, 2016 and December 31, 2015: As of March 31, 2016 (Unaudited) Carrying value Fair value
Financial assets: Cash (Note 6) P=17,294,954 P=17,294,954 Accounts receivable (Note 7)* 578,351,667 578,351,667 Advances to a related party 24,721,000 24,721,000 Refundable deposits (Note 5) 10,530,589 10,530,589 AFS investments (Note 11) 1,094,487,506 1,094,487,506
P=1,725,385,716 P=1,725,385,716
Financial liabilities: Accounts payable and accrued expenses
(Note 18)** P= 366,792,319 P= 366,792,319 Short-term debt (Note 19) 486,000,000 486,000,000 Long-term debt (Note 19) 1,600,937,654 1,600,937,654 Subscription payable (Notes 11 and 12) 70,025,817 70,025,817 P=2,523,755,790 P=2,523,755,790
As of December 31, 2015 (Audited) Carrying value Fair value
Financial assets: Cash (Note 6) P=43,920,481 P=43,920,481 Accounts receivable (Note 7)* 533,964,983 533,964,983 Notes receivable (Note 8) 24,721,000 24,721,000 Refundable deposits (Note 5) 11,052,656 11,052,656 AFS investments (Note 11) 988,939,404 988,939,404
P=1,602,598,524 P=1,602,598,524
Financial liabilities: Accounts payable and accrued expenses
(Note 18)** P=369,958,213 P=369,958,213 Short-term debt (Note 19) 289,000,000 289,000,000 Long-term debt (Note 19) 1,798,380,390 1,798,380,390 Subscription payable (Notes 11 and 12) 70,025,817 70,025,817 P=2,527,364,420 P=2,527,364,420
*Receivables exclude advances to suppliers and contractors as of March 31, 2016 and December 31, 2015. **Accounts payable and accrued expenses exclude statutory payables as of March 31, 2016 and December 31, 2015. Fair value is defined as the amount at which the financial instrument could be exchanged in a current transaction between knowledgeable willing parties in an arm’s length transaction, other than in a forced liquidation or sale. Fair values are obtained from quoted market prices, discounted cash flow models, recent arm’s length market transaction, option pricing models and other relevant valuation models, as appropriate. The carrying value of cash, accounts receivable, loans receivable, notes receivable, due from related parties, refundable deposits, accounts payable and accrued expenses, deposits from customers, due to related parties and loans payable approximate their fair values due to the relatively short-term maturities of the financial instruments or short-term nature of transactions.
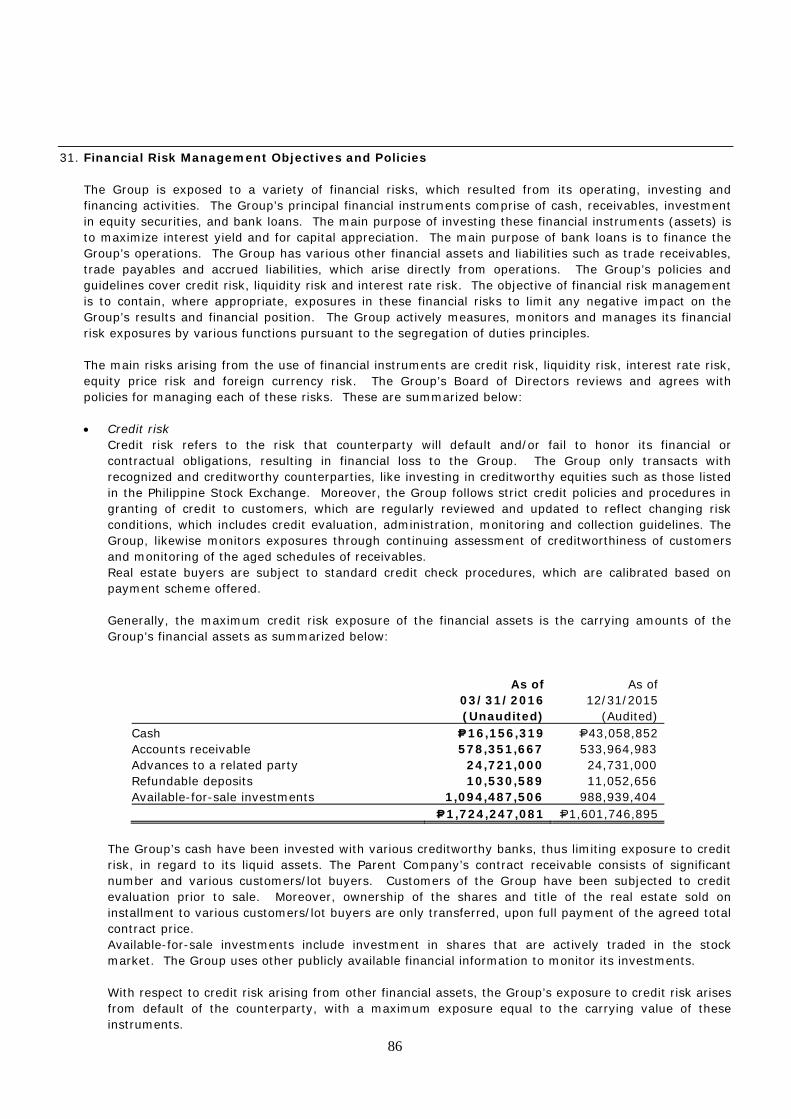
86
31. Financial Risk Management Objectives and Policies
The Group is exposed to a variety of financial risks, which resulted from its operating, investing and financing activities. The Group’s principal financial instruments comprise of cash, receivables, investment in equity securities, and bank loans. The main purpose of investing these financial instruments (assets) is to maximize interest yield and for capital appreciation. The main purpose of bank loans is to finance the Group’s operations. The Group has various other financial assets and liabilities such as trade receivables, trade payables and accrued liabilities, which arise directly from operations. The Group’s policies and guidelines cover credit risk, liquidity risk and interest rate risk. The objective of financial risk management is to contain, where appropriate, exposures in these financial risks to limit any negative impact on the Group’s results and financial position. The Group actively measures, monitors and manages its financial risk exposures by various functions pursuant to the segregation of duties principles.
The main risks arising from the use of financial instruments are credit risk, liquidity risk, interest rate risk, equity price risk and foreign currency risk. The Group’s Board of Directors reviews and agrees with policies for managing each of these risks. These are summarized below: • Credit risk
Credit risk refers to the risk that counterparty will default and/or fail to honor its financial or contractual obligations, resulting in financial loss to the Group. The Group only transacts with recognized and creditworthy counterparties, like investing in creditworthy equities such as those listed in the Philippine Stock Exchange. Moreover, the Group follows strict credit policies and procedures in granting of credit to customers, which are regularly reviewed and updated to reflect changing risk conditions, which includes credit evaluation, administration, monitoring and collection guidelines. The Group, likewise monitors exposures through continuing assessment of creditworthiness of customers and monitoring of the aged schedules of receivables. Real estate buyers are subject to standard credit check procedures, which are calibrated based on payment scheme offered. Generally, the maximum credit risk exposure of the financial assets is the carrying amounts of the Group’s financial assets as summarized below:
As of
03/31/2016 (Unaudited)
As of
12/31/2015 (Audited)
Cash P=16,156,319 P=43,058,852 Accounts receivable 578,351,667 533,964,983 Advances to a related party 24,721,000 24,731,000 Refundable deposits 10,530,589 11,052,656 Available-for-sale investments 1,094,487,506 988,939,404 P=1,724,247,081 P=1,601,746,895
The Group’s cash have been invested with various creditworthy banks, thus limiting exposure to credit risk, in regard to its liquid assets. The Parent Company’s contract receivable consists of significant number and various customers/lot buyers. Customers of the Group have been subjected to credit evaluation prior to sale. Moreover, ownership of the shares and title of the real estate sold on installment to various customers/lot buyers are only transferred, upon full payment of the agreed total contract price. Available-for-sale investments include investment in shares that are actively traded in the stock market. The Group uses other publicly available financial information to monitor its investments.
With respect to credit risk arising from other financial assets, the Group’s exposure to credit risk arises from default of the counterparty, with a maximum exposure equal to the carrying value of these instruments.
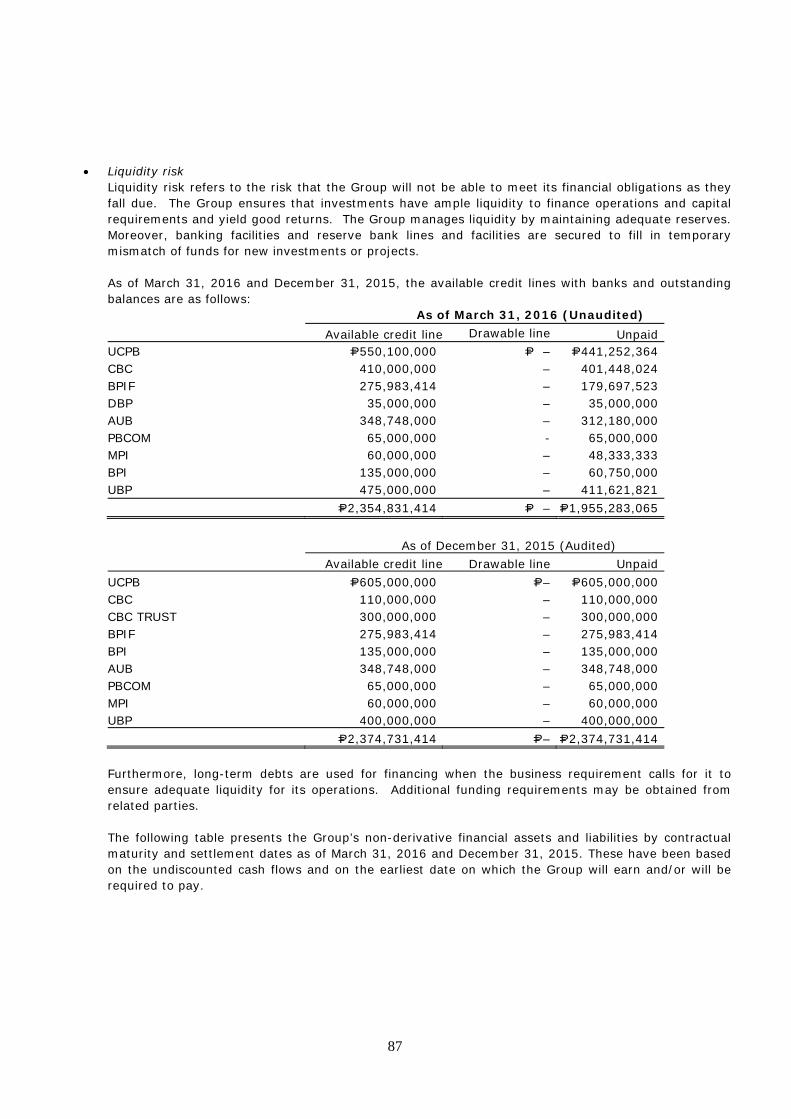
87
• Liquidity risk Liquidity risk refers to the risk that the Group will not be able to meet its financial obligations as they fall due. The Group ensures that investments have ample liquidity to finance operations and capital requirements and yield good returns. The Group manages liquidity by maintaining adequate reserves. Moreover, banking facilities and reserve bank lines and facilities are secured to fill in temporary mismatch of funds for new investments or projects. As of March 31, 2016 and December 31, 2015, the available credit lines with banks and outstanding balances are as follows:
As of March 31, 2016 (Unaudited) Available credit line Drawable line Unpaid UCPB P=550,100,000 P= – P=441,252,364 CBC 410,000,000 – 401,448,024 BPIF 275,983,414 – 179,697,523 DBP 35,000,000 – 35,000,000 AUB 348,748,000 – 312,180,000 PBCOM 65,000,000 - 65,000,000 MPI 60,000,000 – 48,333,333 BPI 135,000,000 – 60,750,000 UBP 475,000,000 – 411,621,821 P=2,354,831,414 P= – P=1,955,283,065
As of December 31, 2015 (Audited)
Available credit line Drawable line Unpaid UCPB P=605,000,000 P=– P=605,000,000 CBC 110,000,000 – 110,000,000 CBC TRUST 300,000,000 – 300,000,000 BPIF 275,983,414 – 275,983,414 BPI 135,000,000 – 135,000,000 AUB 348,748,000 – 348,748,000 PBCOM 65,000,000 – 65,000,000 MPI 60,000,000 – 60,000,000 UBP 400,000,000 – 400,000,000 P=2,374,731,414 P=– P=2,374,731,414 Furthermore, long-term debts are used for financing when the business requirement calls for it to ensure adequate liquidity for its operations. Additional funding requirements may be obtained from related parties. The following table presents the Group’s non-derivative financial assets and liabilities by contractual maturity and settlement dates as of March 31, 2016 and December 31, 2015. These have been based on the undiscounted cash flows and on the earliest date on which the Group will earn and/or will be required to pay.
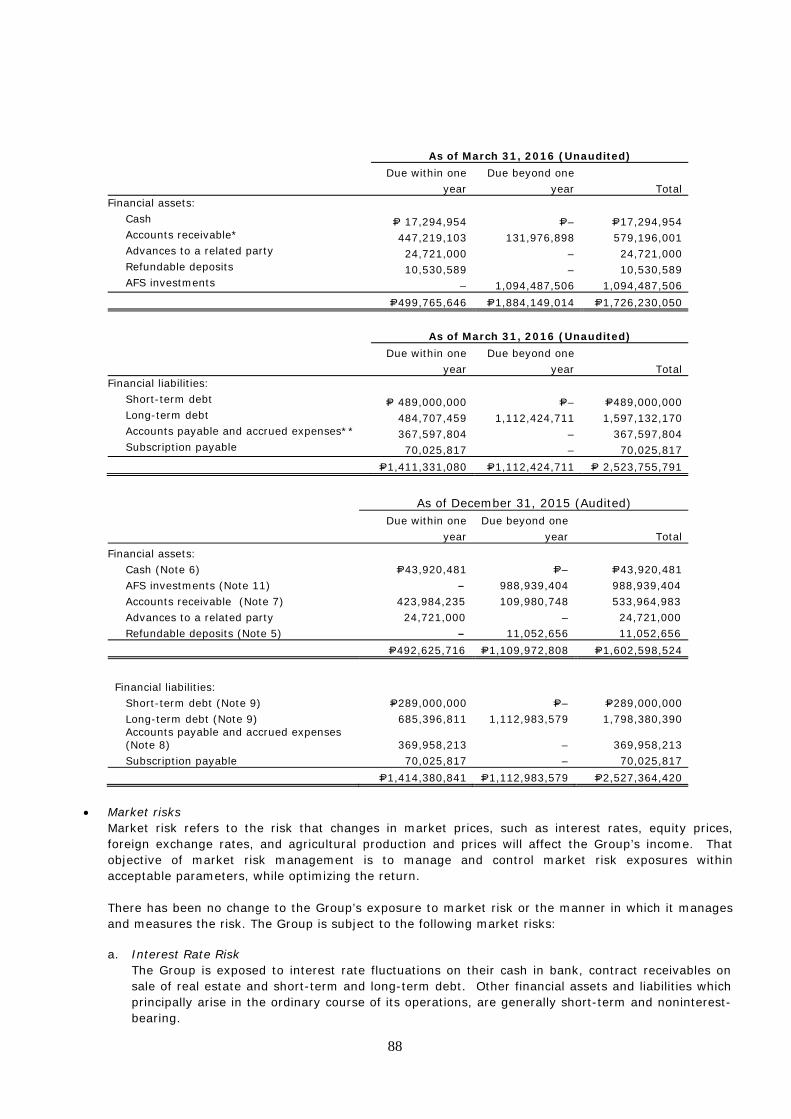
88
As of March 31, 2016 (Unaudited)
Due within one
year Due beyond one
year Total Financial assets:
Cash P= 17,294,954 P=– P=17,294,954 Accounts receivable* 447,219,103 131,976,898 579,196,001 Advances to a related party 24,721,000 – 24,721,000 Refundable deposits 10,530,589 – 10,530,589 AFS investments – 1,094,487,506 1,094,487,506
P=499,765,646 P=1,884,149,014 P=1,726,230,050
As of March 31, 2016 (Unaudited)
Due within one
year Due beyond one
year Total Financial liabilities:
Short-term debt P= 489,000,000 P=– P=489,000,000 Long-term debt 484,707,459 1,112,424,711 1,597,132,170 Accounts payable and accrued expenses** 367,597,804 – 367,597,804 Subscription payable 70,025,817 – 70,025,817 P=1,411,331,080 P=1,112,424,711 P= 2,523,755,791
As of December 31, 2015 (Audited)
Due within one
year Due beyond one
year Total Financial assets:
Cash (Note 6) P=43,920,481 P=– P=43,920,481 AFS investments (Note 11) – 988,939,404 988,939,404 Accounts receivable (Note 7) 423,984,235 109,980,748 533,964,983 Advances to a related party 24,721,000 – 24,721,000 Refundable deposits (Note 5) – 11,052,656 11,052,656 P=492,625,716 P=1,109,972,808 P=1,602,598,524
Financial liabilities:
Short-term debt (Note 9) P=289,000,000 P=– P=289,000,000 Long-term debt (Note 9) 685,396,811 1,112,983,579 1,798,380,390 Accounts payable and accrued expenses (Note 8) 369,958,213 – 369,958,213 Subscription payable 70,025,817 – 70,025,817 P=1,414,380,841 P=1,112,983,579 P=2,527,364,420
• Market risks
Market risk refers to the risk that changes in market prices, such as interest rates, equity prices, foreign exchange rates, and agricultural production and prices will affect the Group’s income. That objective of market risk management is to manage and control market risk exposures within acceptable parameters, while optimizing the return.
There has been no change to the Group’s exposure to market risk or the manner in which it manages and measures the risk. The Group is subject to the following market risks:
a. Interest Rate Risk
The Group is exposed to interest rate fluctuations on their cash in bank, contract receivables on sale of real estate and short-term and long-term debt. Other financial assets and liabilities which principally arise in the ordinary course of its operations, are generally short-term and noninterest-bearing.
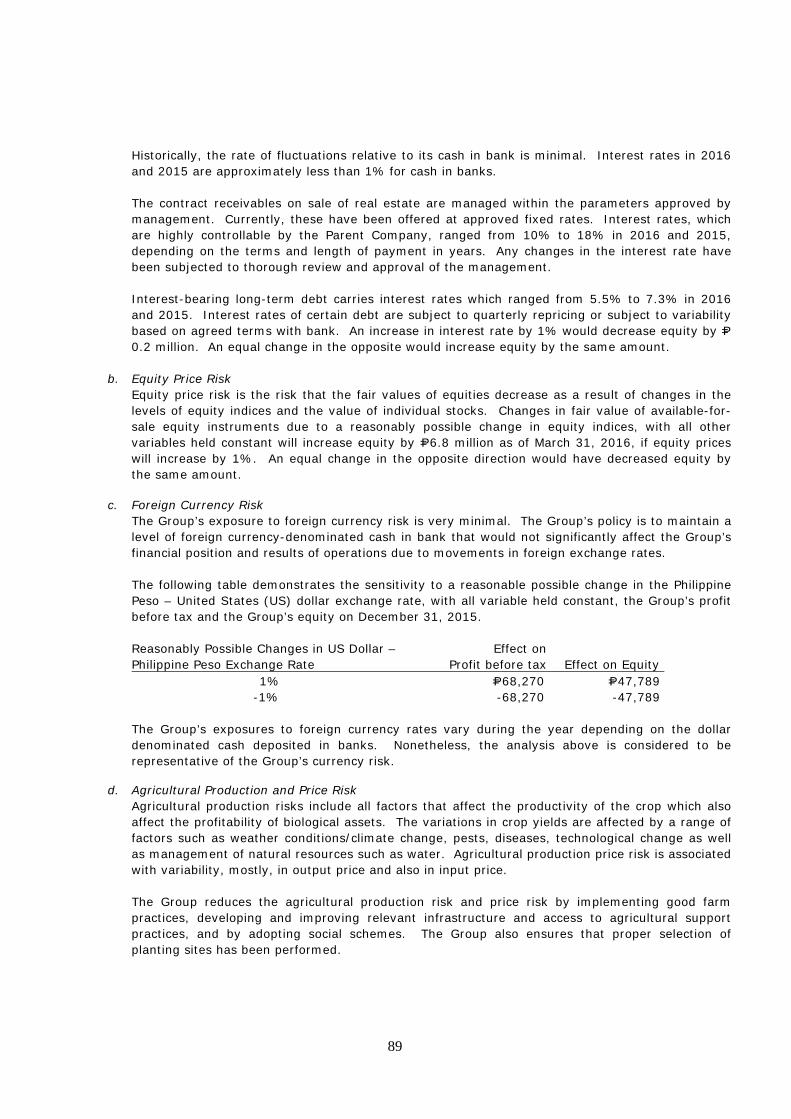
89
Historically, the rate of fluctuations relative to its cash in bank is minimal. Interest rates in 2016 and 2015 are approximately less than 1% for cash in banks. The contract receivables on sale of real estate are managed within the parameters approved by management. Currently, these have been offered at approved fixed rates. Interest rates, which are highly controllable by the Parent Company, ranged from 10% to 18% in 2016 and 2015, depending on the terms and length of payment in years. Any changes in the interest rate have been subjected to thorough review and approval of the management. Interest-bearing long-term debt carries interest rates which ranged from 5.5% to 7.3% in 2016 and 2015. Interest rates of certain debt are subject to quarterly repricing or subject to variability based on agreed terms with bank. An increase in interest rate by 1% would decrease equity by P=0.2 million. An equal change in the opposite would increase equity by the same amount.
b. Equity Price Risk Equity price risk is the risk that the fair values of equities decrease as a result of changes in the levels of equity indices and the value of individual stocks. Changes in fair value of available-for-sale equity instruments due to a reasonably possible change in equity indices, with all other variables held constant will increase equity by P=6.8 million as of March 31, 2016, if equity prices will increase by 1%. An equal change in the opposite direction would have decreased equity by the same amount.
c. Foreign Currency Risk
The Group’s exposure to foreign currency risk is very minimal. The Group’s policy is to maintain a level of foreign currency-denominated cash in bank that would not significantly affect the Group’s financial position and results of operations due to movements in foreign exchange rates. The following table demonstrates the sensitivity to a reasonable possible change in the Philippine Peso – United States (US) dollar exchange rate, with all variable held constant, the Group’s profit before tax and the Group’s equity on December 31, 2015. Reasonably Possible Changes in US Dollar – Philippine Peso Exchange Rate
Effect on Profit before tax
Effect on Equity
1% P=68,270 P=47,789 -1% -68,270 -47,789
The Group’s exposures to foreign currency rates vary during the year depending on the dollar denominated cash deposited in banks. Nonetheless, the analysis above is considered to be representative of the Group’s currency risk.
d. Agricultural Production and Price Risk Agricultural production risks include all factors that affect the productivity of the crop which also affect the profitability of biological assets. The variations in crop yields are affected by a range of factors such as weather conditions/climate change, pests, diseases, technological change as well as management of natural resources such as water. Agricultural production price risk is associated with variability, mostly, in output price and also in input price. The Group reduces the agricultural production risk and price risk by implementing good farm practices, developing and improving relevant infrastructure and access to agricultural support practices, and by adopting social schemes. The Group also ensures that proper selection of planting sites has been performed.
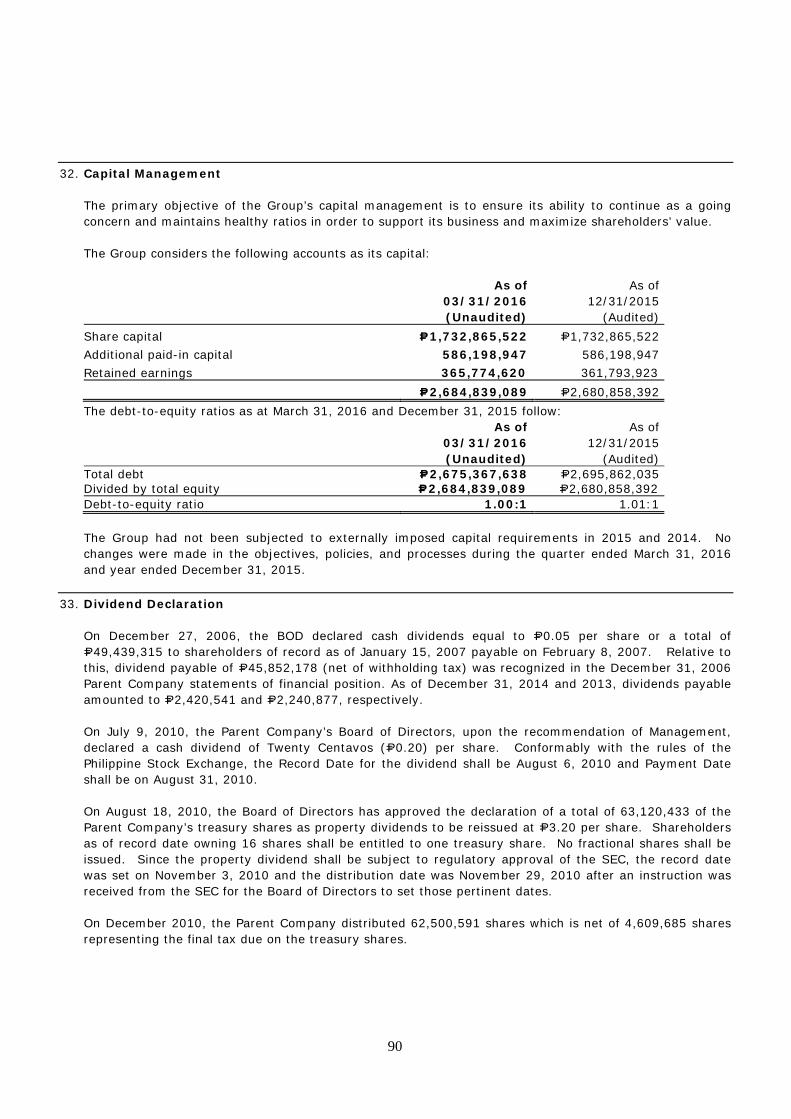
90
32. Capital Management
The primary objective of the Group’s capital management is to ensure its ability to continue as a going concern and maintains healthy ratios in order to support its business and maximize shareholders’ value. The Group considers the following accounts as its capital:
As of 03/31/2016 (Unaudited)
As of 12/31/2015
(Audited) Share capital P=1,732,865,522 P=1,732,865,522 Additional paid-in capital 586,198,947 586,198,947 Retained earnings 365,774,620 361,793,923 P=2,684,839,089 P=2,680,858,392
The debt-to-equity ratios as at March 31, 2016 and December 31, 2015 follow:
As of 03/31/2016 (Unaudited)
As of 12/31/2015
(Audited) Total debt P=2,675,367,638 P=2,695,862,035 Divided by total equity P=2,684,839,089 P=2,680,858,392 Debt-to-equity ratio 1.00:1 1.01:1
The Group had not been subjected to externally imposed capital requirements in 2015 and 2014. No changes were made in the objectives, policies, and processes during the quarter ended March 31, 2016 and year ended December 31, 2015.
33. Dividend Declaration
On December 27, 2006, the BOD declared cash dividends equal to P=0.05 per share or a total of P=49,439,315 to shareholders of record as of January 15, 2007 payable on February 8, 2007. Relative to this, dividend payable of P=45,852,178 (net of withholding tax) was recognized in the December 31, 2006 Parent Company statements of financial position. As of December 31, 2014 and 2013, dividends payable amounted to P=2,420,541 and P=2,240,877, respectively. On July 9, 2010, the Parent Company’s Board of Directors, upon the recommendation of Management, declared a cash dividend of Twenty Centavos (P=0.20) per share. Conformably with the rules of the Philippine Stock Exchange, the Record Date for the dividend shall be August 6, 2010 and Payment Date shall be on August 31, 2010. On August 18, 2010, the Board of Directors has approved the declaration of a total of 63,120,433 of the Parent Company’s treasury shares as property dividends to be reissued at P=3.20 per share. Shareholders as of record date owning 16 shares shall be entitled to one treasury share. No fractional shares shall be issued. Since the property dividend shall be subject to regulatory approval of the SEC, the record date was set on November 3, 2010 and the distribution date was November 29, 2010 after an instruction was received from the SEC for the Board of Directors to set those pertinent dates. On December 2010, the Parent Company distributed 62,500,591 shares which is net of 4,609,685 shares representing the final tax due on the treasury shares.

91
34. Business Segment Information
In identifying the operating segments, management generally follows the Group’s principal activities or business operations, which represent the main products and services provided by the Group as follows: Real estate Development of land into commercial and residential subdivision, sale of lots
and residential houses and the provision of customer financing for sales Quarry and Mining
Quarrying and mining of basalt rocks for production of constructionaggregates or sand and gravel
Service/ Manufacturing /Trading
Providing water supply and servicing Manufacturing of crude palm oil Selling of goods on wholesale and retail basis
Agriculture Development of land for palm oil production and sale of palm seedlings and
sale of crude palm oil Power Operating of power plants and/or purchase, generation, production supply
and sale of power. However, there was no commercial operation yet as of March 31, 2016.
Holding Holding of properties of every kind and description The Group generally account for inter-segment sales and transfers as if the sales and transfers were to third parties at current market prices. Exhibit 1-B regarding business segments presents assets and liabilities as of March 31, 2016 and revenue and profit information for quarters ending March 31, 2016 and 2015 (in thousands).
35. Amendments to the Articles of Incorporation and the By-Laws
In the Board of Directors meeting held on April 4, 2014 and the annual stockholders meeting on May 9, 2014, the Board of Directors and the shareholders representing 2/3 of the outstanding capital stock approved the following amendments in the Articles of Incorporation Amendment to paragraph 7: “That the Corporation’s authorized capital stock shall be increased from Two Billion Pesos (P=2,000,000,000.00) to Three Billion Pesos (P=3,000,000,000.00)”. The documents required on the application to the increase in authorized capital stock were not yet submitted to the SEC as of March 19, 2015. In a Board of Directors meeting held on May 2, 2012 and the annual stockholders meeting on June 1, 2012, the Board of Directors and the stockholders representing 2/3 of the outstanding capital stock approved the following amendments in the Articles of Incorporation: a. Amendment to paragraph 4: “That the term for which the Corporation is to exist is extended for
another fifty (50) years from and after the date of the expiration of the original corporate term on 20 December 2016”.
b. Amendment to paragraph 6: “That the number of directors of this Corporation shall be
Nine (9)……”
92
c. Amendment to paragraph 7: “That the amount of the capital stock of this Corporation is One Billion Six Hundred Twenty Million Pesos (P=1,620,000,000.00), Philippine Currency, and the said capital stock is divided into One Billion Six Hundred Twenty Million (1,620,000,000) shares with a par value of One Peso (P=1.00) each, provided that, stockholders shall have no preemptive right to subscribe to unissued shares unless otherwise approved by the Board of Directors”.
The SEC approved the said amendments on December 28, 2012. The BOD in its special meetings held on May 26 and June 10, 2008 approved the following amendments in its Articles of Incorporation. The amendments were confirmed by the stockholders representing not less than 2/3 of the outstanding capital stock in the annual stockholders’ meeting on July 11, 2008. a. Amendment to paragraph 3: “That the place where the principal office of the Corporation is to be
established is in Pasig City, Metro Manila”.
The change in principal office was approved by SEC on March 3, 2010. The BOD, during their meeting held on November 28, 2011 and by the stockholders of the Parent Company holding at least two-thirds (2/3) of the outstanding capital stock, amended the Articles of Incorporation, changing the principal office to Xavier Estates, Upper Balulang, Cagayan de Oro City. Amendment was approved by SEC on December 28, 2011.
b. Amendment to paragraph 7: “That the amount of the capital stock of this Corporation is P=15,320,000,000 and the said capital stock is divided into 15,320,000,000 shares with the par value of P=1.00 each, provided that shareholders shall have no preemptive right to subscribed unissued shares unless otherwise approved by the Board of Directors”.
Pending approval from SEC for the increase in its capitalization, the Parent Company received a total of P=187.8 million as of December 31, 2009, as deposits for future stock subscription. Additional deposits were received by the Parent Company in 2010 amounting to P=3.8 million. Inasmuch, however, that the Parent Company no longer has use for the fresh capital intended to be raised in 2008, management has proposed that the increase in capital stock be cancelled which was subsequently approved by the BOD in its board meeting last September 16, 2010. The deposits made in consideration thereof have already been returned to the stockholders concerned in 2010.
Moreover, the BOD on its meeting on March 26, 2007 and May 30, 2007, approved the following:
Amendment to paragraph 5 of the secondary purpose of the Articles of Incorporation, to read as follows:
“To engage in the power business, including but not limited to power generation, power trading and power supply, and for this purpose, to bid for or acquire power generation and power related assets, facilities, concessions and contracts, and to enter into other transactions or agreements relating to power, by itself or through joint ventures or partnerships, directly or through its subsidiaries or affiliates and to purchase, hold use, sell, transfer, mortgage, exchange, or dispose of real and personal properties of every kind and description, including all commercial papers and securities or obligations of domestic/foreign corporation or associations without being a stockholder or dealer and to pay or exchange therefore, stocks, bonds or other evidences of indebtedness or securities for this or any other corporation and to exercise any and all rights and obligations as owner or holder thereof, provided it shall not function as a trust corporation”.
The foregoing amendments were confirmed by the stockholders representing not less than 2/3 of the outstanding capital stock in the annual stockholders’ meeting on June 1, 2007. On May 2, 2012, the BOD approved the cancellation of this amendment.
93
36. Other Matter
Impasug-Ong and Kalabugao Plantations ABERDI entered into a Development Contract (DC) with Kapunungan Sa Mga Mag-uuma sa Kaanibungan (KASAMAKA) at the Municipality of Impasug-ong, Bukidnon concerning the development of Oil Palm Commercial Plantation.
KASAMAKA had been granted with Community Based Forest Management Agreement (CBFMA) no. 55093, by the Department of Environment and National Resources (DENR) on December 22, 2000 covering an area of 2,510.80 hectares. Under the CBFMA, KASAMAKA is mandated to develop, manage and protect the allocated community forest project area. Moreover, it is allowed to enter into agreements or contracts with private or government entities for the development of the whole or portion of the CBFMA area. The project’s objectives are to establish approximately 894 hectares into a commercial palm plantation within 5 years (2006-2011). However, ABERDI may intercrop suitable agricultural crops in the plantation and raise livestock, the harvest and produce of which shall belong to ABERDI. The responsibilities of KASAMAKA with regards to the project follow: • To provide the land area of 894 hectares within CBFMA area for oil palm plantation. • To provide manpower needs of the Group in all developmental activities such as land preparation,
planting, weeding, fertilization, harvesting, maintenance and others. On the other hand, the responsibility of ABERDI in regard to the project is to provide technical and financial resources to develop the 894 hectares into palm oil plantation for a period of 20 years up to 2026. Relative to the agreement, the Group paid for leasehold rights on the land that are applicable up to year 2026 (see Note 17). Opol Plantation NC entered into a Development Contract for the establishment of Palm Oil Plantation in Tingalan, Opol, Misamis Oriental with Kahugpongan sa mga Mag-Uuma sa Barangay Tingalan (KMBT). KMBT has been granted CBFMA No. 56297 by DENR on December 31, 2000 covering a total area of 1,000 hectares of forest lands located in Tingalan, Opol, Misamis Oriental to develop, manage and protect the allocated Community Forest Project Area. The roles and responsibilities of KMBT under the Development Contract are as follows: • To provide the land area within the CBFMA for oil plantation • To provide manpower needs of NC in all developmental activities such as land preparation, planting,
weeding, fertilization, harvesting, maintenance and others. On the other hand, the responsibility of NC in regard to the project is to provide technical and financial resources to develop the covered area into palm oil plantation for a period of 25 years.
94
37. Litigation
Yulo Case On December 15, 2008, the First Division of the Supreme Court issued a resolution, denying with finality the motion for reconsideration filed by the Parent Company on October 15, 2008 concerning the case involving a claim for sum of money, specific performance and damage by a certain individual in November 2001. As a result, the Parent Company recognized an estimated litigation loss of P=34.4 million, inclusive of 12% legal interest computed from default until judgment is fully satisfied based on the Court of Appeals amended decision on July 23, 2008 and claimant. On July 15, 2009, pursuant to the assailed Order of the trial court dated June 25, 2009, the Parent Company paid the claimant the amount of P=22.4 million. The said payment was made with the intention of putting closure to the case. The difference between the amount of litigation liability and the amount of settlement has been recorded by the Parent Company as withholding tax on compensation pursuant to the BIR ruling that the nature of the claim is compensation income. In May 2010, the amount recorded by the Parent Company as withholding tax on compensation was released to the Court of Appeals until the decision is final. The presiding judge who handled the case was eventually replaced. In an Order dated April 15, 2010, the new presiding judge, reversed the order of the former presiding judge, declaring that the judgment award is not subject to income tax and, at the same time, eliminating the threshold date of 15 July 2009 set by the former presiding judge in the computation of the total amount payable to the claimant. The new presiding judge ruled that the Parent Company was “still obligated to pay the amount of P=14, 075,521.24 as of April 15, 2010, subject to daily interest at the rate of P=4, 305.73 until judgment is fully satisfied.” The Parent Company moved for reconsideration of the said order but, to no avail. The matter is elevated to the Court of Appeals and, thereafter, the Supreme Court. In due course, the Court of Appeals and the Supreme Court confirmed that the award in favor of Yulo is subject to 32% tax. Plaintiff filed a motion for execution with the RTC seeking additional interest. The court granted the said motion. On January 12, 2016, the Parent Company filed a Motion for Reconsideration (MR) which was denied outright by the judge.
On February 5, 2016, the Parent Company filed a petition for certiorari with prayer for temporary restraining order with Court of Appeals.
However, on March 10, 2016 through a Compromise Agreement, the Company settled the additional interest. The Plaintiff's counsel executed a notice of satisfaction of judgment to confirm the full and final satisfaction of the award on the same day.
Lustre Case The Parent Company filed with the trial court a case for rescission with damages against defendants Home Industries Development Corporation (“HIDC”) and/or Mr. Antonio Lustre. The instant case was brought about by the defendants’ non-delivery of lots subject of a contract to sell. The amount involved in the instant case is Six Million Four Hundred Sixty-Four Thousand Four Hundred Twenty-Five Pesos (P=6,464,425.00) [(cash actually paid by the Parent Company) P=794,425.00 + (present value of shares of stock) P=5,400,000.00 + (difference between value of the shares of stock at the date of the execution of
95
the Contract to Sell and the present value of the shares of stock) P=270,000.00]. The trial court ruled in favor of the Parent Company. The Parent Company learned that the shares of stock forming part of the trial court’s judgment award had been disposed and were no longer in the name of Defendants Home Industries Development Corporation (“HIDC”) and/or Mr. Antonio Lustre. As such, the Parent Company filed an Omnibus Motion dated 18 April 2011 praying, among others, that Defendant HIDC pay the value of the shares of stock, in lieu of the actual return of the same, which regrettably was denied by the trial court. Considering the trial court’s denial of the above-mentioned Omnibus Motion, the Parent Company filed with the Court of Appeals a Motion for Amendment and/or Clarification of Judgment Based on Supervening Events (“Motion”) dated 22 February 2012. This Motion was subsequently denied in a Resolution dated 27 December 2012. Consequently, the Parent Company filed a Motion for Reconsideration (Of the Resolution dated 27 December 2012). On December 9, 2014, the Decision was executed through public sale wherein ABCI was declared the highest bidder at the bid price of Three Million Nine Hundred Ninety-Four Thousand Eight Hundred Thirty –Five Pesos & 31/100 (P=3,994,835.31). The Certificate of Sale in favor of ABCI has already been registered with the Register of Deeds on January 12, 2015 and is duly annotated on the corresponding Transfer Certificated of Title involved. HIDC has one (1) year from January 12, 2015 within which to redeem the property. However, the redemption period lapsed without HIDC redeeming the properties. In view thereof, the Parent Company is processing the payment of taxes due on the properties and the transfer of the titles in the Parent Company’s name.
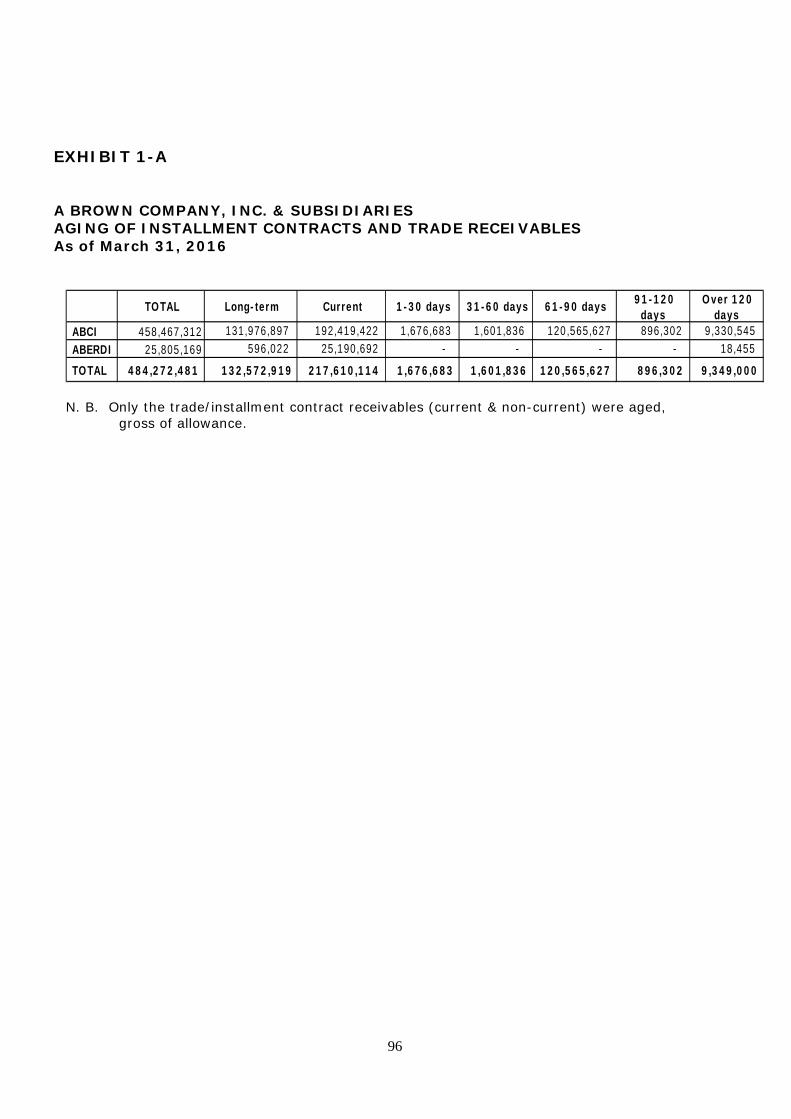
96
EXHIBIT 1-A
A BROWN COMPANY, INC. & SUBSIDIARIES AGING OF INSTALLMENT CONTRACTS AND TRADE RECEIVABLES
As of March 31, 2016
N. B. Only the trade/installment contract receivables (current & non-current) were aged,
gross of allowance.
TOTAL Long-term Current 1-30 days 31-60 days 61-90 days 91-120 days
Over 120 days
ABCI 458,467,312 131,976,897 192,419,422 1,676,683 1,601,836 120,565,627 896,302 9,330,545 ABERDI 25,805,169 596,022 25,190,692 - - - - 18,455
TOTAL 484,272,481 132,572,919 217,610,114 1,676,683 1,601,836 120,565,627 896,302 9,349,000
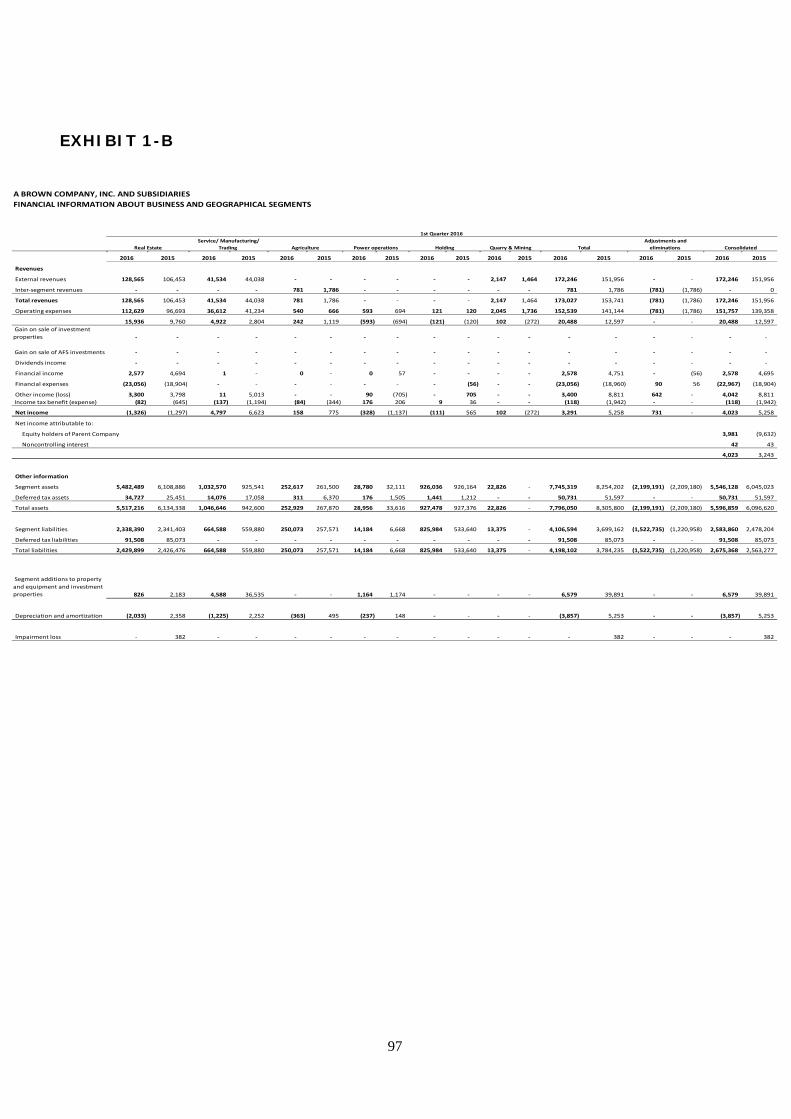
97
EXHIBIT 1-B
A BROWN COMPANY, INC. AND SUBSIDIARIESFINANCIAL INFORMATION ABOUT BUSINESS AND GEOGRAPHICAL SEGMENTS
2016 2015 2016 2015 2016 2015 2016 2015 2016 2015 2016 2015 2016 2015 2016 2015 2016 2015
Revenues
External revenues 128,565 106,453 41,534 44,038 ‐ ‐ ‐ ‐ ‐ ‐ 2,147 1,464 172,246 151,956 ‐ ‐ 172,246 151,956
Inter‐segment revenues ‐ ‐ ‐ ‐ 781 1,786 ‐ ‐ ‐ ‐ ‐ ‐ 781 1,786 (781) (1,786) ‐ 0
Total revenues 128,565 106,453 41,534 44,038 781 1,786 ‐ ‐ ‐ ‐ 2,147 1,464 173,027 153,741 (781) (1,786) 172,246 151,956
Operating expenses 112,629 96,693 36,612 41,234 540 666 593 694 121 120 2,045 1,736 152,539 141,144 (781) (1,786) 151,757 139,358
15,936 9,760 4,922 2,804 242 1,119 (593) (694) (121) (120) 102 (272) 20,488 12,597 ‐ ‐ 20,488 12,597 Gain on sale of investment properties ‐ ‐ ‐ ‐ ‐ ‐ ‐ ‐ ‐ ‐ ‐ ‐ ‐ ‐ ‐ ‐ ‐ ‐
Gain on sale of AFS investments ‐ ‐ ‐ ‐ ‐ ‐ ‐ ‐ ‐ ‐ ‐ ‐ ‐ ‐ ‐ ‐ ‐ ‐
Dividends income ‐ ‐ ‐ ‐ ‐ ‐ ‐ ‐ ‐ ‐ ‐ ‐ ‐ ‐ ‐ ‐ ‐ ‐
Financial income 2,577 4,694 1 ‐ 0 ‐ 0 57 ‐ ‐ ‐ ‐ 2,578 4,751 ‐ (56) 2,578 4,695
Financial expenses (23,056) (18,904) ‐ ‐ ‐ ‐ ‐ ‐ ‐ (56) ‐ ‐ (23,056) (18,960) 90 56 (22,967) (18,904)
Other income (loss) 3,300 3,798 11 5,013 ‐ ‐ 90 (705) ‐ 705 ‐ ‐ 3,400 8,811 642 ‐ 4,042 8,811 Income tax benefit (expense) (82) (645) (137) (1,194) (84) (344) 176 206 9 36 ‐ ‐ (118) (1,942) ‐ ‐ (118) (1,942)
Net income (1,326) (1,297) 4,797 6,623 158 775 (328) (1,137) (111) 565 102 (272) 3,291 5,258 731 ‐ 4,023 5,258
Net income attributable to:
Equity holders of Parent Company 3,981 (9,632)
Noncontrolling interest 42 43
4,023 3,243
Other information
Segment assets 5,482,489 6,108,886 1,032,570 925,541 252,617 261,500 28,780 32,111 926,036 926,164 22,826 ‐ 7,745,319 8,254,202 (2,199,191) (2,209,180) 5,546,128 6,045,023
Deferred tax assets 34,727 25,451 14,076 17,058 311 6,370 176 1,505 1,441 1,212 ‐ ‐ 50,731 51,597 ‐ ‐ 50,731 51,597
Total assets 5,517,216 6,134,338 1,046,646 942,600 252,929 267,870 28,956 33,616 927,478 927,376 22,826 ‐ 7,796,050 8,305,800 (2,199,191) (2,209,180) 5,596,859 6,096,620
Segment liabilities 2,338,390 2,341,403 664,588 559,880 250,073 257,571 14,184 6,668 825,984 533,640 13,375 ‐ 4,106,594 3,699,162 (1,522,735) (1,220,958) 2,583,860 2,478,204
Deferred tax liabilities 91,508 85,073 ‐ ‐ ‐ ‐ ‐ ‐ ‐ ‐ ‐ ‐ 91,508 85,073 ‐ ‐ 91,508 85,073
Total liabilities 2,429,899 2,426,476 664,588 559,880 250,073 257,571 14,184 6,668 825,984 533,640 13,375 ‐ 4,198,102 3,784,235 (1,522,735) (1,220,958) 2,675,368 2,563,277
Segment additions to property and equipment and investment properties 826 2,183 4,588 36,535 ‐ ‐ 1,164 1,174 ‐ ‐ ‐ ‐ 6,579 39,891 ‐ ‐ 6,579 39,891
Depreciation and amortization (2,033) 2,358 (1,225) 2,252 (363) 495 (237) 148 ‐ ‐ ‐ ‐ (3,857) 5,253 ‐ ‐ (3,857) 5,253
Impairment loss ‐ 382 ‐ ‐ ‐ ‐ ‐ ‐ ‐ ‐ ‐ ‐ ‐ 382 ‐ ‐ ‐ 382
Adjustments and eliminations Consolidated
1st Quarter 2016
Real Estate Service/ Manufacturing/
Trading Agriculture Power operations Holding Quarry & Mining Total
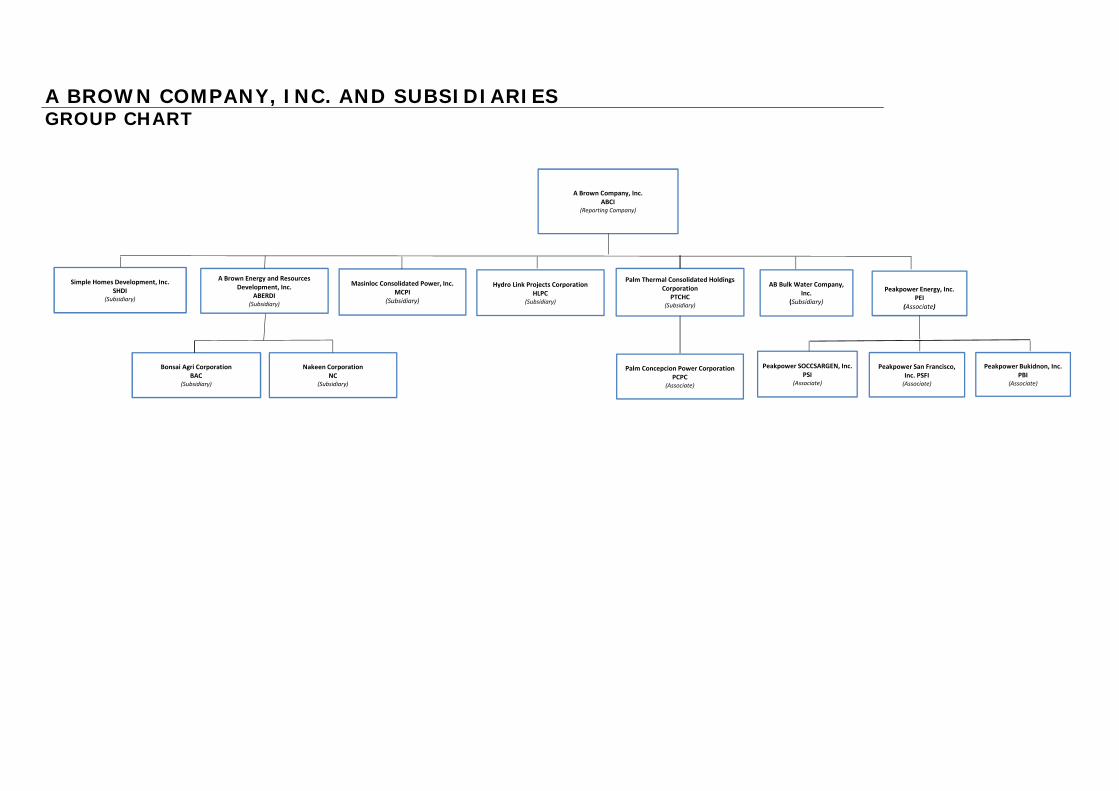
A BROWN COMPANY, INC. AND SUBSIDIARIESGROUP CHART
A Brown Company, Inc.ABCI
(Reporting Company)
A Brown Energy and Resources Development, Inc.
ABERDI(Subsidiary)
Masinloc Consolidated Power, Inc.MCPI
(Subsidiary)
Palm Thermal Consolidated Holdings Corporation
PTCHC(Subsidiary)
Hydro Link Projects CorporationHLPC
(Subsidiary)
AB Bulk Water Company, Inc.
(Subsidiary)
Simple Homes Development, Inc.SHDI
(Subsidiary)
Bonsai Agri CorporationBAC
(Subsidiary)
Nakeen CorporationNC
(Subsidiary)
Palm Concepcion Power CorporationPCPC
(Associate)
Peakpower SOCCSARGEN, Inc. PSI
(Associate)
Peakpower San Francisco, Inc. PSFI(Associate)
Peakpower Energy, Inc.PEI
(Associate)
Peakpower Bukidnon, Inc.PBI
(Associate)