06 ya ds bs
TRANSCRIPT
This article was originally published in a journal published byElsevier, and the attached copy is provided by Elsevier for the
author’s benefit and for the benefit of the author’s institution, fornon-commercial research and educational use including without
limitation use in instruction at your institution, sending it to specificcolleagues that you know, and providing a copy to your institution’s
administrator.
All other uses, reproduction and distribution, including withoutlimitation commercial reprints, selling or licensing copies or access,
or posting on open internet sites, your personal or institution’swebsite or repository, are prohibited. For exceptions, permission
may be sought for such use through Elsevier’s permissions site at:
http://www.elsevier.com/locate/permissionusematerial

Autho
r's
pers
onal
co
py
Deep-Sea Research II 53 (2006) 1769–1786
The northeastern Black Sea redox zone: Hydrochemicalstructure and its temporal variability
E.V. Yakusheva,�, V.K. Chasovnikova, E.I. Debolskayaa, A.V. Egorovb,P.N. Makkaveevb, S.V. Pakhomovab, O.I. Podymova, V.G. Yakubenkoa
aSouthern Branch of the P.P. Shirshov Institute of Oceanology, RAS, Gelendzhik, RussiabP.P. Shirshov Institute of Oceanology, RAS, Moscow, Russia
Received 1 June 2004; accepted 8 May 2006
Available online 6 September 2006
Abstract
Detailed studies of the vertical structure of hydrochemical parameters in the northeastern Black Sea near Gelendzhik are
presented and discussed. This work is based on a set of systematic observations carried out in this region during R/V
‘‘Akvanavt’’ and R/V ‘‘Ashamba’’ cruises from 1997 to 2005 and also on data from previous studies from 1984 to 1997.
The Black Sea region near Gelendzhik is far from the influences of the Bosporus input and Danube River inflow.
Therefore, the vertical structure in this region is more stable compared to the western Black Sea and reflects ‘‘integrated,’’
rather than local, changes of the Black Sea. Seasonal variations in the distribution of chemical parameters at the redox
interface are connected to seasonal variations in hydrophysical processes and organic matter production. In winter,
maxima of organic phosphorus and urea were absent in the vicinity of the onset of hydrogen sulfide. The concentrations of
nitrate were lower in winter than in summer. Winter mixing in the anticyclone eddies led to reduced vertical gradients in the
redox layer and to the disappearance of an upper phosphate minimum. Study of the interannual dynamics of oxygen
concentrations in the Cold Intermediate Layer and anoxic waters boundary in the density field position revealed climatic-
scale changes that may be connected with changes in the North Atlantic Oscillation (NAO) index.
r 2006 Elsevier Ltd. All rights reserved.
Keywords: Black Sea; Biogeochemical cycle; Oxic/anoxic interface; Seasonal variability; Interannual variability; Macronutrients
1. Introduction
Black Sea is the largest meromictic basin in theworld. Annual renovation of its surface watersoccurs only down to depth of about 60–80m, whichis the depth of the Cold Intermediate Layer (CIL)(sy ¼ 14.50 kg/m3). Turbulent diffusion controls thevertical flux below the CIL. This restriction of thesupply of oxygen allows oxygen to become rapidly
consumed due to organic matter (OM) oxidation.Hydrogen sulfide first appears about 50m below thedepth of the CIL (�110–130m). Deeper water in theBlack Sea below the CIL forms by variable mixingof the CIL with the high-salinity deep Bosporusoutflow from the Marmara Sea (Murray et al.,1991). This mixing takes place on the continentalshelf near the Bosporus.
Away from the SW region, influenced by theBosphorus Plume, redox potential decreases gradu-ally with increasing depth and water density. In thedepth range where oxic conditions change to anoxic
ARTICLE IN PRESS
www.elsevier.com/locate/dsr2
0967-0645/$ - see front matter r 2006 Elsevier Ltd. All rights reserved.
doi:10.1016/j.dsr2.2006.05.019
�Corresponding author.
E-mail address: [email protected] (E.V. Yakushev).

Autho
r's
pers
onal
co
py
(the redox zone), oxidized and reduced chemicalspecies interact. These processes occur in a pre-dictable sequence depending on the changes inredox potential (Murray et al., 1995; Rozanov,1995). The products of these reactions appear in theenvironment following the sequence of reactions.OM, which is ultimately the main reducing agent inthe redox zone (Rozanov, 1995), is transported fromthe euphotic zone as new production and is alsogenerated by chemosynthesis in the redox zone(Sorokin, 2002). Water layers with sharply differentchemical, biological and microbiological character-istics can be delineated in the Black Sea (Murrayet al., 1995). Vertical distributions of reactants andproducts demonstrate that specific reactions mayoccur in layers as thin as 2–5m.
The sequence of reactions is characterized bydiagnostic chemical distribution. These distribu-tions display chemotropy—the correspondence ofvertical chemical distributions to specific densitylevels (in accordance to barotropy—the correspon-dence of pressure and density levels). There havebeen numerous estimates of typical density levels ofthe onset of chemical species, depths of extrema anddepths of change of vertical gradients (Vinogradovand Nalbandov, 1990; Codispoti et al., 1991; Lewisand Landing, 1991; Murray et al., 1995; Turgulet al., 1992; Rozanov et al., 2000; Konovalov, 2001;Chasovnikov, 2002).
One of the most interesting features of the redoxzone of the Black Sea is the absence of directcontact of significant concentrations of oxygen andhydrogen sulfide. This suboxic layer (with formalboundaries of 10 mM for oxygen and 0.3 mM forhydrogen sulfide) was first described after 1988 R/V
Knorr Expedition (Murray et al., 1989). Hydrogensulfide was present in trace concentrations, andoxygen concentrations were near the detection limitof about 0.5–3 mM (Codispoti et al., 1991; Glazeret al., 2006) in an approximately 30-m layer.
A fine particle layer (FPL) also associated withthe redox layer, and the light transmission minimumis observed near the hydrogen sulfide boundary(Volkov et al., 1997). OM decay occurs in the redoxlayer by different reactions (i.e., aerobic mineraliza-tion, denitrification, sulfate reduction), and redoxprocesses are carried out both chemically andmicrobiologically (Millero, 1991; Tebo, 1991; Neal-son and Stahl, 1997; Volkov et al., 1997). It isnecessary to define the role of bacteria that governredox reactions and consume inorganic nutrients(Sorokin, 2002), in ways that affect the vertical
distributions of their organic forms (Sorokin, 2002;Coban-Yildiz et al., 2000; Yakushev et al., 2003).Since the cycles of all elements are interconnected, itis not possible to explain the distribution of anyspecific parameter without knowing its connectionwith the distribution of other parameters.
Over the past few decades the Black Sea has beenseriously perturbed by intensive anthropogeniccontamination (Konovalov and Murray, 2001).When observations from near the Danube delta inthe 1980s were compared to data from the 1960s,Cociasu et al. (1996) found that some nutrients hadincreased (e.g., NO3 due to eutrophication) whileothers had decreased (e.g., Si due to dam construc-tion or intensification of diatoms blooms). Inaddition to eutrophication, distributions in theBlack Sea are influenced by variability in climate(Oguz et al., 2006). Changes in both the upper(Konovalov and Murray, 2001) and lower (Yakush-ev et al., 2001) boundaries of the suboxic layer havebeen observed.
The modern concept about the distributions andvariability of the Black Sea oxic/anoxic interfacehave been based on several international expedi-tions to the Black Sea since the late 1980s. Themajority of these expeditions took place in thesouthern and western parts of the Sea, which aresignificantly influenced by the influx from theDanube and the Bosporus Plume (Codispoti et al.,1991; Lewis and Landing, 1991; Tebo, 1991; Lutheret al., 1991; Murray et al., 1995; Ivanov et al., 1999;Konovalov et al., 2003). These studies took place indifferent years and different seasons, and it issometimes difficult to determine what controls theobserved spatial and temporal variability.
Recent studies in offshore waters, distant fromthe Bosporus, have revealed changes in the char-acteristics of chemotropy (Yakushev et al., 2003;Glazer et al., 2006) in different seasons and/ordifferent regions of the Sea. Such changes aredetermined by the combined influence of a complexset of processes that are characterized by differentclimatic, seasonal and synoptic scales. To estimatetheir relative roles, it is necessary to analyzesystematic observations of temporal and spatialvariability.
For these reasons it is better to use observationsfrom the northeastern Black Sea (NE BS), a regionfar from the influence of the Bosporus Plume andDanube River inflow. Compared to the southernand western parts of the sea, there is less differenceof the redox layer structure between the central
ARTICLE IN PRESSE.V. Yakushev et al. / Deep-Sea Research II 53 (2006) 1769–17861770

Autho
r's
pers
onal
co
py
(Eastern Gyre) and coastal region. There is bettercorrespondence between the chemical structurefeatures and the density levels throughout thisregion, and intrusions from remote sources intothe redox zone are not observed. Therefore, (1) thevertical structure in this region is more stablecompared to the other regions of the Black seaand (2) changes of this structure reflect ‘‘inte-grated’’, rather than local, changes of the Sea.
This study presents the data collected in the NEBS, where an intensive time series of observationshas been observed. This is a unique dataset in theBlack Sea. There are very few such time seriesavailable to document seasonal/interannual varia-bility at the same site. The goal of this paper is todescribe the details of the hydrochemical structureof the redox zone in this region and to determine thetemporal variability on seasonal and interannualtime scales.
2. Materials and methods
2.1. Study area
The location of the region studied and an exampleof the surface currents is presented in Fig. 1. TheNE BS is influenced by the rim current that isdirected to the northwest parallel to the coast line.The intensity of this current changes seasonally andinterannualy (Zatsepin et al., 2002). Anticycloniceddies are usually observed between this currentand the coast. These anticyclones also migrate tothe northwest. The distributions of chemical andbiological characteristics are connected to theposition of the rim current frontal zone (Chasovni-kov, 2002).
2.2. Sampling and analysis
This work is based on observations carried out inthe NE BS during R/V ‘‘Akvanavt’’ and R/V
‘‘Ashamba’’ cruises from 1997 to 2005 and also ondata from previous studies on the other vessels from1984 to 1997 (Table 1).
In the cruises devoted to the redox interfacestudies, the sampling in the suboxic layer (sy ¼16.20–15.80 kg/m3 and shallower) was performed at2–3m intervals. During multiple day cruises(aboard R/V ‘‘Akvanavt’’), samples were processedaboard ship and during the 1-day cruises (aboardR/V ‘‘Ashamba’’ or R/V ‘‘Akvanavt’’) sampleswere processed in the coastal laboratory within
1–2 h of sampling. These studies were performedperiodically and cover all the seasons.
The following parameters were measured: dis-solved oxygen, pH, alkalinity, phosphate, totalphosphorus, silicate, nitrate, nitrite, ammonium,urea, total nitrogen, hydrogen sulfide, manganese,iron and methane. Water samples for chemicalmeasurements were collected with 5-L Niskinbottles on a rosette equipped with a Sea BirdCTD probe.
Dissolved oxygen analyses were performed usingthe classic Winkler method with a 30-ml JenconsDigitrate automatic burette. In addition to acorrection for the blank, we also corrected for theoxygen content in the reagents (Hansen, 1999). Theaccuracy of Winkler technique was 0.02ml/L(0.9 mM), the detection limit was about 0.06ml/L(2.7 mM).
pH was measured by glass electrode and deter-mined on the NBS scale with a pH-meter ‘‘I-500’’(produced by NPKF ‘‘Aquilon’’, Russia). Theprecision was about 0.01 pH units.
Alkalinity samples were collected in 250-ml glassbottles. Total alkalinity was determined in thecoastal laboratory by direct titration with hydro-chloric acid according to Bruevich’s modification(Bordovskiy and Chernyakova, 1992). The titrationwas conducted with constant venting with CO2-freeair to pH value of 5.45. The precision of thistechnique was about 2 meq/kg.
Phosphate was determined by the method ofKoroleff (Hansen and Koroleff, 1999). Absorbancewas measured at 885 nm in a 50-mm cell.
For silicate, we used the method by Koroleff(1972) based on the formation of B-1:12 silicomolybdic acid and its partial reduction to a blueheteropoly acid. Absorbance was measured at880 nm with a 10-mm cuvette.
Nitrite was measured with sulfanilamide and N-1-naphthylethylendiamine dihydrochloride (Hansenand Koroleff, 1999). Nitrate was converted tonitrite using Cu–Cd columns. Absorbance wasmeasured at 543 nm in a 50-mm cell. After 2004,nitrate was measured with AA ‘‘Brann-Luebbe’’ inaccordance to the producer’s recommendations.
Ammonium was determined by the phenol–hypo-chlorite reaction (Solorzano, 1969). The reagents(phenol and hypochlorite solutions) were added ondeck in order to avoid contamination of NH3 fromthe air inside the ship.
Urea was measured photometrically with diace-tylmonooxim and semicarbazid (Sapozhnikov et al.,
ARTICLE IN PRESSE.V. Yakushev et al. / Deep-Sea Research II 53 (2006) 1769–1786 1771

Autho
r's
pers
onal
co
py
ARTICLE IN PRESS
44°15'
44°30'
44°45'
37˚45' 38˚00' 38˚15' 38˚30'
Novorossiysk
Gelendz hik
Akv-57 23-24.01.04Z161&GV
168
-50 cm s-1
St. 1487
Fig. 1. Region of studies (bounded by a dashed line) near Gelendzhik, Russia and the position of station 1487 in a velocity field of the R/V
‘‘Akvanavt’’ survey in January 24–25, 2004 calculated by the geostrophic method.
Table 1
List of expeditions with chemical measurements in the redox layer in the Northeastern Black Sea
Vessel, Cruise # Date Content of work
R/V ‘‘Vityaz’’ 1984, April 22—May 30 NE, SE and western coast of the BS
R/V ‘‘Rift’’ 1986, May 19–June 29 A few stations near Gelendzhik and Bulgarian coast
R/V ‘‘Vityaz’’ 1988, March 07–25 Several stations in NW and central part of the BS
R/V ‘‘Yantar’’ 1989, February 09–March 23 Polygon survey near(�25 miles rad.) Gelendzhik and Novorossiysk
R/V ‘‘Akvanavt’’ 1989, February 09–15 Polygon survey near(�20 miles rad.) Gelendzhik
R/V ‘‘Akvanavt’’ 1989, March 09–23 Polygon survey near(�25 miles rad.) Novorossiysk and Gelendzhik
R/V ‘‘Akvanavt’’ 1989, May 26–June 02 Polygon survey near(�20 miles rad.) Gelendzhik
R/V ‘‘Dmitry Mendeleev’’ 1989, July 23–September 09 NE, NW and southern parts of the BS
R/V ‘‘Akvanavt’’ 1989, August 02–14 Polygon survey near(�25 miles rad.) Novorossiysk and Gelendzhik
R/V ‘‘Akvanavt’’ 1989, November 02–15 Polygon survey near NE coast of the BS
R/V ‘‘Akvanavt’’ 1990, February 20–22 A few stations near (�10 miles rad.) Novorossiysk and Gelendzhik
R/V ‘‘Profsoyuz’’ 1990, August 15–19 Polygon survey near(�25 miles rad.) Gelendzhik and Novorossiysk
R/V ‘‘Vityaz’’ 1991, February 11–April 04 Central, NW and SE parts of the BS
R/V ‘‘Rift’’ 1991, June 10–18 Polygon survey near(�30 miles rad.) Gelendzhik and Novorossiysk
R/V ‘‘Vityaz’’ 1991, August 17–23 A few stations in the eastern, central and NW part of the BS
R/V ‘‘Akvanavt’’ 1994, September 11–19 Polygon survey in NE part of the BS
R/V ‘‘Akvanavt’’ 1994, September 30–October 05 Polygon survey near(�30 miles rad.) NE coast of the BS
R/V ‘‘Akvanavt’’ 1995, March 19–28 Polygon survey in NE part of the BS
R/V ‘‘Donuzlav’’ 1995, July 23–26 cross-section ‘‘Gelendzhik—Eastern Gyre’’
E.V. Yakushev et al. / Deep-Sea Research II 53 (2006) 1769–17861772

Autho
r's
pers
onal
co
py
1988). This technique can be applied for concentra-tions from 0.1 to 10 mg at/L and has a precision of4.3 % at concentration of 2 mg at/L.
Total phosphorus was determined by digestionwith sodium persulfate in a water bath at 100 1C.The Valderrama technique (digestion in an auto-clave) was used for analysis of total nitrogen.
Organic forms of phosphorus and nitrogen wereestimated as the difference between the total andinorganic forms (phosphate for phosphorus andnitrate, nitrate and ammonium for nitrogen).
Two techniques were used for determination ofhydrogen sulfide: low concentrations (less than30 mM H2S) in the upper part of anoxic zone were
ARTICLE IN PRESS
Table 1 (continued )
Vessel, Cruise # Date Content of work
R/V ‘‘Yantar’’ 1996, June 25–July 06 Polygon survey in NE part of the BS
R/V ‘‘Yuzhmorgeo’’ 1996, September 01–08 Polygon survey near(�10 miles rad.) NE coast of the BS
R/V ‘‘Akvanavt’’ 1997, November 12–17 cross-section ‘‘Gelendzhik—Eastern Gyre’’
R/V ‘‘Akvanavt’’ 1998, April 07–09 cross-section ‘‘Gelendzhik—Eastern Gyre’’
R/V ‘‘Akvanavt’’ 1999, February 13–16 cross-section ‘‘Gelendzhik—Eastern Gyre’’
R/V ‘‘Akvanavt’’ 1999, April 08–09 cross-section ‘‘Gelendzhik—Eastern Gyre’’
R/V ‘‘Akvanavt’’ 1999, June 10–11 cross-section ‘‘Gelendzhik—Eastern Gyre’’
R/V ‘‘Akvanavt’’ 1999, September 25–30 Polygon survey in NE part of the BS
R/V ‘‘Akvanavt’’ 1999, October 04–07 cross-section ‘‘Tuapse—Eastern Gyre’’
R/V ‘‘Akvanavt’’ 1999, October 14–17 cross-section ‘‘Gelendzhik—Eastern Gyre’’
R/V ‘‘Akvanavt’’ 1999, October 21–26 cross-section ‘‘Gelendzhik—Eastern Gyre’’
R/V ‘‘Akvanavt’’ 1999, November 23–December 07 Studies near(�3 miles rad.) Gelendzhik
R/V ‘‘Akvanavt’’ 1999, December 24–26 cross-section ‘‘Gelendzhik—Eastern Gyre’’
R/V ‘‘Akvanavt’’ 2000, February 29–March 02 cross-section ‘‘Gelendzhik—Eastern Gyre’’
R/V ‘‘Akvanavt’’ 2000, April 07–08 cross-section ‘‘Gelendzhik—Eastern Gyre’’
R/V ‘‘Akvanavt’’ 2000, October 31–November 04 Polygon survey in NE part of the BS
R/V ‘‘Akvanavt’’ 2000, November 17–20 Polygon survey in NE part of the BS
R/V ‘‘Akvanavt’’ 2000, November 30–December 04 cross-section ‘‘Sochi—Eastern Gyre’’
R/V ‘‘Akvanavt’’ 2000, December 20–22 cross-section ‘‘Gelendzhik—Eastern Gyre’’
R/V ‘‘Akvanavt’’ 2001, April 03–06 cross-section ‘‘Gelendzhik—Eastern Gyre’’
R/V ‘‘Akvanavt’’ 2001, April 25–29 cross-section ‘‘Gelendzhik—Eastern Gyre’’
R/V ‘‘Akvanavt’’ 2001, June 10–11 cross-section ‘‘Gelendzhik—Eastern Gyre’’
R/V ‘‘Akvanavt’’ 2001, July 29 A station near (�7 miles) from Gelendzhik
R/V ‘‘Akvanavt’’ 2001, August 20 A station near (�7 miles) Gelendzhik
R/V ‘‘Akvanavt’’ 2001, September 02 Few stations near(�5 miles rad.) Gelendzhik
R/V ‘‘Akvanavt’’ 2001, September 15–19 cross-section ‘‘Gelendzhik—Eastern Gyre’’
R/V ‘‘Akvanavt’’ 2001, September 28–30 cross-section ‘‘Gelendzhik—Eastern Gyre’’
R/V ‘‘Akvanavt’’ 2001, October 6–12 Polygon survey in NE-eastern part of the BS
R/V ‘‘Akvanavt’’ 2001, October 22–23 cross-section ‘‘Gelendzhik—Eastern Gyre’’
R/V ‘‘Akvanavt’’ 2001, November 29–December 04 Polygon survey in NE part of the BS
R/V ‘‘Akvanavt’’ 2002, March 15 A station near (�3 miles) Gelendzhik
R/V ‘‘Akvanavt’’ 2002, March 28–30 cross-section ‘‘Gelendzhik—Eastern Gyre’’
R/V ‘‘Akvanavt’’ 2002, May 18–20 cross-section ‘‘GelendzhiksEastern Gyre’’
R/V ‘‘Akvanavt’’ 2002, May 24–30 Polygon survey in NE part of the BS
R/V ‘‘Akvanavt’’ 2002, July 06–11 cross-section in the Eastern Gyre
R/V ‘‘Akvanavt’’ 2002, August 23–24 Few station �30 miles from Gelenzhik
R/V ‘‘Ashamba’’ 2003, July 02 A station near (�3 miles) Gelendzhik
R/V ‘‘Ashamba’’ 2003, August 29 A station near (�3 miles) Gelendzhik
R/V ‘‘Ashamba’’ 2003, September 10 A station near (�3 miles) Gelendzhik
R/V ‘‘Akvanavt’’ 2004, January 26 A station near (�20 miles) Novorossiysk
R/V ‘‘Akvanavt’’ 2004, May 11–14 cross-section ‘‘Gelendzhik—Eastern Gyre’’
R/V ‘‘Akvanavt’’ 2004, June 02–06 Polygon survey in NE part of the BS
R/V ‘‘Akvanavt’’ 2004, June 21–25 cross-section ‘‘Gelendzhik—Eastern Gyre’’
R/V ‘‘Akvanavt’’ 2004, July 14 cross-section ‘‘Tuapse—Eastern Gyre’’
R/V ‘‘Akvanavt’’ 2004, July 16–17 A station near (�5 miles) Gelendzhik
R/V ‘‘Akvanavt’’ 2004, September 09–12 Studies in the NE part of the BS
R/V ‘‘Akvanavt’’ 2004, December 08–09 cross-section ‘‘Gelendzhik—Eastern Gyre’’
E.V. Yakushev et al. / Deep-Sea Research II 53 (2006) 1769–1786 1773
Autho
r's
pers
onal
co
py
determined photometrically with paraphenilendia-min, while higher concentrations were determinedby iodometric titration (Volkov and Zhabina, 1990;Bordovskiy and Chernyakova, 1992).
Samples for methane were taken from Niskinbottles into 120-ml glass bottles using siliconetubing. A head space of about 12ml was leftunfilled in each bottle. The bottles were made gastight using a screw lid having a rubber membrane.Samples were shaken and left to establish tempera-ture and gas phase equilibrium. The gas phase wastaken for analysis by a syringe through the rubbermembrane and a hole in the lid. The methanecontent in the gas phase was determined by gaschromatography (LHM-80) with flame-ionizationdetection. Methane concentrations in the watersamples were calculated following Bol’shakov andEgorov (1987), assuming that the initial methanecontent in the gas phase was equal to that in theatmosphere and had a value of 1.8 ppm. Theprecision of this method calculated from results ofparallel measurements was 72% and the detectionlimit was 0.2 nM.
Iron(II) was analyzed using the iron(II)–ferrozinecomplex (Stookey, 1970). Total iron was determinedafter reducing iron(III) to iron(II) using ascorbicacid. Iron(III) concentration was calculated by thedifference between total iron and iron(II). For totaliron determinations an aliquot (20ml) of filteredwater, 0.5ml of ascorbic acid, 0.5ml of an acetatebuffer solution and 0.5ml of the ferrozine solutionwere placed in 20-ml tubes. The solutions wereheated in a water bath (80 1C) for 30min. Aftercooling the solutions to room temperature, theirabsorbance was measured at 562 nm using a 5mmcell. For iron(II) determinations, the proceduredescribed above was used but without the ascorbicacid solution.
Formaldoxime-based technique was used formanganese determination (Peshkova and Ovsyan-nikova, 1937; Brewer and Spencer, 1971).
2.3. Data
The data obtained during all the expeditions(Table 1) were calculated and used for statisticalcalculations. A problem-oriented database for theredox layer of the Black Sea was developed to aid inthese calculations (Podymov, 2005). A summary ofcruises (http://sbsio.coast.ru/chemist/exped_e.html)represents the set of equitype arrays with the resultsof hydrophysical and hydrochemical measurements,
and the position and date at each station. The datacan be available on request ([email protected]). The data arrays are written in a standardformat of an electronic worksheet. The majority ofthe more than 1400 stations included in thedatabase contain field observations from the north-eastern part of the Black Sea from 1984 till today. Aprogram was written to set specific criteria of dataselection and loading, and to add new functions forsolving specific tasks (Podymov, 2005). This data-base was used to perform the calculations describedbelow.
3. Results
The examples of typical distributions that weobserve in the NE BS in summer and winter arepresented in Figs. 2 and 3, respectively.
The summer distributions (Fig. 2) were charac-terized by a 10–20m surface-mixed layer with high(25–26 1C) temperature. This layer was character-ized by minimum concentrations of nutrients (0.01–0.05 mM PO4, 0.27–0.70 mM NO3, 2.5–3.9 mM Si),maximal pH values and significant concentrationsof oxygen 250 mM. Oxygen increased to 290–300 mMin the upper part of the CIL. Below the CIL, sharpincreases in concentrations of phosphate and nitrateand a decrease in oxygen were observed.
In winter (Fig. 3), the surface 0–40m layer wascharacterized by low temperatures (9–10.2 11C) andby a slight decrease in temperature with depth. Thevertical distribution of temperature and salinityrevealed several 5-m-lenses of uniform density waterat 135 and 165m which were below the depth of theCIL (�80m). High and uniform concentrations ofdissolved oxygen (304–308 mM), high pH values andlow concentrations of nutrients (0.10–0.18 mM PO4,0.25–0.5 mM NO3, 3.5–3.8 mM Si) were observed inthe surface layer (0–40m). As opposed to the warmperiods of the year (Fig. 2), maxima of organicphosphorus, organic nitrogen and urea were notobserved at the lower boundary of this layer, in thevicinity of the core of CIL (sy ¼ 14.5 kg/m3), wherephosphate, nitrate and silicate begin to increase.
Maximum concentrations of nitrate (�110msy ¼ 15.25 kg/m3) in winter reached 2–2.5 mM(Fig. 3), which was significantly less than valueswe observed during summer (about 4.5–5 mM). Theupper phosphate maximum observed in summer(Fig. 2) at sy ¼ 15.65 kg/m3 was absent, and insteadphosphate increased monotonously with depth. Thesummer vertical structure of phosphate with a
ARTICLE IN PRESSE.V. Yakushev et al. / Deep-Sea Research II 53 (2006) 1769–17861774

Autho
r's
pers
onal
co
pyshallow phosphate minimum was absent. Instead,there was an increase in the vertical gradient ofphosphorus at about sy ¼ 15.90 kg/m3. Nitratedisappeared at the same density (sy ¼ 16.00 kg/m3),as has been observed previously in NE BS. A deepermaximum of nitrite was observed both in winter andsummer with value of 0.05 mM, but the backgroundconcentrations were higher in winter than insummer (Figs. 2 and 3).
Hydrogen sulfide first appeared at sy ¼ 16.10kg/m3
in both winter and summer, but in winter itsboundary was more gradual than in summer. Theonset of ammonium and manganese(II) wereobserved at the same density (sy ¼ 15.90 kg/m3) inwinter and summer. Methane started to increase atsy ¼ 15.85–15.90 kg/m3.
The distribution of alkalinity was characterized insummer by uniform values from the upper mixedlayer (0–40m) down to sy ¼ 15.90 kg/m3 (3170–3190 mM). Below this density increasing values were
observed (Fig. 2). In winter (Fig. 3), the distributionof alkalinity was characterized by more variability.A small increase in alkalinity was observed from theCIL (3200–3230 mM) to the sulfide boundary(3250–3270 mM). Similar changes between summerand winter in absolute values and pattern ofdistribution were seen in salinity (Figs. 2 and 3).
The vertical distribution of the organic phos-phorus was characterized by abrupt increase inconcentration at sy ¼ 15.75 kg/m3 from 0.2–0.4 to0.3–0.5 mM in summer and from 0.1–0.2 to0.3–0.4 mM in winter (Figs. 2 and 3). In winter weobserved a decrease in total organic nitrogen from10–14 mM at sy ¼ 15.75 kg/m3 to 8–10 mM atsy ¼ 15.90 kg/m3 (Fig. 2).
The absence of a urea maximum in the vicinity ofthe H2S onset was another distinctive characteristicof the winter period. The background concentra-tions of urea were lower in winter than in summer(1 mM compared with 2–4 mM).
ARTICLE IN PRESS
200
180
160
140
120
100
80
60
40
20
0
Dep
th, m
16.50
16.25
16.00
15.75
15.50
15.25
15.00
14.75
14.50
14.25
14.00
13.75
σ θ, k
g m
-3
0 100 200 300O2, µM
0 4 6 8Mn (II), µM
0 8 12 16 20
H2S, µM
0 2 3 4 5NO3, µM
0 0.05 0.1 0.15 0.2 0.25NO2, µM
0 4 8 12 16
NH4, µM
0 2 4 6 8PO4, µM
0 20 40 60 80 100Si, µM
0 5 10 15 20 25Norg, µM
0 2 4 6
Urea, µM
7.7 7.9 8.1 8.3 8.5pH
7 9 11 13 15 17T,°C
17 18 19 20 21 22S, ppt
3.1 3.2 3.3 3.4 3.5Alk
0 0.2 0.4 0.6 0.8 1Porg, µM
0 0.2 0.4 0.6 0.8CH4, µM
3 3.043.083.123.16 3.2Xmiss
PO4
NO2
NH4
T
S
H2S
O2
NO3
Urea
Porg
pH
Alk
T O2
H2S
NO3NO2
NH4
PO4
Si
pH
Alk
PorgUrea
S
Mn(II)
Mn (II)
Si
CH4
CH4
Xmiss
Xmiss
2
4
1
Fig. 2. Vertical distribution of temperature (T), salinity (S), density (sy), transmission (Xmiss), dissolved oxygen (O2), hydrogen sulfide
(H2S), total manganese (Mn), silicate (Si), nitrate (NO3), nitrite (NO2), ammonia (NH4), urea (Urea), phosphate (PO4), organic
phosphorus (Porg), pH, total alkalinity (Alk) and methane (CH4) at a station near Gelendzhik (St. 1331, July 2002). Concentrations of
chemical parameters are in mM. Distributions are plotted versus depth in the top and versus density at the bottom.
E.V. Yakushev et al. / Deep-Sea Research II 53 (2006) 1769–1786 1775

Autho
r's
pers
onal
co
py4. Discussion
In general, the chemical structure of the redoxlayer in the NE BS corresponds to that observed inthe central part of the Black Sea. The thickness ofthe suboxic zone also varies in the depth units, butremains constant versus density. These densityvalues (Table 2) correspond well to those observedin the central and western regions. The positions ofonset levels, maximum values of chemical para-meters agree well with those observed previously inthe central regions (Murray et al., 1995) (Table 2).In the NE BS, the depth of hydrogen sulfide onsetvaries in the coastal region from 100 to 180m andfrom 70 to 100m in the Eastern Gyre. The firstappearance of hydrogen sulfide is usually observedto deepen in winter and in the anticyclonic eddies.Having this good record for the past years (Table 1)
makes this site ideal for studying the temporalevolution of the Black Sea.
On the basis of the NE BS expedition data from1999 to 2002, we have estimated the statisticalquartile analysis of these characteristics (Fig. 4).The distributions of hydrochemical features in theshallower layers of the water column are character-ized by greater variability. That reflects the influenceof seasonal variability and eddies that play a greaterrole in the upper layers of the suboxic zone(Chasovnikov, 2002).
In comparison to the western and southern-western Black Sea, which can be described bypronounced water intrusions, the NE BS redoxlayer is characterized by a spatially and temporallystable hydrophysical and chemical vertical struc-ture. We do not observe the same degree ofvariability at the same density levels, and this
ARTICLE IN PRESS
200
180
160
140
120
100
80
60
40
20
0
Dep
th, m
16.50
16.25
16.00
15.75
15.50
15.25
15.00
14.75
14.50
14.25
14.00
13.75
σ θ, k
g m
-3
0 100 200 300O2, µM
0 2 4 6 8 10Mn(II), µM
0 4 8 12 16 20H2S, µM
0 1 2 3 4 5
NO3, µM
0 0.05 0.1 0.15 0.2 0.25
NO2, µM
0 4 8 12 16NH4, µM
0 4 6 82PO4, µM
0 20 40 60 80 100Si, µM
0 4 8 12 16 20Norg, µM
0 2 4 6
Urea, µM
7.7 8.1 8.3 8.5pH
7 9 11 13 15 17T, °C
17 18 19 20 21 22S, ppt
3.1 3.2 3.3 3.4 3.5Alk
0 0.2 0.4 0.6 0.8 1
Porg, µM
0 0.4 0.8 1.2 1.6 2CH4, µM
PO4
NO2
NH4
T
S
H2S
O2
NO3
Urea
Porg
Norg
pH
Alk
TO 2
H2S
NO3
NO2
NH4
PO4
Si
pH
Alk NorgPorg
Urea
S
Mn(II)
Mn(II)
Si
CH4
CH4
7.9
Fig. 3. Vertical distribution of temperature (T), salinity (S), density (sT), oxygen (O2), hydrogen sulfide (H2S), total manganese (Mn),
silicate (Si), nitrate (NO3), nitrite (NO2), ammonia (NH4), urea (Urea), phosphate (PO4), organic phosphorus (Porg), pH, total alkalinity
(Alk) and methane (CH4) at a station near Gelendzhik (St. 1487, January 2004). Concentrations of chemical parameters are in mM.
Concentrations of chemical parameters are in mM. Distributions are plotted versus depth in the top versus density at the bottom.
E.V. Yakushev et al. / Deep-Sea Research II 53 (2006) 1769–17861776

Autho
r's
pers
onal
co
py
reflects the absence of significant lateral transport ofmatter.
The vertical redox hydrochemical structure of thisregion is determined first of all by vertical exchange.It is possible to assume the following hypothesis forthe functioning of the different layers (Yakushevet al., 2002).
Density layer sy ¼ 15.50– 15.70 kg/m3: In theupper part of the redox zone, concentrations of
dissolved oxygen decrease to 15–20 mM, and itsvertical gradient abruptly decreases and becomesequal to that of nitrate (Fig. 5). In this layer, nitrate,instead of oxygen, becomes the main oxidizer.Nitrate is rapidly consumed and its concentrationsdecrease rapidly. The reason for the decrease in thevertical gradient of oxygen is because there is adecrease in the rate of reactions that consumeoxygen.
ARTICLE IN PRESS
Table 2
Characteristics of hydrochemical structure in the density field (kgm3) in the Northeastern Black Sea in comparison to the Central and
Western Black Sea
Characteristics of hydrochemical
structure
Central and Western Black Sea (Murray
et al., 1995)
Northeastern Black Sea (Chasovnikov,
2002)
Maximum of NO3 15.40 15.27�15.45
NO3o0.2 mM 15.95 15.85�15.95
Maximum of NO2 15.85 15.85�15.95
Onset of NH4 (NH4o0.2mM) 15.95 15.92�15.98
Upper maximum of PO4 15.50 15.41�15.63
Minimum of PO4 15.85 15.90�15.96
Lower maximum of PO4 16.20 16.19�16.21
Onset of Mn2+ 15.85 15.80�15.90
Onset of H2S (41 mM) 16.1570.05 16.08�16.14
16.3
16.2
16.1
16.0
15.9
15.8
15.7
15.6
15.5
15.4
15.3
15.2
15.1
15.0
σ θ, k
g m
-3
Max
Min
75%
25%
MedianMean
O2<10 mM O4max1 PO4min PO4max2 NO3max NH4 MnH2SP
Fig. 4. Characteristic density values of hydrochemical parameters: decrease of O2o10mM, onsets of H2S, NH4 and Mn, maximum of
NO3 (NO3max), minimum of PO4 (PO4min), shallow (PO4max1) and deep (PO4max2) PO4 maxima. Results of the quartile analysis
(‘‘Box–Whisker’’ plots: xmin, x0.25, x0.50, x0.75, xmax) for the 1999–2000 NE Black Sea data.
E.V. Yakushev et al. / Deep-Sea Research II 53 (2006) 1769–1786 1777

Autho
r's
pers
onal
co
py
Density layer sy ¼ 15.85– 15.95 kg/m3: In themiddle of the redox zone, oxidizers diffusing fromthe upper layer (oxygen and nitrate) decrease tozero. This occurs simultaneously with the disap-pearance of reductants (ammonia, manganese (II),methane) diffusing up from the anoxic zone. Aminimum of phosphate is also found here. Thislayer may be very thin, probably only 3–5m, and itsposition may vary over the density range specified.
The co-occurrence of the phosphate minimumand the depletion depths of ammonium, manganeseand methane with the upper boundary of the FPL atthe same density level suggests to the possibleexistence of some unifying controlling mechanism.
This common mechanism may be that the redoxreactions completed with oxygen. The presence ofeven 1.5 mM of oxygen (50% smaller than detectionlimit of the voltammetric and Winkler techniques;Glazer et al., 2006) can explain the oxidation ofdissolve manganese, ammonia and methane at thisdepth. Nitrate (which can be measured withaccuracy down to 0.05 mM) is evidently also activelyconsumed in this layer to erratically zero. Denitri-fication and anammox reactions result in a decreaseof total fixed nitrogen and a corresponding increaseof N2 (Murray et al., 2003a). The formation of thephosphate minimum may result from its removal byscavenging Fe, Mn hydroxides (Shaffer, 1986).
Based on estimates of bacterial production withinlayer (Sorokin, 2002), dark chemosynthesis can
consume nutrients like photosynthesis does in theeuphotic zone. Intensive growth of bacteria could beanother significant reason for the decrease ofphosphate in the PO4 minimum, and consumptionof the upward flux of ammonium. This idea issupported by the increased concentrations of ureaand organic phosphorus in this layer. Burlakovaet al. (1999) also showed an increase of PON in thislayer. Coban-Yildiz et al. (2000) also observed anincrease of PON in this layer and suggested that asignificant fraction of this particulate OM was ofbacterial origin with additional contribution frompartially decayed sinking particles. The relativeimportance of sorption on metal oxides andchemosynthesis is not clear and needs more study.
The main result of the geochemical reactions inthis layer is the formation of new oxidizersrespectively, particulate oxidized manganese (III,IV) and iron (III). In addition to diffusive transport,their sinking rate can accelerate the downwardtransport of these electron acceptors.
Density layer sy ¼ 16.10– 16.15 kg/m3: This layerconstitutes the lower part of the redox zone. Theonset of hydrogen sulfide occurs just below thedepths of maximum particulate manganese andiron. The reduction of particulate manganese(IV) bysulfide is very intensive (Lewis and Landing, 1991;Rozanov, 1995) and model estimates (Yakushevand Debolskaya, 2000) suggest this reaction canbalance the hydrogen sulfide flux from below.
ARTICLE IN PRESS
0.1 1 10
grad+, µM m-1
16.5
16
15.5
15
15.5
14
14.5
10 1 0.1
grad-, µM m-1
O2
NH4
Mn
H2S
- +
σθ
NO3
Fig. 5. Mean values of vertical gradients of Mn, NH4, H2S, O2, NO3 (mM/m) in the density field (sy, kg/m3).
E.V. Yakushev et al. / Deep-Sea Research II 53 (2006) 1769–17861778
Autho
r's
pers
onal
co
py
A deeper phosphate maximum occurs about 5–10mbelow the appearance of hydrogen sulfide. Thevertical gradient of hydrogen sulfide increases at thisdepth (Fig. 5). The shape of the sulfide profile istypical for the central regions of the Black Seadistant from the Bosporus Plume and not affectedby intensive vertical mixing.
4.1. Vertical gradients
The studies of the processes responsible for thevertical chemical structure of the redox zone arebased on estimating of the vertical fluxes of reactingcompounds. These fluxes are dependend on thevertical gradients and their changes with depth.
The vertical gradients of several parameters (Mn,NH4, H2S, O2, NO3) at different density levels werecalculated using data from 11 stations that weresampled in the NE BS with 2–3m resolution. Thefollowing procedure was used: a spline function wasfit to the data of each station. The depth gradientswere then calculated using this spline function. Thecalculated gradients were compared with the corre-sponding density data. The density field was dividedinto 0.01 kg/m3 steps. The minimum, maximum,mean and median of the various gradients werecalculated for corresponding density values. Themean values of the gradients of Mn, NH4, H2S, O2,NO3 are presented versus density in Fig. 5.
These calculations show that the vertical gradientof dissolved oxygen has a maximum of 7–10 mM/min the oxycline (syE15.0 kg/m3). In the layer ofsy ¼ 15.8–16.0 kg/m3, the oxygen gradients decreaseto 0.1–0.4 mM/m. The vertical gradient of nitrate isequal to or greater than the vertical gradient ofoxygen below sy ¼ 15.6–15.7 kg/m3 (Fig. 5). Shal-lower than 15.6–15.7 kg/m3, the nitrate gradientdecreases sharply (from values about 1 mM/m) andabove the nitrate maximum (15.3–15.5 kg/m3)changes sign. Vertical gradients of hydrogen sulfideare characterized by maximum values (up to0.5–0.9 mM/m) in the layer sy ¼ 16.2–16.6 kg/m3,but near the depth of hydrogen sulfide onset, thevertical gradient of this parameter decreases to0.15–0.20 mM/m or less. The change in the verticalgradient of hydrogen sulfide from 0.6–0.7 to0.15–0.20 mM/m coincided with the lower boundaryof the FPL, which corresponded to the depth ofphosphate maximum (Figs. 2 and 3). Verticalgradients of manganese have maximum values(0.10–0.15 mM/m) at about the onset of H2S(sy ¼ 16.0–16.2 kg/m3). The Mn gradient decreased
in deeper layers. The vertical gradient of ammoniawas also characterized by maximum values of0.11–0.15 mM/m in the layer sy ¼ 16.0–16.2 kg/m3.
The main result of these calculations is that atspecific density levels in the redox layer the verticalgradients of chemical parameters are characterizedby constant values. At the same time, the verticalgradients of every parameter change following thechanges of density (Fig. 5). These layers where thevertical gradients change versus density (depth)should correspond to the existence of layers ofspecific sources or sinks.
4.2. Model estimates of the rates of changes of
concentrations
The vertical distributions of concentrations andgradients of a certain parameter can be used for theestimating ‘‘sources’’ or ‘‘sinks’’ Ri of this parameterthat compensate the changes connected with verticaldiffusion. As mentioned above, in the NE BS we donot observe significant horizontal changes of con-centrations and that allowed us to use the following1D formula:
Ri ¼qqz
kqci
qz
� �¼
qk
qz
qci
qzþ k
q2ci
qz2, (1)
where k is the vertical turbulent exchange coefficientand ci is a concentration of a component understudy.
We applied this formula for the nitrogen com-pounds because we measured four forms of them(NO2, NO3, NH4, Urea). Nitrogen is a goodexample to use to compare the values and depthsof the source terms (Ri).
The results of such estimates depend uponvertical variability in the turbulent exchange coeffi-cient k. Estimates of k(z) were obtained using a 3Dnumerical model (Debolskaya, 2002) that includedequations of: (1) motion for the conditions ofbaroclinity, (2) continuity, (3) transfer for kineticturbulence energy with consideration of the buoy-ancy force and (4) vertical transfer of multiplicationof kinetic energy by scale of turbulence. The basis ofthe model are measured temperature and salinitydata.
We determined the density distribution duringR/V ‘‘Akvanavt’’ St. 783 (September 2001) and1331 (June 2002) using CTD measurements madewith a vertical resolution of 20 cm. This allowed usto obtain a detailed profile of the vertical diffusioncoefficient k. The values of k obtained were about
ARTICLE IN PRESSE.V. Yakushev et al. / Deep-Sea Research II 53 (2006) 1769–1786 1779

Autho
r's
pers
onal
co
py
2� 10�5m2/s at the depth of the hydrogen sulfideboundary. Similar values for this coefficient at thehydrogen sulfide boundary depth were obtained byStokozov (2004), who analyzed spreading of 137Csafter the Chernobyl accident. He determined valuesfor k of 1–3� 10�5 in the Black Sea Central Basinand 3–11� 10�5m2/s in the region of the RIMcurrent.
For the source/sink calculations we used data forNO2, NO3, NH4, urea, which were sampled at thesame stations with vertical resolution of 2–5m(Yakushev et al., 2003). The results of these‘‘source’’ calculations are presented in Fig. 6. Themagnitude of Ri should be balanced by chemical–biological transformations. From these results wecan see that in the vicinity of onset of ammoniumthe magnitude of Ri is large from 120 to 150m withmaximum at 140m at St. 783 and from 130 to 160mwith maximum at 150m at St. 1331. Biochemicalprocess should result in consumption of ammoniumat a rate up to 0.3 mM/d. At slightly deeper depths,nitrate is consumed at a rate of 0.3–0.4 mM/d from130 to 150m with a maximum at 145m at St. 783and from 130 to 160m with a maximum at 150m atSt. 1331. In the central part of the nitrate maximum(100–120m at St. 783 and 100–130m at St.1331),the biogeochemical processes of nitrate productiondominate with a rate of 0.4–0.7 mM/d. Consumptionof nitrate (0.4–0.5 mM/d at St. 783 and 0.1–0.2 mM/dat St. 1331) is intensive again in the upper part of
oxycline (�80m), possibly due to biological uptakeby primary production. A small maximum inproduction of nitrate (0.01–0.02 mM/d) was foundat both stations directly at the depth of themaximum ammonia consumption.
With this model we can estimate (in N units) themaximum values of sources and sinks at the oxic/anoxic interface. Practically, these sources (Ri)reflect differences in the intensities of processes ofproduction and consumption. Therefore, above thehydrogen sulfide boundary there is sink of nitrate(�0.2–0.4 mM/d) and ammonium (�0.3 mM/d). Inthis layer in the deeper part of the suboxic zone,nitrate becomes the dominant oxidizer as seen in thecomparison of the vertical gradients of oxygen andnitrate (Fig. 5). Nitrate can be consumed bydenitrification and reduction by thiosulfate, ele-mental sulfur and sulfide (Nealson and Stahl, 1997).Nitrite that is producing can be used for theanammox reaction (Murray et al., 2003a), which ismediated by bacteria found in the Black Sea(Kuypers et al., 2003). The role of nitrate as apotential oxidizer of reduced manganese and ironhas been discussed (Murray et al., 1995; Lutheret al., 1997), but the presence of these reactions hasyet to be confirmed.
Another possible sink of inorganic nitrogencompounds is consumption by OM synthesis. Asseen from the urea transformation rates, theintensity of OM formation and decay can be on
ARTICLE IN PRESS
NO2 NO3 NO4 Urea
H, m
0
-40
-80
-120
-160
-0.4 0 0.4 -0.4 0.4 -0.4 0 0.4
St. 783 Ri, µM d-1
-0.4 0 0.4
NO2 NO3 NO4 Urea
H, m
0
-40
-80
-120
-160-0.4 0 0.4 -0.4 0.4 -0.4 0 0.4
St. 1331 Ri, µM d-1
-0.4 0 0.4
Fig. 6. Vertical distribution of ‘‘sources’’ Ri connected with processes of vertical turbulent exchange for NO2, NO3, NH4 and urea at
stations 783 and 1331. The dashed line is the hydrogen sulfide boundary position.
E.V. Yakushev et al. / Deep-Sea Research II 53 (2006) 1769–17861780

Autho
r's
pers
onal
co
py
the same order of magnitude as the processes thatconsume and produce ammonium and nitrate(0.2–0.4 mM/d), but the maxima in urea produc-tion/consumption are offset from those for nitrateand ammonia.
Maximum values of dark CO2 fixation rates in thevicinity of sulfide boundary in the central WesternGyre have been measured as 5 mgC/L/d (Yilmazet al., 2006), 2.3–7.7 mgC/L d (Morgan et al., 2006)and 10 mgC/L d in the central and coastal NE BS(Pimenov and Neretin, 2006). Assuming an uptakeratio of C/N ¼ 6.6, these values correspond to0.06–0.12 mMN/d. Therefore, the sinks calculatedfrom the model cannot be explained only byconsumption by chemosynthesis.
With this simple model, it is also possible todemonstrate that the sources and sinks of matterresulting from the vertical turbulent exchangeshould also correspond to specific density levels asobserved.
4.3. Seasonal variability
Studies of the seasonal variability of parametersare difficult since datasets of winter hydrochemicalmeasurements are very rare compared with those ofthe summer. Winter features of the suboxic layerstructure were studied with fine resolution duringR/V ‘‘Akvanavt’’ cruises in December 2001, 2002,2004 (Table 1) and the R/V ‘‘Knorr’’ cruise inMarch 2003. Results of winter observations ob-tained in the NE BS coastal waters on January 26,2004 (St. #1487 R/V ‘‘Akvanavt’’ cruise #57) areshown in Fig. 3. The location of station #1487 relativeto the geostrophic current field is shown in Fig. 1. Thegeostrophic currents were calculated using hydrophy-sical data collected during the first stage of this cruise(January 24–26, 2004). St.1487 was situated near ananticyclonic eddy (Fig. 1) in a region with increasedhorizontal velocities in the redox layer. The intensityof mixing in the redox layer at this station was greaterthan in the surrounding waters.
The main differences between summer and winterdistribution (Figs. 2 and 3), can be summarized asfollowing:
� The vertical distribution of phosphate in thewinter was characterized by absence of theshallower minimum.� The concentrations of nitrate at the nitrate
maximum were lower in winter (2.5 mM) than inother times of the year (44.5 mM).
� The maxima of organic phosphorus and ureacontent at the onset of hydrogen sulfide, whichare typically observed in summer, were absent inthe winter. The concentrations of organic nitro-gen were lower in winter than in summer (organicnitrogen is not shown in Fig. 2, but we haveobserved larger organic nitrogen values in someother summer stations).� Alkalinity was uniformly distributed to
sy ¼ 15.90 kg/m3 in summer (similar to thatobserved by Hiscock and Millero, 2006) andincreased gradually below the depth of the CIL inwinter.� Changes of the vertical gradients of hydrogen
sulfide, ammonium, manganese and methane attheir onset depths were smoother in the winterthan in summer.
We found that one of the tracers of the seasonalvariability estimates was the shape of the verticalphosphate distribution. The phosphate maximum/minimum dipole observed in the summer was notobserved in our winter data (December, January)from eddies near the NE BS coast.
For better understanding of the seasonal varia-bility of phosphate, we performed statistical analy-sis of seasonal variability of the shallowerphosphate minimum in the northeastern part ofthe Black Sea (Yakushev et al., 2005). Coastal zone(up to about 70 km from the shore) stations andopen sea zone (70–180 km) stations were examinedseparately. The density layer of 15.80–15.90 kg/m3
was used for analysis, since the minimum of thephosphate that appears just above the suboxic zonefalls into this interval.
According to this statistical analysis (Fig. 7),concentrations of phosphate in the minimum in thenortheastern part of the Black Sea are higher at thecoast than in the open sea during both winter andsummer periods. Our data do not show distinctseasonal variability in the open sea stations, butthere are few winter datasets. At the coastalstations, phosphate concentrations during the win-ter were greater than in summer by 0.2–0.5 mM, andshowed an increasing trend during the winterperiods from 2001 to 2004 (from 0.8–1 to1.2–1.6 mM).
Two factors could affect the seasonal variabilityof the hydrochemical structure of the oxic/anoxicinterface: seasonality of OM production and sea-sonality of the intensity of vertical mixing. Adecrease of OM flux in the winter could result in a
ARTICLE IN PRESSE.V. Yakushev et al. / Deep-Sea Research II 53 (2006) 1769–1786 1781

Autho
r's
pers
onal
co
py
decrease in the concentrations of bacteria and couldslow the rates of heterotrophic biogeochemicaltransformation. This decrease in the number ofbacteria and reduction of the rates of reactions wasdescribed by Sorokin et al. (1992). Enhanced mixingassociated with anticyclonic eddies in the winterleads to smoothing of the vertical gradients andextrema resulting in changes in biogeochemicalreactions such as formation of the phosphate dipole(due both to the consumption for OM and forprecipitation with the metal hydroxides).
4.4. Interannual variability
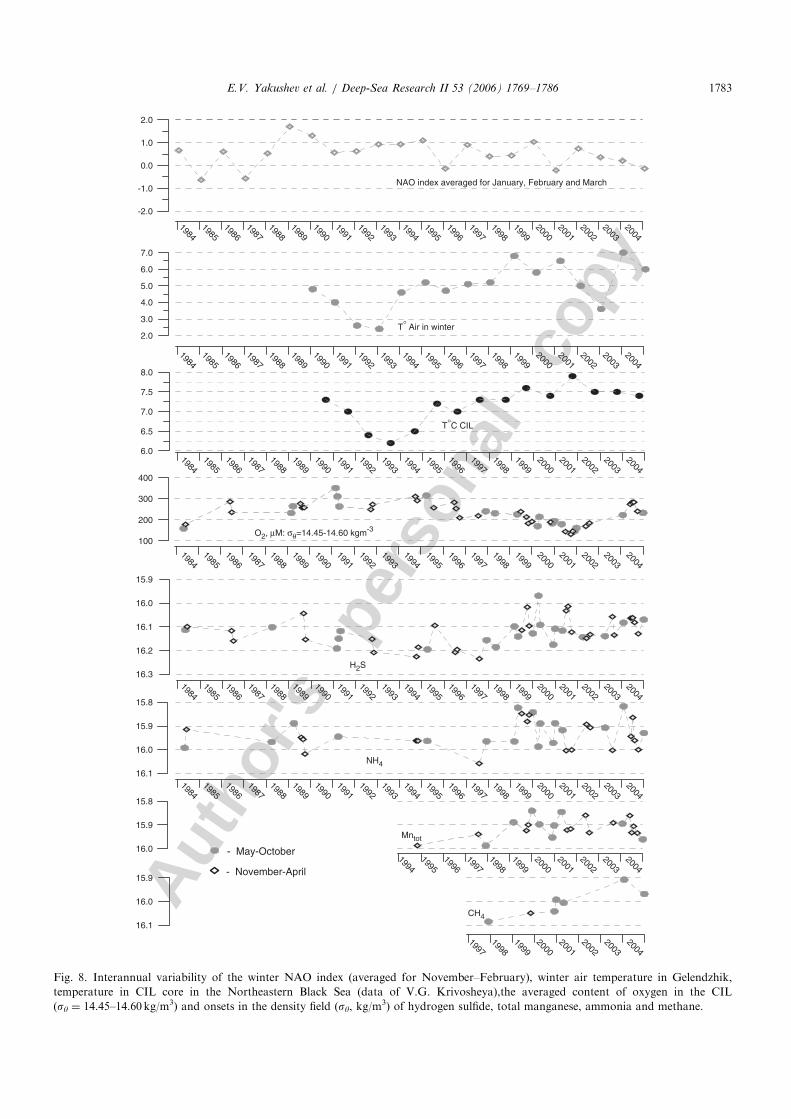
Chemotropy gives us a unique opportunity forcomparison and statistical analysis of data acquiredin different regions and seasons on differentexpeditions. We used unique series of data fromthe NE BS to estimate the changes of the position ofthe boundaries of the anoxic zone.
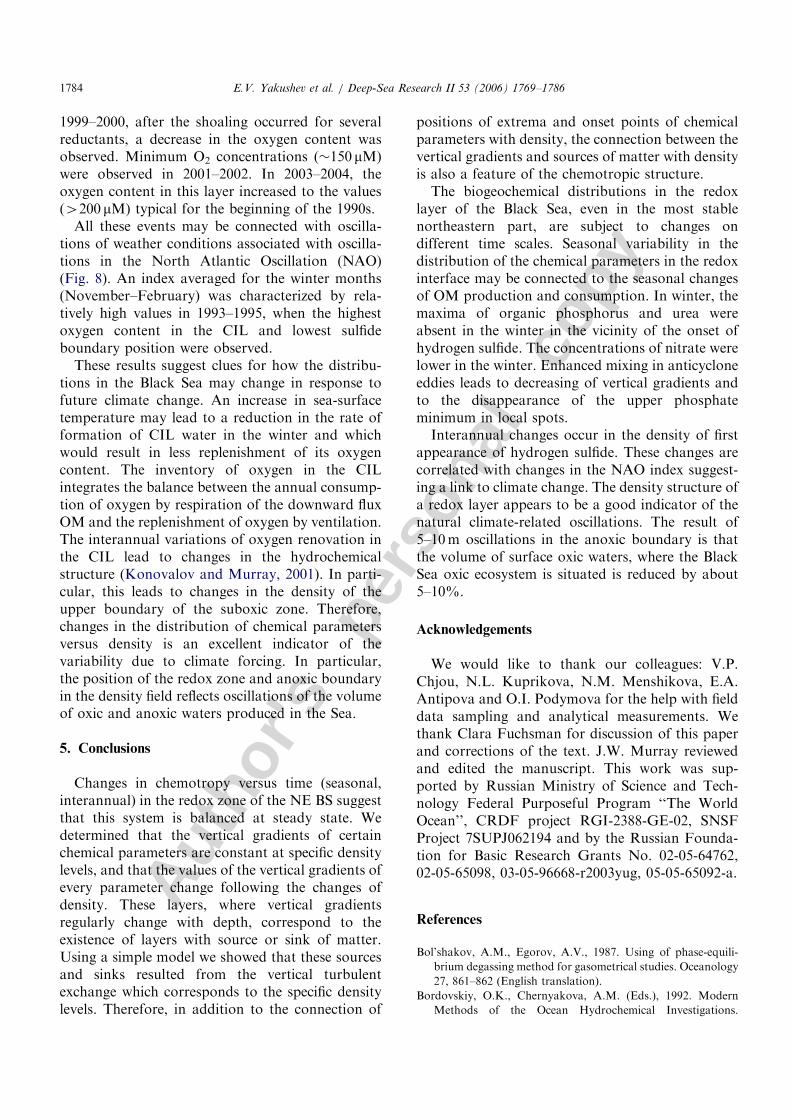
We choose the Akima spline technique for thesecalculations because it gave results which wereeasier to reproduce. Data from every station wereanalyzed individually. Results of these calculationsfor monthly averaged intervals (in some months wehad two or three small cruises, see Table 1) areshown in Fig. 8. The data shown in Fig. 8 are theoxygen concentrations at sy ¼ 14.45–14.60 kg/m3
and the density of first appearance of sulfide,ammonium, manganese and methane.
The values obtained differed slightly (without asystematic bias) from estimates that were reported
by other authors who used visual or linear regres-sion methods for estimating the onset values(Vinogradov and Nalbandov, 1990; Murray et al.,1995; Volkov et al., 1997; Chasovnikov, 2002).Values for methane were deeper than reported byEgorov (2002), because the vertical gradient ofmethane decreases gradually in the vicinity of theonset point.
These results show that the depth of onset ofhydrogen sulfide occurred at values of sy ¼16.15–16.25 kg/m3 in 1991–1998 (Fig. 8). In 1999–2000, this boundary shoaled to about sy ¼ 16.05–16.15 kg/m3 (corresponding to a depth change ofabout 5–15m). After 2000, the density of hydrogensulfide onset stabilized. A similar upward shift wasobserved for other reductants—ammonia, totalmanganese and methane. These changes between1998/1999 may be related to the two warm wintersthat occurred in 1998–1999. These years weredistinguished by an increase of sea surface tempera-ture (Fig. 8) and an increase of temperature in thecore of the CIL (Krivosheya et al., 2002; Oguz et al.,2006).
A decrease in intensity of CIL formation shouldlead to an increase of its core temperature and adecrease of its oxygen content. To confirm this wecalculated average concentrations of dissolved oxy-gen in the CIL (defined as the layer fromsy ¼ 14.45 kg/m3 to �sy ¼ 14.60 kg/m3). These cal-culations should reflect both changes of concentra-tions in the CIL and vertical shifts of the core of theCIL in the density field (Murray et al., 2003a, b). In
ARTICLE IN PRESS
1999 2000 2001 2002 2003 2004
0
0.4
0.8
1.2
1.6
2
1999 2000 2001 2002 2003 2004
0
0.4
0.8
1.2
1.6
2
winter
SeaCoast
summer
Fig. 7. Results of statistical analysis of mean observation of the phosphate in the density layer of sy ¼ 15.8–15.9 kg/m3. Calculations in the
coastal area (0–70km from the shore) are shown on the left part, and open sea part is shown on the right. Vertical line displays the value of
standard deviation.
E.V. Yakushev et al. / Deep-Sea Research II 53 (2006) 1769–17861782
Autho
r's
pers
onal
co
py
ARTICLE IN PRESS
16.0
15.9
15.8
19941995
19961997
19981999
20002001
20022003
2004
16.1
16.0
15.9
15.8
16.1
16.0
15.9
19971998
19992000
20012002
20032004
16.3
16.2
16.1
16.0
15.9
CH4
Mntot
NH4
H2S
100
200
300
400
O2, µM: σθ=14.45-14.60 kgm-3
6.0
6.5
7.0
7.5
8.0
T°C CIL
2.0
3.0
4.0
5.0
6.0
7.0
T° Air in winter
-2.0
-1.0
0.0
1.0
2.0
19841985
19861987
19881989
19901991
19921993
19941995
19961997
19981999
20002001
20022003
2004
19841985
19861987
19881989
19901991
19921993
19941995
19961997
19981999
20002001
20022003
2004
19841985
19861987
19881989
19901991
19921993
19941995
19961997
19981999
20002001
20022003
2004
19841985
19861987
19881989
19901991
19921993
19941995
19961997
19981999
20002001
20022003
2004
19841985
19861987
19881989
19901991
19921993
19941995
19961997
19981999
20002001
20022003
2004
19841985
19861987
19881989
19901991
19921993
19941995
19961997
19981999
20002001
20022003
2004
NAO index averaged for January, February and March
- May-October
- November-April
Fig. 8. Interannual variability of the winter NAO index (averaged for November–February), winter air temperature in Gelendzhik,
temperature in CIL core in the Northeastern Black Sea (data of V.G. Krivosheya),the averaged content of oxygen in the CIL
(sy ¼ 14.45–14.60kg/m3) and onsets in the density field (sy, kg/m3) of hydrogen sulfide, total manganese, ammonia and methane.
E.V. Yakushev et al. / Deep-Sea Research II 53 (2006) 1769–1786 1783
Autho
r's
pers
onal
co
py
1999–2000, after the shoaling occurred for severalreductants, a decrease in the oxygen content wasobserved. Minimum O2 concentrations (�150 mM)were observed in 2001–2002. In 2003–2004, theoxygen content in this layer increased to the values(4200 mM) typical for the beginning of the 1990s.
All these events may be connected with oscilla-tions of weather conditions associated with oscilla-tions in the North Atlantic Oscillation (NAO)(Fig. 8). An index averaged for the winter months(November–February) was characterized by rela-tively high values in 1993–1995, when the highestoxygen content in the CIL and lowest sulfideboundary position were observed.
These results suggest clues for how the distribu-tions in the Black Sea may change in response tofuture climate change. An increase in sea-surfacetemperature may lead to a reduction in the rate offormation of CIL water in the winter and whichwould result in less replenishment of its oxygencontent. The inventory of oxygen in the CILintegrates the balance between the annual consump-tion of oxygen by respiration of the downward fluxOM and the replenishment of oxygen by ventilation.The interannual variations of oxygen renovation inthe CIL lead to changes in the hydrochemicalstructure (Konovalov and Murray, 2001). In parti-cular, this leads to changes in the density of theupper boundary of the suboxic zone. Therefore,changes in the distribution of chemical parametersversus density is an excellent indicator of thevariability due to climate forcing. In particular,the position of the redox zone and anoxic boundaryin the density field reflects oscillations of the volumeof oxic and anoxic waters produced in the Sea.
5. Conclusions
Changes in chemotropy versus time (seasonal,interannual) in the redox zone of the NE BS suggestthat this system is balanced at steady state. Wedetermined that the vertical gradients of certainchemical parameters are constant at specific densitylevels, and that the values of the vertical gradients ofevery parameter change following the changes ofdensity. These layers, where vertical gradientsregularly change with depth, correspond to theexistence of layers with source or sink of matter.Using a simple model we showed that these sourcesand sinks resulted from the vertical turbulentexchange which corresponds to the specific densitylevels. Therefore, in addition to the connection of
positions of extrema and onset points of chemicalparameters with density, the connection between thevertical gradients and sources of matter with densityis also a feature of the chemotropic structure.
The biogeochemical distributions in the redoxlayer of the Black Sea, even in the most stablenortheastern part, are subject to changes ondifferent time scales. Seasonal variability in thedistribution of the chemical parameters in the redoxinterface may be connected to the seasonal changesof OM production and consumption. In winter, themaxima of organic phosphorus and urea wereabsent in the winter in the vicinity of the onset ofhydrogen sulfide. The concentrations of nitrate werelower in the winter. Enhanced mixing in anticycloneeddies leads to decreasing of vertical gradients andto the disappearance of the upper phosphateminimum in local spots.
Interannual changes occur in the density of firstappearance of hydrogen sulfide. These changes arecorrelated with changes in the NAO index suggest-ing a link to climate change. The density structure ofa redox layer appears to be a good indicator of thenatural climate-related oscillations. The result of5–10m oscillations in the anoxic boundary is thatthe volume of surface oxic waters, where the BlackSea oxic ecosystem is situated is reduced by about5–10%.
Acknowledgements
We would like to thank our colleagues: V.P.Chjou, N.L. Kuprikova, N.M. Menshikova, E.A.Antipova and O.I. Podymova for the help with fielddata sampling and analytical measurements. Wethank Clara Fuchsman for discussion of this paperand corrections of the text. J.W. Murray reviewedand edited the manuscript. This work was sup-ported by Russian Ministry of Science and Tech-nology Federal Purposeful Program ‘‘The WorldOcean’’, CRDF project RGI-2388-GE-02, SNSFProject 7SUPJ062194 and by the Russian Founda-tion for Basic Research Grants No. 02-05-64762,02-05-65098, 03-05-96668-r2003yug, 05-05-65092-a.
References
Bol’shakov, A.M., Egorov, A.V., 1987. Using of phase-equili-
brium degassing method for gasometrical studies. Oceanology
27, 861–862 (English translation).
Bordovskiy, O.K., Chernyakova, A.M. (Eds.), 1992. Modern
Methods of the Ocean Hydrochemical Investigations.
ARTICLE IN PRESSE.V. Yakushev et al. / Deep-Sea Research II 53 (2006) 1769–17861784
Autho
r's
pers
onal
co
py
P.P. Shirshov Institute of Oceanology, Moscow, p. 200
(In Russian).
Brewer, P.G., Spencer, D.W., 1971. Colorimetric determination
of manganese in anoxic waters. Limnology and Oceanogra-
phy 16 (1), 107–110.
Burlakova, Z.P., Eremeeva, L.I., Konovalov, S.K., 1999.
Seasonal and spatial variability of the content of suspended
organic substances in the active layer of the Black Sea.
Physical Oceanography 10, 419–454.
Chasovnikov, V.K., 2002. Peculiarities of the hydrochemical
structure of the northeastern part of the Black Sea. Ph.D.
Thesis, Shirshov Institute of Oceanology, Moscow, pp. 125.
Coban-Yildiz, Y., Chiavari, G., Fabbri, D., Gaines, A.F.,
Galetti, G., Turgul, S., 2000. The chemical composition of
Black Sea suspended particulate organic matter; pyrolis GC/
MS as a complementary tool to traditional oceanographic
analysis. Marine Chemistry 69, 55–67.
Cociasu, A., Dorogan, L., Humborg, C., Popa, L., 1996. Long-
term ecological changes in the Romanian coastal waters of the
Black Sea. Marine Pollution Bulletin 32, 32–38.
Codispoti, L.A., Friederich, G.E., Murray, J.W., Sakamoto,
C.M., 1991. Chemical variability in the Black Sea: implication
of continuous vertical profiles that penetrated oxic/anoxic
interface. Deep-Sea Research 38 (2), S691–S710.
Debolskaya, E.I., 2002. Analysis of the Black Sea redox zone
turbulent structure in the Black Sea based on the R/V
‘‘Akvanavt’’ 18th cruise data. Modern notion of the vertical
hydrochemical structure of the Black Sea redox zone. In:
Zatsepin, A.G., Flint, M.V. (Eds.), Complex Investigation of
the Northeastern Black Sea, Nauka, Moscow, pp. 140–150 (In
Russian).
Egorov, A.V., 2002. On distribution of methane in the Black Sea
water column. In: Zatsepin, A.G., Flint, M.V. (Eds.),
Complex Investigation of the Northeastern Black Sea.
Nauka, Moscow, pp. 144–147 (In Russian).
Glazer, B.T., Luther III, G.W., Konovalov, S.K., Friederich,
G.E., Trouwborst, R.E., Romanov, A.S., 2006. Spatial and
temporal variability of the Black Sea suboxic zone. Deep-Sea
Research II, this issue [doi:10.1016/j.dsr2.2006.03.022].
Hansen, H.P., 1999. Determination of oxygen. In: Grashoff, K.,
Kremling, K., Ehrhard, M. (Eds.), Methods of Seawater
Analysis. 3d, Completely Revised and Extended Edition.
Wiley-VCH, Weinheim, NewYork, Chichester, Brisbane,
Singapore, Toronto, pp. 75–90.
Hansen, H.P., Koroleff, F., 1999. Determination of nutrients. In:
Grashoff, K., Kremling, K., Ehrhard, M. (Eds.), Methods of
Seawater Analysis. 3d, completely revised and extended
edition. Wiley-VCH, Weinheim, NewYork, Chichester, Bris-
bane, Singapore, Toronto, pp. 149–228.
Hiscock, W.T., Millero, F.J., 2006. Alkalinity of the Anoxic
Waters in the western Black Sea. Deep-Sea Research II, this
issue [doi:10.1016/j.dsr2.2006.05.020].
Ivanov, L.I., Konovalov, S., Belokopytov, V., Ozsoy, E., 1999.
Regional peculiarities of physical and chemical responses to
changes in external conditions within the Black Sea pycno-
clyne: cooling phase. In: Besiktepe, S.T., Unluata, U., Bologa,
A.S. (Eds.), Environmental Degradation of the Black Sea:
Challenges and Remedies, vol. 2. Kluwer Academic Publish-
ers, Dordrecht, pp. 53–68.
Konovalov, S.K., 2001. Suboxic zone of the Black Sea: genesis
and role in formation of the spatial and temporal variability
of the biogeochemical structure of the waters of main
pycnocline. Ph.D. Thesis, Abstract, Marine Hydrophysical
Institute, Sevastopol, p. 36.
Konovalov, S.K., Murray, J.W., 2001. Variations in the
chemistry of the Black Sea on a time scale of decades.
Journal of Marine Sciences 31, 217–243.
Konovalov, S.K., Luther, G.W., Friederich, G.E., Nuzzio, D.B.,
Tebo, B.M., Murray, J.W., Oguz, T., Glazer, B., Trouwborst,
R.E., Clement, B., Murray, J.W., Romanov, A.S., 2003.
Lateral injection of oxygen with the Bosporus plume—fingers
of oxidizing potential in the Black Sea. Limnology and
Oceanography 48 (6), 2369–2376.
Koroleff, F., 1972. Determination of reactive silicate. Coopera-
tive research report JCES Series A 29, 87–90.
Krivosheya, V.G., Ovchinnikov, I.M., Skirta, A.Yu., 2002.
Intraannual variability of the cold intermediate layer of the
Black Sea. In: Zatsepin, A.G., Flint, M.V. (Eds.), Complex
Investigation of the Northeastern Black Sea. Nauka, Mos-
cow, pp. 27–39.
Kuypers, M.M.M., Sliekers, A.O., Lavik, G., Schmid, M.,
Jorgensen, B.B., Kuenen, J.G., Sinnenghe Damste, J.S., Strous,
M., Jetten, M.S.M., 2003. Anaerobic ammonium oxidation by
anammox bacteria in the Black Sea. Nature 422, 608–611.
Lewis, B.L., Landing, W.M., 1991. The biogeochemistry of
manganese and iron in the Black Sea. Deep-Sea Research 38
(Suppl. 2A), S773–S804.
Luther III, G.W., Church, T.M., Powel, D., 1991. Sulfur
speciation and sulfide oxidation in the water column of the
Black Sea. Deep-Sea Research 38 (Suppl. 2A), S1121–S1137.
Luther III, G.W., Sundby, B., Lewis, B.L., Brendel, P.J.,
Silverberg, N., 1997. The interaction of manganese with the
nitrogen cycle in continental margin sediments: Alternative
pathways for dinitrogen formation. Geochimica et Cosmo-
chimica Acta 61, 4043–4052.
Millero, F.J., 1991. The oxidation of H2S in the Chesapeake Bay.
Estuarine and Coastal Shelf Science 33, 521–527.
Morgan, J.A., Quinby, H.L., Ducklow, H.W., 2006. Bacterial
abundance and production in the Western Black Sea. Deep-
Sea Research II, this issue [doi:10.1016/j.dsr2.2006.03.023].
Murray, J.W., Jannasch, H.W., Honjo, S., Anderson, R.F.,
Reeburgh, W.S., Top, Z., Friederich, G.E., Codispoti, L.A.,
Izdar, E., 1989. Unexpected changes in the oxic/anoxic
interface in the Black Sea. Nature 338, 411–413.
Murray, J.W., Top, Z., Ozsoy, E., 1991. Hydrographic properties
and ventilation of the Black Sea. Deep-Sea Research 38
(Suppl. 2A), S663–S690.
Murray, J.W., Codispoti, L.A., Friederich, G.E., 1995. The
suboxic zone in the Black Sea. In: Huang, C.P., O’Melia, R.,
Morgan, J.J. (Eds.), Aquatic chemistry: interfacial and
interspecies processes. Adv. Chem. Ser. 244. American
Chemical Society, Washington DC, pp. 157–176.
Murray, J.W., Konovalov, S.K., Callahan, A., 2003a. Nitrogen
reactions in the suboxic zone of the Black Sea: new data and
models based on the KNORR 2001 cruise. In: Yilmaz, A.
(Ed.), Oceanography of the Eastern Mediterranean and Black
Sea. Proceeding of the Second International Conference on
Oceanography of the Eastern Mediterranean and Black Sea:
Similarities and Differences of Two Interconnected Basins,
TUBITAK Publishers, Ankara, Turkey, pp. 591–602.
Murray, J.W., Fuchsman C., Kirpatrick J., Paul B., Konovalov,
S.K., Callahan, A., 2003b. Nitrogen transformations in the
suboxic zone of the Black Sea. Nitrogen reactions in the
suboxic zone of the Black Sea. Oceanography, 18(2), 36–47.
ARTICLE IN PRESSE.V. Yakushev et al. / Deep-Sea Research II 53 (2006) 1769–1786 1785

Autho
r's
pers
onal
co
py
Nealson, K.N., Stahl, D.A., 1997. Microorganisms and biogeo-
chemical cycles: what can be learn from layered microbial
communities? In: Banfield, J.F., Nealson, K.N. (Eds.),
Reviews in mineralogy 35, Geomicrobiology: Interactions
between Microbes and Minerals. Mineralogical Society of
America, Washington, DC, pp. 5–34.
Oguz, T., Dippner, J.W., Kaymaz, Z., 2006. Climate regulation
of the Black Sea hydro-meteorological and ecological proper-
ties at interannual-to-decadal time scales. Journal of Marine
Systems, submitted for publication.
Peshkova, V.M., Ovsyannikova, A.A., 1937. Colorimetric
determination of manganese using formaldoxime. Zavods-
kaya Laboratoriya 7, 800–803 (In Russian).
Pimenov, N.G., Neretin, L.N., 2006. Composition and activities
of microbial communities, involved in carbon, sulfur, nitro-
gen and manganese cycling in the oxic/anoxic interface of the
Black Sea. In: Neretin, L.N. (Ed.), Past and Present Water
Column Anoxia. In NATO Sciences Series, Springer, Berlin,
pp. 501–522.
Podymov, O.I., 2005. Numerical estimates of the hydrochemical
characteristics of the Black Sea redox layer with a problem
oriented data base. Ph.D. Thesis, Shirshov Institute of
Oceanology, Moscow, p. 115.
Rozanov, A.G., 1995. Redox stratification of the Black Sea
water. Oceanology 35, 544–549.
Rozanov, A.G., Demidova, T.P., Egorov, A.V., Lukashev,
Yu.F., Stepanov, N.V., Chasovnikov, V.K., Yakushev,
E.V., 2000. Hydrochemical structure of the Black Sea at the
standard section from Gelendzhik to the central part of the
Sea (November 1997). Oceanology 40, 30–36.
Sapozhnikov, V.V., Agatova, A.I., Arzhanova, N.V., 1988.
Methods of hydrochemical investigations of the main
nutrients. Ed. VNIRO, Moscow, p. 119.
Shaffer, G., 1986. Phosphorus pumps and shuttles in the Black
Sea. Letters to Nature 321, 515–517.
Solorzano, Z., 1969. Determination of ammonium in natural
water by the phenohypochlorite method. Limnology and
Oceanography 14, 799–801.
Sorokin, Yu.I., 2002. The Black Sea. Ecology and Oceanography.
Backhuys Publishers, Leiden, (875pp).
Sorokin, Yu.I., Sorokin, P.Yu., Sorokina, O.V., Sorokin, D.Yu.,
Sukhomlin, A.V., 1992. Distribution and the functional
activity of the microflora in the water thickness of the Black
Sea in winter and beginning of spring 1991. In: Vinogradov,
M.E. (Ed.), Winter State of the Ecosystem of the Open Part of
the Black Sea. Shirshov Institute of Oceanology RAS,
Moscow, pp. 89–102.
Stokozov, N.A., 2004. Long-lived radionuclides 137Cs and 90Sr
in the Black Sea after the Chernobyl NPP accident and their
use as a tracers of water exchange processes. Ph.D. Thesis,
Sebastopol, MHI, 2004, 21pp.
Stookey, L.L., 1970. Ferrozine: a new spectrophotometric
reagent for iron. Analytical Chemistry 42, 779–781.
Tebo, B.M., 1991. Manganese(II) oxidation in the suboxic zone
of the Black Sea. Deep-Sea Research 38 (Suppl. 2), 883–905.
Turgul, S., Basturk, O., Saydam, C., Yilmaz, A., 1992. Changes
in the hydrochemistry of the Black Sea inferred from water
density profiles. Nature 359, 137–139.
Vinogradov, M.E., Nalbandov, Yu.P., 1990. Dependence of
physical, chemical and biological parameters in pelagic
ecosystem of the Black Sea upon the water density.
Oceanology 30, 769–777.
Volkov, I.I., Zhabina, N.N., 1990. A method of definition of the
reduced compounds of sulfur in the sea water. Oceanology 30,
778–782 (in Russian).
Volkov, I.I., Kontar’, E.A., Lukashev, Yu.F., Neretin, L.N.,
Nyffeler, F., Rozanov, A.G., 1997. Upper boundary of the
hydrogen sulfide and the nature of the Nepheloid Redox
Layer in the waters of the Caucasian Slope of the Black Sea.
Geochemistry International 6, 618–629.
Yakushev, E.V., Debolskaya, E.I., 2000. Particulate manganese
as a main factor of oxidation of hydrogen sulfide in redox
zone of the Black Sea. In: Oceanic Fronts and Related
Phenomena. Konstantin Fedorov Memorial Symposium.
Pushkin, Saint-Petersburg, Russia, 18–22 May, 1998, Pro-
ceedings. IOC Workshop Report No. 159, Kluwer Academic
Publishers, Dordrecht, 2000, pp. 592–597.
Yakushev, E.V., Besedin, D.E., Lukashev, Yu.F., Chasovnikov,
V.K., 2001. On the upward shift of the boundary of anoxic
zone in the density field in the Black ea in 1999–2000.
Oceanology 41, 686–691 (English Translation).
Yakushev, E.V., Lukashev, Yu.F., Chasovnikov, V.K., Chzhu,
V.P., 2002. Modern notion of the vertical hydrochemical
structure of the Black Sea redox zone. In: Zatsepin, A.G.,
Flint, M.V. (Eds.), Complex Investigation of the North-
eastern Black Sea. Nauka, Moscow, pp. 119–133
(In Russian).
Yakushev, E.V., Chasovnikov, V.K., Debolskaya, E.I., Gregoire,
M., Podymov, O.I., Yakubenko, V.G., 2003. The north-
eastern Black Sea redox zone hydrochemical structure:
observed concentrations and estimated fluxes. In: Yilmaz,
A. (Ed.), Oceanography of the Eastern Mediterranean and
Black Sea. Tubitak Publishers, Ankara, pp. 322–328.
Yakushev, E.V., Podymov, O.I., Chasovnikov, V.K., 2005.
Seasonal changes in hydrochemical structure of the Black
Sea redox zone. Oceanography 18 (2), 44–51.
Yilmaz, A., Coban-Yildiz, Y., Telli-Karakoc, F., Bologa, A.,
2006. Surface and mid-water sources of organic carbon by
photo- and chemoautotrophic production in the Black Sea.
Deep-Sea Research II, this issue [doi:10.1016/j.dsr2.
2006.03.015].
Zatsepin, A.G., Kremenetskiy, V.V., Poyarkov, S.G., Ratner,
Yu.B., Stanichny, S.V., 2002. Influence of wind field on water
circulation in the Black Sea. In: Zatsepin, A.G., Flint, M.V.
(Eds.), Complex Investigation of the Northeastern Black Sea.
Nauka, Moscow, pp. 91–105 (In Russian).
ARTICLE IN PRESSE.V. Yakushev et al. / Deep-Sea Research II 53 (2006) 1769–17861786