‘ go with the flow ’: a review of methods and advancements in blood flow imaging
TRANSCRIPT

REVIEW ARTICLE
‘Go with the flow’: A review of methodsand advancements in blood flow imaging
Susan M. Daly*; 1 and Martin J. Leahy2
1 Biophotonics Research Facility, Department of Physics & Energy, University of Limerick, Ireland2 Tissue Optics and Microcirculation Imaging Group, School of Physics, National University of Ireland, Galway, Ireland
Received 23 April 2012, revised 22 May 2012, accepted 23 May 2012Published online 19 June 2012
Key words: biophotonics, correlation, flow, microcirculation, microvasculature, optical imaging, optical sectioning, photo-acoustic, optical coherence tomography
1. Introduction
The analysis of light interactions with biological tis-sue facilitates a non-invasive morphological andfunctional ‘optical biopsy’ [1], both of which are ofoutward importance diagnostically and prognosti-cally. A biopsy of this form may be juxtaposed to itscore or excisional biopsy precursor, wherein the pro-cedure involves the surgical removal of a samplingof cells or tissues for examination via microscopy orchemical analysis. The medical removal of tissuefrom a living subject to determine the presence or
extent of a disease is a commonplace procedure inclinical practice.
In addition to gleaning structural data, vascularimaging enables the quantification of blood vesselspacing, the assessment of blood flow and permeabil-ity [2, 3], and the analysis of cellular and molecularabnormalities, and vessel wall shear stresses [4].Structural and functional parameters may be eluci-dated by methods ranging from fluorescence to con-focal and multiphoton microscopy. Magnetic reso-nance imaging (MRI), computed tomography (CT),positron emission tomography (PET), ultrasonogra-
# 2013 by WILEY-VCH Verlag GmbH & Co. KGaA, Weinheim
Journal of
BIOPHOTONICS
Physics has delivered extraordinary developments in al-most every facet of modern life. From the humble ther-mometer and stethoscope to X-Ray, CT, MRI, ultra-sound, PET and radiotherapy, our health has beentransformed by these advances yielding both morpholo-gical and functional metrics. Recently high resolution la-bel-free imaging of the microcirculation at clinically rele-vant depths has become available in the research domain.In this paper, we present a comprehensive review on cur-rent imaging techniques, state-of-the-art advancementsand applications, and general perspectives on the pro-spects for these modalities in the clinical realm.
* Corresponding author: e-mail: [email protected], Phone: +353 61 204824, Fax: +353 61 202423
J. Biophotonics 6, No. 3, 217–255 (2013) / DOI 10.1002/jbio.201200071

phy and optical imaging have been shown to providenon-invasive, functionally relevant images of angio-genesis in animals and humans [5–10].
Great attention has been paid in the past two dec-ades to the measurement of flow velocity on the mi-crometer scale and many techniques for assessing theblood supply have been investigated. This is borne outof recognition of the vitally important role that bloodflow plays in the health of the individual. There are amyriad of (biological) reasons for this importance; forexample, the onset of atheroma, a degeneration of thearterial wall which leads to arteriosclerosis or ‘arteryhardening’ [11, 12] manifests as disruption of localisedflow patterns. In particular, there is growing clinicalevidence that goal-directed intervention based onfunctional capillary density and heterogeneity of mi-crocirculatory blood flow, in critically ill patients withseptic and cardiogenic shock, led to improved out-comes [13]. However, the clinical applicability of opti-cal methods is not solely confined to assessment of lo-calised tissue regions. For instance, full-field skinperfusion techniques can assess the extent and aid inthe diagnosis of burn depth [4, 14, 15] by visualisingthe velocity distribution as a scalar velocity map. As-sessing flow pattern disturbances is not of interest un-iquely to the biomedical community; similar methodshave been used in the field of chemical analysis, for ex-ample, in efforts to improve fluidic system perfor-mance [16]. There appears to be an ever-increasingemphasis being placed upon knowledge of precise dis-tribution of flow velocities and the relative dynamics.
To meet this need, a wide variety of methodsaimed towards measuring values of flow velocity with-in media have come into existence. However, everytechnique contains limitations or restrictions whichmust be minimised or compensated for in order to beutilised in a practical manner (see Figure 1). Theprinciples upon which such methods are based varywidely, as does the suitability (e.g. resolution, imag-ing depth, etc.) and the relative technology andcosts involved [5, 17]. These constraints throw downthe gauntlet of developing new imaging methodsthat can bridge this resolution dilemma.
Non-invasive in vivo imaging modalities have ob-vious advantages for the clinical realm; noteworthyare their ability to provide clinically relevant infor-mation without disturbing the normal biological en-vironment. Methods which would allow the routineclinical assessment and monitoring at the microcircu-latory level could greatly improve early detectionand improve patient recovery rate. Furthermore, exvivo tissue is not representative of the natural biolo-gical environment. Thus, non-invasive optical imag-ing techniques have filled this niche, garnering a re-putation for fulfilling patient comfort during clinicalassessment. Nonetheless, difficulties remain in ob-taining accurate data in an environment which issubject to such large biological variability.
The consistent and growing interest in opticalimaging methods is clearly evident based upon thenumber of papers on the subject of the microcircula-tion published in the physical sciences (see Figure 2).
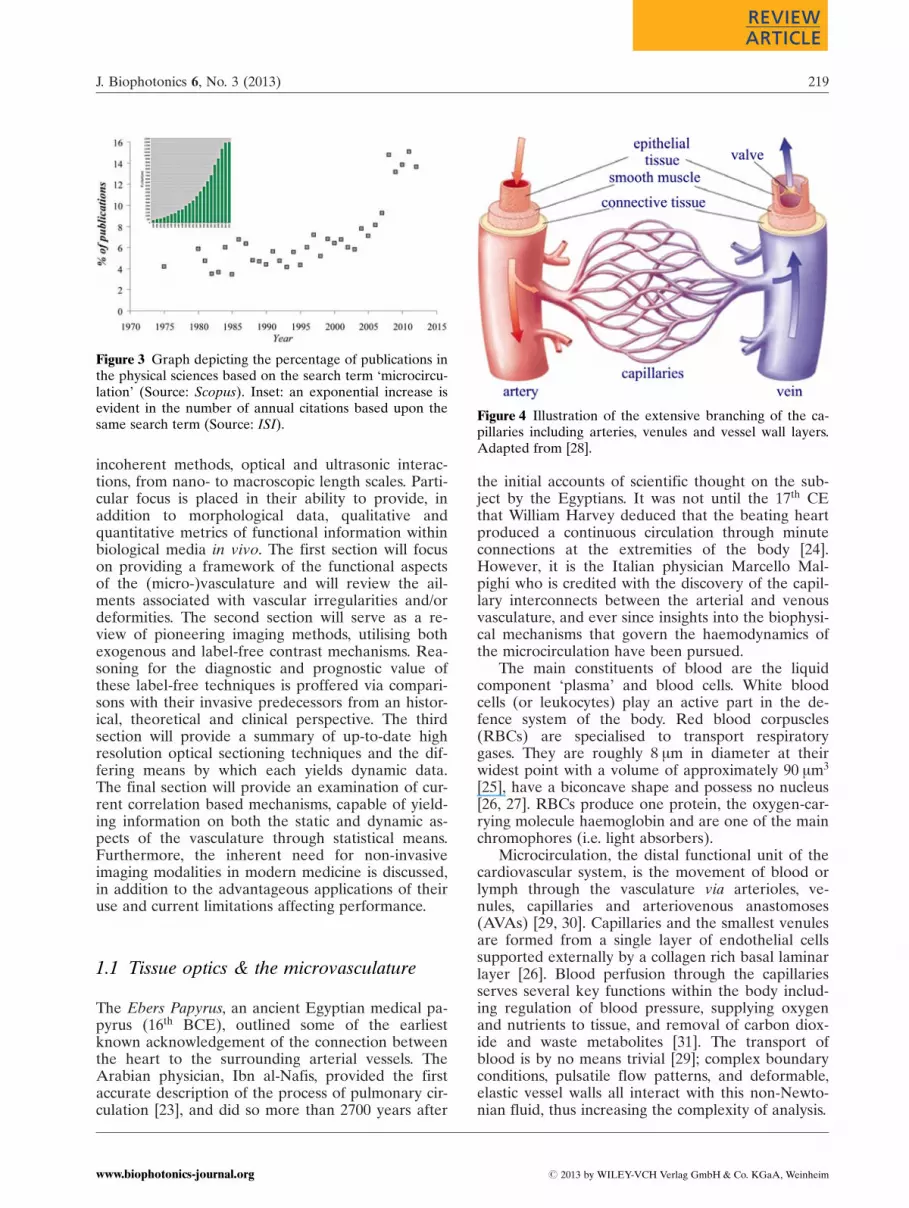
A leap from the long stable 8% of all microcircu-lation papers to 15% represents a doubling betweenthe years 2006 and 2011 (see Figure 3). In addition,an exponential increase in the number of annual ci-tations on the topic of ‘microcirculation imaging’ re-veals there to be an explosion of interest in develop-ment and evaluation of new tools to study themicrocirculation.
Several comparative reviews exist currently inthe literature based on particular types of imagingmechanisms [18, 19]. There are also several publi-cations which focus on the importance of the analy-sis of blood flow dynamics within the vasculature[20–22]. This paper, however, is intended to be acomprehensive historical overview of the invasivetechniques of the past and of current state-of-the-artadvances in non-invasive imaging modalities. Thetechniques covered vary widely from coherent and
Figure 1 Illustration of the relative domains occupied byvarious imaging modalities in terms of resolution and sam-pling depth. DOT: Diffuse Optical Tomography.
Figure 2 Graph depicting the increase in the number of pub-lications using the search term ‘microcirculation’ (Source:Scopus). Blue squares: all publications; pink squares: phy-sical sciences; yellow triangles: based on the laser Dopplermodality.
S. M. Daly and M. J. Leahy: A review of methods and advancements in blood flow imaging218
Journal of
BIOPHOTONICS
# 2013 by WILEY-VCH Verlag GmbH & Co. KGaA, Weinheim www.biophotonics-journal.org
incoherent methods, optical and ultrasonic interac-tions, from nano- to macroscopic length scales. Parti-cular focus is placed in their ability to provide, inaddition to morphological data, qualitative andquantitative metrics of functional information withinbiological media in vivo. The first section will focuson providing a framework of the functional aspectsof the (micro-)vasculature and will review the ail-ments associated with vascular irregularities and/ordeformities. The second section will serve as a re-view of pioneering imaging methods, utilising bothexogenous and label-free contrast mechanisms. Rea-soning for the diagnostic and prognostic value ofthese label-free techniques is proffered via compari-sons with their invasive predecessors from an histor-ical, theoretical and clinical perspective. The thirdsection will provide a summary of up-to-date highresolution optical sectioning techniques and the dif-fering means by which each yields dynamic data.The final section will provide an examination of cur-rent correlation based mechanisms, capable of yield-ing information on both the static and dynamic as-pects of the vasculature through statistical means.Furthermore, the inherent need for non-invasiveimaging modalities in modern medicine is discussed,in addition to the advantageous applications of theiruse and current limitations affecting performance.
1.1 Tissue optics & the microvasculature
The Ebers Papyrus, an ancient Egyptian medical pa-pyrus (16th BCE), outlined some of the earliestknown acknowledgement of the connection betweenthe heart to the surrounding arterial vessels. TheArabian physician, Ibn al-Nafis, provided the firstaccurate description of the process of pulmonary cir-culation [23], and did so more than 2700 years after
the initial accounts of scientific thought on the sub-ject by the Egyptians. It was not until the 17th CEthat William Harvey deduced that the beating heartproduced a continuous circulation through minuteconnections at the extremities of the body [24].However, it is the Italian physician Marcello Mal-pighi who is credited with the discovery of the capil-lary interconnects between the arterial and venousvasculature, and ever since insights into the biophysi-cal mechanisms that govern the haemodynamics ofthe microcirculation have been pursued.
The main constituents of blood are the liquidcomponent ‘plasma’ and blood cells. White bloodcells (or leukocytes) play an active part in the de-fence system of the body. Red blood corpuscles(RBCs) are specialised to transport respiratorygases. They are roughly 8 mm in diameter at theirwidest point with a volume of approximately 90 mm3
[25], have a biconcave shape and possess no nucleus[26, 27]. RBCs produce one protein, the oxygen-car-rying molecule haemoglobin and are one of the mainchromophores (i.e. light absorbers).
Microcirculation, the distal functional unit of thecardiovascular system, is the movement of blood orlymph through the vasculature via arterioles, ve-nules, capillaries and arteriovenous anastomoses(AVAs) [29, 30]. Capillaries and the smallest venulesare formed from a single layer of endothelial cellssupported externally by a collagen rich basal laminarlayer [26]. Blood perfusion through the capillariesserves several key functions within the body includ-ing regulation of blood pressure, supplying oxygenand nutrients to tissue, and removal of carbon diox-ide and waste metabolites [31]. The transport ofblood is by no means trivial [29]; complex boundaryconditions, pulsatile flow patterns, and deformable,elastic vessel walls all interact with this non-Newto-nian fluid, thus increasing the complexity of analysis.
Figure 3 Graph depicting the percentage of publications inthe physical sciences based on the search term ‘microcircu-lation’ (Source: Scopus). Inset: an exponential increase isevident in the number of annual citations based upon thesame search term (Source: ISI).
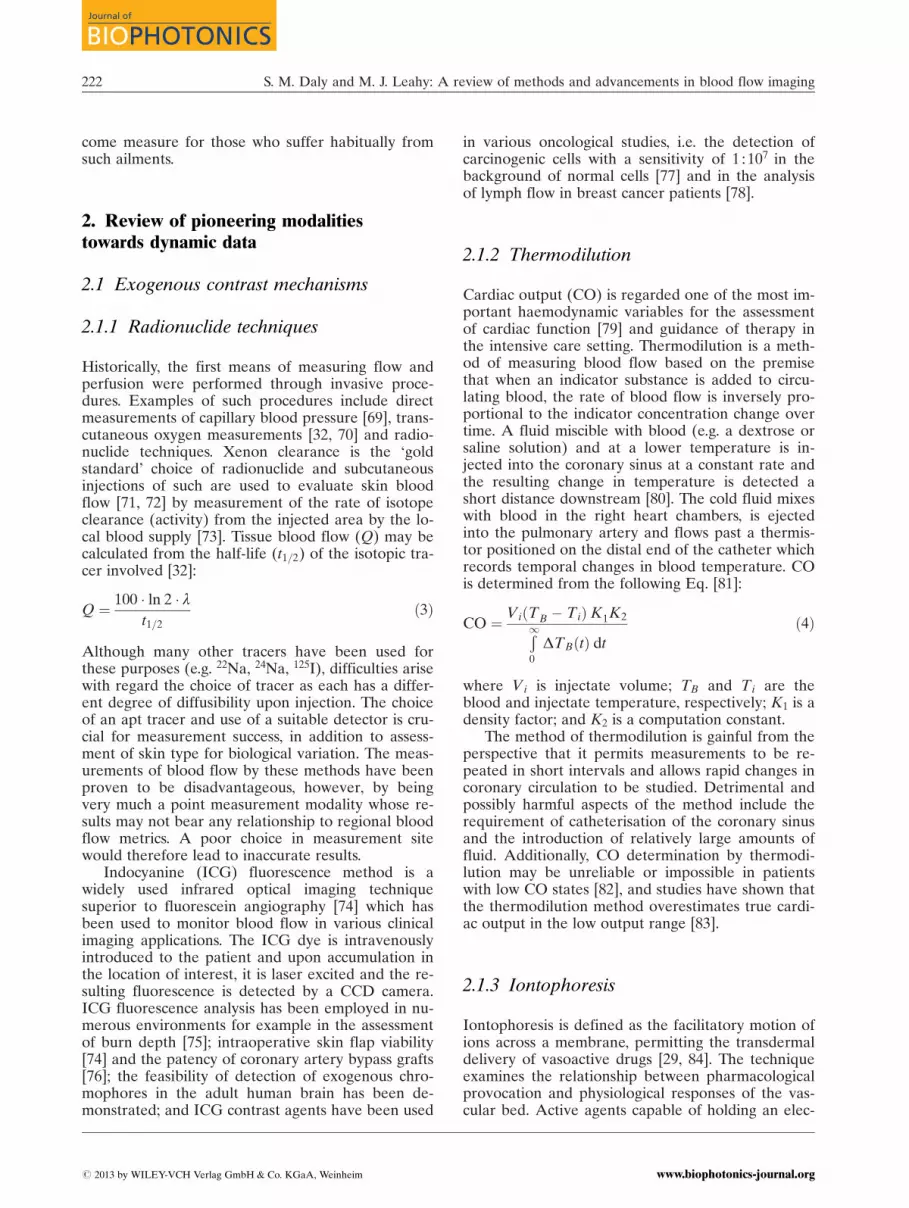
Figure 4 Illustration of the extensive branching of the ca-pillaries including arteries, venules and vessel wall layers.Adapted from [28].
J. Biophotonics 6, No. 3 (2013) 219
REVIEWREVIEWARTICLEARTICLE
# 2013 by WILEY-VCH Verlag GmbH & Co. KGaA, Weinheimwww.biophotonics-journal.org

The scale of the cardiovascular system geometryspans several orders of magnitude (see Table 1),from the size of a minute capillary to aortic size (ap-proximately 2 cm). In addition, these lengths are notconsistent throughout the entire body; capillariesthose found in the skin have comparatively thickerwalls (2–3 mm) [32] when compared with the rest ofthe body (0.1 mm) [27]. Furthermore, the type offlow experienced in these vessels varies greatly fromstrongly pulsatile (e.g. in arteries) to being almoststationary. Flow is characterised by two dimension-less quantities: the Reynolds number (Re) and theWomersley number (a), defined as:
Re ¼ d � �vv � r#
; a ¼ d
ffiffiffiffiffiffiffiffiffiffiffiffiffiffi2pf � r#
rð1Þ
where d is the vessel diameter; �vv, bulk velocity; r,density; #, dynamic viscosity; and f is the characteris-tic frequency. Generally, Reynolds numbers below2000 imply laminar flow rates, whereas for low Wo-mersley values, pulsatile flow is dominated by vis-cous effects [4].
In the skin, the structure of vessels is arrangedinto superficial and deep horizontal plexuses [34]and serves a number of vital functions such as nutri-tional support for tissues and homeostasis [29, 35].
AVAs serve as low resistance channels for large vol-umes of blood to pass directly from arterioles to ve-nules (i.e. bypasses the capillaries) [29] and play animportant role in the thermoregulation of the body[36]. Assessment of AVAs in the acral regions of thebody has shown them to be implicated in diabetes,where the volume of blood transferred by AVAs in-creases and is thought to be the cause of neuropathiculcerations [37] (see § 1.2).
Biological tissues are absorbing media and areoptically inhomogeneous [25]. Light microscopy anddirect visual inspection of the skin is hampered byscattering, regular surficial reflections and absorptionby chromophores such as melanin and haemoglobin.Light interaction with a multilayer and multicompo-nent substance such as skin is a highly complicatedprocess [25, 39]. Light propagation within tissues de-pends on the scattering and absorption of its cellcomponents and tissue fibers, the size, shape anddensity of these structures, relative refractive indicesand the polarisation state of the incident light[40, 41]. For instance, the stratum corneum and der-mal layers of the skin may provide 5–7% and 35–70%, respectively, of diffuse reflectance independentof the wavelength and skin type. A collimated beammay become diffuse by interaction with microscopicinhomogeneities at boundary interfaces. This at-tenuation in a thin tissue layer of thickness d, maybe described by the Bouguer-Beer-Lambert expo-nential law [42]:
IðdÞ ¼ ð1� RFÞ I0 exp ð � mtdÞ ð2Þ
where I0 is the incident light intensity; mt, extinctionor total attenuation coefficient; and RF, coefficientof Fresnel reflection. At a microscopic scale, tissuecomponents have no pronounced boundaries andappear to merge into a continuous structure withspatial variations in the refractive index. Quantita-tive models [43] assist in the comprehension of suchcomplex morphologies by predicting the absolutemagnitudes of optical coefficients, and wavelengthand angular dependencies. One such model is thediscrete particle model of tissue [25, 44].
1.2 Clinical implications of blood flowassessments
Aberrant microcirculatory morphology and haemo-dynamics are signatures of many human diseasessuch as cancer, macular degeneration, and manyothers. The skin is easily accessible and any compro-mise in nutritional support [45] and/or impairment intissue viability can lead to disease manifestation [46].Skin blood flow measurements are used to studyclinical conditions which either intrinsically affect
Table 1 Reference values for mean velocity (�vv), diameter(d), Reynolds number (Re) and Womersley number (a);adapted from [4, 28].
Vessel Type �vv (m s�1) d (mm) Re (�) a (�)
Artery 0.45 4 450 40Arteriole 0.05 0.05 0.5 0.5Capillary 0.001 0.008 0.002 0.1Venule 0.002 0.02 0.01 0.2Vein 0.1 5 125 50
Figure 5 Illustration of dermal and epidermal strata andthe arrangement of blood vessels in the skin. Adapted from[38].
S. M. Daly and M. J. Leahy: A review of methods and advancements in blood flow imaging220
Journal of
BIOPHOTONICS
# 2013 by WILEY-VCH Verlag GmbH & Co. KGaA, Weinheim www.biophotonics-journal.org

skin blood [32] or where measurement of skin bloodflow is affected by the underlying pathology. Assess-ment of skin structure and function can provide evi-dence of a disorder, the dysfunction extent, serve asan early indication of disease onset or as a means ofpost-operative assessment, for example skin flap via-bility following plastic surgery [45].
The nailfold plexus is one of only a few locationson the body where capillaries advance close enoughto the skin surface (within 200 mm) to be naturallyvisible without the use of specialised optical equip-ment or optical clearing agents. The fingernail is ea-sily fixed in position, free from any pulsatile move-ment, and the capillaries run in hairpin-like loopsparallel to the skin surface. Initial microscopy techni-ques for capillaroscopic purposes were reliant onepi-illumination, with a magnification range of be-tween 15 and 100 [29].
The ease with which capillaries may be imageddoes not imply that the range of ailments is by anymeans limited. Chronic illnesses such as systemiclupus erythematosus, scleroderma [48], systemicsclerosis [49], antiphospholipid syndrome [50], con-nective tissue disease [51], diabetes mellitus [52] andRaynaud’s Phenomenon [49] have been readily iden-tified via specific physiological markers at the capil-lary level such as increased vessel permeability (hae-morrhaging) [2, 3], the presence of avascular areas,enlarged loops, poor circulation, and increased tortu-osity [29]. In addition, the identification of such ail-ments has not been limited to solely systemic dis-eases. Physiological irregularities have manifested inthe nailfold plexus, stemming from localised areas ofdiscomfort and have revealed the presence of condi-tions such as rheumatoid arthritis [53], vasculitis,psoriasis and psoriatic arthritis [54], and migraine, inaddition to psychiatric disorders such as schizophre-nia [55].
A brief list of ailments and the reported techni-ques used in their detection and identification areoutlined on Table 2. Although the quoted imagingtechniques do not proffer a clinical solution to such
ailments, their value and the justification for theiruse may be understood from their potential to char-acterise disease progression and determine responseto therapy, enabling timely modifications to thera-peutic strategies. This is particularly pertinent fromthe perspective of preventative medicine and patientmanagement, as the manifestation of vascular aber-rations can occur initially in the peripheral areas ofthe body prior to clinical suspicion. Such early diag-noses and subsequent early intervention may offerthe patient a decreased degree of suffering, a wel-
(a) (b)
Figure 6 (a) Normal capillary arrangement; (b) Angiogenicramified capillaries commonly seen in Raynaud’s phenom-enon [47].
Table 2 Compilation of ailments which manifest in theacral regions and the respective technique used in theirdetection. OPS, Orthogonal Polarisation Spectral; SDF,Sidestream Dark Field; LDF, Laser Doppler Flowmetry;PAOD, Peripheral Arterial Obliterative Disease [17, 47,48, 50, 52, 53, 56–68].
J. Biophotonics 6, No. 3 (2013) 221
REVIEWREVIEWARTICLEARTICLE
# 2013 by WILEY-VCH Verlag GmbH & Co. KGaA, Weinheimwww.biophotonics-journal.org
come measure for those who suffer habitually fromsuch ailments.
2. Review of pioneering modalitiestowards dynamic data
2.1 Exogenous contrast mechanisms
2.1.1 Radionuclide techniques
Historically, the first means of measuring flow andperfusion were performed through invasive proce-dures. Examples of such procedures include directmeasurements of capillary blood pressure [69], trans-cutaneous oxygen measurements [32, 70] and radio-nuclide techniques. Xenon clearance is the ‘goldstandard’ choice of radionuclide and subcutaneousinjections of such are used to evaluate skin bloodflow [71, 72] by measurement of the rate of isotopeclearance (activity) from the injected area by the lo-cal blood supply [73]. Tissue blood flow (Q) may becalculated from the half-life (t1=2) of the isotopic tra-cer involved [32]:
Q ¼ 100 � ln 2 � lt1=2
ð3Þ
Although many other tracers have been used forthese purposes (e.g. 22Na, 24Na, 125I), difficulties arisewith regard the choice of tracer as each has a differ-ent degree of diffusibility upon injection. The choiceof an apt tracer and use of a suitable detector is cru-cial for measurement success, in addition to assess-ment of skin type for biological variation. The meas-urements of blood flow by these methods have beenproven to be disadvantageous, however, by beingvery much a point measurement modality whose re-sults may not bear any relationship to regional bloodflow metrics. A poor choice in measurement sitewould therefore lead to inaccurate results.
Indocyanine (ICG) fluorescence method is awidely used infrared optical imaging techniquesuperior to fluorescein angiography [74] which hasbeen used to monitor blood flow in various clinicalimaging applications. The ICG dye is intravenouslyintroduced to the patient and upon accumulation inthe location of interest, it is laser excited and the re-sulting fluorescence is detected by a CCD camera.ICG fluorescence analysis has been employed in nu-merous environments for example in the assessmentof burn depth [75]; intraoperative skin flap viability[74] and the patency of coronary artery bypass grafts[76]; the feasibility of detection of exogenous chro-mophores in the adult human brain has been de-monstrated; and ICG contrast agents have been used
in various oncological studies, i.e. the detection ofcarcinogenic cells with a sensitivity of 1 : 107 in thebackground of normal cells [77] and in the analysisof lymph flow in breast cancer patients [78].
2.1.2 Thermodilution
Cardiac output (CO) is regarded one of the most im-portant haemodynamic variables for the assessmentof cardiac function [79] and guidance of therapy inthe intensive care setting. Thermodilution is a meth-od of measuring blood flow based on the premisethat when an indicator substance is added to circu-lating blood, the rate of blood flow is inversely pro-portional to the indicator concentration change overtime. A fluid miscible with blood (e.g. a dextrose orsaline solution) and at a lower temperature is in-jected into the coronary sinus at a constant rate andthe resulting change in temperature is detected ashort distance downstream [80]. The cold fluid mixeswith blood in the right heart chambers, is ejectedinto the pulmonary artery and flows past a thermis-tor positioned on the distal end of the catheter whichrecords temporal changes in blood temperature. COis determined from the following Eq. [81]:
CO ¼ ViðTB � TiÞK1K2Ð10
DTBðtÞ dtð4Þ
where Vi is injectate volume; TB and Ti are theblood and injectate temperature, respectively; K1 is adensity factor; and K2 is a computation constant.
The method of thermodilution is gainful from theperspective that it permits measurements to be re-peated in short intervals and allows rapid changes incoronary circulation to be studied. Detrimental andpossibly harmful aspects of the method include therequirement of catheterisation of the coronary sinusand the introduction of relatively large amounts offluid. Additionally, CO determination by thermodi-lution may be unreliable or impossible in patientswith low CO states [82], and studies have shown thatthe thermodilution method overestimates true cardi-ac output in the low output range [83].
2.1.3 Iontophoresis
Iontophoresis is defined as the facilitatory motion ofions across a membrane, permitting the transdermaldelivery of vasoactive drugs [29, 84]. The techniqueexamines the relationship between pharmacologicalprovocation and physiological responses of the vas-cular bed. Active agents capable of holding an elec-
S. M. Daly and M. J. Leahy: A review of methods and advancements in blood flow imaging222
Journal of
BIOPHOTONICS
# 2013 by WILEY-VCH Verlag GmbH & Co. KGaA, Weinheim www.biophotonics-journal.org

tric charge are applied topically to the skin in a gelform. An electrode, oppositely charged with respectto the active agent, repels the ions down towards ananode/cathode via an electrical gradient, thus pene-trating the skin. As the skin generally possesses anet negative charge, positively charged drugs aregenerally easier to deliver [37]. Although the ionto-phoretic method does not cause localised pain orswelling, it is a time consuming exercise and must berepeated at regular intervals.
2.2 Endogenous contrast mechanisms
2.2.1 Thermography
In thermography, two-dimensional (2D) maps of ra-diation differences are constructed of regional tem-perature distributions across the skin and are usedas a direct measure of blood perfusion [32, 85].There are contact and non-contact thermographicdevices; the former utilises liquid crystal technologydirectly on the skin surface, and the latter employsthe infra-red (IR) portion of the electromagneticspectrum. The energy flux emitted by the skin is gi-ven by Stefan-Boltzmann’s law:
R ¼ qST4S ð5Þ
where qS is the Stefan-Boltzmann constant and TS isthe temperature at the skin surface. Although ther-mography has good spatial resolution and is rela-tively easy to use [86], it provides details of surfacetemperature only and has poor responsiveness. How-ever, microwave radiometry can penetrate to subcu-taneous tissue depth (1–2 cm) and has been used instudies to assess peripheral vascular disease [87].
2.2.2 Laser doppler imaging
A system composed of both stationary and mobilescatterers is illuminated with coherent light; somephotons undergo a frequency change. This phenom-enon is known as the Doppler Effect, named for itsdiscoverer, Austrian physicist Christian AndreasDoppler. The effect occurs when photons are scat-tered from particles which are moving and thechange in frequency is determined by the frequencyof the emitting source and the velocity relative tothe observer. As the reflected portion of the incidentbeam is found to be spectrally broadened [89, 90],this frequency shift can be used to determine the ve-locity of the moving object. Laser Doppler Flowme-try (LDF) refers to a general class of non-invasivetechniques which utilise the optical Doppler effect tomeasure changes in microcirculatory blood perfusion
for both in vitro [91] and in vivo [92] purposes. Per-fusion is defined as the product of the local speedand concentration of blood cells [41, 93]
Within the vasculature, dynamic components(such as RBCs) will undergo a frequency shiftwhereas the static components will not. These fre-quency shifts are allowed to impinge on the surfaceof a photodetector, producing beat frequencies fromwhich it is possible to determine the product of theaverage speed and concentration (i.e. perfusion) ofthe moving components within the tissue volume inquestion. The scattering angle, the wavelength of thelight in tissue (lT) and the velocity of the movingscattering object (vS) determine the frequency shiftproduced by Doppler scattering.
To derive this frequency shift, if an incidentphoton is described by the propagation vector ki and
Figure 7 Thermograms of the right hand of a healthy con-trol (Top) and a patient with systemic sclerosis (Bottom).A temperature gradient persists irrespective of ambienttemperature, suggesting an underlying vascular disease [88].
J. Biophotonics 6, No. 3 (2013) 223
REVIEWREVIEWARTICLEARTICLE
# 2013 by WILEY-VCH Verlag GmbH & Co. KGaA, Weinheimwww.biophotonics-journal.org

is scattered by a moving particle (see Figure 8) inthe direction kS, the scattering vector q (invariablewith elastic scattering) is given by:
jqj ¼ ki � kS ¼ 2k sinq
2
� �ð6Þ
The Doppler frequency shift (f Ds) for a single scat-tering event may be given by [25]:
f Ds ¼2vSh cos q
lTð7Þ
In a system of moving particles such as RBCs in tis-sue, a more realistic scenario would involve a singlephoton undergoing multiple Doppler-shifts. In thiscase f Ds would be the sum of the individual scatter-ing events. The velocity of RBCs in cutaneous circu-lation is of the order of mm s�1 and correspondinglyproduces a Doppler shift of several kHz. Since thisis very small, optical heterodyning techniques areutilised to obtain Doppler shifts [32].
Laser Doppler Perfusion Monitoring (LDPM)and Laser Doppler Perfusion Imaging (LDPI) weredeveloped for point-wise monitoring and imaging ofskin perfusion, respectively.
LDPI techniques have good spatial resolutiondue to their wide field of vision and ability to recordfluctuation patterns across a large area of the skin[34]. The first portable clinical instrument was devel-oped by Holloway and Watkins although it hadsome practical limitations due to poor signal to noiseratio [32, 95]. Although Laser Doppler technologyhas many potential applications, it has yet to becomeintegrated into clinical settings [96]. Angular limita-tions, the stochastic nature of the Doppler signalfrom a highly scattering medium [97, 98], phasewrapping, and interferometric fringe washout effects,prevent accurate assessment of the detected Dopplersignal [99] causing measurement ambiguities as wellas loss of information. Additionally, disturbances ofthe fluid refractive index resulting from large tem-perature fluctuations have caused the incident laser
beam to wander and defocus [100]. In spite of this,LDPI technology has been demonstrated and usedin the assessment of a plethora of clinical situations;for instance, assessment of burn extent [14, 15] andrelative perfusion [41, 101, 102], post-operative ma-lignant skin tumour assessment [103], and in thestudy of arthritis and joint inflammation [104].
2.2.3 Laser speckle imaging
Image speckle refers to the pattern observed on asurface [105]. As outlined in § 2.2.2, analysis of theDoppler shift of the photon or the distribution ofDoppler shifts from a distribution of photons, en-ables the discernment of the dynamics of scatteringparticles. In vivo experiments have shown a strongcorrelation between Doppler and speckle modalities[106]. A speckle pattern is formed either by the re-flection of coherent light from a rough surface, or bytransmitting the light through a transparent mediumhaving a randomly fluctuating refractive index distri-bution and by subsequent 3D multiple beam inter-ference [107]. The speckle pattern is a granular var-iation of light intensity (see Figure 10) obtainedfrom any rough surface such as skin and is charac-
Figure 8 Illustration of single Doppler shift event; q, scat-tering angle; f, azimuthal angle.
Figure 9 Perfusion images of the finger obtained before,during, and after occlusion of the upper arm using LDPI(64� 64 pixels) [94].
Figure 10 Illustration of a simulated speckle pattern withan exposure time of 1 ms [113].
S. M. Daly and M. J. Leahy: A review of methods and advancements in blood flow imaging224
Journal of
BIOPHOTONICS
# 2013 by WILEY-VCH Verlag GmbH & Co. KGaA, Weinheim www.biophotonics-journal.org

terised by a random intensity distribution that maybe described by statistical means [17, 108].
Scattering inhomogeneities within the skin can beconsidered as point sources and small differences indistances traversed, to the photodiode detector used,result in dark and bright speckles dispersed at allpoints in space. This motion results in a speckle pat-tern that appears decorrelated or ‘blurred’ [109].The amount of decorrelation depends on the speedand volume of the scatterers in the tissue. To quanti-fy the blurring of the speckles, the speckle contrastis computed as the ratio [110, 111]:
KS ¼sS
hIi � 1 ð8Þ
where sS is the standard deviation; and hIi is themean intensity. A fluctuation in light intensity is re-corded each time a scatterer moves through a dis-tance of 0:5l. Determinations of velocity may beobtained by temporally assessing the statistical beha-viour of speckles. The time-varying component ofspeckle may be quantified by comparisons of like pix-el intensities recorded in successive scans of the sub-ject, thus forming 2D maps of flow across the regionof interest. A successful approach was developedusing laser speckle contrast analysis (LASCA), whichassumes that (considering a Lorenztian flow profile)the speckle contrast could be related to correlationtime tC (and hence RBCV) [110, 112]:
K ¼ b0:5 tC
Tþ t2
C
2T2 exp � 2T
tC
� �� 1
� �( )0:5
ð9Þ
where b1 accounts for loss of correlation related tothe ratio of the detector size to the speckle size andpolarisation; tC, the correlation time; and T is theexposure time of the camera.
In full-field measurements, tissue is illuminatedby an expanded laser beam and the resulting imagespeckle is recorded by a CCD camera.
Speckle techniques have the advantage of beingable to acquire images in real-time, making it possi-ble to measure blood flow response to occlusion andhyperaemia, for instance. Although specular reflec-tion effects may be disregarded with the addition ofpolarising filters, static tissue reduces the signal-to-noise (SNR) ratio [114–116]. These factors contri-bute to the confinement of the speckle technique tosuperficial measurements, with deeper measure-ments requiring the necessity of being performed onsurgically exposed tissue.
Progress has been made in establishing a flowdecorrelation time using laser speckle contrast tech-niques [117]; however, issues still remain of how torelate this time constant to the flow velocity [118].Although accurate absolute measurements RBCV
cannot be calculated, perfusion changes can be suc-cessively monitored and tracked. Laser speckle ima-ging has been demonstrated on the rodent skin foldmodel [119, 120], assessed the vasodilation re-sponses of intestinal tissues [121], analysed retinalblood flow and cerebral perfusion [122–125], andstroke [110].
2.2.4 Polarisation spectroscopy
If polyvinyl alcohol (PVA) chains are stretched, theyform an array of aligned, linear molecules known asa polariser. This device is capable of changing theexact form that light, which passes through, maytake, i.e. its state of polarisation. Polarisers come inmany different configurations, capable of circular orelliptical polarisation. However, if an iodine dopantis attached to the PVA molecules, this makes thesechains conducting along their length and thus lightpolarised parallel to these chains is absorbed whilstperpendicularly polarised light is transmitted (a line-ar polariser). The technique of polarisation spectro-scopy (PS) makes use of this phenomenon for imag-ing purposes by gating photons returning fromdifferent skin tissue compartments [126].
Light from the superficial skin layers can be dif-ferentiated from light backscattered from the dermaltissue matrix by use of simple polarisation filters.When monochromatic or white incoherent light islinearly polarised by a filter and is subsequently inci-dent on the skin surface, 5% of the light is specularlyreflected by Fresnel reflection as surface glare and afurther 2% is reflected from the superficial stratumcorneum layers. These two light fractions retain theiroriginal polarisation state, dictated by the orientationof the first polariser (see Figure 12). The remainingportion penetrates through the epidermal layers,
Figure 11 (Left) Photograph of a free flap on the face aftersurgery; (Right) Laser Doppler image of the same area,showing much lower perfusion in the flap than in the sur-rounding tissue. Adapted from [105].
1 If the source is polarized and the detector is not, then b ¼ 0:5
J. Biophotonics 6, No. 3 (2013) 225
REVIEWREVIEWARTICLEARTICLE
# 2013 by WILEY-VCH Verlag GmbH & Co. KGaA, Weinheimwww.biophotonics-journal.org

where it is absorbed or backreflected. The backscat-tered portion is exponentially depolarised by scatter-ing [127] and tissue birefringence [128]; it has beensuggested that more than 10 scattering events are re-quired to sufficiently depolarise light [129, 130].
Light remerging from tissue structure is now dif-fusely reflected, consisting of equal (approx. 22%)divisions of parallel and perpendicular polarisationswith respect to the original filter direction. By plac-ing another polarising filter over the detector, surfi-cial [132] and subdermal [133] light fractions (i.e. co-polarised (CO) and cross-polarised (CR)) may bediscriminated.
Image processing of PS techniques employ an al-gorithm which generates a normalised difference be-tween CO and CR images [17]:
P ¼ CO� CRCOþ CR
ð10Þ
where P represents a composite image observingsurface histology. The denominator cancels any non-uniform illumination. Using polarisation imagingand Kubelka-Munk theories, an algorithm was devel-oped [134] to produce an output variable (TiViindex)capable of relaying information regarding RBC con-centration:
TiViindex ¼Mred �Mgreen
Mred
� exp �pMred �Mgreen
Mred
� �� �ð11Þ
where Mred and Mgreen represent the red and greenimage colour planes; and p is an empirical factorwhich produces the best linear fit between TiViindex
and RBC concentration. The technique has hightemporal and spatial aspects, with lateral resolutionestimated at 50 mm [131].
P images have been shown to be comparable tohistopathology examination, the invasive ‘gold stand-
ard’ of skin examination [17]. Polarisation filteringhas been applied in specular reflection elimination inLSI [109] and in LDPI, which otherwise would haveresulted in an overestimation of readings [135]; toprovide chemical signatures to generate Ramanspectra of the superficial layers [136]; and it has beenapplied in studies of burn depth [14, 15, 17, 137,138]. The PS method has some limitations, however.A prominent error relates to the measurement inac-curacies obtained on persons with dark skin, due tothe high absorption of melanin. Nonetheless, owingto its low cost, ease-of-use and portability, PS imag-ing systems are an attractive alternative for imagingpurposes.
2.2.5 Side-stream Dark Field Illumination
The computation of a TiViindex value relaying infor-mation regarding RBC concentration was discussedin § 2.2.4. This methodology took advantage of thephysiological fact that green light ensures optimaloptical absorption by the haemoglobin in the RBCs(independent of oxygenation state) with respect tothe lack of absorption by the tissue embedding themicrocirculation [60]. This use of green light illumi-nation thus acts as a contrast mechanism, whereRBCs are visualised as dark moving globules and tis-sue is visualised as white/gray. Side-stream dark fieldillumination imaging was introduced as the successorof Optical Polarisation Spectroscopy (OPS) [139].
The SDF imaging device consists of a centrallight guide, surrounded by concentrically placed lightemitting diodes that emit green light. In OPS imag-ing, the tissue embedding the microcirculation is illu-minated with polarised green light [60, 133, 141–143]. As in the case of PS imaging, backscattered(and thus depolarised) light is projected onto a CCDcamera after it passes an analyzer. Polarised light re-
Figure 12 Illustration of the oper-ating principle of PS using polari-sation gating method. Polarisationfilters (1,2) are arranged so thattheir pass-directions are perpendi-cular, thus creating a cross-polarisedimage [131].
S. M. Daly and M. J. Leahy: A review of methods and advancements in blood flow imaging226
Journal of
BIOPHOTONICS
# 2013 by WILEY-VCH Verlag GmbH & Co. KGaA, Weinheim www.biophotonics-journal.org
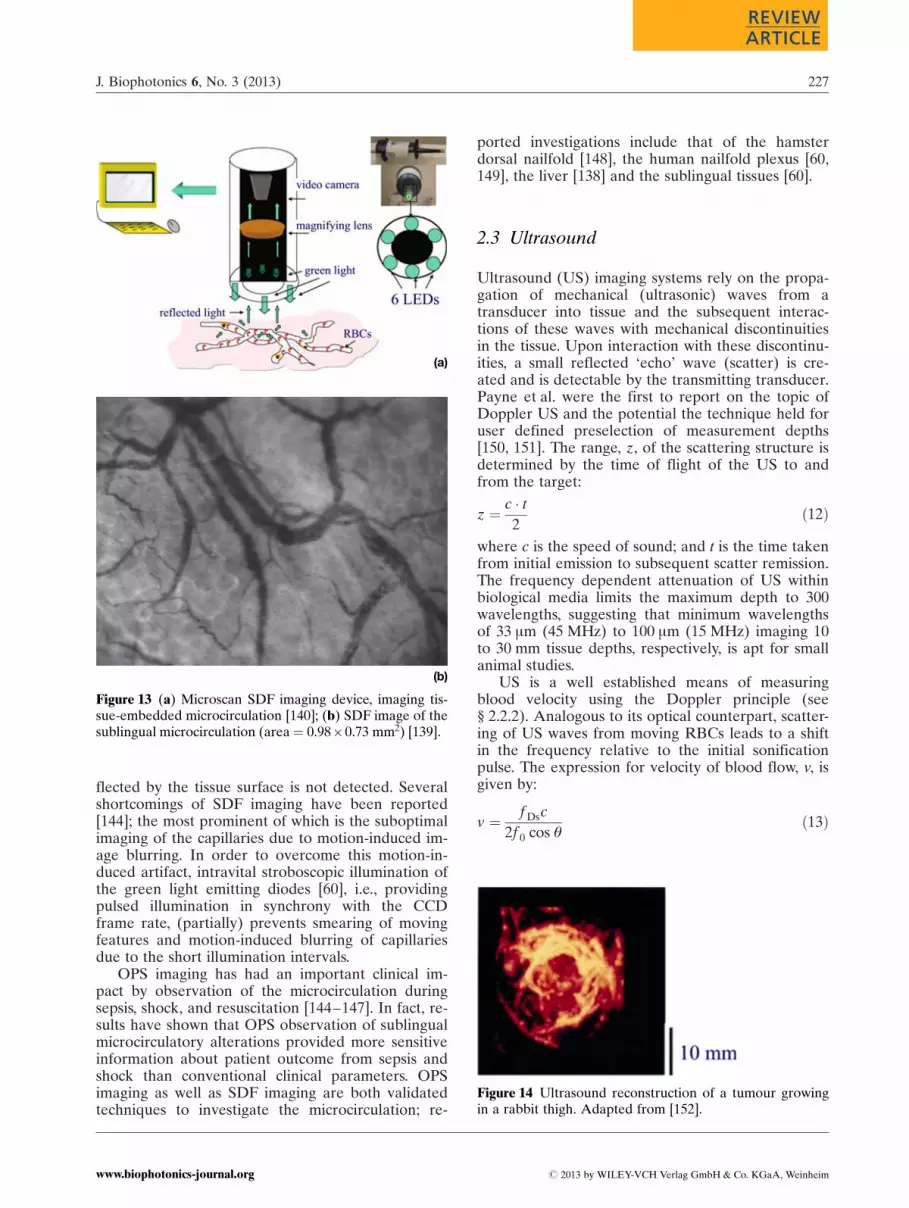
flected by the tissue surface is not detected. Severalshortcomings of SDF imaging have been reported[144]; the most prominent of which is the suboptimalimaging of the capillaries due to motion-induced im-age blurring. In order to overcome this motion-in-duced artifact, intravital stroboscopic illumination ofthe green light emitting diodes [60], i.e., providingpulsed illumination in synchrony with the CCDframe rate, (partially) prevents smearing of movingfeatures and motion-induced blurring of capillariesdue to the short illumination intervals.
OPS imaging has had an important clinical im-pact by observation of the microcirculation duringsepsis, shock, and resuscitation [144–147]. In fact, re-sults have shown that OPS observation of sublingualmicrocirculatory alterations provided more sensitiveinformation about patient outcome from sepsis andshock than conventional clinical parameters. OPSimaging as well as SDF imaging are both validatedtechniques to investigate the microcirculation; re-
ported investigations include that of the hamsterdorsal nailfold [148], the human nailfold plexus [60,149], the liver [138] and the sublingual tissues [60].
2.3 Ultrasound
Ultrasound (US) imaging systems rely on the propa-gation of mechanical (ultrasonic) waves from atransducer into tissue and the subsequent interac-tions of these waves with mechanical discontinuitiesin the tissue. Upon interaction with these discontinu-ities, a small reflected ‘echo’ wave (scatter) is cre-ated and is detectable by the transmitting transducer.Payne et al. were the first to report on the topic ofDoppler US and the potential the technique held foruser defined preselection of measurement depths[150, 151]. The range, z, of the scattering structure isdetermined by the time of flight of the US to andfrom the target:
z ¼ c � t2
ð12Þ
where c is the speed of sound; and t is the time takenfrom initial emission to subsequent scatter remission.The frequency dependent attenuation of US withinbiological media limits the maximum depth to 300wavelengths, suggesting that minimum wavelengthsof 33 mm (45 MHz) to 100 mm (15 MHz) imaging 10to 30 mm tissue depths, respectively, is apt for smallanimal studies.
US is a well established means of measuringblood velocity using the Doppler principle (see§ 2.2.2). Analogous to its optical counterpart, scatter-ing of US waves from moving RBCs leads to a shiftin the frequency relative to the initial sonificationpulse. The expression for velocity of blood flow, v, isgiven by:
v ¼ f Dsc
2f 0 cos qð13Þ
(a)
(b)
Figure 13 (a) Microscan SDF imaging device, imaging tis-sue-embedded microcirculation [140]; (b) SDF image of thesublingual microcirculation (area¼ 0.98�0.73 mm2) [139].
Figure 14 Ultrasound reconstruction of a tumour growingin a rabbit thigh. Adapted from [152].
J. Biophotonics 6, No. 3 (2013) 227
REVIEWREVIEWARTICLEARTICLE
# 2013 by WILEY-VCH Verlag GmbH & Co. KGaA, Weinheimwww.biophotonics-journal.org
where f Ds is the Doppler frequency shift, f 0, the so-nification frequency, c, the local speed of sound, andq, the angle between the axis of beam propagationand the flow velocity vector.
Recent work has been undertaken to examinethe potential of US Doppler findings of tumourstage and/or patient prognosis [153–155]. It is, how-ever, clear that these methods are sensitive only tolarge vessel flow, i.e. arterioles and venules largerthan about 50 mm. Despite this, the development ofhigh frequency micro-US [156, 157] and Doppler,has facilitated the non-invasive imaging of micro-scopic structure and blood flow with improved spa-tial resolution. The intensity of scatter echoes de-pends on the reflective property of the tracers [4].The introduction of US microbubble contrast agents(diameter less than 1 to 5 mm) has created a signifi-cant opportunity for visualisation of the microcircu-lation [158, 159] by enabling anatomical and func-tional aspects to be visualised and quantified. Due tothese improvements in US imaging, the modality isnow ripe to be exploited in a plethora of clinical ap-plications. Efforts are underway to use the US tech-nology in prostate imaging [160], neonatal imaging[161], skin and ocular imaging [162] and a widerange of intraluminal imaging applications [163]. Theextensive applicability of US in the clinical domainmay be seen from its qualitative and prognostic as-sessment of cardiovascular disease [164], develop-mental biology [165], musculoskeletal disease [166],arteriosclerosis [164] and a wide variety of othermanifestations of human disease.
2.4 Magnetic resonance imaging
Magnetic Resonance Imaging (MRI) was first sug-gested by Lauterbur [167] and, independently, byMansfield and Grannell [168]. Nuclei with an oddnumber of protons, neutrons or both, have an intrin-sic nuclear spin [169, 170]. Ordinarily, nuclei spinwith their axes randomly aligned. The potential en-ergy of the magnetic momentum in a homogeneousexternal magnetic field depends on the direction ofmomentum. The magnetic momentum of a proton(e.g. hydrogen atom) of low potential energy (i.e.parallel momentum and field vectors) can be flippedto a higher energy state (anti parallel vectors) by ab-sorption of a photon of exactly the missing energydifference between these two states [4] – this is re-ferred to as nuclear magnetic resonance. The nucleusreverts/realigns to its normal state via emission of aphoton, whose frequency is dependent on the energydifference between the normal and excited spinstates. It is this motion that is used to construct a 3Dimage composed of information from the strata ofthe object; this depth information is obtained by
transmitting multiple radio waves at differing fre-quencies in space [169].
Contrast agents [172] are frequently used in MRIstudies as a means of improving the visibility of in-ternal body structures by contrast enhancement, themost common of which are gadolinium-based [173].As tissue is approximately diamagnetic, a paramag-netic vascular contrast agent would change the envir-onment and alter the relaxation times of tissues andbody cavities in which they are present. Barium sul-fate is commonly used as a means of signal enhance-ment in the gastrointestinal tract, but natural pro-ducts high in manganese (e.g. green tea) serve thesame purpose [174].
In the days of MRI’s infancy, signals from dy-namic tissue constituents (e.g. RBCs) were consid-ered an insidious nuisance as it generated frequentartifacts which detracted from image quality. In duecourse, it was realised that these apparently errantsignals could be exploited to generate diagnosticquality images of blood vessels. For example, phasecontrast velocity MRI [175] estimates the phaseshift of hydrogen nuclei as they pass through a mag-netic field and this phase change is proportional tovelocity [176]. Other methods of time-resolved con-trast-enhanced functional assessment have sincebeen introduced, for example, time-of-flight MR an-giography (TOF MRA) [177] and contrast-enhancedMR-angiography (CEMRA) [178]. Contrast-en-hanced techniques such as MRI offer unrivalledspatial and temporal resolution, in addition to hav-ing good soft tissue contrast and depth of penetra-tion without any loss in sensitivity or resolution [29,179]. However, it is an expensive research tool interms of initial purchase and subsequent mainte-
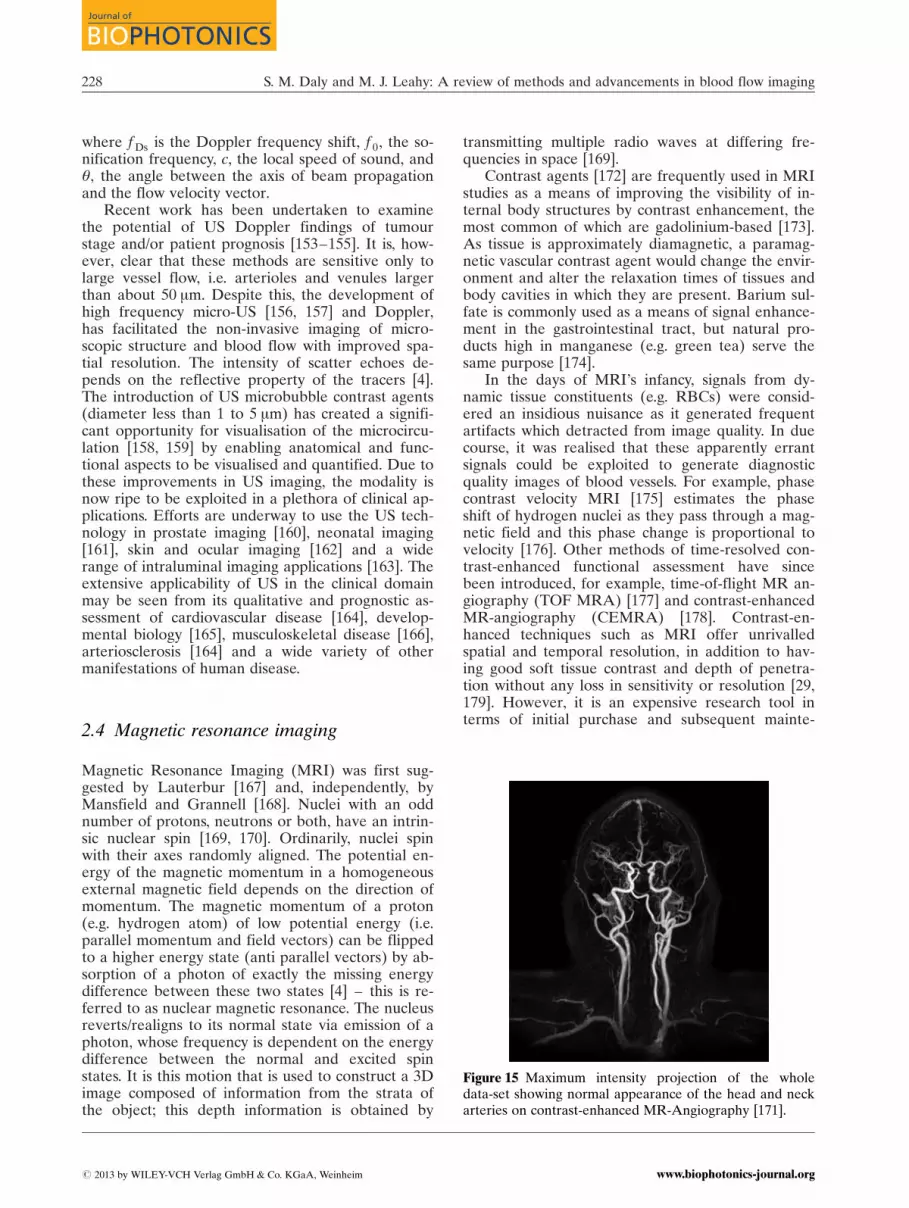
Figure 15 Maximum intensity projection of the wholedata-set showing normal appearance of the head and neckarteries on contrast-enhanced MR-Angiography [171].
S. M. Daly and M. J. Leahy: A review of methods and advancements in blood flow imaging228
Journal of
BIOPHOTONICS
# 2013 by WILEY-VCH Verlag GmbH & Co. KGaA, Weinheim www.biophotonics-journal.org

nance, requiring experienced operators. Image ren-dering is very time consuming, implying the techni-que is more suited to recordings of steady state con-ditions rather than transient phenomena. Moreover,MRI has not been well validated in terms of the mi-crocirculation [180]. Nevertheless, functional MRIhas become a most important tool for cognitive re-search since the latter part of the 20th century, withsome of its most important applications being foundin oncological studies [181, 182], cardiac perfusionand monitoring [183, 184] and neurological imaging[185, 186].
2.5 Positron emission tomography
Functional imaging with positron-emitting isotopeswas first proposed as an imaging technique thatcould offer greater sensitivity with single photon-emitting isotopes than conventional nuclear medi-cine techniques [187]. It was recognised that high-energy photons produced by the annihilation of po-sitron-emitting isotopes could be used to describethe physiological distribution of ‘tagged’ chemicalcompounds [188]. Positron emission tomography(PET) is a nuclear medicine imaging techniquewhich utilises exogenous and endogenous contrastmechanisms (i.e. ‘tracers’) to yield a 3D image of in-trinsic functional processes and/or changes of regio-nal blood flow in various anatomic structures.
The PET process is multifaceted. Imaging beginswith a biological molecule that carries a positron-emitting isotope (a ‘tracer’) injected into the patient.15O, 13N, 11C and 18F are considered among the mostimportant radionuclides for medical applications ofPET [189]. Over time, this isotope accumulates in anarea of the body for which the attached moleculehas an affinity; e.g. 11C accumulates in the brain ortumours where glucose is the primary source of en-ergy [188]. The radioactive nuclei decay by positronemission and the emitted positron undergoes annihi-lation with an electron from the surroundings. Theenergy associated with this process divides equallybetween two photons (i.e. high energy g-rays) whichfly from each other at a 180� angle. An array of de-tectors surrounding the patient senses the g-ray ra-diation (provided the line of coincidence is correct)and distribution of the positron-emitting tracer iscomputed via tomographic reconstruction proce-dures from the recorded projection data.
PET images qualitatively assess sites of unusualtracer accumulations (tumour sites) and quantita-tively measure the tracer uptake for an assessmentof the staging of a disease [188]. However, the use ofradionuclides is not only invasive, as outlined in§ 2.1.1, but the use of such may induce patient-speci-fic complications. Furthermore, PET utilises ionising
Figure 16 PET images of average cerebral blood flowfor baseline, hypercapnia2 and hypocapnia3 conditions.Adapted from [190].
radiation in its operation, and resulting images tendto be of poor resolution (in the order of mm [191])in comparison to other methods. In spite of this, theability of PET to analyse disease progression is welldocumented, for example, in Alzheimer’s disease[192, 193] (see Figure 16); Parkinson’s disease [194,195]; epilepsy [196–198]; visualisation of the heart[199] and afflictions such as coronary artery disease[200]. PET has also been shown to be effective in lo-cating metastatic disease in the breast [191], lung [201]and lower gastrointestinal tract [202], in addition todistinguishing between both benign and malignantcancer [203, 204].
Micro positron emission tomography (micro-PET) is an advanced form of current PET technol-ogy [205]. It provides information pertaining to thefunction of living organisms with very high sensitiv-ity, high signal-to-noise ratio, and requires minimaluse of radioisotopes (e.g. nanoparticles) for detectingphysiological characteristics. Nowadays, PET is al-ways combined with CT to put the function in astructural context.
2 Hypercapnia: an excess of carbon dioxide in the blood.3 Hypocapnia: abnormally low levels of carbon dioxide in theblood.
J. Biophotonics 6, No. 3 (2013) 229
REVIEWREVIEWARTICLEARTICLE
# 2013 by WILEY-VCH Verlag GmbH & Co. KGaA, Weinheimwww.biophotonics-journal.org
3. Optical sectioning techniques
3.1 Histological staining
An essential tool of biology and medicine, histologyis the study of the anatomy of cells and tissues viaexamination by microscopy, subsequent to sectioningand apt staining. As biological tissue has little inher-ent contrast in either light or electron microscopy,staining is employed to provide contrast and to high-light particular features of interest. Micro-ComputedTomography is one of the most common microscopymethods which employs histology (see § 3.3).
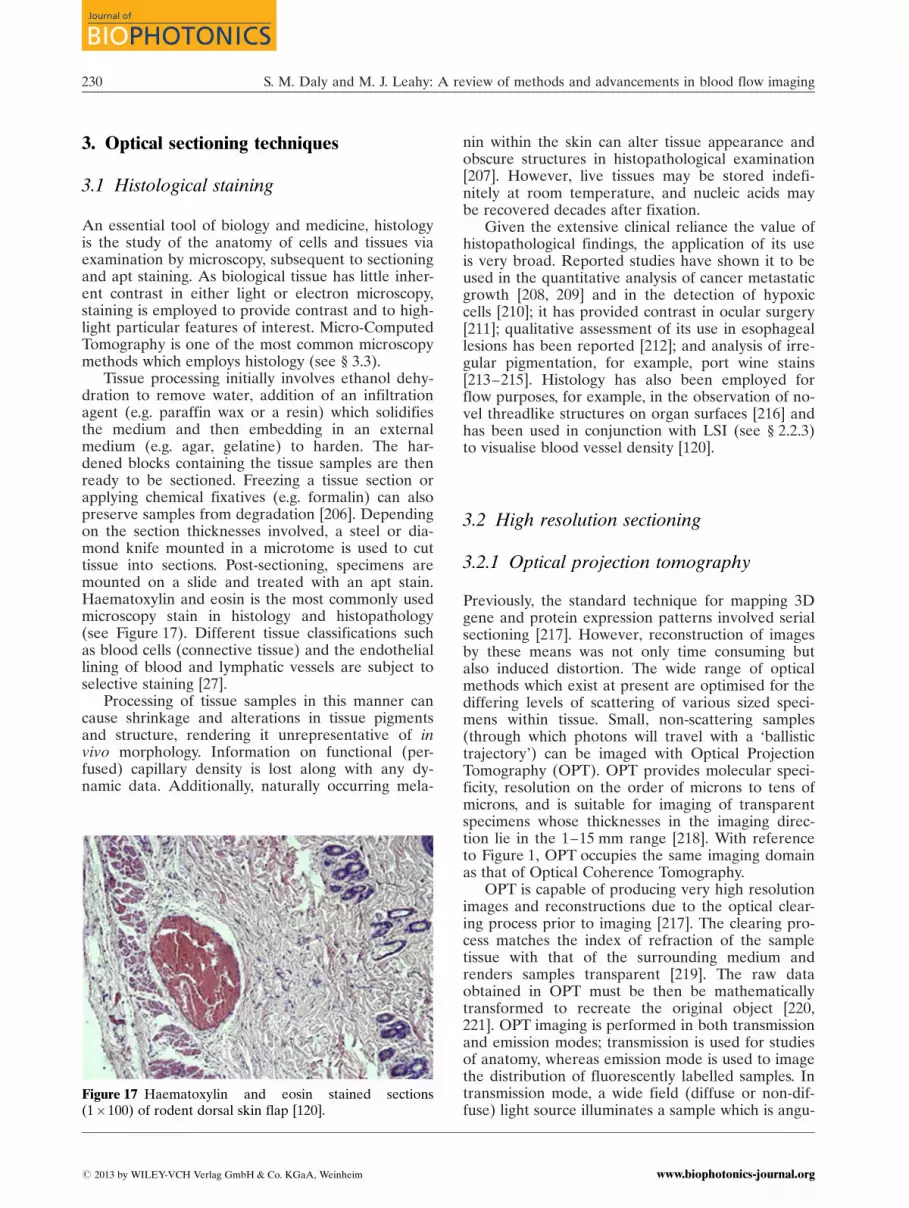
Tissue processing initially involves ethanol dehy-dration to remove water, addition of an infiltrationagent (e.g. paraffin wax or a resin) which solidifiesthe medium and then embedding in an externalmedium (e.g. agar, gelatine) to harden. The har-dened blocks containing the tissue samples are thenready to be sectioned. Freezing a tissue section orapplying chemical fixatives (e.g. formalin) can alsopreserve samples from degradation [206]. Dependingon the section thicknesses involved, a steel or dia-mond knife mounted in a microtome is used to cuttissue into sections. Post-sectioning, specimens aremounted on a slide and treated with an apt stain.Haematoxylin and eosin is the most commonly usedmicroscopy stain in histology and histopathology(see Figure 17). Different tissue classifications suchas blood cells (connective tissue) and the endotheliallining of blood and lymphatic vessels are subject toselective staining [27].
Processing of tissue samples in this manner cancause shrinkage and alterations in tissue pigmentsand structure, rendering it unrepresentative of invivo morphology. Information on functional (per-fused) capillary density is lost along with any dy-namic data. Additionally, naturally occurring mela-
nin within the skin can alter tissue appearance andobscure structures in histopathological examination[207]. However, live tissues may be stored indefi-nitely at room temperature, and nucleic acids maybe recovered decades after fixation.
Given the extensive clinical reliance the value ofhistopathological findings, the application of its useis very broad. Reported studies have shown it to beused in the quantitative analysis of cancer metastaticgrowth [208, 209] and in the detection of hypoxiccells [210]; it has provided contrast in ocular surgery[211]; qualitative assessment of its use in esophageallesions has been reported [212]; and analysis of irre-gular pigmentation, for example, port wine stains[213–215]. Histology has also been employed forflow purposes, for example, in the observation of no-vel threadlike structures on organ surfaces [216] andhas been used in conjunction with LSI (see § 2.2.3)to visualise blood vessel density [120].
3.2 High resolution sectioning
3.2.1 Optical projection tomography
Previously, the standard technique for mapping 3Dgene and protein expression patterns involved serialsectioning [217]. However, reconstruction of imagesby these means was not only time consuming butalso induced distortion. The wide range of opticalmethods which exist at present are optimised for thediffering levels of scattering of various sized speci-mens within tissue. Small, non-scattering samples(through which photons will travel with a ‘ballistictrajectory’) can be imaged with Optical ProjectionTomography (OPT). OPT provides molecular speci-ficity, resolution on the order of microns to tens ofmicrons, and is suitable for imaging of transparentspecimens whose thicknesses in the imaging direc-tion lie in the 1–15 mm range [218]. With referenceto Figure 1, OPT occupies the same imaging domainas that of Optical Coherence Tomography.
OPT is capable of producing very high resolutionimages and reconstructions due to the optical clear-ing process prior to imaging [217]. The clearing pro-cess matches the index of refraction of the sampletissue with that of the surrounding medium andrenders samples transparent [219]. The raw dataobtained in OPT must be then be mathematicallytransformed to recreate the original object [220,221]. OPT imaging is performed in both transmissionand emission modes; transmission is used for studiesof anatomy, whereas emission mode is used to imagethe distribution of fluorescently labelled samples. Intransmission mode, a wide field (diffuse or non-dif-fuse) light source illuminates a sample which is angu-
Figure 17 Haematoxylin and eosin stained sections(1�100) of rodent dorsal skin flap [120].
S. M. Daly and M. J. Leahy: A review of methods and advancements in blood flow imaging230
Journal of
BIOPHOTONICS
# 2013 by WILEY-VCH Verlag GmbH & Co. KGaA, Weinheim www.biophotonics-journal.org

larly rotated stepwise; the light transmitted in thisstepwise fashion is captured using a CCD micro-scope (see Figure 18). Similarly, in emission mode,wide field illumination of apt wavelength excites thesame rotating sample and the emitted fluorescence iscaptured using in the same manner as transmissionmode.
Generally, transmission and emission modes areused concurrently to render fluorescent visualisa-tions against a morphological backdrop. As is thecase with many optical imaging techniques, tradeoffsexist in their operation in terms of resolution anddepth of field. For instance, partially closing the irisof the system in both transmission and emission
modes of OPT increases the depth of field of the sys-tem, thus degrading the image resolution [217]:
DOFmax ¼ hbath1:305l
NA2
� �ð14Þ
where DOFmax is the maximum depth of fieldachievable by the system; NA is the system numeri-cal aperture; hbath, the refractive index of the materi-al in which samples are suspended. Organic solventswhich act as index-matching agents are, however,generally toxic. Resultantly, analysis of live speci-mens is restricted to those that are already ade-quately transparent, e.g. small embryonic tissue. Useof a wide-field CCD in OPT operation causes someof the pixel noise to be generated by multiply scat-tered photons that were emitted from regions of thetissue that do not lie on the intended projection forthat pixel. Use of a laser scanning approach rendersless noise at a given pixel, in a manner analogous tothe use of laser scanning in confocal imaging [223].
In addition to its use in developmental biology,OPT microscopy has the potential for use in medicalapplications for which knowledge of the 3D structuremay be useful, but not readily accessible from histo-pathological sections (see § 3.1). Given OPT’s versa-tility in its ability to simultaneously record both ab-sorption and emission profiles, it is particularly usefulin performing gene expression analysis [222–224].
OPT has been shown to reveal superb sectioningability, useful for reconstructing vertebrate embryosand in the examination of the 3D anatomy of devel-oping organs [222, 224, 225] (see Figure 18); model-ling of early human brain development [226]; 3Dimaging of isolated cell nuclei [227]. With regard tocontributions this technique has made to the knowl-edge of flow and related dynamics, OPT has beenshown to be applicable in studies of gas-solids flowto analyse particle concentration [228]; general flowrate analyses [229, 230]; cell tracing [231]; and thespatiotemporal analysis of zebrafish [232].
3.2.2 Stimulated emission depletionmicroscopy
Since the research of Abbe, it has been consideredthat the resolution limit of light microscopy based onfocusing optics had been reached [233]. Einstein’snotion of de-exciting a quantum system by stimu-lated emission has not only facilitated the inventionof the laser but also of stimulated emission depletion(STED), a super-resolution microscopy techniquewhich utilises the non-linear de-excitation of fluores-cent dyes to overcome the resolution limit imposedby diffraction. This has resulted in resolution im-provements by a factor of 10–12 [234–236] with afocal plane resolution greater than 6 nm achievable
(a)
(b)
Figure 18 (a) Schematic of OPT microscopy setup [220];(b) false-colour image of a mouse embryo, stained with al-cian blue and then scanned by OPT [222].
J. Biophotonics 6, No. 3 (2013) 231
REVIEWREVIEWARTICLEARTICLE
# 2013 by WILEY-VCH Verlag GmbH & Co. KGaA, Weinheimwww.biophotonics-journal.org

[237], surpassing that of current high-end X-ray mi-croscopy [238].
The intensity distribution of the excitation lightin the focal plane of the lens is determined by dif-fraction and described by the point-spread function(PSF) [239],
hexcðnÞ ¼ const:2J1ðnÞ
n
���� ����2 ð15Þ
where J1 is the first-order Bessel function;
n ¼ 2p � r �NAlexc
; r is the distance from the focal point;
NA, numerical aperture; and lexc is the excitationwavelength. One possible way to reduce the spatialextent of hexc(n) is to inhibit the fluorescence in itsouter regions; this is equivalent to an increase in re-solution [234]. Employment of an additional STEDlaser beam (see Figure 19 (center)) inhibits fluores-cence by being focused with small lateral offsets�Dn with respect to the excitation beam and over-laps with the excitation beam on either side. Thus,the STED beam depletes the excited state beforefluorescence takes place via stimulated emission andonly the innermost region of hexc(n) remains whichcontributes to the fluorescence signal.
The first experimental confirmation of the super-ior lateral resolution of this non-invasive STED
technique was demonstrated by separation of adja-cent Pyridine nanocrystals [240] that are otherwiseindiscernible.
Chromophores, such as haemoglobin, absorb buthave undetectable fluorescence because the sponta-neous emission is dominated by their fast non-radia-tive decay. STED competes effectively with this non-radioactive decay, providing a new contrast mechan-ism which has been investigated in the vascular net-work of a nude mouse ear [241]. In addition, STEDhas been implemented in nanofluidic studies [242,243] with reported spatial resolutions better than70 nm; and in protein flow cytometry research [244].
3.3 Micro-computed tomography
The basis of all computed tomography techniques isthe ordered collection of X-ray projected data frommultiple angles in space [245]. Many comparisonsmay be drawn between the working principles of mi-cro-computed tomography (micro-CT) and those ofOPT (see § 3.2.1). 3D images of vasculature are ob-tainable by micro-CT imaging, with resolution onthe micron scale.
A micro-CT system comprises three basic ele-ments: an x-ray source; the conversion electronics;and a method for either rotating the specimen or ro-tating the scanner around the specimen. This experi-mental setup is very similar to that of Figure 18(a),substituting bright-field illumination with an X-raysource. To generate 3D volume data, methods suchas cone beam reconstruction [246] are used to con-vert the projection data into a stack of slices [245];this may be further extended into filtered back pro-jection methods, as is the case in OPT.
As an X-ray penetrates an object in transmissionmode, it is exponentially attenuated by the materialalong its path in the same manner as described bythe Beer-Lambert law in Eq. (2). However, the mainlimitation of micro-CT relates to contrast; as the ab-sorption of X-rays by soft tissues or optical colouredstains is low, this causes difficulties in the simulta-neous imaging tissue structure and analysis of geneexpression, respectively [248]. In addition, imagequality is inherently related to X-ray dose, a concernthat is particularly relevant for in vivo studies (e.g.
Figure 19 Measured focal spotsfor excitation (left: 470 nm; blue),STED (center: 603 nm, orange) andeffective spot (right: 22 nm, green)[236].
Figure 20 Maximum intensity projection (red channel) sti-mulated emission ex vivo imaging of mouse ear microvas-culature based on endogenous haemoglobin contrast. Inthe magnified image, individual RBC rouleaux are visiblewithin a single capillary [241].
S. M. Daly and M. J. Leahy: A review of methods and advancements in blood flow imaging232
Journal of
BIOPHOTONICS
# 2013 by WILEY-VCH Verlag GmbH & Co. KGaA, Weinheim www.biophotonics-journal.org

the potential for radiation damage to the specimen,thereby altering the physiology). High spatial resolu-tion requires high doses, and a reduction in dosecauses higher image noise and reduced image con-trast [249].
The modulation transfer function (MTF) of animaging system is a common comparator for micro-CT spatial resolution [245, 250]:
MTFðrÞ ¼Ðþ1�1
exp ð�j2prxÞ ½LSFðxÞ� dx
���������� ð16Þ
where r represents spatial frequency; and LSF is theintegral of the point spread function. In any realimaging system, the MTF is non-ideal and valuesdrop progressively at higher spatial frequencies. Re-sultantly, small vessel diameters appear to broadenand this causes inaccuracies in CT-values. However,improvements in scanner components have madebench-top nano-CT units feasible, having the abilityto image at cellular and subcellular levels with voxelresolutions on the order of 500 nm [249].
Micro-CT provides high resolution 3D volumetricdata, suitable for analysis, quantification, validationand visualisation of vasculature. Reported studiesfor the use of micro-CT include the assessment of in-
duced or implanted disease models [251, 252]; screen-ing for anatomical abnormalities and/or changes inlive animals [253]; assessing angiogenesis during frac-ture healing [254]; in morphological studies, for ex-ample, the rodent renal vasculature [255, 256]; andthe assessment of cancer staging for predictions ofmetastatic relapse [257]. Micro-CT has also branchedinto the realm of fluid dynamic simulations in, for in-stance, the mouse aorta [258, 259] and assessment ofcoronary artery disease [260]. Although in vivo mi-cro-CT imaging is still in its infancy, the possible im-plications and applications of its use in biomedical re-search is potentially far-reaching.
3.4 Confocal & two-photon imaging
The previously described methods of Optical projec-tion tomography and Stimulated emission depletionmicroscopy (§ 3.2.1, § 3.2.2) both utilise fluorescencein their operation. However, a severe problem withepi-fluorescence is the unwanted contribution of sig-nals from structures above and below the focalplane; this can produce a background glow that cancause image degradation [261]. This is surmountedby employing the principles of confocal imaging.
Geometrically speaking, confocal means havingthe same foci. In the confocal regime, an object isilluminated with a small (diffraction limited) spot,usually derived from a focused laser beam. An ob-jective lens replaces that of the conventional micro-scope condenser and the field of illumination is lim-ited by a pinhole positioned on the microscope axis.This spatially restricts the optical system so that onlysignals emanating from the focal point are detected.Both the intensity of illumination and the sensitivityof the detector fall rapidly with distance away fromthe focal plane. Thus, light scattered from parts otherthan the illuminated point on the specimen is re-jected from the optical system (by the exit pinhole)resulting in reduced blurring from light scattering,improved effective resolution and signal-to-noise ra-tio [262]. This technique may be used in both trans-
Figure 21 High-resolution micro-CT vascular tree 3D vol-ume rendering of ligated hindlimb of the mouse; skeletalstructure is included for clarity [247].
Figure 22 Microscope schematicfor (a) confocal and (b) two-photonmethods.
J. Biophotonics 6, No. 3 (2013) 233
REVIEWREVIEWARTICLEARTICLE
# 2013 by WILEY-VCH Verlag GmbH & Co. KGaA, Weinheimwww.biophotonics-journal.org
mitting and epi-illuminating modes, and an image ofthe complete specimen is built up by a raster scan-ning. Reported resolutions have been of the orderof 100 nm [5]; however, with 4-Pi methods an axialresolution of 100 nm and a localisation accuracy of<10 nm in fixed and immune-labelled specimens[263].
As described above, confocal microscopy drama-tically reduces the contribution of fluorescence fromthe out-of-focus regions of a specimen. However, re-gions above and below the focal plane are still ex-posed to the full intensity of the excitation light and‘parasitic’ fluorescence in every direction, convergingand diverging from the illuminated spot in the focalplane. Resultantly, biological specimens still suc-cumb to photon-induced damage and rapid fluores-cent bleaching. These shortcomings are circum-vented by two-photon microscopy [264, 265], andhas been extended to the practice of multiphoton(i.e. more than 2) fluorescence microscopy [262].
The challenges posed by the confocal methodsmay be surmounted by outputting an intense IR la-ser pulse which induces fluorescence in the blue orUV excitable fluorophore at the focal spot of thesystem only. At this position, the coherent electro-magnetic field strength is so high that its acts non-linearly to excite chromophores at twice the fre-quency of the IR pulse, inducing an electronic transi-tion equivalent to the absorption of a single photon,possessing twice as much energy [266]. The excitedfluorophore can then emit a single photon of fluores-cence. As a result, fluorophores above and belowthe focus do not experience the fluorescence effectsof the two-photon methods and are therefore neitherexcited nor damaged. Additionally, two-photon mi-croscopy permits confocal imaging of planes muchdeeper in the tissue (new approaches have led todepths of almost 1 mm [267]) with considerably high-er light coupling efficiency, with less bleaching anddamage outside of the focal plane [264, 268, 269].For very thin objects such as isolated cells, confocalmicroscopy produces images with higher optical re-solution due to the shorter excitation wavelengths.Nonetheless, the superior optical sectioning and lightdetection capabilities of the two-photon modality re-sults in better performance in highly scattering tis-sue.
The biggest advantage of 3D optical sectioningapproaches such as confocal microscopy and two-photon microscopy [270], is their ability to visualisebiologically significant molecular distributions withina single specimen. However both techniques do suf-fer some shortcomings. Although the confocal princi-ple allows clear imaging within semitransparent tis-sue, turbid media causes scattering and absorption oflight thus diminishing the ability to image withdepth. This limits the actual useful depth of confocalimaging to around 100–200 mm [262] even with the
use of near IR illumination which is more penetrat-ing than visible light [271–273]. Moreover, use of IRillumination for imaging itself reduces image resolu-tion, due to the longer wavelength for a given nu-merical aperture [271]. The pulsed lasers requiredfor two-photon excitation are much more expensivethan the continuous wave versions used in confocalmicroscopy. In addition, despite the fact that the invivo resolution provided by multiphoton imaging isreportedly superior to that offered by MRI andPET, the necessity of either thinning or removing aportion of the skull for imaging the brain surface im-pedes the potential clinical applicability of this tech-nique [274].
Yet, despite these limiting factors, confocal andtwo-photon imaging have been used in a wide vari-ety of applications: rodent cerebral microcirculationinvestigations [275–278]; used in conjunction withparticle image velocimetry (see § 4.1) to investigatemicro-channel blood flow [279]; as a quantitativemethod in the study of embryonic vasculature dy-namics [280, 281]; dynamic studies of Alzheimer’sdisease and epilepsy [274]; and in cytometric studiesof the relationships between stem cells [282], tumourcells [283] and their tissue environments [284, 285].
3.5 Photoacoustic tomography & microscopy
Purely optical imaging in biological media is ham-pered with the either imaging depth or spatial reso-lution trade-offs, owing to strong optical scattering.Purely ultrasonic (USn) imaging may improve uponthese limiting factors in the optical (quasi-) diffusiveregime, due to the fact that USn scattering is 2–3orders of magnitude weaker than optical scattering[250]. Photoacoustic tomography (PAT) refers toimaging based upon the tenets of the photoacousticeffect. If an object is irradiated with a short-pulsedlaser beam, some of radiation is absorbed and par-tially converted into heat. This heat causes a pres-sure rise via localised thermoelastic expansion, andthis pressure rise propagates as a USn or photo-acoustic (or optoacoustic) wave. Detection of thesesignals by an array of transducers allows reconstruc-tion of the light absorption distribution and deduc-tion of information on the distribution of absorbinginclusions in tissue. A typical PAT system uses anunfocused US detector to acquire the photoacoustic(PA) signals, and the image is reconstructed by in-versely solving the photoacoustic equations (e.g.backprojection algorithms based on time-reversalmethods [286–289]).
PAT is an optical absorption based modality, withcontrast and resolution based on the PA excitationphase and PA emission phase (derived from theUSn detection), respectively. In PAT, NIR light is
S. M. Daly and M. J. Leahy: A review of methods and advancements in blood flow imaging234
Journal of
BIOPHOTONICS
# 2013 by WILEY-VCH Verlag GmbH & Co. KGaA, Weinheim www.biophotonics-journal.org
used as it is in this wavelength range (and that of thevisible wavelengths) that haemoglobin dominates softtissue optical absorption, producing functional net-work maps of haemoglobin oxygen saturation in thevasculature [290]. If an isosbestic point is selected forimaging, the PA signal represents total haemoglobinconcentration, irrespective of oxygenation.
The generation and propagation of a PA wave inan inviscid medium may be described by the follow-ing [250]:
r2 � 1
v2S
@2
@t2
!pðr; tÞ ¼ � b
kv2S
@2Tðr; tÞ@t2 ð17Þ
where vS; is the speed of sound; t, time; pðr; tÞ, theacoustic pressure at location r and time t; b, thermalcoefficient of volume expansion; k, isothermal com-pressibility; and T, temperature rise. The spatial re-solution (Dx) of a PAT system is determined by thefrequency bandwidth of the PA signal detectors (Df )[286]:
Dx vS
Dfð18Þ
PAT combines the advantageous aspects of opticaldiffusion tomography and conventional US imaging,with achievable spatial resolutions on the order of0:1–10 mm (frequency bandwidth dependent) andimaging depths of several cm.
Intravital microscopy is the current ‘gold stand-ard’ for imaging of dynamic microvascular regula-tion [291]; however, it is generally invasive and lackscrucial morphological parameters such as depth in-formation. PA microscopy (PAM) overcomes theselimitations by being reliant on endogenous opticalcontrast, working non-invasively in reflection modewith time-resolved depth detection.
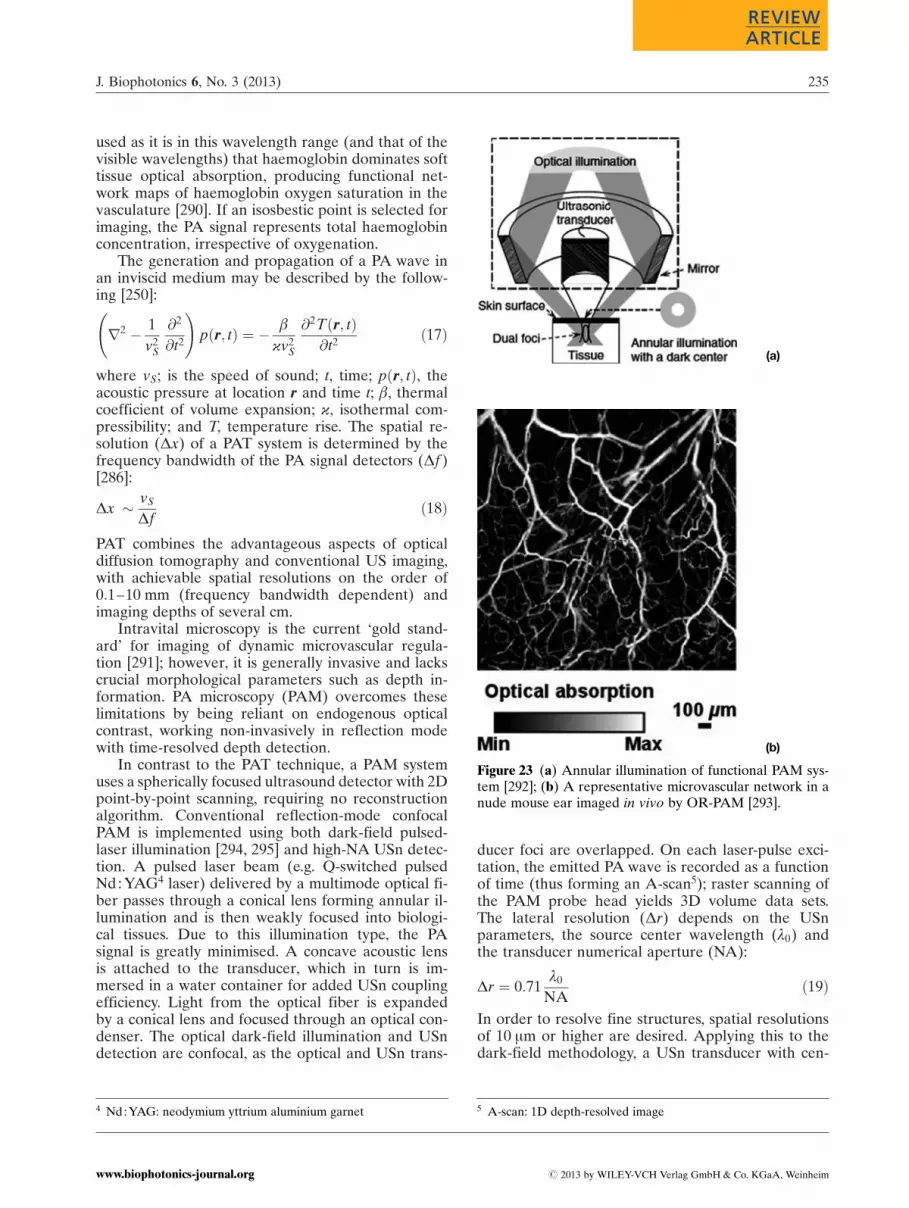
In contrast to the PAT technique, a PAM systemuses a spherically focused ultrasound detector with 2Dpoint-by-point scanning, requiring no reconstructionalgorithm. Conventional reflection-mode confocalPAM is implemented using both dark-field pulsed-laser illumination [294, 295] and high-NA USn detec-tion. A pulsed laser beam (e.g. Q-switched pulsedNd : YAG4 laser) delivered by a multimode optical fi-ber passes through a conical lens forming annular il-lumination and is then weakly focused into biologi-cal tissues. Due to this illumination type, the PAsignal is greatly minimised. A concave acoustic lensis attached to the transducer, which in turn is im-mersed in a water container for added USn couplingefficiency. Light from the optical fiber is expandedby a conical lens and focused through an optical con-denser. The optical dark-field illumination and USndetection are confocal, as the optical and USn trans-
ducer foci are overlapped. On each laser-pulse exci-tation, the emitted PA wave is recorded as a functionof time (thus forming an A-scan5); raster scanning ofthe PAM probe head yields 3D volume data sets.The lateral resolution (Dr) depends on the USnparameters, the source center wavelength (l0) andthe transducer numerical aperture (NA):
Dr ¼ 0:71l0
NAð19Þ
In order to resolve fine structures, spatial resolutionsof 10 mm or higher are desired. Applying this to thedark-field methodology, a USn transducer with cen-
(a)
(b)
Figure 23 (a) Annular illumination of functional PAM sys-tem [292]; (b) A representative microvascular network in anude mouse ear imaged in vivo by OR-PAM [293].
4 Nd : YAG: neodymium yttrium aluminium garnet 5 A-scan: 1D depth-resolved image
J. Biophotonics 6, No. 3 (2013) 235
REVIEWREVIEWARTICLEARTICLE
# 2013 by WILEY-VCH Verlag GmbH & Co. KGaA, Weinheimwww.biophotonics-journal.org

ter frequency of 400 MHz is required; however, thislimits the penetration depth to <100 mm. Spatial re-solution in dark-field PAM is limited by USn pa-rameters (<50 mm), and is thus unable to resolve ar-tifacts on the arteriole, venule and capillary scale[292, 296]. By employing techniques such as diffrac-tion-limited optical focusing (OR-PAM) [297], reso-lution improvements on the order of 5 mm or greaterare obtainable.
The PA Doppler (PAD) effect [298–300] is thecombination of the production of an acoustic wavefrom a light-absorbing medium and the shifting ofthis wave when it has a motion relative to a detector.Consider a light absorbing-particle suspended in a li-quid is moving at a velocity v and an intensity-modu-lated laser beam illuminates the particle at an anglea. The particle undergoes the PA process and resultsin the formation of an acoustic wave which are col-lected in a solid angle W by a USn transducer. Dop-pler shifts values depend on q, the angle betweenthe flow path of the particle and the transducer. ThePAD shift (f PAD) of the PA wave along a typical an-gle q may be expressed as [300]:
f PAD ¼ f M
v cos q
nSð20Þ
where f M is the modulation frequency; and nS is thevelocity of the moving scattering object. In § 2.2.2,the method of laser Doppler flowmetry was out-lined; a principle disadvantage of this method is itslimited measuring depth and loss of flow directionalinformation due to multiple light scattering. With thePAD methods, however, this is no longer an issue.Additionally, as light-absorbing particles are used asflow tracers, lower background noise and higher de-tection contrast result.
PA techniques are frequently used in cerebral mi-crovascular imaging [301] (see Figure 23(b)) andcancer detection. Enhanced angiogenesis is typicalfor malignant tumours from onset and thereforePAT allows for early tumour detection and diagnosis[302, 303]. These methods have also been utilised inthe assessment of absorption contrast differentiationbetween metastatic and normal breast tissue [304,305]. In addition, PA techniques have been usedalongside complementary multimodal modalitiessuch as fluorescence imaging to yield in vivo func-tional molecular information [306, 307].
3.6 Optical coherence tomography
Many of the aforementioned optical techniques (Po-larisation Spectroscopy, Optical Projection Tomogra-phy and Photoacoustic Imaging) are based on thediffuse scattering of light with turbid media. OpticalCoherence Tomography (OCT), on the other hand,
falls into the category of ballistic (and quasi-ballistic)optical imaging. OCT is analogous to ultrasoundpulse-echo imaging [308], employing coherence gat-ing. The intensity of singly backscattered light is giv-en by [250]:
IðzÞ ¼ I0 exp ð�2mtzÞ RB ð21Þ
where RB denotes the portion of backscattered lightreceived by the detector; z is the ballistic pathlengthin the scattering medium; the factor of two in the ex-ponent results from the round-trip propagation. Bal-listic imaging rejects non-ballistic photons; the re-tained ballistic photons have better collimation, amore well-defined wavefront, and retain their inci-dent polarisation state (in a non-birefringent med-ium). OCT detection is based on the principles of in-terferometry as the speed of light is 5 orders ofmagnitude larger than that of sound. It can provideclear visual boundaries between different vessel walllayers and is a non-contact modality.
OCT is based in Michelson interferometry, usinglow coherence light sources (e.g. superluminescentdiodes) and may be implemented in free-space or(single-mode) fiber-based systems. In interferometry,if a monochromatic light source beam is emitted to-wards a beamsplitter it is split into two, with one halfbackreflected from a reference mirror and the re-maining backreflected by an object surface. Thesesplit beams are then recombined by the originalbeamsplitter and received by a detector. The inten-sity received by a the detector may be written as[309]:
IðtÞ ¼E2R0 þ E2
S0 þ 2ER0ES0 cos ð2ðkSlS � kRlRÞ|fflfflfflfflfflfflfflfflfflfflffl{zfflfflfflfflfflfflfflfflfflfflffl}Df
Þ ð22Þ
where R and S denote the reference and samplearms, respectively; E0 is the incident electric field; k,the propagation constant; and l is the arm lengthfrom beamsplitter to the back reflection surfaces.The time-varying phase difference Df results in theinterference term becoming an alternating currentwhich produces interference fringes. Thus, the re-corded I is referred to an as interferogram, varyingperiodically with optical pathlength difference (ormismatch) 2hðlS � lRÞ.
The first generation OCT systems were based ontime-domain principles (TdOCT) [308, 310]. InTdOCT systems, while the reference beam is re-flected from a mirror as is in the traditional inter-ferometric setup, the sample beam is backscatteredfrom various depths in a biological tissue sample.The movement of the reference arm induces a Dop-pler frequency shift in the reflected reference beam.Detection of beams of this type may be categorisedas heterodyne detection owing to the Doppler shift.However, the principle which enables OCT to re-solve the back-scattered distribution of the backscat-
S. M. Daly and M. J. Leahy: A review of methods and advancements in blood flow imaging236
Journal of
BIOPHOTONICS
# 2013 by WILEY-VCH Verlag GmbH & Co. KGaA, Weinheim www.biophotonics-journal.org

tered light is coherence gating; beams will only inter-fere when their optical path-length difference iswithin the coherence length of the light source. Thecoherence length (lC) of light is defined as the spatialextent along the propagation direction over whichthe electric field is substantially correlated [311]:
lC ¼4 ln 2
p
l20
Dlð23Þ
where l0, the source center wavelength; and Dl isthe full-width at half maximum (FWHM) bandwidth.Therefore, the axial resolution may be determinedby the source coherence length (i.e. the arrival oftime echoes), or more accurately, lC=2. Although theabove expression for lC is for a Gaussian lineshape,it is the most common definition in OCT literature[312]. In contrast to convention microscopy, the axialand transverse resolutions in OCT are decoupledfrom each other. However, as is the case in tradi-tional microscopic methods, the transverse resolutionin the OCT imaging system is determined by the fo-cused spot size [313]:
Dx ¼ 4l
p
f
dð24Þ
where d is the spot size on the objective lens and f isits focal length; the transverse resolution results fromthe confocal mechanism. The path length distribu-tion of ballistic light may be directly converted intoa physical depth distribution; this conversion breaksdown if diffuse light is considered.
The Fourier domain equivalent of TdOCT(FdOCT), which encompasses both spectral andswept-source variants [314], avoids the varying ofthe reference optical path by considering all multiplepartial waves for all sample beam backscatterersalong a single A-scan simultaneously. It accom-plishes this by dispersing the recombined beam into
its spectral components by a spectrometer and per-forms an inverse Fourier transformation of the de-tected spectrum yielding an A-scan image in its en-tirety (see Figure 25). Contrast in OCT imagesoriginates from the varying intensity of backreflectedlight, and signal differences originate from subtlevariations of refractive index.
Consequently, FdOCT yields higher frames ratesand greater sensitivities. Although FdOCT methodsrequire more complex post-processing, they havegreat potential in terms of speed of acquisition andsensitivity. For a given N pixel-based SdOCT with a
depth scan range of xdepth ¼N
2lC, a TdOCT system
Figure 24 Schematic of free-space TdOCT (a) and FdOCT(b) systems.
(a)
(b)
Figure 25 (a) 2D (and 3D) cross-sectional images are con-structed by imaging at different transverse positions;(b) 1D representation of the backscattering in a cross-sec-tional plane of the tissue as indicated by the line throughtissue in (a) [313].
J. Biophotonics 6, No. 3 (2013) 237
REVIEWREVIEWARTICLEARTICLE
# 2013 by WILEY-VCH Verlag GmbH & Co. KGaA, Weinheimwww.biophotonics-journal.org
acquiring signal over the same total time duration asan SdOCT system will have an signal-to-noise (SNR)ratio of [315]:
SNRTDOCT ¼ 10 log 4PS2N
� �T
"
hn
� �
¼ SNRSDOCT � 10 logN
2
� �ð25Þ
where PS, total detected sample power; T, total sig-nal collection time; e, the quantum detector effi-ciency; and hn, the photon quantum energy. There-fore a SdOCT system is intrinsically more sensitivethan a TdOCT by a factor of N=2 [316]. In additionto sensitivity and resolution considerations, the nom-inal axial imaging depth of an OCT system is de-rived by the following expression [317]:
zmax ¼1
4h
l20
DlN ð26Þ
where h is the average refractive index of the sampleunder study (for glass h ¼ 1:5), Nis the number ofdetector array elements (N ¼ 1024); all other termsare as described previously. As the depth-to-resolu-tion ratio of OCT is >100, it qualifies as a high reso-lution imaging modality [250], and is capable ofdoing so down to millimetre scale depths.
Owing to its reliance on interferometry, OCT ismore limited than confocal imaging in terms of sig-nal detection. As light reflected from the specimenmust be coherent with a reference beam, it cannotdetect fluorescence (as this requires the illuminationand detection beams to be of different wavelengths).As such, OCT appears unsuitable for analysis of im-munohistochemistry or other standard gene expres-sion assays [223]. Although OCT may be likened toUS in its theoretical formulation, it also is victim tosome of the associated consequences, for instance,conspicuous speckle artifacts [250]. The use of allphotons as in photoacoustic imaging (see § 3.5) is ofconsiderable advantage over OCT techniques, reli-ant on (quasi-) ballistic interactions, due to the factthat a useful percentage of (diffuse) photons pene-trates several cm into tissue. Additionally, diffuse,random, light scattering can perform uniform illumi-nation of microvessels which may be otherwise beobscured.
Some very active research areas at present in-clude: diagnosing dermatological diseases e.g. psoria-sis [318]; assessment of arteriosclerotic plaques [319,320]; and determining burn extent and tissue viabili-ty by defining tissue barrier layers characteristic ofscarring (wound healing and graft flow) [321–323].However, in truth, OCT has ubiquitous applications,having emerged in a variety of clinical fields:ophthalmology [324–326], intravascular imaging incardiology [327, 328], oncology [329, 330], gastroen-
terology [331–333], general dermatology [334–336],dentistry [337, 338], and gynaecology [339, 340], toname a few. Functional extensions of OCT haveemerged: polarisation-sensitive systems used, for ex-ample, in the diagnosis of neoplastic6 processes; dif-ferential phase-sensitive methods for use in photo-refractive surgery; full-field advancement of theconventional single-point OCT detection technique;and endoscopic OCT. Combining OCT with comple-mentary techniques such as OCT with confocal mi-croscopy (optical coherence microscopy), amalga-mates the spatial sectioning and pin-hole rejectioncapabilities of confocal microscopy with the addi-tional longitudinal sectioning provided by OCT co-herence gating. Another asset of OCT is that it canbe used to separate structure and function in 3D andto measure flow in individual microvessels. Methodswhich embody this ability are outlined in the follow-ing subsections.
3.6.1 Doppler
Scanning of the reference mirror of an OCT systemat a velocity v, produces a Doppler signal at a fre-quency fD (¼ 2v=l); the dynamic constituents of thetissue (with velocity vS) will also produce a Dopplersignal. Hence, the signal of the Doppler OCT(DOCT) will be proportional to [25]:
AðtÞ cos ½2pðf D � f DsÞ t þ fðtÞ� ð27Þwhere A(t) is the reflectivity and fðtÞ is the phaseshift defined by the scatterer position. By simplymeasuring the frequency shift of moving particles ina defined vessel, it is possible to characterise bloodflow and surpasses that of Laser Doppler Flowmetry(see § 2.2.2) due to OCT’s ability to resolve struc-tures in depth.
Doppler ultrasound (US), the fundamental prin-ciple upon which DOCT is based, was developed asa tool for vascular disease assessment and monitor-ing. However, despite the advancements of DOCTtechniques, a principal limitation still exists: the Dop-pler method is inherently 1D. The “true” velocity isextracted from this 1D information by assuming thedirection of blood motion, resulting in an inaccuratedetermination of the flow velocity [342]. Dopplertechniques are only apt for larger blood vessels withfaster flow rates, in which Doppler shifts are easierto detect [343]. Furthermore, as a Fourier transfor-mation is usually preformed in sliding short-timewindows, a tradeoffs between axial and velocity re-solutions exist in the flow estimation [250]. DOCT is
6 Neoplasm: a new or uncontrolled growth of abnormal tissue, e.g.a tumour.
S. M. Daly and M. J. Leahy: A review of methods and advancements in blood flow imaging238
Journal of
BIOPHOTONICS
# 2013 by WILEY-VCH Verlag GmbH & Co. KGaA, Weinheim www.biophotonics-journal.org

also inherently sensitive to the phase stability causedby both the system and the measurement environ-ments [344].
The preliminary experiments regarding DOCTinvolved investigating picoliter blood volumes [345].Since then, DOCT has had great success in the vi-sualisation of ocular media and related flow dy-namics (see Figure 26) [346–349], in addition to cer-ebral [350], cardiovascular [351] and urological [352]applications.
3.6.2 Speckle variance
Due to the extensive tortuosity of the microvascula-ture (especially if ailments which alter the physiol-ogy are present), the Doppler angular dependencymay lead to incomplete vascular maps in vivo.Speckle variance (SV) techniques based on structur-al image intensity have been used in tumour micro-vascular imaging with high-frequency ultrasound[353]. The interframe speckle variance (SVijk) imagesof structural image of the OCT intensity (Iijk) maybe calculated as follows [354]:
SVijk ¼1N
PNi¼1ðIijk � �IIÞ2 ð28Þ
where N, the number of B-mode frames SV is calcu-lated across; i, slice index; j and k, lateral and depthindices of the images; and �II, the average over thesame set of pixels. SV-OCT images accentuate bloodvessels as flowing portions induce localised specklepatterns and thus, are uncorrelated between frames[355].
One of the most outward advantages of SV is itsindependence of the Doppler angle for flow velocity
Figure 26 Composite mosaic of thechoroidal vasculature using dualbeam scan DOCT. Scale bar: 1 mm[341].
(a)
(b)
Figure 27 (a) SV microvascular projection image of an im-planted gliosarcoma tumour in the dorsal window chamberof a mouse (scale bar ¼ 250 mm). Colour represents rela-tive vessel depth; (b) Magnified region of interest from (a)(750� 750 mm2) [356].
J. Biophotonics 6, No. 3 (2013) 239
REVIEWREVIEWARTICLEARTICLE
# 2013 by WILEY-VCH Verlag GmbH & Co. KGaA, Weinheimwww.biophotonics-journal.org
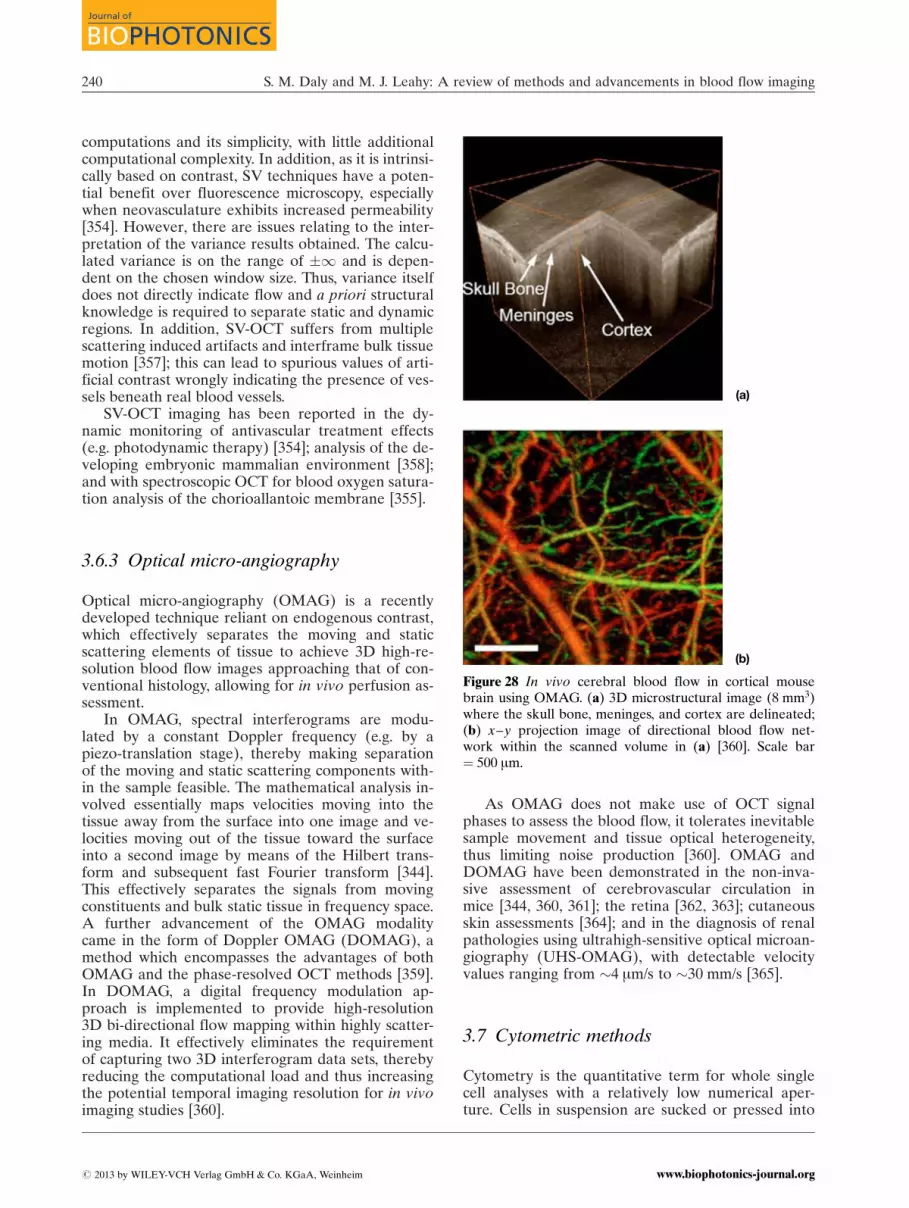
computations and its simplicity, with little additionalcomputational complexity. In addition, as it is intrinsi-cally based on contrast, SV techniques have a poten-tial benefit over fluorescence microscopy, especiallywhen neovasculature exhibits increased permeability[354]. However, there are issues relating to the inter-pretation of the variance results obtained. The calcu-lated variance is on the range of �1 and is depen-dent on the chosen window size. Thus, variance itselfdoes not directly indicate flow and a priori structuralknowledge is required to separate static and dynamicregions. In addition, SV-OCT suffers from multiplescattering induced artifacts and interframe bulk tissuemotion [357]; this can lead to spurious values of arti-ficial contrast wrongly indicating the presence of ves-sels beneath real blood vessels.
SV-OCT imaging has been reported in the dy-namic monitoring of antivascular treatment effects(e.g. photodynamic therapy) [354]; analysis of the de-veloping embryonic mammalian environment [358];and with spectroscopic OCT for blood oxygen satura-tion analysis of the chorioallantoic membrane [355].
3.6.3 Optical micro-angiography
Optical micro-angiography (OMAG) is a recentlydeveloped technique reliant on endogenous contrast,which effectively separates the moving and staticscattering elements of tissue to achieve 3D high-re-solution blood flow images approaching that of con-ventional histology, allowing for in vivo perfusion as-sessment.
In OMAG, spectral interferograms are modu-lated by a constant Doppler frequency (e.g. by apiezo-translation stage), thereby making separationof the moving and static scattering components with-in the sample feasible. The mathematical analysis in-volved essentially maps velocities moving into thetissue away from the surface into one image and ve-locities moving out of the tissue toward the surfaceinto a second image by means of the Hilbert trans-form and subsequent fast Fourier transform [344].This effectively separates the signals from movingconstituents and bulk static tissue in frequency space.A further advancement of the OMAG modalitycame in the form of Doppler OMAG (DOMAG), amethod which encompasses the advantages of bothOMAG and the phase-resolved OCT methods [359].In DOMAG, a digital frequency modulation ap-proach is implemented to provide high-resolution3D bi-directional flow mapping within highly scatter-ing media. It effectively eliminates the requirementof capturing two 3D interferogram data sets, therebyreducing the computational load and thus increasingthe potential temporal imaging resolution for in vivoimaging studies [360].
As OMAG does not make use of OCT signalphases to assess the blood flow, it tolerates inevitablesample movement and tissue optical heterogeneity,thus limiting noise production [360]. OMAG andDOMAG have been demonstrated in the non-inva-sive assessment of cerebrovascular circulation inmice [344, 360, 361]; the retina [362, 363]; cutaneousskin assessments [364]; and in the diagnosis of renalpathologies using ultrahigh-sensitive optical microan-giography (UHS-OMAG), with detectable velocityvalues ranging from 4 mm/s to 30 mm/s [365].
3.7 Cytometric methods
Cytometry is the quantitative term for whole singlecell analyses with a relatively low numerical aper-ture. Cells in suspension are sucked or pressed into
(a)
(b)
Figure 28 In vivo cerebral blood flow in cortical mousebrain using OMAG. (a) 3D microstructural image (8 mm3)where the skull bone, meninges, and cortex are delineated;(b) x–y projection image of directional blood flow net-work within the scanned volume in (a) [360]. Scale bar¼ 500 mm.
S. M. Daly and M. J. Leahy: A review of methods and advancements in blood flow imaging240
Journal of
BIOPHOTONICS
# 2013 by WILEY-VCH Verlag GmbH & Co. KGaA, Weinheim www.biophotonics-journal.org
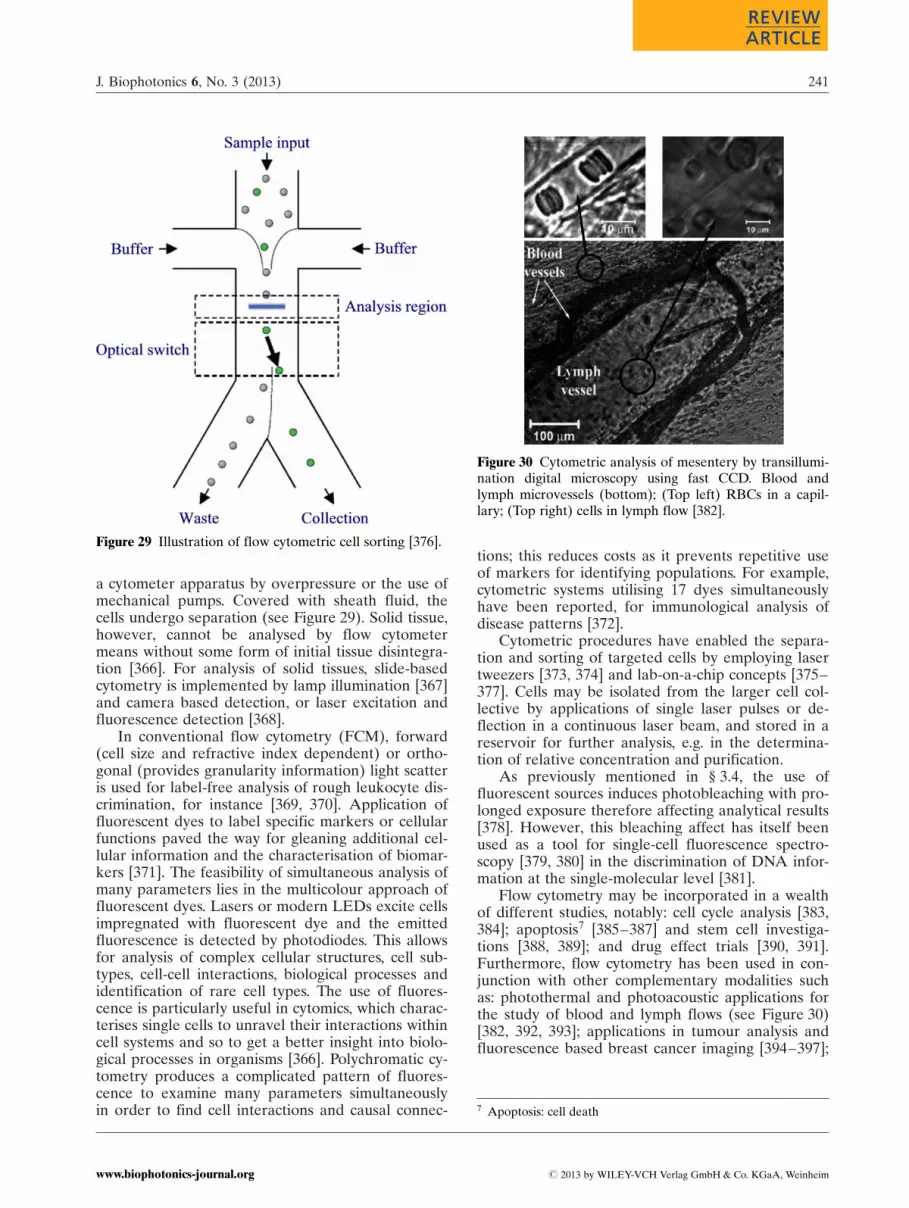
a cytometer apparatus by overpressure or the use ofmechanical pumps. Covered with sheath fluid, thecells undergo separation (see Figure 29). Solid tissue,however, cannot be analysed by flow cytometermeans without some form of initial tissue disintegra-tion [366]. For analysis of solid tissues, slide-basedcytometry is implemented by lamp illumination [367]and camera based detection, or laser excitation andfluorescence detection [368].
In conventional flow cytometry (FCM), forward(cell size and refractive index dependent) or ortho-gonal (provides granularity information) light scatteris used for label-free analysis of rough leukocyte dis-crimination, for instance [369, 370]. Application offluorescent dyes to label specific markers or cellularfunctions paved the way for gleaning additional cel-lular information and the characterisation of biomar-kers [371]. The feasibility of simultaneous analysis ofmany parameters lies in the multicolour approach offluorescent dyes. Lasers or modern LEDs excite cellsimpregnated with fluorescent dye and the emittedfluorescence is detected by photodiodes. This allowsfor analysis of complex cellular structures, cell sub-types, cell-cell interactions, biological processes andidentification of rare cell types. The use of fluores-cence is particularly useful in cytomics, which charac-terises single cells to unravel their interactions withincell systems and so to get a better insight into biolo-gical processes in organisms [366]. Polychromatic cy-tometry produces a complicated pattern of fluores-cence to examine many parameters simultaneouslyin order to find cell interactions and causal connec-
tions; this reduces costs as it prevents repetitive useof markers for identifying populations. For example,cytometric systems utilising 17 dyes simultaneouslyhave been reported, for immunological analysis ofdisease patterns [372].
Cytometric procedures have enabled the separa-tion and sorting of targeted cells by employing lasertweezers [373, 374] and lab-on-a-chip concepts [375–377]. Cells may be isolated from the larger cell col-lective by applications of single laser pulses or de-flection in a continuous laser beam, and stored in areservoir for further analysis, e.g. in the determina-tion of relative concentration and purification.
As previously mentioned in § 3.4, the use offluorescent sources induces photobleaching with pro-longed exposure therefore affecting analytical results[378]. However, this bleaching affect has itself beenused as a tool for single-cell fluorescence spectro-scopy [379, 380] in the discrimination of DNA infor-mation at the single-molecular level [381].
Flow cytometry may be incorporated in a wealthof different studies, notably: cell cycle analysis [383,384]; apoptosis7 [385–387] and stem cell investiga-tions [388, 389]; and drug effect trials [390, 391].Furthermore, flow cytometry has been used in con-junction with other complementary modalities suchas: photothermal and photoacoustic applications forthe study of blood and lymph flows (see Figure 30)[382, 392, 393]; applications in tumour analysis andfluorescence based breast cancer imaging [394–397];
Figure 29 Illustration of flow cytometric cell sorting [376].
Figure 30 Cytometric analysis of mesentery by transillumi-nation digital microscopy using fast CCD. Blood andlymph microvessels (bottom); (Top left) RBCs in a capil-lary; (Top right) cells in lymph flow [382].
7 Apoptosis: cell death
J. Biophotonics 6, No. 3 (2013) 241
REVIEWREVIEWARTICLEARTICLE
# 2013 by WILEY-VCH Verlag GmbH & Co. KGaA, Weinheimwww.biophotonics-journal.org

functional brain imaging [398]; and utilised with con-trast enhancing fluorescence nanoparticles for HIVscreening [399, 400]. Flow cytometry has also beenused in a number of clinical studies for examplesickle cell anaemia, with the potential for discrimi-nating between sickled and non-sickled cells, as thesickled variety have reduced oxygen-carrying abilityand more slowly through the microcirculation [401].
4. Correlation based mechanisms
4.1 Particle tracking velocimetry
Optical correlation techniques quantitatively meas-ure flow, are insensitive to detector noise and non-invasive [402–404]. Capillary video-microscopy wasone of the first means by which abnormal capillaryvasculature and dynamics in, for example, wound sitesand port wine stains, was documented [405–407].Video cursors were placed along the length of a capil-lary, one at an upstream and one at a downstream po-sition, separated by a known distance.
The temporal variations in light intensity sub-jected to cross-correlation computations yield transittimes for photometric events moving from one cur-sor to another, thereby allowing the computation ofred blood cell velocity (RBCV) values. Currently, vi-deocapillaroscopy is the clinical ‘gold standard’ forcapillary imaging and analysis. However, the depthof tissue penetration is a limiting factor and restrictscapillaroscopic techniques to the nutritive portionsof the skin [409].
Particle image velocimetry (PIV) is a non-intru-sive measurement technique, used to measure full-field velocity data within a 2D plane of a particle-seeded flow field [410]. The fluid velocity is inferredfrom the motion of tracer particles which constitutea random pattern that is ‘tied’ to the fluid, whosemotion is visible through tracer pattern changes. InPIV, two sequential images are subsampled at oneparticular area via an interrogation window. Withinthese samples, an average spatial shift of particlesmay be observed from one sample to its counterpart
in the other image [411], provided flow is present.The displacement of a tracer particle (d) in a finitetime interval (Dt ¼ t00 � t0) may be given by [412]:
dðx; t0; t00Þ ¼Ðt00t0
v½xðtÞ; t� dt ð29Þ
where v½xðtÞ; t� is the tracer particle velocity. The tra-cer pattern does not necessarily have to be com-posed of discrete tracer particles; the above interpre-tation is likewise applicable to continuous tracerssuch as dyes. PIV tracer velocity values are deducedby calculation of the expectation value of the auto-correlation function for a double-exposure continu-ous image [412]. The temporal autocorrelation func-tion of the scattered light intensity yields measure-ments of velocity gradients in a steady flow [413],thus providing a way of determining shear gradientsquantitatively.
Performance of PIV methods in measuring in-stantaneous velocity fields were improved upon bythe introduction of direct cross-correlation of imagefields in place of multiple-exposure auto-correlationmethods [415]. Cross-correlation methods of interro-gation of successive single-exposure frames can beused to measure the separation of pairs of particleimages, resulting in improvements in spatial resolu-tion, detection rate, accuracy and reliability. A highcross-correlation value near unity is observed whenmany particle images in the initial image match theircorresponding spatially equivalent shifted partnersin the subsequent image, i.e. the higher the correla-tion coefficient, the greater the accuracy of the velo-city data obtained [410]. PIV has been associatedwith certain limitations, such as directional ambiguity[412], and its use of microbeads for contrast have re-sulted in severe obstructions and distortion of theflow profiles [416], thus limiting its clinical applica-tion.
The clinical applicability of the PIV techniquehas been reported in small animal models and note-worthy in the analysis of arterioles with both bifurca-tion and confluence in the rat mesentery [417]. Themost successful approach for employing advancedvelocimetry for measurements in microfluidics (see§ 3.7) is microparticle image velocimetry (mPIV)using fluorescently tagged polystyrene particles [242,418, 419]. PIV has been used as a complementarytechnique to a wide variety of modalities. Recently,it was coupled with OCT (see Figure 32) for quanti-tatively characterising the microfluidic-scale flowgenerated by epithelial motile cilia of Xenopus tropi-calis embryos [414]. PIV is not restricted to opticallyacquired images only; US imaging has been used tomeasure the velocity distribution in the porcine leftventricle [4], with reported spatial and temporal re-solutions of 0.4 mm and 0.5 ms, respectively [420]. Inaddition, X-ray velocimetry has been suggested as a
Figure 31 Illustration of television microscopy methodsof capillary velocity estimation [408].
S. M. Daly and M. J. Leahy: A review of methods and advancements in blood flow imaging242
Journal of
BIOPHOTONICS
# 2013 by WILEY-VCH Verlag GmbH & Co. KGaA, Weinheim www.biophotonics-journal.org

means of in vivo wall shear stress measurement, as itis a highly influential factor for the progression ofarterial disease [421].
4.2 Correlation spectroscopy
Scanning laser image correlation (SLIC) is an opticalcorrelation technique which traces a laser beam ra-pidly with respect to the motion of particles. It ap-plies the use of pair-correlation [422] to analyse re-flected fluctuations from moving particles, thusyielding temporal information between sequentialimages. SLIC is capable of discriminating amongmultiple populations of particles travelling simulta-neously through the same channel at different velo-cities [423, 424].
In SLIC, a laser follows a trajectory across achannel, illuminating a series of (many) small re-gions (see Figure 33(a)). The reflected intensity foreach region is measured with an optical detector. Inorder to perform velocity measurements, temporalcomparisons need to be made of a particle initiallyand at a later time via cross-correlation. For SLICcomputation, normalised cross-correlation is used[423] and is defined as:
GabðtÞ ¼hdIbðtÞ � dIaðt þ tÞitðhdIaðtÞit hdIbðtÞitÞ
ð30Þ
where a and b refer to the columns in Figure 33; I,intensity; t, temporal correlation shift; h it, temporalaverage; and dIðtÞ ¼ IðtÞ � hIðtÞi. 2D plots may bededuced via multidistance pair-correlation [425].
STICS is fundamentally different from other opti-cal correlation techniques, e.g. speckle, as it does not
require the use of a model and is a purely statisticalmethod [343]. However, it is limited in the range ofvelocities it can measure, the maximum velocitybeing limited by the acquisition speed of detection[423]. SLIC has been widely implemented in assess-ments of vascular dynamics in, for example, zebrafish embryos [16, 427].
Figure 32 2D, two-component flow velocity field of OCT-based particle tracking velocimetry of non-recirculatory ci-lia-driven fluid flow [414].
(a)
(b)
Figure 33 (a) In the SLIC method, a laser scans manysmall regions, the reflected intensity is detected and pair-correlation provides a flow measurement. Image adaptedfrom [423]; (b) STICS analysis of movements of labelledorganelles in the cytoplasm of a lily pollen tube. The vec-tor map overlying the micrograph reveals the directionand speed of particle motion in the pollen tube over a 10 speriod [426]. Scale bar ¼ 10 mm.
J. Biophotonics 6, No. 3 (2013) 243
REVIEWREVIEWARTICLEARTICLE
# 2013 by WILEY-VCH Verlag GmbH & Co. KGaA, Weinheimwww.biophotonics-journal.org

4.3 Advancements in OCT flow assessment
Recently, techniques have been proposed for flowvelocity investigations that are distinct from thosewhich utilise phase information, frequency shifts orDoppler broadening of bandwidth. Time-varyingspeckle is manifested as a change in OCT (see § 3.6)image spatial speckle frequencies; methods have uti-lised this fact to provide quantitative flow informa-tion in vitro [428].
Autocorrelation methods for quantitative map-ping of transverse particle-flow velocity have beenproposed [429], which employ the statistical natureof the intensity fluctuation of backscattered lightmodulated by (stochastically) flowing particles.These methods are derived from the theoretical ana-lysis of fluorescence correlation spectroscopy [430].Such methods are clearly advantageous, e.g. with re-gard to phase-resolved Doppler OCT which has alimited dynamic range of velocity caused by phasewrapping [429, 431]. Such methods have beenfurther applied as a means of non-invasive measure-ment of concentration in non-flowing particle sus-pensions governed by Poissonian distributions [432].
Means of calculating absolute flow velocities with-out explicit knowledge of vessel angles have recentlybeen reported by employing the use of surface inte-grals along the x� y plane [433] (see Figure 34) andby maximum intensity projection correlation of coin-cident pixels in multiple OCT B-scans [434].
OCT techniques which encompass cross-correla-tion have recently been introduced [435]. A 2Dcross-correlation between two spatially distinctimages was performed. However, in practical appli-cation, the measured velocity range was smaller thanpredicted; this error was attributed to the quasi-syn-chronous manner of image acquisition. This may beimproved upon by continuously analysing the speci-
men using multiple, spatially disparate imagingpoints [436]. By performing cross-correlation analy-sis of the flow induced fluctuations of the OCT sig-nal, transit times may be yielded and ergo velocityvalues for particle flow computed. Methods whichutilise the time scale of random fluctuations in thedynamic scattering component related to RBCV
have recently been reported in quantitative studiesof capillary haemodynamics [437]. The application ofcross-correlation methods of velocity estimation tocomplex situations, e.g. turbulence, is the focus ofcurrent research. Imaging at multiple positions hasbeen the topic of recent discussion in the imagingcommunity; current developments are outlined onthe next section.
4.4 Dual-beam techniques
Several investigations have reported the use of adual-beam imaging modality [438, 439]. The classicinterferometric setup of partial coherence interfero-metry (PCI) and OCT has the drawback of beingsensitive to longitudinal object positions [440]. Ef-forts to overcome such limitations in ocular mediahave been reported, in which the cornea was used asa reference surface in a common path dual-beam in-terferometric set-up [441]. A dual-beam Dopplerspectral domain OCT (SdOCT) system which elimi-nated the ambiguity associated with unknown orien-tation of local velocity vectors in the blood vessels ofzebrafish has been reported [442].
Recent work has been proposed [443, 444], whichoutlines a dual-beam scan Doppler optical coherenceangiography (see Figure 35). A similar technique hasalso been reported [445], in which two laterally dis-placed sample beams make it possible to applyphase-resolved Doppler analysis. However, thesemethods are sensitive to involuntary sample motion.Regardless, dual-beam methods have been reportedto yield an increased dynamic range for detectable
Figure 34 (A) OCT maximum intensity projection angio-gram of the rat somatosensory cortex vasculature at 12 mmtransverse resolution; (B) magnified area as shown in (A)[433].
Figure 35 Mosaic of en-face images of the retinal vascula-ture captured using dual-velocity optical coherence angio-graphy [443]; two different scanning beams with spatialand temporal separation provide two measurable velocityranges enabling higher sensitivity to very low velocity flows.
S. M. Daly and M. J. Leahy: A review of methods and advancements in blood flow imaging244
Journal of
BIOPHOTONICS
# 2013 by WILEY-VCH Verlag GmbH & Co. KGaA, Weinheim www.biophotonics-journal.org

velocities [99] and capable of providing useful micro-structural information, in addition to providing highspatial resolution velocity measurements [446].
5. Conclusion
This review has provided an extensive overview anddiscussion of the advancement of optical sectioningtechniques applied to blood flow imaging, from theirinitial inception to modern day. All of the discussedmodalities are capable of relaying clinically relevantand diagnostically important morphological andfunctional information. The implication of thesemethods in the clinical realm has been outlined, inaddition to an in-depth discussion of their modusoperandi, associated advantages and limitations.Although the techniques discussed may differ inher-ently in their construction, operation, resolution,etc., they are yet intrinsically linked. The prevalenceof complementary modalities is rife at present, utilis-ing supplementary information to yield multifacetedinformation with affirming, real-world applications.
Author biographies Please see Supporting Informationonline.
References
[1] G. J. Tearney, M. E. Brezinski, B. E. Bouma, S. A.Boppart, C. Pitris, J. F. Southern, and J. G. Fujimoto,Science 276, 2037–2039 (1997).
[2] J.-L. Chen, L. Wei, V. Acuff, D. Bereczki, F.-J. Hans,T. Otsuka, W. Finnegan, C. Patlak, and J. Fensterma-cher, Microvascular Research 48, 190–211 (1994).
[3] A. G. Hudetz, B. B. Biswal, G. Feher, and J. P. Kam-pine, Microvascular Research 54, 35–42 (1997).
[4] P. Vennemann, R. Lindken, and J. Westerweel, Ex-periments in Fluids 42, 495–511 (2007).
[5] D. M. McDonald and P. L. Choyke, Nat. Med. 9,713–725 (2003).
[6] R. Weissleder, Nature Reviews Cancer 2, 11–18(2002).
[7] J. D. Pearlman, R. J. Laham, M. Post, T. Leiner, andM. Simons, Current Pharmaceutical Design 8, 1467–1496 (2002).
[8] M. Neeman, Journal of Cellular Biochemistry 87(Suppl. 39) 11–17 (2002).
[9] N. G. Costouros, F. E. Diehn, and S. K. Libutti, Jour-nal of Cellular Biochemistry 87 (Suppl. 39) 72–78(2002).
[10] R. Weissleder and V. Ntziachristos, Nature Medicine9, 123–128, (2003).
[11] J. Lighthill, Mathematical Biofluiddynamics (Societyfor Industrial and Applied Mathematics, Philadel-phia, 1975).
[12] J. E. Moore Jr., A. Delfino, P.-A. Doriot, P.-A. Dor-saz, and W. Rutishauser, Biofluid methods in vascu-lar and pulmonary systems (CRC Press, 2001).
[13] D. D. Backer and J.-L. Vincent, in: MicrocirculationImaging, M. J. Leahy (Wiley-VCH, Weinheim, 2012).
[14] L. Devgan, S. Bhat, S. Aylward, and R. J. Spence,J. Burns Wounds 5, 1–9 (2006).
[15] V. Singh, L. Devgan, S. Bhat, and S. M. Milner, An-nals of Plastic Surgery 59, 109–115 (2007).
[16] X. T. Pan, H. Yu, X. K. Shi, V. Korzh, and T. Woh-land, Journal of Biomedical Optics 12, 014034–014044 (2007).
[17] M. J. Leahy, J. O’Doherty, P. McNamara, and J. G. En-field, Medical Laser Application 22, 105–126 (2007).
[18] K. P. Chan, B. Devaraj, M. Yamada, and H. Inaba,Physics in Medicine and Biology 42, 855–867 (1997).
[19] J. C. Hebden and D. T. Delpy, British Journal ofRadiology 70, S206–S214 (1997).
[20] S. Kurada, G. W. Rankin, and K. Sridhar, Optics andLaser Technology 25, 219–233 (1993).
[21] H. Zhao, R. H. Webb, and B. Ortel, Journal of Clini-cal Engineering 27, 40–47 (2002).
[22] F. Kajiya, Frontiers of medical and biological engi-neering: the international journal of the Japan So-ciety of Medical Electronics and Biological Engi-neering 1, 271–285 (1989).
[23] J. B. West, Journal of Applied Physiology 105, 1877–1880 (2008).
[24] P. E. Pormann and E. Savage-Smith, Medieval Isla-mic Medicine (Edinburgh University Press, Edin-burgh, 2007).
[25] V. Tuchin, Tissue Optics: Light Scattering Methodsand Instruments for Medical Diagnosis (SPIE Press,Bellingham, Washington, USA, 2007).
[26] J. P. T. Ward, R. W. Clarke, and R. W. A. Linden, Phy-siology at a Glance (Wiley-Blackwell, Oxford, 2005).
[27] G. J. Tortora, Introduction to the Human Body: theEssentials of Anatomy and Physiology (AddisonWesley Longman, New York, 1997).
[28] Pycnogen ALL, http://www.pycnogenall.com.[29] C. I. Wright, C. I. Kroner, and R. Draijer, Journal of
Pharmacological and Toxicological Methods 54, 1–25(2006).
[30] A. I. Vinik, T. Erbas, T. S. Park, K. K. Pierce, andK. B. Stansberry, Diabetes Technology & Therapeu-tics 3, 29–50 (2001).
[31] B. Fagrell and M. Intaglietta, J. Intern. Med. 241,349–362 (1997).
[32] I. D. Swain and L. J. Grant, Physics in Medicine andBiology 34, 151–175 (1989).
[33] S. E. Charm and G. S. Kurland, Blood flow and mi-crocirculation (Wiley, New York, 1974).
[34] E. Berardesca, J. L. Leveque, and P. Masson, SkinPharmacology and Applied Skin Physiology 15,442–456 (2002).
[35] H. A. M. Daanen, European Journal of AppliedPhysiology 89, 411–426 (2003).
[36] M. J. Leahy and G. E. Nilsson, in: Handbook ofPhotonics for Biomedical Science, V. V. Tuchin (ed.)(CRC Press, Boca Raton, FL, 2010).
J. Biophotonics 6, No. 3 (2013) 245
REVIEWREVIEWARTICLEARTICLE
# 2013 by WILEY-VCH Verlag GmbH & Co. KGaA, Weinheimwww.biophotonics-journal.org

[37] A. I. Vinik, T. Erbas, T. S. Park, K. B. Stansberry,J. A. Scanelli, and G. L. Pittenger, Diabetes Care 24,1468–1475 (2001).
[38] American Vein and Aesthetics Institute, http://www.medrehab.com/Skincare.php.
[39] R. R. Anderson and J. A. Parrish, in: The Science ofPhotomedicine, J. D. Regan and J. A. Parrish (eds.)(Plenum Press, New York, 1982), 147–194.
[40] T. Vo-Dinh, Biomedical Photonics Handbook (CRCPress, Boca Raton, 2003).
[41] V. V. Tuchin, Handbook of Optical Biomedical Diag-nostics (SPIE Press, Bellingham, WA, 2002).
[42] M. van Gemert, S. Jacques, H. Sterenborg, andW. Star, IEEE Transactions in Biomedical Engineer-ing 36, 1146–1154 (1989).
[43] J. Lee and N. Smith, Microcirculation 15, 699–714(2008).
[44] J. M. Schmitt and G. Kumar, Applied Optics 37,2788–2797 (1998).
[45] J. Cobb and D. Claremont, The International Journalof Lower Extremity Wounds 1, 161–169 (2002).
[46] R. F. Abarquez and J. E. L. Cinco, Clinical Hemo-rheology and Microcirculation 29, 157–165 (2003).
[47] M. Cutolo, W. Grassi, and M. M. Cerinic, Arthirtis& Rheumatism, 48, 3023–3030 (2003).
[48] S. Guiducci, R. Giacomelli, and M. M. Cerinic,Autoimmunity Reviews 6, 520–523 (2007).
[49] M. Hahn, C. Hahn, M. Junger, A. Steins, D. Zuder,T. Klyscz, A. Buchtemann, G. Rassner, and V. Bla-zek, Microvascular Research 57, 187–198 (1999).
[50] J. L. P. Vaz, M. A. A. Dancour, D. A. Bottino, andE. Bouskela, Rheumatology 43, 1025–1027 (2004).
[51] M. Aschwanden, T. Daikeler, K. A. Jaeger, C. Thal-hammer, A. Gratwohl, M. Matucci-Cerinic, andA. Tyndall, Annals of the Rheumatic Diseases 67,1057–1059 (2008).
[52] M. I. Perez and S. R. Kohn, Journal of the AmericanAcademy of Dermatology 30, 519–531 (1994).
[53] G. A. Scardina and P. Messina, Annals of Anatomy– Anatomischer Anzeiger 188, 425–429 (2006).
[54] W. Grassi, P. Core, G. Carlino, and C. Cervini, Scan-dinavian Journal of Rheumatology 21, 226–230(1992).
[55] J. P. Vuchetich, S. K. Miranowski, B. A. Mueller, andK. O. Lim, Schizophrenia Bulletin 35, 253–253(2009).
[56] M. Cutolo, C. Pizzorni, and A. Sulli, Best Practice &Research Clinical Rheumatology 19, 437–452(2005).
[57] A. L. Herrick and C. Hutchinson, Best Practice &Research Clinical Rheumatology 18, 957–979(2004).
[58] K. Borysewicz, European Journal of Pain 13, S55–S285 (2009).
[59] F. Ingegnoli, R. Gualtierotti, C. Lubatti, L. Zahalko-va, L. Meani, P. Boracchi, S. Zeni, and F. Fantini,Seminars in Arthritis and Rheumatism 38, 289–295(2009).
[60] P. T. Goedhart, Opt. Express 15, 15101–15114(2007).
[61] M. Rossi and A. Carpi, Biomedicine & Pharma-cotherapy 58, 427–431 (2004).
[62] K. C. Vollebregt, K. Boer, K. R. Mathura, J. C. deGraaff, D. T. Ubbink, and C. Ince, British Journal ofObstetrics and Gynaecology 108, 1148–1153 (2001).
[63] F. Schiavon, P. Maffei, C. Martini, E. De Carlo,C. Fais, S. Todesco, and N. Sicolo, The Journal ofClinical Endocrinology & Metabolism 84, 3151–3155(1999).
[64] W. Haenggi, H. R. Linder, M. H. Birkhaeuser, andH. Schneider, Maturitas 22, 37–46 (1994).
[65] H. Kurvers, M. Jacobs, R. J. Beuk, F. Vandenwilden-berg, P. Kitslaar, D. W. Slaaf, and R. S. Reneman,Pain 60, 333–340 (1995).
[66] O. Bongard, A. Boccara, B. Cense, C. Dainty, D. Ma-lonek, and E. Beaurepaire, Circulation 86, 878–886(1992).
[67] P. Gasser and O. Meienberg, Eur Neurol. 31, 168–171 (1991).
[68] P. Gasser and F. R. Buhler, J. Hypertens. 10, 83–86(1992).
[69] C. S. Danzer and D. R. Hooker, Amer. J. Physiol.52, 136 (1920).
[70] P. Baumbach, Understanding transcutaneous PO2
and PCO2 measurements (Radiometer Publications,Copenhagen, 1985), pp. 14–18.
[71] K. H. Tonnesen and P. Sejrsen, Acta PhysiologicaScandinavica S68, 202 (1966).
[72] P. Sejrsen, Scandinavian Journal of Clinical & La-boratory Investigation S19, 52 (1967).
[73] P. Sejrsen, Circulation Research 25, 215 (1969).[74] C. Holm, M. Mayr, E. Hofter, A. Becker, U. J. Pfeif-
fer, and W. Muhlbauer, British Journal of PlasticSurgery 55, 635–644 (2002).
[75] J. M. Still, E. J. Law, K. G. Klavuhn, T. C. Island,and J. Z. Holtz, Burns 27, 364–371 (2001).
[76] L. Balacumaraswami, Y. Abu-Omar, B. Choudhary,D. Pigott, and D. P. Taggart, Journal of Thoracic andCardiovascular Surgery 130, 315–320 (2005).
[77] V. P. Zharov, E. I. Galanzha, E. V. Shashkov, N. G.Khlebtsov, and V. V. Tuchin, Optics Letters 31,3623–3625 (2006).
[78] E. M. Sevick-Muraca, R. Sharma, J. C. Rasmussen,M. V. Marshall, J. A. Wendt, H. Q. Pham, E. Bone-fas, J. P. Houston, L. Sampath, K. E. Adams, D. K.Blanchard, R. E. Fisher, S. B. Chiang, R. Elledge,and M. E. Mawad, Radiology 246, 734–741 (2008).
[79] S. G. Sakka, K. Reinhart, and A. Meier-Hellmann,Intensive Care Medicine 25, 843–846 (1999).
[80] W. Ganz, K. Tamura, H. S. Marcus, R. Donoso,S. Yoshida, and H. J. C. Swan, Circulation 44, 181–195 (1971).
[81] T. Nishikawa and S. Dohi, Canadian Journal ofAnaesthesia – Journal Canadien D Anesthesie 40,142–153 (1993).
[82] T. Nishikawa and S. Dohi, European Journal ofAnaesthesiology 10, 321–329 (1993).
[83] A. van Grondelle, R. V. Ditchey, B. M. Groves,W. W. Wagner Jr., and J. T. Reeves, Am. J. Physiol.Heart Circ. Physiol. 245, H690–H692 (1983).
S. M. Daly and M. J. Leahy: A review of methods and advancements in blood flow imaging246
Journal of
BIOPHOTONICS
# 2013 by WILEY-VCH Verlag GmbH & Co. KGaA, Weinheim www.biophotonics-journal.org
[84] F. Y. Ozbebit, F. Esen, S. Gulec, and H. Esen, Micro-vascular Research 67, 207–214 (2004).
[85] J. E. Francis, R. Roggli, T. J. Love, and C. P. Robin-son, Journal of Biomechanical Engineering – Trans-actions of the Asme 101, 246–249 (1979).
[86] H. P. Henderson and M. E. J. Hackett, Angiology29, 65–75 (1978).
[87] J. R. T. Manson, M. M. Abd-Alrazzal, J. Ausobsky,P. A. Matthews, and R. C. Kester, The use of micro-wave emisson thermography in peripheral vasculardisease – a preliminary study (Biological Engineer-ing Society, London, 1985).
[88] A. L. Herrick and S. Clark, Annals of the Rheu-matic Diseases 57, 70–78 (1998).
[89] G. E. Nilsson, T. Tenland, and P. A. Oberg, Physicsin Medicine and Biology 25, 987–988 (1980).
[90] G. E. Nilsson, T. Tenland, and P. A. Oberg, IeeeTransactions on Biomedical Engineering 27, 597–604 (1980).
[91] C. Riva, G. B. Benedek, and B. Ross, InvestigativeOphthalmology 11, 936–944 (1972).
[92] M. D. Stern, Nature 254, 56–58 (1975).[93] M. J. Leahy, F. F. de Mul, G. E. Nilsson, and R. Ma-
niewski, Technol Health Care 7, 143–162 (1999).[94] A. Serov, B. Steinacher, and T. Lasser, Optics Ex-
press 13, 3681–3689 (2005).[95] D. Watkins and G. A. Holloway, Ieee Transactions
on Biomedical Engineering 25, 28–33 (1978).[96] M. E. Anderson, T. L. Moore, M. Lunt, and A. L.
Herrick, Rheumatology 43, 986–991 (2004).[97] D. P. Dave and T. E. Milner, Optics Letters 25,
1523–1525 (2000).[98] M. D. Kulkarni, T. G. van Leeuwen, S. Yazdanfar,
and J. A. Izatt, Optics Letters 23, 1057–1059 (1998).[99] H. C. Hendargo, R. P. McNabb, A.-H. Dhalla,
N. Shepherd, and J. A. Izatt, Biomedical Optics Ex-press 2, 2175–2188 (2011).
[100] A. H. Bachman, R. A. Leitgeb, and T. Lasser, Opt.Express 14, 1487–1496 (2006).
[101] S. Monstrey, H. Hoeksema, J. Verbelen, A. Pirayesh,and P. Blondeel, Burns 34, 761–769 (2008).
[102] Z. B. M. Niazi, T. J. H. Essex, R. Papini, D. Scott,N. R. McLean, and M. J. M. Black, Burns 19, 485–489 (1993).
[103] I. Wang, S. Andersson-Engels, G. E. Nilsson, K. War-dell, and K. Svanberg, British Journal of Dermatol-ogy 136, 184–189 (1997).
[104] W. R. Ferrell, P. V. Balint, and R. D. Sturrock, Rheu-matology 39, 1214–1217 (2000).
[105] J. D. Briers, Physiological Measurement 22, R35–R66 (2001).
[106] G. Royl, C. Leithner, H. Sellien, J. P. Muller, D. Me-gow, N. Offenhauser, J. Steinbrink, M. Kohl-Bareis,U. Dirnagl, and U. Lindauer, Brain Research 1121,95–103 (2006).
[107] N. A. Fomin, Speckle Photography for Fluid Me-chanics Measurements (Springer, Berlin, Heidelberg,1998).
[108] J. W. Goodman, Speckle Phenomena in Optics: The-ory and Applications (Roberts & Co., Berlin, 2006).
[109] K. R. Forrester, C. Stewart, J. Tulip, C. Leonard, andR. C. Bray, Medical & Biological Engineering &Computing 40, 687–697 (2002).
[110] D. A. Boas and A. K. Dunn, J. Biomed. Opt. 15,011109 (2010).
[111] J. D. Briers and S. Webster, J. Biomed. Opt. 1, 174–179 (1996).
[112] D. D. Duncan and S. J. Kirkpatrick, Journal of theOptical Society of America a-Optics Image Scienceand Vision 25, 2088–2094 (2008).
[113] M. Draijer, E. Hondebrink, T. v. Leeuwen, andW. Steenbergen, Lasers Med Sci. 24, 639–651(2009).
[114] K. R. Forrester, C. Stewart, C. Leonard, J. Tulip, andR. C. Bray, Lasers in Surgery and Medicine 33, 151–157 (2003).
[115] C. J. Stewart, C. L. Gallant-Behm, K. Forrester,J. Tulip, D. A. Hart, and R. C. Bray, Skin Researchand Technology 12, 247–253 (2006).
[116] P. Zakharov, A. Volker, A. Buck, B. Weber, andF. Scheffold, Optics Letters 31, 3465–3467 (2006).
[117] D. D. Duncan, P. Lemaillet, M. Ibrahim, Q. D.Nguyen, M. Hiller, and J. Ramella-Roman, Journalof Biomedical Optics 15, 056014 (2010).
[118] A. B. Parthasarathy, W. J. Tom, A. Gopal, X. J. Zhang,and A. K. Dunn, Optics Express 16, 1975–1989(2008).
[119] B. Choi, N. M. Kang, and J. S. Nelson, MicrovascularResearch 68, 143–146 (2004).
[120] Z. J. Du, T. Zan, H. Li, and Q. F. Li, MicrovascularResearch 82, 284–290 (2011).
[121] H. Y. Cheng, Q. M. Luo, Q. Liu, Q. A. Lu, H. Gong,and S. Q. Zeng, Physics in Medicine and Biology 49,1347–1357 (2004).
[122] A. Kharlamov, B. R. Brown, K. A. Easley, and S. C.Jones, Neuroscience Letters 368, 151–156 (2004).
[123] P. Zakharov, A. C. Voelker, M. T. Wyss, F. Haiss,N. Calcinaghi, C. Zunzunegui, A. Buck, F. Scheffold,and B. Weber, Optics Express 17, 13904–13917(2009).
[124] Z. Wang, W. Luo, P. Li, J. Qiu, and Q. Luo, Journalof Biomedical Optics 13, 064023 (2008).
[125] N. Feng, J. Qiu, P. Li, X. Sun, C. Yin, W. Luo,S. Chen, and Q. Luo, Optics Express 19, 15777–15791 (2011).
[126] S. G. Demos and R. R. Alfano, Applied Optics 36,150–155 (1997).
[127] A. Ishimaru, Applied Optics 28, 2210–2215 (1989).[128] D. F. T. Silva, B. C. Vidal, D. M. Zezell, T. M. Zorn,
S. C. Nunez, and M. S. Ribeiro, Journal of Biomedi-cal Optics 11, 024002 (2006).
[129] J. M. Schmitt, A. H. Gandjbakhche, and R. F. Bon-ner, Applied Optics 31, 6535–6546 (1992).
[130] F. C. Mackintosh, J. X. Zhu, D. J. Pine, and D. A.Weitz, Physical Review B 40, 9342–9345 (1989).
[131] J. O’Doherty, J. Henricson, C. Anderson, M. J. Leahy,G. E. Nilsson, and F. Sjoberg, Skin Research andTechnology 13, 472–484 (2007).
[132] S. L. Jacques, J. C. Ramella-Roman, and K. Lee,Journal of Biomedical Optics 7, 329–340 (2002).
J. Biophotonics 6, No. 3 (2013) 247
REVIEWREVIEWARTICLEARTICLE
# 2013 by WILEY-VCH Verlag GmbH & Co. KGaA, Weinheimwww.biophotonics-journal.org

[133] W. Groner, J. W. Winkelman, A. G. Harris, C. Ince,G. J. Bouma, K. Messmer, and R. G. Nadeau, Nat-ure Medicine 5, 1209–1213 (1999).
[134] J. O’Doherty, Assessment of Tissue Viability by Po-larised Light Spectroscopy, by P. M. J. Leahy (Uni-versity of Limerick, 2007).
[135] M. G. D. Karlsson and K. Wardell, Journal of Bio-medical Optics 10, 064002 (2005).
[136] Z. J. Smith and A. J. Berger, Optics Letters 30,1363–1365 (2005).
[137] S. M. Milner, S. Bhat, S. Gulati, G. Gherardini, C. E.Smith, and R. J. Bick, Burns 31, 316–319 (2005).
[138] S. Langer, A. G. Harris, P. Biberthaler, E. von Dob-schuetz, and K. Messmer, Transplantation 71, 1249–1256 (2001).
[139] C. A. den Uil, E. Klijn, W. K. Lagrand, J. J. Brugts,C. Ince, P. E. Spronk, and M. L. Simoons, Progressin Cardiovascular Diseases 51, 161–170 (2008).
[140] C. M. Treu, O. Lupi, D. A. Bottino, and E. Bouskela,Archives of Dermatological Research 303, 69–78(2011).
[141] V. Cerny, Z. Turek, and R. Parizkova, PhysiologicalResearch 56, 141–147 (2007).
[142] J. Lindert, J. Werner, M. Redlin, H. Kuppe, H. Ha-bazettl, and A. R. Pries, Journal of Vascular Re-search 39, 368–372 (2002).
[143] M. Heger, J. F. Beek, K. Stenback, D. J. Faber, M. J.C. van Gemert, and C. Ince, Optics Express 13,702–715 (2005).
[144] C. Ince, Critical Care 9, S13–S19 (2005).[145] P. E. Spronk, C. Ince, M. J. Gardien, K. R. Mathura,
H. M. Oudemans-van Straaten, and D. F. Zandstra,Lancet 360, 1395–1396 (2002).
[146] Y. Sakr, M. J. Dubois, D. De Backer, J. Creteur, andJ. L. Vincent, Critical Care Medicine 32, 1825–1831(2004).
[147] H. A. Lehr, F. Bittinger, and C. J. Kirkpatrick, Jour-nal of Pathology 190, 373–386 (2000).
[148] A. G. Harris, I. Sinitsina, and K. Messmer, Journalof Vascular Research 37, 469–476 (2000).
[149] K. R. Mathura, K. C. Vollebregt, K. Boer, J. C. DeGraaff, D. T. Ubbink, and C. Ince, Journal of Ap-plied Physiology 91, 74–78 (2001).
[150] P. A. Payne, R. Y. Faddoul, and S. M. Jawad, Practi-cal Aspects of Skin Blood Flow Measurement (Bio-logical Engineering Society, London, 1985).
[151] P. Atkinson and J. P. Woodcock, Doppler Ultrasoundand its use in Clinical Measurement (Academic,London, 1982).
[152] F. S. Foster, P. N. Burns, D. H. Simpson, S. R. Wil-son, D. A. Christopher, and D. E. Goertz, Cancerand Metastasis Reviews 19, 131–138 (2000).
[153] S. D. Bos and H. J. A. Mensink, Scandinavian Jour-nal of Urology and Nephrology 32, 87–91 (1998).
[154] M. I. Novis, R. H. Baroni, L. M. D. Cerri, R. L. Mat-tedi, and C. A. Buchpiguel, Clinics 66, 27–34 (2011).
[155] E. Epstein, C. Van Holsbeke, F. Mascilini, A. Mas-back, P. Kannisto, L. Ameye, D. Fischerova, G. Zan-noni, V. Vellone, D. Timmerman, and A. C. Testa,
Ultrasound in Obstetrics & Gynecology 38, 586–593(2011).
[156] A. M. Y. Cheung, A. S. Brown, V. Cucevic, M. Roy,A. Needles, V. Yang, D. J. Hicklin, R. S. Kerbel, andF. S. Foster, Ultrasound in Medicine and Biology 33,1259–1268 (2007).
[157] F. S. Foster, J. Mehi, M. Lukacs, D. Hirson, C. White,C. Chaggares, and A. Needles, Ultrasound in Medi-cine and Biology 35, 1700–1708 (2009).
[158] H. Becher and P. N. Burns, Handbook of ContrastEchocardiography (Springer, Berlin, 2000).
[159] P. N. Burns, J. E. Powers, and T. Fritzsch, Radiology185, 142 (1992).
[160] K. K. Hodge, J. E. McNeal, M. K. Terris, and T. A.Stamey, Journal of Urology 142, 71–75 (1989).
[161] B. G. Ewigman, J. P. Crane, F. D. Frigoletto, M. L.Lefevre, R. P. Bain, and D. McNellis, New EnglandJournal of Medicine 329, 821–827 (1993).
[162] J. Flammer, S. Orgul, V. P. Costa, N. Orzalesi, G. K.Krieglstein, L. M. Serra, J. P. Renard, and E. Ste-fansson, Progress in Retinal and Eye Research 21,359–393 (2002).
[163] N. G. Pandian, A. Kreis, B. Brockway, J. M. Isner,A. Sacharoff, E. Boleza, R. Caro, and D. Muller,American Journal of Cardiology 62, 493–494 (1988).
[164] G. Heiss, A. R. Sharrett, R. Barnes, L. E. Chamb-less, M. Szklo, and C. Alzola, American Journal ofEpidemiology 134, 250–256 (1991).
[165] F. S. Foster, C. J. Pavlin, K. A. Harasiewicz, D. A.Christopher, and D. H. Turnbull, Ultrasound inMedicine and Biology 26, 1–27 (2000).
[166] R. J. Wakefield, P. V. Balint, M. Szkudlarek, E. Filip-pucci, M. Backhaus, M. A. D’Agostino, E. N. San-chez, A. Iagnocco, W. A. Schmidt, G. Bruyn, D. Kane,P. J. O’Connor, B. Manger, F. Joshua, J. Koski,W. Grassi, M. N. D. Lassere, N. Swen, F. Kainberger,A. Klauser, M. Ostergaard, A. K. Brown, K. P. Mac-hold, and P. G. Conaghan, Journal of Rheumatology32, 2485–2487 (2005).
[167] P. C. Lauterbur, Nature 242, 190–191 (1973).[168] P. G. Mansfield and P. K. Grannell, J. Phys. C 6,
L422 (1973).[169] A. Berger, British Medical Journal 324, 35–35
(2002).[170] F. Mirrashed and J. C. Sharp, Skin Research and
Technology 10, 149–160 (2004).[171] C. M. Kerskens, R. M. Piech, and J. F. M. Meaney,
Microcirculation Imaging (Wiley-VCH, Weinheim,2012).
[172] R. J. Kim, E. Wu, A. Rafael, E. L. Chen, M. A. Par-ker, O. Simonetti, F. J. Klocke, R. O. Bonow, andR. M. Judd, New England Journal of Medicine 343,1445–1453 (2000).
[173] P. Caravan, J. J. Ellison, T. J. McMurry, and R. B.Lauffer, Chemical Reviews 99, 2293–2352 (1999).
[174] J. K. T. Lee, S. S. Sagel, R. J. Stanley, and J. P. Hei-ken, Computed Body Tomography with MRI Corre-lation (Lippincott, Williams and Wilkins, Philadel-phia, PA, 2005).
S. M. Daly and M. J. Leahy: A review of methods and advancements in blood flow imaging248
Journal of
BIOPHOTONICS
# 2013 by WILEY-VCH Verlag GmbH & Co. KGaA, Weinheim www.biophotonics-journal.org

[175] G. J. Wilson, R. M. Hoogeveen, W. A. Willinek,R. Muthupillai, and J. H. Maki, Top Magn ResonImaging 15, 169–185 (2004).
[176] E. K. Yucel, C. M. Anderson, R. R. Edelman, T. M.Grist, R. A. Baum, W. J. Manning, A. Culebras, andW. Pearce, Circulation 100, 2284–2301 (1999).
[177] D. L. Parker, C. Yuan, and D. D. Blatter, MagneticResonance in Medicine 17, 434–451 (1991).
[178] L. Faggioni, V. Zampa, S. Ortori, E. Picano, R. DeLucia, E. Soldati, M. G. Bongiorni, E. Neri, andC. Bartolozzi, European Journal of Radiology 81,250–256 (2012).
[179] M. Neeman and H. Dafni, Annual Review of Bio-medical Engineering 5, 29–56 (2003).
[180] J. J. Oliver and D. J. Webb, Arteriosclerosis Throm-bosis and Vascular Biology 23, 554–566 (2003).
[181] D. J. Loeffelbein, M. Souvatzoglou, V. Wankerl,A. Martinez-Moller, J. Dinges, M. Schwaiger, andA. J. Beer, Journal of Oral and Maxillofacial Surgery70, 473–483 (2012).
[182] C. de Bazelaire, M. Chapellier, A. Pluvinage, A. Sce-mama, F. Pilehvari, P. Bourrier, J. Frija, and E. deKerviler, Oncologie 12, 187–196 (2010).
[183] A. Cuocolo, W. Acampa, M. Imbriaco, N. De Luca,G. L. Iovino, and M. Salvatore, Quarterly Journal ofNuclear Medicine and Molecular Imaging 49, 4–18(2005).
[184] K. Nassenstein, S. Orzada, L. Haering, A. Czylwik,M. Zenge, H. Eberle, T. Schlosser, O. Bruder, E. Mul-ler, M. E. Ladd, and S. Maderwald, European Radi-ology 22, 559–568 (2012).
[185] J. W. Belliveau, D. N. Kennedy, Jr., R. C. McKinstry,B. R. Buchbinder, R. M. Weisskoff, M. S. Cohen,J. M. Vevea, T. J. Brady, and B. R. Rosen, Science254, 716–719 (1991).
[186] E. R. Freilich and W. D. Gaillard, Current Neurol-ogy and Neuroscience Reports 10, 40–46 (2010).
[187] P. E. Valk, D. Delbeke, and D. L. Bailey, Positronemission tomography: clinical practice (Springer,2006).
[188] U. S. National Research Council, in: Mathematicsand physics of emerging biomedical imaging (Com-mittee on the Mathematics and Physics of EmergingDynamic Biomedical Imaging (National AcademyPress, Washington D.C., 1996).
[189] D. W. Townsend, Annals Academy of Medicine Sin-gapore 33, 133–145 (2004).
[190] H. Ito, I. Kanno, M. Ibaraki, J. Hatazawa, andS. Miura, Journal of Cerebral Blood Flow and Meta-bolism 23, 665–670 (2003).
[191] C. Wilson, A. A. Lammertsma, C. G. McKenzie, K. Si-kora, and T. Jones, Cancer Research 52, 1592–1597(1992).
[192] S. Minoshima, B. Giordani, S. Berent, K. A. Frey,N. L. Foster, and D. E. Kuhl, Annals of Neurology42, 85–94 (1997).
[193] S. Minoshima, N. L. Foster, K. A. Frey, R. L. Wahl,J. H. Burdette, and D. E. Kuhl, Journal of NuclearMedicine 38, 257–257 (1997).
[194] A. M. Owen, J. Doyon, A. Dagher, A. Sadikot, andA. C. Evans, Brain 121, 949–965 (1998).
[195] J. S. Rakshi, T. Uema, K. Ito, D. L. Bailey, P. K. Mor-rish, J. Ashburner, A. Dagher, I. H. Jenkins, K. J. Fris-ton, and D. J. Brooks, Brain 122, 1637–1650 (1999).
[196] H. Stefan, G. Pawlik, H. G. Bocherschwarz, H. J.Biersack, W. Burr, H. Penin, and W. D. Heiss, Jour-nal of Neurology 234, 377–384 (1987).
[197] S. S. Spencer, Epilepsia 35, S72–S89 (1994).[198] O. Muzik, E. A. da Silva, C. Juhasz, D. C. Chugani,
J. Shah, F. Nagy, A. Canady, H. M. von Stockhausen,K. Herholz, J. Gates, M. Frost, F. Ritter, C. Watson,and H. T. Chugani, Neurology 54, 171–179 (2000).
[199] G. D. Hutchins, M. Schwaiger, K. C. Rosenspire,J. Krivokapich, H. Schelbert, and D. E. Kuhl, Journalof the American College of Cardiology 15, 1032–1042 (1990).
[200] R. O. Bonow, V. Dilsizian, A. Cuocolo, and S. L. Ba-charach, Circulation 83, 26–37 (1991).
[201] B. A. Dwamena, S. S. Sonnad, J. O. Angobaldo, andR. L. Wahl, Radiology 213, 530–536 (1999).
[202] K. Kinkel, Y. Lu, M. Both, R. S. Warren, and R. F.Thoeni, Radiology 224, 748–756 (2002).
[203] M. Karam, S. Roberts-Klein, N. Shet, J. Chang, andP. Feustel, Journal of Nuclear Medicine 49, 1429–1436 (2008).
[204] R. Vikram, H. D. W. Yeung, H. A. Macapinlac, andR. B. Iyer, American Journal of Roentgenology 191,1545–1551 (2008).
[205] M. L. Jan, K. S. Chuang, G. W. Chen, Y. C. Ni, S. Chen,C. H. Chang, J. Wu, T. W. Lee, and Y. K. Fu, IeeeTransactions on Medical Imaging 24, 886–893 (2005).
[206] H. Corrodi and G. Jonsson, Journal of Histochemis-try & Cytochemistry 15, 65–78 (1967).
[207] K. Takano, J. Sato, H. Shirasaki, N. Yamazaki, K. Ho-ki, and T. Himi, Auris Nasus Larynx 31, 161–163(2004).
[208] I. C. MacDonald, A. C. Groom, and A. F. Chambers,Bioessays 24, 885–893 (2002).
[209] R. J. Motzer, J. Bacik, T. Mariani, P. Russo, M. Ma-zumdar, and V. Reuter, Journal of Clinical Oncology20, 2376–2381 (2002).
[210] M. L. Woods, C. J. Koch, and E. M. Lord, Interna-tional Journal of Radiation Oncology Biology Phy-sics 34, 93–101 (1996).
[211] A. K. H. Kwok, W. W. Y. Li, C. P. Pang, T. Y. Y. Lai,G. H. F. Yam, N. R. Chan, and D. S. C. Lam, Ame-rican Journal of Ophthalmology 132, 178–183 (2001).
[212] M. Mori, Y. Adachi, T. Matsushima, H. Matsuda,H. Kuwano, and K. Sugimachi, American Journal ofGastroenterology 88, 701–705 (1993).
[213] E. P. Walker, P. H. Butler, J. W. Pickering, W. A. Day,R. Fraser, and C. N. Vanhalewyn, British Journal ofDermatology 121, 217–223 (1989).
[214] D. B. Apfelberg, J. Kosek, M. R. Maser, and H. Lash,British Journal of Plastic Surgery 32, 232–237(1979).
[215] J. W. Buecker, J. L. Ratz, and D. F. Richfield, Journalof the American Academy of Dermatology 10,1014–1019 (1984).
J. Biophotonics 6, No. 3 (2013) 249
REVIEWREVIEWARTICLEARTICLE
# 2013 by WILEY-VCH Verlag GmbH & Co. KGaA, Weinheimwww.biophotonics-journal.org

[216] B. Sung, M. S. Kim, B. C. Lee, J. S. Yoo, S. H. Lee,Y. J. Kim, K. W. Kim, and K. S. Soh, Naturwis-senschaften 95, 117–124 (2008).
[217] A. Sarasa-Renedo, A. Darrell, and J. Ripoli, in: Hand-book of Photonics for Biomedical Science, V. V. Tu-chin (ed.) (CRC Press, Boca Raton, FL, 2010).
[218] J. R. Walls, J. G. Sled, J. Sharpe, and R. M. Henkel-man, Physics in Medicine and Biology 52, 2775–2790 (2007).
[219] V. V. Tuchin, Journal of Physics D – Applied Physics38, 2497–2518 (2005).
[220] J. Sharpe, U. Ahlgren, P. Perry, B. Hill, A. Ross,J. Hecksher-Sorensen, R. Baldock, and D. Davidson,Science 296, 541–545 (2002).
[221] A. C. Kak and M. Slaney, Principles of Computer-ized Tomographic Imaging (IEEE Press, 1988).
[222] J. Sharpe, Journal of Anatomy 202, 175–181 (2003).[223] J. Sharpe, Annual Review of Biomedical Engineer-
ing 6, 209–228 (2004).[224] T. Alanentalo, A. Asayesh, H. Morrison, C. E. Lo-
ren, D. Holmberg, J. Sharpe, and U. Ahlgren, NatureMethods 4, 31–33 (2007).
[225] M. Oldham, H. Sakhalkar, Y. M. Wang, P. Y. Guo,T. Oliver, R. Bentley, Z. Vujaskovic, and M. Dewhirst,Journal of Biomedical Optics 12, 014009 (2007).
[226] J. Kerwin, M. Scott, J. Sharpe, L. Puelles, S. C. Rob-son, M. Martinez-de-la-Torre, J. L. Ferran, G. J. Feng,R. Baldock, T. Strachan, D. Davidson, and S. Lind-say, BMC Neuroscience 5, 27 (2004).
[227] M. Fauver, E. J. Seibel, J. R. Rahn, M. G. Meyer,F. W. Patten, T. Neumann, and A. C. Nelson, OpticsExpress 13, 4210–4223 (2005).
[228] R. A. Rahim, M. H. F. Rahiman, C. L. Goh, S. Z. M.Muji, H. A. Rahim, and Y. M. Yunos, Sensors andActuators a-Physical 161, 53–61 (2010).
[229] R. A. Rahim, P. J. Fea, C. K. San, and L. L. Chean,Advanced Powder Technology 16, 399–411 (2005).
[230] R. A. Rahim, K. T. Chiam, M. H. F. Rahiman, andP. Jayasuman, Ieee Sensors Journal 9, 1076–1083(2009).
[231] C. G. Arques, R. Doohan, J. Sharpe, and M. Torres,Development 134, 3713–3722 (2007).
[232] R. J. Bryson-Richardson and P. D. Currie, Zebrafish:2nd Edition Cellular and Developmental Biology,Vol. 76 (Academic Press, 2004).
[233] R. Kopelman and W. H. Tan, Science 262, 1382–1384 (1993).
[234] S. W. Hell and J. Wichmann, Optics Letters 19, 780–782 (1994).
[235] V. Westphal, J. Seeger, T. Salditt, and S. W. Hell,Journal of Physics B-Atomic Molecular and OpticalPhysics 38, S695–S705 (2005).
[236] G. Donnert, J. Keller, R. Medda, M. A. Andrei,S. O. Rizzoli, R. Lurmann, R. Jahn, C. Eggeling, andS. W. Hell, Proceedings of the National Academy ofSciences of the United States of America 103,11440–11445 (2006).
[237] E. Rittweger, K. Y. Han, S. E. Irvine, C. Eggeling,and S. W. Hell, Nature Photonics 3, 144–147 (2009).
[238] W. L. Chao, B. D. Harteneck, J. A. Liddle, E. H. An-derson, and D. T. Attwood, Nature 435, 1210–1213(2005).
[239] T. Wilson and C. J. R. Sheppard, Theory and Prac-tice of Optical Scanning Microscopy (Academic,London, 1984).
[240] T. A. Klar and S. W. Hell, Optics Letters 24, 954–956 (1999).
[241] W. Min, S. J. Lu, S. S. Chong, R. Roy, G. R. Holtom,and X. S. Xie, Nature 461, 1105–1109 (2009).
[242] C. F. Kuang and G. R. Wang, Lab on a Chip 10,240–245 (2010).
[243] Y. Kazoe, K. Mawatari, Y. Sugii, and T. Kitamori,Analytical Chemistry 83, 8152–8157 (2011).
[244] K. S. Morozova, K. D. Piatkevich, T. J. Gould, J. H.Zhang, J. Bewersdorf, and V. V. Verkhusha, Biophy-sical Journal 99, L13–L15 (2010).
[245] C. Sensen and B. Hallgremsson, Micro-ComputedTomography (Springer-Verlag, Berlin, Germany,2009), pp. 301–318.
[246] L. A. Feldkamp, L. C. Davis, and J. W. Kress, Jour-nal of the Optical Society of America a-Optics Im-age Science and Vision 1, 612–619 (1984).
[247] L. Zagorchev, P. Oses, Z. W. Zhuang, K. Moodie,M. J. Mulligan-Kehoe, M. Simons, and T. Couffinhal,Journal of Angiogenesis Research 2, 7 (2010).
[248] E. L. Ritman, Journal of Cellular Biochemistry 39,116–124 (2002).
[249] T. L. Kline and E. L. Ritman, in: MicrocirculationImaging, M. J. Leahy (ed.) (Wiley-VCH, Weinheim,2012).
[250] L. V. Wang and H.-I. Wu, Biomedical Optics: Princi-ples and Imaging (Wiley, Hoboken, NJ, 2007).
[251] R. Savai, A. C. Langheinrich, R. T. Schermuly, S. S.Pullamsetti, R. Dumitrascu, H. Traupe, W. S. Rau,W. Seeger, F. Grimminger, and A. Banat, Neoplasia11, 48–56 (2009).
[252] L. Zagorchev and M. J. Mulligan-Kehoe, EuropeanJournal of Radiology 70, 305–311 (2009).
[253] M. S. Morrison, S. A. Ricketts, J. Barnett, A. Cuth-bertson, J. Tessier, and S. R. Wedge, Journal of Nu-clear Medicine 50, 116–122 (2009).
[254] T. Miclau, C. Lu, Z. Thompson, P. Choi, C. Puttlitz,R. Marcucio, and J. A. Helms, Journal of Orthopae-dic Research 25, 1552–1558 (2007).
[255] A. Garcia-Sanz, A. Rodriguez-Barbero, M. D. Bent-ley, E. L. Ritman, and J. C. Romero, Hypertension31, 440–444 (1998).
[256] R. Iliescu, S. R. Fernandez, S. Kelsen, C. Marie, andA. R. Chade, Nephrology Dialysis Transplantation25, 1079–1087 (2010).
[257] V. Goh, S. Halligan, D. M. Wellsted, and C. I. Bar-tram, European Radiology 19, 79–89 (2009).
[258] D. A. Steinman, Annals of Biomedical Engineering30, 483–497 (2002).
[259] J. Suo, D. E. Ferrara, D. Sorescu, R. E. Guldberg,W. R. Taylor, and D. P. Giddens, ArteriosclerosisThrombosis and Vascular Biology, 27, 346–351(2007).
S. M. Daly and M. J. Leahy: A review of methods and advancements in blood flow imaging250
Journal of
BIOPHOTONICS
# 2013 by WILEY-VCH Verlag GmbH & Co. KGaA, Weinheim www.biophotonics-journal.org

[260] A. Lerman and E. L. Ritman, Herz 24, 531–533(1999).
[261] J. G. White, W. B. Amos, and M. Fordham, Journalof Cell Biology 105, 41–48 (1987).
[262] P. J. Tadrous, Journal of Pathology 191, 345–354(2000).
[263] J. Hueve, R. Wesselmann, M. Kahms, and R. Peters,Biophysical Journal 95, 877–885 (2008).
[264] F. Helmchen and W. Denk, Nature Methods 2, 932–940 (2005).
[265] C. Xu, W. Zipfel, J. B. Shear, R. M. Williams, andW. W. Webb, Proceedings of the National Academyof Sciences of the United States of America 93,10763–10768 (1996).
[266] W. Denk, J. H. Strickler, and W. W. Webb, Science248, 73–76 (1990).
[267] P. Theer, M. T. Hasan, and W. Denk, Optics Letters28, 1022–1024 (2003).
[268] S. Inoue, in: Handbook of Biological Confocal Mi-croscopy, J. B. Pawley (ed.) (Springer, New York,2006).
[269] K. Konig, Journal of Microscopy-Oxford 200, 83–104 (2000).
[270] S. M. Potter, S. E. Fraser, and J. Pine, Scanning, 18,147 (1996).
[271] S. A. Boppart, B. E. Bouma, M. E. Brezinski, G. J.Tearney, and J. G. Fujimoto, Journal of NeuroscienceMethods 70, 65–72 (1996).
[272] D. M. Shotton, Histochemistry and Cell Biology 104,97–137 (1995).
[273] J. M. Schmitt, M. J. Yadlowsky, and R. F. Bonner,Dermatology 191, 93–98 (1995).
[274] M. Garcia-Alloza and B. J. Bacskai, NeuromolecularMedicine 6, 65–78 (2004).
[275] Y. Tomita, N. Kubis, Y. Calando, A. T. Dinh, P. Me-ric, J. Seylaz, and E. Pinard, Journal of CerebralBlood Flow and Metabolism 25, 858–867 (2005).
[276] Z. G. Zhang, K. Davies, J. Prostak, J. Fenstermacher,and M. Chopp, Journal of Cerebral Blood Flow andMetabolism 19, 68–78 (1999).
[277] D. C. Morris, Z. G. Zhang, K. Davies, J. Fensterma-cher, and M. Chopp, Brain Research Protocols 4,185–191 (1999).
[278] M. J. Levene, D. A. Dombeck, K. A. Kasischke,R. P. Molloy, and W. W. Webb, Journal of Neurophy-siology 91, 1908–1912 (2004).
[279] W. H. Kim, C. I. Kim, S. W. Lee, S. H. Lim, C. W.Park, H. Lee, and M. K. Park, Journal of the OpticalSociety of Korea 14, 42–48 (2010).
[280] E. A. V. Jones, M. H. Baron, S. E. Fraser, and M. E.Dickinson, American Journal of Physiology-Heartand Circulatory Physiology 287, H1561–H1569(2004).
[281] N. D. Lawson and B. M. Weinstein, DevelopmentalBiology 248, 307–318 (2002).
[282] D. G. Buschke, J. M. Squirrell, H. Ansari, M. A. Smith,C. T. Rueden, J. C. Williams, G. E. Lyons, T. J.Kamp, K. W. Eliceiri, and B. M. Ogle, Microscopyand Microanalysis 17, 540–554 (2011).
[283] W. He, H. F. Wang, L. C. Hartmann, J. X. Cheng,and P. S. Low, Proceedings of the National Academyof Sciences of the United States of America 104,11760–11765 (2007).
[284] K. H. Kim, T. Ragan, M. J. R. Previte, K. Bahlmann,B. A. Harley, D. A. Wiktor-Brown, M. S. Stitt, C. A.Hendricks, K. H. Almeida, B. P. Engelward, andP. T. C. So, Cytometry Part A 71, 991–1002 (2007).
[285] E. R. Tkaczyk and A. H. Tkaczyk, Cytometry Part A79A, 775–788 (2011).
[286] T. Khokhlova, I. Pelivanov, and A. Karabutov, in:Handbook of Photonics for Biomedical Science,V. V. Tuchin (ed.) (CRC Press, Boca Raton, FL, 2010).
[287] R. A. Kruger, P. Y. Liu, Y. R. Fang, and C. R. Ap-pledorn, Medical Physics 22, 1605–1609 (1995).
[288] G. Paltauf, J. A. Viator, S. A. Prahl, and S. L. Jac-ques, Journal of the Acoustical Society of America112, 1536–1544 (2002).
[289] Y. Wang, D. Xing, Y. G. Zeng, and Q. Chen, Physicsin Medicine and Biology 49, 3117–3124 (2004).
[290] J. Laufer, D. Delpy, C. Elwell, and P. Beard, Physicsin Medicine and Biology 52, 141–168 (2007).
[291] A. Tabuchi, M. Mertens, H. Kuppe, A. R. Pries, andW. M. Kuebler, Journal of Applied Physiology 104,338–346 (2008).
[292] H. F. Zhang, K. Maslov, G. Stoica, and L. V. Wang,Nature Biotechnology 24, 848–851 (2006).
[293] S. Hu, K. Maslov, and L. V. Wang, Optics Express17, 7688–7693 (2009).
[294] K. Maslov, G. Stoica, and L. H. V. Wang, Optics Let-ters 30, 625–627 (2005).
[295] Z. Xie, L. V. Wang, and H. F. Zhang, Applied Optics48, 3204–3211 (2009).
[296] S. Hu, K. Maslov, and L. V. Wang, in: Handbook ofPhotonics for Biomedical Science, V. V. Tuchin (ed.)(CRC Press, Boca Raton, FL, 2010).
[297] S. Hu, K. Maslov, and L. V. Wang, Journal of Visua-lized Experiments, DOI: 10.3791/2729 (2011).
[298] H. Fang, K. Maslov, and L. V. Wang, Physical Re-view Letters 99, 184501 (2007).
[299] H. Fang, K. Maslov, and L. V. Wang, Applied Phy-sics Letters 91, 264103 (2007).
[300] H. Fang and L. V. Wang, in: Photoacoustic Imagingand Spectroscopy, L. V. Wang (CRC Press, Boca Ra-ton, FL, 2009).
[301] X. D. Wang, Y. J. Pang, G. Ku, X. Y. Xie, G. Stoica, andL. H. V. Wang, Nature Biotechnology 21, 803–806(2003).
[302] E. I. Galanzha, E. V. Shashkov, T. Kelly, J.-W. Kim,L. Yang, and V. P. Zharov, Nature Nanotechnology4, 855–860 (2009).
[303] S.-H. Yang, G.-Z. Yin, and D. Xing, Chinese PhysicsLetters 27, 094302 (2010).
[304] M. H. Xu and L. H. V. Wang, Physical Review E 71,016706 (2005).
[305] M. H. Xu and L. H. V. Wang, Review of ScientificInstruments 77, 041101 (2006).
[306] L. Wang, X. Xie, J.-T. Oh, M.-L. Li, G. Ku, S. Ke,S. Similache, C. Li, and G. Stoica, IEEE Engineering
J. Biophotonics 6, No. 3 (2013) 251
REVIEWREVIEWARTICLEARTICLE
# 2013 by WILEY-VCH Verlag GmbH & Co. KGaA, Weinheimwww.biophotonics-journal.org

in Medicine and Biology Society Conference 1, 190–192 (2005).
[307] P. P. Joshi, Y.-S. Chen, S. Kim, J. Shah, K. Sokolov,and S. Emelianov, IEEE Engineering in Medicineand Biology Society Conference 2009, 4106–4109(2009).
[308] D. Huang, E. A. Swanson, C. P. Lin, J. S. Schuman,W. G. Stinson, W. Chang, M. R. Hee, T. Flotte, K. Gre-gory, C. A. Puliafito, and J. G. Fujimoto, Science254, 1178–1181 (1991).
[309] W. Drexler and J. G. Fujimoto, Optical CoherenceTomography: Technology and Applications (Sprin-ger, 2008).
[310] M. R. Hee, E. A. Swanson, D. Huang, J. A. Izatt,C. P. Lin, J. S. Schuman, C. A. Puliafito, and J. G.Fujimoto, Investigative Ophthalmology & VisualScience 33, 722 (1992).
[311] J. M. Schmitt, IEEE Journal of Selected Topics inQuantum Electronics 5, 1205–1215 (1999).
[312] A. F. Fercher, K. Mengedoht, and W. Werner, OpticsLetters 13, 186–188 (1988).
[313] J. G. Fujimoto, Comptes Rendus De L AcademieDes Sciences Serie Iv Physique Astrophysique 2,1099–1111 (2001).
[314] H. C. Hendargo, R. P. McNabb, A. H. Dhalla, N. Shep-herd, and J. A. Izatt, Biomedical Optics Express 2,2175–2188 (2011).
[315] Z. Yaqoob, J. Wu, and C. Yang, BioTechniques 39,S6–S13 (2005).
[316] B. Liu and M. E. Brezinski, Journal of BiomedicalOptics 12, 044007 (2007).
[317] P. H. Tomlins and R. K. Wang, Journal of PhysicsD-Applied Physics 38, 2519–2535 (2005).
[318] J. Welzel, M. Bruhns, and H. H. Wolff, Archives ofDermatological Research 295, 50–55 (2003).
[319] J. G. Fujimoto, Nature Biotechnology 21, 1361–1367(2003).
[320] H. Yabushita, B. E. Bourna, S. L. Houser, T. Aretz,I. K. Jang, K. H. Schlendorf, C. R. Kauffman,M. Shishkov, D. H. Kang, E. F. Halpern, and G. J.Tearney, Circulation 106, 1640–1645 (2002).
[321] B. H. Park, C. Saxer, S. M. Srinivas, J. S. Nelson, andJ. F. de Boer, Journal of Biomedical Optics 6, 474–479 (2001).
[322] J. F. de Boer, S. M. Srinivas, A. Malekafzali, Z. P. Chen,and J. S. Nelson, Optics Express 3, 212–218 (1998).
[323] B. S. Atiyeh, S. W. Gunn, and S. N. Hayek, WorldJournal of Surgery 29, 131–148 (2005).
[324] J. F. Arevalo, C. F. Fernandez, and R. A. Garcia,Ophthalmology 112, 1612–1619 (2005).
[325] I. Svorenova, P. Strmen, and Z. Olah, BratislavaMedical Journal-Bratislavske Lekarske Listy 111,306–307 (2010).
[326] C. L. Shields, M. A. Materin, and J. A. Shields, Cur-rent opinion in ophthalmology 16, 141–154 (2005).
[327] G. Guagliumi, G. Musumeci, V. Sirbu, H. G. Bezer-ra, N. Suzuki, L. Fiocca, A. Matiashvili, N. Lortkipa-nidze, A. Trivisonno, O. Valsecchi, G. Biondi-Zoccai,and M. A. Costa, Jacc-Cardiovascular Interventions3, 531–539 (2010).
[328] A. F. Fercher, W. Drexler, C. K. Hitzenberger, andT. Lasser, Reports on Progress in Physics 66, 239–303 (2003).
[329] L. P. Hariri, G. T. Bonnema, K. Schmidt, A. M. Wink-ler, V. Korde, K. D. Hatch, J. R. Davis, M. A. Brewer,and J. K. Barton, Gynecologic Oncology 114, 188–194 (2009).
[330] H. J. Boehringer, E. Lankenau, F. Stellmacher,E. Reusche, G. Huettmann, and A. Giese, Acta Neu-rochirurgica 151, 507–517 (2009).
[331] E. V. Zagaynova, O. S. Streltsova, N. D. Gladkova,L. B. Snopova, G. V. Gelikonov, F. I. Feldchtein, andA. N. Morozov, Journal of Urology 167, 1492–1496(2002).
[332] S. A. Boppart, Minerva Biotecnologica 16, 211–237(2004).
[333] S. Mordon, V. Maunoury, P. Bulois, P. Desreumaux,and J. F. Colombel, Gastroenterologie Clinique EtBiologique 29, 618–620 (2005).
[334] T. Gambichler, V. Jaedicke, and S. Terras, Archivesof Dermatological Research 303, 457–473 (2011).
[335] J. Welzel, Skin Research and Technology 7, 1–9(2001).
[336] J. Welzel, E. Lankenau, R. Birngruber, and R. En-gelhardt, Current Problems in Dermatology 26, 27–37 (1998).
[337] C. Gimbel, Lasers in Surgery and Medicine Suppl.21 (41), 55–56 (2009).
[338] L. L. Otis, M. J. Everett, U. S. Sathyam, and B. W.Colston, Journal of the American Dental Associa-tion 131, 511 (2000).
[339] C. Pitris, A. Goodman, S. A. Boppart, J. J. Libus,J. G. Fujimoto, and M. E. Brezinski, Obstetrics andGynecology 93, 135–139 (1999).
[340] M. Ascencio, P. Collinet, M. Cosson, and S. Mordon,Journal de gynecologie, obstetrique et biologie de lareproduction 36, 749–55 (2007).
[341] F. Jaillon, S. Makita, and Y. Yasuno, Optics Express20, 385–396 (2011).
[342] B. Dunmire, K. W. Beach, K. H. Labs, M. Plett, andD. E. Strandness, Ultrasound in Medicine and Biol-ogy 26, 1213–1235 (2000).
[343] M. Rossow, W. W. Mantulin, and E. Gratton, Journalof Biomedical Optics 14, 024014 (2009).
[344] R. K. Wang, S. L. Jacques, Z. Ma, S. Hurst, S. R. Han-son, and A. Gruber, Optics Express 15, 4083–4097(2007).
[345] J. A. Izatt, M. D. Kulkami, S. Yazdanfar, J. K. Barton,and A. J. Welch, Optics Letters 22, 1439–1441 (1997).
[346] V. Guedes, J. S. Schuman, E. Hertzmark, G. Woll-stein, A. Correnti, R. Mancini, D. Lederer, S. Voska-nian, L. Velazquez, H. M. Pakter, T. Pedut-Kloiz-man, J. G. Fujimoto, and C. Mattox, Ophthalmology110, 177–189 (2003).
[347] S. Yazdanfar, A. M. Rollins, and J. A. Izatt, Archivesof Ophthalmology 121, 235–239 (2003).
[348] J. A. Izatt, M. R. Hee, E. A. Swanson, C. P. Lin,D. Huang, J. S. Schuman, C. A. Puliafito, and J. G.Fujimoto, Archives of Ophthalmology 112, 1584–1589 (1994).
S. M. Daly and M. J. Leahy: A review of methods and advancements in blood flow imaging252
Journal of
BIOPHOTONICS
# 2013 by WILEY-VCH Verlag GmbH & Co. KGaA, Weinheim www.biophotonics-journal.org

[349] M. Wojtkowski, A. Kowalczyk, R. Leitgeb, and A. F.Fercher, Optics Letters 27, 1415–1417 (2002).
[350] C. Wang, Y. Yang, Z. Ding, J. Meng, K. Wang,W. Yang, and Y. Xu, Journal of Biomedical Optics16, 046001 (2011).
[351] P. Li, A. Liu, L. Shi, X. Yin, S. Rugonyi, and R. K.Wang, Physics in Medicine and Biology 56, 7081–7092 (2011).
[352] J. Wierwille, P. M. Andrews, M. L. Onozato, J. Jiang,A. Cable, and Y. Chen, Laboratory Investigation 91,1596–1604 (2011).
[353] A. Needles, D. E. Goertz, A. M. Cheung, and F. S.Foster, Ultrasound in Medicine and Biology 33,591–600 (2007).
[354] A. Mariampillai, B. A. Standish, E. H. Moriyama,M. Khurana, N. R. Munce, M. K. K. Leung, J. Jiang,A. Cable, B. C. Wilson, I. A. Vitkin, and V. X. D.Yang, Optics Letters 33, 1530–1532 (2008).
[355] X. Liu, K. Zhang, Y. Huang, and J. U. Kang, Biome-dical Optics Express 2, 2995–3009 (2011).
[356] A. Mariampillai, M. K. K. Leung, M. Jarvi, B. A.Standish, K. Lee, B. C. Wilson, A. Vitkin, and V. X. D.Yang, Optics Letters 35, 1257–1259 (2010).
[357] J. Fingler, D. Schwartz, C. Yang, and S. E. Fraser,Optics Express 15, 12636–12653 (2007).
[358] N. Sudheendran, S. H. Syed, M. E. Dickinson, I. V.Larina, and K. V. Larin, Laser Physics Letters 8,247–252 (2011).
[359] R. K. Wang and L. An, Optics Express 17, 8926–8940 (2009).
[360] R. K. Wang, Optics Letters 33, 1878–1880 (2008).[361] Y. Jia, P. Li, and R. K. Wang, Journal of Biomedical
Optics 16, 096019 (2011).[362] Z. Zhi, W. Cepurna, E. Johnson, T. Shen, J. Morri-
son, and R. K. Wang, Biomedical Optics Express 2,579–591 (2011).
[363] R. K. Wang, L. An, P. Francis, and D. J. Wilson, Op-tics Letters 35, 1467–1469 (2010).
[364] L. An, J. Qin, and R. K. Wang, Optics Express 18,8220–8228 (2010).
[365] Z. Zhi, Y. Jung, Y. Jia, L. An, and R. K. Wang, Bio-medical Optics Express 2, 1059–1068 (2011).
[366] A. Mittag and A. Tarnok, in: Advanced OpticalFlow Cytometry, V. V. Tuchin (ed.) (Wiley-VCH,Weinheim, Germany, 2011).
[367] V. S. Varga, L. Ficsor, V. Kamaras, V. Jonas, T. Virag,Z. Tulassay, and B. Molnar, Cytometry Part A 75A,1020–1030 (2009).
[368] L. A. Kamentsky, D. E. Burger, R. J. Gershman,L. D. Kamentsky, and E. Luther, Acta Cytologica41, 123–143 (1997).
[369] J. M. Hatfield and W. C. Hymer, Endocrinology 119,2670–2682 (1986).
[370] S. Suzuki and N. Eguchi, Experimental Animals 48,107–114 (1999).
[371] B. Rotman, Proceedings of the National Academy ofSciences of the United States of America 47, 1981–1991 (1961).
[372] S. P. Perfetto, P. K. Chattopadhyay, and M. Roederer,Nature Reviews Immunology 4, 648–655 (2004).
[373] X. Wang, S. Chen, M. Kong, Z. Wang, K. D. Costa,R. A. Li, and D. Sun, Lab on a Chip 11, 3656–3662(2011).
[374] J. Enger, M. Goksor, K. Ramser, P. Hagberg, andD. Hanstorp, Lab on a Chip 4, 196–200 (2004).
[375] M. M. Wang, E. Tu, D. E. Raymond, J. M. Yang,H. C. Zhang, N. Hagen, B. Dees, E. M. Mercer,A. H. Forster, I. Kariv, P. J. Marchand, and W. F.Butler, Nature Biotechnology 23, 83–87 (2005).
[376] C. Q. Yi, C. W. Li, S. L. Ji, and M. S. Yang, AnalyticaChimica Acta 560, 1–23 (2006).
[377] D. Wlodkowic and Z. Darzynkiewicz, Methods inCell Biology, Vol. 102: Recent Advances in Cytome-try, Part a: Instrumentation, Methods, Fifth Edition(2011), pp. 105–125.
[378] J. P. Rigaut and J. Vassy, Analytical and QuantitativeCytology and Histology 13, 223–232 (1991).
[379] E. Bedner, L. T. Du, F. Traganos, and Z. Darzynkie-wicz, Cytometry 43, 38–45 (2001).
[380] R. M. P. Doornbos, B. G. deGrooth, and J. Greve,Cytometry 29, 204–214 (1997).
[381] T. Takada, M. Fujitsuka, and T. Majima, Proceedingsof the National Academy of Sciences of the UnitedStates of America 104, 11179–11183 (2007).
[382] V. P. Zharov, E. I. Galanzha, and V. V. Tuchin, Op-tics Letters 30, 628–630 (2005).
[383] G. Sitton and F. Srienc, Cytometry Part A 73A,538–545 (2008).
[384] M. E. K. Calvert, J. A. Lannigan, and L. F. Pember-ton, Cytometry Part A 73A, 825–833 (2008).
[385] H. Lecoeur, Experimental Cell Research 277, 1–14(2002).
[386] N. Yasuda, S. Matzno, C. Iwano, M. Nishikata, andK. Matsuyama, Journal of Pharmaceutical and Bio-medical Analysis 39, 712–717 (2005).
[387] S. Yasuhara, Y. Zhu, T. Matsui, N. Tipirneni, Y. Ya-suhara, M. Kaneki, A. Rosenzweig, and J. A. J. Mar-tyn, Journal of Histochemistry & Cytochemistry 51,873–885 (2003).
[388] J. P. Nolan and L. Yang, Briefings in FunctionalGenomics & Proteomics 6, 81–90 (2007).
[389] A. Castagnola, S. Eda, and J. L. Jurat-Fuentes, Dif-ferentiation 81, 192–198 (2011).
[390] S. K. Koester, J. U. Maenpaa, V. J. Wiebe, W. J. Ba-ker, G. T. Wurz, R. C. Seymour, R. E. Koehler, andM. W. Degregorio, Breast Cancer Research andTreatment 32, 57–65 (1994).
[391] S. A. Morgan, J. V. Watson, P. R. Twentyman, and P. J.Smith, British Journal of Cancer 60, 282–287 (1989).
[392] V. P. Zharov, E. I. Galanzha, and V. V. Tuchin, Jour-nal of Cellular Biochemistry 97, 916–932 (2006).
[393] V. P. Zharov, E. I. Galanzha, E. V. Shashkov, J.-W.Kim, N. G. Khlebtsov, and V. V. Tuchin, Journal ofBiomedical Optics 12, 051503 (2007).
[394] K. Wang, K. Wang, W. Li, T. Huang, R. Li, D. Wang,B. Shen, and X. Chen, Acta Radiologica 50, 1095–1103 (2009).
[395] S. J. Simpson, M. Vachula, M. J. Kennedy, H. Kaizer,J. S. Coon, R. Ghalie, S. Williams, and D. Vanepps,Experimental Hematology 23, 1062–1068 (1995).
J. Biophotonics 6, No. 3 (2013) 253
REVIEWREVIEWARTICLEARTICLE
# 2013 by WILEY-VCH Verlag GmbH & Co. KGaA, Weinheimwww.biophotonics-journal.org
[396] E. Bergers, P. J. vanDiest, and J. P. A. Baak, Journalof Clinical Pathology 49, 931–937 (1996).
[397] I. Brotherick, B. K. Shenton, M. Egan, W. E. Cun-liffe, D. A. Browell, L. G. Lunt, J. R. Young, andM. J. Higgs, European Journal of Cancer 32A, 2334–2341 (1996).
[398] F. Villalobos-Chavez, E. Carrillo-Garcia, R. Mora-les-Camacho, E. Franco-Macias, J. Millan-Pascual,and J. J. Rodriguez-Uranga, Revista De Neurologia40, 661–664 (2005).
[399] E. H. Park, Abstracts of Papers of the AmericanChemical Society 239, (2010).
[400] B. Gao, W.-g. Fu, Z.-h. Dong, Z.-d. Fang, Z.-j. Liu,Y. Si, X.-m. Zhang, and Y.-q. Wang, Chinese Medi-cal Journal 124, 298–303 (2011).
[401] S. P. Morgan and I. M. Stockford, in: Advanced Op-tical Flow Cytometry, V. V. Tuchin (ed.) (Wiley-VCH, Weinheim, Germany, 2011).
[402] M. J. Rossow, W. W. Mantulin, and E. Gratton, Jour-nal of Biomedical Optics 15, 026003 (2010).
[403] J. D. Briers and A. F. Fercher, Investigative Ophthal-mology & Visual Science 22, 255–259 (1982).
[404] B. Hebert, S. Costantino, and P. W. Wiseman, Bio-physical Journal 88, 3601–3614 (2005).
[405] B. Fagrell, A. Fronek, and M. Intaglietta, AmericanJournal of Physiology 233, H318–H321 (1977).
[406] A. Bollinger, P. Butti, J. P. Barras, H. Trachsle, andW. Siegenth, Microvascular Research 7, 61–72(1974).
[407] J. D. Briers and A. F. Fercher, Investigative Ophthal-mology & Visual Science 22, 255–259 (1982).
[408] H. H. Lipowsky, N. U. Sheikh, and D. M. Katz, J.Clin. Invest. 80, 117–127 (1987).
[409] B. Fagrell, International Journal of Microcirculation-Clinical and Experimental 15, 34–40 (1995).
[410] K. Jambunathan, X. Y. Ju, B. N. Dobbins, and S. Ash-forthfrost, Measurement Science & Technology 6,507–514 (1995).
[411] C. E. Willert and M. Gharib, Experiments in Fluids10, 181–193 (1991).
[412] J. Westerweel, Measurement Science & Technology8, 1379–1392 (1997).
[413] C. Keveloh and W. Staude, Applied Optics 22, 333–338 (1983).
[414] S. Jonas, D. Bhattacharya, M. K. Khokha, and M. A.Choma, Biomedical Optics Express 2, 2022–2034(2011).
[415] R. D. Keane and R. J. Adrian, Applied ScientificResearch 49, 191–215 (1992).
[416] X. T. Pan, H. Yu, X. K. Shi, V. Korzh, and T. Woh-land, Journal of Biomedical Optics 12, 014034(2007).
[417] A. Nakano, Y. Sugii, M. Minamiyama, J. Seki, andH. Niimi, JSME International Journal Series C –Mechanical Systems Machine Elements and Manu-facturing 48, 444–452 (2005).
[418] J. G. Santiago, S. T. Wereley, C. D. Meinhart, D. J.Beebe, and R. J. Adrian, Experiments in Fluids 25,316–319 (1998).
[419] R. Lima, S. Wada, K. Tsubota, and T. Yamaguchi,Measurement Science & Technology 17, 797–808(2006).
[420] H. R. Zheng, L. L. Liu, L. Williams, J. R. Hertzberg,C. Lanning, and R. Shandas, Applied Physics Letters88, 261915 (2006).
[421] R. A. Jamison, S. Dubsky, K. K. W. Siu, K. Houri-gan, and A. Fouras, Annals of Biomedical Engineer-ing 39, 1643–1653 (2011).
[422] M. A. Digman and E. Gratton, Biophysical Journal97, 665–673 (2009).
[423] M. J. Rossow, W. W. Mantulin, and E. Gratton, Jour-nal of Biomedical Optics 15, 026003 (2010).
[424] B. Hebert, S. Costantino, and P. W. Wiseman, Bio-physical Journal 88, 3601–3614 (2005).
[425] S. A. Hall, D. M. Wood, E. Ibraim, and G. Viggiani,Granular Matter 12, 1–14 (2010).
[426] J. Bove, B. Vaillancourt, J. Kroeger, P. K. Hepler,P. W. Wiseman, and A. Geitmann, Plant Physiology147, 1646–1658 (2008).
[427] A. S. Forouhar, M. Liebling, A. Hickerson, A. Nasi-raei-Moghaddam, H. J. Tsai, J. R. Hove, S. E. Fraser,M. E. Dickinson, and M. Gharib, Science 312, 751–753 (2006).
[428] J. K. Barton and S. Stromski, Optics Express 13,5234–5239 (2005).
[429] Y. Wang and R. K. Wang, Optics Letters 35, 3538–3540 (2010).
[430] H. Asai, Japanese Journal of Applied Physics 9,2279–2282 (1980).
[431] Z. P. Chen, Y. H. Zhao, S. M. Srinivas, J. S. Nelson,N. Prakash, and R. D. Frostig, IEEE Journal of Se-lected Topics in Quantum Electronics 5, 1134–1142(1999).
[432] Y. Wang and R. K. K. Wang, Optics Letters 36,2143–2145 (2011).
[433] V. J. Srinivasan, S. Sakadzic, I. Gorczynska, S. Ru-vinskaya, W. Wu, J. G. Fujimoto, and D. A. Boas,Optics Express 18, 2477–2494 (2010).
[434] J. Enfield, E. Jonathan, and M. J. Leahy, Biomed.Opt. Express 2, 1184–1193 (2011).
[435] Z. Y. Shen, M. Wang, Y. H. Ji, Y. H. He, X. S. Dai,P. Li, and H. Ma, Laser Physics Letters 8, 318–323(2011).
[436] S. M. Daly, C. Silien, and M. J. Leahy, Proc. SPIE8222, 82220H (2012).
[437] V. J. Srinivasan, H. Radhakrishnan, E. H. Lo, E. T.Mandeville, J. Y. Jiang, S. Barry, and A. E. Cable,Biomed. Opt. Express 3, 612–629 (2012).
[438] W. D. Bachalo, Applied Optics 19, 363–370 (1980).[439] K. Q. Xia, Y. B. Xin, and P. Tong, Journal of the Op-
tical Society of America a-Optics Image Science andVision 12, 1571–1578 (1995).
[440] A. Baumgartner, C. K. Hitzenberger, E. Ergun,M. Stur, H. Sattmann, W. Drexler, and A. F. Fercher,Graefes Archive for Clinical and ExperimentalOphthalmology 238, 385–392 (2000).
[441] A. H. Bachmann, R. Michaely, T. Lasser, and R. A.Leitgeb, Optics Express 15, 9254–9266 (2007).
S. M. Daly and M. J. Leahy: A review of methods and advancements in blood flow imaging254
Journal of
BIOPHOTONICS
# 2013 by WILEY-VCH Verlag GmbH & Co. KGaA, Weinheim www.biophotonics-journal.org

[442] N. V. Iftimia, D. X. Hammer, R. D. Ferguson, M. Mu-jat, D. Vu, and A. A. Ferrante, Optics Express 16,13624–13636 (2008).
[443] F. Jaillon, S. Makita, E.-J. Min, B. H. Lee, and Y. Ya-suno, Biomedical Optics Express 2, 1147–1158(2011).
[444] S. Makita, M. Yamanari, M. Miura, and Y. Yasuno,Proc. SPIE 7550, 75500E (2010).
[445] S. Zotter, M. Pircher, T. Torzicky, M. Bonesi, E. Got-zinger, R. A. Leitgeb, and C. K. Hitzenberger, Opt.Express 19, 1217–1227 (2011).
[446] Y. Imai and K. Iimura, Optics Communications 271,219–223 (2006).
J. Biophotonics 6, No. 3 (2013) 255
REVIEWREVIEWARTICLEARTICLE
# 2013 by WILEY-VCH Verlag GmbH & Co. KGaA, Weinheimwww.biophotonics-journal.org