→ fund manager commentary - pendal group
TRANSCRIPT
Fund Manager
Commentary
September quarter 2016
Contents
Australian Shares 3
International Shares 10
Australian Fixed Income 12
International Fixed Income 12
Credit 15
Cash 17
Australian Property 20
International Property 22
Active Balanced 25
Performance as at 30 September 2016 28
Fund Manager Commentary – September quarter 2016 3
Australian Shares
BT Wholesale Core Australian Share Fund
Market review
The S&P/ASX 300 Accumulation Index saw another quarter of sizeable swings to finish the period
5.2% higher. The bulk of these gains were attributable to the best July in size years as ‘Brexit’ fears
subsided. Speculation over supportive central bank activity also offered an updraft and helped lift the
S&P 500, NASDAQ and FTSE 100 to fresh record highs.
At the global macro level, investor attention remained focused on comments from Fed officials. With
rates unchanged over the quarter, Chairwoman Yellen steered market expectations towards a
December hike. This was alongside robust labour market data that included at 287,000 jump in the
closely-watched Non-Farm Payrolls report for July.
Across the Atlantic, the ECB left investors lacking confidence after it revealed an apparent absence of
plans post QE. In contrast, the Bank of England was cheered by markets after cutting the cash rate to
0.25% and unveiling a 170 billion pound stimulus package.
Turning the Asia, equity markets responded positively to the re-election of Shinzo Abe and promises
of further fiscal reform. The Bank of Japan’s new yield targeting measure was also seen as a
constructive move. Meanwhile in neighbouring China, strong economic data from the world’s largest
commodity consumer helped propel a rebound in base metal, coal and iron ore prices. Other areas of
the commodities complex endured significant swings, including crude oil (WTI: -0.2%) and gold
(-0.5%).
At home, the RBA cut rates to a new record low of 1.5% during the quarter and waved goodbye to
Glenn Stevens as Governor of the Board. Stevens cited sliding inflation as part of the rationale for
easing policy further, which was reflected in second quarter CPI data. Other economic data was more
constructive with the unemployment rate dropping 0.2% to 5.6% and GDP expanding 3.3% year-on-
year. The resilient local data and strong Chinese figures helped the AUD shrug off the rate cut to
finish 2.9% higher against its US counterpart.
Sector-wise, the Materials (+13.9%) space was the standout performer which was largely attributable
to the significant price gains for the miners’ key commodity exports. At the other end of the spectrum,
the ‘rate-sensitive’ areas including Telecommunications (-6.4%), Utilities (-2.3%) and REITs (-1.9%)
were the worst performers. This was driven by a significant recovery in global government bond rates,
which followed from 10 year yields in Australia and the US hitting new record lows early in the quarter.
Fund Manager Commentary – September quarter 2016 4
Finally from a stock-specific standpoint, investors were afforded an array of cues from the FY16
reporting season. Overall, results were underwhelming and earnings expectations for the broader
market were revised lower by -0.4%. There were numerous highlights including severe
disappointments and share price drops from CSL and QBE, while on the other side of the coin
Treasury Wine (TWE) and JB Hi-Fi (JBH) surprised on the upside. The former also featured in
noteworthy capital markets activity during the quarter with its deal to acquire rival retailer The Good
Guys.
Portfolio performance
The BT Wholesale Core Australian Share Fund returned 4.42% (post-fee, pre-tax) in the September
quarter 2016, underperforming its benchmark by 0.82%.
The portfolio made solid gains in the third quarter, although it lagged the index due primarily to the
effect of resources. The latter continues to benefit from an improvement in key commodity prices, with
some signs of supply discipline emerging in industries such as coal, while Chinese stimulus continues
to prop up demand. The S&P/ASX 300 Resources index posted a 12.9% gain for the quarter as a
result, outperforming the S&P/ASX 300 by 7.7%. The underweight in South32, Fortescue Metals and
BHP Billiton dragged on performance, although this was at least partly offset by the position in Rio
Tinto.
Contributors
ANZ, ANZ, OW, +14.6%
Shares in ANZ (+14.6%) enjoyed a strong recovery and ended the quarter higher despite a brief mid-
month pullback during September. Investor sentiment towards the major banks has become more
constructive in recent months as concerns over capital adequacy, a housing bust and intense
mortgage competition ameliorate. As these hurdles are cleared we see further upside for the sector,
which is at a multi-decade valuations discount to industrials. Within the area, ANZ is particularly
attractive based partly on the turnaround measures already undertaken and potential for continued
cost-outs.
Qantas, QAN, OW, +12.9%
Shares in Australia’s national carrier, Qantas (+12.9%), staged a healthy rebound over the quarter.
This was largely achieved in July alongside the pullback in the price of crude oil. The airliner also
reported a record pre-tax profit in August of $1.5 billion. While management had warned of softer
domestic demand it will manage capacity accordingly. At the same time, the international business
has performed well. Considering that revenues are on a firmer footing and significant cost-outs are
still yet to be achieved, we expect sizeable returns to shareholders and believe there is significant
upside for its share price.
Fund Manager Commentary – September quarter 2016 5
Macquarie Group, MQG, OW, +18.9%
A well-received first quarter FY17 earnings update released at the end of July offered an uplift for
Macquarie Group (MQG) through the quarter. The result was accompanied by reaffirmed earnings
guidance at its AGM. Management expects its full year result to be broadly in line with what was a
record period in FY16. We expect the diversified financials player will benefit further from asset sales
and lower for longer rates. Its stock also remains attractive from a valuations standpoint.
Detractors
Twenty First Century Fox, FOX, -11.0%
A string of negative developments dragged shares in shares in Twenty First Century Fox (-11.0%)
lower over the quarter. This included a disappointing earnings result with the media giant reporting
earnings of US$2.76 billion for the full year, with a significant drag from foreign exchange movements.
We note that excluding the FX impact, earnings growth was actually in the low double digits.
Additionally, the poor performance of its film division was tied to the timing of key features that are set
to be released in FY17, which should help the area turn around. Expectations for robust affiliate fee
growth are also encouraging. Overall, we believe FOX remains attractive with a low earnings multiple
and solid growth prospects.
South 32, S32, +57.4%
A continued rebound in prices of its key commodity exports helped South 32 (+57.4%) maintain a
strong upward trajectory over the quarter. This included nickel prices, which benefited from
speculation over further mine closures in the Philippines, which accounts for roughly half of the
metal’s global production. The impressive increase in the price of coking coal also offered an updraft
for the stock. We recognise these developments have improved the outlook for the miner, however
valuations remain more attractive for rivals like Rio Tinto (RIO).
GPT Group, GPT, -6.5%
GPT (-6.5%) shares finished the quarter lower as the property group suffered alongside its peers in
the REITs space as bond yields tracked higher. In terms of company-specific news flow, management
unveiled a $2.1 billion plan to develop its shopping mall portfolio. This included an expansion of its
flagship Highpoint Shopping Centre in Melbourne’s West, which underwent a $300 million
redevelopment in 2013. It also increased its interest in the GPT Wholesale Shopping Centre Fund by
$157 million, bringing its share up to 25.3% from 20.2%. Going forward, we acknowledge the risks
posed by a continued run up in bond yields, however we believe GPT will outperform its REITs peers.
Strategy & Outlook
We have been neutralising our previous moderate underweight exposure to resources via a reduction
in our BHP Billiton underweight over recent weeks. While the underlying fundamentals for key
commodities such as iron ore have not returned to full health, Chinese economic policy remains the
Fund Manager Commentary – September quarter 2016 6
major driver of commodity prices over the next six to twelve months. While such signals as there are
suggest that the Chinese government will continue to stimulate in the near term, the degree of
uncertainty and opacity is such that we would be cautious on chasing commodity stocks from here,
hence our neutral exposure.
The defining feature of the quarter is the possibility that we are seeing a shift in performance
leadership. The defensive bond-sensitives which have done well for several years - and then surged
again over the year-to-date – have been underperforming over the past two months. The macro
theme supporting their re-rating – persistently declining bond yields – may have reached its nadir as
signs emerge that central banks are re-thinking their flirtation with negative yields and are instead
turning to fiscal policy as the engine for further growth. While yields may not rise much from here, the
lack of any further compression removes a degree of support for highly-valued defensives and at the
moment the momentum in that trade is waning. This was reflected in the beneficial effects of our
underweight in some high profile defensives, including Transurban and Scentre Group.
At the same time, the recent reporting season demonstrated that the market is demanding more from
some previously-loved high growth stocks, several of which have underperformed after disappointing
the market. Meanwhile, some previously unloved stocks which were able to demonstrate some
resilience or signs of a turnaround have done relatively well; ANZ and Qantas providing pertinent
examples within the portfolio. Crucially, the stock price reaction may be exacerbated by the
historically extreme divergence in valuations between the cheapest and most expensive stocks.
In short, it is potentially a good environment for the Fund’s strategy. As the impact of broad market
trends wanes, stock-specific factors come to the fore. Some companies are well set to navigate what
remains a challenging economic environment – others face more challenges, either due to the nature
of their industry or the strategy employed by management. This plays to our strengths of a large team
of analysts with deep insight into industry dynamics and corporate management and strategy.
Fund Manager Commentary – September quarter 2016 7
Australian Shares
BT Wholesale Smaller Companies Fund
Market review
The S&P/ASX Small Ordinaries Index experienced another quarter of sizeable swings to finish the
period 8.5% higher. The bulk of these gains were attributable to the best July in size years as ‘Brexit’
fears subsided. Speculation over supportive central bank activity also offered an updraft and helped
lift the S&P 500, NASDAQ and FTSE 100 to fresh record highs.
At the global macro level, investor attention remained focused on comments from Fed officials. With
rates unchanged over the quarter, Chairwoman Yellen steered market expectations towards a
December hike. This was alongside robust labour market data that included a 287,000 jump in the
closely-watched Non-Farm Payrolls report for July.
Across the Atlantic, the ECB left investors lacking confidence after it revealed an apparent absence of
plans post QE. In contrast, the Bank of England was cheered by markets after cutting the cash rate to
0.25% and unveiling a 170 billion pound stimulus package.
Turning the Asia, equity markets responded positively to the re-election of Shinzo Abe and promises
of further fiscal reform. The Bank of Japan’s new yield targeting measure was also seen as a
constructive move. Meanwhile in neighbouring China, strong economic data from the world’s largest
commodity consumer helped propel a rebound in base metal, coal and iron ore prices. Other areas of
the commodities complex endured significant swings, including crude oil (WTI: -0.2%) and gold
(-0.5%).
At home, the RBA cut rates to a new record low of 1.5% during the quarter and waved goodbye to
Glenn Stevens as Governor of the Board. Stevens cited sliding inflation as part of the rationale for
easing policy further, which was reflected in second quarter CPI data. Other economic data was more
constructive with the unemployment rate dropping 0.2% to 5.6% and GDP expanding 3.3% year-on-
year. The resilient local data and strong Chinese figures helped the AUD shrug off the rate cut to
finish 2.9% higher against its US counterpart.
Sector-wise, the Materials (+13.9%) space was the standout performer which was largely attributable
to the significant price gains for the miners’ key commodity exports. At the other end of the spectrum,
the ‘rate-sensitive’ areas including Telecommunications (-6.4%), Utilities (-2.3%) and REITs (-1.9%)
were the worst performers. This was driven by a significant recovery in global government bond rates,
which followed from 10 year yields in Australia and the US hitting new record lows early in the quarter.
Fund Manager Commentary – September quarter 2016 8
Portfolio performance
The BT Wholesale Smaller Companies Fund rose 7.22% (post-fee, pre-tax) over the September
quarter, underperforming its benchmark the S&P/ASX Small Ordinaries Accumulation Index by
1.28%.
The small cap portfolio posted decent gains in the third quarter, with strong contributions from New
Zealand-based vitamins producer Vitaco and Cleanaway Waste Management, among others.
Performance lagged the index due primarily to the underweight position in Whitehaven Coal and
underperformance from a few core positions. The latter included Mantra Group and Village
Roadshow, both of which weakened in the first weeks of the quarter, before recovering to be among
the better performers in September
Contributors
Cleanaway Waste Management (CWY) (Overweight)
CWY delivered strong results in August, with revenue growing 5.1% in FY16 which, allied with the
company’s recent focus on cost control, saw underlying profit after tax increase 38.5% and the
company move from a statutory loss to profit. The stock surged given muted market expectations,
based on a recent history of poorer quality results. The benefits of the company’s streamlining and
simplification programme have become apparent in this result, which came against a reasonably
challenging economic backdrop for the business.
Fletcher Building (FBU) (Overweight)
New Zealand-based construction firm Fletcher Building (FBU) posted a 71% gain in net earnings for
FY16, backed by strong improvements in operating earnings and cash flow. Both the New Zealand
and Australian divisions enjoyed decent growth in operating earnings. Looking forward, management
cited strong demand for residential construction in Auckland as a key driver of profit growth in FY17,
even as work in Christchurch in the wake of the 2011 earthquake tails off.
Detractors
Whitehaven Coal (WHC) (Overweight)
Whitehaven released a quarterly production update which showed volumes, prices and product mix
(coking coal versus cheaper thermal coal) had all improved. The coal price continued to strengthen,
driving coal producers higher. The key driver here is constrained supply, as the Chinese authorities
have slashed their production calendar in order to both support the profitability of the sector and in
response to social concerns over environmental pollution. As with most issues related to Chinese
policy, there is very little visibility as to how long this will last. In the meantime, Whitehaven is certainly

Fund Manager Commentary – September quarter 2016 9
improving from an operational and balance sheet perspective, although this is largely reflected in a
stock price which has already run very hard.
Japara Healthcare (JHC) (Overweight)
The aged care sector has seen a valuation de-rating in recent months as noise from the government
suggest they may be revisiting their approach in terms of funding and legislation, increasing
complexity and uncertainty around the regulatory environment. Japara’s underlying earnings outlook
remains robust and we expect that as clarity emerges around the government’s approach it should
help support the sector given the structural tailwinds of an ageing population and supply shortage of
aged care beds.
Strategy & Outlook
The small cap sector is at an interesting juncture following a year of strong outperformance – and one
that demands a very stock-specific approach to the market. The premium placed upon growth stocks,
in an otherwise low-growth environment, has driven some stocks to the point where it is increasingly
difficult to justify quite heady valuation ratings. This was demonstrated in the most recent reporting
season where several high-profile and previously loved stocks fell dramatically after disappointing
investor expectations. When coupled with a correction in defensive bond-sensitive stocks, also from
high valuations in many instances, it leaves some pockets of small cap land looking very vulnerable.
They key is to identify these while identify those areas which combine a decent outlook with a
reasonable valuation.
As we see signs that the momentum in bond-sensitives may be waning – given central banks seem to
be backing away from their flirtation with negative yields – the resource trade remains the key macro-
thematic in the small cap sector. While Chinese policy remains supportive, key commodity prices are
unlikely to collapse, allowing highly-leveraged small cap miners to churn out decent cash flow and
repair balance sheets. The key question is how long Chinese policy remains supportive – for once
that strut disappears the supply and demand fundamentals underpinning iron ore and several other
commodities could potentially normalise, placing downward pressure on prices.
For this reason, we are not chasing resource stocks from this point. As always, we have positioned
the portfolio to benefit from those areas where we have greater degrees of visibility and conviction in
outcomes. There are attractive stocks and pockets in the small cap market at the moment. We like
companies such as Bapcor, which is driving growth through consolidation in the auto parts industry.
We also like Technology One, which is a great example of an Australian company establishing a
global presence via a niche technology platform.
Fund Manager Commentary – September quarter 2016 10
International Shares
BT Wholesale Core Global Share Fund
Market review
Examining developments at the global macro level, investor attention remained closely focused on
comments from US Federal Reserve officials. With no change in rates through the quarter
Chairwoman Yellen steered market expectations towards a hike in December. This was alongside
robust labour market data that included a 287,000 jump in the closely-watched US Non-Farm Payrolls
report released in July. More forward-looking indicators of the economy also supported a relatively
bright picture with a key gauge of service sector activity hitting a seven month high during the quarter.
Across the Atlantic, anticipation of an announcement for renewed stimulus from the ECB helped
support investor sentiment. Ultimately, President Draghi disappointed with little indication that the
Governing Council had discussed plans post their quantitative easing programme due to conclude
early next year. Meanwhile in neighbouring Britain, the Bank of England unveiled a fresh round of
asset purchases to the tune of 170 billion Pounds and slashed the cash rate to 0.25%. This followed
in the wake of June’s surprise ‘Brexit’ victory, where effects were later reflected in a significant
deterioration in economic activity surveys.
In Asia, equity markets responded positively to the re-election of Shinzo Abe and the Liberal
Democratic Party’s promises of further fiscal reforms. Anticipation of new easing measures from the
Bank of Japan also captured headlines with Governor Kuroda later unveiling a new policy of targeting
10 year Japanese Government Bond yields. This was in hopes of bringing inflation up to its 2% target
from current levels at -0.5%.
Turning to neighbouring China, strong economic data from the world’s largest commodity consumer
helped propel a rebound in base metal, coal and iron ore prices. Other corners of the commodities
complex endured significant swings throughout the quarter including crude oil. After suffering its worst
month in a year, WTI rebounded to finish only -0.2% lower for the period. This came as traders
contended with supply restraint talks from OPEC and fears of ramped up US onshore production.
Gold was similarly whipsawed around, but at the mercy of shifting US rate rise forecasts, which saw
the yellow metal end lower by only -0.5%.
Portfolio performance
The BT Wholesale Core Global Share Fund returned 2.71% (post fee, pre-tax) in the September
quarter 2016, outperforming its benchmark by 0.76%.
The Fund outperformed its benchmark over the third quarter of 2016. Outperformance was sourced
from Europe and North America, though in North America strong active returns in the US portfolio

Fund Manager Commentary – September quarter 2016 11
were partially offset by the underperformance of the Canadian portfolio. Developed Asian holdings
finished flat against local benchmarks over the quarter.
In terms of notable thematic performance drivers, the outperformance in Europe was largely driven by
strength in relative-value and investor sentiment signals, outweighing negative contributions by
business quality metrics. In the US market, positive performance was lead by business quality and
relative value signals, outweighing weakness in momentum measures. In Japan, positive results from
relative value and investor sentiment measures were offset by weakness in momentum measures.
The underperformance in Canada was the result of underperformance of relative value signals and
indirect momentum signals, offset somewhat by positive result from direct momentum measures.
Active industry/sector positioning generated a minor loss over the quarter, with the overweight to
Utilities and underweight to Financials the primary sources of underperformance. Outperformance at
the Fund level was due to stock selection within industry groups, with strong results within each of the
Consumer Discretionary, Consumer Staples, Health Care and Industrials sectors all contributing
notably over the quarter.
At a stock level, strongest positive contributions came from overweight positions in: United Airlines, a
major American domestic and international carrier; Hewlett Packard, a US headquartered
multinational information technology company; and Las Vegas Sands Corporation, an American
casino and resort operating company. Largest detractors were overweights in: E. ON, a German
headquartered public utility holding company, operating a portfolio of energy plants across Europe;
Barrick Gold, a global gold miner, headquartered in Canada; and FirstEnergy Corporation, a US
electricity utility.
Strategy & Outlook
Entering October, the largest active sector positions are overweights to Information Technology and
Utilities and underweights to Financials and Energy. Relative to long-term allocations, we remain
mildly tilted towards higher quality companies with positive momentum and away from cheaper
industry peers in Europe, while mildly tilted towards relative value considerations in Japan and the
US.
Fund Manager Commentary – September quarter 2016 12
Australian Fixed Income
BT Wholesale Fixed Interest Fund
Market review
During the quarter Australian three-year bond yields declined by 4 basis points to 1.48% from 1.52%
and ten-year yields fell by 7 basis points from 2.01% to 1.94%, with the 3-10s yield curve flattening to
46 basis points. The Reserve Bank of Australia eased monetary policy by 25 basis points to 1.50% at
its August meeting. In its statement the Reserve Bank noted the global economy is growing at a
slower than average pace while domestically economic growth is continuing at a moderate pace
despite a large decline in business investment. Inflation is expected to remain low for some time, with
low cost pressures globally and subdued wage inflation domestically. Low interest rates have been
supporting domestic demand and the lower exchange rate since 2013 is assisting the export sector.
The Reserve Bank is comfortable with the housing market, noting that more cautious lending and the
increased supply should result in slower price appreciation. Labour market data released during the
quarter reflected the falling unemployment rate however the composition of the number remained
weak. Both growth of housing credit and business credit have slowed over the quarter.
Portfolio performance
The BT Wholesale Fixed Interest Fund returned 0.66% in the September quarter 2016 (post-fees,
pre-tax), underperforming its benchmark by 0.27%.
The Portfolio underperformed its benchmark over the quarter. The Duration and FX strategies were
the largest detractors from performance in the Alpha overlay, while the Cross-Market and Cross-
Sector strategies added to performance. The Government bond component underperformed its
benchmark with the Duration strategy being the main detractor. The Cross-Market and Yield curve
strategies added to performance. The Credit component outperformed its benchmark with positive
contributions coming from excess accrual and long exposures to Domestic Bank subordinate paper,
Infrastructure, Utilities and Real Estate.
Strategy & Outlook
The Reserve Bank cut the cash rate by 25 basis points at its August meeting and returned to a neutral
stance in the statement thereafter in the quarter. The next key data release that will shape monetary
policy expectations is third quarter inflation, released in late October. Non-inflation related data has
been solid enough not to warrant monetary policy easing: inflation data, particularly first quarter, had
just been too weak for the Reserve Bank to ignore.

Fund Manager Commentary – September quarter 2016 13
International Fixed Income
BT Wholesale Global Fixed Interest Fund
Market review
Central banks remained the centre of attention over the quarter. The FOMC left the federal funds rate
unchanged over the quarter. However, Fed Chair Janet Yellen’s speech at Jackson Hole managed to
raise market expectation of monetary policy tightening by the end of the year. In the United Kingdom
the Bank of England eased by 25 basis points and announced a new Term Funding Scheme to
reinforce the pass-through of the cut. In its Monetary Policy Summary, it was noted that following
Brexit the outlook for growth in the short to medium term had weakened markedly. The Bank of Japan
announced it is adopting Quantitative and Qualitative Monetary Easing (QQE) with yield curve control,
with the aim to get CPI inflation to 2%. The Reserve Bank of New Zealand eased monetary policy by
25 basis points to 2% in August. Over the quarter, US and Japanese bond yields rose by 12 and 13
basis points respectively. UK bond yields declined by 12 basis points. Australian bond yields
outperformed US yields with the spread contracting by 19 basis points. The Australian dollar
appreciated and the trade weighted index rose by 2.24% over the quarter. Equities continued their up-
trend and commodities retraced from the peak made in June.
Portfolio performance
The BT Wholesale Global Fixed Interest Fund return 0.04% (post-fees, pre-tax), underperforming its
benchmark by 0.18%.
Over the quarter performance of the FX, Yield Curve and Macro strategies were negative whilst the
Cross-Market strategy was positive and the Duration strategy was largely flat. Losses in the FX
strategy were from long USD positions against JPY and ZAR, both of which were stopped out in the
quarter. Losses in the Yield Curve strategy were mainly from USD curve positions, although the
losses were mitigated by gains from EUR curve flatteners. Performance of the Macro strategy was
slightly negative due to tightening of our credit spread trade between the European Senior Financial
and the Main indices. Gains in the Cross-Market strategy were from a long UK Gilts vs US Notes
position which we opened and took profits on during the quarter. Our long Australian vs short US
positions also performed strongly later in the quarter. In the Duration strategy our long duration
positions in the front-end of the New Zealand curve and Swedish front-end performed well over the
quarter. The newly added long duration positions in the Australian and US markets also benefitted
from the rally later in the quarter.

Fund Manager Commentary – September quarter 2016 14
Strategy & Outlook
The Bank of Japan’s new iteration of extraordinary monetary policy to control the yield curve is
inconsistent to its quantitative easing goals. In case of lower inflation, its zero interest rate policy will
be undermined as real interest rates rise. Globally there is no shortage of catalysts that could see risk
aversion increase quickly. The US election is due to be held in early November. The Italian
referendum, due to be held in early December, and the state of the Italian banking system are key
concerns in Europe and likely to result in financial market volatility increasing later in the year. In the
US, the market currently has the Federal Reserve as more likely than not to raise rates further by the
end of the year. Emerging markets have been the beneficiaries of capital inflows as yield starved
investors look to credit markets and emerging markets to generate additional return. A mass unwind
of these positions will see risk aversion rise quickly.
Fund Manager Commentary – September quarter 2016 15
Credit
BT Wholesale Enhanced Credit Fund
Market review
Over the quarter, physical credit market spread to swap moved tighter in line with other risk markets.
The credit market was supported by a continued drive for investor yield and limited new market
supply. A continued concern permeating risk markets has been the lack of liquidity which could result
in significant volatility with significant news events. For the quarter the supporting credit market factor
has been general commodity price stability. Global economic data has been mixed with growth
continuing to soften. Corporate reporting both in the US and domestically has generally missed
expectations.
Throughout the quarter concern remained as to when the US Fed will raise rates and what changes
the ECB could implement in its QE program. Domestically the Reserve Bank dropped the RBA Cash
Rate by 25 basis points in August in response weakening domestic data.
In September concerns arose over a reported US$14 billion DOJ fine discussed with Deutsche Bank
AG for its role in RMBS during the GFC. Given the bank’s comparatively weaker capital and modest
buffer on its ability to pay coupon on its AT1 securities, the market reacted negatively with the bank’s
CDS widening 60 basis points to 255 basis points. Concerns increased over potential heightened
systemic risk if Deutsche Bank became insolvent which could be a catalyst to further market volatility.
Throughout August and September oil markets continued to largely reflect increasing prices and
relative stability compared to earlier periods. Iron ore hovered above US$55 per tonne during the
quarter whilst Brent oil ended above US$50/barrel at quarter end. Metallurgical coal pricing has been
stable as supply from coal mines in China has decreased due to flooding and lack of cost
competitiveness.
During the quarter the strongest performing sector was Resources. In prior quarters this sector had
markedly underperformed the corporate credit index as issuers such as Glencore and BHP had faced
difficult strategic decisions in a weakening commodity market. At the start of the quarter this sector
had an average spread to swap of 165 basis points which tightened 35 basis points over the three
month period.
Over the quarter physical credit and CDS tightened.
Portfolio performance
The BT Wholesale Enhanced Credit Fund returned 1.26% in the September quarter 2016 (post-fees,
pre-tax), outperforming the benchmark by 0.02%.
Fund Manager Commentary – September quarter 2016 16
Positive performance came from an overweight in infrastructure, utilities and subordinate bank paper.
Negative performance came from swap spread movements.
Activity over the quarter included acquiring utility, infrastructure and finance company bonds.
Strategy & Outlook
Our macro credit view remains neutral. There continues to be near term headwinds as risk markets
continue to perform but exhibit low liquidity increasing the risk of future volatility. Commodity demand
and pricing uncertainty and potential central bank actions represent risks to the downside in the latter
part of calendar 2016. We believe this will continue to make a volatile and uncertain mix in the near
term.
Whilst we maintain a more sanguine longer term view we believe near term volatility could be
encountered and be injurious to credit performance. Risk markets will continue to suffer from
uncertainty and unexpected consequences from events such as Brexit. In addition, continued
commodity price fragility, and shifting expectations on central bank interventions will feed volatility.
Whilst the global growth pulse is waning we continue to be constructive on global growth
underpinning corporate creditworthiness as companies focus on margins with soft top-line conditions.
We remain positive longer-term here.
With near term top-line revenue softness management are at risk of looking to purchase growth
through M&A. Further, companies might consider strategy changes if they are challenged in the
current slow environment. We will continue to maintain a watching brief on any developments.
Accordingly, whilst the near term market tone is weaker we remain cautious albeit positive in our
longer outlook. Domestically we see growth largely dependent on commodity price stability and
housing and we continue to recommend a defensive approach that is flat with any overweights in
operationally resilient sectors such as utilities and infrastructure that provide a higher yield to index
returns as we don’t foresee continued strong compression of spread to swap as experienced in the
prior years.
Fund Manager Commentary – September quarter 2016 17
Cash
BT Wholesale Managed Cash and BT Wholesale Enhanced Cash Funds
Market review
The Reserve Bank of Australia eased monetary policy by 25 basis points at its August meeting, taking
the cash rate to 1.50%. The accompanying statement following each of the Reserve Banks’ meetings
during the quarter was consistent. The Reserve Bank noted the global economy is growing at a lower
than average pace and that whilst actions by Chinese policymakers are supporting the near term
growth outlook, the underlying pace of China’s growth appears to be moderating. Domestically the
Reserve Bank noted that despite a large decline in business investment economic growth is
continuing at a moderate pace. Inflation is expected to remain low for some time, with low cost
pressures globally and subdued wage inflation domestically likely to contain inflationary pressures. In
relation to the housing market, the Reserve Bank noted that supervisory measures have strengthened
lending standards and that some lenders are taking a more cautious approach to some segments of
the market. Dwelling prices have been rising only moderately over the course of the year and are
more likely to remain subdued with the large supply of apartments coming onto the market. The
Reserve Bank view is the likelihood of lower interest rates exacerbating risks in the housing market
has diminished.
On July 7 S&P revised Australia’s AAA Sovereign rating outlook to negative (from stable) across both
its local and foreign currency ratings. This implies a one-in-three chance that the AAA rating will be
lowered within two years and was attributed to a period of protracted fiscal slippage, political gridlock,
and downside risk to revenues from weaker iron ore prices and wages. With the ratings on the
sovereign being placed on negative the ratings outlook on semi government and the Australian major
banks were also placed on negative outlook.
Second quarter inflation data was released in late July with headline inflation in line with expectation,
rising by 0.4%, and resulting in the annual rate increasing by 1.0%. The trimmed mean was slightly
higher than expected at 0.5% for the quarter and 1.7% for the year. The inflation environment is more
than benign enough to warrant further monetary policy easing at the August meeting, which was
subsequently acted upon.
Second quarter gross domestic product, released in early September, was slightly weaker than
expected at 0.5% and resulted in an annual growth rate of 3.3%. Components within the number
showed net trade contracting during the quarter (-0.2%), contributing 2.2% to growth over the past
year. Domestic demand remains weighed down by the fall in mining investment, adding 0.6% to the
quarter and 1.2% for the year.
Fund Manager Commentary – September quarter 2016 18
Central Bank meetings late in the quarter attracted much attention.
The Federal Reserve indicated rate hikes were likely to occur prior to the end of the year. Three
members dissented from the decision, preferring to raise rates by 25 basis points at the meeting. The
statement from the Federal Reserve noted that risks to the economic outlook appear roughly
balanced and the case for hiking has strengthened, but decided to wait for further evidence of
continued progress towards its objectives. Three members also found no further rate hikes this year
to be appropriate. The committee is more split now than it has been for a long time.
Expectations for further monetary policy stimulus from the European Central Bank (ECB) were low,
and the market was still disappointed. The ECB refrained from announcing further policy
accommodation, which was not unexpected, however it was ECB president Mario Draghi refusing to
discuss other options such as changes to the capital key, extension of the QE program or a widening
of the assets that could be purchased that underwhelmed the market. Draghi emphasized the need
for fiscal and regulatory authorities to support economic growth. There is a limit to what monetary
policy can achieve! There is also the damage that negative interest rate policy is inflicting on the
financial and insurance sectors.
The Bank of Japan announced it is adopting Quantitative and Qualitative Monetary Easing (QQE) with
yield curve control. The Bank of Japan will continue to expand the monetary base until CPI inflation
exceeds 2%. The Bank of Japan abandoned the guideline for the average remaining maturity for its
purchases and will adjust purchases of 10 year Japanese Government Bond purchases so the yield
remains around 0%.
In the United Kingdom the Bank of England eased monetary policy by 25 basis points in August,
taking the cash rate to 0.25%. They also announced a new Term Funding Scheme to reinforce the
pass-through of the cut, the purchase of up to GBP10 billion of UK corporate bonds and an expansion
of the asset purchase scheme for UK government bonds of GBP60 billion, taking the total stock of
these asset purchases to GBP435 billion. In its Monetary Policy Summary, the Monetary Policy
Committee (MPC) noted that following the United Kingdom’s vote to leave the European Union the
outlook for growth in the short to medium term has weakened markedly.
The Reserve Bank of New Zealand eased monetary policy by 25 basis points to 2% in August. The
market had been pricing in a possibility of a 50 basis point cut occurring and saw short end rates sell
off slightly when only 25 basis points was delivered.
Bond yields were lower over the quarter, with three and ten year bond yields falling by 4 and 7 basis
points respectively to end at 1.48% and 1.94%. Three and six month bank bill yields were 22 and 15
basis points lower at 1.74% and 1.97% and the Australian dollar ended the quarter 3% higher at
0.7663.
Fund Manager Commentary – September quarter 2016 19
Portfolio performance
Managed Cash
The BT Wholesale Managed Cash Fund returned 0.50% in the September quarter 2016 (post fee,
pre-tax), outperforming its benchmark by 0.02%.
With a higher running yield than the index remains well positioned to outperform. Themes and credit
exposure remain consistent with prior months, with excess spread from A-1 rated issuers likely to be
the main driver of outperformance. The Fund ended the month with a weighted average maturity of 69
days (maximum limit of 70 days). Yields further out the curve continue to offer better relative value
and the weighted average maturity has consistently been longer than benchmark due to this. With
longer dated yields offering better value and with Reserve Bank monetary policy tightening a distant
prospect we will remain longer than benchmark. The Fund is well positioned to continue to outperform
its benchmark.
Enhanced Cash
The BT Wholesale Enhanced Cash Fund returned 0.76% in the September quarter 2016 (post fee,
pre-tax), outperforming its benchmark by 0.28%. Positive performance came from financials, RMBS,
industrials and infrastructure sectors.
Activity during the quarter included investing in domestic bank, infrastructure and industrials sectors
funded out of cash. As at the end of the quarter, the portfolio had a credit spread of 84bps over bank
bills, interest rate duration of 0.13 years and credit spread duration of 1.59 years.
Strategy & Outlook
The Reserve Bank left the cash rate unchanged at its September meeting and had a neutral bias to
the statement. The next key data release that will shape monetary policy expectations is third quarter
inflation, released in late October. Non-inflation related data has been solid enough not to warrant
monetary policy easing: inflation data, particularly first quarter, had just been too weak for the
Reserve Bank to ignore.
There is no lack of catalysts that could see risk aversion increase quickly. The US election is due to
be held in early November. The Italian referendum, due to be held in early December, and the state of
the Italian banking system are key concerns in Europe and likely to result in financial market volatility
increasing later in the year. In the US, the market currently has the Federal Reserve as more likely
than not to raise rates further by the end of the year. Emerging markets have been the beneficiaries of
capital inflows as yield starved investors look to credit markets and emerging markets to generate
additional return. A mass unwind of these positions will see risk aversion rise quickly.
Fund Manager Commentary – September quarter 2016 20
Australian Property
BT Wholesale Property Securities Fund
Market review
The REIT sector generated a total return of -1.9% for the September quarter, underperforming the
broader market which was up 5.1%. Year rolling AREITs have returned 20.8%, outperforming the
broader market by 7.6%. Global REITs (in USD terms) were up 1.5% for the quarter, with Europe the
best performing market (+6.2%) and Japan the worst performing market (flat).
The best performing stocks over the quarter were Mirvac Property Group (+10.9%), Growthpoint
Property Group (+8.9%) and Investa Office Fund (+6.8%). The worst performing stocks were mostly
mids caps with BWP Trust down 11.8%, Charter Hall Retail REIT -11.1% and Generation Healthcare
REIT -9.1%.
It was another volatile quarter for global capital markets, with the equity market performing well in July
driven by a strong US payrolls number and strong gains in commodity prices. The Australian share
market performed particularly well despite S&P downgrading Australia’s sovereign credit outlook (to
negative watch) and the Australian Federal government having a smaller post-election majority in the
lower house. The US SP500 hit an all-time high in August 2016 driven by a continuously dovish US
Fed that left the Fed Fund rate on hold in September 2016. US bonds were up 15bp over the quarter
finishing at 1.59%. Australian bonds were fairly flat over the quarter finishing at 1.90%. The Australian
dollar (vs USD) was up 1.7c over the quarter finishing at 76.5c.
REIT news for the quarter included GPT selling its stake in GPT Metro Fund to Growthpoint
Properties enabling its successful takeover of the REIT. National Storage REIT acquired a $285
million storage portfolio (30 centres on a cap rate of 8.3%), funded by a $260 million equity raising.
August saw a mixed reporting season with Mirvac the standout performer with strong residential sales
volumes, improving margins and record pre-sales. As a consequence the Group upgraded earning
guidance for FY17 with EPS growth expected to be 9-11%. The retail landlords posted mixed results
with all showing slowing retail sales growth decelerating over the last six months, although leasing
spreads improved slightly to +1.1%. Office REITs posted reasonable income growth of 2-3%, but very
strong NTA growth of +13-17%.
Portfolio performance
The BT Wholesale Property Securities Fund returned -1.44% over the September quarter (post-fee,
pre-tax), outperforming its benchmark by 0.44%.
The portfolio outperformed the benchmark for the September quarter. Overweight positions in Mirvac
Group, Precinct Properties Limited and Stockland Trust Group and underweight positions in Abacus

Fund Manager Commentary – September quarter 2016 21
Property Group and GDI Property Group added to performance. The main detractors were from our
overweight positions in Westfield Corporation, Aspen Group and Lifestyle Communities and
underweight positions in Shopping Centres Australia and Crowmell Property Group.
Strategy & Outlook
The sector is priced on an FY17 dividend yield of 4.6%, 33% premium to NTA and a PE ratio of 18.6
times, well ahead of its long term average. However, earnings and balance sheets are stable with
sector gearing at 30% and falling slowly as asset prices continue to rise. Falling bond and cash yields
continue to be supportive. The better managed REITs continue to use the buoyant direct market as
an opportunity to divest non-core assets. AREITs are beginning to have a competitive cost of capital
and we would expect equity capital issuance to pick up in the balance of 2016.
.
Fund Manager Commentary – September quarter 2016 22
International Property
BT Wholesale Global Property Securities Fund managed by AEW
Market Review (In USD)
For the quarter ended September 30, performance of the global property securities market (on an ex-
Australia basis) as measured by the FTSE EPRA/NAREIT Developed Index continued to climb,
posting a total return of 1.49%. Asia Pacific (up 6.0%) was the strongest performing region, followed
by Europe (up 5.0%), while North America (down 1.0%) was a negative performer for the quarter. In
Asia Pacific, all countries were in positive territory for the quarter, with the exception of Japan. Hong
Kong (up 16.6%) posted the largest gain, followed by Singapore (up 4.1%) and New Zealand (up
2.8%), while Japan (0.0%) was flat. In Europe, results were positive in all countries with the exception
of Italy (down 4.8%). Norway (up 21.3%) was the strongest performer, followed by Austria (up 17.4%)
and Finland (up 15.6%). Within North America, the U.S. and Canada returned -0.8% and -4.3%,
respectively.
Portfolio performance
The BT Wholesale Global Property Securities Fund returned 1.31% over the September quarter
(post-fee, pre-tax), underperforming its benchmark by 0.23%.
North America
Modest underperformance relative to the benchmark (in USD) was driven by negative sector
allocation results, which were partially offset by positive stock selection results. Regarding sector
allocation, negative results were attributable to the portfolio’s overweight to the underperforming
storage sector and an underweight to the outperforming health care sector. In terms of stock
selection, results were strongest in the industrial, diversified and apartment sectors and were weakest
in the health care, hotel and data centre sectors. Among the portfolio’s holdings, top individual
contributors to relative performance included overweight positions in outperforming Prologis (PLD)
and Rexford Industrial Realty (REXR) and a lack of exposure to underperforming Digital Realty Trust
(DLR). Detractors most notably included overweight positions in underperforming DuPont Fabros
Technology (DFT) and CubeSmart (CUBE) and a lack of exposure to outperforming HCP Inc (HCP).
Europe
Outperformance relative to the benchmark was attributable to positive stock selection results and, to a
lesser extent, positive country allocation results. In terms of stock selection, results were strongest in
France, the United Kingdom and Spain and were weakest in the Netherlands, Switzerland and
Sweden. Regarding country allocation, positive results were driven by the portfolio’s underweight to
Fund Manager Commentary – September quarter 2016 23
the underperforming Swiss market and an overweight to the outperforming Swedish market. On the
other hand, the portfolio’s underweight to the outperforming Austrian market was a notable detractor.
The portfolio’s small cash balance was also a detractor to relative performance in light of the
European REIT sector’s positive performance for the period. Among the portfolio’s holdings, top
positive contributors to relative performance included overweight positions in outperforming Gecina
SA (France) and Sponda Oyj (Finland) and a lack of exposure to underperforming Swiss Prime Site
AG (Switzerland). Detractors included overweight positions in underperforming PSP Swiss Property
AG (Switzerland), Workspace Group Plc. (United Kingdom), and Unite Group Plc. (United Kingdom).
Asia
Underperformance relative to the benchmark was attributable to negative stock selection results
which were partially offset by positive country allocation results. In terms of stock selection, negative
results in Hong Kong and Japan were partially offset by positive results in Singapore. Positive country
allocation results were largely driven by the portfolio’s overweight to the outperforming Hong Kong
market and an underweight to the underperforming Singaporean market. Among the portfolio’s
holdings, top contributors to relative performance included overweight positions in outperforming
Cheung Kong Property Holdings Ltd (Hong Kong), Sun Hung Kai Properties Ltd (Hong Kong) and
HongKong Land Holdings Ltd (Hong Kong). Detractors most notably included a lack of exposure to
outperforming New World Development (Hong Kong) and overweight positions in underperforming
Hulic REIT (Japan) and Invincible Investment Corp (Japan).
Outlook
North America
Nationally, rents are still moving up in all property types (though a bit more slowly in the case of
apartments and hotels) and some longer-lease property types are transitioning into an environment
where leases will be signed at higher rents than the in-place ones that were signed after the Global
Financial Crisis, providing a boost to net operating income. Overall, for the sector, we expect average
cash flow growth for REITs to be in the mid to upper single digits in 2016 and 2017. After the third
quarter sell-off, the REIT market is slightly more attractive than average versus other asset classes,
as healthy yield spreads to bonds largely offset higher than normal valuations versus general equities.
At the end of the third quarter, REITs were attractive relative to private real estate given the sector
was trading at an average 2% discount to net asset values, with some sectors trading at much larger
discounts (and some at significant premiums). REITs continued to be most attractive relative to bonds
as a yield vehicle. REIT dividend yields rose by one basis point to 3.66% during the third quarter, but
the Moody’s BAA corporate bond yield fell 12 basis points, making the REIT yield more competitive
with corporates. While Treasury yields moved up, REIT dividend spreads to both Treasuries and
corporate bonds are much wider than average, providing some cushion to values if base rates move
up further. Looking ahead, while the REIT market is likely to continue to react nervously to any
changes in the supportive interest rate environment, earnings growth should support ample dividend
Fund Manager Commentary – September quarter 2016 24
growth that should be especially attractive in the current low yield environment and which should help
offset slow increases in interest rates if they continue to rise going forward. Looking forward, we
expect REIT returns to be driven more by current yield and improving earnings fundamentals than by
additional multiple expansion.
Europe
European property equities are well positioned in the currently low growth and low interest rate
environment. We expect capital flows to real estate as a safe yielding asset class will continue.
Additionally, we expect rental growth to be relatively favourable for most REITs as the companies
invest in the larger cities which benefit from the urbanization trends we see in many parts in Europe.
‘Brexit’ could lead to a period of a couple of years of uncertainty, which could weigh on investor
sentiment, but the UK REITs are well positioned with strong balance sheets and long leases. At
quarter-end, a potential fall in real estate values appeared to be priced in as UK REITs traded at an
average discount of more than 10% to net asset value. REITs with significant exposure to London
offices traded at a discount of 25% to net asset value. Overall, European REITs are trading at a 5%
premium to net asset value. European REITs offer an earnings yield of 4.7% and a dividend yield of
3.6%.
Asia
Looking ahead, we are beginning to see some relative value emerging in some markets like Australia
and Singapore after the recent correction. With interest rates likely to remain low, the private market
continues to price assets at tighter cap rates than public market valuations, providing some upside to
NAVs. At a fundamental level, the picture remains mixed, with some areas continuing to see
improving property trends, such as the office and retail sectors in Australia while some sectors
continue to be impacted by pockets of weakness, including the retail sectors in Singapore and Hong
Kong and the office sector in Singapore. The portfolio continues to seek the best relative value in the
sub-property markets where we expect to see improving property fundamentals, with potential
earnings, dividend, and net asset value upside.
Fund Manager Commentary – September quarter 2016 25
Active Balanced
Market review
The S&P/ASX 300 Accumulation Index experienced another quarter of sizeable swings to finish the
period 5.2% higher. The bulk of these gains were generated during the best July in six years, after
global equities rebounded significantly as ‘Brexit’ fears subsided. Speculation over central bank
stimulus also helped provide an updraft for the asset class with benchmarks including the S&P 500,
NASDAQ and FTSE 100 hitting fresh record highs. At the same time, this suppressed expected
volatility which was reflected by a plunge in the VIX (volatility index) to nearly half its level one year
ago.
Examining developments at the global macro level, investor attention remained closely focused on
comments from US Federal Reserve officials. With no change in rates through the quarter
Chairwoman Yellen steered market expectations towards a hike in December. This was alongside
robust labour market data that included a 287,000 jump in the closely-watched US Non-Farm Payrolls
report released in July. More forward-looking indicators of the economy also supported a relatively
bright picture with a key gauge of service sector activity hitting a seven month high during the quarter.
Across the Atlantic, anticipation of an announcement for renewed stimulus from the ECB helped
support investor sentiment. Ultimately, President Draghi disappointed with little indication that the
Governing Council had discussed plans post their quantitative easing programme due to conclude
early next year. Meanwhile in neighbouring Britain, the Bank of England unveiled a fresh round of
asset purchases to the tune of 170 billion Pounds and slashed the cash rate to 0.25%. This followed
in the wake of June’s surprise ‘Brexit’ victory, where effects were later reflected in a significant
deterioration in economic activity surveys.
In Asia, equity markets responded positively to the re-election of Shinzo Abe and the Liberal
Democratic Party’s promises of further fiscal reforms. Anticipation of new easing measures from the
Bank of Japan also captured headlines with Governor Kuroda later unveiling a new policy of targeting
10 year Japanese Government Bond yields. This was in hopes of bringing inflation up to its 2% target
from current levels at -0.5%.
Turning to neighbouring China, strong economic data from the world’s largest commodity consumer
helped propel a rebound in base metal, coal and iron ore prices. Other corners of the commodities
complex endured significant swings throughout the quarter including crude oil. After suffering its worst
month in a year, WTI rebounded to finish only -0.2% lower for the period. This came as traders
contended with supply restraint talks from OPEC and fears of ramped up US onshore production.
Gold was similarly whipsawed around, but at the mercy of shifting US rate rise forecasts, which saw
the yellow metal end lower by only -0.5%.
Fund Manager Commentary – September quarter 2016 26
At home, the RBA cut rates to a new record low of 1.5% during the quarter and waved goodbye to
Glenn Stevens as Governor of the Board. Stevens cited sliding inflation as part of the rationale for
easing policy further. Indeed, this was evident in the 2016 Q2 CPI figures that revealed the central
bank’s preferred measure, the trimmed mean, was well below its 2-3% target band at only 1.7% year-
on-year. Other economic data released during the quarter reflected a more constructive picture; the
unemployment rate dropped 0.2% to 5.6% and Q2 GDP showed the economy expanded by 3.3%
versus the previous year. The resilient local and Chinese prints as well as higher commodity prices
saw the Australian Dollar shrug off the rate cut to finish 2.9% higher against its US counterpart.
Finally, the Turnbull-led coalition victory at the Federal election was largely overlooked by markets.
Portfolio performance
The BT Wholesale Active Balanced Fund returned 2.56% (post fee, pre-tax) in the September quarter
2016, underperforming its benchmark by 0.16%.
The Fund delivered a return of 2.80% (pre-fee) for the quarter, outperforming the benchmark by
0.08%. All asset classes delivered positive returns, with the exception of Australian Listed Property
(-1.95%) which retreated on the prospect of an increase in interest rates in the US.
Active returns for the quarter were driven by International Equities (+1.16%) with the Core
International Equities, Dynamic Markets and Emerging Market allocations all delivering positive active
returns. Despite the negative market returns the Australian Listed Property (+0.47%) portfolio
delivered positive active returns due to the defensive positioning of the Fund. Alternative assets
(+0.92%) continued to deliver active consistent returns despite the increased market volatility post
Brexit.
The detractors for the quarter included Australian Equities (-0.62% active) and Australian Fixed
interest (-0.08% active).
Tactical asset allocation contribution was marginally negative (-0.04%) for the quarter reflecting a lack
of directionality in the markets.
Strategy & Outlook
The Bank of Japan’s new iteration of extraordinary monetary policy to control the yield curve is
inconsistent to its quantitative easing goals. In case of lower inflation, its zero interest rate policy will
be undermined as real interest rates rise. Globally there is no lack of catalysts that could see risk
aversion increase quickly.
The upcoming US election provides some level of market uncertainty although at the time of writing
the case for the Republican presidential candidate appears to be self-distracting. The downstream

Fund Manager Commentary – September quarter 2016 27
impact to the Congress and Senate Races remains to be seen, providing some potential for the
Democrats to take back the Senate.
The Italian referendum, due to be held in early December, and the state of the Italian banking system
are key concerns in Europe and likely to result in financial market volatility increasing later in the year.
In the US, the market currently has the Federal Reserve as more likely than not to raise rates further
by the end of the year.
Fund Manager Commentary – September quarter 2016 28
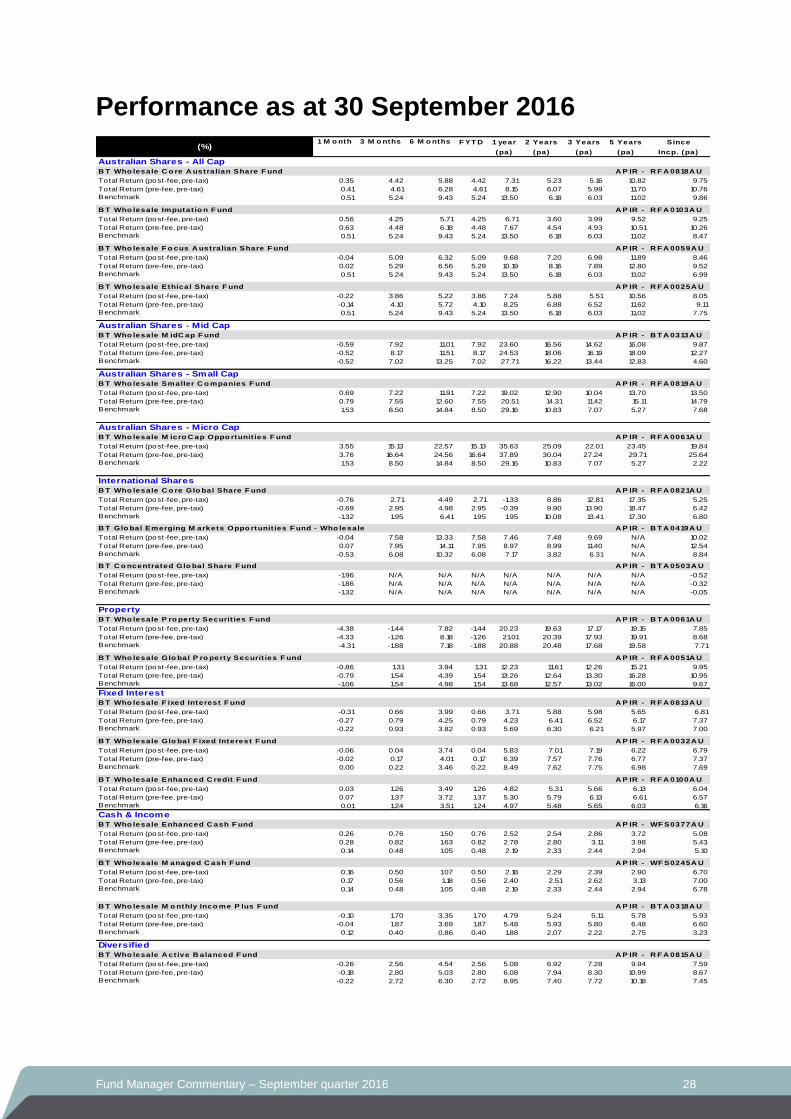
Performance as at 30 September 2016
F YT D 1 year 2 Years 3 Years 5 Years Since
(pa) (pa) (pa) (pa) Incp. (pa)
Australian Shares - All Cap
B T Who lesale C o re A ustralian Share F und A P IR - R F A 0818A U
Total Return (post-fee, pre-tax) 0.35 4.42 5.88 4.42 7.31 5.23 5.16 10.82 9.75
Total Return (pre-fee, pre-tax) 0.41 4.61 6.28 4.61 8.15 6.07 5.99 11.70 10.76
Benchmark 0.51 5.24 9.43 5.24 13.50 6.18 6.03 11.02 9.86
B T Who lesale Imputat io n F und A P IR - R F A 0103A U
Total Return (post-fee, pre-tax) 0.56 4.25 5.71 4.25 6.71 3.60 3.99 9.52 9.25
Total Return (pre-fee, pre-tax) 0.63 4.48 6.18 4.48 7.67 4.54 4.93 10.51 10.26
Benchmark 0.51 5.24 9.43 5.24 13.50 6.18 6.03 11.02 8.47
B T Who lesale F o cus A ustralian Share F und A P IR - R F A 0059A U
Total Return (post-fee, pre-tax) -0.04 5.09 6.32 5.09 9.68 7.20 6.98 11.89 8.46
Total Return (pre-fee, pre-tax) 0.02 5.29 6.56 5.29 10.19 8.16 7.89 12.80 9.52
Benchmark 0.51 5.24 9.43 5.24 13.50 6.18 6.03 11.02 6.99
B T Who lesale Ethical Share F und A P IR - R F A 0025A U
Total Return (post-fee, pre-tax) -0.22 3.86 5.22 3.86 7.24 5.88 5.51 10.56 8.05
Total Return (pre-fee, pre-tax) -0.14 4.10 5.72 4.10 8.25 6.88 6.52 11.62 9.11
Benchmark 0.51 5.24 9.43 5.24 13.50 6.18 6.03 11.02 7.75
Australian Shares - Mid Cap
B T Who lesale M idC ap F und A P IR - B T A 0313A U
Total Return (post-fee, pre-tax) -0.59 7.92 11.01 7.92 23.60 16.56 14.62 16.08 9.87
Total Return (pre-fee, pre-tax) -0.52 8.17 11.51 8.17 24.53 18.06 16.19 18.09 12.27
Benchmark -0.52 7.02 13.25 7.02 27.71 16.22 13.44 12.83 4.60
Australian Shares - Small Cap
B T Who lesale Smaller C o mpanies F und A P IR - R F A 0819A U
Total Return (post-fee, pre-tax) 0.69 7.22 11.91 7.22 19.02 12.90 10.04 13.70 13.50
Total Return (pre-fee, pre-tax) 0.79 7.55 12.60 7.55 20.51 14.31 11.42 15.11 14.79
Benchmark 1.53 8.50 14.84 8.50 29.16 10.83 7.07 5.27 7.68
Australian Shares - Micro Cap
B T Who lesale M icro C ap Oppo rtunit ies F und A P IR - R F A 0061A U
Total Return (post-fee, pre-tax) 3.55 15.13 22.57 15.13 35.63 25.09 22.01 23.45 19.84
Total Return (pre-fee, pre-tax) 3.76 16.64 24.56 16.64 37.89 30.04 27.24 29.71 25.64
Benchmark 1.53 8.50 14.84 8.50 29.16 10.83 7.07 5.27 2.22
International Shares
B T Who lesale C o re Glo bal Share F und A P IR - R F A 0821A U
Total Return (post-fee, pre-tax) -0.76 2.71 4.49 2.71 -1.33 8.86 12.81 17.35 5.25
Total Return (pre-fee, pre-tax) -0.69 2.95 4.98 2.95 -0.39 9.90 13.90 18.47 6.42
Benchmark -1.32 1.95 6.41 1.95 1.95 10.08 13.41 17.30 6.80
B T Glo bal Emerging M arkets Oppo rtunit ies F und - Who lesale A P IR - B T A 0419A U
Total Return (post-fee, pre-tax) -0.04 7.58 13.33 7.58 7.46 7.48 9.69 N/A 10.02
Total Return (pre-fee, pre-tax) 0.07 7.95 14.11 7.95 8.97 8.99 11.40 N/A 12.54
Benchmark -0.53 6.08 10.32 6.08 7.17 3.82 6.31 N/A 8.84
B T C o ncentrated Glo bal Share F und A P IR - B T A 0503A U
Total Return (post-fee, pre-tax) -1.96 N/A N/A N/A N/A N/A N/A N/A -0.52
Total Return (pre-fee, pre-tax) -1.86 N/A N/A N/A N/A N/A N/A N/A -0.32
Benchmark -1.32 N/A N/A N/A N/A N/A N/A N/A -0.05
Property
B T Who lesale P ro perty Securit ies F und A P IR - B T A 0061A U
Total Return (post-fee, pre-tax) -4.38 -1.44 7.82 -1.44 20.23 19.63 17.17 19.15 7.85
Total Return (pre-fee, pre-tax) -4.33 -1.26 8.18 -1.26 21.01 20.39 17.93 19.91 8.68
Benchmark -4.31 -1.88 7.18 -1.88 20.88 20.48 17.68 19.58 7.71
B T Who lesale Glo bal P ro perty Securit ies F und A P IR - R F A 0051A U
Total Return (post-fee, pre-tax) -0.86 1.31 3.94 1.31 12.23 11.61 12.26 15.21 9.95
Total Return (pre-fee, pre-tax) -0.79 1.54 4.39 1.54 13.26 12.64 13.30 16.28 10.95
Benchmark -1.06 1.54 4.98 1.54 13.68 12.57 13.02 16.00 9.67
Fixed Interest
B T Who lesale F ixed Interest F und A P IR - R F A 0813A U
Total Return (post-fee, pre-tax) -0.31 0.66 3.99 0.66 3.71 5.88 5.98 5.65 6.81
Total Return (pre-fee, pre-tax) -0.27 0.79 4.25 0.79 4.23 6.41 6.52 6.17 7.37
Benchmark -0.22 0.93 3.82 0.93 5.69 6.30 6.21 5.97 7.00
B T Who lesale Glo bal F ixed Interest F und A P IR - R F A 0032A U
Total Return (post-fee, pre-tax) -0.06 0.04 3.74 0.04 5.83 7.01 7.19 6.22 6.79
Total Return (pre-fee, pre-tax) -0.02 0.17 4.01 0.17 6.39 7.57 7.76 6.77 7.37
Benchmark 0.00 0.22 3.46 0.22 8.49 7.62 7.75 6.98 7.69
B T Who lesale Enhanced C redit F und A P IR - R F A 0100A U
Total Return (post-fee, pre-tax) 0.03 1.26 3.49 1.26 4.82 5.31 5.66 6.13 6.04
Total Return (pre-fee, pre-tax) 0.07 1.37 3.72 1.37 5.30 5.79 6.13 6.61 6.57
Benchmark 0.01 1.24 3.51 1.24 4.97 5.48 5.65 6.03 6.16
Cash & Income
B T Who lesale Enhanced C ash F und A P IR - WF S0377A U
Total Return (post-fee, pre-tax) 0.26 0.76 1.50 0.76 2.52 2.54 2.86 3.72 5.08
Total Return (pre-fee, pre-tax) 0.28 0.82 1.63 0.82 2.78 2.80 3.11 3.98 5.43
Benchmark 0.14 0.48 1.05 0.48 2.19 2.33 2.44 2.94 5.10
B T Who lesale M anaged C ash F und A P IR - WF S0245A U
Total Return (post-fee, pre-tax) 0.16 0.50 1.07 0.50 2.18 2.29 2.39 2.90 6.70
Total Return (pre-fee, pre-tax) 0.17 0.56 1.18 0.56 2.40 2.51 2.62 3.13 7.00
Benchmark 0.14 0.48 1.05 0.48 2.19 2.33 2.44 2.94 6.78
B T Who lesale M o nthly Inco me P lus F und A P IR - B T A 0318A U
Total Return (post-fee, pre-tax) -0.10 1.70 3.35 1.70 4.79 5.24 5.11 5.78 5.93
Total Return (pre-fee, pre-tax) -0.04 1.87 3.69 1.87 5.48 5.93 5.80 6.48 6.60
Benchmark 0.12 0.40 0.86 0.40 1.88 2.07 2.22 2.75 3.23
Diversified
B T Who lesale A ct ive B alanced F und A P IR - R F A 0815A U
Total Return (post-fee, pre-tax) -0.26 2.56 4.54 2.56 5.08 6.92 7.28 9.94 7.59
Total Return (pre-fee, pre-tax) -0.18 2.80 5.03 2.80 6.08 7.94 8.30 10.99 8.67
Benchmark -0.22 2.72 6.30 2.72 8.95 7.40 7.72 10.18 7.45
(%)1 M o nth 3 M o nths 6 M o nths
For more information Please call 1800 813 886, contact your Business Development Representative or visit btim.com.au
All returns calculated by BT Investment Management (Fund Services) Limited, ABN 13 161 249 332, AFSL 431426 (BTIM). No part
of this Fund Manager Commentary (Commentary) is to be circulated without this page attached.
This Commentary is dated 14 October 2016 and has been prepared by BTIM. The information in this Commentary is for general
information only and should not be considered as a comprehensive statement on any of the matters described and should not be
relied upon as such. The information contained in this Commentary may contain material provided directly by third parties and is
believed to be accurate at its issue date. While such material is published with necessary permission, neither BTIM nor any
company in the BTIM Group of companies accepts any responsibility for the accuracy or completeness of this information or
otherwise endorses or accepts any responsibility for this information. Except where contrary to law, BTIM intends by this notice to
exclude liability for this material.
This Commentary has been prepared without taking into account your objectives, financial situation or needs. Furthermore, it is not
intended to be relied upon for the purpose of making investment decisions and is not a replacement of the requirement for individual
research or professional tax advice. Because of this, before acting on this information, you should seek independent financial and
taxation advice to determine its appropriateness having regard to your individual objectives, financial situation and needs.
BTIM does not give any warranty as to the accuracy, reliability or completeness of the information contained in this Commentary.
This Commentary is not to be published without the prior written consent of BTIM.
Performance data (post-fee) assumes reinvestment of distributions and is calculated using exit prices, net of management costs.
Performance data (pre-fee) is calculated by adding back management costs to the (post-fee) performance. Past performance is not
a reliable indicator of future performance. The term ‘benchmark’ refers to the index or measurements used by an investment
manager to assess the relative risk and the performance of an investment portfolio.
BTIM is the issuer of the following products:
BT Wholesale Core Australian Share Fund ARSN 089 935 964
BT Wholesale Imputation Fund ARSN 089 614 693
BT Wholesale Focus Australian Share Fund ARSN 113 232 812
BT Wholesale Ethical Share Fund ARSN 096 328 219
BT Wholesale Smaller Companies Fund ARSN 089 939 328
BT Wholesale MidCap Fund ARSN 130 466 581
BT Wholesale Core Global Share Fund#
ARSN 089 938 492
BT Wholesale Global Fixed Interest Fund ARSN 099 567 558
BT Wholesale Enhanced Credit Fund ARSN 089 937 815
BT Wholesale Fixed Interest Fund ARSN 089 939 542
BT Wholesale Property Investment Fund ARSN 089 939 819
BT Wholesale Global Property Securities Fund ARSN 108 227 005
BT Wholesale Managed Cash Fund ARSN 088 832 491
BT Wholesale Enhanced Cash Fund ARSN 088 863 469
BT Wholesale Active Balanced Fund ARSN 088 251 496
A product disclosure statement (PDS) is available for each of the above products and can be obtained by contacting BTIM on
1800 813 886, or by visiting btim.com.au. You should consider the relevant PDS in deciding whether to acquire, or to continue to
hold, the product. BT® is a registered trade mark of BT Financial Group Pty Ltd and is used under licence.
# AQR began managing international equity for BT Financial Group in June 2006.