document resume ir 004 362 - eric · the school district affects the librarian's ... printing...
TRANSCRIPT

DOCUMENT RESUME
ED 134 188 IR 004 362
AUTHOR Pfister, Fred C.; Alexander, KarenTITLE Discrepancies between Actual and Ideal Roles and
Functions of Texas School librarians as Perceived bySchool Superintendents, Principals, and Librarians.Report of a Study.
SPONS AGENCY North Texas State Univ., Denton.PUB DATE 76NOTE 199p.
EDRS PRICE HF-$0.83 HC-$10.03 Plus Postage.DESCRIPTORS Analysis of Variance; Audiovisual Aids; Data
Analysis; Hypothesis Testing; Instructional MaterialsCenters; *Librarians; library Acquisition; libraryPlanning; *Library Research; library Services;*Library Surveys; *School Libraries
IDENTIFIERS Texas
ABSTRACTThis study examines the actual and the desired
performance of school librarians in areas of planning, accessingnetworks, instructional and curriculum development, and production oflearning resources. A questionnaire based on the 1976 certificationrequirements for Texas learning resources specialists was constructedas the survey instrument. Research problems were tested according totwo principal criteria: (1) perceptions of superintendents,principals, and librarians, and (2) the size, location and level ofselected school districts. Based on data analysis, this reportconcludes that: (1) all three major groups of respondents agree onthe gap between perceived actual versus ideal conditions; (2)librarians' responsibility for selection and acquisition ofaudiovisual materials receives less recognition than theirresponsibility regarding print materials; (3) librarians do not fullyparticipate in management and planning activities; (4) the size ofthe school district affects the librarian's service and managementfunctions; (5) librarians are not accepted in the instructional role;(6) librarians' access to resources is limited within the schooldistrict; (7) communication between librarians and administrators islacking. These findings are generalizable to a wider population.(SC)
Documents acquired by ERIC include many informal unpublished* materials not available from other sources. ERIC makes every effort ** to obtain the best copy available. Nevertheless, items of marginal ** reproducibility are often encountered and this affects the quality ** of the microfiche and hardcopy reproductions ERIC makes available *
* via the ERIC Document Reproduction Service (EDRS). EDRS is not* responsible for the quality of the original document. Reproductions ** supplied by EDRS are the best that can be made from the original. ************************************************************************

U.S. OEPARTMENT OF HEALTH,EDUCATION I WELFARENATIONAL INSTITUTE OF
EDUCATION
THIS DOCUMENT HAS BEEN REPRO-DUCED EXACTLY AS RECEIVED FROMTHE PERSON OR ORGANIZATION ORIGIN.ATING IT POINTS OF VIEW OR OPtNIONSSTATED DO NOT NECESSARILY REPRE-SENT OFF.ICIAL NATIONAL INSTITUTE OFEDUCATION POSITION OR POLICY
DISCREPANCIES BETWEEN ACTUAL AND IDEAL ROLES AND FUNCTIONSOF TEXAS SCHOOL LIBRARIANS AS PERCEIVED BY SCHOOL
SUPERINTENDENTS, PRINCIPALS, AND LIBRARIANS
REPORT OF A STUDYCONDUCTED WITH THE AID OF
A NORTH TEXAS STATE UNIVERSITY FACULTY RESEARCH GRANTAND IN COOPERATION WITH
REGIONAL SERVICE CENTERS TEN & ELEVEN
BY
FRED C. PFISTERAND
KAREN ALEXANDER
"PERMISSION REPRODUCE THIS COPY-RIGHTED MATEktAL HAS BEEN GRANTED BY
Fred C. Pfilter
TO ERIC AND ORGANIZATIONS OPERATINGUNDER AGREEMENTS WITH THE NATIONAL INSTITUTE OF EDUCATION FURTHER REPRO-DUCTION OUTSIDE THE ERIC SYSTEM RE-OUIRES PERMISSION OF THE COPYRIGHTOWNER."

ACKNOWLEDGMENTS
The authors of this report wish to acknowledge the assistance from
Dr. Frank Buell and Mr. R.P. Campbell, Jr. from Education Service Center
XI, and to Dr. Joe Farmer and Dr. Haydn Goodgion from Education Service
Center 10, for their cooperation in providing consultation on the research
design, the timetable for the study, identification of pilot study districts,
printing of survey forms and cover letters, and for Education Service Center
co-sponsorship of tht,- study in correspondence directed to superintendents,
principals, and librarians. Ms. Nora Ernst, Office Of Research, NTSU College
of Education; Dr. Hamilton Monroe, our colleague in the library school; and
Sandra Kincaid, statistician at the U.S. Department of Labor in Dallas gave
us valuable advisement on statistics and research design questions. Thanks
also to Mts. Linda Bostic, a student who generated the whole study by asking
the right question at the right time and who later worked on the study as a
research assistant and to Abigail Hubbard, another research assistant who
came in to help finish up and has shown lots of true grit as well as competence.
Finally, we would like to express our appreciation to the State of Texas
for making research funds available. Without the research grant funds this
project could not have been undertaken.
3

TABLE OF CONTENTS
Chapter Page
I. INTRODUCTION
Review of Related Literature 2Description of the Study 4Definition of Terms 8
II. RESPONSIBILITY 11
Introduction 11Data Analysis 11
Findings--T-Test for Correlated Samples 13Findings--Analysis of Variance 13
III. PERFORMANCE 53
Performance Area I 53Performance Area II 62Performance Area III 66Don't Know Responses 72
IV. LIBRARIANS 76
All Librarians: Elementary vs. Secondary . . 76Traditional librarian activities 76Management functions 82Local production of materials functions . 87
Urban Librarians: Elementary vs. Secondary . 90All Librarians: Large Districts vs. Small
Districts 92Performance areas I, II, and III 96
V. PRINCIPALS 100
All Elementary Principals vs. All SecondaryPrincipals 100Performance area I 106Performance area II and III 106
Urban Principals: Elementary vs. Secondary . 113All Principals: Large Districts vs. Small
Districts 116Responsibility 116Performance areas I and III 121
All Principals: Urban vs. Rural 123Responsibility area 123Performance areas I, II, & III 126
4

Chapter
VI. SUPERINTENDENT INTERVIEWS
Page
130
Introduction 130Interview Results 131Means for Improvement Suggested by the
Superintendent Interviews 141
VII. SUMMARY, CONCLUSIONS, AND RECOMMENDATIONS . 143
Introduction 143Summary of Findings 146
T-Test 146ANOVA--Superintendents, Librarians and
Principals , 146ANOVA--Subgroups of Librarians 149ANOVA--Subgroups of Principals 150Superintendent Interviews 151
Conclusions 151Recommendations Drawn From the Siudy. 155Recommendations for Further Research 157
AOpendix
I. SURVEY INSTRUMENT AND COVER LETTERS 159
II. A COMPARISON OF ACTUAL RANKINGS WITH IDEALRANKINGS: DATA FROM THE T-TEST FORCORRELATED SAMPLES 172
III. SUPERINTENDENTS INTERVIEWED 178
BIBLIOGRAPHY 180
5
-iv-

LIST OF TABLES
Table2AB2
1 Results of one-way analysis of variance for statement number 1:The librarian has responsibility for formulating long rangeplans for the library
2 Results of one-way analysis of variance for statement number 2:When new or remodeled library plan facilities are needed, thelibrarian has responsibility for preparing the educations/specifications for them
3 Results of one-way analysis of variance for statement number 3:When new or remodeled library facilities are planned, thelibrarian has responsibility for planning for the floor design,furnishings, etc.
4 Results of one-way analysis of variance for statement number 4:The librarian has responsibility for planning facilities forlocal design and production of learning resources
5 Frequency distribution for statement number 4: The librarianhas responsibility for planning facilities for local design andproduction of learning resources
6 Results of one-way analysis of variance for statement number 5:When funds are available from sources outside the local district,the librarian has responsibility for preparing proposals forobtaining them
7 Results of one-way analysis of variance for statement number 6:The librarian has responsibility for coordinating deliveriesand returns of materials from the school district's center.(Answer only if your district maintains a district learningresources center)
8 Results of one-way analysis of variance for statement number 7:The librarian has responsibility for coordinating deliveriesand returns of materials from the regional service center
9 Results of one-way analysis of variance for statement number 8:The librarian has responsibility for providing for use of materialsfrom outside. the school by activities such as Inter-library Loanand maintaining a community resources file
6
-v-
14
16
17
18
20
21
22
23
24

Table Page
10 Results of one-way analysis of variance for statement number 9:The librarian has responsibility for designing and conductingin-service training programs for teachers 26
11 Reiillts of one-way analysis of variance for statement number 10:The librarian has responsibility for providing in-serviceeducation for the library staff (including volunteers). 27
12 Frequency distribution for statement number 10: The librarinnhas responsibility for providing in-service education for thelibrary staff (including volunteers)
13 Results of one-way analysis of variance for statement number 11:The librarian has responsibility for campus level productionof materials that aid teachers in the classroom
14 Results of one-way analysis of variance for statement number 12:The librarian has responsibility for teaching students how toproduce audio-visual materials
15 Results of one-way analysis of variance for statement number 13:The librarian has responsibility for developing the listening,viewing, and responding skills of students
Results of one-way analysis of variance for statement number 14:The librarian has responsibility for developing the reading.and responding skills of students
17 Results of one-way analysis of variance far statement number 15:The librarian has responsibility for formulating and recommend-ing for adoption policies for the evaluation and selection ofaudio-visual materials for the collection
18 Results of one-way analysis of variance for statement number 16:The librarian has responsibility for formulating and recommend-ing for adoption policies for the evaluation and selection oflibrary books, periodicals, and other print materials for thecollection
19 Results of one-way analysis of variance for statement number 17:The librarian has responsibility for evaluating and selectingaudio-visual equipment
20 Results of one-way analysis of variance for statement number 18:The librarian has responsibility for making adequate provisionfor previewing materials being considered for the collection
7
-vi-
28
30
31
32
34
36
37
38
39

Table Page
21 Frequency distribution for statement number 15: The librarianhas responsibility for formulating and recommending foradoption policies for the evaluation and selection of audio-visual materials for the collection (ideal condition) 41
22 Frequency distribution for statement number 17: ,The librarianhas responsibility for evaluating and selecting audio-visualequipment (ideal condition)
23 Results of one-way analysis of variance for statement number 19:The librarian has responsibility for developing and implementingprocedures for acquisition (by purchase, exchange, or gift)of print materials
24 ResulLs of one-way analysis of variance for statement number 20:The librarian has responsibility for developing and implementingprocedures for acquisition of audio-visual materials
25 Results Of one-way analysis of variance for statement number 21:The librarian has responsibility for acquiring audio-visualequipment
26 Results of one-way analysis of variance for statement number 22:The librarian has responsibility for the 'storage and schedulingof audio-visual equipment
27 Frequency distribution for statement number 22: The librarianhas responsibility for the storage and scheduling of audio-visual equipment (actual condition)
28 Frequency distribution for statement number 22: The librarianhas responsibility for the storage and scheduling of audio-visual equipment (ideal condition)
29 Results of one-way analysis of variance for statement number 23:The librarian has responsibility for developing policies andprocedures for maintenance of audio-visual equipment
30 Frequency distribution for statement number 23: The librarianhas responsibility for developing poli.ies and procedures formaintenance of audio-visual equipment
31 Statement number 24. The librarian disseminates information tostudents and teachers on the.availability of materials, equip-ment, and resources in the library
32 Statement number 25. The librarian promotes the library'scollections and services by such means as displays, booktalks, and classroom presentations
-vii-
42
43
44
45
47
118
49
50
51
54
54

Tablepage
33 Statement number 26. The librarian disseminates informaticn to-BtUdents and teachers on effective use of materials and equip-
-ment54
34 Statement number 27. The librarian provides information toteachers on new teaching developments ani practices 55
35 Statement number 28. The librarian provides teachers with listsof materials useful in instruction
36 Statement number 29. The librarian participates on curriculumplanning committees
37 Frequency distribution for statement number 29: The librarianparticipates on curriculum planning cammittees (actual condition)
38 Frequency distributiOn'for atatement number 29: The librarianparticipates on curriculum planning camittees (ideal condition) 57
55
56
57
39 Statement number 30. The.librarian designs information systemsto.meet the needs of students and teachers
40 Statement number 31. The librarian helps students chooseappropriate materiels to meet learning needs
41 Statement number 32. The librarian teaches students how to usematerials available in the library
58
59
59
42 Statement number 33. The librarian applies learning theories tothe evaluation of materials for inclusioa in the collection 59
43 Statement number 54. The librarian evaluates materials forinclusion in the collection by utilizing suggestions from admin-istrators and teachers
44 Statement number 35. The librarian incorporates new productionmethods into the production of media
45 Statement number 36. The librarian uses the systems approach tothe study and design of library services
46 Statement number 37. The librarian gathers statistical data foruse in managing the library
59
60
47 Statement number 38. The librarian applies basic research datareported in the literature to the management of the library 61
48 Statement number 39. The librariaa plans and conducts researchprojects to provide information for decision making 62

Table Page
49 Statement number 40. The librarian reads professional publi-cations to keep abreast of developments in the field 62
50 Results of analysis of variance between principals and librariansfor statements in performance area II (actual and ideal condition) 63
51 Percentage of principals and librarians who perceive the actualcondition for statements 42-45 at the 4 & 5 levels 65
52 Percentage of principals and librarians who perceive the hiealcondition for statements 42-45 at the 4 & 5 levels 65
53 Results of analysis of variance between principals and librariansfor statements in performance area II (actual condition) 67
Results of analysis of variance between principals and librariansfor statements in performance area II (ideal condition) 68
54 Frequency distribution for statement number 56: The librarianapplies instructional design principles to the design oflocally produced materials (actual condition)
55 Frequency distribution for statement number 56: The librarianapplies instructional design principles to the design oflocally produced materials (ideal condition)
56 Dcn't Know responses from all secondary principals and fromall elementary principals on significant statements relatingto the actual Londition where the percentage rate exceeded10 percent
70
71
73
57 Don't Know responses from all secondary librarians and fram allelementary librarians on significant statements relating to theactual condition where the percentage rate exceeded 10 percent 74
58 Elementary librarians vs. secondary librarians: Results ofanalysis of variance of selected statements relating to "tradi-tional" librarian activities (actual condition)
Elementary librarians vs. secondary librarians: Results ofanalysis of variance of selected statements relating to "tradi-tional" librarian activities (ideal condition)
59 Elementary librarians vs. secondary librarians: Analysis ofvariance of selected statements relating to management functions(actual condition)
Elementary librarians vs. secondary librarians,4 Analysis ofvariLoce of selected statements relating to management functions(ideal condition)
10
78
79
83
84

Table?age
60 El eftentary librarians vs. secondary librarians: Results ofanalysis of variance on selected statements relating tolocal production (actual and ideal condition) 88
61 Urban elementary librarians vs. urban secondary librarians:Analysis of variance of selected statements (actual andideal condition)
62 Librarians: large districts vs. small districtsResults of analysis of varianceResponsibility area (actual condition)
93
Librarians: large districts vs. small districtsResults of analysis of varianceResponsibility area (ideal condition)
63 Librarians: large districts vs. small districtsResults of analysis of variancePerformance areas I, II, & III (actual condition)
Librarians: large districts vs. small districtsResults of analysis of variancePerformance areas I, II, & III (ideal condition)
64 Elementary principals vs. secondary principals: Results ofanalysis of variance on selected statements in theresponsibility area (actual condition)
Elementary principals vs. secondary principals: Results ofanalysis of variance on selected statements !nresponsibility area (ideal condition)
65 Elementary principals vs. secondary principalL: Results ofanalysis of variance on selected statements in performancearea I. (actual condition)
Elementary principals vs. secondary principals: Results ofanalysis of variance on selected statements in performancearea I (ideal condition)
66 Elementary principals vs. secondary principals: Results ofanalysis of variance on selected statements in performanceareas II & III (actual condition)
Elementary principals vs. secondary principals: Results ofanalysis of variance on selected statements in performanceareas II & III (ideal condition)
-x-
914
97
98
101
102
107
108
111
112

Table
67 Urban elementary principals vs. urbau secc,adary principals:Results of analysis of variance on selected statements(actual condition)
Urban elementary principals vs. urban secondary principalsResults of analysis of variance on selected statements(ideal condition)
68 Principals in large districts vs. principals in small districtsResults of analysis of variance on selected statements inresponsibility area (actual condition)
Principals in large districts vs. principals in small districtsResults of analysis of variance on selected statements inresponsibility area (ideal condition)
69 Principals in large districts vs. principals in small districtsResults of analysis of variance on selected statements inperformance areas I & III (actual and ideal condition)
70 Principals in urban districts vs. principals in rural districtsResults of analysis of variance on selected statements in theresponsibility area (actual condition)
Principals in urban districts vs. principals in rural districtsResults of analysis of variance on selected statements in theresponsioility area (ideal opndition)
71 Principals in urban districts vs. principals in rural districtsResults of analysis of variance on selected statements in per-formance areas I, II, & III (actual condition)
Principals in urban districts vs. principals in rural districtsResults of analysis of variance on selected statements in.per-formance areas I, II, & III (ideal condition)
Page
114
115
117
118
122
124
125
127
128

CHAPTER I
INTRODUCTION
National standards for school media centers have received a great deal
of attention during the past ten years, with new statements appearing in 1969
and 1975. During the same period state certification requirements for school
media specialists have been examined, reviewed, and revised across the country.
As part of this movement, a completely new set of certification require-
ments for Campus-Level Learning Resources Specialists (school librarians,
school media specialists), was adopted by the Texas State Board of Education
in May, 1976. Texas' new certification requirements draw heavily from the
1975 national standards, Media Programs: District and School, and coil for
nearly every competency identified in the model recently developed by a com-
mittee of the American Association of School Librarians (AASL, 1976). The
Texas certification plan is premised, then, on school situations with optimium
program, funding, staffing, quartet%) facilities and administrative support.
Since media personnel educated in Texas should be prepared to function in the
best of Learning Resources Centers in Texas and across the country, the high
expectations are quite appropriate. Upgrading and modernizing the requirements
for newly certified Learning Resources Specialists does present problems,
!however. The gap between the ideal upon which the new preparation is based
and the "real world" of school media centers will become wider in most cases,
and the need for in-service education more pronounced. School district media
supervisors, state education agency personnel and others responsible for con-
tinuing education ofechool personnel will need to increase their efforts to
identify the areas in greatest need of improvement and plan programs accordingly.
-1-
13

-2-
Changed certification requirements will also necessitate thoughtful and
active responses from academic institutions which provide pre-service educe-
btion. Educators, for example, will need to re-assess the information they
give to prospective school media specialists regarding superintendents' and
principals' views of what media specialists ought to be doing. But is a
principal a principal a principal? Or, for example, will the expectations of
elementary principals differ from those of secondary principals?
And what about those preparing for positions as superintendents, prin-
cipals, or teachers? They too should have up-to-date information about actual
and desirable roles and functions of school media specialists. School admini-
strators could use data of the kind available from the study reported here to
compare their current activities and future plans with norms for.similar school
systems. Reality-based norms would help them set priorities when they prepare
budgets, rationalize staffing, assess the adequacy of learning resources col-
lections, and make other management decisions.
Review of Related Literature
Standards and Certification.--The major survey instrument for this study
was based on Preparation Program for the Education of the Campus-Level Learning
Resources Specialist (school librarian), the state certification plan recently
adopted by the Texas State Board of Education (Prep. Program..., 1975). Two
sets of recently developed ktsindards are important to this study, since they
served as basic resource documents for the committee which prepared the certi-
fication proposal. Media PrOSTSMISI District and School provides guidelines
and recommendations for school library media programs of superior quality and
serves as the current national modal (AASL and AECT, 1975). Guidelines for the
14

Development of Campus Learning Resources Centers (Librarians), published in
1974 by the Texas Education Agency, provides similar.guidelines at the state
level (TEA 1974). These sources are not research, of course, neither do they
represent the extant literature on standards and certification. They are in-
cluded because f their basic relationship to this research project.
Functions of the school library.--A study of major importance is the
Library Manpower Project funded by the Knapp Foundation. The results of .this
study included identification of twelve categories of 300 tasks performed by
various school library personnel (School Library Manpower Project, 1970);
definitions for school library personnel with specifications for competencies
necessary to carry out the functions described in the definitions (Case, 1973);
and a survey of six university level experimental programs for School Library
Media Education (School Library Manpower Project, 1974). Other studies that
deal with functions of the school library and/or the position of the library in
the total school program are Gayer, 1971; Gayer and Jones, 1966; Liesener, 1972;
Lohrer, 1970; Office of Education, 1973; Ricking, 1974; and Smith, 1956.
Perceptions of the librarian's role.--Anderson's research on the role of
the school librarian as perceived by the librarians, teachers, and principals
in Oregon high schogls concluded that the three groups do not perceive the
librarian's role in the same way (Anderson, 1970). Olson conducted a similar
survey in the Minneapolis-St. Paul area and reached the same conclusion (Olson,
1966). The only study identified which attempted to determine the future roles
and functions of school librarians was Jetter's Delphi study of the opinions of
fifty-three leaders prominent in professional specializations (Jetter, 1972).
Jetter's major finding was that librarians would be working much more with
curriculum and teachers in the future.

Although these studies indicate a definite variance in the perceptions of
the librarian's role by librarians, principals, and teachers and give some
general notion of future directions, none speaks directly to conditions in
Texas; not one studies superintendents as a basic group; and none attempts
to determine whether perceptions of librarian's roles and functions differ in
large and small school districts in rural and urban districts, and in elementary
and secondary schools.
Description of the Study
Research Hypotheses
This study was designed to establish the perceptions of current and desired
roles and functions of the librarian1 by seeking information from school super-
intendents, principals, and librarians. Three basic hypotheses were considered
in the attempt to determine these perceptions:
Null Hypothesis 1.--H0: No significant rank difference exists between the
librarian's roles and functions considered desirable by superintendents and
those considered desirable by librarians.
Null Hypothesis.2.--H0: No significant rank difference exists between the
librarian's roles and functions considered desirable by principals and those
considered desirable by librarians.
Null Hypothesis 3.--H0o No significant rank difference exists between the
librarian's roles and functions considered desirable by superintendents and
those considered desirable by principals.
1A decision was made to use the term "librarian" because that is the term com-monly used by Texas school personnel and was the language used in Texas certi-fication guidelines at the time of the study.
16

- 5-
The following related hypotheses were also tested:
Null Hypothesis 4.--H0: No significant rank difference exists between
the librarian's roles and functions considered desirable by superintendents in
urban schools and those considered desirable by superintendents in rural
schools.
Null Hypothesis 5.--H0: No significant rank difference exists between
the librarian's roles and functions considered desirable by superintendents in
large school districts and those considered desirable by superintendents in
small school districts.
Null Hypothesis 6.--H0: no significant rank difference exists between
the librarian's roles and functions considered desirable by all secondary school
principals and those considered desirable by all elementary school principals.
Null Hypothesis 7.--H0: No significant rank difference exists between
the librarian's roles and functions considered desirable by urban secondary
school principals and those considered desirable by urban elementary school
principals.
Null Hypothesis 8.--H0: No signifièant rank difference exists between
the librarian's roles and functions considered desirable by principals of large
school districts and those considered desirable by principals of small school
districts.
Null Hypothesis 9.--H0: No significant rank difference exists between
the librarian's roles and functions considered desirable by all urban school
principals and those considered desirable by all rural school principals.
Null Hypothesis Na significant rank difference exists between
the librarian's roles and functions considered desirable by ail secondary
school librarians and those considered desirable by all elementary school li-
brarians.

-6-
Null Hypothesis 11.--H0: No significant rank difference exists between
the librarian's roles and functions considered desirable by urban secondary
school librarians and those considered desirable by urban elementary school
librarians.
Null Hypothesis 12.--H0: No significant rank difference exists between
the librarian's roles and functions considered desirable by librarians of
large school districts and those considered desirable by librarians of small
school districts.
Research Process
An ex Las facto study was conducted, and the data collected were used to
measure and correlate the variates and criterion variables inherent in the Texas
Preparation Program for the Education of the Campus Level Learning Resources
Specialist (school librarian). The criterion variable (opinion of the roles
and functions of the school librarian considered desirable) was examined in re-
lation to the following variate: perception of the current roles and functions
of the school librarian.
Both the criterion variable and the variate were ranked by school super-
intendents, school principals, and school librarians. One-way analysis of
variance and Fisher's correlated T-Test were applied and interpreted according
to standard statistical Sources. Level of significance was set at .05.
Procedures
1. Co-sponsorship of the study by Region 10 Education Service Center and
by Region XI Education Service Center was obtained. Personnel from the two
Centers were then consulted on the structure of the questionnaire, appropriate
pilot study locations, and the general research design.
18

-7-
2. A discrepancy analysis survey instrument was prepared, modeled on
the Richardson (Texas) Independent School District's Needs Assessment of
Guidance/Counselling Service. This instrument has two six-point scales for
the representation of opinions. The first (left-hand) scale is designed to
elicit information on the perceived present status of an activity; the second
(right-hand) scale seeks an indication of the desired status for the same
activity. Survey items were based on the model of the recommended functions
to be performed hy the Learning Resources Specialist (school librarian) in
the Texas Council on Library Education's Preparation Program for the Education
of the Campus-Level Learning Resources Specialist. (See Appendix I for a
copy of the survey instrument.)
3. Appropriate cover letters were prepared for mailing to superintendents,
principals, and librarians (see Appendix I ).
4. A pilot study was conducted in two urban and two rural Texas school
districts outside the universe of the study reported here to determine whether
revision was needed and to check the suitability of the proposed data analysis.
5. For those districts in which it could be determined that there was a
district level media supervisor (library consultant, library director), con-
tact was initiated with the supervisor, who then acted as the spokesperson in
attempting to obtain the participation of, and authorization from, the super-
intendent of that district. A mailing was sent to the remaining superintendents
in Region Service Centers Ten and Eleven2 requesting their personal partici-
pation in the survey and their authorization to mail the questionnaire to
principals and librarians in their districts. Responses Were received from 72
of 164 (43.907. ) of the superintendents.
2See "Definition of Terms" for descriptions of Regional Service Centers Ten andEleven.
19

-8-
6. After authorizations were received from superintendents, questionnaires
were distributed by district level supervisors or mailed on a common date to
principals and librarians. To insure confidentiality, each questionnaire was
accompanied by a postpaid return envelope addressed to Pfister at NTSU. Re-
sponses were received from 418 of 708 (59.04% ) of the principals and 324 of
an estimated 520 librarians (62.317. ). An estimate was necessary for librar-
ians since no accurate directory was available, and some librarians serving
multiple campuses received more than one questionnaire.
7. Responses were key-punched as they were received and computed after
the closeout date of March 2, 1976.
8. Ten urban and six rural superintendents were identified by drawing a
stratified random sample from participating districts. ,All sixteen superin-
tendents were asked to give individual interviews (or designate an assistant
to do so) in order to obtain reaction and comment on the major findings of the
survey and to receive their advisement on recommended actions for reducing dis-
crepancies between current and desired roles and functions of school librarians.
9. Preliminary assessments of findings were made.
10. Interviews with fourteen superintendents (eight urban and six rural)
were conducted.
11. Final assessments were made, and reports were prepared on the study
and its findings.
Definition of Terms
Education Service Center.--see Regional Service Center.
Elementary school.--any school serving grades K-6 or any portion thereof.
0

9-
Instructional design.--the formulation and selection of management systems
for instructional development (AASL and AECT, 1975: p. 112).
Instructional development.--the solution of instructional problems through
the design and application of instructional systems and their components (AASL
and AECT, 1975: p. 113).
Large school district.--any district having ten (10) or more campuses.
Learning Resources Center (LRC).--the functional unit providing for an or-
ganized collection of print materials, audiovisual materials and their related
devices with the services of a staff qualified to provide and facilitate the
use of these materials and devices as required to meet the varied needs of
students and faculty. (Also called Library, Instructional Materials Center,
Educational Media Center, Library Media Center, and other variants.) (Prep
program..., 1975: 7).
Learning Resources Specialist.--a new and unique professional position
which implies more than a change in title, and more than the sum total of the
traditional concepts of "library" and "audio-visual". The position is evidence
of a fundamental change in services and utilization of resources, developed in
response to new patterns of learning, curricula and administration, and the
continuing impact of technology.
The Learning Resources Specialist (LRS) is an individual who has developed
knowledge and understanding of, and competencies in, the expanded range of
media services, with particular emphasis on the development, administration and
implementation of a unified learning resources program. The LRS may also have
developed advanced competencies in a specific area of the learning resources
program, i.e., educational research, administration, information science, cur-
riculum, educational broadcasting and other educational specializations (Prep
Program..., 1975: 7).
21

-10-
Region 10 Education Service Center.--serves eight counties, 81 school
districts, and about 375,000 school children. Haydn Goodgion, Executive
Director, 400 Spring Valley Road, Richardson, Texas 75080.
Region XI Education Service Center.--serves ten counties, 83 school districts
and about 214,500 school children. R. P. Campbell, Jr., Executive Director,
2821 Cullen Street, Fort Worth, Texas 76107.
Regional Service Center.--provides support for media, computer, consultant
services, and other resources in support of local school districts. The state
of Texas is divided into twenty regions, each with a Regional Service Center
funded by federal, state, and local sources (also known as Education Service
Center).
Rural school district.--any school district located in a county not de-
si/
nated as urban according to Statistical Abstracts of the United States, 1973.
Secondary school.--any school serving grades 7-12 or any combination
thereof.
Small school district.--any district having 1-9 campus units.
Urban school district.--any school district located in a county designated
as urban according to the Standard Metropolitan Statistical Area listings in
Statistical Abstracts of the United States, 1973.
2 2

CHAPTER II
RESPONSIBILITY
Introduction
This chapter provides data on the responses made to role and function
statements one through twenty-three by 72 superintendents, 418 principals
ud 324 librarians. These twenty-three statements represent responsibilit.-
as opposed to performance areas for campus level media center personnel.
The purpose of the study was to measure perceptions of current and desired
levels of performance. The survey was introduced to respondents through an
appropriate cover letter (see Appendix I). Respondents were asked to indicate
for each statement: "(1) your :litrcepion of the actilsil condition in your
school or district in the left hand scale, and (2) your judgment as to the
ideal condition for that role c function in the right hand scale." Response
categories for the responsibility section are: 0 (zero) im Don't Know; 1 im
Has attle or No Responsibility; 2 Has Some Responsibility; 3 . Has Consider-
able Responsibility; 4 = Has Much Responsibility; 5 . Has Complete Responsibility.
Because of the variations in terminology--e.g. media specialist, learning
resources specialist, librarian--a decision was made to use the term "librar-
ian" which was in accord with the then current language of Texas certification
and is the term commonly used by superintendents, principals, and indeed, the
librarians themselves.
Data Analysis
Data from returns was analyzed as follows:
1. Frequency distribution tables were prepared for each group, showing
number and percent of non-response (Blank4, as well as number and
2 3

-12-
percent for the six response categories. These tables are not re-
produced in this report.
2. The T-Test for Correlated Samples was made for each respondent group
to compare actual and ideal perceptions on each of the statements.
Blanks were eliminated; zeroes (Don't Knows) were included in T-Test
calculations.
3. A one-way analysis of variance test was made between responses of
superintendents and those of librarians, between superintendents and
principals, between principals and librarians, and between a number
of sub-groups to be discussed in subsequent chapters. Both blanks
and zeroes were excluded from analysis of variance calculations)
4. For those items where analysis of variance showed a significant dif-
ference at the .05 or greater level, supplementary frequency distri-
butions were prepared to permit examination of percentages when
blanks and zeroes had been excluded. Only a selection of these tables
is included in this report.
5. Summary tables were constructed to facilitate reporting normative and
comparative data for each of the fifty-seven statements on the ques-
tionnaire. Each summary table gives the text of the role or function
statement; the means for actual conditions and for ideal conditions
'One of the assumptions of the analysis of variance (ANOVA) model is
that the x populations being tested have equal variances. The Bartlett test of
homogeneity of variance, an all purpose test, was used to determine whether the
assumption of equality of variances was met for ANOVA. Where the assumption of
equality of variances was not met for ANOVA in a given comparison, the affected
statistic will be omitted. We are indebted to Sandra Kincaid, Dopt. of Labor
Statistician, Dallas Regional Office, for assistance on this point.
2 4

-13-
for superintendents,1
for principals, and for librarians; and p,
the analysis of variance statistic.
rindings--T-Test for Correlated Samples
The T-Test for correlated samples between the actual and ideal rankings re-
vealed a highly significant difference in each of the three groups for every
role and function statement. In the case of the principals the difference on
this item and for all others in this section was significant at the 0.0000
level. Although not always so highly significant, T-Test results for librarians
and for superintendents also indicated highly significant differences between
actual and ideal conditions on every item. Correlated T-Test data are shown
in AppeiAix P.
The succinctness 0.7ith which the T-Test results can be reported here does
-ot mygn that they are unimportant. Superintendents, principals, and librarians
are in agreement that there is not one role or function among those included
which is now being carried out as well as it should be.
Findings--Analysis of Variance
Formulating long range plans.--No statistically significant difference was
found to exist between any of the three groups. The librarians are uniformly
perceived as having considerable actual responsibility for long range planning,
with the desired ideal over half a step above the actual condition (see table 1).
Preparing the educational specifications for new facilities.--The perceptions of
the actual situation are of particular interest here. Keep in mind that we are
er.amining the rankings assigned to librarian responsibility, as seen by each of
1Superintendents responded to items 1 through 23 only; thus Chapter III,which reports on items 24 through 57 includes no superintendent information.
25

TABLE 1
Results of one-way analysis of variance forstatement number 1: The librarian has re-sponsibility for formulating long range
plans for the library.
CONDITION MEANS P
Actual
Supt. Libn.
.10183.28169 3.02484I
Ideal 3.80000 3.92236 .1535
Actual
Libn. Prin.
3.02484 3.06601 .6283
Ideal 3.92236 3.66667
Supt. Prin.
Actual
Ideal
3.28169
3.80000
3.06601 .1163
3.66667 .1890
* Statistic not used. See note, p. 12.
2 6

- 15
the three groups. Librarians perceived their own actual responsibility at a
significantly lower level than did the principals, who in turn, ranked librarian
responsibility significantly lower than did the superintendents (see table 2).
However one may wish to speculate on the rationale for this somewhat surprising
progression, the implications for librarians seem clear. Administrators at both
building and disttict levels see more opportunity for librarians to assume responsi-
bility than librarians in this study have been willing (able?) to assume for
themselves. The opportunity to assume added responsibility is there now, and
administrators' perceptions of the ideal condition would call for eiren greater
involvement of librarians in planning for new or remodeled facilities.
Planning floor design, furnishings.--Once again the means for perceptions
of actual responsibility levels follow a librarian--principal--superintendent
low to high progression of 2.06738 to 2.27249 to 2.78261. The difference be-
tween each step is significant, and the implications are similar to those for
involvement in planning new or remodeled facilities--the door is open if the
librarians will take advantage of the opportunity. As for the ideal, principals
and superintendents show no significant difference in their means of 3.38480 and
3.55714; librarians are significantly higher (p...0487) than the superintendents
in their perception of the ideal (see table 3).
About one of eight librarians (12.65%) and one of twelve principals
(8.37%) responded "Don't Know" to the actual condition, which may indicate
lack of experience with this activity.
Planning facilities for local design sad production.--Once again, librarians
perceive their level of responsibility at a level significantly lower than do the
administrators (see table 4).
27

TABLE 2
Results of one-way analysis of variance for
statement number 2: When new or remodeledlibrary plan facilities are needed, the li-brarian has responsibility for preparingthe educational specifications for them.
CONDITION MEANS'
P
Actual
Supt. Libn.
2.91429 2.15734 .0000*
Ideal 3.69565 3.76563 .4662
4,1
Actual
Libn. Prin.
.0088*2.15734 2.40360
Ideal 3.76563 3.44853 -**
Actual
Supt. Prin.
2.91429 2.40360 .0010*
Ideal 3.69565 3.44853 .0219*
* Significant at the .05 or greater level.** Statistic not used. See note, p. 12.
28

TABLE 3
Results of one-way analysis of variance forstatement number 3: When new or remodeledlibrary facilities are planned, the li-brarian has responsibility for planningfor the floor design, furnishings, etc.
CONDITION MEANS P
Actual
Supt. Libn.
.0000*2.78261 2.06738
Ideal 3.55714 ,3.75701 .0487*
Libn. Prin.
Actual 2.06738 2.27249 .0313*
Ideal 3.75701 3.381+80 4E*
Supt. Prin.
Actual 2.78261 2.27249 .0013*
Ideal 3.55714 3.38480 .1240
* Significant at the .05 or greater level.** Statistic not used. See note, p. 12.
2 9

-18-
TABLE
Results of one-way analysis of variance forstatement number 4:. The,librarian has re-sponsibility for planning facilities for
local design and production oflearning resources.
,CONDITION! MEANS P
Actual
Supt. Libn.
2.78571 1.95470 .0000*
Ideal 3.44928 3.37785,
.5681
Libn. Prin.
Actual 1.95470 2.33161 .0000*
Ideal 3.37785 3.33750 .5630
Supt. Prin.
Actual 2.78571 2.33161 .0031*
Ideal 3.44928 3.33750 .3477
* Difference significant at the .05 or greaterlevel
30

-19-
The frequency distribution presented in Table 5 shows this clearly,
especially on the 1 (Little or No Responsibility) line. There one finds 49.83%
of librarians, only 30.577, of the principals, and much lower still, 18.577
of the superintendents.
Preparing proposals for obtaining outside funds.--The pattern observed
earlier is maintained in the perceptions of the librarian's responsibility for
preparing proposals for outside funds. Superintendents and principals both
ranked the actual level of responsibility assigned to librarians for this ac-
tivity at a significantly higher level than librarians did (see table 6). The
librarian was rather uniformly perceived as having considerable responsibility
(3.0) at the ideal level. Superintendent interviews indicated that campus
level librarians were expected to provide input for proposals for ESEA Title IV
proposals, sharing responsibility with principals and (where available) school
library supervisors. Superintendents did not see the actual preparation of
proposals as a campus level responsibility,however.
Obtaining resources from beyond the local campus.--Statements 6, 7, and 8 ask for
response on three facets of the campus level librarian's responsibility for pro-
viding coordination with, and access to, resources from beyond the local campus.
All three major hypotheses of the study were supported for each item on both
the actual and the ideal perception; i.e., there were no significant differences
in rankings of an item by superintendents, principals, and librarians. Compari-
son of the actual means for statement 6, coordinating deliveries and returns
from the school di-trict center, with the actual means for items 7 and 8 shows
that librarians are now performing best between the campus and the local dis-
trict center. The actual means for item 6 are higher, and the discrepancies
between actual and ideal are smaller, than for items 7 and 8 (see tables 7, 8, and 9 ).
31

TABLE 5
Frequency distributionresponsibility for planning
production
for statement numberfacilities
of learning resources.
Actual ConditiOn
4: The librarian hasfor local design and
RESPONSE CATEGORY LIBRARIANS PRINCIPALS SUPERINTENDENTS
No. 0/0 No. 9/0 No. 0/oNo Response 5 * 8 * 0 *
0 Don't Know 32 * ' 24 * 2 *
1 Little or No Respon-sibility
143 49.83 118 30.57 13 18.57
2 Some Responsibility 64 22.30 115 29.79 16 22.86
3 Considerable Respon-sibility
39 13.59 69 17.88 20 28.57
4 Minch Responsibility 32 11.15 75 19.43 15 21.43
5 Complete Responsibility 9 3.14 9 2.33 6 8.57
* Non-responses and zero (Don't Know) responses were not used inanalysis or variance computations.
32

TABLE 6
Results of one-way analysis of variance forstatement number 5: When funds are avail-able from sources outside the local dis-trict, the librarian has responsibility
for preparing proposalsfor obtaining them.
CONDITION1 MEANS P
Actual
Supt. Libn.
2.0588 1.78313
,
.0113*
Ideal 3.12121 2.99317 .4038
Libn. Prin.
Actual 1.78313 1.96020 . 0040*
Ideal 2.99317 3.01320 .6899
Supt.; Prin.
Actual 2.0588 1.96020 .47911.
Ideal 3.12121 3.01320 .5517
* Significant at the .05 or greater level.
33

A
TABLE 7
Results of one-way analysis of variance forstatement number 6: The librarian has re-sponsibility for coordinating deliveriesand returns of materials from the schooldistrict's center. (Answei only if yourdistrict maintains a district learning
resources center.)
CONDITION MEANS P
Actual
Supt. Libn..
3.56250 3.28571 .5170
Ideal 4.2000 3.64390 .1240
Actual
Libn. Prin.
.37873.28571 3.41392
Ideal 3.64390 3.82117 .1347
Actual
Supt. Prin.
3.56250 3.41392 . 6 99'7
Ideal 4.2000 3.82117 .2328
3

-23-
TABLE 8
Results of one-way analysis of variance forstatement number 7: The librarian hab re-sponsibility for coordinating deliveries
and returns of materials from theregional service center.
CONDITION MEANS P
Actual
Supt. Libn.
.10682.21212 2.57966
Ideal 3.31148 3.11824 .3735
Actual
Libn. Prin.
.76352.57966 2.61867
Ideal 3.11824 3.30311 .1107
Actual
Supt. Prin.
2.21212 2.61867 .0618
Ideal 3.31148 3.30311 .96'75

-24-
TABLE 9
Results of one-way analysis of variance forstatement number 8: The librarian has re-sponsibility for providing for use of ma-terials fram.outside the school by activ-ities such as Inter-library Loan and main-
taining a community resources file.
CONDITION MEANS
Actual
Supt. Libn.
2.35385 2.5000 .4771
Ideal 3.65079 3.42193 .1925
Libn. Prin.
Actual 2.5000 2.39779 .3733
Ideal 3.42193 3.42377 9811.5
Supt. Prin.
Actual 2.35385 2.39779 .8168
Ideal 3.65079 3.42377 .1662
3 8

-25-
There iv an apparent opportunity for greater activity on the part of librarians
who are willing to serve as a link to outside information and instructional
resources. Professional expertise.is clearly needed in this area to perform
a service which can often be offered without significant budget increases.
A question on the librarian's role in this area was posed for the superintendent
interviews and is discussed in chapter six.
Desi nin and conductin n-service ro rams for teachers.--The low level of
responsibility for teacher in-service perceived by all groups for both actual and
ideal scales is quite surprising (see table 10). There is food for thought here
for those involved in pre-service education who place high value and conniderable
emphasis on the school media specialist's role in in-service for teichers. The
situation seems to call for some caveats from library school instructors to neo-
phyte librarians. Those entering the profession should be made aware of possible
reluctance on the part of school personnel to view this activity as an area of
high priority, or even of legitimate concern, for the librarian.
Providing in-service education for staff.--While the ideal rankings showed
some variation and a statistically significant difference between principals and
librarians, all ideal rankings exceeded the 4.0 level (see table 11).
The frequency distributions for the actual rankings given in table 12 show
a wide difference in percentages on the 5 (Complete Responsibility) line with
over 50% of the librarians claiming complete responsibility, but only 35%
of the principals and less than 10% of the superintendents seeing the librarian
assuming complete responsibility under actual conditions. The 1 line is also of
interest, since 14.01% (nearly one of seven) of the librarians perceive them-
selves as having little or no responsibility in this area. Do they have no
staff, does their staff not need in-service education, or is someone else respon-
sible?
3 7

-26-
TABLE 10
Results of one-may analysis of variance forstatement number 9: The librarian has re-sponsibility for designing and conduct-
ing in-service training.programsfor teachers.
CONDITION MEANS P
Actual
Supt. Libn.
.94671.63768 1.64650
Ideal 2.41791 2.58147 .2715
Actual
Ideal
Libn.
1.64650
2.58147
Prin.
1.79208
2.58008
.0561
.994-3
Supt.
Actual 1.63768 :79208
Ideal 2.41791 2.58088
.2401
.2571
3 8

TABLE 11
Results of one-way analysis of variance forstatement number 10: The librarian hasresponsibility for providing in-service
education for the library staff(including volunteers).
CONDITION MEANS .
Actual
Su t. Libn.
3.34328 3.86643 .0110*
Ideal 4.22727 4.56129 .3081
Actual
Libn. Prin.
3.86645 3.60354 .0178*
Ideal 4.36129 4.12871
Actual
Supt. Prin.
3.34328 3.60354 .1651
Ideal 4.22727 4.12871 .4490
* Significant at the .05 or greater level.
3 9

-28-
TABLE 12
Frequency distributionhas responsibility for
the library
for statement numberproviding in-service
staff (includiqg
Actual Condition
10: The librarianeducation for
volunteers).
RESPONSE CATEGORY' LIBRARIANS PRINCIPALS SUPERINTENDENTS
No. Oho No. 010 No. 0/0No Response 8 10 0
0 Don't Know 9 12 * 2 *
1 Little or No Respon-sibility
43 14.01 52 13.13 13 19.40
2 Some Responsibility 32 10.42 43 10.86 16 23.88
3 Considerable Respon-sibility
23 7.49 57 14.39 20 29.85
4 Mitch Responsibility 34 11.07 102 25.76 15 22.39
5 Complete Responsibility 175 57.00 142 35.86 6 8.96
* Non-responses and zero (Don't Know)'responses were not used inanalysis or variance computations.
4 0

-29-
Producing materials.--The rankings assigned to this function by prin-
cipal& %Ala significantly higher than those given to it by librarians on both
the actual and ideal scales (see table 13). Superintendents and principals
agretal that ideally librarians would assume considerable responsibility (3.0)
for local production of materials; the actual condition is seen as near the
some (2.0) level.
Teaching students to produce audio-visual materials.--There was agreement,
without significant differences between groups, that librarians currently have
little responsibility for teaching students how to produce audio-visual ma-
terials. The mean for the ideal level, as perceived by each of the three groups,
was a full step or more above the actual level, with no significant difference
between any of the groups. This would indicate that, given funding and librar-
ian expertise adequate to do the teaching, considerable progress could be made
in this ervice area (see table 14).
Developing listening, viewing, and responding skills of students.--A gener-
ally low level of responsibility for both actual and ideal is seen by all three
groups (see table 15). The low rankings reflect an attitude that librarians
occupy a supportive, rather than an integral, role in basic instructional areas
such as developing listening, viewing, and responding skills. This seems to
be another professional role which could be assumed by librarians who are
willing to promote the use of existing resources in cooperation with classroom
teachers. Certainly an area so basic to student instruction is in need of at-
tention when 45.597. of responding superintendents, 34.06% of principals, and
43.09% of librarians indicate that librarians currently assume little or no
responsibility for it,1
1These percentages were taken from statistical tables which have not been
included in this report.
41

-30-
TABLE 13
Results of one-way analysis of variance forstatement number 11: The librarian has re-sponsibility for campus level production
of materials that aid teachers inthe classroom.
CONDITION MEANS P
Actual
Supt. Libn.
.42972.08696 1.96154
p
Ideal 3.04478 2.79487 1 .1189
Actual
Libn. Prin. 4011111
.0058*1.96154 2.21182
Ideal 2.79487 3.12069 .0002*
Actual
Supt. Prin.
2.08696 2.2118e .4332
Ideal 3.04478 3.12069 .6232
* Significant at the .05 or greater level.
4 2

TABLE 14
Results of one-way analysis of variance forstatement number 12: The librarian has re-sponsibility for teaching students how to
produce audio-visual materials.
CONDITION MEANS P
Actual
Supt. Libn.
.20831.56923 1.77419
Ideal 2.84615 2.80528 .8064
Actual
Libn. Prin.
.36891.77419 1.85642
Ideal 2.80528 2.90226 .2904
Actual
Supt. Prin.
.06351.56923 1.85642
Ideal 2.84615 2.90226 .7266
4 3

TABLE 15
Results of one-way analysis'of variance forstatement number 13: The librarian has re-sponsibility for developing the listening,
viewing, and responding skillsof students.
CONDITION MEANS P
Actual
Supt. Libn.
1.79104 1.94603 .2639
Ideal 2.70313 2.61093I
.5278
Actual
Libn. Prin.
1.94603 2.06234 .1346
Ideal 2.61093 2.78713 .0272*
Actual
Supt. Prin.
1.79104 2.06234 .0405*
Ideal 2.70313 2.78713 .5559
*Significant at the .05 or greater level.
4 4

-33-
It has been suggested that the questionnaire statement should have read,
"The librarian has responsibility for helping teachers develop the listenirig,
viewing, and responding skills of students." Perhaps this is correct; the
competency statement in the certification guidelines model from which this
item was derived reads, "Facilitate viewing, listening, reading and responding
skills of students and teachers." There is warrant for the present wording,
however, if one considers such parent statements as the following from Nadia
Programs: District and School (AASL and AECT, 1975:53):
"The media staff draws upon the expertise provided by their trainingand experience to enable learners to acquire research skills andreading, viewing, and listening techniques that enhance their abili-ty to select and use media. This is a special and unique contributionthat media professionals make to students at every macurity level."
In addition, the AASL Certification Nbdel for Professional School Nadia PersoU-
nel (AASL, 1976:14) lists among its competencies for utilization of media
"d. Provide guidance in reading, listening, aad viewing experiences for stu-
dents and teachers."
Developing reading and res onding skills.--The low means for the actual
conditions (see table 16) are a function of the high percentages of respondents
who perceive the librarians as having little or no current responsibility for
developing reading and responding skills-32 of the superintendents (44.44%),
175 of the principals (41.87%), and 133 of the librarians (41.05%).
Even at the ideal level the response rate for the Little or No Responsi-
bility category was 15 for superintendents (20.83%), 74 for principals (17.70%),
and 56 for librariani (17.28%).1 As shown in chapter four, the view that li-
brarians have little or no responsibility for developing reading and responding
skills is stronger in secondary schools than in elementary schools.
1See note, page 29.
4 5

-34-
TABLE 16
Results of one-way analysis of variance forstatement number 14: The librarian has re-
sponsibility for developing the readingand responding skills of students.
CONDITION MEANS P
Actual
Supt. Libn.
1.72464 1.91429 .1315
Ideal 2.44776 2.46429 .9o55
Actual
Libn. Prin.
35781.91429 1.84938
Ideal 2.46429 2.51225 .5362
Actual
Supt. Prin.
1.72464 1.84938 .2855
Ideal 2.44776 2.51225 .6411
4 6

-35-
Comparison of tat'ss 15 and 16 shows that all three groups ranked the
librarian's responsibility for developing listening, viewing, and responding
skills at somewhat higher levels than their rankings for developing reading
and responding skills.
Selecting materials and related equipment.--Statements
15, 16, 17, and 18 deal with various aspects of responsibility for selecting
materials and related equipment. As one might expect, the highest level for
both the actual and the ideal scales was on the function traditionally'asso-
ciated with librarians: statement sixteen, formulating and recommending
selection policies for print materials. All group means exceeded 3.5 on the
actual scale, and only the principals' mean of 3.96845 fell below 4.0 on the
ideal scale (see table 18). Librarians perceived both actual and ideal re-
sponsibilities for selecting print materials'at a significantly higher level
than principals did. This may mean that librarians should give more consider-
ation to the need for sharing responsibility for developing and implementing
selection policies.
Next highest means were fo statement 18, responsibility for making ade-
quate provisions for previewing materials. Here, as in statement 16, we have
an area of responebIlity whic: has traditionally been regarded as proper for
the librarian. It is ru14 w-thout significant dif2erence of opinion between
groups in every case except that the ideal perceptions of librarians were sig-
nificantly higher than were those of the principals (see table.20).
Means for the actual conditions and, in general, for the ideal were lower
still on statement 15, selecting audio-visual materials (see table 17). The
lowest means of the four selection areas appear on statement 17, evaluating
and selecting audio-visual equipment (see tfble 19). Selection of audio-visual
4 7

TABLE 17
Results of one-way analysis of variance forstatement number 15: The librarian has re-sponsibility for formulating and recomuend-ing for adoption policies for the evalua-tion andselection of audio-visual mater-
ials for the collection.
CONDITION MEANS
Actual
Supt. Libn.
2.60870 2.88088 .1526
Ideal 3.39706 3.76415 .0033*
Actual
Libn. Prin.
2.88088 2.65586
Ideal 3.76415 3.34063 .0000*
Actual
Supt. Prin.
3.60870 2.65586 .7667__Ideal 3.39706 3.34063 .6605
* Significant at the .05 or greater level.** Statistic not used. See note, p. 12.
48

TABLE 18
Results of one-way analysis of variance forstatement number 16: The librarian has re-sponsibility for formulating and recom-mending for adoption policies for theevaluation and selection of librarybooks, periodicals, and other print
. materials for-the collection.
CONDITION MEANS
Actual
Supt. Libn.
3.76812 3.93189 .2983
Ideal 4.17647 4.24611 .4830
Actual
Libn. Prin.
3.93189 43.51214 .0Q00*
Ideal 4.24611 3.96845 .00004'
Actual
Supt. Prin.
3.76812 3,51214 .o866
Ideal 4.17647 3.96845
* Significant at the .05 or greater level.
4 9

TABLE 19
Results oc. one-way analysis of variance forstatement. number 17: The librarian has re-sponsibility for evaluating and selecting
audio-visual equipment.
CONDITION MEANS P
Actual
Supt. Libn.
2.44118 2.44828 .9691
Ideal 3.07576 3.52866 .0006*
Actual
Libn. Prin.
2.448e8 2.56934 .2164
Ideal 3.52866 3.21550 .0000*
Actual
Supt. Prin.
.42912.44118 2.56934
1
Ideal 3.07576 3.2I550 .304.3
* Significant at the .05 or greater level.

-39-
TABLE 20
Results of one-way analysis of variance forstatement number 18: The librarian has re-sponsibility for making adequate provisionfor previewing materials being considered
for the collection.
CONDITION MEANS P
Actual
Supt. Libn.
.05823.21429 2.86076
Ideal 3.79412 3.76508t
.8218
Libn. Prin.
Actual 2.86076 2.90799 .64.26
Ideal 3.76508 3.59903 .0229*
Supt. Prin.
Actual 3.2142 2.90799 .0607
Ideal 3.79412 3.59903 .1161
* Significant at the .05 or greater level.
51

equipment and materials is apparently less recognized as the proper province
of libiarians than is the selection of print materials. The ideal rankings
of librarians were significantly higher than the rankings of principals and
superintendents on statements 15 and 17.
Since responsibility for audio-visual materials and equipment is so pi-
votal to the concept of the unified learning resources program being developed
in Texas and elsewhere, the frequency distributions for perceptions of the
ideal condition on statements 15 and 17 are presented in tables 21 and 22.
These tables show quite clearly that even though a small minority per-
ceives little or no librarian responsibility in these two areas, the majority
of administrators as well as librarians would ideally prefer to see librarians
assume "Much" or even "Complete" responsibility. Since there is increasing
support for this view from national and state levels, it will become mare and
more important for librarians to develop the skill and the will to assume re-
sponsibility where the propensity to delegate it to them already exists.
Develo in and in.lementin ac uisition rocedures.--Statements 19, 20, and
21 concern areas of acquisition. Here, as in the hierarchy that emerged for areas
of selection, the highest rankings were assigned to the librarian's responsibility
for developing and implementing procedures for acquisition of print,materials
(statement 19); the next higher rankings were for acquisition of audio-visual
materials (statement 20); and the lowest rankings of the three were given to
responsibility for acquiring audio-visual equipment (statement 21). Superinten-
dents, principals, and librarians all ranked the three statements in the same
order. Thus, even though the librarians were significantly higher in a number
of their rankings than superintendents and principals, particularly on the ideal
condition, there was no conflict on the relative positions of the three acquisition
areas (see tables 23, 24, and 25).
5 9

-41-
TABLE 21
Frequency distribution for statement number 15: The librarianhas responsibility for formulating and recommending foradoption policies for the evaluation and selection Of
audio-visual materials for the collection.
Ideal Condition
RESPONSE CATEGORY
.No Response
0 Don't Know
1 Little or No Respon-sibility
2 Some Responsibility
3 Considerable Respon-sibility
4 Much Responsibility
5 Complete Responsibility
LIBRARIANS PRINCIPALS SUPERINTENDENTS
No. 0/0 No. 0/o No. 0/0
5 * 2 * 4 *
7 2.20
28 8.81
52 16.35
177 55.66
54 16.98
5 * 0
14 3.35 2 2.94
77 18.42 12 17.65
105 25.12 19 27.94
185 44.26 27 39.71
30 7.18 8 11.76
* Non-responses and zero (Don't Know) responses were not used inanalysis or variance computations.
5 3 ,

TABLE 22
Frequency distribution for statenent number 17: .The librarianhas responsibility for evaluating and selecting
audio-visual equipment,
Ideal Condition
RESPONSE CATEGORY LIBRARIANS PRINCIPALS SUPERINTENDENTS
No. 0/0 No. °/o No. cl/o
No Response 6 * 3 * 6 *
0 Don't Know 4 * 2 .* 0 *
1 Little or No Respon-sibility
8 2.55 30 7.26 3 4.55
2 Some Responsibility 43 13.69 69 16.71 18 27.27
3 Considerable Respon-sibility
75 23.89 120 29.06 20 30.30
1
4 Much Responsibility 151 4E3.09 170 41.16 21 31.82
5 Complete Responsibility 37 11.78 24 5.81 I. 6.06
* Non-responses and zero (Don't Know) responses were not used inanalysis or variance zomputations.
5 1
4

-43-
TABLE 23
Results of one-way analysis of variance forstatement number 19: The librarian has re-sponsibility for developing and implement-
ing procedures for acquisition (by pur-chase, exchange, or gift)
of print materials.
CONDITION MEANS P
Actual
Supt. Libn.
3.08571 3.60952 .0045*
Ideal 5.52941 4.06940I
mow*
Actual
Libn. Prin.
3.60952 2.91646 .0000*
Ideal 4.06940 5.47750
Actual
Supt. Prin.
3.08571 2.91646 . 3272
Ideal 3.52941 3.47750 . 7109
* Significant at the .05 or greater level.** Statistic not used. See note, page 12.

TABLE 24
Results of one-way analysis of variance forstatement number 20: The librarian has re-sponsibility for developing and implement-
ing procedures for acquisition ofaudio-visual materials.
CONDITION MEANS P
Actual
Supt. Libn.
2.64706 2.95238 .1293
Ideal 3.37879 3.83439 .0009*
Actual
Libn. Prin.
4HE2.95238 2.65174
Ideal 3.83439 3.26650
Actual
Supt. Prin.
2.6,(06 2.65174 .9780
Ideal 3.37879 3.26650 .4408
* Significant at the .05 or greater level.** Statistic not used. See note, page 12.
5

-45-
TABLE 25
Results of one-way analysis of variance forstatement number 21: The librarian has re-
sponsibility for acquiring audio-visualequipment.
CONDITION MEANS P
Actual
Supt. Libn.
2.11940 2.22713 .5416
Ideal 2.83582 3.32588
t
.0012*
Actual
Libn. Prin.
2.22713 2.37065 .1371
Ideal 3.32588 2.98519 .0000*
Actual
Supt. Prin.
2.11940 2.37065 .1265
Ideal 2.83582 2.98519 .3365
* Significant at the .05 or greater level.
5 7

-46-
There was no significant difference in the rankings superintendents and
principals assigned to either actual or ideal conditions for any of the three
acquisitions statements.
Storing and scheduling of equipment.--Significantly different rankings
were assigned by the three groups in five of six comparisons on statement 22
(see table 26). This may indicate a difference in perception of the meaning
of the statement, or it may be that certain large districts with a dispro-
portionate number of principals and librarians have skewed the overall findings.
In any event, the frequency distributions may be of interest and are provided
in tables 27 and 28.
Comparison of the Complete Responsibility cell for librarians on tables
27 and 28 shows a rather unusual situation: fewer librarians assigned the
highest ranking for the ideal condition than did so for the actual condition.
Some who have complete responsibility now would apparently like to get rid of
at least part of it. Nevertheless, the ideal condition seems to hold promise
for the future; combining lines 4 and 5 for each group shows that 76.55%
of the librarians, 71.267, of the principals, and 60.29 % of the superintendents
would like to have librarians assume Much or Complete responsibility for
storage and scheduling of equipment.
Developing policies and procedures for maintenance of equipment.--
Rankings of superintendents and principals did not differ significantly, but
the librarians' ranking of their ideal level of responsibility was signifi-
cantly higher than the rankings of either principals or superintendents (see
table 29).
Table 30 shows the frequency distribution for librarians' responsibility
for developing policies and procedures for maintenance of audio-visual equip-
ment. While the ideal means are above the Considerable Responsibility level,
53

-47-
TABLE 26
Results of one-way analysis of variance forstatement number 22: The librarian has re-sponsibility for the storage and schedul-
ing of audio-visual equipment.
CONDITION MEANS P
Actual
Supt. Libn.
2.86957 3.82132 .0000*
Ideal 3.64706 4.09464 .0047*
Actual
Libn. Prin.
3.83132 3.39268 .0001*
Ideal 4.09464 3.84541 .0011-9*
Actual
Supt. Prin.
2.86957 3.39268 .0068*
Ideal 3.64706 3.84541 .2006
* Significant at the .05 or greater level.
5 9

TABLE 27
Frequency distribution for statement number 22: The librarianhas responsibility for the storage and scheduling of audio-visual equipment.
Actual Condition
RESPONSE CATEGORYLIBRARIANS PRINCIPALS SUPERINTENDENTS
No. 0/0 No. 0/o No. 010No Response4 * 4 * 2 *
0 Don't Know1 * 4 * 1 *
1 Little or No Respon-sibility
52 16.30 80 19.51 18 26.09
2 Some Responsibility 24 7.52 37 9.02 13 18.843 Considerable Respon-
sibility18 5.64 55 13.41 11 15.94
4 Much Responsibility 60 18.81 118 28.78 14 20.295 Complete Responsibility 165 51.72 120 29.27 13 18.84
* Non-responses and zero (Don't Know)responses were not used inanalysis or variance computations.
0 0

-14.9-
TABLE 28
Frequency distribution for statement number 22: The librarianhas responsibility.for the storage and scheduling of audio-
visual equipment.
Ideal Condition
RESPONSE CATEGORY LIBRARIANS PRINCIPALS SUPERINTENDENTS
No. °/o No. 0/0 No. °/o
No Response 5 * 3 * 4 *
0 Don't Know 2 * 1 * 0 *
1 Little or No Respon-sibility
19 5.86 34 9.21 3 4.41
2 Some Responsibility 21 6.48 19 4.59 10 14.71
3 Considerable Respon-sibility
29 8.95 66 15.94 14 20.59
4 Much Responsibility 90 27.78 153 36.96 22 32.35
5 Complete Responsibility 158 48.77 142 34.30 19 27.94
* Non-responses and zero (Don't Know) responses were not used inanalysis or variance computations.
61

TABLE 29
Results of one-way analysis of variance forstatement number 23: The librarian has re-sponsibility-for developing policies and
procedures for maintenance ofaudio-visual equipment.
CONDITION MEANS P
Actual
Supt. Libn.
2.33333 2.80635 **
Ideal 3.13235 3.55769 .0106*
Actual
Libn. Prin.
.0684.2.80635 2.60000
Ideal 3.55769 3.21078 .0003*
Actual
Supt. Prin.
2.33333 2.60000 .1414.
Ideal 3.13235 3.21078 .6405
* Significant at the .05 or greater level.** Statistic not used. See note, page 12.
6 2

-51.
TABLE 30
Frequency distribution for statement number 23: The librarianhas responsibility for developing policies and procedures
for maintenance of audio-visual equipment.
Ideal Condition
RESPONSE CATEGORY
No Response
0 Don't Know
1 Little or No Respon-sibility
2 Some Responsibility
3 Considerable Respon-sibility
4 Much Responsibility
5 Complete F.tsponsibility
LIBRARIANS PRINCIPALS SUPERINTENDENTS
No. 0/0 No. O/o No. 0/0
5 * 6 * 4 *
7 * 4 * o *
28 8.97 64 15.69 9 12.50
36 11.54
65 20.83
100 32.05
83 26.60
51 12.50
92 22.55
137 33.58
64 15.69
10 13.89
19 26.39
23 31.94
7 9.72
* Non-responses and zero (Don't Know) responses were not used inanalysis or variance computations.
6 3

- 52-
it should be kept in mind that there is a fairly substantial minority in each
gr)up who sees the ideal condition as one where the librarian has Little or
No Responsibility or, one step above that, Some Responsibility (see table 30,
lines 1 and 2).
6 4

CHAPTER III
PERFORMANCE
1This chapter provides da'ta on role and function syltements twenty-four
through fifty-seven from the 418 principals and the 324 librarians who laspOnded
to the questionnaire. Response to these statements was not requested from super2
intendents, since the statements are concerned with performance; and campus level
personnel, rather than superintendents or their assistants, were assumed to be
better sources for this information
Performance Area I
This performance area, the first of three to be discussed in chapter three,
was organized to include those role and function statements which involve period-
icity, regularity, or consistency. The response categories are: 0 (zero) = Don't
Know; 1 = Never, Not at all; 2 = Infrequently; 3 = Sometimes; 4 = Frequently;
5 = Always, Systematically.
Disseminating_information on resources and services.--The means for the rankings
from the analysis of variance findings, and particularly the means for the ideal con-
ditions, clearly show that disseminating information to patrons on available resources
is a service that is considered important (see table 31). Similarly, promoting the
library's collections through displays and presentations (statement 25) and dissemin-
ating information on the effective use of materials and equipment (statement 26)
are functions which are now performed at a 3 (Sometimes) level and would ideally be
performed at a 4 plus (frequently) level (see tables 32 and 33). Implementing these
functions at a higher level would not seem to require significant additional funding,
but rather a reordering of priorities on the part of librarians.
6 5

TABLE 31
Statement number 24. The librarian disseminates informition tostudents and teachers on the availability of materials, equip-
ment, and resources in the library.
Actual
Ideal
Libn. Prin.
4.22500 3.88564
4.75472 4.58252
TABLE 32
2
Statement number 25. The librarian promotes the library'scollections and services by such means as displays, book
talks, and classroom presentations.
Libn. Prin. 2
Actual 3.70405 3.75669 .5027
Ideal 4.48418 4.48301 .9807
TABLE 33
Statement number 26. The librarian disseminates, information tostudents and teachers on effective use of materials and equip-
ment.
Libn. Prin. 2
Actual 3.60313 3.46341 .0669
Ideal 4.37107 4.26764 .0509 *
Providing information on new teaching developments.--Supplying information to
teachers on new teaching developments and practicies is now perceived by both
librarians and principals as occurriAg at a 2 plus (LT frequently to Sometimes) level
(see table 34). While both groups agree that increased activity would be desirable,
* Difference signii.cant at the .05 or greater level.
** Statistic not used. See note, page 12.
6 6

-55-
the frequency distribution table for the ideal condition on this statement (not
shown in this report) shows that 8.33% of all librarians and 7.18% of all prin-
cipals rated this as a 1 (Never) activity at the ideal level. It is apparent
from responses to this and some other statements (e.g. 13, 14, 29) that a per-
sistent minority of both principals and librarians does not view the librarian
as a full-fledged member of the instructional faculty.
Proyiding teachers with lists of materials useful in instruction (statement 28)
is another function being performed at a Sometimes (3) level now but would be done
Frequently (4) under ideal conditions (see table 35). Here, as in a number of other
traditional library functions, the librarians ranked their actual activity signifi-
cantly higher than the principals did.
TABLE 34
Statement number 27. The librarian provides information to teacherson new teaching developments and practices.
Libn. Prin. 2
Actual 2.55238
_
2.40100 .0747
Ideal 3.41196 3.36250 .5628
TABLE 35
Statement number 28. The librarian provides teachers with lists ofmaterials useful in instruction.
Libn. Prin. 2
Actual 3.47188 3.27518 .0178*
Ideal 4.23885 4.15892 .1805
Partici atin on curriculum lannin committees.--This is an especially
* Difference significant at the .05 or gr,later level.
6 7

important function and one that is not viewed in the same way by librarians and
principals (see table 36). As shown in table 37, the significantly lower mean
for librarians on the actual scale stems from the 136 librarians-44.44% of the
total responding--who reported that they never participate on curriculum planning
committees; whereas only 21.56% of the principals perceived librarian participation
at the "Never" level. At the other end of the scale, a total of 15.68% of the
librarians see their current involvement at the 4 (Frequently) and 5 (Always;
Systematically) levels. Nearly twice that percentage-27.79%of the principals
ranked current librarian involvement on the two upper levels. It is somewhat
bemusing to consider the Don't Know responses; one wonders why 24 principals would
not know whether librarians participate on curriculum planning committees. It is
even harder to understand why twelve librarians "did not know" whether they par-
ticipated in curriculum planning, or why six librarians did not know what the ideal
condition should be (see table 38).
The frequency distribution in table 38 shcws that the ideal condition, as
perceived by over 90% of the principals, would have librarians participating at the
3, 4, or 5 level. Even though the ideal ranking reported 115, librarians was signifi-
cantly higher than that reported by principals, the way seems open for greater par-
ticipation in curriculum planning by librarians.
TABLE 36
Statement number 29. The librarian participates on curriculumplanning committees.
Libn. Prin. 2
Actual 2.07477 2.68571 .0000*
Ideal 4.04207 3.77444 .0004*
* Difference significant at the .05 or greater level.
6 8

-57-
TABLE 37
Frequency distribution for statement number 29: The librarianparticipates on curriculum planning committees.
Actual Condition
RESPONSE CATEGORY LIBRARIANS PRINCIPALS
No Response
No. No.
6 __ 9 __
0 Don't Know 12 24 --
I Never, Not at All 136 44.44 83 21.56
2 Infrequently 68 22.22 92 23.90
3 Sometimes 54 17.65 103 26.75
4 Frequently .33 10.78 77 20.00
5 Always, Systematically 15 4.90 30 7.79
TABLE 38
Frequency distribution for statement number 29: The librarianparticipates on curriculum planning committees.
Ideal Conlition
RESPONSE CATEGORY LIBRARIANS PRINCIPALS
No. No.
No Response 9 -- 10 ....
0 Don't Know 6 __ 9 -_,
1 Never, Not at All 7 2.27 12 3.01
2 Infrequently 15 4.85 26 6.52
3 Sometimes 55 17.80 100 25.06
4 Frequently 113 36.57 163 40.85
5 Always, Systematically 119 38.51 98 24.56
6 9

-58-
Designing information systems--Principals and librarians agree on their
radkings for both actual end ideal conditions here (see table 39). Frequency
distribution tables (not reproduced in this report) show that on the ideal con-
dition, 5.26% of the principals and 10.49% of the librarians responded "Don't
Know." In-service education is apparently needed for insuring librarian familiar-
ity with, and competency in, this area.
Table 39
Statement number 30. The librarian designs information systemsto meet the needs of students and teachers.
Libn. Prin. 2
Actual 3.01434 2.95526 .5426
Ideal 4.08273 3.94330 .0556
Traditional library functions.--Statements 31, 32, 33, and 34 are considered
together, and the analysis of variance results are shown in tables 40, 41, 42, and
43. Examination of the mean scores shows that for every one of these statements, on
both actual and ideal, the rankings by librarians are considerably higher than that
assigned by principals. When one compares these findings with those for such manage-
ment functions as planning and applying for funds (pp. 13 - 14, where principals
assigned the higher rankings, a pattern seems to emerge. Librarians (put them-
selves on the line and) rank themselves highest in those traditional library functions
where they feel secure and comfortable. :hey do not present themselves as strongly
in the newer, less familiar areas. The validity of this pattern might be questionable
since we are looking at two different areas (i.e. performance and responsibility) if
there were not supporting evidence farther along in this performance seen= in the
results from statements 35, 36, 38, and 39.

-59-
TABLE 40
Statement number 31. The librarian helps students chooseappropriate materials to meet learning needs.
Libn. Prin.
Actual 4.34375 3.81863
.2
* *
Ideal 4.63522 4.35766 **
TABLE 41
Statement number 32. The librarian teaches students how touse materials available in the library.
Libn. Prin. 2
Actual 4.39498 4.16019 4(4
Ideal 4.78095 4.61165 * *
TABLE 42
Statement number 33. The librarian applies learning theories tothe evaluation of materials for inclusion in the collection.
Libn. Prin.
Actual 4.16452 3.48619 **
Ideal 4.56129 4.2o4o8 **
TABLE 43
Statement number 34. The librarian evaluates materials for inclusionin the collection by utilizing suggestions from administrators
and teachers.
Libn. Prin. 2
Actual 4.45938 3.96020 **
Ideal 4.63810 4.46324 .0002*
Difference significant at the .05 or greater level.
t.tatistic not used. See note page 12.
71

Using new production methods.--Principals ranked l'or..,:aians' actual perfor-
mance significantly higher than librarians ranked themselves (see table 44), but
their perceptions of the ideal condition did not differ significantly. More than
one-eighth (13.40%) of the principals responded "Don't Know" to the actual
condition.
TABLE 44
Statement number 35. The librarian incorporates new productionmethods into the production of media.
Libn. Prin.
Actual 2.76014 2.98000 .0232*
Ideal 3.88591 3.96185 .3195
Using the systems approach.--There were no significant differences between
rankings on this statement (see table 45). There were, however, 134 principals
(32.06%) and 57 librarians (17.59%) who responded "Don't Know" on the actual
condition.
The percentage of "Don't Know" responses was also quite high on the ideal
condition-22.97% of the principals and 20.37% of the librarians. If the systems
approach is valid in school learning resources centers (and we believe it is) a
good deal of in-service education is needed. Furthermore, the current curriculum
supporting school library certification needs major overhaul in most colleges and
universities.
Gathering and using statistical and research data.--Statements 37 and 38
received very similar responses. The act149'1 means are near the 3.0 (Sometimes
level and are not significantly different for librarians and principals (see tables
* Difference significant at the .(n or greater 1ev,1.

-61-
TABLE 45
Statement number 36. The librarian uses the systems approach tothe study and design of library services.
Libn. Prin. 2
Actual 3.05021 3.20370 .1713
Ideal 4.00885 4.11960 .1569
46 and 47). The ideal levels are ne v at the 4.0 (Frequently) level for both
groups and do not differ significant.j.
TABLE 46
Statement number 37. The librarian gathers statistical datafor use in managing the library.
Libn. Prin. 2
Actual 3.10423 3.04217 .5646
Ideal 3.95987 3.98352 .7467
TABLE 47
Statement number 38. The librarian applies basic research datareported in the literature to the management
of the library.
Libn. Prin. 2
Actual 3.05941 3.11327 .5745
Ideal 3.91333 .399145 .2817
Plannin and conducting reseavch nrojects.--Librarians and principals agree
that the current performance of librarians is weak and that ideally there would
be much more research activity (see table 48). A lack of communication between
principals thri 1Lbrarians is indicated by the large percentage (19.38%) of prin-
cipals who responded "Don't Know" to the item on the actual condition and by the
7 3

-.62-
11.72% of the principals who responded "Don't Know" to the ideal condition.
TABLE 48
Statement number 39. The librarian plans and conducts researchprojects to provide information for decision making.
Libn. Prin. 2
Actual 2.21333 2.23148 .8435
Ideal 3.42105 3.47045 .5467
Reading professional publications.--As was expected, both groups assigned
high rankings to this activity on both the actual and the ideal scales (see
table 49).
TABLE 49
Statement number 40. The librarian reads professional publicationsto keep abreast of developments in the J.t(A6
Actual
Ideal
Libn. Prin.
4.42688 3.94901
4.7704); 4.48756 **
Performance Area II
This section considers six statements which ask respoments 0 indicate
the extent to which the role or function is providcd. The response scales havo
the following categories: () Don't Know; 1 m Makes Ao Provision; 2 x. Makes Min-
imal Prwision; 3 m Makes Partial Provision; 4 Makes Substantial ProviqLn; 5 =
Makes Complete Frovision.
At. shown in table O, five of the six statements were not found to have sig-
nificantly different reAings betwvli principals and librarianu, althlugh librarians
4:* Statistic not use6. F.,ee note, page 12.
7 4

-63-
TABLE 50
Results of analysis of variance between principals and librariansfor statements in performance area II.
Actual Condition
Role or Function Statements
41. The librarian makes provision for eval-uation of the library's policies and procedures.
42. The librarian makes provision for referenceservices for the students and teachers in theschool.
43. The librarian makes provision for resourceswhich will support the school's curricular pro-gram._
44. The librarian makes provision for materialsto meet the recreatianal needs of the students.
45. The librarian makes provision for profession-al materials to meet the needs of teachers andadministrators.
46. The librarian makes provision for multi-cltural and multi-ethnic materials.
Ideal Condition
Role or Function Statements
Ill. The librarian makes provision for eval-uation of the library's policieu and procedures.
42. The librarian makes provision for referenceservices for the students and reachers Ln theschool.
43. The librarian makes provision for resourceswhich will support the school's curricular pro-gram.
44. The librarian makes provision for matet.141sto meet the recreational needs of the students.
45. The librarian makes provision for profession-al materials to meet the needs of teachers andadministrators.
46. The librarian maker, provision for multi-cultural and multi-ethnic materials.
Libn. Prin.
3.30097 3.27321 .7568
4.30408 3.86181 **
f
4.14151 3.76485 **
3.r08 3.40()=J **
3.31Q% 7.2(03 .5591
3.82019 !).64810 .0206*
Libn. Prin.
!,.26384 4.17776 .1096
4.60759 4.40547 **
4.57188 4.35539 **
4.36102 4:03731 **
4.19745 4.14706 .3636
4.30573 4.17n37 .0151*
* Difference significant at the .05 or greater level.** Statistic not used. See note, page 12.
7 3

consistently ranked these functions at higher levels than principals did. Four
of these statements--providing reference services, providing resources in support
of the curriculum, providing materic6e for the recreational needs of students, and
providing professional materials fcr: zaachoxs--fit the traditional librarian
activity category discussed earlier in connection with statements 31-54. The extent
to which librarians are perceived as the primary source of these services was
ascertained by examining the f-equency distribution tables to determine the percent-
age of respondents who assigned ranks of 4 (Substantial Provision) and 5 (Complete
Provision). Table 51 shows the combined total percentage for the two ranks of the
actual condition. Frequency distribution totals for the two highest categories
combined for the ideal condition for these statements follow in table 52.
The percentages shown in tables 51 and 52 warrant consideration even though
the analysis of variances statistic has not been used.
The rather substantial percentage differences in perceptions of the actual
condition for statements 42, 43, and 44 apparently denote a lack of common under-
standing as to who is doing what or, perhaps, of the rather standard terminology
used in the statements. The gap which remains at the ideal level for statement 44,
providing recreational material, might bear further investigation: where do the re-
maining 24% of the principals think students should get their recreational materials?
The librarians' total of 46% on the actual scale for statement 45 reminds us that
campus level professional libraries are generally inadequate.
(3

-65-
TABLE 51
Percentage of principals and librarians who perceive the actual .
condition for statements 42-45 at the 4 &
of LibrariansStatement Ranking in 4 & 5
Combined
42. Providing reference
5 levels.
of PrincipalsRanking in 4 & 5
Combined
services. 85.80 70.58
43. Providing resources tosupport ehe curriculum. 90.49 66.50
44. Providing materials tomeet recreational needs. 77,16 51.67
45. Providing professionalmaterials for teachers andadministrators. 46.30 44.98
TABLE 52
Percentage of principals and librarians who perceive the idealcondition for statements 42-45 at the 4 &
of LibrariansStatement Ranking in 4 & 5
Combined
42. Providing reference
5 levels.
of PrincipalsRanking in 4 & 5
Combined
services. 95.68 89.95
43. Providing resources tosupport the curriculum. 93.21 89.71
44. Providing materials tomeet recreational needs. 86.42 76.32
45. Provoding professionalmaterials for teachers andadministrators.
84.26 84.45
Providing multi-cultural and multi-ethnic materials.--The librarian.,1 rankings
were eignIficantly higher than those of principals for both the actual and the ideal
conditions for this statement (see table 50). Since this service function has such
7 7

high priority in Texas, it would be well for librarians to be sure that their
understanding of proper performance is congruent with that of the principals.
Performance Area III
This, the final section, covers eleven statements (47 through 57) which were
considered by the investigators to be dichotomous in nature. The five interval sCale
was replaced in this section by response choices of 0 = Don't Know; 1 = Yes; and.....
5 = No. The computer was then programmed to treat the 1 (Yes) responses as 5's and
the 5 (No) responses as l's to maintain the 1 lowest to 5 highest ranking values of
the previous 46 statements.
Since data summaries for seven of the eleven statements in this section require
no comment, data on all eleven will be presented on the following pages in tables
53 and 54, with comments following the tables.

-67-
TABLE 53
Results of analysis of variance between principals and librariansfor statements in performance area II.
Actual Condition
Role or Function Statements
47. The librarian formulates and is guided byspecific objectives for the library.
48. The librarian provides adequate proceduresfor circulating print and audio-visual materials.
49. Print materials are organized according to
Libn.
4.78413
4.83333
Prin.
4.52304
4.42569
**
the Dewey Decimal or other accepted classificationsystem.
4.87382 4.91753 .3607
50. Audio-visual materials are organized accord-ing to the Dewey Decimal or other accepted classi-fication system.
4.08280 4.08934 .9602
51. Access to print materials is provided througha card catalog and/or other records. 4.87500 4.8863o .8259
52. Access to audio-visual materials is providedthrough a card catalog and/or other records. 4.4700 4.22955 **
53. The librarian prepares an annual report onthe progress and activities of the library. 3.26537 3.61157 .0217*
54. The librarian prepares an annual budgetrequest.
3.65397 4.41085 **
55. The librarian maintains financial recordsto show campus level allocations and expenditures. 4.35443 4.28342 .5379
56. The librarian applies instructional designprinciples to the design of locally producedmaterials.
2.95781 3.55944 .0005*
57. The librarian providc9 adequate supervisionof the library staff (including volunteers). 4.59609 4.68286 .3178
* Difference signif'.At at the .05 or greater level.
** Statistic not used. Sea note, page 12.
7

-68-
TABLE 53--continued
Results of analysis of variance between principals and librariansfor statements in performance area II.
Ideal Condition
Role or Function Statements
47. The librarian formulates and is guided byspecific objectives for the library.
48. The librarian provides adequate proceduresfor circulating print and audio7visual materials.
49. Print materials are organized according to
Libn.
5.00000
5.00000
Prin.
4.94962
4.95025
.0460*
.0481*
the Dewey Decimal or other accepted classificationsystem.
4.96203 4.97995 .4758
50. Audio-visual materials are organized accord-ing to the Dewey Decimal or other accepted classi-fication system.
4.80769 4 .71123 .1898
51. Access to print materials is provided througha card catalog and/or other records. 4.97468 4.98000 .8131
52. Access to audio-visual materials is providedthrough a card catalog and/or other records. 4.96190 4.75635 **
53. The librarian prepares an annual report ontae progress and activities of the library. 4.55700 4.74160 **
514.. The librarian prepares an annual budgetrequest. 4.76547 4.82957 .3316
55. The librarian maintains financial recordsto show campus level allocations and expenditures. 4.72816 4.70103 .7308
56. The librarian applies instructional designprinciples to the design of locally producedmaterials.
4.42358 4.70732 **
57. The librarian provides adequate supervisionof the library staff (including volunteers). 4.97444 4.93939 ,2730
* Difference significant at the .05 or greater level.
** Statistic not used. See note; page 12.

-69-
The uniformly high rankings by both librarians and principals on statements
47, 48, 49, 51, 52, 55, and 57 seem to indicate that these are standard expecta-
tions. Future versions of the survey instrument used in this study might mention
them as presumed givens in a preliminary paragraph and omit them as response items.
Organizing and classifying audio-visual materials (statement 50).--Over one-fifth
(22.22%) of the librarians reported that audio-visual materials are not organized
according to the Dewey decimal or other accepted classification system. Principals
confirmed this situation: 18.9% responded No and another 13.4% responded "Don't
Know." The basic step, then, of providing bibliographic control of campus media
collections must be accomplished in these schools before a workable learning re-
sources center can be established. These percentages also suggest that far too
many principals are not aware of what'is happening in the library, since more than
one out of eight principals does not know whether there Is systematic bibliographic
organization of audio-visual materials.
Preparing an annual report (statement_0).--The principals' lack of informa-
tion, as evidenced by their responses tn the previous statement, may be due in part
to the lack of formal communication, sirce 41.36% of the librarians responded that
they do not prepare an annual report on the progress and activities of the library.
Principals once again had what seems to be an inordinate number of Don't Know re-
sponses--41 or 9.81 --along witl. 30.14% who responded that their librarians sub-
mitted no report.
Many librarians are currently failing co utilize the annual report as a means
to communicate to their school an t. the community. Furthermore, same librarians and
principals apparently do not recognize the value of such reports, such 10.49% of the
librarians and 5.98% of the principals replied that even under ideal conditions they
would not have an annual report made.
8 1

-70-
Preparing an,annual bud et re uest statement 54).--The budget request is
another potential communication device which is reported as unused by a substan-
tial percentage--32.72%--of the librarians. Principals may have had a different
understanding of what this function statement meant,.since only 15.64% of them
responded "No" to this item.
Applying instructional design principles to locally produced materials (state-
ment 56).--The ability to utilize instructional design principles is one of the
seven competency areas designated as required for entering level certification in
the newly adopted Texas plan. The responses are therefore of considerable interest,
and frequency distributions are shown in tables 54 and 55 as supplements to the
analysis of variance data shown previously in table 53.
TABLE 54
Frequency distribution for statement number 56: The librarianapplies instructional design principles to the design of
locally produced materials.
Actual Condition
RESPONSE CATEGORY LIBRARIANS , PRINCIPALS
No. No.
Blank 20 6.17 20 4.78
0 Don't Know 67 20.68 132 26.79
1 No 123 37.35 105 24.64
5 Yes 116 35.80 185 43.78
"

-71-
TABLE 55
Frequency distribution for statement number 56: The librarianapplies instructional design principles to the design of
locally produced materials.
Ideal Condition
RESPONSE CATEGORIES LIBRARIANS PRINCIPALS
Blank
0 Don't Know
1 No
5 Yes
No. No.
26 8.02
69 21.30
33 10.19
196 60.49
25 5.98
65 15.55
24 5.74
34 72.73
These tables show a considerable lack of understanding of the statement on the
part of librarians and principals alike. More than 20 percent of the librarians and
over 15 percent of the principals replied that they did not know whether librarians
should apply instructional design principles under ideal conditions. Comparison
of the percentages of "yes" answers on the actual and the ideal tables shows that
a much higher level of performance would be called for in this area under ideal
conditions. There are obvious implications here for those responsible for in-service
and pre-service education of librarians. Furthermore, since principals are responsible
for the campus level program, including the library, it seems reasonable to assume
that some in-service for principals would also be in order
We have seen numerous differences between the perceptions of librarians and
adMinistrators in chapters two and three, and have pointed out occasional instances
where the Don't Know responses seemed noteworthy. The final section of this chapter
is an organized presentation of those statements where the "Don't Knows" exceeded
8 3

72-
ten percent of the total respondent group.
Don't Know Responses
The frequency distributions for the 57 statements show the percentages of
respondents who rep14.ed Don't Know. Table 56 summarizes the Don't Know responses
for the actual condition for those statements where the Don't Know response was
equal to or greater than 10% of the responding principals; table 57 does the same
for librarians. Both tables permit examination of responses from elementary and
secondary school personnel separately. They show elementary librarians and prin-
cipals as less knowledgeable than their secondary counterparts, and, as one might
expect, there are more Don't Knows for principals than librarians. This is cause
for concern if one believes that subordinate and superordinate relationships fare
better in an atmosphere in which the roles and functions of each are known--to
themselves and one another. In this time of transition from the library to the
Learning Resources Center, it is not surprising that there is uncertainty among
both librarians and principals as to the proper roles and functions of the librarian/
Learning Resources Specialist. It would appear from the instances of principals' Don't
Know responses reported for Lht actual condition,however, that librarians need Lo do
more to communicate with their campus level administnators in a formal, systematic
way to keep them abreast of library activities and concerns. In addition, it seems
that pre-service and in-service education for administrators should include more
information on the roles and functions of the librarian.
Administrative support for library activities is at least in part a function
of administrators' knowledge of those activities. Perhaps secondary prin,:ipals show
a greater awareness of the librarians' roles and functions because 67.38% of the
secondary librarians report that they prepare an annual report on their libraries'
84

TABLE 56
Don't Know responses from all secondary principals and fromall elementary principals on significant statements re-
lating to dhe actual condition where the percent-age rate exceeded 10 percent
Elem. Prin.(N = 276)
Statement no. and summary Don't Know
Sec. Prin.(N = 142)Don't Know
3. Planning for the floor designfurnishings. etc., for newfacilities.
10.87
5. Preparing proposals forobtaining outside funds 14.13
Providing for use of materialsthrough Interlibrary Loan, etc. 11.23
55. Applying learning theories tothe evaluation of materials 11.96
Y. Using new production methods 14.86 10.56
56. Using the systems approach 35.51 25.35
57. Gatherii:g statistacal data 22.46 10.56
Applying basic research datato management 25.00 18.31
5. Planning and conducting researchprojects 22.10 14.08
O. Reading professional publica-tions. 15.59
50. Organizing and classifyingaudio-visual materials 14.13 11.(,!7
5. Preparing an annual report 10.51
56. App'ying instructional designprinciples to locally producedmaterials.
27.54 25.35
8 5

TABLE 57
Don't Know responses from all secondary librarians and fromall elementary librarians on significant statements re-
lating to the actual condition where the percent-age rate exceeded 10 percent
Statement no. and summary
Elem. Libn.(N = 178)
Don't Know
:;ec. Libn.
(N = 144)Don't Know
2. Preparing the educationalspecifications for new facilities
5. Planning for the floor designfurnishings, etc., for new facilities
4. Planning facilities for localdesign and production
13.48
14.04
11.80
11.11
5. Preparing proposals fo- obtainingoutside fLads 28.09 13.89
50. Designing information systems 11.80
56. Using the systems approach 17.142 18.06
56. Applying instructional designprinciples to locally producedmaterials
20.79 20.14
8 6

-75-
progress and pctivities, compared with only 46.99% of the elementary librarians.
Regardless of the reasons which might be offered to explain the principals' Don't
Knows, it is clear that corrective measures must be undertaken both by librarians
and library educators to fill the existing information gaps. What support can
librarians expect to receive from principals who Don't Know whether the4;.. ':.hrarian
plans and conducts research projects? Such a situation represents a funda,,,
collapse in communications. Librarians must not ran:. dny assumptions concezr.
information that they might characterize as being self.. ,ient and, theref..,re,
known. They must communicate.
This concludes the discussion cf the 57 statements, Cnapter four conside.:s
the differences between subgroups of librarians.
8 7

CHAPTER IV
LIBRARIANS
Chapters II and III compared responses from all librarians with responses from
principals and from superintendents. This chapter compares the responses of
(1) all elementary librarians with those of all secondary librarians, (2) urban
elementary librarians with those of urban secondary librarians, and (3) librarians
in large school districts with those of librarians in small school districts.1
Here
we will consider only those questionnaire statements in which significant differences
between sub-groups were _found on either the actual or ideal response scales.
All Librarians: Elementary vs. Secondary,
Statements where significant differences were found in the analysis of
variance between responses from 178 elementary librarial,-% and 1.,4 a-condary li-
brarians have been grouped for convenience of discussion into (1) "Traditional"
Librarian Activities, (2) Management Functions, and (3) Local ',Toauction of Mater-
ials Functions. A comparison of the ritan rankings in the.; thr& .! areas is of
interest because it shows a configuration which we have chosen to call a "descending
familiarity/comfort response." Cognizance of the existence cf this familiarity/
comfort response, evidenced so generally by librarians, and of the areas where ele-
mentary and secondary librarians differ in this regard, seems to be basic in planning
in-service training or continuing education activities.
Traditional Librarian Activities
With one exception, librarians' responses seemed to reflect a comfortable,
14
A. proposed comparison of responses from urban librarians with those fromrural librarians could not be made because there were not enough responses fromrural librarians.
-76)-
88

-77-
secure, positive approach to those service and management activities which the
inve4tigators classed as traditional. High rankings were given to in-service
education for the library staff (statement 10); developing and implementing
acquisition procedures for print materials (statement 19); promoting the library's
collection and services (statement 25); teaching students how to use materials
(statement 32); and providing access to audio-visual materials through a card
catalog or other records (statement 52). As shown in table 58, the actual and
ideal means for the foregoing traditional activities have actual means ranging
from a low of 3.44 to a high of 4.56 and ideal means ranging from a low of 4.00
to a high of 5.00,1
Librarians, then, generally rank these responsibilities and
performance areas at a high level both actually and ideally.
Developing listening, viewing, and responding skills (statement 13) was
classed as a traditional activity; but the mean rankings, in contrast to those
just discussed were very low (see table 58). Conversations with superintendents
and library supervisors indicate that statement 13 may not have been interpreted
by the respondents in the way that was intended. The statement did not spell out
that the librarian has responsibility for developing the listening, viewing...
and reading and responding skills of students through the support work done for/with
teachers as well as through direct instruction. A very narrow interpretation of the
statement used could have contributed to the low means for statement 13, or it may
be that this accurately reflects the condition in the field with whatever impli-
cations that may have for educators; supervisors, and the like.
A pattern which continues, as we shall see, throughout this comparison between
elemen'ary and secondary librarians emerges first here in the consideration of the
1Note that statement 13 is discussed separately and is not included in thisanalysis.
8 9

-78-
TABLE 58
Elementary librarians vs. secondar: librarians
Results of analysis of variance on selectedstatements relating to
"traditional" librarian activities
Actual ConditionRole or Function Statements **
Elem. Libns. Sec. Libns. 210. The librarian has responsibility forproviding in-service education for the li-brary staff (including volunteers).
A 3.69697 4.06429 .0356*
13. The librarian has responsibility for de-veloping the listening, viewing, and respond-ing skills of students.
A 2.13295 1.71631 .0005*
19. The librarian has responsibility for de-veloping and implementing procedures foracquisition (by purchase, exchange, or gift)of print materials.
A 3.44767 3.80142 .0270*
25. The librarian promotes the library'scollections and services by such means asdisplays, book talks, and classroom presen-tations.
B 3.91429 3.45833 .0001*
32. 'ae librarian teaches studenlo how to usematerials available in the library. B 4.45402 4.32639 .1286
52. Access to audio-visual materials is pro-vided through a card catalog and/or otherrecords.
D 4.22 4.34752 .1625
* Difference significant at the .05 or greater level.
** RESPONSE CATEGORIES:A: 0-Don't know; 1=Has Little or No Responsibility; 2,,Has Some Responsibility;
3=Has Considerable Responsibility; 4=Has Much Responsibility; 5=Has CompleteResponsibility
B: 0=Don't Know; 1=Never; Not at All; 2=Infrequently; 3=Sametimes; 4=Frequently;5=A1ways; Systematically
C: 0=Don't Know; 1=Makes No Provision; 2=Mhkes Minimal Provision; 3=MAkes PartialProvision; 4=Makes Substantial Provision; 5=Makes Complete Provision
D: 0=Don't Know; 1=No; 5=Yes
frir'' 0

-79--
TABLE 58, continued
Elementary librarians vs. secondary librarians
Results of analysis of variance on selectedstatements relating to
"traditional" librarian activities
Ideal ConditionRole or Function Statement **
Elem. Libns. Sec. Libns.10. The librarian has responsibility forproviding in-service education for the li-brary staff (including volunteers).
A 4.22941 4.52174 .0356*
13. Ehe librarian has responsibility for de-veloping the listening, viewing, and respond-ing skills of students.
A 2.67052 2.52555 .2301
19. The librarian has responsibility for de-veloping and implementing procedures foracquisition (by purchase, exchange, or gift)of print materials.
A 4.00000 4.15108 .0284*
25. The librarian promotes the library'scollections and services by such means asdisplays, book talks, and classroom presen-tations.
B 4.55491 4.39716 .0284*
32. The librarian teaches students how to usematerials available in the library. B 4.83237 4.71631 .0278*
52. Access to audio-visual materials is pro-vided through a card catalog and/or otherrecords.
D 5.00000 4.91304 .0502*
* Difference significant at the .05 or greater level.
** RESPONSE CATEGORIES:A: 0=Don't Know; 1=Has Little or No Responsibility; 2=Has Some Responsibility;
3=Has Considerable Responsibility; 4=Has Much Responsibility; 5=Has CompleteResponsibility
B: 0=Don't Know; 1=Never; Not at All; 2=Infrequently; 3=Sometimes; 4=Frequently;5=A1ways; Systematically
C: 0=Don't Know; l=Makes No Provision; 2=Makes Minimal Provision; 3=Makes PartialProvision; 4=Makes Substantial Provision; 5=Makes Complete Provision
D: 0=Don't Know; 1=No; 5=.Yes
91

traditional activities. Note that on the actual condition for the four statements
which differed significantly, elementary librarians perceive their responsibility
or performance on statement 13, developing listening, viewing, and responding
skills, and statement 25, promoting the libraries collections and services--both
service-related functions--at a significantly higher level than do secondary
librarians.
Conversely, secondary librarians ranked themselves significantly higher on
management-related functions--statement 10, providing in-service education for
library staff, and statement 19, developing and implementing acquisition procedures
for print materials.
They differed again on the ideal conditions for statement 32, teaching students
how to use library materials, and statement 52, providing access to audio-visual
materials, both service-related functions. Elementary librarians assigned signifi-
cantly higher performance level rankings in both cases.
Elementary librarians assigned significantly higher ranks to a management-
related function only on statement 18, making adequate provision for previewing
materials, to be discussed in the next section.
Librarians disagree significantly on both the actual and the ideal rankings
for the function of promoting the library's collection and services, and in both
cases elementary librarians rank this statement at a higher level than do secon-
dary librarians. Of the elementary librarians, 70.28% placed their actual perfor-
mance at the Frequently-to-Always level; whereas only 47.92% of the secondary
librarians say they perform at this level. At the ideal, their respective percent-
ages at the 5 (Always, Systematically) level were 95.37% and 91.49%.1
Promotion of the library's collection and services is a direct form ot
outreach to all users of the library. Both elementary and secondary librarians
1See note, page 29.
. 0 ')

-81-
should be able to involve student assistants in the planning and development of
displays and other promotional activities, thereby giving students creative out-
lets and educational experiences, as well as promoting the library on a systematic
basis. It would appear, in short, that librarians, through planning and use of
availale resources, could approach their ideal on this statement.
The actual performance reported by secondary librarians suggests that they do
not place a very high priority on promotion (perhaps displays are seen as "kid
stuff"?), but their ideal would tend to belie this view. The commitment to an out-
reach philosophy is reflected generally in librarianship and should be a fundamental
component of (and a stated underlying assumption in) both pre-service and in-service
education for librarianship.
On statement 32, librathns agree that their actual performance in teaching
students to use -aVailable materials is at the Frequently-to-Always level, but their
perceptions of the ideal condition differ significantly. Of elementary librarians,
84.97% place the ideal at the Always/Systematically level, compared with 73.76% of
the secondary librarians. Perhaps secondary librarians see their students as being
more capable of independent performance in the use of library materials without
instruction. Nevertheless, the ideal means are at a high level (4.83-4.71) for
both groups, and such teaching is evidently seen as a high priority activity, partic-
ularly where librarians are striving to reach their ideal levels.
One would think that, regardless of the actual condition reported for statement
52, providing accens to audio-visual materials, all librarians would be in agreement
as to what the ideal condiPion should be. We BO, however, that there is statis-
tl,ally significant disagreement on the ideal. Every one of the elementary
librarians sees the ideal at les, compared with 97.83% of the secondary librarians.
The frequency distributions for both the actual and ideal levels show that several
9 3

-82-
respondents reported that they Don't Know. Leaving aside speculations as to what
situations might prevail which would leave a librarian in a state of ignorance
about whether he/she provides access, we are still left with a few secondary li-
brarians who think that ideally there should be no access to audio-visual materials
"through a card catalog and/or other records." We are unable to explain such re-
sponses. At any rate, the distribution for the actual condition shows that 42
respondents report they do not currently provide such access and suggests that
in-service education is needed for bibliographic control of audio-visual materials.
Man6sement Functions
Many librarians assume the role of manager wich less assurance than they
assume the traditional roles and functions discussed in the previous section.
As we shall see, this discomfort is evidenced in low rankings for important
functions. A statistical summary for the management function statements to be
discussed in this section is given in table 59.
Of the significant management functions, secondary librarians ranked their
responsibility levels and performance levels significantly higher than did ele-
mentary librarians in four of the five statements. Secondary librarians report
a significantly greater level of responsilAlity for coordinating deliveries and
returns of materials from the regional service center (statement 7) than do ele-
mentary librarians; but neither group ranks it particularly high, either actually
or ideally. Of the elementary librarians, 48.10% indicate that they actually have
Little or No Responsibility, as do 41.48% of the secondary librarians. One of the
interviewed superintendents suggested that the low rankings for this activity
might be a
materials
materials,
result of faulty wording of the statement. Since schools order other
from the regional service centers in addition to classroom related
the superintendent thought that a specification of the "materials"
94

-83-
TABLE 59
Elementary librarians vs. secondary librarians
Resulte.of analysis of variance on selectedstatements relating tomanagement functions
Actual Condition
Role or function statements if X-
7. The librarian has responsibility for co-Elem. Libns. Sec. Libns-
ordinating deliveries and returns oi materialsfrom the regional service center.
A 2.32911 2. 841+1+4. .0092*.
18. The librarian has responsibility farmaking adequate provision for previewingmaterials being considered for the collection.
A 3.06395 2.60563 .0056k
37. The librarian gathers statistical datafor use in managing the library. 2.81928 3.41727 .0002*
38. The librarian applies basic researchdata reported in the literature to the man-agement of the library.
B 2.93976 3.20741 .0521*
53. The librarian prepares an annual reporton the progress and actf,,ities of the library. D 2.87952 3.69504 .0003*
* Difference significant at the .05 or greater level.
** RESPONSE CATEGORIES:A: 0=Don't Know; 1=Has Little or No Responsibility; 2=Has Some Responsibility;
3=Has Considerable Responsibility; 4=Hels Much Responsibility; 5=Has CompleteResponsibility
B: 0=Don't Know; 1=Never; Not at All; 2=Infrequently; 3=Sometimes; 4=77requently5=Always; Systematically
C: 0=Don't Know; 1=Makes No Provision; 2=Makes Minimal Provision; 3=Makes PartialProvision; 4=Makes Substantial Provision; 5=Makes Complete Provision
D: 0=Don't Know; 1=No; 5=.Yes

-84-
TABLE 59, continued
Elementary librarians vs. secondary librarians
Results of analysis of variance on selectedstatements relating tomanagement functions
Role or function.statements
Ideal Condition
7. The librarian has responsibility for co-ordinating deliveries and returns of materialsfrom the regional service center.
18. The librarian has responsibility formakills adequate provision for previewingmaterials being considered for the collection.
37. The librarian gathers statistical datafor use in managing the library.
38. The librarian applies basic research datareported in the literature to the managementof the library.
53. The librarian prepares an annual reporton the progress and activities of the library.
Elem. Libns. Sec. Libns.
A 2.95570 3.28676 .0647
A 3.78035 3.73571 .6920
B 3.76687 4.17910
3.82036 4.02290 .0648
D 4.40120 4.73913
* Statistic not used. See note, p. 12.
** RESPONSE CATEGORIES:A: 0=Don't Know; 1=Has Little or No Responsibility; 2=Has Some Responsibility;
3=Has Considerable Responsibility; 4=Has Much Responsibility; 5=Has CompleteResponsibility
B: 0=Don?t Know; 1=Never; Not at All; 2=Infrequently; 3=Sometimes; 4=Frequently5=Always; Systematically
C: C=Don't Know; 1=Makes No Provision; 2=Makes Minimal Provision; 3=Makes PartialProvision;.4=Makes Substantial Provision; 5=Makes Complete Provision
D: 0=Don't Know; 1=No; 5=Yes
96

-85-
in statement 7 would have elicited a more accurate response. Another explana--
tion for the low rankings is the rather common practice of assigning one librarian
to several campuses, and, as a result, making them unlikely candidates for building
coordinators. Even so, it is difficult not to question such a high percentage in
the Little or No Responsibility rank since the responsibilities of the Building
Media Coordinator, as outlined in the Catalog of the Materials Resources Center,
Education Service. Center, Region XI, would appear to be "naturals" for the campus-
level librarian:
1. Each Building Media Coordinator needs to have a thorough knowledge ofthe Media Services offered by the Education Service Center, Region XI, andshould keep the faculty and administration of his/her building informed ofthese services.
2. The Building Media Coordinator must know the procedures for obtaining"Loan Materials" and other services from the media component of the EducationService Center. It is his duty to keep the professional staff of his schoolinformed of the services available and help them to secure these services.
3. The Building Media Coordinator should accept some responsibility in pro-viding opportunities for the professional growth of the teachers in hisschool. This may be accomplished by arranging for in-service educationworkshops in Media. These workshops will be provided, upon request, by theEducation Service Center and all supplies are furnished by the Media Division.
Secondary librarians report their actual performance at significantly higher
levels on management statement 37, gathering statistical data for use in managing
the library; statement 38, applying research reported in the literature to manage-
ment of the library, and statement 53, preparing an annual report on progress and
activities of the library.
Elementary librarians ranked themselves significantly higher on only one of
these five management-related statements: providing for previewing materials being
considered for the collection (statement 18). A t al of 50% of the elementary
librarians placed their actual responsibility at the Much and Complete lave18,
compared with only 33.10% of the secondary librarians who assigned those levels.
9 '7

Perhaps teaching faculty in the secondary schools assume a larger share of this
responsibility than they do in the elementary school.
Except for statement 18 where responses from elementary librarians produced
higher actual and ideal means, secondary librarians gave each of.the management
functions higher rankings. Secondary librarians seem to place higher priority
on management functions--traditional or otherwise. Secondary librarians' actual
means are higher for statements 7, 10, 19, 37, 38, and 53--all management-related4
statements. Conversely, elementary librarians give higher means (and therefore
higher priority?) to direct service-related statements: numbers 11, 13, 25, 32,
35, 52, and 56.
Do secondary libraries require more management than elementary libraries?
Do secondary library patrons demand less service than elementary library patrons?
Do elementary librarians as a group prefer the service aspects of their positions
and do secondary librarians prefer the management aspects? Do elementary librarians
perceive themselves more as teachers and do secondary librarians view themselves more
as administrators? Is there, in fact, a fundamental difference between being the
librarian in an elementary school and being the librarian in a seeonlary school?
These questions have not been resolved by the current research but seem to be
likely areas for further study.
Regardless of which group has the higher mean score on a given management-
related statement, the scores, as a group, are relatively lower than those reported
earlier for the traditional activities. Pre-service and in-service education should
include information in support of statement 37, data gathering, so that librarians
will know what data are to be gathered, how to gather data, and how the data can
be used to provide information for management decisions and/or to provide justifi-
cation for requests to school administrators.
9 8

-87-
Perhaps more important is the preparation of an annual report on the library's
progress and activities (statement 53). Even though 67.38% of the secondary librar-
ians (but only 46.99% of the elementary librarians) said they prepared such a report,
principals evidenced a sometimes dismeying lack of knowledge concerning their
libraries and their librarians' roles and functions (see page 72). An annual report
either to an administrator or to a library supervisor can be a valuable tool for
establishing priorities, for focusing short and long-range plans, for evaluating
services and programs, for monitoring the operation and giving the librarian an over-,-
view of the program, and for communicating formally the library's activities to
school administrators and the community. The merits of preparing such a report,
along with preparation guidelines, should be presented in pre-service and in-service
education.
Local Production of Materials Functions
Local production of materials is a responsibility/performance activity
which accrues "Ear-librarians when they become Learning Resources Specialists and
their libraries become Learning Resources Centers. Since this change in concept,
practice, and indeed, in Certification Requirements, is still in progress, it is
not surprising that there is a tendency toward low rankings for both actual and
ideal conditions in this area. Table 60 provides a statistical summary for these
statements. As in other areas of the study, the gap between the actual means and
the ideal means shown in table 60 has clear implications for pre-service and in-
service education.
Local production functions statements represent the lowest category of the
descending familiarity/comfort response. Statement 11, producing materials, is the
basic component of this group, since statements 35, using new production methods, and
9 9

-88-
TABLE 60
Elementary librarians vs. secondary librarians
Results of analysis of variance on selectedstatements relating to
local production
Actual Condition
Role or Function Statement
11. The librarian has responsibility forcampus level production of materials that aid A
0 teachers in the classroom.
35. The librarian incorporates new produc-tion methods into the production of media.
56. The librarian applies instructionaldesign principles to the design of locallyproduced materials.
Elem. Libns.
2.08140
3.00625
3.29008
Ideal Condition
Role or Function Statement
11. The librarian has responsibility forcampus level production of materials that aid A.
teachers in the classroom.
35. The librarian incorporates new produc-tion methods into the production of media.
56. The librarian applies instructionaldesign principles to the design of locallyproduced materials.
Elem. Libns.
Sec. Libns. 2
1.81295 .o464*
2.46269 .0003*
2.52381 .0033*
Sec. Libns. 2
2.87356 2.6E613 .1636
3.95758
4.48c92
* Difference significant at the .05 or greater level.
3.78626 .1760
4.33333 .4382
RESPONSE CATEGORIES:A: 0=Don't Know; 1=Has Little or No Responsibility; 2=Has Some Responsibility;
3=Has Considerable Responsibility; 4=Has 1.141ch Responsibility; 5=Has CompleteResponsibility
B: 0=Don't Know; 1=Never; Not at All; 2=Infrequently; 3=Sometimes; 4-Frequently;5=Always; Systematically
D: 0=Don't Know; 1=No; 5=Yes
100

-89-
56, applying instructional design principles to locally produced materials, presup-
pose statement 11. Statement 11 has the lowest actual and ideal means of all the
significant statements (except of course the troublesome statement 13). That state-
ment 11 is ranked so low actually is not surprising, since it is a new area of librar-
ian responsibility. That it is ranked ao low ideally is perhaps a reflection of.
librarians' lack of training and familiarity in this area and of a hesitancy to
assume yet another role.
Elementary librarians ranked their actual responsibility and performance levels
significantly higher on each of the local production statements (all service-related
functions) than did secondary librarians. As has been noted, however, the means as
a group are quite low compared with the means for statements in the area of traditional
activities. A review of the frequency distribution for the actual condition w.11 help
-account for these low means. For the basic statement 11, producing materials, 41.86%
of the elementary librarians and 55.40% of the secondary librarians reported their
current responsibility at the 1 (Little or No) level. The frequency of using,new
production methods, statement 35, was ranked at either Never (1) or Infrequently (2)
by 30% of the elementary librarians and 55.22% of the secondary librarians. As
for applying instructional design principles to locally produced materials, state-
ment 56, 42.75% of the elementary librarians and 69.90% of the secondary librarians
replied No.1
Since incorporating new production methods and applying instructional
design principles would seem to be contingent primarilY on whether the incorpoiator
is knowledgeable about, and skilled in, those new methods and principles, in-service
education would be appropriate here to help librarians reach their ideals and to
achieve the competencies specified in the certification requirements.
Responses to the actual condition in statement 56 provide considerilble vidence
of librarians' lack of information in this area of their profession: 20.79% of the
1See note, page 29.
101

elementary.librarians and 20.14% of the secondary librarians replied Don't Know.
Urban Librarians: Elementary vs. Secondary
The population of all librarians discussed in the previous section consists
primarily of librarians from counties which are designated as urban. Therefore,
the comparison between urban elementary and secondary librarians yWded substan-
tially the same significant statements as did the comparison between all elementary
and secondary librarians. Two statements which did not differ significantly in the
previous comparison will be discussed in this section, aril data summaries are pre-
sented in table 61.
Urban secondary librarians perceive themselves as having significantly more
actual responsibility for both statement 2, preparing educational specifications
for new facilities, and statement 3, planning for the floor design, furnishings,
etc., than do urban elementary librarians; but both groups place their level of
responsibility at a low rank. One of the superintendents who was interviewed
suggested that most respondents would, of necessity, have answered these statements
from a hypothetical rather than an experiential perspective. Perhaps these means
give us a picture, then, of how librarians think their administrators would
involve them in the process; that is, if the situation described in statement 2 or
3 presented itself, librarians believe they would be allowed to give only Some-
plus input. Such an interpretation would suggest that many librarians do not
see themselves as having much actual influence with their administrators or much
actual control over their working environment.
As was discussed in chapter II, both superintendents and principals rankea
librarians' actual responsibility for planning at a higher level than the librarians
did. It would seem, then, that librarians could assume more responsibility than
they currently think.
102

-91-
TABLE 61
Urban elementary librarian vs. urban secondary librarian
Results of analysis of variance on selected statements
Actual Condition
Role or function statement ***
Elem. Libns.2. When new or remodeled library facilitiesare needed, the librarian has responsibility - .k- 2.03974for preparing the educational specificationsfor them.
Sec. Libns.
2.33613 .0444*
3. When new or remodeled library facilitiesare planned, the librarian has responsibility A 1.94667 2.23276 .0505*for planning for the floor design, furnishings,etc.
Role or function statement
Ideal Condition
***
2. When new or remodeled library facilitiesare needed, the librarian has responsibilityfor preparing the educational specificationsfor them.
3. When new or remodeled library facilitiesare planned, the librarian has responsibilityfor planning for the floor design, furnishings,etc.
Elem. Libns. Sec. Libns. E
A 3.72571 3.85039 .1352
A 3.68571 3.88281 -)HE
* Difference significant at the .05 or greater level.
** Statistic not used. See note, p. 12.
*** Response category A: 0=Don't Know; 1=Has Little or No Responsibility; 2=HasSome Responsibility; 3=Has Considerable Responsibility; 4=Has Much Responsibility;5=Has Complete Responsibility
103

-92-
In concluding this section, we note that statements 2 and 3 are both manage-
ment-related responsibilities to which secondary librarians assigned significantly
higher actual means in keeping with the pattern observed earlier.
All Librarians: Large Districts vs. Small Districts
For purposes of this study,.large districts are defined as those having ten
or more campuses and small districts as those saving nine or fewer campuses. The
study includes 8 large distlicts with school library supervisors, and 232 of the
251 returns from librarians in large districts came from those eight districts.
The large districts are primarily urban and suburban. As was noted previously,
there are elementary librarians in some large districts who serve several campuses.
The small districts are suburban as well as rural, and no responding small district
has a school library supervisor. In several small districts, however, one librarian
serves all the district's schools with the assistance of aides or volunteers.
The responding campus librarian from a large district is therefore likely to have
administrattve/management back-up from the library supervisor for that district;
and the library supervisor shares to some extent the responsibility for, and the
performance of, such management functions as stEtement 16, formulating and recommend-
ing for adoption selection policies for print materials. Conversely, a responding
campus librarian from a small district may well be the librarian fOr that district;
and management functions may be a crucial and time-demanding part of his/her role,
leaving more service-related functions to the aides and/or volunteers who staff the
various campus libraries and handle day-to-day operations. Against this background,
then, we will consider the statements which showed significant differences in the
percepe.ons of these two groups of librarians.
Table 62 presents the data summary for those statements which were significant
11'
104

TABLE 62
' Librarians: large districts vs. small districts
Results of analysis of varianceResponsibility area***
Actual Condition
Role or function statementsLarge Small
8. The librarian has responsibility for pro-viding for use of materials from outside the 2.59641 2.18841 .0509*school by activities such as InterlibraryLoan and maintaining a community resourcesfile.
9. The librarian has responsibility for de-signing and conducting in-service training 1.72428 1.58028 .0106*programs for teachers.
10. The librarian has responsibility for pro-viding in-service education for the library 3.85P32 3.91429 .7651staff (including volunteers).
16. The librarian has responsibility forformulating and recommending for adoption 3.84400 4.23288 .0160*policies for the evaluation and selection oflibrary books, periodicals, and other printmaterials for the collection-;
19. The librarian has responsibility for de-veloping and implementing procedures for 3.43621 4.19444 * *
acquisition (by purchase, exchange, or gift)of print materials.
* Difference significant at the .05 or greater level.
** Statistic not used. See note, p. 12.
*** Response category A: 0=Don't Know; 1=Has Little or No Re'sponsibility; 2=HasSome Responsibility; 3=Has Considerable Responsibility; 4=Has Much Responsibility;5=Has Complete Responsibility
105
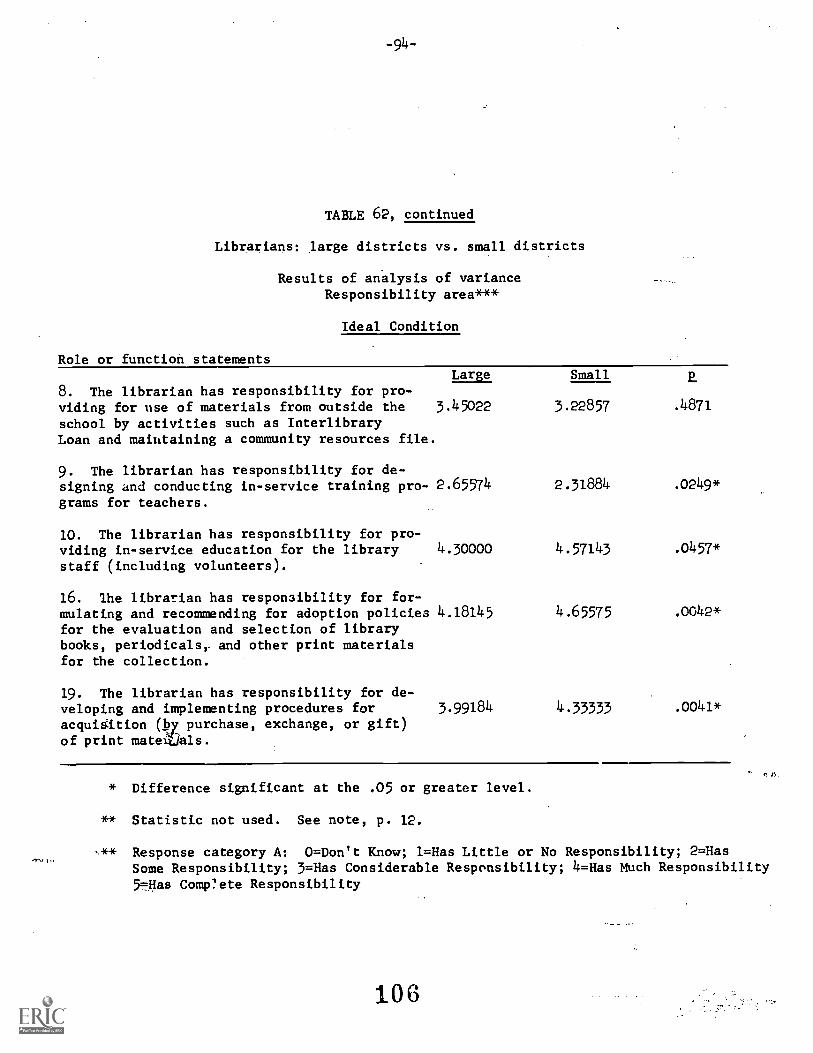
-94-
TABLE 62, continued
Librarians: large districts vs. small districts
Results of analysis of varianceResponsibility area***
Ideal Condition
Role or function statementsLarge
8. The librarian has responsibility for pro-viding for use of materials from outside the 3.45022school by activities such as InterlibraryLoan and maintaining a community resources file.
9. The librarian has responsibility for de-signing and conducting in-service training pro- 2.65574grams for teachers.
10. The librarian has responsibility for pro-viding in-service education for the library 4.30000
staff (including volunteers).
16. lhe librarian has responsibility for for-mulating and recommending for adoption policies 4.18145for the evaluation and selection of librarybooks, periodicals, and other print materialsfor the collection.
19. The librarian has responsibility for de-veloping and implementing procedures for 3.99184acquidition (by purchase, exchange, or gift)of print mateajals.
Small P_
.48713.22857
2.31884 .0249*
4.57143 .0457*
4.65575 .0042*
4.33333 .0041*
* Difference significant at the .05 or greater level.
** Statistic not used. See note, p. 12.
** Response category A: 0=Don't Know; 1=Has Little or No Responsibility; 2=HasSome Responsibility; 3=Has Considerable Responsibility; 4=Has Much Responsibility5=Has Comp?ete Responsibility

-95-
in the Responsibility Area. Response categories are scaled as follows: 0=Don't
Know; 1=Little or No Responsibility; 2=Some Responsibility; 3=Considerable Respon-
sibility; 4=Much Responsibility; 5=Complete Responsibility.
Of the five statements, three were significant on the actual condition. Large
district librarians reported their responsibility at a significantly higher level
for the two service-related functions: statemnt 8, providing for Interlibrary
Loan, and statement 9, designing and conducting in-service training programs for
teachers. Small district librarians reported a significantly higher responsfbility
level for the management-related statement 16, formulating and recommending for
adoption selection policies for print materials.
The same pattern emerges for the ideal condition, where four of the statements
showed significant differences. Again, the large district librarians are signifi-
cantly higher in their perceptions of the ideal responsibility level for statement 9,
a service-relatefl responsibility. On the other hand, librarians in small districts
ranked the ideal responsibility levels higher for management-related functions as
represented by statement 10, providing in-service education for library staff;
statement 16;- and statement 19, developing and implementing procedures for
acquisition of print materials. These means tr.nd to suggest that the librarian
in the small district is forced by the re,A1ie., of th,esitnation to place a higher
priority on management-related activities than on service-related functions.
The comparatively low actual and ideal means for statement 8, providing for
Interlibrary Loan, and statement 9, designing and conducting in-service training
programs for teachers, indicate a need for pre-service and in-service training for
librarians. One would think that the responsibility for providing Interlibrary
Loan service would belong completely to the librarian; and the librarian would be
the logical person to provide centralized coordination of access to community re-
107

-96-
sources, even though counselors and teachers may also maintain files pertinent to
their activities. The very low means for statement 9 (Little or No-plus for the
actual level of responsibility) suggest that librarians do not perceive themselves
as coequal with the rest of faculty. At any rate, there are implicatioas here for
pre-service and in-service training, since workshops with teachers can provide
good opportunities for building faculty-library relationships and for promoting
the library's services and collection.
Performance Areas I, II, and III
Significant differences were found in eleven Performance Area statements, and
table 63presents the data summary.
Librarians from large and small districts disagreed significantly on the actual
condition for every one of these eleven statements. The only statement which
received a higher mean from small district librarians is statement 41, providing
for evaluation of the libraries policies and procedures--a management function. All
of the other statements are service-related and received higher means from
librarians in large districts, except for.the management-related statement 54,
prepating an annual budget request. Here the pattern was broken, since large dis-
trict librarians ranked it higher than small district librarians did. We may
speculate that more librarians from large districts prepare annual budget requests
because their library supervisors force them to do so or that superintendents
handle fiscal.matters themselves in small (Lstricts. Be that as it may, it is
very useful in a pre-service education program to be able to tell a prospective
learning resources specialist about the variations in role and function expecta-
tions which he/she might expect in a small district as contrasted with a large
district.

-97-
TABLE 63
Librarians: large districts vs. small districts
Results of analysis of variancePerformance areas I, II, & III
Actual Condition
Role or function statements
24. The librarian disseminates informationto students and teachers on the availabilityof materials, equipment, and,resources inthe library.
25. The librarian promotes the library's col-lections and services by such means as dis-plays, book talks, and classroom presentations.
26. The librarian disseminates information tostudents and teachers on effective use ofmaterials and equipment.
27. The librarian provides information toteachers on new teaching developments andpractices.
30. The librarian designs information systemsto meet the needs of students and teachers.
31. The librarian helps students chooseappropriate materials to meet learning needs.
41. The librarian makes provision forevaluation of the library's policies andprocedures.
46. The librarian makes provision for muLti-cultural and multi...ethnic materials.
51. Access to print materials is providedthrough a card catalog and/or other records.
54. The librarian prepares an annual bud-get request.
56. The librarian applies instructionaldesign principles to the design of locallyproduced materials.
** Large Small P.
B 4.27935 4.04110 .0129*
B 3.77823 3.45205 .0151*
B 3.72470 3.19178 .0001*
4
B 2.63786 2.26389 .0170*
B 3.11628 2.6718P .0224*
B 4.38886 4.19178 .0173),t
C 3.23109 3.53521 .0463*
C 3.91020 3.51389 .0018*
D 4.98387 4.50000 .0077*
D 3.79835 3.16667 .01271
D 3.14208 2.33333 .0089N
* Difference significant at the .05 or greater level.41* RESPONSE CATEGORIES:
B: OmIDon't Know; lowNever, Not at All; 2-Infrequently; 3-Sometimes; 4-Frequently;5-Always; Systematically
C: OmIDon't Know; limMakes No Provision; 215Makes Minimal Provision; 3mMakes PartialProvision; 4-Makes Substantial Provision; 5mMakes Complete Provision
D: 0-Don't Know; ligNo; 5.0ies
1.09

-98-
TABLE 63, continued
Librarians: large districts vs. small districts
Results of analysis of variancePerformance areas I, II, & III
Ideal Condition
Role or function statements
24. The librarian disseminates information tostudents and teachers on the availability ofmateriale, equipment and resources in thelibrary.
25. The librarian promotes the library'scollections and services by such means asdisplays, book talks, and classroom presen-tations.
26. The librarian disseminates informationto students and teachers on effective useof materials and equipment.
27. The librarian provides information toteachers on new teaching developments andpractices.
30. The librarian designs information systemsto meet the needs of students and teachers.
31. The librarian helps students chooseappropriate materials to meet learning needs.
*** LIM Small 2.
41. The librarian makes provision forevaluation of the library's policies andprocedures. .
46. The librarian makes provision for multi-cultural and multi-ethnic materials.
51. Access to print materials is providedthrough a card catalog and/or other records.
54. The librarian prepares an annualbudget request.
56. The librarian appliem instructional designprinciples to the design of locally producedmaterials.
B 4.76327 4.72603
B 4.48148 4.49315
B 4.43673 4.15068
B 3.49138 3.14493
B 4.11574 3.96774
B 4.64898 4.58904
c 4.21008 4.44928
C 4.33058 4.22222
D 5.00000 4.88571
D 4.76667 4.76119
D 4.5212 4.07692
.5556
.8907
426*
.0274*
.2572 .
.3767
**
.2575
.04377*
.9665
**
* Difference significant at the .05 or greater level.** Statistic not used. See note, page 12.
"11 RESPONSE CATEGORIES:8: 00Don't Know; loNever, Not at All; 2-Infrequently; 3-Sometimes; 4.Frequently;
5-Always; SystematicallyC: 0-Don't Know; 1.Makas no Provision; 2.Makes Minimal Provision; 3Makes Partia
Provision; 4-Makes Substantial Provision; 5.Makes Complete ProvisionD: 0.10on't Know; luNo; 5-Yes
11D

The frequency of Don't Know responses (21.12% of the large district librarians
and 19.18% of the small district librarians) for the actual condition on statement
56, applying instructional design principles to the design of locally produced
materials, suggests a need for in-service and pre-service training in this area.
A comment from an urban librarian written in the margin of the ideal scale of
this statement may be representative of the way some librarians are feeling about
the new responsibilities proposed for them. He/she wrote, after checking the "Don't
Know" column, "[I] Don't care to know."
In summary, then, it appears that the presence or absence of library supervisors
and the number of libraries assigned to a given librarian influence the situation of
the campus librarian in regard to service vs. management functions. While campus-
level librarians in large districts may have in-put into policy formulation and
procedure development, they apparently do not have primary responsibility in these
areas and therefore devote more time to day-to-day operations. The small district
librarian, on the other hand, may spend large blocks of time in in-service training
for the aides and volunteers on whom she/he depends so heavily and in designing
policies and procedures to serve as guidelines for the day-to-day activity of
aides. These observations do not, however, provide any insight into reasons
that would explain why librarians in small districts have lower ideal rankings on
library service statements than do librarians in large districts. Perhaps it is
a matter of lawered sights, given the realities (money, staffing, size of collection)
of their situation.
lii

CHAPTER V
PRINCIPALS
This chapter examines those statements in which ANOVA showed a significant
difference in the responses from all elementary principals and those from all
secondary principals, the responses from all urban elementary principals and those
from all urban secondary principals, the responses from all principals in large
school districts and those from all principals in small school districts, and the
responses from all urban principals and those from all rural principals.
For the sake of the discussion, each of the,following sections will be divided
into two groups: statements from the Responsibility Area of the survey instrument
and statements from the Performance Areas.
All Princi als: Elementary vs. Secondary
Responsibility Area
The comparison between the 276 elementary principals and the 142 secondary
principals yielded twelve statements from the Responsibility Area of the survey
instrument in which a significant difference between the two groups was found.
Response categories in the Responsibility Area were scaled as follows: 0 (zero).=
Don't Know; 1 = Has Little or No Responsibility; 2 = Has Some Responsibility; 3 =
Has Considerable Responsibility; 4 = Has Much Responsibility; 5 . Has Complete Re-
sponsibility. Table 64 presents a data summary for these twelve statements and
serves as background for the following discussion.
Perhaps the most striking relationship disclosed by the comparison between
elementary and secondary principals (both here and in the Performance Areas to be
discussed below) is the fact that on each and every significant statement secondary
-100-
112

-101-
TABLE 64
Elementary principals vs. secondary principals
Results of analysis of variance on selectedstatements in the responsibility area**
Actual Condition -
Role or function statements Means
Sec. prin. 2Elem. prin.
I. Formulating long range plans 2.99254 3.20567 .0554
2. Preparing the educational. speci-fications for new facilities 2.26295 2.65942 .0018*
3. Planning for the floor design;furnishings, etc., for new facilities 2.09544 2.58394 .0002*
5. Preparing proposals for obtainingoutside funds 1.95633 2.32000 .0117*
6. Coordinating deliveries andreturns of materials from the school 3.34463 3.54167 .3009district's center
7. Coordinating deliveries and returnsof materials from the regional servicecenr,Ir
8. Providing for use of materialsthrough Interlibrary Loan, etc.
10. Providing in-service educationfor staff
16. Formulating policies for select-ing print materials
18. Providing for previewing materials
19. Developing acquisition proceduresfar print materials
20. Developing acquisition proceduresfor audio-visual materials
2.45714 2.94308 .0087*
2.19492 2.77778 .0002*
3.42857 3.93431 .0006*
3.35556 3.80986 .0002*
2.81919 3.07746 .0512*
2.69650 3.32609 .0000*
2.56322 2.81560 .0619
* Difference significant at the .05 or greater level.** Response category A: 0=Don't Know; 1=Little or No Responsibility;
2=Has Some Responsibility; 3=Has Considerable Responsibility; 4=HasMuch Responsibility; 5=Has Complete Responsibility
113

-102-
TABLE 64, continued
Elementary principals vs. secondary principals
Results of analysis of variance on selectedstatements in the responsibility area***
Ideal Condition
Role or function statements Means
Sec. Prin.Elem. prin.
1. Formulating long range plans 3.60517 3.78571
.2
.0296*
2. Preparing the educational speci-fications for new facilities 3.38577 3.56738 .0389*
3, Planning for the floor design;furnishings, etc., for new facilities 3.28839 3.56738 .0021*
5. Preparing proposals for o,Itainingoutside funds 2.95686 3.16418 .0947
6. Coordinating deliveries andreturns of materials from the schooldistrict's center
3.70225 4.04167 .0273*
7. Coordinating deliveries and returnsof materials from the regional servicecenter
3.14567 3.60606 .0034*
8. Providing for use of materialsthrough Interlibrary Loan, etc. 3.26275 3.73485 .0002*
10. Providing in-service educationfor staff 3.99625 4.38686 .0002*
16. Formulating polie.es for select-ing print materials 3.90370 4.09155 .0248*
18. Providing for previewing materials 3.53309 3.72535 .0538*
19. Developing acquisition proceduresfor print materials 3.31298 3.78986 *If
20. Developing acquisition procedures
for audio-vlsual materials 3.17603 3.43662
* Difference significant at the .05 or greater level.
** Statistic not'used. See note, page 12.
*** Response category A: 0Don't Know; laLittle or No Responsibility;2...Has Some Responsibility; 3Nas Considerable Responsibility; 4s.lias
Much Responsibility; 5Nas Complete Responsibility
114

-103-
principals showed the higher mean. They also, as a group, presented themselves
as being more knowledgeable about librarian's roles and functions (see discussion
of the Don't Know response on p.72). We are unable to explain why secondary prin-
cipals reported higher levels of responsibility both actually and ideally for each
of these statements.1 Do secondary principals have more experience with librarians
than do elementary principals? Do secondary principals regard the librarian as
being more central to the school's functions and therefore being more important and
more responsible? Is it that external pressures such as accreditation requirements
have forced the secondary principal into a closer relationship with the library?
Statements 1, 2, 3, and 5 deal with planning and funding responsibilities. The
highest actual means given in this group of statements were for statement 1, formu-
lating long range plans for the library. Here we find that principals agreed that
librarians have Considerable responsibility (about 3.0 on a 5.0 scale). However, as
possible aspects of the responsibility for long range planning are made more specific
in statements 2, 3, and 5, the responsibility level drops with each statement, with
the lowest means given for preparing proposals for outside funding sources, statement
5. Although the principals disagreed significantly in their perceptions of the actual
responsibility level for funding proposals, elementary principals placed it just
below--and secondary, just above--the Some (2.0) responsibility level. It would
appear that the Considerable responsibility attributed to librarians in formulating
long range plans for the library was meant to apply only to the routines of school
librarianship.
Secondary principals' perceptions of the ideal conditions for the,planning
statements placed the responsibility solidly into the Cansiderable-plus level, with
lAs we reported in 'chapter IV, the differences between elementary and secon-dary librarians did not fall into such a uniform pattern.
115

elementary principals reporting lower levels which, nevertheless, exceeded
Considerable. Principals did not differ significantly on the ideal for the fund-
ing statement, ranking it near the Considerable (3.0) level.
Statements 6, 7, and 8 concern liaison and networking responsibilities with
agencies outside the local campus--the school district's center, the regional service
center, and other libraries. Of the three responsibilities, the one which seems to
be the most closely associated with the roles of the librarian--that of interlibrary
loan--received the lowest actual rankings. Highest responsibility rankings both
actually and ideally were given to statement 6, coordinating with the school district's
center. Although the principals agreed that the actual responsibility for statement
6 was Considerable-plus, they disagreed on the Ideal; and they showed substantial
disagreement on both the actual and ideal conditions for statements 7 and 8.
Of all the responsibility siatements reported here, statement 10, providing
in-service education for library staff, received the highest rankings both actually
and ideally from each group of principals. There was also a highly signifirant
difference in their respective perceptions. The frecjiency distribution (not re-
produced here) shows that 47.45% of the secondary principals reported that their
librarians have actual Complete responsibility in this area, compared with 29.73%
of the elementary principals who assigned that level. For their ideal perceptions,
60.58% of the secondary principals but only 37.08% of the elementary principals,placed
responsibility at the Complete level. Who is responsible for training library staff
in the remaining schools? Or, are there no staff*members or volunteers to be trained?
Since many of the elementary schools represented in this survey have either irregular
or infrequent services from a librarian responsible for several campuses, some of the
problem may come as a result of this limited staffing. Perhaps the burden of re-
cruiting and developing the volunteer staff--student or adult--is often carried by
116

the building principal in such schools.
Statements 16, 18, 19, and 20 concern previewing and acquiring materials for
the library. Statement 16, formulating policies for selecting print materials,
received Considerable-plus actual rankings from both groups, although secondary
principals ranked it substantially higher. The rankings for statements 19 and 20,
parallel statements on developing acquisition procedures for print materials and
AV materials, respectively, suggest that secondary principals continue to see
AV materials as items which are not wholly integrated into the traditional group
of materials falling under the librarian's jurisdiction. Statement 19, print mater-
ials, received an actual ranking of 3.33 from secondary principals, compared with
statement 20, AV materials, which received an actual ranking of 2.82--a half step
lower. Although elementary principals did not make such a distinction between the
twogiving statement 19 a 2.70 ranking and statement 20 a 2.56 ranking, they
perceived both responsibilities at a lower level than secondary principals did and
statenent 19 at a much lower level.
A comparison of actual responsibility levels perceived by principals for their
respective librarians results in the following picture, based on these significant
statements. Neither group of librarians is perceived as having Much (4.0) actual
responsibility in any of these areas; secondary librarians come closer with the
rankings for statements 10 and 16. Secondary librarians are seen as having Consider-
tile-plus (3.0+) responsibility on six of the twelve statements; elementary librarians
are ranked above the 3.0 level on only three of the twelve statements.
The ideal rankings are similarly divided. Here secondary librarians are ranked
at the 3.5 level or above for ten of the twelve statements, with Much responsibility
(4.0) on three of those ten statements (6, 10, 16). On the other hand, elementary
librarians--even at the ideal--are not ranked at tne Much responsibility level on
117

-106-
any statement. On only 5 statements would their ideal responsibility level
equal or exceed the 3.5 rank.
In connection with the elementary principal& relatively low ideal rankings,
it is interesting to consider the distance between their reporzed actual conditions
and their reported ideal conditions. Elementary principals appear to be more
dissatisfied than.secondary principals, since the gap between their actual means
and their ideal means was greater for elementary principals than for secondary prin-
cipals on 9 of the twelve statements. Secondary principals showed a larger gap on
only one statement, number 6, coordinating deliveries and returns from the school
district's center, and the two groups had equal gaps on statement 7, coordinating
deliveries and returns from the regional service center, and 20, developing
acquisition procedures for AV materials. What are elementary principals saying
about their librarians? That they need more of their time? That they would like
better performance but are not really expecting it, even under ideal circumstances?
A follow-up to the current study is planned to compare responses from districts
which have full-time elementary librarians in every school with those where one
librarian serves two or more schools to see whether this may be the deciding factor.
Performance Area I
This Performance Area of the survey instrument consists of statements 24-40 and
has the following scale to indicate frequency of performance of a given function:
0 (zero) = Don't Know; 1 = Never, Not at All; 2 = Infrequently; 3 . Sometimes;
4 = Frequently; 5 . Always, Systematically.
Ten of the seventeen statements in this Performance Area had rankings which
differed significantly and table 65 presents the data summary for those statements.
Again We note that secondary principals gave higher rankings for each and every
one of the significant statements both actually and ideally.
113

TABLE 65
Elementary principals vs. secondary principals
Results of analysis of variance on selectedstatements in performance area I***
Actual Condition
Role or function statements Means
Elem. prin. Sec. prin. 2
24 Disseminating information on theavailability of resources 3.79259 4.06383 .0077*
27. Providing information en newteaching developments 2.33588 2.52555 .0985
28. Providing teachers with lis'A ofmaterials useful in instruction 3.17910 3.46043 .0193*
30. Designing information systems 2.83267 3.19380 .0041*
31. Helping studentt, chooseappropriate materials 3.71642 4.01429 .0036*
33. Applying learning theories tothe evaluation of ma*0rials 3.39662 3.65600 .0339*
34. Evaluating materials by utilizingsuggestions from administrators andteachers
3.86090 4.15441 **
38. Applying basic research data tomanagement 2.95918 3.38053 .0025*
39. Planning and conducting researchprojects 2.06373 2.51667 .0006*
40. Reading professional publications 3.82819 4.16667 **
* Difference significant at the .05 or greater level.** Statistic not used. See note, page 12.
*** Response category B: 0=Don't Know; 1=Never; Not at All; 2=Infrequentiv;3=Sometimes; 4=Frequentiv; 5=Always; Systematically
119

TABLE 65, continued
Elementary principals vs. secondary principals
Results of analysis of variance on selectedstatements in performance area I***
Ideal Condition
,Role or function statements Means
Elem. prin.
24. Disseminating information on theavailability of resource& 4.53137
27. Providing information on newteaching developments 3.a030
28. Providing teachers with lists ofmaterials us.ful in instruction 4.11524
30. Designing information systems 3.86719
31. Helping students chooseappropriate materials 4.31734
33. Applying learning theories tothe evaluation of materials 4.16031
34. Evaluating materials by utilizingsuggestions from administrators andteachers
3.86090
38. Applying basic research data tomanagement 3.86404
39. Planning and conducting researchprojects 3,36123
40. Reading professional publications 4.42586
Sec. prin. 2
4.68085 .0116*
3.52206 ..0367*
4.24286 .1456
4.09091 .0250*
4.43571 .0917
4.29231 .1252
4.15441
4.22764 .0003*
3.66667 .0078*
4.60432 .0063*
* Difference significant at the .05 or greater level.** Statistic not used. See note, page 12.*** Response category B: 0=Don't Know; 1=Never; Not at All; 2=Infrequently;
3=Sometimes; 4=Frequently; 5=Always; Systematically
120

-109-
Statements 24, 27, and 28 concern frequency with which information about
library resources, information on new teaching developments, and bibliographies
for teachers are distributed. Just as we saw an apparent hesitancy on the part
of librarians in chapter 3 to "...provide information to teachers on new teaching
developments and practices," we find here that principals agiee that Infrequently-
plus (2.0+) is the actual condition. Although they disagreed significantly on
the ideal condition, each group of principals gave it the lowest ideal rankings of
the ten statements in this section. It would appear that
there are perceived territorial boundaries between the teacher and the librarian
which would be violated by the librarian who assumed an aggressive role in this
area. Since teachers commonly share with other teachers information of this nature
which comes to their attention, t4cre may be an implication here that the librarian
1.7 aot considered a colleague elthor by the librarian or by the principals. Would__
teachers welcome tnis kind of information from librarians? Another study will have
to anovn that question.
The composite picture of the performance of the elementary librarian which
emerges from the means given by the elementary principals is that of a person who
is currently acting with significantly less frequency than secondary librarians on
seven of the ten functions and with less frequency on the three remaining functions.
At the ideal, elementary librarians would still be seen as performing with less
frequency--significantly less on seven of the ten functions. We believe that these
figures are the result of the lack of full-time librarian service at the campus level
in many elementary schools.
Here, as with the responsibility statements discussed above, elementary principals
exhibit greater dissatisfaction than secondary principals as evidenced by the filet
that there is a greater gap between their actual mean score and their ideal mean
121

score on nine out of the ten statemants. Only in the cast. of statement 27, pro-
viding information on new teaching practices, do secondary principals show a wider
gap than do elementary principals between their actual and ideal means.
Performance Areas II and III
Performance Area II consists of statements 41-46 with response categories
scaled to indicate the degree of provision made for each function or service:
0 (zero) = Don't Know; 1 = Makes No Provision; 2 = Makes Minimal Provision; 3 =
Makes Partial Provision; 4 = Makes Substantial Provision; 5 = Makes Complete Pro-
vision.
Performance Area III consists of statements 47-57 and completes the survey
instrument. The response scale is dichotomous: 0 (zero) = Don't Know; 1 = No;
5 = Yes. As explained in chapter 3, the computer was programmed to treat the
1 (Yes) responses as 5's.and the 5 (No).responses as l's to maintain the 1 lowest
to 5 highest ranking values of the first 46 statements. Table 66 presents data
summaries for statements in Performance Areas II and III in which elementary and
secondary principals differed significantly in their rankings.
Again, secondary principals have ranked the level of provision higher in every
case, and a greater percentage of secondary principals responded Yes to the
dichotomous statements. And again, elementary principals' rankings suggest greater
dissatisfaction with their current library service in that the gape between their
actual means and their ideal means are wider in six out of the seven statements than
are the gaps for secondary principals, who showed slightly greater dissatisfaction
on statement 46, providing for multi-cultural and multi-ethnic materials.
We conclude this consideration of the significant statements resulting from the
comparison of responses from all secondary principals with those from all elementary
principals with a series of questions: Are librarians roles and functions at the
122

TABLE 66
Elementary principals vs. secondary principals
Results of analysis of variance on selected statementsin performance areas II & III
Actual Condition
Role or functions
41. Evaluating policies and pro-cc-lures.
43. Providing resources to sup-port the curriculum
44. Providing materials to meetrecreational needs
45. Providing professionalmaterials for teachers and admin-istrators
46. Providing multi-cultural andmulti-ethnic materials
51. Providing access to printmaterials
56. Applying instructional de-sign principles to locally pro-duced materials
*** Elem. prin.
C .12602
C .66917
C .30888
C .16730
C .59690
D 4.82677
D .33684
Sec. prin.
3.54962 .0010*
3.94928 **
3.58647 .0236*
3.44286 .0153**
3.74453 **
5.00000 .0148*
4.00000 .0057*
* Difference significant at the .05 or greater level.** Statistic not used. See note page 12.
*** RESPONSE CATEGORIES:C: 0=Don't Know; 1=Makes No Provision; 2=Makes Minimal Provision; 3=Makes
Partial Provision; 4=Makes Substantial Provision; 5= Makes CompleteProvision
D: 0=Don't Know; 1=No; 5=Yes

TABLE 66, continued
Elementary principals vs. secondary principals
Results of analysis of variance on selected statementsin performance areas II & III
Ideal Condition
Role or function statements
41. Evaluating policies and pro-cedures.
43. Providing resources to sup-port the curriculum
44. Providing materials to meetrecreational needs
45. Providing professionalmaterials for teachers and admin-istrators
46. Providing multi-cultural andmulti-ethnic materials
51. Providing access to printmaterials
56. Applying instructional de-sign principles to locally pro-duced materials
** Elem. prin. Sec. Prin. 2
C 4.07843 4.35971 .0002*
C .30224 4.4571.4 .0235*
C 3.99245 4.12409 .1736
C 4.10821 4.22i43 .1282
C 4.11610 4.27536 .0454*
D .96970 5.00000 .3100
D 4.68664 4.74775 .6165
* Difference significant at the .05 or greater level.** RESPONSE CATEGORIES:
C: 0=Don't Know; 1=Makes No Provision; 2=MAkes Minimal Provision; 3=MakesPartial Provision; 4=Makes Substantial Provision; 5=Malces CompleteProvision
D: 0=Don't Know; 1=No; 5=Yes

-113-
elementary level less demanding than those at the secondary level? Apparently,
elementary principals as a group see themselves currently as receiving less
from their librarians and as ideally expecting less from their librarians than
secondary principals receive and hope to receive. Apparently, also, elementary
principals see a greater gap between what they are getting and what they'd like to
get than do secondary principals. Is this perceived difference primarily (or solely?)
a result of part-time service to so many of the elementary schools in the survey? Is
it that elementary library service has received less attention in library education?
Is it that the people who are attracted to elementary libraries are less competent
than those who opt for secondary libraries? Is it that elementary principals don't
know what their librarians are doing or what they should be doing and therefore were
unable to respond as accurately as they might have otherwise? A total of twenty-
nine statements were significant in this comparison. In only ONE case did the
elementary principals as a group reach and exceed a rank of 4 on the actual condition--
statement 51, providing access to print materials through a card catalog. Whether
this situation indicates widespread dissatisfaction or widespread lack of information1
is a question which cannot be answered by this study.
Urban Principals: Elementary vs. Secondary
The population of all principals discussed in the previous section consists
primarily of principals from counties which are designated as urban. Therefore,
the comparison between urban elementary and secondary principals yielded substan-
tially the same statements with significant differences as did tke previous comparison.
Summary data for the six statements which were significant here but were not signifi-
cant in the earlier comparison are presented in table 67.
1See discussion of Don't Know responses at the conclusion of chapter 3.
125

TABLE 67
Urban elementary principals vs.urban secondary principals
Results of analysis of varianceon selected statements
Actual Condition
Sec. prig.Role or function statements -1E* Elem. prin.
1. Formulating long range plans A 2.99609 3.24800 .0297*
5. Preparing proposals for ob-taining outside funds A 1.91163 2.34259 .0046*
36. Using the systems approach B 3.17089 3.33708 .3125
40. Reading professional publi-cations B 3.82326 4.20721 .0007*
43. Providing resources tosupport the curriculum C 3.69565 3.99174 .0051*
44. Providing materials tomeet recreational needs C 3.36179 3.64655 .0252*
* Difference significant at the .05 or greater level.
** RESPONSE CATEGORIES:A: 0=Don't Know; 1=Has Little or No Responsibility; 2=Has Same
Responsibility; 3=Has Considerable Responsibility; 4.=Has MuchResponsibility; 5=Has Complete Responsibility
B:. 0=Don't Know; 1=Never, Not at All; 2= Infrequently; 3=Sometimes;4=Frequently; 5=Always; Systematically
C: 0=Don't Know; 1=Makes No Provision; 2=Makes Minimal Provision; 3=MakesPartial Provision; 4=Mhkes Substantial Provision; 5=Mhkes CompleteProvision
126

TABLE 67, continued
Urban elementary principals vs.urban secondary principals
Results of analysis of varianceon selected statements
Ideal Condition
Sec. prin.Role or function statements *** Elem. prin.
1. Formulating long range plans A 3.59533 3.83871 .0047*
5. Preparing proposals for ob-taining outside funds A 2.90417 3.17949 .0349*
36. Using the systems approach B 3.17089 3.33708 .3125
40. Reading professional publi-cations B 4.42400 4.63964
43. Providing resources tosupport the curriculum C 4.32157 4.47967 .0224*
44. Providing materials tomeet recreational needs C 4.01587 4.20833 .0443*
* Difference significant at the .05 or greater level.
** Statistic not used. See note, page 12.
*** RESPONSE CATEGORIES:A: 0=Don't Know; 1=Has Little or No Responsibility; 2=Has Some
Responsibility; 3=Has Considerable Responsibility; 4=Has MuchResponsibility; 5-Has Complete Responsibility
B: 0=Don't Know; 1=Never, Not at All; 2=Infrequently; 3=Sometimes4=Frequently; 5=Always; Systematically
C: 0=Don't Know; 1=Makes'No Provision; 2=Makes Minimal Provision;3=Makes Partial Provision; 4=Makes Substantial Provision; 5=MakesComplete Provision
127

-116-
Immediately apparent once again is the fact that urban secondary principals have
assigned higher rankings for each of the statements both actually and ideally. And
again, except Lor statement 36, using the systems approach, the gaps between the
elementary principals' actual means and their ideal means are wider than the gaps
for secondary principals.
Actually, statement 36 is the only one which did not appear at all in the
previous section. Each of the others appeared earlier as significant on either the
actual or ideal scales. For example, statement 1, long range plapning, was signifi-
cant on the ideal scale only earlier and here is significant on both scales.
Urban principals agreed that statement 36, using the systems approach for
designing library services, is done Sometimes-plus (3.0+) by their librarians.
Although they disagreed significantly on the ideal, they placed it at relatively
high (4.30 and 4.05) levels.
Altogether, thirty statements provided evidence of significant differences
between urban elementary principals'and urban secondary principals' perceptions of
the roles and functions of librarians. There are more differences reported here than
there are for the remaining two groups of principals.
All Principals: Large Districts vs. Small Districts
Responsibility
This section reports on the comparison of responses from 322 principals in
large districts with responses from 96 principals in small districts. There were
eight statements in which the rankings differed significantly in the Responsibility
Area. Table 68 presents the data summary for these eight statements.
Statements 2, 3, 4, and 5 deal with planning and funding responsibilities of
the campus level librarian. Principals in small districts report significantly higher
actual and ideal levels of librarian responsibility in each of these areas than do
123

-117-
TABLE 68
Principals in large districts vs. principals in small districts
Results of analysis of variance on selectedstatements in responsibility area**
Actual Condition
Role or function statements
Large
2. Preparing the educational speci-fications for new facilities 2.31104
3. Planning for the floor design,furnishings, etc., for new facilities 2.14236
4. Planning facilities for localdesign and production 2.25850
5. Preparing proposals for obtainingoutside funds 1.95057
9. Designing and conducting in-serviceprograma) for teachers 1.84665
13. Developing listening, viewing,and responding skills 2.12013
19" Developing acquisition proceduresfor print materials 2.87708
22. Storing and scheduling ofaudio-visual equipment 3.47302
Means
2Small
2.71111 .0055*
2.68889 .0002*
2.56522 .0278*
2.47253',- .0009*
1.60440 .0458*
1.87097 .0377*
3.04255 .2953
3.12632 .0447*
* Difference significant at the .05 or greater level.
** Response category A: 0=Don't Know; l=Has Little or No Responsibility;2=Has Some Responsibility; 3=Has Considerable Responsibility; 4=HasMuch Responsibility; 5=Has Complete Responsibility
129

-118-
TABLE 68, continued
Principals in large districts vs. principals in small.districts
Results of analysis of variance on selectedstatements in responsibility area**
Ideal Condition
Role or function statements
2. Preparing the educational speci-fications for new facilities
3. Planning for the floor design,furnishings, etc., for new facilities
4. Planning facilities for localdesign and production
5. Preparing proposals for obtainingoutside funds
9. Designing and conducting in-serviceprograms for teachers
13. Developing listening, viewing,and responding skills
19. Developing acquisition proceduresfor print materials
22. Storing and scheduling ofaudio-visual equipment
Large
Means
Small
3.414ol 3.56383 .1319
3.31847 3.60638 .0048*
3.29967 3.46237 .1293
2.90847 3.40426 .0003*
2.62540 2.43011 .1282
2.82903 2.64894 .1469
3.41503 3.68085 .0336*
3.86478 3.78125 .5457
* Difference significant at the .05 or greater level.
** Response category A: 0=Don't Know; 1=Has Little or No Responsibility;2=Has Some Responsibility; 3=Has Considerable Responsibility; 4=HasMuch Responsibility; 5=Has Complete Responsibility
130

-119-
principals in large districts. Of the small district principals, 52.22% report
librarians' responsibility for statement 2, preparing educational specifications
for new library facilities, at the Considerable (3.0) and Much (4.0) levels,
compared with 34.78% of the large district principals who assigned those levels.
The actual level of responsibility for statement 3, planning for floor design,
furnishings, etc., is ranked at the Much (4.0) or Complete (5.0) level by 38.89% of
small district principals, compared with only 18.40% of the principals in large
districts who placed it that high. Responsibility levels for statement 4, planning
facilitiesforlocaldesignandproductim,wrerdat the Considerable (3.0)
rank or above by 48.74% of the small district principals, but only 36.74% of the
large district principals,assigned those levels. Preparing proposals for outside
funds, statement 5, is an area in which librarians have Little or No responsibility
according to 54.75% of the principals in large districts and 36.26% of those
small districts. At the other end of the scale, however, 32.96% of small district
principals place librarians' responsibility for preparing proposals at the Much or
Complete levels, compared with only 17.49% of the principals in large districts who
assigned those levels. Although librarians in small districts are perceived as
having more responsibility in these areas, the mean scores for the actual condition
never reach the Considerable (3.0) level. Nevertheless, the small districts appear
to rely more heavily on campus level personnel in these areas than do the large dis-
tricts. It should also be noted that there is a wider gap between the actual means
and the ideal means given by the large districts than-by the small districts for
these statements.
Statement 9, designing and conducting in-service training programs for teachers,
received the lowest actual and ideal rankings in this section from both groups.
Although the large district principals ranked the actual responsibility significantly
131

-120-
higher, 80.51% of dhem said the librarians have Little/No (1.0) or Some (2.0)
responsibility, and 84.62% of the small district principals agreed. Conducting in-
service training for teachers appears to be a function which is viewed in the same
way as providing information to teachers on new teaching developments and practices
(statement 27, discussed above). In some ways, however, statement 9 represents a
more crucial activity than does statement 27. Teachers who are given forMal, well-
prepared orientations to their library should be in better positions to interpret
it to their students, to integrate it into their teaching, and to make the library
more central to the enttre educational program. Although the ideal levels here are
low, there appears to 13'?. room for librarians to increase their activity in this area.
Statement 13, developing listening, viewing, and responding skills, received
the next lowest means both actually and ideally, with principals in large districts
significantly higher on the actual levels of responsibility.
The ideal for statement 19, developing procedures for acquisition of print
materials, was ranked significantly higher (3.68 to 3.41) by small district princi-
pals, but the difference in their perceptions of the actual condition was not sig-
nificant. Their ideal rankings were at the Considerable-plus level, and the gap,'
between the actual and ideal means given by the small district principals was wider
than that of the larger district principals. The presence in many of the large
districts of library supervisors who have a large share of the responsibility for
developing acquisition procedures probably explains the lower means of the large
district principals and their narrower actual-ideal gap.
Statement 22 concerns the librarian's responsibility for the sto-age and
scheduling of AV equipment. Principals agreed that the ideal level is just short
of Much responsibility but disagreed in their perceptions of the actual condition.
Principals in large districts ranked the actual condition higher, with 74.61% of them
132

-121-
reporting the responsibility level at 3.0 and above, compared with only 61.06% of the
small district principals who assigned those levels.
It would appear at this point that the principals in large and small districts
are confirming the pattern noted earlier for the librarians in large and small
districts. The small district librarians gave higher rankings to management-related
responsibilities and functions, and the large district librarians gave higher rank-
ings to the service-related responsibilities and functions. The same divisiOn
appears here in the perceptions of their respective principals.
^Performance Areas I and III
The rankings of four statements in Performance Area I, and one.statementin
Performance Area III differed significantly. Table 69 presents the Jata summary for
these statements.
Principals in large districts assigned higher actual levels of performance
to each of these statements and higher ideal levels to all except statement 50,
organizing and classifying audio-visual materials. Statements 25, 26, and 31 are
representative of service-related activities, and they are all ranked at Sometimes-
plus (3.04) by both groups of principals on the actual scale. Although the princi-
pals disagreed significantly in their perceptions of the ideal for these three state-
ments, both groups ranked the ideal in excess of 4.0 on the 5 point scale.
Statement 299 participating on curriculum planning committees, cannot be neatly
designated as either service-related or management-related, rather it is faculty-
related. It was suggested earlier that the 1,- rankings on statements 9 and 27
may indicate that the librarian is not perceived as a full faculty member. The
rankings for statement 29 are low enough here to raise the question again--the mean
rankings for the actual condition do not reach-3.0. On the ideal scale, the librarian
would participate less often than Frequently (4.0) according to the principals'
133

-122-
TABLE 69
Principals in large districts vs. principals in mnall districts
Results of analysis of variance on selectedstatements in performance areas I & III
Actual Condition
Role or function statements *** Large Small 2
25. Promoting the library'scollections and services B 3.82650 3.52128 **
26. Disseminating information oneffective use of materials and B 3.53312 3.22581 **equipment
'19. Participating on curriculumplanning committees B 2.7635/ 2.42697 .0237*
31. Helping students chooseappropriate materials B 3.85669 3.69149 .1537
50. Organizing and classifyingaudio-visual materials D 4.23596 3.60000 .0028*
Ideal Condition
Role or function statements *if* Large
25. Promoting the library'scollections and services B 4.51887
26. Disseminating information oneffective use of materials and B 4.31447equipment
29. Participating on curriculumplanning committees
31. Helping students chooseappropriate materials
50. Organizing and classifyingaudio-visual materials
B 3.81553
B 4.40063
D 4.70629
Small 2
4.36170 .o400*
4.10753 .0123*
3.63333 .1243
4.21277 .0175*
4.72727 .8684
* Difference significant at the .05 or greater level.** Statistic not used. See note, page 12.*** RESPONSE CATEGORIES:
B: 0=Don't Know; 1=Never, Not at All; 2=Infrequently; 3=Sometimes;4=Frequently; 5=Always; Systematically
D: 0=Don't Know; 1=No; 5=Yes
134

rankings. It appears then that many librarians still need to convince administrators
that they are indeed faculty members who wish to function as faculty.
Principals disagreed significantly in their perceptions of the actual condition
in regard to statement 50, organizing and classifying audio-visual materials. Of
the large district principals, 80.90% responded that the materials were so organized,
compared with only 65.00% of the small district principals. They did not disagree
significantly in their perceptions of the ideal.
All Principals: Urban vs. Rural
ResponsibilitY Area
This section compares responses from 386 urban principals with responses from
32 rural principals. Seven statements from the Responsibility Area differed signifi-
cantly in this comparison, and table 70 F _sents the data summary.
Statements 3 and 5 concern planning and fundin3 responsibilities of the librariaa,
and rural principals ranked each of ihem higher both actually and ideally--significantly
higher on the actual condition for stateur.:nt 3 and on the ideal for statttment 5. Of
the rural principals, 42.86% ranked librarian& actual responsibility for planning for
floor design, furnishings, etc., - ;..he Much (4.0) or Complete (5.0) levels, compared
with only 21.721 of the urban p.incipals who designated those levels. Similarly,
56.26% of the rural principals--but only 38.09% of the urban principals--indicated
that librarins would ideally have Much or Complete responsibility for preparing pro-
posals for outside funds. Rural districts generally have fewer personnel
and, as a result, appear to rely more heavily on them dhan do urban districts.
Although principals agreed that librarians' actual responsibility for statement
11, producing materials locally, was at the Some-plus (3.0) level, they disagreed
significantly in their perceptions of the ideal. Of the rural principals, 62.50%
ranked the ideal at the Much or Complete levels, compared with only 39.84% of the
135

TABLE 70,
Principals in urban districts vs., principals in rural districts
Results of analysis of varianceon selected statements in the
responsibility area**
Actual Condition
Role or function statements Means
Urban
3. Planning for the floor design,furnishings, etc., for new facilities 2.23429
5. Preparing proposals for obtainingoutside funds 2.05573
11. Producing materials 2.20588
16. Formulating policies for select-ing print materials
17. Evaluating and selecting audio-visual equipment
19. Developing acquisition proceduresfor print materials
22. Storing and scheduling of audio-visual equipment
Rural 2
2.75000 .0327*
2.38710 .1758
2.28125 .7376
3.47895 3.90625 .o46o*
2.60950 2.09315 .0235*
2.89532 3.15625 .2903
3.44180 2.81250 .0204*
* Difference significant at the .05 or greater level.
** Response category A: 0=Don't Know; 1=Has Little or No Responsibility;2=Has Some Responsibility; 3=Has Considerable Responsibility; 4=HasMuch Responsibility; 5=Has Complete Responsibility
136

TABLE 70, continued
Principals in urban districts vs.principals iq rural districts
Results of analysis of varianceon selected statements in the
responsibility area**
Ideal Condition
Role or function statements
Urban
3. Planning for the floor design,furni,,hings, etc., for new facilities 3.36605
5. Preparing proposals for obtainingoutside funds 2.99440
IA. Producing materials 3.07487
16. Formulating policies for select-ing print materials 3.95000
17. Evaluating and selecting audio-visual equipment 3.23622
19. Developing acquisition proceduresfor print materials 3.3475o
22. Storing and scheduling of audio-visual equipment 3.85864
Means
2Rural
3.6129 .1306
3.40625 .0548*
3.65625 .0064*
4.18750 .1105
2.96875 .1579
3.93750 .0104*
3.68750 4334
* Difference significant at the .05 or greater level.
** Response category A: (Don't Know; lmilias Little or No Responsibility;2NHas Some Responsibility; 3NHas Considerable Responsibility; 4NHasMuch Responsibility; 5NHas Complete Responsibility
137

urban principals who assigned those levels.
Statements 16 and 19 deal with policies and procedures for selecting and
acquiring print materials, and rural principals ranked librarians' responsibility
levels higher on both the actual and ideal--significantly higher on the actual
condition for statement 16 and on the ideal condition for statement 19. Here,
again, we are probably seeing the influence of the large urban districts' library
supervisors who assume some of the responsibility in the urban districts that, in
the rural districts, remainswith the campus librarian.
Statements 17 and 22 concern evaluating, selecting, storing and scheduling
of AV equipment; and urban principals assigned significantly higher actual levels
of librarian responsibility for these functions than did rural principals. Both
groupp_of principals perceive librarians as having more responsibility for storage
and scheduling than for evaluating and selecting AV equipment. Apparently, however,
actual practice in many of the rural districts.places AV equipment outside the
jurisdiction of the librarian. According to information gained from the superin-
tendent interviews, the principals themselves often assume this responsibility.
Performance Areas I, II, and III .
Seven statements in Performance Aiea I, four statements in Performance Area II,
and one statement in Performance Area III showed significant differences in this com-
parison. Table 71 presents a data summary for these statements.
Urban principals ranked librarians' actual performance significantly higher on
ten of the twelve statements. Once again, the lowest actual rankings assigned by
each group are reserved for the librarians' frequency of participation on curriculum
planning committees. Of the rural principals, 32.14% reported that their librarians
Never participate, as did 20.73% of the urban principals.
Otherwise, however, urban principals perceived their librarians' performance
133

-127-
TABLE 71
Principals in urban districts vs.principals in rural districts
Results of analysis of varianceon selected statements in per-formance areas I, II, & III
Actual Condition,
Role or function statements ** Urban Rural 2
25. Promoting the library's col-lections and services B
26. Disseminating information oneffective use of materials and Bequipment
29. Participating on curriculumplanning committees B
33. Applying learning theories tothe evaluation of materials B 3.50299
3.79790 3.23333 .0060*
/
3.50789 2.90000 .0018*
2.72269 2.21429 .0353*
34. Evaluating materials by util-izing suggestions from administra- B 3.98928tors and teachers
37. Gathering statistical data B 3.08766
38. Applying basic research datato management B 3.15278
43. Providing resources to sup-port the curriculum C 3.79144
44. Providing materials to meetrecreational needs C 3.45304
45. Providing professional mater-ials for teachers and administra- C 3.29144tors
46. Providing multi-cultural andmulti-ethnic materials
52. Providing access to audio-visual materials
3.68207
4.29683
3.28571 .3139
3.58621 .0365*
2.45833 .0248*
2.57143 .0298*
3.43333 .0526*
2.80000 .0027*
2.89655 .0597
3.18519 .0132*
3.50000 .0062*
* Difference significant at the .05 or greater level.** RESPONSE CATEGORIES:
B; 0=Don't Know; 1=Never; Not at All; 2=Infrequently; 3=Sometimes;4=Frequently; 5=Always;'Systematically
C: 0=Don't Know; 1=Makes No Provision; 2=Makes Minimal Provision; 3=MakesPartial Provision; 4=Makes Substantial Provision; 5=Makes CompleteProvision
D: 0=Don't Know; 1=No; 5=Yes
139

-128-
TABLE 71, continued
Principals in urban districts vs.principals in rural districts
Results of analysis of varianceon selected statements in per-formance areas I, II, & III
Ideal Condition
Role or function statements
25. Promoting the library's col-lections and services
26. Disseminating information oneffective use of materials andeqdipment
29. Participating on curriculumplanning committees
33. Applying learning theories tothe evaluation of materials
34. Evaluating materials by util-izing suggestions from administra-tors and teachers
37. Gathering statistical data
38. Applying basic research datato management
43. Providing resources to sup-port the curriculum
44. Providing materials to meetrecreational needs
45. Providing professional mater-ials for teachers and administra-tors
46. Providing multi-cultural andmulti-ethnic materials
52. Providing access to audio-visual materials
*** Urban
B 4.49476
B 4.28609
B 3.78649
B 4.22715
B 4.48276
B 3.98521
B 4.00308
C 4.37302
C 4.07796
C 4.17196
4.19149
4.75691
Rural 2.
4.33333 .1921
4.00333 .0578
3.62069 .3856
3.93548 .0519/F
4.22581 .0298*
3.96154 .8956
3.84615 .3976
4.13333 **
353333
3.83333 .0122*
3.89655 **
4.75000 .9689
* Difference significant at the .05 or greater level.
** Statistic not used. See note, page 12.
*** RESPONSE CATEGORIES:A: 0=Don't Know; 1=Never; Not at All; 2=Infrequently; 3=Sometimes;
4=Frequently; 5=Alwavs. SystematicallyC: 0=Don't Know; 1=Makes No Provision; 2=Makes Minimal Provision; 3=Makes
Partial Provision; h=Makes Substantial Provision; 5=Makes CompleteProvision
D: 0=Don't Know; l=No; 2=Yes
140

at the 3-plus level for each of the remaining eleven statements, with high rankings
(3.6+) going to statement 25, promoting the library's collection and services;
statement 34, utilizing suggestions from administrators and teachers; statement 43,
providing resources in support of the curricular program; statement 46, providing
multi-cultural and multi-ethnic materials; and statement 52, providing access to
AV materials through a card catalog or other records.
Rural principals, on the other hand, ranked six of the twelve statements below
the three level, and no performance statement was ranked as high as 3.6. Only state-
ments 34, evaluating materials by utilizing suggestions from administrators and
teachers, and 52, providing access to AV materials, received rankings as high as
3.5 from the rural principals.
Rural principals indicated greater dissatisfaction with the current level of
librarian performance. The gaps between their actual means and their ideal meant'
were wider than those for urban principals in eleven aut of the twelve statements.
Only on statement 33, applying learning theories to the evaluation of materials,
did urban principals show greater dissatisi,r;tion. As was the case with many ele-
mentary principals in this study, rural principals typically share the services of
one librarian with other schools in their district. Therefore it is not surprising .
that there are wider gaps between their perceived actual conditions and their
perceived ideals.
The next chapter presents the results of interviews with a sample of fifteen
superintendents drawn from those who had responded to the survey.
141

,"
CHAPTER VI
SUPERINTENDENT INTERVIEWS
Introduction
Interviews with school district superintendents or their designates' were
held between March 26, 1976, and April 24, 1976. A stratified random sample of
the seventy-two respondents to the initial questionnaire was drawn to provide
the names of ten urban and six rural districts in which to request interviews
with the superintendent or his representative. Superintendent interest in the
study was evidenced by the fact that only one substitution from the initial sample
was required and only one interview had to be cancelled.
The investigators developed an open-ended interview schedule designed to gain
responses to major findings and to elicit suggestions for desirable courses of
action to correct perceived problems. Specifically, we wanted information of the
following nature: (1) What explanation(s) could superintendents give for some of
the more significant findings? (2) How did the superintendents perceive the li-
brarian's role in, for example, planning? (3) Did superintendents see need for
changes? If so, what suggestions would they offer for producing those changes?
Each interview began with a review of the study's purpose and results. Then
the purpose of the interview, as given in the letter requesting the interview, was
restated: "...to obtain reaction to major findings and seek advisement on possible
actions which might be desirable." Interview areas included (1) planning, (2) apply-
ing foi funds, (3) participation on curriculum planning committees, (4) selecting
materials and equipment, (5) developing listening, viewing, and responding skills,
1The term superintendent will be used hereinafter as a matter of convenience.
A list of those interviewed, along with position titles, is given in Appendix III.
-130-
142

and (6) network liaison.
Interview Results
Planning.--The first area of inquiry dealt with perceptions of librarians'
actual level of responsibility for planning in the areas of educational specifi-
cations for new or remodeled library facilities, floor design, furnishings, etc.,
(survey statements 2 and 3) and for planning for facilities for local design and
production of learning resources (survey statement 4). To provide background,
the interviewer summarized the findings on planning essentially as follows: "In
their perceptions of the actual level of responsibility, librarians ranked them-
selves significantly lower than principals who, in turn, ranked librarian respon-
sibility lower than superintendents did. Survey statement 2, for example, had a
mean for librarians of 2.15, for principals'of 2.40, and for superintendents of
2.91 on a 1 (lowest) to 5 (highest) scale. Survey statements 3 and 4 were ranked
similarly."
Given this introducto...., information, the superintendent was then asked: "What
do you think about the way these rankings line up?" Suitable follow-up questions
were asked as necessary to focus attention on the librarian's role in planning.
A few of the superintel 'eats saw the low rankings that librarians had assigned
to themselves as quite understandable. One said succinctly, "They put themselves
out of it, didn't they? Th,, o not surprising." Another from a small rural district
said, "Some lib,ariant ir. ist not organized at all, just can't manage well. When
remodeling was done here, we just went ahead; we didn't ask her. It wouldn't have
done any good."
Two superintendents explained the rankings by surmising that if most of the
answers were premised on hypothetical rather than real situations the differences
143

-132-
should be expected. As one put it, "Administrators are being made more and more
aware of the need for involvement from the grass roots level and may tend to give
higher rankings because of this consciousness."
The initial reaction was generally surprise, however, with comTents such as,
"Why, it [the sequence of the mean scores for the actual condition] Is inverted,
isn't it!" One of the more knowledgeable superintendents thought that librarians'
lack of experience, training, initiative, or perhaps some combination of the
three, were possible factors that would account for the sequence. His rhetorical
question seemed appropriate: "Where else would one go for this information if not
to the librarian?"
Another administrator in a large urban district thought that the low level of
librarian involvement in planning occurs because "Administrators are hesitant to
ask people who are already very busy to came to after-school meetings, but there
would be no problem with librarians getting into planning sessions if they wanted
to."
Two of the strongest positive interview responses were from superintendents
in small districts. One explained that his "lead librarian" of twelve years does
all library budget planning and did all the planning for a recently constructed
elementary school library. The superintendent then said, with considerable feeling:
"I was here ten years before we hired [the current librarian], and it was a relief
to get someone to take care of it.". He added that he wanted to delegate responsi-
bility and had a great deal of confidence in his librarian: "She is willing to
take hold, to take charge. She has reasons for what she wants and sees that it is
used when she gets it." The other superintendent explained that he didn't see how
his district could possibly get along without its librarian. As for planning, "She
doesn't wait to be told; she comes to :find out. This is a strength of her person-
144

-133-
ality. We don't say yes to everything, but she just keeps coming back."
Superintendents in small schools did not think that it would be necessary for
librarians to set about in a formal way to determine administrative expectations
for their role in planning. For example, in one small rural situation where the
superintendent and the librarian had worked together for several years, the super-
intendent felt that the district's small size facilitated communications and that
everybody understood what was expected, "but'if we got a brand new lady (or man)
we would need to talk to her or to him more."
Superintendents, when asked where the librarians fit in, gave some interesting
responses: "Librarians could take more initiative," said one, "if they would go
about it in the right way." Another response was that "Some people in the school
business--coaches, department heads, not just the librarian--wouldn't get their
requests no matter what. Those who come in and pound the desk and say 'We need
this' are not going to get anywhere." Nearly every one of the superintendents
stressed that librarians need to be reasonable in their requests and aware of budget
constraints.
Applying for funds.--The second interview area concerned the low level of
the rankings assigned to librarians for the actual condition on survey statement 5,
"When funds are available from sources outside the local diEict, the librarian has
responsibility for preparing proposals for obtatning them." Superintendents' means
were 2.05, principals' 1.96, and librarians' 1.78. With this background information,
the funding area was introduced by the investigator as foll/dwst "Take the ESEA
Title IV fund applications for instance, who is responsibla for c..t1Taying information
for making them here in (name of school district)?" If neces& follow-up
question asked "Where do you see the librarian fitting into t;tinY"
It soon became clear that superintendents do not consider funding bc a
14 5

-134-
campus level librarian's function. Concensus was that applications to regularly
recurring sources, such as ESEA funds, should be handled at the district level
with librarian input. In one instance the statement that it was not the librarian's
job to apply for funds was softened by the qualification that "librarians should
be responsible for fund proposals from non-standard sources."
Participation on curriculum planning committees.--The third interview area
considered the findings on survey statement 29, "The librarian participates on
curriculum planning committees." This statement was in a section of the question-
naire with responses scaled to indicate frequency of occurrence from I (Never;
Not at All) to 5 (Always; Systematically). Nearly half (4)4..44%) of the librarians
reporting on this statement said they NEVER participate on curriculum planning
committees, but 90.47 percent of them see the ideal situation as one where they
would participate at least Sometimes (3 on the 5 point scale). Superintendents
were then asked: "Why do you think this is? Why don't more librarians get onto
curriculum planning committees?"
Interviewed superintendents supported the librarians' contentions that they are
not ordinarily included on curriculum committees. Indeed, only two superintendents,
both in small urban districts, stated firmly, unequivocally, that their librarians
did participate in this way; and one of these librarians was in a school where the
faculty served as a committee of the whole. In the other district, the superinten- .
dent reported that librarians were involved in all aspects of curriculum develop-
ment from needs assessment on; for example, they have been heavily involved in
developing English curriculum mini-units, and they work closely with counselors.
Among the rest of the interviewed supertntendents, the reasons for non-rartici-
ration varied widely. At one extreme were those represented by dhe rural superinten-
dent who thought very highly of his librarian but said flatly, "It would be a waste
146

-135-
of her time. The only way our librarian gets involved in curriculum is in getting
suggestions from teachers. We're small enough so she can learn what she needs
without going to faculty curriculum meetings." Another pro-librarian superinten-
dent of a small rural school district did not put the librarian on curriculum
committees because "The librarian has so much extra stuff that you hate to put
more on her--she's a hard worker, and does a lot already."
A large urban district superintendent replied in a similar vein with "How
much are they willing to do beyond the regular school hours? Principals would
not hesitate [to ask librarians to serve on curriculum planning committees] if
they did not think it was an imposition." This particular district pays extra
for curriculum development, "and the budget is tight, so specialists may not be
involved as much as they should be.... The supply of materials is not given its
proper place in curriculum development, however."
Representing the other extreme were two superintendents who placed blame for
non-participation on the librarians themselves. One, from a large urban district,
was "not surprised Ws not ranked higher. When in-service day cames, they
[librarians] go off by themselves instead of going to the Language Arts session.
Actually they are welcome to go to other curriculum meetings, too, but I don't
know of any way to get them to be more active participants." The other superin-
tendent, from a small urban district, attributes librarians non-participation to
"lack of cammunication. The librarians should take the initiative to go to the
teachers, but they don't. When we revised curriculum recently, same teachers had
to identify related nbrary materials themselves. Librarians should know the
materials, and levels, and what is available. Maybe t's easier just to stay in the
library than it is to function as a faculty member!"
Three superintendents thought administrators were remiss in not involving
147

-136-
librarians in curriculum planning. As ona.put it, even though "it is not the
librarians' function to be co-equal in formulating the uriginal objectives, they
should be brought in earlier than they generally are to advise on shifts of materials
which might be occasioned by changes in grade placement or sequence."
If librarians are to function as menibers of the professional staff in schools,
it is essential that they be involved in curriculum planning and development.
This means some librarians will have to quit getting satisfaction fram having
people say "look at our pcor,overworked librarian, she is doing so much we couldn't
ask her to do any more." Some will have tu be more assertive and say "I would like
to attend the curriculum planning sessions because I need to be there to do my job
right, and you need me there to do the curriculum planning right." And for many
librarians it will mean taking the time and the effort to learn about approaches
to instructional design so they can be contributing participants in the process.
Selecting materials and equipment: small districts (urban & rural).--Survey
statements 15, 16, 17, and 18 deal with various aspects of responsibility for
selecting materials and equipment. All three groups who responded to the question-
naire survey--principals, superintendents, and librarians--ranked the degree of
responsibility in this area in the following descending order: at the top was
selection policies for print materials (statement 16); next, provision for preview-
ing materials (statement 18); then, selection policies for AV materials (statement
15); and at the bottom, selection of AV equiPment (statement 17). This ranking
was consistent in the responses for both actual and ideal conditions. After the
foregoing background, superintendents were asked: "How do you account for this
hierarchy?" When it was necessary, these follow-up questions were asked: "Who
does select AV materials and equipment? How does the librarian fit intp this
situation?"
148

-137-
Responses to this question by superintendents from small districts varied
widely. One point of viewA'as expressed emphatically by a superintendent who is
proud of his position oyi selection generally: "Teachers need to select materials
and equipment, not me/or the librarian; otherwise, it'll never be used." Sub-/
sequent discussion ,Aith the high school librarian confirmed,his statement: the
librarian allocate'd library materials funds equally among the teachers, retaining
one share for mo/p-up buying. Another point of view, more widely held, is repre-'
sented by another superintendent who replied, "Yes, I can tell you why that ranking
exists--the AV materials are all in the principal's office, along with the AV equip-
ment and region.service center catalogs. It's always been that way." The
intervieTrier's reaction must have been evident, because the superintendent went on
to add,, "She [the librarian] stays busy without it, you know, and besides there
isn't room for it in the library; and staff is not available to cover the library
at,all times."
The reason given for the low'responsibility levels in the audio-visual area by
one articulate superintendent from a small rural district was that "librarians have
a poor image of themselves--a lack of confidence; and the superintendent does not
ordinarily see this as a librarian's job. Even the reading resources are bought
through reading resources teachers in our situation, where the librarian is here
only two days a week."
At the other extreme in small urban school districts were two superintendents
who could see no correspondence between the rankings and their situations. One said,
"We treat it all the same--it's all in the library and under the librarian's charge.
The principals have too many other responsibilities." Another responded, "The li-
brarian has the budget--she spends it, not the superintendent. That's what she is
hired to do." As one might expect, both of these superintendents had excellent
149

librarians who had assumed full professional responsibility.
Selecting materials and equipment: Large districts (urban & rural).--Super-.
intendents or assistant superintendents from large districts (ten or more campuses)
gave very consistent and candid explanations for the rankings. Consider the
following comments:
(1) "Traditionally, the librarian takes care of reading naterials, usingselection aids such as 'best' lists for books; but subject specialists'input is more necessary in AV selection."
(2) "Principals are in charge of AV materials and equipment and have been,historically. It would take some adjustment on the principals' part toaccommodate the Learning Resources Center and the Learning ResourcesSpecialist concept."
(3) "This hierarchy represents what we have been doing. Since equipment needsto be standardized across the district and must be put Out for bids, it'spretty well taken out of the librarians' hands. The librarian's training,interest, and background has not been in [audiovisual] equipment andmaterials. I'm not saying that's sex related; it's just that theirtraining and security is weaker in that area."
(4) "It's that way as a matter of course because books were first, and AVcame later; and we tend to think of a librarian dealing with books andthe rest will come gradually. Currently the principal assumes a largershare of the responsibility because the money [for AV equipment andmaterials] is not allocated to the library budget. Besides, the librarianherself does not see this as her job--equipment is expensive; and she wouldneed to see about getting it to fit [pause] and she just doesn't want theresponsibility."
It would appear that library tradition, media history, and Oessibly, sex role
stereotyping have cambined to deprive AV equipment and materials of a "home." Here,
the librarian tends them; there, the principal; elsewhere, another faculty member
is in charge. Since selecting and maintaining AV materials and equipment is central
to the concept of the Learning Resources Center, pre-service and in-service education
for the Learning Resources Specialist and all other school personnel must recognize
and support the L.R.S.'s responsibility in this area.
Developing listening, viewing, reading, and responding skills.--Statements 13
150
-139-
and 14 ask about the responsibility of librarians for developing student skills
in listening, viewing, reading, and responding. All three groups see a surprisingly
low level of responsibility (Little or None to Some-plus) on both the actual and
the ideal scales. All groups agreed that both actually and ideally librarians have
more responsibility for developing listening and viewing skills than for developing
reading skills. As might be expected, secondary librarians ranked these activities
lower than elementary librarians did. Given this introduction, superintenderts
were askt,! 'la responsibility for developing these skills and how the librarian
fits in.
A typical superintendent comment was "This is partly the librarian's job,
too, especially in the elementary grades. I'm surprised it is not [ranked] higher."
Another said, "Librarians definitely need these skills in order to establish the
teacher-librarian cooperation needed in getting books and so on to the kids. When
you have this cooperation, then library skills instruction gets the support it
needs."
In one district, after considerable discussion of the wording of the statements,
the superintendent suggested that the response might have been higher if the wording
had been changed from "the librarian has responsibility for developing listening,
viewing, and responding skills of students" to "The librarian has responsibility for
helping teachers develop the listening. skills of students."1
One superintendent said he didn't know the level of the librarian's responsi-
bility, and we went to his librarian to get the answer from her. She said, "Ply
responsibility? Do you want me to be honest? This is outside my area completely--
definitely a 1 (Never; Not at all) rank."
1 See page 33, supra, for further discussion of this point.
151

This is clearly an area in which the actual condition in many schools differs
markedly from policy statements of the profession.
Network laison.--Three survey statements-6, 7, and 8--ask for information
on three facets of the campus levol librarian's responsibility for providing
coordination with, and access to, resources from beyond the local campus. Resources
specifically mentioned in the statements include the Regional Service Center, the
public library, the State's library network, community resources, and the school
district learning resources center. Librarians are performing fairly well in their
coordination with the school district's center (where there is one), and that area
was not discussed with superintendents. Superintendents were asked, however, to
comment on the low rankings for the actual condition reported for laison with the
Regional Service Center--Superintendent's means were 2.L1, principals' 2.61,
librarians' 2.58--and for interlibrary loan responsibilities--superintendents'
means were 2.35, principals' 2.40, librarians' 2.50.
The introductory question, "Do you have any idea why these rankings are so
low, Superintendent ?" was followed, if necessary, by "Who serves in this
district as the link between your campus and the Education Service Center?" and/or
"What about having the school librarian serve as a link to public libraries?"
Regional Service Center policy calls for a building coordinator for each cam-
pus. It would seem logical that the librarian would serve in this capacity, since
much of the service provided involves learning resources. While librarians often
do act as laison, this duty is assumed by the principal in many schools. The prin-
cipal is always on duty and is often in charge of the building AV anyway.
The question of public library laison prompted discussion of the Community
Library concept in three interviews. One superintendent in a small rural town said
that communication with the public is needed: "It's a shame to shut it [the school's
15 2

library] down in the summer. It takes a certain kind of person to make it
interesting to the public, though. We want our people to read with their kids,
and a good librarian could help on this." One small school superintendent was
very positive in his response: "I'd like to see even more done. I'd like to see
her [the librarian] open the school library to the public a few hours a week to
see how it would work." Comments on more adequate utilization of existing re-
sources are typified by the superintendent from a large urban district who said:
"Using the public li'crary and other community resources is up to the teachers as
things stand now, but the librarians should do more than they are." Here, is,
again, an area in which librarians should be able to perform in a unique and use-
ful way to provide access to additional sources of learning materials.
Means for Improvement Suggestedby the Superintendent Interviews
In-service education.--In-service education was the method most generally
mentioned as the vehicle for bringing about improvement. Suggested audiences for
whom in-service education should be designed included the librarians,'the teachers,
and the school administrators. One interview respondent suggested that the instru-
ment used in Actual and Ideal Roles and Functions could serve as a needs assessment,
with in-service education modules developed in response to the needs so identified:
planning, curriculum development, multi-cultural/multi-ethnic materials, etc.
Pre-service education.--Changes in pre-service education were also suggested.
There were those who felt that the new certification plan, with its greater speci-
ficity, was very much needed for the librarians. One superintendent volunteered
that administrators need to know more about all special area teachers--counse1ors,
nurses, etc., as well as librarians; and he suggested that Schools of Education should
have a course for this purpose.
153

-11+2-
Demonstration libraries.--Demonstration libraries were suggested by one
superintendent. He felt that superintendents are, of necessity, fiscally oriented,
and probably not as aware as they should be of the place of learning resources
centers in the schools. Visits to demonstration libraries representative of differ-
ent sized districts might produce greater awareness in administration and other
school personnel. He suggested that this might well be handled through the Education
Service centers.
Outreach.--A final suggestion for bringing about improvement is the result of
participation by this investigator in the study generally and in the interviews
in particular. The communication with superintendents and their assistants has
been useful in several instances in explaining the value of appropriate participa-
tion by librarians in such activities as planning and in curriculum development.
These and other non-clerical roles and functions which form part of the librarian's
job need to be outlined to school administrators on a one-to-one basis as opportun-
ities present themselves.
154

CHAPTER VII
SUMMARY, CONCLUSIONS, AND RECOMMENDATIONS
Introduction
New standards and new certification requirements have increased the
expectations for the level of involvement of school media center personnel in
such areas as planning, accessing networks, instructional design, curriculum
development, and production of learning resources. This research study was.
conducted to provide information about the actual and the desired performance
of school librarians so that pre-service education, in-service education, and
the management of school media centers might be improved.
An attempt was made to answer the following questions: (1) How well are
librarians currently performing? How close are they coming to an ideal level
of performance? (2) Do school administrators and school librarians agree on
the current and future importance of the roles and functions set forth in the
newly adopted certification requirements for learning resources specialists
(librarians)? (3) Do various sub-groups of librarians and principals agree
on the current and future importance of these roles and functions? (4) Are
there roles and functions which are not understood by large numbers of librar-
ians and/or administrators?
A questionnaire based on the 1976 certification requirements for Texas
learning resources specialists (school librarians) was used to provide data.
The questionnaire contained 57 statements such as "The librarian participates
on curriculum planning committees." Response was obtained regarding perceptions
of both the actual and the ideal condition for each statement, thus generating
114 items for study. Response scales for statements 1-46 consisted of five-point
155-143-

low to high progressions with an additional "Don't know" option. The response
scale for statements 57-57 consisted of "Yes," "No," and the "Don't Know"
option.
A total of 814 (62%) of the surveys distributed were returned in usable
condition. Principals and librarians completed all items; superintendents
completed only items 1-46 (librarians' responsibility area), since superinten-
dents were presumed not to have direct knowledge of the librarians' performance
functions represented by items 47-114. Follow-up interviews were conducted with
a stratified random sample of fifteen superintendents drawn from the 72 superin-
tendents who responded to the survey.
The t-test for correlated samples was used to compare the perceived actual
condition with the perceived ideal condition for each statement. Analysis of
variance (ANOVA) was used to test the agreement or disagreement between respon-
dent groups and subgroups on the following hypotheses:
Null Hypothesis 1.-110: No significant rank difference exists between the
librarian's roles and functions considered desirable by superintendents and
those considered desirable by librarians.
Null Hypothesis 2.--H0: No significant rank difference exists between
librarian's roles and functions considered desirable by principals and those
considered desirable by librarians.
Null Hypothesis 3.--H0: No Significant rank difference exists between the
librarian's roles and functions considered desirable by superintendents and those
considered desirable by principals.
Null Hypothesis 4.--H0: No significant rank difference exists between the
librarian's.roles and functions considered desirable by superintendents in urban
schools and those considered desirable by superintendents in rural schools.
156

Null Hypothesis 5.--H0: No significant rank difference exists between the
librarian's roles and functions considered desirable by superintendents in large
school districts and those considered desirable by superintendents in small
school districts.
Null Hypothesis 6.--H0: No significant rank difference exists between the
librarian's roles and functions considered desirable by all secondary school
principals and those considered desirable by all elementary school principals.
Null Hypothesis 7.--H0: No significant rank difference exists between the
librarian's roles and functions considered desirable by urban secondary school
principals and those considered desirable by urban elementary school principals.
Null Hypothesis 8.--H0: No significant rank difference exists between the
librarian's roles and functions considered desirable by principals of large school
districts and those considered desirable by principals of small school districts.
Null Hypothesis 9.--H0: No significant rank differene-e exists between the
librarian's roles and functions considered desirable by all urban school principals
and those considered desirable by all rural school F acipals.
Null Hypothesis 10.--H0: No significant rank difference exists between the
14.brarian's roles and functions considered desirable by all secondary school
librarians and those considered desirable by all elementary school librarians.
Null Hypothesis ll.--H0: No significant rank difference exists between the
librarian's roles and functions considered desirable by urban secondary school
librarians and those considered desirable by urban elementary school librarians.
Null Hypothesis 12.--H0: No significant rank difference exists between the
librarian's roles and functions considered desirable by librarians of large
school districts and those considered desirable by librarians in small school
districts.
157

-1A6-
Summary of Findings
T-Test
How close are we coming to the ideal? The t-test for correlated samples
shows the ideal ranking to be significantly higher than the actual ranking for
every statement responded to by superintendents, principals, and librarians.
There is not one role or function included in this study which is now being
carried out as well as respondents think it should be.
Within this general shortfall in the performance of librarians, the
study shows that perceived gaps between actual and ideal are greater for elem-
entary principals than for secondary principals. Librarians generally have a
greater difference than administrators between their actual and ideal means on
management functions such as planning. Conversely, on service functions such
as providing materials for teachers, it is generally the administrators who
show the greater difference between their actual and ideal perceptions of the
librarian's performance.
ANOVA--Superintendents, Librarians, Principals
The null hypotheses for the three major groups were rejected in 54 instances.
One-way analysis of variance yielded significant differences between superinten-
dents and principals on 7 of 46 responsibility items, between superintendents and
librarians on 15 of 46 responsibility items, and between .rincipals and librarians
on 20 of 46 responsibility items. Librarians and principals differed significantly
on 12 of 68 performance items. The ANOVA statistic from 31 of the 206 comparisons
made to test the three basic hypotheses was not used because the assumption of
equal variances was not met (see note, page 12). Thus, of the 175 usable com-
parisons, 54 (31%) showed significant differences between groups and 121 (69%)
153

-147-
did not.
Differences between librarians and adinOistratcrs.--Librarians perceived
their current (acuual) level of performance to be significantly higt,:x than the
administrators did in areas of service such as providing teachers vith lists of
materials useful for instruction; providing multi-cultural, multi-ethnic materials;
and storing and scheduling audiovisual equipment. Statements ranked significantly
higher by librarians than administrators on the ideal scale were also generally
in service areas such as selecting, previewing, acquiring, circulating, and
evaluating materials. Two notable exceptions, related to the instructional role
of librarians, were developing listening, viewing, and responding skills and
participating on curriculum committees.
Administrators gave significantly higher actual rankings (and thus attrib-
uted more responsibility or higher performance) than librarians themselves did
for management functions such as planning facilities, preparing proposals for
outside funding, and managing campus level production of materials. Administra,
tors also gave significantly higher actual rankings to bwo instructional functiobs--
applying instructional design principles to locnily produced materials and partici-
pating on curriculum planning committees. In only two cases did administrators
project an ideal condition which was significantly higher than that envisioned by
librarians for themselves: responsibility for planning remodeled quarters and
managing campus level production of materials.
Differences between superintendents and principals.--Rankings given by
superintendents were significantly higher than those given by principals on the
statements concerned with preparing the educational specifications for new facil-
ities; planning for the floor design, furnishings, etc., for new facilities;
planning facilities for local design and production;. and formulating policies
159

-148-
for selecting print materials. Rankings given to librarians' roles and functions
by principals were significantly higher than those given to them by superintendents
only on statements related to developing listening, viewing, and responding skills
and to storing and scheduling of audio-visual equipment.
Differences between major groups not significant.--The eighteen statements for
which no significant difference was found between major groups on either the actual
or the ideal condition presuMably represent areas of agreement on the roles and
functions of librarians. Functions uniformly perceived at high levels of perfor-
mance or responsibility by the three major groups included organizing materials,
providing access to materials through a card catalog, maintaining financial rec-
ords, and supervising library staff. Functions uniformly perceived at low levels
of performance or responsibility included conducting in-service training for
teachers, developing reading and responeing skills, and providing information to
teachers on new teaching developments.
Don't Know responses, actual condition.--The frequency with which principals
and librarians indicated lack of'knowledge of the actual condition was examined.
The rate of Don't Know responses for elementary and/or secondary principals
exceeded 10%'on 13 of the 57 statements. For librarians the Don't Know rate
exceeded 10% on 7 of the 57 statements.
Both principals and librarians exceeded the 10% level of Don't Know responses
on statements 3, planning for the floor design, furnishings, etc., for new facili-
ties; 5, preparing proposals for obtaining outside funds; 36, using the systems
approach to planning; and 56, applying instructional design concepts to locally
produced materials.
160

-149-
ANOVA--Subgroups of Librarians
Differences between elementary and secondary librarians.--The rankings of
elementary librarians were significantly higher than tllose of secondary librar-
ians on the actual and/or the ideal condition for eig%t 5c,..atements. These were
mostly service oriented functions such as developing ltstening, viewing, and
responding skills; teaching students to use available materials; and promoting
the library's collections and services.
The rankings of secondary librarians were significantly higher than those
of elementary librarians.on six statements. These were, for the urst part,
management oriented functions such as gathering statistical data, applying basic
research data to management, and preparing an annual report.
The differences between urban elementary librarians and urban secondary
librarians were nearly the same as those found between all elementary and secon-
dary librarians.
In general, librarians gave higher rankings to such traditional roles and
functions as teaching students how to use library materials than they did to
management functions, such as planning, or to functions related to the produc-
tion of materials.
Differences between librarians from large and small districts.--Rankings
of librarians from large districts were significantly higher than rankings of
librarians from small districts on twelve statements. Most of these were
service oriented functions such as disseminating information on the availability
of resources, providing information on new teaching developments, and helping
students choose appropriate materials.
Librarians from small districts gave significantly higher rankings to only
four statements, all management related: providing fn-service education for staff,
161

-150-
formulating policies for selecting materials, developing acquisition procedures
for print materials, and evaluating policies and procedures.
Differences between librarians from urban and rural districts.--The sub-
hypothesis regarding responses of urban versus rural librarians could not be
tested because there were not enough responses from rural librarians.
ANOVA-- Subgroups of Principals
Difkerences between elementary and secondary principals.--The rankings
given by secondary principals were higher than those given by elementary prin-
cipals in every case where significant differences between the two groups
occurred. A little over half of the statements (29 of 57) yielded statistically
significant differences on the actual and/or ideal scale. Significant differences
were found in such areas as planning facilities, preparing proposals for funding,
obtaining resources from beyond the local campus, selecting and acquiring mater-
ials, disseminating information on resources and services, gathering and using
statistical and research data, prcviding resources for curricular and recreational
needs, and applying instructional design principles to locally produced materials._
ANOVA for urban elementary principals vs. urban secondary principals revealed
significant differences similar to those found for all secondary vs. all elemen-
tary principals.
Differences between principals from large and small districts.--Principals in
small districts gave librarians significantly higher rankings than did principals
from large districts on management related areas such as planning facilities and
preparing proposals for obtaining outside funds.
Conversely, principals from large districts save higher rankings to service
or instruction related functions such as developing listening, viewing, and
responding skills, Aucting in-service programs for teachers, helping students
16'2

-151-
choose appropriate materials, and participating on curriculum committees.
Differences between_principals from urban and rural districts.--Significant
differences were found on the rankings for 19 of the 57 statements in the compari-
son of principals from urban and rural districts. Urban principals gave the high-
er rankings for performance area statements such as disseminating information on
resources and services, gathering and using statistical and 1--esearch data, and
providing resources and materials. Rural principals, on the other hand, gave
higher rankings to responsibility area statements such as planning for the floor
design, furnishings, etc., for new facilities; preparing proposals for obtaining
outside funds; formulating policies for selecting print materials; and developing
acquisition procedures for print materials.
Superintendent Interviews
Interviews were conducted with superintendents to obtain reaction to
major findings and seek advisement on possible actions which might be desirable.
Interview areas included planning; applying for tonds; participating on curriculum
planning committees; selecting materials aud equipment; developing listening,
viewing, and responding skills of students.
Superintendent interviews indicated that the findings have face validity,
that administrators would generally welcome librarians who seek more responsi-
bility, and that admini ,trators are often ill-informed about the value of librarian
participationin curriculum planning and management.
Conclusions
The following major conclusions have been drawn from this study:
(1) Superintendents, principals, and librarians agreed that the actual conditions
in school libraries are a long way from the desired level. The groups most
163

-152-
sistently dissatisfied with librarian performance were rural principals (as
opposed to urban principals) and elementary principals (as opposed to secondary
principals). Each of these sub-groups in the study typically shares the services
of one librarian with other schools in the district, and we believe that this
part-time service accounts for the wider gaps between their perceived actual con-
ditions and their perceived ideal conditions.
(2) The three major respondent groups assigned higher actual and ideal rankings
to the librarian's responsibility for selection and acquisition of print materials
than to his/her responsibility for selection and acquisition of audiovisual mater-
ials and equipment. We conclude, therefore, that responsibility for audiovisual
materials and equipment iS less recognized as properly belonging to the librarian
than is the responsibility for print materials. Information obtained from inter-
views with superintendents indicates that library tradition, media history, and,
possibly, sex role stereotyping have combined to deprive AV equipment and materials
of a place in the libraries of many of the schools surveyed.
In a related area, we conclude that the low rankings assigned by librarians to
local production of materials and to instructional design functions reflect their
lack of training and, perhaps, a hesitancy to become involved in activities when
their role has not been clearly established.
(3) Librarians are not participating as fully in management decisions as they
could be if they were more assertive. Superintendents ane principals see opportun-
ities for librarians to assume more responsibility for management activities, such
as planning, than the librarians in this study have heretofore undertaken.
We assume that many librarians would, of necessity, have answered such manage-
ment-related statements as "The librarian participates in planning new facilities..."
from a hypothetical, rather than an experiental, perspective. These responses may
164

-153-
give us a picture, then, of how librarians think their administrators would
involve them in management decisions if an opportunity should present itself.
Since librarians believe they would be allowed to give only limited input, we
conclude that librarians do not generally see themselves as having much actual
influence with their administrators or much actual control over their working
environment.
Rankings librarians gave themselves on traditional functions such as
selecting, acquiring, and organizing materials tend to be higher than those given
to them by principals and suggest that librarians feel secure and comfortable in
these traditional areas. Conversely, the lower, rankings which librarians gave
themselves on management and production functions indicate that confidence is
lacking there.
Superintendent interviews indicate that the low level of librarian involve-
ment in planning is due, at least in part, to administrators' hesitance to ask
busy people to attend additional after-school meetings; but if librarians will
ask to be included, their participation in planning sessions will be welcomed.
(4) There is an apparent relationship between the size of the school district
and the situation of the librarian in regard to service versus management fnnctions.
While campus level librarians in large districts may have input into policy formu-
lation and procedure development, they apparently do not have primary responsibility
in these areas and therefore devote more time to day-to-day service. On the other
hand, one person may be the only librarian in a small district and may have respon-
sibility for several campuses. This apparently causes librarians in small districts
to emphasize., management functions over service functions in order to provide train-
ing and guidance for the campus-level aidc,1 and volunteers who are so essential in
these circumstances.
165

-154-
These observations do not, however, provide insight as to why librarians
in small districts have lower ideal rankings on library service statements
than do librarians in large districts. Perhaps it is a matter of lowered sights,
given the realities (money, staffing, size of collection) of their situation.
(5) The librarian is not viewed as a true colleague of the classroom teacher.
The uniformly hit actual rankings given by both librarians and principals to
librarian performance in statements 47, formulating specific objectives; 48,
circulating materials; 49, organizing materials; 51, providing access through
a card catalog or other records; 55, maintaining financial records; and 57,
supervising library staff; indicate that the btandard current expectation for
librarians is that they provide and manage an organized collection. On the other
4hand, the low rankings given to 9, designing and conducting in-service training
for teachers, 13, developing listening, viewing, and responding skills; 14, develop-
ing rea.ng and responding skills; 27, providing information to teachers on new
teaching developments; and 29, participating on curriculum planning committees
support the conclusion that !.ibrariano are not generally accepted in--anidon't, as
a group, perceive themselves in--the teaching or instructional role.
(6) Librarian activitiy in providing access to resources from beyond the local
campus is limited mainly to coordinating deliveries from, and returns to, school
district centers.
(7) The number of Don't Know responses by both librarians and principals is cause
for concern, since subordinate and superordinate relationships fare better in an
atmosphere where the roles end functions of each are known--to themselves and to
one another. An administrator's support for library acti.qties is, at least: in
part, n function of his/her knowledge o: those activities. We conclude that th
lack of formal communication from the librarian by such means as annual reports and
16

-155-
budget requests is often a contributing factor to the administrator's lack of
information.
The seven
Recommendations Drawn From the Study
or recommendations which follow are drawn from and are
parallel to the seven major conclusions, presented above.
(1) Reduction of the gap between actual and ideal conditions generally, and
alleviation of the critical needs in elementary and rural schools in particular,
can only be accomplished by more adequate staffing and resources. School admin-
istrators need a better understanding of learning resources centers before they
can argue convincingly for adequate financing. Two recommendations are offered
in this regard. First, one-to-one communication with superintendents and their
assistants is needed to explain the value of libraries generally and to promote
appropriate participation by librarians in such activities as planning and in
curriculum development. These and other nonclerical roles and functions of the
librarian need to be outlined for school adminfatrators by library supervisors,
library educators, and rdw.ation Service Center personnel.
Second, we support the establishment and identification of demonstration
libraries as suggested by one superintendent during the superintendent inter-
views. He felt that superintendents are, of necessity, fiscally oriented and
probably not as aware ns they should be of the place of learning resources centers
in the schools. Visits to demonstration libraries representative of different
sized districts could produce greater awareness in administrative and other school
personnel. The demonètration library concept could bv handled through the State
Department of Education or through appropriate regional centers.
(P) Since selecting and maintaining audiovisual materials and equipment is central
to the concept of a unified media center, pre-service and in-service education for
1 6 7

-156-
Learning Resources Specialists and for all other school personnel must recognize
and support the learning resources specialists' responsibility in this area.
In-service education on new production methods and instu.Lional design prin-
ciples should be offered to help librarians achieve the competencies specified
in the certification requirements. We recommend that all education efforts in
this regard emphasize the development of appropriate role perceptions on the
part of the learning resources specialists themselves.
(3) Since administrators indicated a willingneis for librarians to assume more
responsibility for planning, librarians should reassess their current activities
and prepare to provide more input to administrative planning for school libraries.
Toward this end, pre-service and in-service education should include instruction
in, for example, data gathering, so that librarians will know what data are to:be
gathered, how to gather data, and how the data can be used to provide information
for management decisions and/or to provide justification for requests to school
administrators.
(4) Curriculum planners for pre-service library education should provide pro-
grams which recognize and address such differences as those found between large
school districts and small school districts.
(5) It has long been an assumption of leaders in the school media field that
librarians are faculty rather than support staff. One important way that in-
service librarians can demonstrate their commitment to a faculty role is by
actively seeking greater involvement in curriculum planning and development, and
we strongly recommend thatythey do so. This will mean that some librarians will
have to quit getting satisfaction from having people say, "Look at our poor, over-
worked librarian; she is doing so much we couldn't ask her to do any more," Some
will have to be more aseertive and say "T would like to attend the curriculum
planning sessions because I need to be there to do my job right, and you lived mv
168

-157-
there to do the curriculum planning right." And many librarians will need to
take the time and the effort to learn about approaches to instructional design
so they can be contributing participants in t"ct process..
(6) Librarians should increase their efforts to provide access to additional
sources of learning materials by establishing formal links with public libraries
and other community resources. The responsibility for providing interlibrary!
loan service should be assumed by the librarian. Furthermore, the librarian is
the logical person to provide centralized coordination of access to community
resourtes, even though counselors a: _eachers may also maintain files pertinent
to their activities.
(7) An annual report either to an administrator or to a library supervisor can
be a valuable tool; and the merits of preparing such a report, along with prep-
aration guidelines, should be presented in pre-service and in-service education.
Recommendations for Further Research
(1) We have suggested that staffing is the. key factor in perceptions of roles
and functions. A study using data obtained from the current study is planned to
compare responses from districts which have full-time elementary librarians
in every school with those where one librarian servces two or more schools to
see what effect full versus part-time staffing has on the way elementary prin-
cipals view the roles and functions of librarians. The proposed study will also
compare responses from districts which have school library supervisors with those
which have none.
(°) Those who go into school administrr.tion need to know more about what
they should bo able to expect from librarians, and a curriculum study tn investi-
gate means for providing this information in the pre-service education programs for
school administrators ahould be undertaken.
169

(3) This study was a cooperative effort of a university and its library
school, state education agencies, and school districts ranging in size from
Dallas and Fort Worth down to single campus rural schools. It included a geo-
graphic area of 14,166 square miles--a little larger than Maryland and Deleware
combined--with a population of 2,659,300. We believe, therefore, that the infor-
mation presented here can be generalized to a wider population. It seems logical
that planned, co-ordinated replication of this study would be useful, however,
since there is a need for some means to cumulate information to serve as a base
line for planning at the local, area, or state-wide levels. Needs assebsments
have been done in various ways in variuos places, but there is no way to cumu-
late and synthesize compatible data from a large number of locations to provide
valid generalizations at state, regional and national levels. These wider gener-
alizations would be of particular interest to officers of national associations
such as AECT, AASL, and NASSP and to educational programs preparing media special-
ists capable of working effectively in any section of the country.
170

APPENDIX I
SURVEY INSTRUMENT AND COVER LETTERS
171

-16o-
NORTH TEXAS STATE UNIVERSITY SCHOOL OF LIBRARY AND INFORMATION SCIENCESAND
EDUCATION SERVICE CENTERS TEN AND ELEVEN
STUDY OF ACTUAL AND IDEAL ROLES OF SCHOOL LIBRARIANS
DIRECTIONS:
The following statements represent areas of responsibility and performanceidentified for the campus level librarian (learning resources specialist) in therecently developed "Guidelines for the Preparation of the Campus Learning ResourcesSpecialist" prepared for submission Ll'the State Board of Examineis for TeacherEducation.
Please complete the survey tutrumint by indicating for each statement:1. Your perception of the actual condition in your school or district in the
left hand scale,2. Your judgment as to the ideal condition for that role or function in the
right hand scale.
Responses will be tabulated by computer. Disregard computer instructionsrepresented by bracketed numters such as [14] appearing throughout.
1Computer Use
AREAS OF RESPONSIBILITYActual Level ofResponsibility Ideal Level of
Responsibility
H0-41-1
H1-41-1 1-4
1-1I-41-1get pa
pa pa1(74 (1711 .3 H H H
En tn 08 ,11 8 ro4 F) 8 0'74o4 H o4 H H o4 H o4 H Htn Pt1 rn 1.4 tn V) 14 V) t..4 CnMg174 M 1g17:1 .8
'14 I. . r.40 Cn r.4 Cn Cn 0 V) (4 (1) C/3Z Z I-1 Z Z $4 Z r42. ,,,48 Mg R4 S R4
8 M N 8 44 el g Ai i41
0 Cn C/3 (4
E- 2 6 0 0 r 2 6 0Hoop° Hoop o'AM AA6 En En C/3 C/)< 4 4
[13] 0 1 2 3 4 5
[14] 0 1 2 3 4 5
§
1.
forthe
The librarian has responsibilityformulating long range plans forlibrary.
[15] 0 1 2 3 4 5
2. When new or remodeled library [16] o 1 2 3 4 5
facilities are needed, the librarianhas responsibility for preparing theeducational specifications for them.
172BE SURE TO COMPLETE BOTH SCALES

-161-
AREAS OF RESPONSIBILITY
Actual Level ofResponsibility Ideal Levet of
Responsibility
H H H HH H H HH H H H HM M o4 M M 1.4
ai ,--, rli H H Ai H Ai H HC/3 ,..4 cr) 1-1 c/3 al 1-1 VI 1-4 CA
L1 IPCI E. 411-1 cm H z. P:1 m IA 0H H Ai H Hcn
Vs.1 c/1 0 cnAla0 C/3 rI6 ,.4 C/3Z Z s-1 Z 430 P:1 0 imc4 P4 5 Ai Ai .114 r340 C/3 CA r 0 . c4 cn p.3
gcamaim 43 gc.3 2 F33
41 W 41
n 0 cl 6 D 0 i CIH 6C..)
(-I
.2z
-1 C/3 U
c43
C-3
[17] 0 1 2 3 4 5
[18] 0 1 2 3 4 5
[19] 0 1 2 3 4 5
[20] 0 1 2 3 4 5
[21] 0 1 2 3 4 5
(22] 0 1 2 3 4 5
H-
§
1-7 cn C.) x
3. When new or remodeled libraryfacilities are planned, the librarianhas responsibility for planning forthe floor design, furnishings, etc.
[23] 0 1 2 3 4
4. The librarian has responsibilityfor planning facilities for localdesign and production of learningresources.
[24] 0 1 2 3 4
5. When funds are available fromsources outside the local district,the librarian has responsibility forpreparing proposals for obtainingthem.
[25] 0 1 2 3 4
6. The librarian has responsibilityfor coordinating deliveries and re-turns of materials from the schooldistrict's center. (Answer only ifyour district maintains a districtlearning resources center)
[26] o r 2 3 4
7. The librarian has responsibilityfor coordinating deliveries and re-turns of materials from the regionalservice center.
[27] 0 1 2 3 4
8. The librarian has responsibility [28] 0 1 2 3 4for providing for use of materialsfrom outside the school by activitiessuch as Interlibrary Loan and main-taining a community resources file.
173
5
5
5
5
5

AREAS OF RESPONSIBILITY
Actual Level of Ideal Level of'11222nalaiLLE Responsibility,
.,H H H HH H H HPI C13 PI PIH H H H H Hg g
cn cn 4Z D.I Z D.I HOH OH XI041-4C4H H C4HC41-1Hcn I..) cn 1..4 cn cn 1.4 cn I..) cnM C1741 V C1-14 6 41114.11-1Z
1:4 0:1 IZ 13:1 0H H 114 H H ck,
2 ca N ti) ti00 cn cn cnz 6 6 mg 44 S 04cd P.1 4.4 A40 cn cn Eil 0 cn 04 cn 4.1
gc=3 M'41 M41 V 2 M t=1H
.... 00.0C.)
E - I I) CC?) 8 R 8§
Cl, Cl Cl Cl Cfl
1[29] 0 1 2 3 4 5 9. The librarian has responsibility [37] 0 1 2 3 4 5
for designing and conducting in-service training programs for teachers.
[30] 0 1 2 3 4 5 10. The librarian has responsibility [38] 0 1 2 3 4 5
for providing in-service education forthe library staff (including volunteers).
[31] 0 1 2 3 4 5 11. The librarian has responsibility [39] 0 1 2 3 4 5
for campus level production of materialsthat aid teachers in the classroom.
[32] 0 1 2 3 4 5 12. The librarian has responsibility [40] 0 1 2 3 4 5
for teaching students haw to produceaudio-visual materials.
[33] 0 1 2 3 4 5 13. The librarian has responsibility [41] 0 1 2 3 4 5for developing the listening, viewing,and responding skills of students.
[34] 0 1 2 3 4 5 14. The librarian has responsibility [42] 0 1 2 3 4 5for developing the reading and res-ponding skills of students.
[35] 0 1 2 3 4 5 15. The librarian has responsibility [43] 0 1 2 3 4 5for formulating and recommending foradoption policies for the evaluationand selectfrn of audio-visual materialsfor the collection.
[36] 0 1 2 3 4 5 16. The librarian has responsibility [44] 0 1 _2 3 4 5
for formulating and recommending foradoption policies for the evaluationand selection of library books, pe-riodicals, and other print materialS-for the collection. i74

Actual Level ofResponsibility
cn
[45] 0 1
[46] 0 1
[47] 0 1
[48] 0 1
[49] 0 1
[50] 0 1
[51] 0 1
-163-
AREAS OF RESPONSIBILITY
Ideal Level of
Responsibility
H H HO 0 0H t >4 H Hal E-f al goH H H H HCg
0ocal i cn
80Hal04 H 1-4
ci IC i ECnH 04
Ncn C / I 0
ZCIfI
g 1046
en E z I ao nCa4 iS ct4 N43 e-fc-,la 43 m 43 4H 0 H=
Cg C00 n 0C .
O) f . . .,
!. 1o cn 0 0
cn cn cn A cn cng g g a g 'il g2 3 4 5 17. The librarian has responsibility [52] 0 1 2 3 4 5
for evaluating and selecting audio-visual equipment.
2 3 4 5 18. The librarian has responsibility [53] 0 1 2 3 4 5for making adequate provision forpreviewing materials being consideredfor the collection.
2 3 4 5 19. The librarian has responsibility [54] 0 1 2 3 4 5for developing and implementing pro-cedures for acquisition (by purchase,exchange, or gift) of print materials.
2 3 4 5 20. The librarian has responsibility [55] 0 1 2 3 4 5for developing and implenenting pro-cedures for acquisition of audio-visual materials.
2 3 4 5 21. The librarian has responsibility [56] 0 1 2 3 4 5for acquiring audio-visusl equipment.
2 3 4 5 22. The librarian has.rnsponsibility [57] 0 1 2 3 4for the storage and scheduling ofaudio-visual equipment.
2 3 4 5 23. The librarian has responsibility [58] 0 1 2 3 4 5
for developing policies and proceduresfor maintenance of audio-visual equip-mnnt.
END OF RESPONSIBILITY AREAS
Note that Performance Area I follows with different response categories.
17 5

Actual Performance
-164-
PERFORMANCE AREA I
154
Ideal Performance
P4-3
UH.tE-1
-3
N <F
M i0 z
rj)r44
0
'F1 M
ifig z3 E-Iu
A
iM44
E-0 c4
C=1 1 0 EI.. 0
[59] 0 1 2 3 4 5
[60] 0 1 2 3 4 5
[61] 0 1 2 3 4 5
[62] 0 1 2 3 4 5
[63] 0 1 2 3 4 5
[64] 0 1,2 3 4 5
[65] 0 1 2 3 4 5
[66] 0 1 2 3 4 5
24. The librarian disseminatesinformation to students andteachers on the availability ofmaterials, equipment, and re-sources in the library.
25. The librarian promotes thelibrary's collections and servicesby such means as displays, booktalks, and classroom presentations.
26. The librarian disseminates in-formation to students and teacherson effective use of materials andequipment.
27. The librarian provides infor-mation to teachers on new teachingdevelopments and practices.
28. The librarian provides teacherswith lists of materials useful ininstruction.
29. The librarian participates oncurriculum planning cormnittees.
30. The librarian designs infor-mation systems to meet the needsof students and teachers.
31. The librarian helps studentschoose appropriate materials tomeet learning needs.
[67] 0 1 2 3 4
[68] 0 1 2 3 4
[69] 0 1 2 3 4
[70] 0 1 2 3 4
[71] 0 1 2 3 4
[72] 0 1 2 3 4
[73] 0 1 'd 3 4
[74] 0 1 2 3 4
5
5
5
5
5
5
5
5

..........
Actual Performance
-165-
PERFORMANCE AREA I
CC 1 2
DUP 2-1'!
!Computer Use]
[13] 0 1 2 3 4 5 32. The librarian teaches stu-dents how to use materials avail-able in the library.
[14] 0 1 2 3 4 5 33. The librarian applies learn-ing theories to the evaluation ofmaterials for inclusion in thecollection.
[15] 0 1 2 3 4 5 34. The librarian evaluates ma-terials for inclusion in the col-lection by utilizing suggestionsfrom administrators and teachers.
[16] 0 1 2 3 4 5 35. The librarian incorporatesnew production methods into theproduction of media.
[17] 0 1 2 3 4 5 36. The librarian uses the sys-tems approach to the study anddesign of library services.
[18] 0 1 2 3 4 5 37. The librarian gathers statis-tical data for use in managing thelibrary.
[19] 0 1 2 3 4 5 38. The librarian applies basicresearch data reported in the lit-eratme to the management of thelibrary.
[20] 0 1 2 3 4 5 39. The librarian plans and con-ducts research pajects to provideinformation for decision mating.
[21] 0 1 2 3 4 5 40. The librarian reads profes,-sional publications to keep ab-reast of developments in the field.
Ideal Performance
o-I
E-1
44 >4
8 8D m Fig>4 C1.1>4
."z 8"8
[22] 0 1 2 3 4 5
[23] 0 1 2 3 4 5
[24] 0 1 2 3 4 5
[25] 0 1 2 3 4 5
[26] 0 1 2 3 4 5
[27] 0 1 2 3 4 5
[28] 0 1 2 3 4 5
[29] 0 1 2 3 4 5
[30] 0 1 2 3 4 5
END OF PERFORMANCE AREA IPerformance Area II follows with different res onse cate ories.
1.77

-166-
PERFORMANCE AREA II
Actual Performance Ideal Performance
Z Z0 0H Hrn Z rn ZZ Z 11 0 HO0 0 ..> H 6 62H H 0 CIIcn ci) HH H 114 >Z > > 00 0 0 IAH
rn 04 04 HH E-I ya>2 E-I zl8 Q H E-I cn
Z MI'A 0 H -cX Z Z 1'4 rn 0E-I cn cn cn cn cn
-ping"[31] 0 1 2
[32] 0 1 2
[33] 0 1 2
[54] 0 1 2
[35] 0 1 2
[36] 0 1 2
3 4 5
3 4 5
3 4 5
3 4 5
3 4 5
3 4 5
Z2 2 2 grn 04 04 1.4
E-I N
r14418 5D 2 Z Q. E-n 8
H H 0 CriC./) cn 4:4 HH H> > 0
E-Icncncncncn
1 H0
41. The librarian makes provisionfor evaluation of the library'spolicies and procedures.
[37] 0 1 2
42. The librarian makes provisionfor reference services for thestudents and teachers in the school
[38] 0
43. The librarian makes provisionfor resources which will supportthe school's curricular program.
[39] 0 1 2
44. The librarian makes provisionfor materials to meet the recre-ational needs of the students.
[40] 0, 1 2
45. Me librarian makes provisionfor professional materials to meetthe needs of teachers and admini-strators.
[41] 0 1 2
46. The librarian makes provision [42] 0 1 2for multi-cultural and multi-ethnicmaterials.
3 4 5
3 4 5
3 4 5
3 4 5
3 4 5
3 4 5
END OF PERFORMANCE AREA II
Performance Area III follows with different res onse cate ories.
178

-167-
PERFORMANCE AREA III
Actual Performance Ideal Performance
8 8n. .-. . .8 2 § 41 0. z
f43] o 1 5 47. The librarian formulates and [54] 0 1 5is guided by specific objectivesfor the library.
[44] 0 1 5 48. The librarian provides ade- [55] 0 1 5quate procedures for circtlatingprint and audio-visual materials.
[45] 0 1 5 49. Print materials are organized [56] 0 1 5according to the Dewey Decimal orother accepted classificationsystem.
[46] 0 1 5
[47] 0 1 5
[48] 0 1 5
[49] 0 1 5
50. Audio-visual materials are [57] 0 1 5organized according to the Deweydecimal or other accepted class-ification system.
51. Access to print materials isprovided through a card catalogand/or other records.
52. Access to audio-visual mat-erials is provided through a cardcatalog ard/or other records.
53. The librarian prepares anannual report on the progress andactivities'of the library.
[58] 0 1 5
[591 0 1 5
[60] 0 1 5
[50] 0 1 5 54. The librarian prepares an [61] 0 1 5annual budget xequest.
[51] 0 1 5 55. The librarian maintains [621 0 1 5financial records to show campuslevel allocations and expenditures.
[52] 0 1 5
[53] 0 1 5
56. The librarian applies instruc- [63] 0 1 5
tional design principles to the des-ign of locally produced materials.
57. The librarian provides ade- 1641 o 1 5quate supervision of the librarystaff (including volunteers).
Thank you for participating. Please return the completed survey to Dr.Fred C. Pfister, School of Library and Information Sciences, North Texas StateUniversity, Denton, Texas 76203.
179

-168-
Dear Librarian,
Education Service Centers Ten and Eleven are cooperatingwith North Texas State University in a faculty research study,"Actual and Ideal Roles and Functions of Texas School Librar-
- ians as Perceived by School Superintendents, Principals, andLibrarians". The study is an attempt to provide a realisticbase of information for planning pre-service and in-serviceeducation of school librarians by asking, (1) what are schoollibrarians doing naw, and (2) what should they be doing?
Your superintendent of schools has given permission toconduct the study in your district. I am enclosing a quest-ionnaire survey for your response and return to me in theself-addressed, postage paid envelope on or before February20, 1976. The anonymity of survey participants will be pro-tected by removing all identification when the surveys areprocessed, and no individual or school will be identifiablein the data summary.
Your thoughtful response to the survey form will be asignificant contribution to the information base we are seek-ing to establish. Allow me to thank you in advance for yourconsideration and cooperation.
FCP:lb
Sincerely yours,
North TexasState
University
Denton. Texas78203
School ofLibrary andInformation
Sciences
Fred C. Pfister, ph.D
Associate Professor
180
A/ 2111t AO, eIV 'Me ,P

-169-
Dear Principal,
Education Service Centers Ten and Eleven are cooperatingwith North Texas State University in a faculty research study,"Actual and Ideal Roles and Functions of Texas School Librar-ians as Perceived by School Superintendents, Principals, andLibrarians". The study is an attempt to provide a realisticbase of information for planning pre-service and in-serviceeducation of school librarians by asking, (1) what are schoollibrarians doing now, and (2) what should they be doing?
Your_superintendent of schools has given permission toconduct the study in your district. I am enclosing a quest-ionnaire survey for your response and return to me in theself-addressed, postage paid envelope on or before February20, 1976. The anonymity of survey participants will be pro-tected by removing all identification wh1n.the surveys arcprocessed, and no individual or school will be identifiablein the data summary.
Your thoughtful response to the Jurvey form will be asignificant contribution to the information base we are seek-ing to establish. Allow me to thank you iu advance for yourconsideration and cooperation.
FCP:lb
Sincerely yours,
Fred C. Pfister,c(.D441Associate Professor
181
N.T. Box 13796 AC 817-788-2445
North TexasState
University
Denton, Texas76203
scnoor orLibrary andinformation
Sciences

School of.Library andInformation SciencesNorth Texas State UniversityN. T. Box 13796Denton, Texas 76230September 16, 1975
Education Service Centers X and XI are cooperating with North Texac State
University in a faculty research study, "Actual and Ideal Roles and Functions
of Texas School Librarians4. I have enclosed a summary.of the study and will
provide further information should you request it. The stildy will seek infor-
mation from sChool superintendents, principals, and school litrarians in
Education Service Regions X and XI. When completed, IA will provide data
useful for evaluating the practical value cf school library certification
programs and for Education Service Center piannIng of in-service education
programs. As is customary, the anonymity of respondents will be protected
when the findings are reported.
May I have your permission to mail a questionnaire survey to you and to
the principals and librarians in y3ur dl.strict in January 1976? Your support
in 'this regari would certenly be appreciated.
Sincerely yours,
182

Dear Superintendent:
Pledse fill out the first 23 item' :! zhe survey and return r
questionnaire at your earliest convenierwe, iAnd not later thanFebruary 20, 1976. If you are willing to the principalslibrarians in your district participate, 71,xc Ail be delayed i.returning your own survey form, we Would epprolYte an early r'lz.arnof the authorization printed below.
The sgrvey on "Actual and Ideal Roles of School Librarians"as Perceived by Superintendents, Principals, and Librariansmay be mailed to the principals and librarians in thisdistrict.
(Signature)
183

APPENDIX II
A COMPARISON OF ACTUAL RANKINGS WITH IDEAL RANKINGS:
DATA FROM THE T-TEST FOR CORRELATED SAMPLES
184

T-TEST FOR CORRELATED SAMPLES FOR 324 LIBRARIANS
STATEMENT ACTUAL CONDITION IDEAL CONDITION DIFFERENCE TEST
MEAN STANDARD
DEVIATION
MEAN STANDARD
DEVIATION
MEAN STANDARD
DEVIATION
3.00617 1.24417 3.89815 0.70741 -0.89198 1.11452 -14.40575 0,00001,90432 1.32613 3.71914 0,83544 -1.81481 1.36847 -23,87087 0.0000
; 1 79938 1.30011 3.72222 0.83462 -1.92284 1.38889 -24.92000 0.00001.73148 1.26349 3.20062 1.18290 -1.46914 1.34313 -19.68867 0.00001,37037 1.29724 2.70679 1.36876 -1.33642 1.38583 -17.35822 0,00002.09864 2.06241 2.30556 2.06605 -0.24691 1.06775 -4.16245 0.0000
7 2.34877 1.77843 2.84877 1.70738 -0.50000 1.42403 -6.32009 0,00002.25309 1.62340 3.17901 1,51527 -0.92593 1.37674 -12.10585 0,0000
0 1,59568 1.02603 2.49383 1.18163 -0.89815 1.07554 -15.03127 Immo10 3.66358 1.71348 4.17284 1.32179 -0.50926 1,34345 -6.82321 0.000011 1.88889 1.21650 2.69136 1,27021 -0.80247 1.11749 -12.92578 0.000012 1.69753 1.26192 2.62346 1.36527 -0.92593 1.27396 -13.08255 0.000015 1,89198 1.08639 2.50617 1,15513 -0.61420 0.97773 -11.30735 0.000014 1,86111 1,00886 2.34259 1 12249 -0.48148 0.87428 -9.91294 omoo15 2.83642 1.50575 3.69444 i.o3611 -0.85802 1.28995 -11.97283 0.0000lc 3.91975 1.23408 4.20679 0.84959 -02704 0.97699 -5.28836 0.000017 2.41049 1.42338 3.41975 1.12241 -1.00926 1.25283 -14.50055 0.000018 2.79012 1.50924 3,66049 1.15468 -0.87037 1.23237 -12.71258 0.000019 3.30926 1.51051 3.98148 1.0614f -0.47222 1.09424 -7.76793 0.000020 2.57037 1.59775 3.7i605 1.18802 -0.84568 1.34956 -11.27940 0.000021 2.17901 1,55358 3,21296 1.25940 -1.03395 1.31745 -14.12657 0.000022 5.76235 1.58231 4.00617 1.30965 -0.24383 1.30460 -3.56417 0.0009
2.12840 1.65256 3.42593 1.3957 -0.69753 1.36787 -9.17889 0.000024 4.17284 0.85536 4,66667 0.79472 -0.49383 0.78094 -11.38228 0.000025 3.66975 1.0i)690 4.57346 0.93738 -0.70370 1,08971 :11.52384 0.0000
5.55864 1.07589 4.29012 0.92225 -0,73148 0.97910 -13.44774 0.0000fyiL, 48i45 1.22776 3.16975 1.41165 -0.68827 1,06958 -11.58290 0.000028 3.42901 1.11195 4.10c02 1,02782 -0.67901 1.06247 -11.90357 0,000029 1.97840 1.27957 5.85494 1.28118 -1,87654 1.5065o -22.42137 0.000030 2,59568 1.60498 3.50300 1.65527 -0.90741 1.23321 -13.24455 0.0000
185180

T-TEST FOR CORRELATED SAMPLES FOR 324 LIBRARIANS, continued
STATEMENT ACTUAL CONDITION IDEAL CONDITION DIFFERENCE TEST
MEAN STANDARD
DEVIATION
MEAN STANDARD
DEVIATION
MEAN STANDARD
DEVIATION
Yirrowa
31 4,29012 0,80388 4.54938 0,80288 -0,25926 0,69099 -6.75359 moo32 4.32716 0.91652 4.64815 0.91070 4.32099 0,83762 -6.89788 m00°33 3.98457 1.26506 4,36420 1.13080 -0.37963 0,89079 -7,67105 moo34 4.40432 0.87630 4.50926 0.97804 -0,10494 0,70914 -2,66362 0,0081
35 2.52160 1.44972 3.57407 1.47971 -1.05247 1.32622 -14.28459 moo°36 2.25000 1.73718 2.79630 1.99578 -0.5463o 1.11325 -8.83296 0.0000
37 2.94136 1.52572 3.65432 1.42868 -0.71296 1,20410 -10,65801 0,0000
38 2.86111 1.37283 3.62346 1.36754 -0,76235 1.07130 -12,80897 0,0000
39 2.04938 1.24569 3.00926 1.46261 -0.95988 1.27184 -13.58485 Immo40 4.19444 0.93892 4.6821 0.77949 -0.48765 0,84559 -10.38069 o.0000
41 3.14815 1.30359 4.04012 1.16513 -0.89198 1.07493 -14.93636 0,0000
42 4.23765 0.92556 4.49383 0,88501 -0.25617 0,75422 -6.11375 0,0000
43 4.06481 0.93709 4.41667 1.00271 -0.35185 0,84730 -7.47470 0,0000
44 3.85494 1.16473 4,21296 1.07649 .0,35802 0.74333 -8.66972 omoo45 3.25926 i.13790 4.06790 1.05059 -0,80864 1.05004 -13.86188 0.0000
h6 3.73765 1.09417 4.172E4 1.02344 -0.43519 0.90687 -8.63778 0.0000
187 188

T-TEST FOR CORRELATED SAMPLES FOR 418 PRINCIPALS
STATEMENT ACTUAL CONDITION IDEAL CCNDITION DIFFERENCE TEST
EAN STANDARD
DEVIATION
MEAN STANDARD
DEVIATION
MEAN STANDARD
DEVIATION
3.00000 1.14845 3.60526 0.92120 -0,60526 0,96940 -12.76528 0.0000'2 2.23684 1.31177 3.36603 0.98793 -1.12919 1.22624 .18.82694 0.00003 2.05509 1.34800 3.30383 1.00647 -1.24880 1.27710 -19.99200 0.00004 2.15311 1.28280 3.19378 1.11594 -1.04'1;7 1.14250 -18.62287 0.00005 1.76555 1.41339 2.81818 1.36079 -1.05263 1.22214 -17.60936 0.00006 2.22967 r-::.02854 2.50478 2.06750 -0.27512 0.89142 -6.30996 0.00007 2.34928 1.74584 3.05024 1.66495 -0.70096 1.19513 .11.99121 0.00008 2.07656 1.54512 3.16926 1.46E24 -1.09330 1.30426 .17.13809 0.00009 1.73206 1.05256 2,51914 1.14463 -0.78708 0,98921 -16.26743 0.0000
10 3.41388 1.58485 3.99043 1.23688 -0.57656 1.10161 -10.70040 0.000011 2.14833 1.25693 3.03110 1.25673 -0.88278 1.08096 -16.69659 0.000012 1,76316 1.22284 2.77033 1.31396 -1.00716 1..11774 -18.42265 0.000013 1,97847 1.07378 2.69378 1.15138 -0.71531 0.94,846 -15.41931 0.000014 1.79187 0.95321 2.45215 1.09451 -0.66029 0.91584 -14.74020 0.000015 2,54785 1.30627 3.28469 1.05839 -0.73684 0.98069 -15.36137 0.000016 3.46172 1.22903 3,91148 0.93137 -0.44976 0.94887 -9.69091 0.000017 2.52632 1.27154 3.1770,3 1.08057 -0.65072 0.90695 -14.66894 0.000018 2.87321 1.31061 3.56459 1.02107 -0.69139 0.97841 -14.44736 0.000019 2.75598 1.46019 3.32775 1.25625 -0.57177 0.93077 -12.97767 0.000020 2.55024 1.36718 3.19617 1.19342 -0.64593 0.94399 -13.98965 0.000021 2,27990 1.30508 2.89234 1.28275 _0.61244 0.94858 .13.20017 0.000022 3.32775 1.53465 3.80861 1.23759 -0.48086 0.99441 .9.88655 0.000023 2.51914 1.46776 3.13397 1.36985 .o.61483 1.03301 .12.16855 0.000 r'
24 3.82057 1.09451 4.51675 0.78716 -0.69617 0.90617 -15.70714 0.0000,25 3.69378 1.18018 4,41866 '083928 -0.72488 0.967- -15.29796 0.000o26 5.39713 1.12746 4.19617 0.88677 .0.79904 0.95601 .17,08P18 0.000027 2.29187 1.17569 3.21770 1.27246 -0.92584 1.06244 -17.81633 ()g0028 5,18900 1.25240 4.06938 1.02836 -0.88038 1.05032 -17.13720 0.000029 2.47368 1.38700 3.60287 1.24665 .1.12919 1.25140 -18.44834 mom30 2.68660 1.39882 3.66029 1.35866 -0.97368 1.10233 -18.05903 0.0000
189 190

T-TEST FOR CORRELATED SAMPLES FOR 418 PRINCIPALS, continued
STATEENT ACTUAL CONDITION IDEAL CO6ITION DIFFERENCE TEST
MEAN STANDARD MEAN
DEVIATION
31 3.72727 1.13470 4.28469
32 4.10048 1..02227 4.54545
33 3.01914 1.57304 3.94258
34 5.80861 1.24146 3.45646
35 2,49522 1,53808 3.47847
36 2.06938 1,83033 2.96651
;72.41627 1.70594 3.46890.,,
38 2.30144 1.70626 3.3516770
1,72967 1,37505 2,93062ii
40 :3.33493 1.68866 4.31579
41 2.95215 1.49743 3.93780
42 3,67703 1.29507 4.236811
.63876 1.17370 4 25120
4 5.19139 1.38568 3.88278
45 3.14593 1,22924 4.04785
16 3.41,737 1.28573 4.04067
191
STANDARD
DEVIATION
MEAN STANDARD
DEVIATION
0.87206 -0.55742 0.84411 -13,50108 0,0000
0.79512 -0.44498 0.81831 -11,11753 0.0000
1.27945 -0.92344 1,28592 -14.68197 0.0000
0.92641 -0.54785 0.95654 -11.70964 0.0000
1,54105 -0.98325 1.20240 -16,71881 0.0000
1.99251 -0.89713 1.36290 -13.45795 0.0000
1.57170 -1.05263 1.39788 -15.39557 0.0000
1.68596 -1.05024 1.43938 -14.91768 0.0(k0
1.5784 -1.20096 1.34211 -18.29486 0.0000
1.05748 -0.98086 1.48360 -13.51695 0.0000
1,i9790 -0.98565 1.30477 -15.44451 0.0000
1,05207 -0.55981 0.91222 -12. 54666 pm0.92995 -0.61244 0.88853 -14.09223 0,0000
1.18873 -0.69139 0.99301 -14.23498 0.J000
0.94836 -0.9019! 1,04913 -17.57620 0.0000
1.04148 -0.59330 0.95819 -12.65933 0,0000

T-TEST FOR CORRELATED SAMPLES FOR 72 SUPERINTENDENTS
STATEMENT ACTUAL CONDITIONIDEAL CCEDITION
DIFFERENCETEST
MTAN STANDARD
DEVIATION
MEAN STANDARD
DEVIATION
1 5,2361i 1.1o687 3.69444
2.83333 A.19859 3.541677
2.66667 1.16280 3.083314 2,70833 .1 1.29395 3305565 2.08333 1.30815 2.86111
0.79167 1.62669 187500
2,02778 1.60081 2.80556
2.12500 1..50059 3.194440 1.56944 0.97614 2.25000
lc J1l1l 1A8302 3.87500U. 'e.30000 1.28917 2.8333312 1.41667 1,01745 2.5694413 1.66667 0,9293 2.4027814
1.,)5278 3,5843 2.2777815 2.50000 1.28917 3.2083316 3.61111 1.26219 3.9444417 2:50556 1.31769 28194418 5.12500 1.24400 3.5833319 3.00000 1.37380 3.3333320 2.50000 1.39415 3.0972221 1.97222 1.29975 2.6388922 2.75000 1,56322 3.4444423 2.23611 1 27260 2,95833
Superintendents did not answer statements 24-57.
0.92901
1.00614
0.99205
1.15842
1.45646
1,78363
1,88873
1.64992
1,23048
1.40359
1.42414
1.44209
1.33912
1.24722
1.25527
1.18546
1.29274
1.19565
1.34269
1,36516
1.27053
1.41311
1.56802
193
MEAN STANDARD
DEVIATION
-0.45833 1.13755
-0.70833 1.10616
-0.79167 1.22115
-0.59722 1.12162
.0.77778 1.25846
-0.08333 0.76453
-0.7778 1,36708
-1.06944 1.39745
-0,68056 0.99047
-0.76389 1.38902
-0.83333 1.16280
-1,15278 1.19459
:40.73611 1.06140
-0.62500 0.99912
70.70833 1.09335
-0.33333 1.17485
-0.51389 0.90372
-0.45833 1.06066
-0,33333 1.07468
-0.59722 1.02997
-0.66667 1.13832
-0.69444 1.12135
-0.72222 1.14107
- 3.41884 0.0010
- 5.43358 0.0000
-5.50099 0.0000
-4.51813 0,0000
-5.24423 0.0000
-0.92489 0.3582
-4.7960o loom-6.49366 0.0000
-5.83029 0.0000
-4.66646 0.0000
-6.08105 0.0000
-8.18832 0.0000
- 5.88480 0.0000
- 5.30798 0.0000
-5.49722 con-2.40747 0.0187
-4.82506 0,0000
-3.66667 0.0005
-2.63189 0.0104
-4.92014 0.0000
-4,96947 0,0000
-5.25486 0,0000
-5.37064 0,0000
194

APPENDIX III
SUPERINTENDENTS INTERVIEWED
1
19 5
-178-

SUPERINTENDENTS INTERVIEWED
School District Date ofInterview
Person Interviewed
Sam Rayburn(Ivanhoe)
Whitewright
Denton
Muenster
Callisburg(Gainesville)
Denison
Plano
Allen
Mineral Wells
Northwest(Justin)
Maypearl
Mesquite
Lewisville
Ponder
Boyd
3/26/76
3/26/76
3/29/76
3/30/76
3/30/76 .
- 4/2/76
4/6/76
4/6/76
4/13/76
4/14/76
4/16/76
4/20/76
4/20/76
4/21/76
4/23/76
196
B.J. Mathews
Superintendent
Richard L. CappsSuperintendent
Robert McGee_
Superintendent
L.B. Bruns
Superintendent
Rufus D. MooreSuperintendent
Bill K. Ford
Superintendent
Bill HolifieldCurriculum Director
D.L. RountreeSuperintendent
Bill Hall
Superintendent
Truett WilsonS.,)%intendent
Ma Innie.intendent
J.C. CAnnadavAsst. Supt. Secon-dary Schools
Glayton DowningAsst. Supt. IorCurriculuM
Archie M. Scott
Superintendent
Larry Enis
Superintendent

BIBLIOGRAPHY

BIBLIOGRAPHY
American Association of School Librarians. Certification Model for ProfessionalSchool Media Personnel. Chicago: American Library Association, 1976.
American Association of School Librarians and Associatiljfor Educational Communi-cations and Technology. Media Programs: District and School. Chicago:American Library Association, 1975.
Anderson, Carolyn Joyce. "Role Expectations of the High School Librarians asPerceived by Librarians, Principals and Teachers." Ph.D. dissertation,University of Oregon, 1970.
Case, Robert N. Behavioral Requirements Analysis Checklist: A Compilation ofCompetency-Based Job Functions and Task Statements for School Library MediaPersonnel. Phase II School Library Manpower Project. Chicago: AmericanLibrary Association, 1973.
Gaver, Mary V. Services of Secondary School Media Centers: Evaluation andDevelopment. Chicago: American Library Association, 1971.
Gayer, Mary V. and Jones, Milbrey L. "Secondary Library Services: A Search ForEssentials." Teachers College Record, Vol. 68, No. 3, Dec. 1966.
Jetter, Margaret Ann. "The-Roles of the School Library Media Specialist in theFuture: A Delphi Study." Ph.D. dissertation, Michigan State University,1972.
Liesener, James W. A Process for Plannin School Media Pro rams: DefininService Outputs, Determining Resource and Operational Requirements, andEstimating Program Costs. College Park, Md.: School of Library and Infor-mation Sciences, University of Maryland, 1972.
Lohrer, Alice: The Identification and Role of School Libraries That Functionas Instructional Materials Centers and Implications For Library Educationin the United States. 1970. ED038 150
Office of Education. The Educatioh Professions 1971-1972. Part IV. "A Man-power Survey of the School Library Media Field." 1973. ED 082 801
Olson, Lowell Ellis. "Teachers', Principals', and Librarians' Perceptions ofthe School Librarian's Role." Ph.D. dissertation, University of Minnesota,1966.
"Preparation Program for the Education of the Campus-Level Learning Resources*Specialist (Professional Certification)," Educational Resources andTechniques, Vol. 15, No. 1 (Spring, 1975): 7-12.
198

Ricking, Myrl and Booth, Robert E. Personnel Utilization in Libraries: ASystems Approach. Chicago: American Library Association, 1974.
School Library Manpower Project. Phase I Final Report to the Knapp Foundation.Chicago: American Library Association, 1970.
School Library Manpower Project. Curriculum Alternatives: Experiments in SchoolLibrary Media Education. Chicago: American Library Association, 1974.
Smith, Susan Seabury. "The Role of the School Librarian in Curriculum Improve-ment." Ed.D. dissertation, Columbia University, Teachers College, 1956.
Southern Association of Colleges and Schools. Standards for Secon2ary Schools.Atlanta: Southern Association of Colleges and Schoolb, 1970.
Texas Education Agency. Guidelines for the Development of Campus LearningResources Centers (Libraries). Austin, Texas: Texas Education Agency, 1974.
19 9