document resume fpons agency national inst. of education
TRANSCRIPT

DOCUMENT RESUME
TM 810 144
AUTHOR Leinhardt, Gaea: Engel, MaryTITLE Iterative Evaluaton: NRS. An Example.INSTITUTION Pittsburgh Univ., Pa. Learning Research and
Development Center.FPONS AGENCY National Inst. of Education (DHEW) , Washington,
D.C.REPORT NO IRDC-1980/12PUB DATE 79NOTE 36p.
EDRS PRICE MF01/PCO2 Plus Postage.DESCRIPTORS *Evaluation Methods: Grade 1: *Instructional
Innovation: Primary Education: *Program Evaluation:Program Implementation: *Reading Instruction
IDENTIFIERS *Iterative Methods: *New Primary Grades BeadingSystem
ABSTRACTThe use of increasingly more informative evaluations
of a single innovation are documented. The innovation, The NewPrimary Grades Reading* System (NRS), was implemented in a variety ofsettings, and the evaluations track the iiplementation from the earlystages of pilot testing through large-scale adoption of the program.NRS is characterized as an eclectic code-breaking approach tobeginning reading instruction as opposed to a whole-word approach. It.employs letter-sound correspondences, synthetic phonics, analyticphonics and linguistic techniques such as displaying differences andsimilarities in spelling patterns. NRS is both indi4idualized andadaptive. Once all the students are at or above Level III andreceiving instructions from audio cassettes, the teacher is. free toutraveln around the room to diagnose, prescribe, teach and monitorstudent progress and to assess student performance. Many studies ofthe effectiveness of NRS have been conducted. A sample of seven ofthe 20 or more studies are reported here. There is one within-schoolstudy, five within-district across-school studies, and oneacross-district study. In all cases there is pre/posttest informationon grade 1 students. Cumulation of evidence across settings allowsfor greater confidence in conclusions drawn from the evaluation.(Author/RL)
*********************************************"4************************** Reproductions supplied by EDRS are the best that can be made
from the original document.***********************************************************************

U S DEPARTMENTOF HEALTH
EDUCATION & WELFARENATIONAL INSTITUTE OF
EDUCATIONT4, DOCUMI NI oiAS HE EN NEPQC1.OUCFC) r XA ti AS 41 CI IVE QOM1141- PENSON CIN
OCRJAN5fAlON ORICONMINT, IT POINTS OI VI( WON OPINIONSSI ATE 1100 NOTNI CT SSAJoR Y NI ONtST NI O
NAI IONAt Ni.II1 T(1 / 101O MI( At ION P0.1 !ION ON POI Y
"PERMISSION TO REPRODUCE THIScoMATERIAL HAS BEEN GRANTED BY
.1
TO THE EDUCATIONALRESOURCES
INFORMATION CENTER (ERIC)"
qtyA In t y Plt ab u h
2

ITERATIVE EVALUATION: 1,111S, AN EXA1s4pLE
Gaea Leinhardt and Mary Engel
Learning Research and Development Center
University of Pittsburgh
1979
.
The research reported herein was supported by the Learning Researchand Development Center, supported in part as a research and develop-ment center by funds from the National Institute of E ducation (NIELUnited States Department of Health, Education, and Welfare. Theopinions expressed do not necessarily reflect the position or policy ofNIE, and no official endorsement should be inferred.
3

Abstract
This paper documents the ust of increasingly more informative eval-uations of a single innovation. The innovation, The New PrimaryGrades Reading System (NRS), was implemented in a variety of settings,and the evaluations track the implementation from the early stages ofpilot testing through large-scale cdoption of the program. Accompanyingcontrasts were made within a single school, within a school district,and across districts. This approach to evaluation followed the naturally
occurring process of implementation of the innovation and providesconvergent evidence as to its effects. The cumulation of evidenceregarding the success of an innovation across settings allows for greaterconfidence in the conclusions drawn from the evaluation.
iii 4

ITERATIVE EVALUATION: NRS, AN EXAMPLE
Gain Leinhardt and Mary Engel
Learning Research and Development CenterUniversity of Pittsburgh
Since the mid-1960's educational evaluation has become a prom-inent aspect of educational reform and innovation. Evaluatio..s of bothmajor educational changes and minor curriculum revisions tend to
occur after the design and implementation of the innovation ratherthan during it. There are rational and defensible reasons for this.First, when an innovation of any type is supported, it is supportedon the assumption that some change or improvement is desirable.Whether the change represents an improvement is another question.Second, the individuals involved in designing, implementing, and
revising an innovation are not necessarily the same people who designand implement an evaluation; therefore, especially in curriculumdesign, evaluation efforts are tacked on after development.
Two important approaches to evaluation of curricular innovations
are often proposed and rarely followed. One approach is the designand implementation of an experiment with random assignment of units(students, classes, or schools) to treatment and tight control to avoiddeterioration of the design. The results of such a study should beclear cut (Boruch & Rindskopf, 1977). The process of true random-ization and selection of the correct unit for assignment has provendifficult but by no means impossible in education. Homogeneity of
treatment within groups and separation of treatment between groupshas been a more difficult problem. A second approach is the designand implementation of an explanatory observational study (Cooley,

1978). Such a study should start with a model of how the innovation
may work and include measures of the independent variables. While
this approach is undoubtedly the one that will be followed in most largescale field-based evaluations, the process of delineating a modal andmeasuring its components requires large numbers of observationalunits (students, classrooms, schools), and it is therefore unlikelythat during early stages of curriculum evaluation this approach will befollowed because of cost and complexity of administration.
The purpose of this paper is to examine the feasibility of a third,somewhat more pragmatic, approach to evaluating curriculum inno-vations. To use this approach, the innovation is followed through itsimplementation in different educational settings, data are gathered atwhatever level possible on its effects, and then the total picture ofprogram effects is constructed by analyzing the convergent and divergentevidence. This approach follows the natural route of program develop-ment; that is, programs start at some level, positive "results" at thatlevel lead to expansion, and then further assessment is followed byfurther expansion. One can visualize this approach as a set of concen-tric rings moving out from a single limited contrast to larger and morecomplex ones. The rings are both the levels of expansion for theinnovation and the levels of contrast for the evaluation.
This paper draws together a set of small scale evaluations of aneducational innovation, the New Primary Grades Reading System (NRS;
Beck, 1977). NRS was implemented in a variety of settings startingin 1973. The settings were of increasing physical distance from thedevelopers and tended to have decreasing intervention from theimplementation staff. At some point in each new implementation
situation, some evaluative data were collected. This paper describesthe NRS innovation and presents a chronological overview of its imple-
mentation and the type of contrasting information available. The
26
evaluations are described as moving with the implementations fromhistorical within-school contrasts to.more taxing concurrent across-district contrasts. The set of studies is followed by a synthesis of theimpact of NRS on classroom processes and student achievement.
Background
Before exploring the details of the individual studies that evolvedfrom the development and implementation of NRS, a description of thereading system, how it operates in the classroom, and a brief historyof its development are reviewed.
The NRS Approach
NRS is characterized by its developers as an eclectic code-breakingapproach to beginning reading instruction as opposed to a whole-wordapproach (Beck, 1977; Beck, Note 1). Children are taught by receivingexplicit instruction about letter-sound correspondences that can beused in attempting to road the word. One way in which children aretaught to read unfamiliar words is by using synthetic phonics, or puttingsounds together to form words. The strategy developed for use inputting the sounds together is called the blending chain. A second way
children are taught to approach unfamiliar words in NRS is to explorethe word for its parts, or, more generally, to use analytic phonics.NRS also teaches children about linguistic techniques that can be usedin learning to read words. Words and text within NRS are displayedso that differences and similarities in spelling patterns are evidentto the children.
The developers of NRS emphasize its individualized, adaptive
structure. The reading system is individualized in that students, aftercompleting the first two levels of the curriculum, work through thecurriculum at different rates. The curriculum is adaptive in that
3
7

teachers are provided with multiple teaching strategies for use with
different students. The curriculum also provides the students with awide variety of instructional resources which can be used to adapt to
their individual needs and interests. MIS is also designed to teach
children self-management skills, permitting students to work on an
activity or to move between activities without the supervision of the
teacher.
The first two levels of the curriculum are designed to teach self-
management skills, letter-sound correspondences, and techniques for
blending those sounds into words. Most of the academic and managericl
instruction in these early levels of SIRS occurs in teacher-led small
groups. As the first student enters Level III of the curriculum, the
teacher's role changes: The studets receive initial instruction innew content or skills from audio cassettes, and, once all of the students
are at or above Level III, the teacher is free to "travel" around the
room to diagnose, prescril)e, teach, and monitor student progress and
to assess student performance.
Prescriptive activities assigned by the teacher must be completed
by the student. Each child knows his/her prescription for the day by
looking at a prescription sheet that is sequenced within the child's own
consumable workbook. Prescriptive activities also include teacher-
led instruction, cassette-led instruction, and tests or progress checks.
In addition to prescriptive activities, children are assigned or select
reinforcement and fluency-building activities. These activities may
include reading a story written to be appropriate for the level in which
the child is working. playing specially designed games, reading a story
in a teacher-led group situation, reading books other than those in
NRS. or writing stories.
4

Chronology of NR9
Shortly after its inception in 1964, the Learning Research andDevelopment Center (LRDC) became involved with two public (*lemon..tary schools* one located in major urban area, and the other in a
suburb. LRDC was attempting to individualize elementary schoolinstruction in reading, mathematics, and science. The research anddevelopment of individualized reading instruction began with two basicrestrictions in mind* that the reading curriculum should emphasisecode-breaking, and that the LRDC should not attempt to develop itsown reading curriculum, but should try to modify existing ones(Beck, 1977).
A published, programmed text was in use in reading classroomsat both schools in 1970. The text was designed so that the teacherpresented new content to students; students, in turn, practiced skillsin their individual workbooks after content was presented. It becameapparent that a teacher in a classtuom with a large number of studentscould not present content to each student, one at a time. The LRDCdeveloped, from the instructional strategies available in the teacher'smanual, audio lessons on cassette tapes to take some of the introductionof new material off the teachers' hands. The addition of the tapes tothe curriculum increased the amount of time the teacher had at his/herdisposal for tutoring students and monitoring their performance.
A later modification of the published program made by the researcherswas the introduction of the Early Reading Program (ERP), which incor-
porated new instructional strategies for the introduction of letter-soundcorrespondence and the blending of those sounds into words. As theseand other changes of the program were being tried out in the develop-mental schools, the reading project staff began to examine the resultsof standardized reading achievement tests. The results were encour-aging, but no statement could have been made linking the changes to
5
9
modifications in the curriculum. Observations children made bythe staff indicated that many were still having difficulty in acquiring
reading skills, and the staff continued to be dissatisfied with the
curriculum itself for a number of other reasons--such as the inappropriato use of "fill in the blanks" and the inappropriate introduction
and practice of similar graphemes (e.g., b and d). For those reasons,a decision to develop a now reading curriculum was made.
The reading staff gradually began implementing NRS in the two
developmental schools in 1972 -1973. Data from the 1973-1974 school
year at both schools for first grade classrooms revealed that achieve
ment for NRS students was good as compared to first grade students
in the previous )car who had been taught with the patched-up curriculum
(Beck, 1977; Buehler ik Eichelberger, Note 3; Eichelberger Id Leo,Note 2). These data were difficult to interpret for several reasons.Any first grade student who was taught reading using NRS probably
received some beginning reading instruction in kindergarten using the
old system. The reading staff also provided assistance in the class-rooms, for those children who needed it, before 1973-1974. Duringand after that year, the assistance was removed.
As the LRDC reading staff and curriculum developers changed
their approach from rewriting and revising a beginning reading cur-riculum to developing and implementing a new one, the need for further
evaluation of the curriculum became more pressing. The study of the
implementation and its effects on student achievement become more
structured as finer and more numerous changes were being made in
NRS. Strengths and weaknesses of the program were being brought
to light. Since all evaluations of NRS had been conducted in schools
with long-term, ongoing relationships with LRDC (i.e., they were
using other individualized curricula at the same time), and because
of the relatively positive results of NRS, it was decided to implement
6

444 tivo iota r-"eaing program in a setting that had had no previews
411bo
pp,Dc.
497415 Ichool year represented a major change for NRS,
111
'411°0 1, prOgrOn Wag. implemented in three first grade classrooms0
au.0°.
in ict A (Beck. 1977) WilkInstn_Ift Demette, 19741, 0-
4) 1 .94Ckalia, 11°a ' this represents second ring out from the
kA , .avoloPnIshtal Bite, All first graders at School 1 used NRSti%4140411 a
t t 40 dents remained in the program for the entire schoolr, *for+4, grciuP ° 40 students was compared w!th a group of 43
k\ttio
ho vie" to first grsda in 1973-1974 at School 1 and who had0% %to
Od oat reeding Program. The LRDC reading staff was respon-14%4 "%preestrioo/ineervice training as well as txtensive support
durioli that first year of implementation at School 1. In
Nip the rsliding staff was available to the teachers *A staff at10
`to,spool to silewer questions, solve problems. collect data on student
Pk\NO' 11°Pett hie the distribution and quality of curricular
d OUNtrVie I the r.iministration of standardised tests attiNtabisio14.4 of the Oct/Q*1 Year (McCaslin. Note 4) to the 1974-1975 first
"`N, ihe 1974.1975 second graders (1973-1974 first graders).°pd tomatte
this first year were positive.
edolististrators. principals, teachers, and students hadfa 1:51stric
acrIP" to the first attempts at implementation of NRS inDk% NW°
t °coon"(Via- 1.-:GLicf2tPte 1975). Administrators and curriculum
opsfri 0tf "lied interest in continuing to use the MRS reading
ctk kliets5durtoiC the 1975-1976 school year in four first grade
is 1)..L. all' e, local press and TV reactions are cited. Thisthik-Titte to dear:78t1:_ete the dissemination of results and to document
ev,,z,bvtrots into Y uetween innovation, evaluation, and use ofNU,,,40

classrooms in two District A school., thus adding another ring to the
implementation and evaluation from one school to two school.. Thefirst concurrent contrast (as orveed to historical) was carried outthe following year, Four NRS first grades were compared with seven
basal first grades within the same school district. The NRS students
again performed better than the students in the basal programs. Local
response to the program was very enthusiastic Wilkinsburs Meetly.
1976).
In the spring of 1976, District A personnel decided to use NRS as
the main reading curriculum in their primary grades. The program
was introduced in all first grade classrooms beginning in September.
1976. The program was also used in four second grade and three
third erode classrooms the same year.
Accumulations of positive evidence about the benefits of NRS
resulted in the afloption of the reading program by an LRDC-affiliated
District b Tallow Through site. During 1976-1977 NRS was implemented
in two kindergarten Follow Through classrooms and in six first gradeFollow Through classrooms. Evaluators also collected data from tixnon-NRS, non-Follow Through classrooms for comparison study.
addin still another ring (multiple within-district comparisons) to theimplementation an evaluation.
The developers of NRS saw a need for further evaluation of the
program that would make comparisons outside of District A. Anotherdistrict (District C) agreed to permit data to be gathered for use in
such a contrast. Three first grade classrooms in District C acted as
the control group for eight first grade classrooms in District A. andanother ring, an across-district contrast, was added to the series of
evaluations.
Another level of contrast was added to the evaluation of NRS in
District B in 1977-1978. In addition to collecting data on ale NRS
8
12

and six non-NRS first grade classrooms, data was gathered on six NRSand eight non-NRS second grade classrooms. Most second graderswho had NRS in 1977-1978 had had NRS in 1976-1977 as first graders.
Specific Studik. s
Many studies of the effectiveness of NRS Lave been conducted overthe years. A saropie of seven of the twenty or more studies are re-ported here. All the studies chosen had reasonably clean data, pre-and posttests, and verifiable test administrations. No study waseliminated from this discussion due to directionality of the findings.This section presents the details of each selected contrast and showshow each study added to information about NRS. There is one within-school study, five within-district across-school studies, and oneacross-district study. In all cases there is pre/posttest informationon students; in some cases there is descriptive classroom informationfrom interviews or questionnaires.
Within-School Contrast: Study 1
After the pilot test of NRS described in the preceding section,the first of the series of evaluations, the within-school contrast, wascarried out. Data collection and analysis for this study were underthe control of the implementors (McCaslin, Note 4); raw data are nolonger available for reanalysis.
Population. In 1974-1975, the NRS was implemented in threefirst grade classrooms in School 1 of District A. The population ofthe school was approximately 50% white. In 1973-1974, first gradersat the school had received reading instruction with Scott-Foresman orHarper & Row, both basal reading series. These students constitutedthe contrast group. There were 40 students in the NRS group and 43students in the basal group.
9
Method. Both groups received the Pintner - Cunningham PrimaryTest (Pintner, Cunningham, & Durost, 1966) in the spring of theirkindergarten year. This test is one of a series of Pintner GeneralAbilities Tests and yields an IQ score. In the spring of their .firstgrade year, both groups were tested on four subtests of the StanfordAchievement Test (SAT; Madden, Gardner, Rudman, Karlsen, &
Merwin, 1964): Word Reading, Paragraph Meaning, Vocabulary, andWord Study Skills.
Analysis and results. Scores for the Pintner-Cunningham did notdiffer significantly between the two groups. T-tests were conductedto determine if the NRS group performed significantly better than thebasal group on the criterion measure. Scores on the SAT were sig-nificantly higher for the NRS group on two of the four subtests, Word
Reading and Paragraph Meaning. Scores on the Word Study Skills andVocabulary subtests were higher for the NRS group, but not signifi-cantly so.
Within-District Contrast: Study Z
In response to positive reading achievement test results from thewithin-school across-year contrast and to positive reactions by theadministrators in District A, a study was designed to test the effec-tiveness of NRS in a more challenging, demanding set of circumstances --a concurrent within-district across-school contrast. This would help
to control but not eliminate the challenge to results ariing frompossible historical differences from year 1 to year 2. This contrastrepresents a second ring in the evaluation of the effectiveness of NRSand its implementation.
Population. In 1975-1976, NRS was implemented in four first
grade classrooms in two District A schools. The seven remainingfirst grade classrooms within the district that received basal instruc-
10
14
tion (Scott-Foresman or Harper and Row) were used as the contrastgroup. These seven classrooms were divided among three schools inthe district. There were 65 students in the NRS group and 121 studentsin the non-NRS group who had pretest and posttest scores. The per-centage of minority students enrolled in the first grade had increasedslightly from the preceding year.
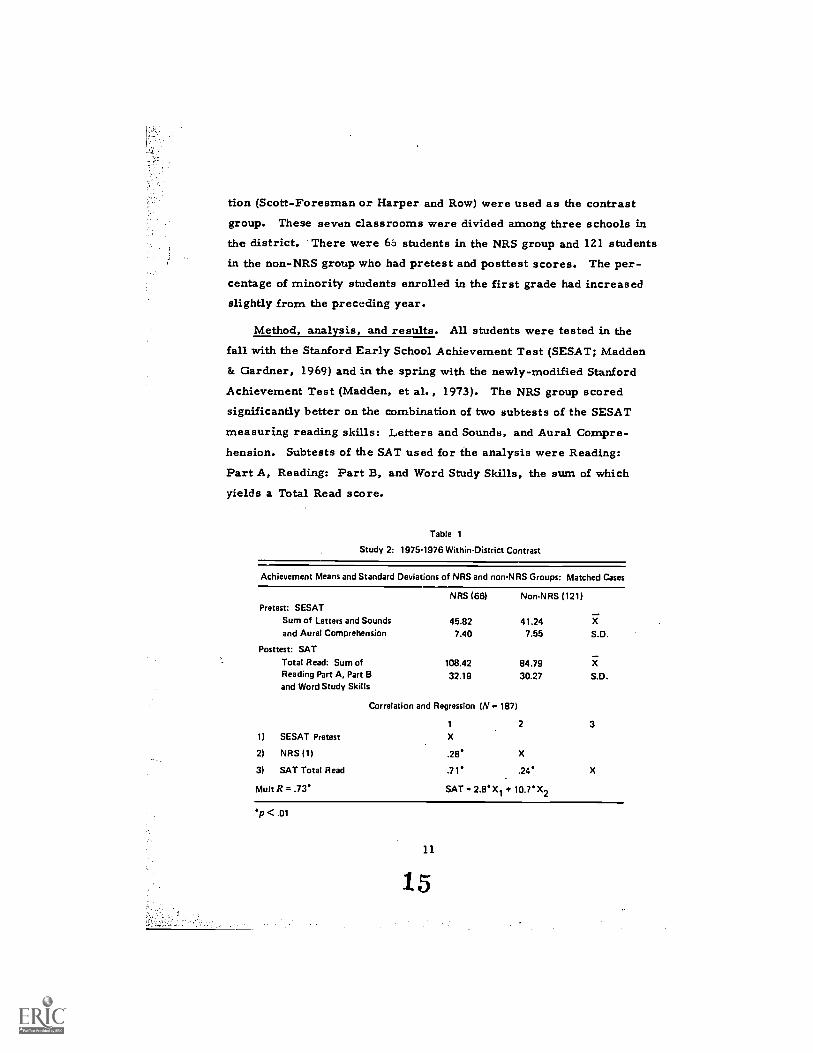
Method, analysis, and results. All students were tested in thefall with the Stanford Early School Achievement Test (SESAT; Madden& Gardner, 1969) and in the spring with the newly-modified StanfordAchievement Test (Madden, et al., 1973). The NRS group scored
significantly better on the combination of two subtests of the SESATmeasuring reading skills: Letters and Sounds, and Aural Compre-hension. Subtests of the SAT used for the analysis were Reading:Part A, Reading: Part B, and Word Study Skills, the sum of whichyields a Total Read score.
Table 1
Study 2: 1975.1976 WithinDistrict Contrast
Achievement Means and Standard Deviations of NRS and nonNRS Groups: Matched Cases
Pretest: SESATSum of Letters and Soundsand Aural Comprehension
NRS (66)
45.827.40
NonNRS (121)
41.247.55 S.D.
Posttest: SATTotal Read: Sum of 108.42 84.79Reading Part A, Part Band Word Study Skills
32.19 30.27 S.D.
Correlation and Regression (N = 187)
1 2 31) SESAT Pretest X
2) NRS (1) .28. X
3) SAT Total Read .71* .24' X
Mult R =.73' SAT= 2.8.X1 + 10.7'X2
*p< .01
11
15

Table 1 presents the means and standard deviations of the SESAT
pretest and the SAT posttest for both the NRS and the non-NRS groups.
Pretest scores indicate that the NRS group started out slightly aheadof the non-NRS group on the combination of the Letters & Sounds andAural Comprehension subtests of the SESAT (4.6 points) and finishedthe year considerably higher on the posttest (23.6 points).
End-of-year achievement (SAT Total Read) was regressed onpretest (SESAT Letters and Sounds + Aural Comprehension) and a
dummy variable code for NRS (1). Table 1 shows the correlation ma-trix of the variables in the regression, the Multiple R, and the raw Bweights for the regression solution. Both B weights (pretest and NRS)
are significant (2.8 and 10.7), F (1, 184) = 163.'19 and 8.77 respectively.
One aid in interpreting the difference between the twc groups inend-of-year achievement comes from the information about instruc-tional processes used in reading. In January and February, 1976, aninterview designed to measure instructional practices in reading wasadministered to the first grade teachers involved in the study. Data
from the interview can be described using three general descriptorsor constructs: the opportunity the students have to learn materialssampled on the end-of-year performance measures; the structure ofthe instruction for both the teacher and curriculum; and the content ofreading, or how often students engaged in various types of reading
activities. Only a selected number of variables from the constructswill be discussed here. A summary of these variables is presentedin Table 2.
The first set of variables reflects the opportunity students had tolearn the material on which they were tested. Important measures
in this construct are: the number of, students enrolled; the number ofadults in the room during reading instruction; student attendance; thenumber of minutes allotted for reading per week; and the overlap
12
16
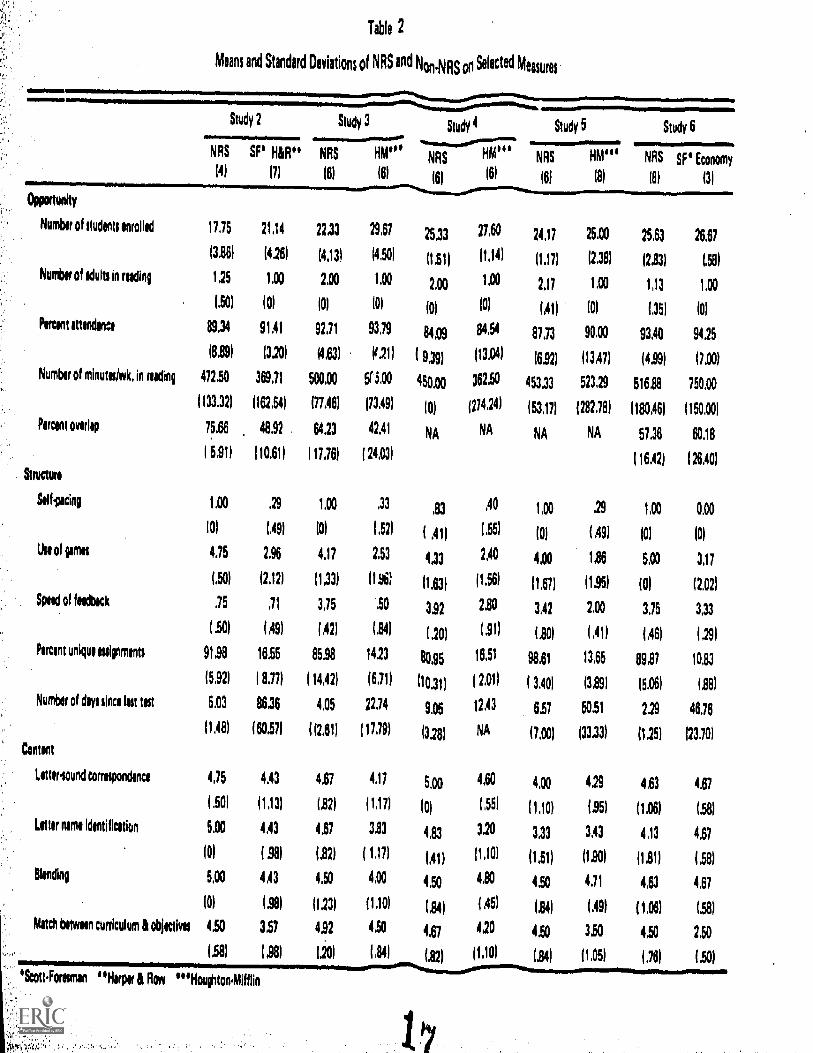
Table 2
Means and Standard Deviations of NRS and Non,NRs 00 Selected Measures
MMINMIVIIIMIEMINIMMIP1411110011111MOWNW
Study 2 Study 3
NRS Er"(6) (61
Stud'? 4
NRS HM
(6) 161
Study 5
NRS HM"'
(0 (8)
Study 6
NRS SF FAR"
141 (7)
NRS SF' Economy
18) 131
0990110011Y
Number of students enrolled 17.75 21.14 22.33 29,61 25.33 21.60 24,17 25.00 25,63 26.87
(3261 (4261 (4131 14,501 11,91) 11,141 A1) (2.381 12.83) 1.581
Hunter of adults in reading 1,25 1.00 2.00 1,00 2,00 1.00 2,17 1.00 1,13 1.00
(.50) (0) 10) (01 (01 101 (Al) 101 1,351 101
Percent ettendince 89.34 9141 9231 93,79 04,00 84.54 8733 80,00 93.40 94.25
(8.89) 13.20) (4.831 (1211 I9,39) (11041 16,921 113.47) 14.99) 17.001
Number of minutolwk, in reading 472,50 369.71 500.00 sr sAx 450,00 362.50 45333 523,29 516,88 750,00
1133.321 (162.64) (77.461 173.491 10) 1214.241 153111 1282.181 1180.46) 1150401
Percent overlap 75.66 48.9264.23 42,41
NA NA NA NA 51.36 60,18
( 5.91) (10.611 117.761 ( 24.03)116,42) 126401
Structure
Self.pacing 1.00 .29 1,00 .33 la .40 1,00 .29 1.00 0.00
101 (.491 (01 1.521 (Al) 1,551 (01 1,491 (01 (0)
Use of games 4,75 2.96 4.17 2,53 4,33 2.40 4.00 1.86 5.00 317
1.50) 12.12) (113) H .96) 11,031 (1.56) 11,611 (1.95) (0) (2321Speed of feedback .75 ,71 3,15 .50 3,52 2.80 3.42 2.00 3.15 3,33
1.50) (.491 (.421 134) 120) 1.91) 1,00) 1,41) 46) 1,20)
Percent unique **Amin!' 91.98 16.55 85.98 14.23 80,98 16.51 08,61 13.65 89,87 10,93
(5,921 1 8.111 ( 14A21 (6.11) (10211 2.01) 1 3.401 0,891 (6061 (281
Number of days since lot test 5,03 86.36 4,05 22.14 0,05 12.43 6,57 50.51 2.29 46.76
11.481 160.57) 1(2.811 117.191 13281 NA 17,001 133,33) 11.25) (23.70)
Content
Lettersound correspondence 4,75 4,43 4,67 4.17 5,00 4.60 4,00 4.29 4.63 4.67
1.501 (1.13) 1,821 (1,171 (01 1.55) (1,10) (351 (1.06) 1351
Letter name Identificetion 5.00 4.43 4,67 323 42.3 3.20 3,33 3.43 4.13 4.67
101 (,98) (.82) 1171 141) (1.10) (1,51) 1120) 11,81) 1.581
Blending 5.00 4A3 4.93 4.00 4,50 4.80 4.50 4.11 4.63 4,87
(01 OM (1,231 (1.101 (.84) 1,45) (.84) 1.491 (1.061 1.581
Match batmen curriculum II obleilvN 4,50 3.57 432 450 4,67 420 4,50 330 4,50 2,50
(.58) (,98) 1201 1.841 (I2) (1.10) 1,841 11,051 1.761 1.501
ScottForomin "Hypo & Row "'Houpon.Mifflin

between the curriculum and the criterion test. The average numberof students enrolled in the NRS classrooms in District A during 1975-1976 was lower than the number enrolled in non-NRS classrooms(17.8 vs. 21.1). There were also more adults present for reading_ -
instruction in a few of the NRS classrooms. Attendance for the two
groups was very similar (89.3% for NRS and 91.1% for non-NRS).NRS teachers assigned approximately 100 minutes per week morereading instruction to their students than non-NRS teachers, and theyreported a higher overlap between what was presented in the curriculumand what was tested on the SAT (75. 6% overlap reported by NRSteachers and 48.9% by non-NRS teachers). This means that, ingeneral, the NRS students had a greater chance to learn reading thanthe non-NRS students because they had fewer students, more adults,more time, and a larger amount of criterion-relevant material.
The structure construct is represented by five variables: self-pacing of students, frequency of use of games, speed with whichassignments are corrected and returned to students, the percentageof unique assignments, and the number of days since the last test.Without exception, in the NRS classrooms students worked at theirown rate, while in non-NRS classrooms most students did not workat their own rate. Reading games were used more frequently in NRSclassrooms. The rate of correction tended to be the same for NRSand non-NRS students. There were large differences between groups
in the percentage of unique assignments and the number of days sincethe last test: percent unique was 92.0% for NRS and 16. 6% for non -
NP ,, number of days since last test was 5.0 for NRS and 86.4 fornon -NI S. Thus, NRS provides for greater individualization, morestructure and more feedback.
The content construct is made up of four variables: frequency ofstudent engagement in letter-sound correspondence, frequency of
letter identification, frequency of blending, and an estimate of thematch between the curriculum and what the teacher considered to beimportant first grade reading objectives. NRS students were reportedto have spent slightly more time in letter-sound correspondence,letter identification, and blending than non-NRS students. NRS teachersreported a closer match between NRS and important reading objectives,4.5 on a 5-point scale; non-NRS teachers rated the match betweentheir curriculum and objectives at 3.6. Thus, the content of the NRScurriculum seems to focus on acquiring basic reading skills more sothan the basal sequence.
Within-District Contrast: Stud _33
Population. A second within-district contrast was conducted in1976-1977 when an urban school district (District B) from a differentstate than District A adopted NRS for use in six of its first gradeFollow Through classrooms. The control group consisted of six firstgrade classrooms that received reading instruction with Houghton-Mifflin, a basal series. There were 119 students in the NRS groupof six classes and 144 students in the non-NRS group for whom pre-test and posttest data were available. This study replicated Study 2in a more economically depressed urban area. In addition, the pre/posttests were selected to more closely reflect the objectives oftraditional basal series.
Method. Students in both groups were tested in October, 1976with the Murphy-Durrell Reading Readiness Analysis (Murphy &
Durrell, 1965). The test contains three subtests. Only the LetterNames subtest was used for analysis because performance on thePhonemes subtest was strongly influenced by the presence of NRSin the classroom prior to pretesting in October. The Learning Ratesubtest was not used because of inconsistency in administration.
15
19

End-of-year achievement was measured in May, 1977 by the SAT
(Madden, et al., 1973). Subtests used in the analysis were: Reading:Part A, Reading: Part B, and Word Study Skills. The three subtestscores yield a score for Total Read.
Analysis and results. Table 3 shows the means and standard devia-tions of the Murphy-Durrell pretest and SAT posttest for both the NRS andbasal groups. The NRS group started out slightly ahead of the controlgroup, possibly because testing of entering abilities did not occur untilwell over a month into the school year.
A regression analysis indicates that end-of-year achievement testscores for the NRS group were significantly higher than for the childrenwho used the basal series. End-of-year achievement (SAT Total Read) forall students was regressed on initial ability and a dummy variable code for
NRS (1). Table 3 shows the correlation matrix of the variables in the regres-sion, with the raw B weights for the regression solution. Both B weights,
pretest and NRS, were significant (2. 1 and 10.6), F (1, 260) = 136.0, and12. 84.
Table 3
Study 3: 1976-977 Within-District Contrast
Achievement Means and Standard Deviations of NRS and non-NRS Groups: Matched Cases
Pretest: Murphy-DurrellLetter Names Total
NRS(119)
46.735.75
Non- NRS(144)
42.81
9.15 S.D.
Posttest: SATTotal Read: Sum ofReading Part A, Part 8 102.79 83.81 7and Word Study Skills 27.78 29.09 S.D.
Correlation and Regression (N. 2631
1 2 3
1) Murphy-Durrell Pretest X
2) NRS (1) .24' X
3) SAT Total Read .62" .32' X
Mult R - .64" SAT u 2.1'X1 1- 10.6'X2
*p<.01
7.6
20

Process data for this contrast were collected in the first twomonths of 1977, again through the use of a teacher interview. Thesedata are summarized in the second column of Table 2. The opportunity
construct suggests that the average number of students enrolled inNRS classrooms in District B during 1976-1977 was lower (X = 22. 3)than the number enrolled in the non-NRS classrooms ( = 29.7). NRSclassrooms had twice as many adults present during reading instruction.The percentage of students present in both settings was equivalent.Teachers in NRS classrooms reported that they allocated 500 minutesper week fo) reading instruction; non-NRS teachers allocated 85 minutes
per week more. NRS teache.:s reported a 64% overlap between whatthe SAT measured and what was presented in the NRS curriculum;nor.-NRS teachers reported a 42% overlap. Thus, in the second within-district contrast there is again a greater opportunity for students tolearn to read in NRS classrooms because there are more teachers,fewer students, and greater overlap. However, less time is allocatedto reading indicating that perhaps NRS is more efficient in teachingreading than the basal series.
Fundamental differences between NRS and non-NRS groups appearin the structure of the curriculum. Again the NRS group reported ahigher level of student self-pacing, and that they use games abouttwice as frequently as non-NRS teachers. NRS teachers also reportedthat they correct student work and return it to the students muchsooner than their basal counterparts, though neither group reportedcorrecting or returning work on-line. The percentage of uniqueassignments on a given day is a measure of individualization in theclassroom, and NRS classrooms have a much higher percentage ofunique assignments: 86% for the NRS group and 14.2% for the non-NRS group. NRS students tend to be tested more.frequently than
non-NRS students: The average number of days between tests for
17
21

the NRS group is 4.1 days, and 22.7 days for the non-NRS group.
NRS students also tend to score well on those tests. The percentageof correct items on a selected test for the NRS group was 95%; for the
non-NRS group, it was about 75% correct. The results of the structureconstruct are consistent with the other within-district contrast: NRSindividualizes instruction and gives more rapid and frequent feedback
than non-NRS curricula.
Again NRS teachers report a somewhat greater focus in beginningreading content than non-NRS teachers. In general, NRS teachers
report that they teach letter-sound correspondence more frequentlythan do non-NRS teachers (4.7 for NRS; 4.2 for non-NRS). The samepattern holds true for identifying letters and blending sounds. Therating of the match between the curriculum and what teachers consid-ered to be important first grade reading objectives was high for bothgroups (4. 9 for NRS, 4.5 for non-NRS).
Within-District Contrast: Study 4
Population. Data collection in Distr let B during 1977-1978 formed
the basis for the third within-district contrast. Six first grade class-rooms received reading instruction with NRS, and six classrooms weretaught with Houghton-Mifflin, a basal series. Pretest and posttestdata were collected for 123 NRS students and 133 non-NRS students.This study replicates the previous one with the exception of a minor
change of testing instruments.
Method. The Comprehensive Tests of Basic Skills (CTBS LevelB, Form S; CTB/McGraw-Hill, 1973) was administered in October,
1977 in all 12 first grade classrooms. Five subteets were administered:
Letter Sounds, Word Recognition I, Reading Comprehension, Word
Recognition II, and Language I. A total read score was obtained byadding the first four subtest scores. The Language I subtest was not
18
22

included in the analyses because it is a test of listening and pictorialinterpretation, not reading. Students were posttested in May, 1978with the same form and subtests of the CTBS. Process data werealso collected during the first months of 1978, this time through theuse of a questionnaire mailed to the teachers.
Analysis and results. NRS and non-NRS group means and standarddeviations for the CTBS are presented in Table 4. Again, the NRSgroup scored higher on the pretest than the non-NRS group. There isa 3-point difference between groups on the pretest and a 7-point differ-ence on the posttest. End-of-year achievement (CTBS Total Read)for all students was regressed on initial ability and a dummy variablecode for NRS (1). Table 4 contains correlations of the variables andraw B weights (pretest and NRS), ,both of which are significant (.77and 4.7), F (1, 253) = 93.0 and 7.11.
Table 4
Study 4: 1977.1978 WithinDistrict Contrast
Achievement Means and Standard Deviations of NRS and nonNRS Groups: Matched Cases
Pretest: CTBS Level 8NRS (123) NonNRS (133)
Total Read 30.49 27.3512.17 9.62 S.D.
Posttest: CTBS Level 8Total Read 64.11 57.05
14.15 17.78 S.D.
Correlation and Regression (N* 256)
1 2 31) CTBS Level 8 Pretest X
2) NRS (1) .14 X
3) CTBS Level 8 Posttest .53' .21' X
Mult R .55' CTBS .77'X1
+ 4 7')( 2
'p < .01
19
23

Classroom process data (in Table 2) for opportunity show that theNRS group again had fewer students enrolled per classroom than thenon-NRS group and twice as many adults in the room during readinginstruction. The number of students present in the classrooms wasequivalent. First grade NRS teachers during 1977-1978 uniformlyallotted 450 minutes per week for reading instruction, while non-NRSteachers allotted about 362 minutes per week. There exists a ratherlarge standard deviation for the non-NRS group on this variable,indicating that, as a group, non-NRS teachers allocated reading timevery differently. Unfortunately, the overlap estimate was not collectedduring 1977-1978 for this study.
The structure construct reveals that the NRS group had moreclassrooms in which students were self-paced. NRS teachers contin-ued to report more frequent use of games and that they corrected andreturned student work more quickly than teachers who used the basalseries. The percentage of unique assignments was much higher forNRS classrooms (81% unique for NRS classrooms; 16.5% unique fornon-NRS classrooms); students in NRS classrooms tended to be testedmore frequently (calculations of the number of days between tests waspossible for only two of the non-NRS classrooms); and they performedbetter on a selected test than did the non-NRS students.
Regarding the content construct, NRS students spent more timeengaged in letter-sound correspondence and letter identificationexercises, but non -NRS students spent more time in sound blendingexercises. Both groups of teachers rated the curricula as having aclose match with what they considered to be important first gradereading objectives.
Within-District Contrast: Study 5
Population. The fourth within-district contrast in this set ofevaluations was a contrast at the second glade level in District B.
20
24

Ini97 90, SAS was being implemented in six second grade class-
1.N -1 ottr°1 group was made up of eight second grade class-'Ole ebe co"'folk - + . gotight"'Mifilie. a basal reading series. There were111111 wit's'
and 109 About 70 percent of theNkstorident° 09 non-NgS students.
o re ill 1414.t\ltiw _,130 wets classrooms in second grade in District Bobjects f*
Pak.,_ 'ft v'19, 'letIlsted as in first grade classrooms in District B during
1the
rnon-NRS group, only about 2% of those secondli*6.`977 For
tle Ms during 1977-1978 Participated as first grade subjectsauk\ %code
ttla Weler, the curriculum, Houghton-Mifflin is0-191lkie a district-de) This wide variation is due to the closing
of ti rlentehe n,F0Uom
fifth1,,he no- - Through schools. This study extends the' -'4. tdiee to the second grade--adding another ring totokle too 8--
%eNeritatioe god evaluation
Method'second graded students were pretested in October and
90% ".1...t....,,h0414
kttn el. May With Level C. Form S of the Comprehensive TestsOf 11 vted I
''''et Sills. Subtexts administered were Vocabulary, ReadingNb Sentences, and Reading Comprehension: Passages.
iffl vrthensubteete yields a score for Total Read. Class-
rot:IA.1 -.41au, r the Or"
ofdots. obtained through a teacher questionnaire, were
Class -
111.0ce°21. the first few months of 1978.%c duringiciand reaulta. Pretest and posttest means and standard
ilehAt1011)1------------.pevel C of the CTBS are shown in Table 5. The NRSati, fromell,. from13 scored slightl/r higher on both pretest and posttest.
A 5510 analysis was Conducted to determine if the differencepet.. k-egre
variable was significant. CTBSgreit:prsbaiLthe dependent
es'. groups was regressed on pretest and a dummy4/aiA
lead%1 de for Table 5 contains the correlation matrix
tis t covariables 0 the regressions the multiple R, and the raw _B
ificku regression solution. The B weight of . 54 for NRS isitlgkkt for
.1- (1r z19) =-' 135; hoseever, the pretest .79 B weight,,, is envie,/ 4 319, -..11Cant, as is the overall Mull R.,
21
2

Table 5
Study 5: 1977.1978 Within-District Contrast
Adtkrvernant Means and Standard Deviations of NRS and nonNRS Groups. Matched Cases
NRS 1113)
Pretest: CTBS Lava C
Non-NRS (109)
Total Raid 34.42 32.9216.56 16.71 S.D.
Posttest: CTBS Level CTotal Read 50.82 49.09
16.40 17.89 S.D.
Correlation and Regression IN 222)
1 2 3
1) CTBS Level C Pretest X
2) NRS .045 X
3) CTBS Level C Punta .22 .051 X
Sauk R .77' CTBS Posttest ...79")(1 +.54X2
'p <.01
Within-District Across-Grade Contrast: Study 5a
Population. Another contrast arose from the second grade study.This analysis was done to determine if there were cumulative effectsthat were undetected by the simple second grade contrast. This con-trast involves tracking NRS students over two years. By spring, 1978,there were 112 students who had been in the District B studies sincethe fall, 1976: 83 students in NRS and 29 students in the basal program.Clearly the contrast group must be viewed with caution, however,because the means for the full first grade group and the two-yearsample are quite similar as shown in Table 6.
Method. Achievement test scores for this contrast were compiledfrom the first grade fall 1976 administration of the Letter Names sub-test of the Murphy-Durrell and the spring 1978 administration of theCTBS Level C to second graders.
22
26

Table 6
Study 5a: 1976.1977 and 1977.1978 WithinDistrict and AcrossGrade Contrast
Achievement Means and Standard Deviations of NRS and nonNRS Groups: Matched Cues
NRS (83) Non-NRS (29)
Pretest: Murphy-DurrellLetter Names Total 47.78
4.07
Posttest: CTBS Level CTotal Read 62.33
16.72
46.003.79 S.D.
49.83 717.23 S.D.
Achievement Means and Standard Deviations of NRS and nonNRS Groups: Unmatched Cases
Pretest: Murphy-DurrellLetter Names Total
Posttest: CTBS Level CTotal Read
NRS NonNRS
45.97 (n 140) 42.02 (n 172) 76.97 9.44 S.D.
50.82 (n 113) 49.09 (n 109) 716.40 17.89 S.D.
Correlation and Regression (N- 112)
1 2 3
11 Murphy-Durrell Pretest X
21 NRS (1) .19 X
3) CTBS Level C Posttest .29' .07 X
Muit R CTBS Posttest 1.1*X1 + .50X2
p < .01
23
27

Analysis and results. Table 6 shows group means and standarddeviations of the pretest and posttest measures. The NRS groupstarted out slightly ahead of the basal group in first grade and endedup only slightly ahead at the end of second grade. The regressionanalysis used a dummy variable'for NRS (1). Table 6 presents thecorrelation coefficients, the multiple R, and the raw B weights for theregression solution. Again the B weight for NRS is not significant butsignificance was obtained for pretest, F (1, 109) = 9.16, as well asthe overall Mult R.
Process data for the grade two, District B classrooms werecollected during 1977-1978 via a questionnaire completed by theteachers. These data are identical for Studies 5 and 5a. The oppor-tunity and structure information is similar to previous years. In
terms of opportunity, NRS had fewer students, more adults, equivalentattendance, and lower allocation of reading time. Variables within thestructure construct reveal that in NRS classrooms, students were loreoften self-paced, used more games, had faster feedback, had individ-ualized assignments, were tested more frequently, and did better onteacher tests.
By second grade, some variables in the content construct havetaken on a different look as would be expected. For example, secondgrade NRS students engaged in letter-sound correspondence, letteridentification, and sound blending less often than the basal studentsand less often than they did in first grade. This can probatly beexplained by the fact that, in NRS, most of those kinds of exercisesare taught in the first faw levels, usually covered in the first grade.Second grade NRS teachers rate the curriculum as closely matchingwhat they consider to be important second grade reading objectives
(4. 5), while non-NRS teachers rate their curriculum less well (3.5).
24
28

Across-District Contrast: Study()
The final study to be presented here involves a contrast betweentwo school districts: District A, which was using NRS in first grade,and District C, using Scott-Foresman or Economy, both of which arebasal reading curricula. The study took place during 1976-1977 and
represents the third ring in the sot of contrasts. District A was
implementing NRS in all its first grade classrooms that year; asdescribed earlier, a second district was identified for use as a com-parable contrast group. This contrast provides a more rigorouscontrol for the effect of the innovation. Within District A, NRS wasclearly identified as the innovation, and it was possible that the non-NRS teachers were distressed at not having it. District C teachers,in contrast, did not know of the existence of NRS.
Population. Census tract data from 1970 revealed similaritiesbetween District C and District A in terms of SES and race. By early1976, when plans were being drawn up to establish District C as acontrol, the population in District A had begun to change. Threeclassrooms in two schools in District C closely resembled those inDistrict A with regard to SES and ,:retest information, so they wereused to represent the contrast group for the eight District A classrooms.
Method. Both groups were tested in the fall, 1976 with the Murphy-Durrell Reading Readiness Analysis, and in the spring, 1977 with the
Stanford Achievement Test. The Letter Names subtest from the Murphy-Durrell was used as the pretest measure and the Total Read score fromthe SAT was the criterion measure.
Analysis and results. Table 7 shows means and standard devi-ations for the groups on both pre- and posttests. NRS students startout slightly below the basal students, but end up well ahead of them.
The NRS group scored 2 points below the non-NRS group on 'the pre-test, but 12.3 points above the control grclp on the posttest. End-
25

of-year achievement for both groups was regressed on pretest and adummy variable code for NRS (1). Table 7 shows the correlationmatrix of the variables in the regression, the multiple R, and the rawB weights for the regression solution. Both B weights (pretest andNRS, 2.1 and 16.5) are significant, F (1, 238) = 77.42 and 25.04respectively.
Data regarding classroom practices were collected with an inter-view of the eight NRS District A teachers and the three comparisonDistrict C non-NRS teachers. These data are presented in the lastcolumn of Table 2. Variables in the opportunity construct show thatDistrict A classrooms had an equivalent number of students enrolled,adults in reading, and percent of students present. District A hadfewer minutes allocated to reading (200 minutes less per week), andslightly lower percentage of overlap.
Table 7
Study 6: 1976.1977 AcrossDistrict Contrast
Achievement Means and Standard Deviations of NRS and nonNRS Groups: Matched Cases
NRS (170) Non-NRS(71)Pretest: Murphy-Durrell
Letter Names Total 44.57 46.616.49 6.12 S.D.
Posttest: SATTotal Read 100.89 88.61
26.60 26.28 S.D.
Correlation and Regression (N +. 241)1 2 3
1) Murphy.Durrell pretest X
2) NRS (1) .14 X
3) SAT Posttest .45* .21' X
Mult R ..53" SAT 2.1'1(1 + 16 5')( 2
< .01
26 30
In the structure construct, NRS teachers unanimously reportedthat their classrooms were self-paced and that they used more games.NRS students got work corrected and returned to them more quickly,went for far fewer days between tests, and performed slightly betteron the tests, though the difference between groups was not dramatic.Most of the students in the District C group were assigned the samelessons as their classmates, while 90 percent of the students inDistrict A were assigned unique lessons.
The content construct reveals that the NRS group spent the sameamount of time engaging in letter-sound correspondence, slightly lesstime identifying letters, and the same amount of time blending. DistrictA teachers rated the match between NRS and what they thought to beimportant first grade reading objectives as 4.5, while District Cteachers rated the match as 2.5.
Discussion and Implications
The effects of NRS were assessed through several related eval-uations. Each new study contributed more information. The contrastscan be considered concentric rings expanding out to more distantsettings from the central starting point. Initial settings were geo-
graphically close, involved considerable support during the imple-mentation process, and used criterion measures that had a tightrelationship to what was taught. Later contrasts used settings thatwere further away, involved less support, and used more general
criterion measures.
After the initial field test of NRS in LRDC-affiliated developmentalschools, negotiations to implement the new curriculum in a schoolunrelated to LRDC were completed, and the first within-school con-
trast was established. Concerns of developers and school adminis-trators led the program into further implementation within that school
27

district, and the series of within-district contrasts was begun. Thesuccess of NRS in those two settings led to thci move complex contrastacross districts. The positive results of most of the studios conductedunder very different, increasingly demanding circumstances, with lessand less implementor assistance, speak well of the iterative, concentricapproach to implementation and evaluation.
The data support NRS as a successful first grade reading program.Four studies show NRS students performing considerably better thantheir counterparts using a variety of basal series (Scott-Foresman,Harper and Row, Houghton-Mifflin, and Economy). One study ofsecond grade students in one district did not show NRS students to havegained more than non-NRS students. We analyzed the second gradedata in two ways: first, a simple pre/post contrast; second, a longi-tudinal study of those students that were in either program for twoyears. This second contrast, while obviously suffering from selectionbias, was important in case we were observing students that had hadonly one year of NRS. One possibility is that many of the students inNRS in the second grade had moved out of NRS and were in a different
curriculum. However, this is only speculation. Further research isclearly needed to evaluate the effectiveness of NRS at the second grade.Five sets of process data were collected over the years. Generaltrends noted from the data are summarized.
Opportunity. NRS classrooms tend to have fewer students enrolledand more adults present during reading instruction. However, inStudy 2, the number of adults is almost equal. The percentage ofstudents present tends to be equivalent for NRS and comparison groupe.The number of minutes per week allocated for reading instruction
varies. It appears that even when NRS students have less time avail-able, they usually perform better. When the overlap estimate betweenwhat was taught and what was tested on the end-of-year achievement
28
32

measure was collected, the NRS group had a higher percentage ofoverlap in two out of three cases.
Structure. It is evident that NRS students were self-paced andused games as a part of reading instruction far more frequently thantheir non-NRS counterparts. NRS teachers corrected and returnedwork to students more quickly and made assignments on a moreindividualised basis. NRS students were tested more frequently andperformed better on those tests than did the basal students, indicatingthat they were tested on material they had learned.
Content. First grade NRS students spent more time than basalstudents and second grade NRS students engaging in letter-soundcorrespondence, letter identification, and blending. This trend ismost probably a function of the fact that the NRS curriculum presentsthose kinds of activities early in the first grade. NRS teachers,across all of the studies, rated the match between the curriculum andwhat they considered to be important first or second grade readingobjectives as a close match.
This paper used a set of sequential studies on the effectivenessof NRS as an example of a strategy for curriculum evaluation. These
studies follow the natural development and expansion of a curriculumprogram and provide convergent evidence for the value of a particularinnovation, NRS. None of the studies alone could provide convincing
evidence for the value of the curriculum, and even this collection ofstudies still leaves questions unanswered. We do know that the programcan be implemented successfully in several very different settingswith decreasing amounts of developer support. We can also see thatNRS is very successful in first grade classrooms on several differentdependent measures (two versions of the SAT and the CTBS). However,
the one study of NRS at the second grade did not provide evidence for
its success there. The strategy of cumulating several small studies--
29
in multiple settings is clearly feasible and follows the natural sequenceof development and implementation.
The strategy of iterative evaluation is not offered as a replacenientfor the two more prominent approaches currently available, experimentsand explanatory observational studies. Rather, iterative evaluation isseen as an alternative to waiting for the perfect evaluation conditions toprevail or to ignoring the natural production of evaluative information
that accompanies program development. Whether it is a desirablealternative remains to be seen.
30 34

Reference Notes
1. Beck, In. New Fri:nail, Grades Reading System: Previewof an atlautive reaang eystem. Paper presented at the annualrneetini of the American Educational Research Association,New Orleans, 1973.
2. Eichelbarger, R. T. , & Lee, J. Formative evaluation design forthe New ;leading System (NRS): 1973-74. Unpublished manuscript,Universit r of Pittsburgh, Learning Research and DevelopmentCenter, 1174.
3. Buehler, J. F. , & Eichelberger, R. T. Evaluation of an adaptivereading curr:tulum from a longitudinal perspective. Paperpresented at the annual meeting of the American EducationalResearch Association, Washington, D. C. , 1975.
4. McCaslin, E. S. Report of the first year implementation of theNew Primary Grades Reading System (NRS) in Kelly School (1974-1975 school year). University of Pittsburgh, undated draft.
31
3!

Reference.
Beck, I. L. Comprehension during the acquisition of decoding skills.In J. T. Guthrie (Ed.), Cognition, curriculum, and corrission.Newark, DE: International Reading Association, 1977.
Boruch, R. F., & Rindskopt, D. On randomised experiments,approximation to experiments, and data analysis. In L. Rutman(Ed.), Evaluation research methods: A basic guide. BeverlyHills, CA: Sago, 1977.
Cooley, W. W. Explanatory observational studies. EducationalResearcher, 1978, 7 (9), 9-15.
CTB/McGraw-Hill. Comprehensive Tests of Basic Skills. Monterey,CA: McGraw-Hill, 1973.
Madden, R., & Gardner, E. F. Stanford Early School AchievementTest. Level I. New York: Harcourt, Brace, Jovanovich, 1969.
Madden, R,., Gardner, E. F., Rudman, H. C., Karlsen, B., &Merwin, J. C. Stanford Achievement Test. Primary I Form A.New York: Harcourt, Brace, Jovanovich, 1964; 1973.
Murphy, H. A., It Durrell, D. D. Murphy-Durrell Reading ReadinessAnalysis. New York: Harcourt, Brace, & World, 1965.
Pintner, R., Cunningham, B. V., & Duroet, W. Pintner-CunninghamPrimary Test. New York: Harcourt, Brace, & World, 1966.
Wilkinsburg Gazette, August 28, 1974.
Willcinsburg Gazette, October 15, 1975.
Wilkineburg Gazette, March 17, 1976.
32
36