document resume - files.eric.ed.gov · questionnaires returned in 1983 by 88 farm families in the...
TRANSCRIPT
DOCUMENT RESUME
ED 269 213 RC 015 731
AUTHOR Rathge, Richard W.; Swenson, Cynthia L.TITLE An Evaluation of Use Value Production of Farm Wonen
in an Agricultural State.PUB DATE Aug 85NOTE 30p.; Paper presented at the Annual Meeting of the
Rural Sociological Society (48th, Blacksburg, VA,August 21-25, 1985).
PUB TYPE Reports - Research/Technical (143) --Speeches /Conference Papers (150)
EDRS PRICE MF01/PCO2 Plus Postage.DESCRIPTORS Comparable Worth; *Economic Research; Employed Women;
*Evaluation Problems; Farmers; *Farm Labor; *Females;Labor Economics; Labor Supply; Rural Areas; *RuralEconomic-; Rural Family; Rural Farm Residents; WomensStudies, Work Environment
IDENTIFIERS Economic Concepts; *Economic Effects; EconomicInfluences; *Farm Women; Labor Studies; North Dakota;Rural Sociology; Rural Women; Valuation Theory
ABSTRACTResearchers explored farm women's economic
contributions to the family farm--an economic contributiontraditionally underestimated or ignored--employing use valueproduction as an indicator of labor. Active labor, usually defined ascommodity production, was broadened to include 'value production, orall activity contributing to making a living. Household and farm taskperformance was measured (controlling for time of season and size aidtype of operation), couparataive labor inputs nere investigated, anooff-farm employment motives and earnings were explored.Questionnaires returned in 1983 by 88 farm families in the easternhalf of North Dakota provided data. Women were found to contributemore labor to farm tasks in the fall, on smaller farms, and onlivestock farms, contributing at least 40 hours a week on the averageto farm tasks. Women also performed 90% rf the household tasks whichconsumed 80 hours a week on the avczage. Nearly one in three womenreported off-farm employment; non -farm expenses and maintaining theircareers were major reasons given. Distance and lack of availableemployment were found to pose the most difficulties for farm women inoff-farm employment. Tables and figures present survey data by farmsize and type and illustrate off-farm employment; an appendix listsfarm and household tasks used in the survey. A Clort list ofreferences concludes the document. (LFL)
***********************************************************************
Reproductions supplied by EDRS are the best that can be madefrom the original document.
******************************************************************. t**

An Evaluation of Use Value Production ofFarm Women in an Agricultural State
'PERMISSION TO REPRODUCE THISMATERIAL HAS BEEN GRANTED BY
dant W .
TO THE EDUCATIONAL RESOURCESINFORMATION CENTER (ERIC)
U S OEPARTMEN OF EDUCATIONOffice of Educattonal Research and Improvement
EDUCATIONAL RESOURCES INFORMATIONCENTER (ERIC)
Iithts document has been reprnduced asrecetved from the person or organizationortginating ttKrum changes have been made to improvereproduction aualtty
Points of view or dpintons stated in thisdocu',lent do not necessarily represent offictalOE RI position or policy
by
Richard W. Rathge and Cyntnia_L. Swenson
Departments of Agricultural Economics and SociologyNorth Dakota State UniversityFargo, North Dakota 58105
Vm4
bo Paper presented at the Annual Meeting of th:I.Rural Sociological Association,Blacksburg, VA, August 21-25, 1985.
r04
2

a AN EVALUATION OF USE VALUE PRODUCTION OFFARM WOMEN IN AN AGRICULTRUAL STATE
by
Richard W. Rathge and Cynthia L. Swenson
The economic contribution of farm women to the family farm has
traditionally been underestimated and largely ignored. Ironically, this
lingering oversight has occurred inspite of research contributions documenting
farm 'omen's extensive involvement in agricultural enterprises. For example,
the time budget studies of the 1920s (e.g., Crawford 1927, Wilson 1929)
promoted and supprted by the 1925 Purnell Act, offered quantifiable
evidence of farm women's labor input. More contemporary studies have outlined
the diversity of farm women's tasks (Fassinger and Schwarzwefler 1984; Jones
and kosenfeld 1981), wives participation in farm management (Sawer 1973;
Wi'kening and Bharadwaj 1967), and the resultant impact on American as well as
foreign agriculture (Gasson 1980).
Recent investigations into the economic contributions of homemaking
activities, a parallel body of knowledge, additionally substantiates the
largely unrecognized yet valuable unpaid labor input of v,omeli to families and
households. One facet of this research has been to estimate the dollar value
of homemakers' activities (e.g., Murphy and Peskin 1981; Gauger and Walker
1973; Brody 1975). Calculations, typically based on replacement costs,
indicate the finarcial worth of homemaking varies dramatically. Estimates for
the early to mid 1970s ranged from $4,000 to $20,000 annually (Hefferan 1982).
The pronounced variability in these figures, in part, reflects the wide
spectrum of recognition given to roles homemakers perform. In spite of a
general lack of consensus, however, these efforts are beginning to receive
attention from legislators, lawmakers, and public officials. Nonetheless,
farm women as well as other women in many parts of the country remain

- 2 -s
victimized by discriminatory inheritance tax laws, undercompensated in divorce
settlements, wrongful death or personal injury lawsuits, and unrecognized by
creditors, social security adjustors and loan officers.
This paper attempts to extend our understanding of farm women's
economic contributions to the family farm by exploring the conceptual
definition of work Conventional wisdom or neo-classical economics suggests
"active labor" is confined to commodity production. (i.e., the production of
goods and services for exchange). We broaden this perspective by viewing
value production (i.e., all activity which contributes to "making a living")
as a more appropriate indicator of active labor. Thus, we include both
income-earning and non income-earning labor in our calculations of the
economic activity of farm women. This is accomplished by measuring farm
women's household and farm task performance controlling for time of season and
size and type of operation. We conclude our paper with a discussion of
relevant policy implications.
Defining Active Labor
The definition of active labor hingts on the conceptualization of
"economic activity." From an orthodox perspective, the roots of economic
activity are found in capital growth and accumulation, particularly in
relation to commodity production. Classical economists would emphasize Lhat
the relative value of commodity production rests in its exchange potential in
the market. As a result, the market is the benchmark for determining what
constitutes labor and in providing parameters for assessing its corresponding
value. From this orthodox economic perspective, it follows that activities
not directly tied to the market mainstream are peripheral and considered
noneconomic (Beneria 1981). In brief, active labor is "commoditized" labor,
that is activities which produce goods and services for exchange. Labor force
3 -
Partic;pation, therefore, is measured in terms of its direct ties to the
market. Thus, farm -bases activities or homemaking tasks are defined as active
labor only if they produce goods or services for exchange. This theoretical
framework has woven its way into the national income accounting and labor
force statistics network
This theoretical framework has numerous drawbacks. The most obvious
and pertinent to the present discussion is how one differentiates between
activities which produce a good or service for exchange from those that do
not. For example, in farming does fieldwork, barn chores, or maintenance
functions (e.g., machinery repair, household upkeep, food preparation)
independently produce a good? Those'in farming would, most likely, agree that
it is all three in concert which produce the product. As Fassinger and
Schwarzweller (1984) suggest, farming is a multifaceted economic organization
which involves both farm labor inputs and hidden factors of production.
However, historically only those who earned a wage or were labeled "unpaid
13-farm worker' were viewed as economically active. Household chores, food
preparation, child rearing and other important maintenance functions have not
fallen within the definition of unpaid farm worker even though some fieldwork
and machinery maintenance has. As a result, these tasks remain excli.led from
the category of "productive work." Since women and children most often
perform this type of labor, their unpaid efforts are largely unrecognized.
It is argued that this rather narrow approach to viewing the economic
system is misleading. Beneria, (1981) for example, suggests that the
exclusion of nor-commodity production distorts both the analysis of economic
activity and labor force participation by undervaluing women's work. Her
position is that both use and exchange values _hould be included in the
definition of active labor.
5

- 4 -
Use value production can be defined as all non income-earning activity
which contribute to the production of goods and services for the satisfaction
of human needs. Its importance and underlying link to the economic system can
best be seen by evaluating how people "make a living" as compared to the more
restrictive notion of how people "earn a living." The latter notion taps the
income-earning activies of households while the former investigates all
aspects of "work." On the surface, the semantics seem to be cutting a fine
line with regard to the definition of work yet, the two notions are
distinctly different. This paradox reflects the intu.tively integral
relationship between commodity and non-commodity production juxtaposed with
the currently inadequate indicators of active labor. It i important to note
that use value production only encompasses work related tasks and does not
include leasure or recreational activity. Admittedly, there are difficulties
with ambiguity (e.g., cooking for recreation) but this problem is not confined
to use value production. Similar contridictions arise in commodity production
(e.g., hunting, handicrafts).
There are several benefits to using this broader definition of "active
labor." First, it offers researchers a more realistic tool to invesitgate the
economic contributions members make to their household or family's economic
well-being. Second, this technique may help expose sexist misconceptions of
women's labor activities and initiate a more responsible evaluation of their
efforts. Third, this approach will provide a more appropriate indicator of
the effects of changing technology on all workers including homemakers.
Finally, a more accurate picture of the unemployed or underemployed derived
from use value production statistics may improve our strategies for assisting
these individuals (e.g., employment programs).

e
- 5 -
This paper takes advantage of the first of these benefits by
re-evaluating North Dakota farm women's economic contribution to their family
farms. We first examine both the diversity and time commitment of farm women
to farm and household tasks. Secondly, we investigate tne comparative labor
inputs of farm women. Finally, we describe what motivates farm women to se,k
off-farm employment, what factors impinge on their ability or choice to work
off the farm, and how the money they earn off the farm is spelt.
Methods
Data was obtained from a random survey of farm households in the
eastern half of North Dakota. The study was restricted to the eastern
of the state to avoid the impact of rapid energy development (i.e., c
and natural gas exploration and extraction) which began during the m
Mail questionnaires were sent to farm households in the spring of
telephone follow-up survey was conducted to assess nonresponse bi
found that nonrespondents were primarily single males, widowers
elderly. A total usable sample of 88 farm families was analy
The questionnaire was divided into several sections.
included general information about the size and type of op
acreage, crops, livestock). The next two sections detail
tasks. This portion of the questionnaire replicated th
Fassinger and Schwarzweller 1984). In brief, a list o
household tasks were given and the respondent instru
members who "normally" did the corresponding task o
that task. The respondent was requested to also
hours per week each task took. In addition, ag
average number of hours spent on farm and hous
(i.e., spring, summer, fall, winter) were inc
7
portion
oal, oil,
id 1970s.
983. A
as. It was
, and the
ed.
The first section
ration (i.e.,
ed farm and household
work done by
f 29 farm tasks and 21
ted to identify family
r "helped" in performing
report the average number of
regrate measures of the
ehold tasks for each season
luded. Finally, a question was

6
asked to assess the proportion of farm and household labor each member
contributed. The fourth section of the questionnaire gathered information
concerning off-farm labor. Items focused on a) type and amount of off-farm
labor, b) the main reason for off-farm labor, and c) what the money was spent
on. A final section was dedicated to demographics (i.e., age, education,
location).
Farm Types
Farms were classified according to their scale and type. First, scale of
operation was divided into three groupings, large, medium and small. Large
farms were defined as those with more than 2,000 acres (N=16). Medium sized
farms were those with at least one section of land (540 acres) but less than
2,001 acres (N=42). The average farm in North Dakota had 1,104 acres in 1982.
Small farms were defined as those with less than one section of land (N=30).
Farms were also dichotomized into livestock (N=41) and non-livestock
(N=47) operations. A livestock operation contained at least one of the
following: a) more than 20 head of beef, b) more than 80 head of hogs, c)
more than 60 dairy cows, d) more than 50 poultry, or e) more than 20 head of
other livestock (e.g., horses, sheep). All other farms were defined as
non-livestock operations.
Measuring Use Value
Use value was quantified in two ways. First, we focused on the temporal
dimension. Respondents were asked to report the number of hours a week they
generally spent on 29 item specific farm tasks and 21 identified household
tasks (see Appendix 1). We assumed that part of the difficulty in
undervaluing unpaid farm and household work is that much of it is unrecognized
or taken for granted. If this lack of recognition is internalized, it is
8
7 -
likely that a respondent would not include many activities in their general
assessment of the contribution they offer to the family farm. Thus, we used
the sum of hours spent on individual tasks as an indicator of their actual
input into the farm. Correspondingly, we used their assessment of the average
number of hours spent on farm and household tasks, respectively, as a measure
of their perceived input into the family farm.
The second dimension we considered was that of comparative! labor input.
Since time is only meaningful in a comparative context, we attempted to
evaluate labor contributions relative to other members of the household. This
was accomplished in two ways. First, we asked what percent of farm and
household tasks, respectively, were performed by members of the household.
This would prcwide us with a general indicator of perceived labor
contributions. One obvious difficulty is that this judgment was made based un
one person's observations, thus, probably slanted accordsny to his or her
perspective. Second, we asked the respondent to indicate "who does" and "who
normally helps" do each of the 29 farm and 21 household tasks. This part of
the analysis replicated the work done by Fassinger and Scnwarzweller 1984. In
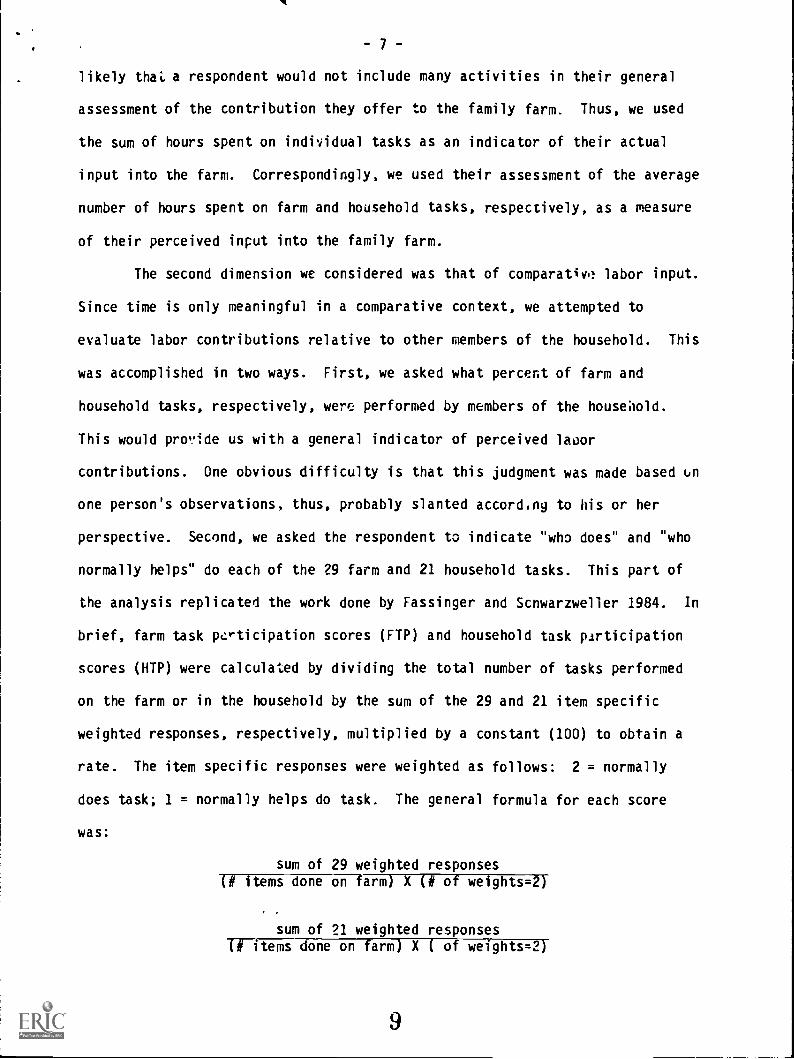
brief, farm task participation scores (FTP) and household task participation
scores (HTP) were calculated by dividing the total number of tasks performed
on the farm or in the household by the sum of the 29 and 21 item specific
weighted responses, respectively, multiplied by a constant (100) to obtain a
rate. The item specific responses were weighted as follows: 2 = normally
does task; 1 = normally helps do task. The general formula for each score
was:
sum of 29 weighted responses(# items done on farm) X (# of weights=2)
sum of 21 weighted responses(# items done on farm) X ( of weights=2)
9

8 -
A score of 100 can be interpreted as that person performing all of the tasks,
while a. score of 25 represents a contribution of only 25percent.
Findings
Time Dimension
Several interesting findings were revealeo with respect t.) the amount
of time farm women contributed to farm and household tasks. First, we
investigated shifts in time demands which paralleled the seasons (i.e.,
spring, summer, fall, winter). Respondents were asked to indicate the average
total number of hours per week they spent on farm tasks each season. As one
might suspect, there was a marked difference in the number of hours women
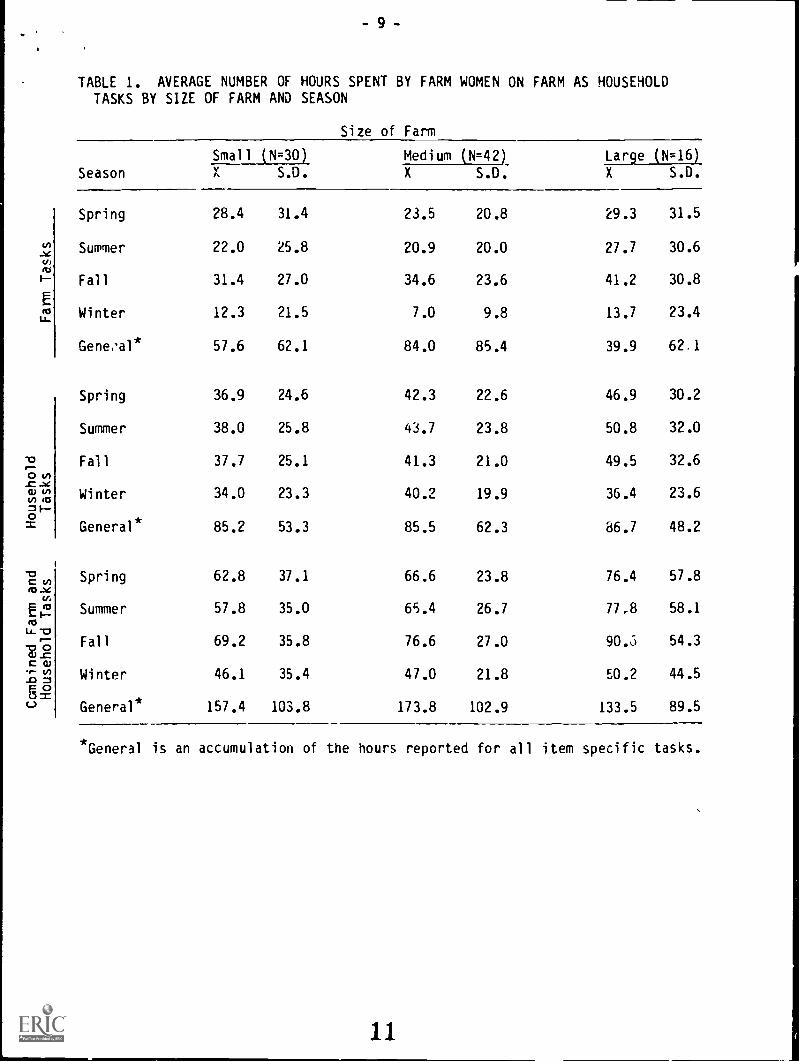
contributed to farm tasks depending upon the season of year. Winter months
tended to demand less of farm women (i.e., an average of 7 to 13 hours per
week) with respect to farm tasks compared to spring and fall (i.e., an
average of 23 to 41 hours per week). In general, farm women spent twice to
three times the number of hours in spring and fall on farm tasks then they did
during the winter months (see Table 1).
Second, following the evidence provided by Fassinger and Schwarzweller
(1984), we analyzed the impact of farm size on farm women's labor input. Size
of operation tended to have a slight impact on the number of hours farm women
spent on farm tasks. Table 1 indicates that women on medium sized farms, in
general, contributed fewer hours to farm task, on the average, than did women
on larger or smaller farms. Fall seemed to be the major exception to this
observation.
It is interesting to note that the size of the farm seemed to have a
much greater impact on the number of hours farm women spend on household tasks
than farm tasks. As seen in Table 1, the larger the farm size, the more time
farm women spent on household tasks on the average. This is particularly
10
9
TABLE 1. AVERAGE NUMBER OF HOURS SPENT BY FARM WOMEN ON FARM AS HOUSEHOLDTASKS BY SIZE OF FARM AND SEASON
Size of Farm
Season
Small (N=30) Medium (N=42) Large (N=16)vh S.D. X S.D. X S.D.
Spring 28.4 31.4 23.5 20.8 29.3 31.5
Summer 22.0 25.8 20.9 20.0 27.7 30.6
Fall 31.4 27.0 34.6 23.6 41.2 30.8
Winter 12.3 21.5 7.0 9.8 13.7 23.4
Gene,.al* 57.6 62.1 84.0 85.4 39.9 62.1
Spring 36.9 24.6 42.3 22.6 46.9 30.2
Summer 38.0 25.8 43.7 23.8 50.8 32.0
Fall 37.7 25.1 41.3 21.0 49.5 32.6
Winter 34.0 23.3 40.2 19.9 36.4 23.6
General* 85.2 53.3 85.5 62.3 86.7 48.2
Spring 62.8 37.1 66.6 23.8 76.4 57.8
Summer 57.8 35.0 65.4 26.7 77,13 58.1
Fall 69.2 35.8 76.6 27.0 90.3 54.3
Winter 46.1 35.4 47.0 21.8 50.2 44.5
General* 157.4 103.8 173.8 102.9 133.5 89.5
*General is an accumulation of the hours reported for all item specific tasks.
11

10 -
notable since the amount of time farm women dedicated to hour;ehold tasks
flucuated little over the different seasons.
In general, farm women's investment in farm and household tasks are in
themselves equilavent to full-time employment. During the slowest farm
season, win' ", farm women spee an average of more than 4C hours a seek on
farm and household tasks (see Table 1). In contrast, during the more active
fall months, farm women contributed an average of 69 to 91 hours a week on
farm and household tasks depending on the size of their operation.
A third aspect related to the time dimension of farm women's labor we
explored was the impact of recall. We assumed that farm women would be likely
to underestimate their involvement in farm tasks when responding to global
measures of time similar to those reported earlier. To assess this bias, we
averaged the time farm women ildicated they spent on each of the 29 item
specific farm tasks listed in Appendix 1. The average time commitment of farm
women to farm tasks according to this measure (noted as "general" in Table 1)
was nearly twice that indicated by the global variable, regardless of season.
The interesting exception was larger farms where the "general" measure was
slightly low, than the global indicator for fall. The average time spent on
household tasks, hcwever, was consistently higher when using the "general"
variable as opposed to the global season specific indicator. It is difficult
to determine which portrays a more accurate picture of farm women's labor
involvement. The discrepency in these two indicators would seem to suggest
that farm women respond to a much narrower definition of farm labor when
reporting their overall involvement in their farm than they do when reporting
item specific involvement.
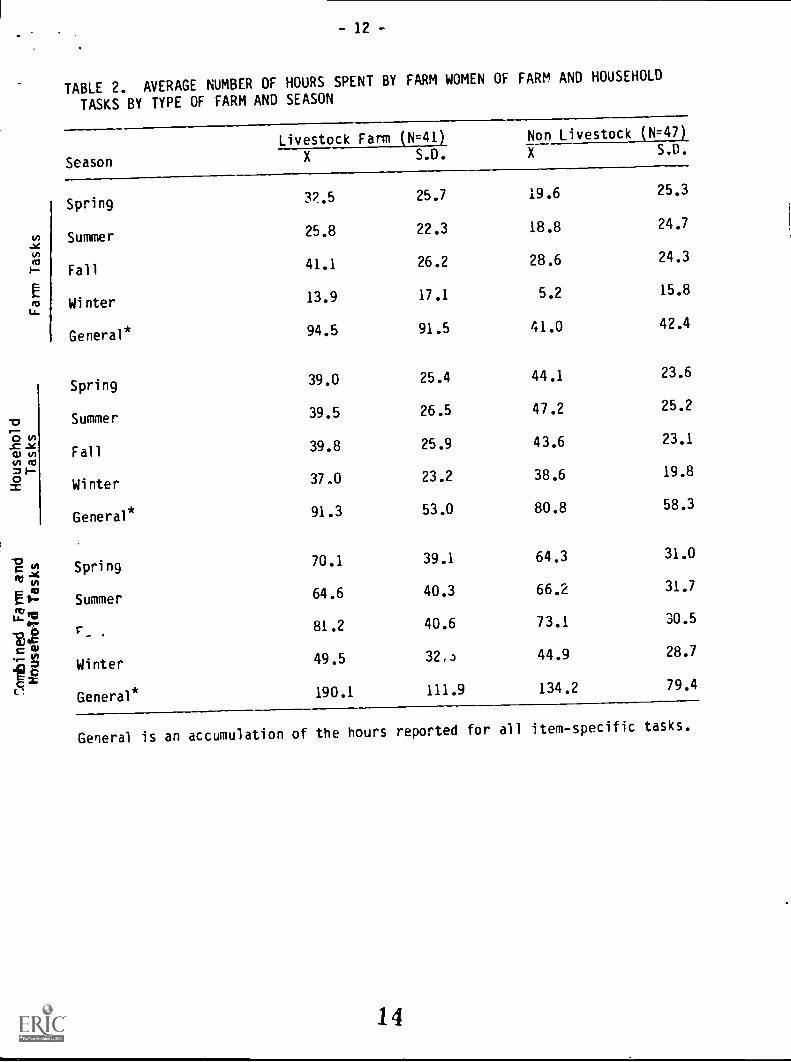
A final temporal dimension we investigated was the impact the type of
farming operation had on farm women's time demands. The type of farm
12

11
operation appears to be a more important contributor to differentials in farm
women's time commitments to farm and household tasks than does size of
operation. Women on livestock farms, for example, invested much more time in
farm tasks, on the average, than did women on non-livestock farms (see Table
2). In contrast, women on non-livestock farms tend to spend slightly more
time on household tasks on the average. In additi-n, seasonal shifts effected
non-livestock farm women's time contribution to household tasks more markedly
than livestock farm women. The extreme difference between the global measure
of time and Cie general task spr-4fic accumulation indicator is still
apparent.
Comparative Labor Input
The traditional stereotypic picture of gender specific roles emerge
when comparing the lbor inputs of household membErs to the farm. When we
isolated farm labor contributions, men tended to provide t:-..-: largest
proportion of farm labor regardless of size or type of farming operation (see
Table 3). It is interesting to note, however, that their contribution
declined significantly as the size of the operation increased. Women and
others (e.g., children, hired labor) tended to increase their labor
contribution with the expanding size of the farm. In general, more than one
in four women reported not contributing labor to their family farm.
Ironically, half of these women cited performing at least -',..wo of the 29 farm
tasks detailed in Appendix 1. It would appear that farm women's definition of
farm labor input is narrowly defined.
The type of farm operation hi-,s a notable impact on women's on-farm
labor. Only 14 percent of the women on livestock farms indicated they
performed no farm labor while 20 percent on non-livestock farms made that
claim (see Table 2). Twice as many livestock farm women reported conducting a
13
-12-
TABLE 2. AVERAGE NUMBER OF HOURS SPENT BY FARM WOMEN OF FARM AND HOUSEHOLD
TASKS BY TYPE OF FARM AND SEASON
Season
Livestock Farm (N=41) Non Livestock (N=47)
X S.D. X S.D.
Spring 32-5 25.7 19.6 25.3
Summer 25.8 22.3 18.8 24.7
Fall41.1 26.2 28.6 24.3
Winter 13.9 17.1 5.2 15.8
General* 94.5 91.5 41.0 42.4
Spring 39.0 25.4 44.1 23.6
Summer 39.5 26.5 47.2 25.2
Fall 39.8 25.9 43.6 23.1
Winter 37.0 23.2 38.6 19.8
General* 91.3 53.0 80.8 58.3
Spring 70.1 39.1 64.3 31.0
Summer 64.6 40.3 66.2 31.7
r_ .81.2 40.6 73.1 30.5
Winter 49.5 32.3 44.9 28.7
General* 190.1 111.9 134.2 79.4
General is an accumulation of the hours reported for all item-specific tasks.
14

- 13 -
TABLE 3. PERCENT OF FARM LABOR CONTRIBUTED BY MEMBERS OF THE HOUSEHOLD BY
0H
ili3;mt.
1) =
cucn Up
M'1111
o
W HW z
..ne
.po,,,,-(11N.t
H___Iz
c02:
SIZE AND TYPE OF FARM OPERATION
PERCENT OF FARM LABOR
HouseholdMember None
Modest(1-9%)
Medium(10-44%)
Large(50% or more)
x S.D.
Wife
Husband
Other
Wife
Husband
Other
Wife
Husband
Other
Wife
husband
Other
Wife
Husband
Other
27.3
40.0
7.7
5.2
21.1
28.6
7.1
1
13.9
31.4
20.5
7.9
16.2
18.2
28.2
18.4
28.6
7.2
11.1
11.4
38.5
10.9
40.9
9.1
55.0
59.0
25.6
44.7
35.7
42.9
50.0
66.7
16.2
48.6
33.3
31.6
48.6
13.6
90.9
5.0
5.1
69.2
15.8
7.1
50.0
35.7
8.3
83.8
8.6
7.7
60.5
24.3
15.6
71.0
14.4
16.0
63.9
22.5
10.5
47.6
40.9
18.4
67.0
15.8
11.6
59.1
31.5
17.9
18.6
16.4
16,2
26.6
22.9
14.1
23.7
26.8
14.9
19.6
18.8
17.0
28.9
25.5
15

- 14 -
medium amount of labor (i.e., between 10 percent and 50 percent) as did
non-livestock farm women. Interestingly only 60 percent of the husbands on
non-livestock farms reported doing the majority of farm labor compared to 84
percent on livestock farms.
Hous,..nold labor was overwhelmingly performed by the wife (see Table 4).
In only one instance was the husband credited with more than 30 percent of the
household labor. It is noteworthy to point out that almPst the majority of
children and other household members were reported as non-contributors to
household labor, regardless of size or type of farming operation.
A second dimension of labor input we investigated was the possible
discrepency in perceived labor input and actual labor contributions. We
assumed farm women would undervaluate their comparative farm labor input
because of stereotyping and a general lack of recognition of the integral part
they typically play in the farming enterprise. Using the methods employed by
Fassinger and Schwarzweller (1984) we calculated both farm task participation
scores (FTP) and household task participation scores (HIP) for farm women.
These scores offer a comparative measure of farm women's labor by dividing the
number of tasks she performed after adjusting for her effort in conducting
these tasks (i.e., 2 paints for doing the task and 1 point for helping), by
the total number of tasks reported.
As seen in Table 5, the vast majority of the 29 farm tasks were
reported as being done. Respondents on the small farms reported Londucting an
average of 25 of the 29 tasks while those on medium and larger farms reported
an average of 27 tasks performed. It is interesting to note that no
meaningful difference is found in the number of farm tasks performed by type
of farm operation.
16

TABLE 4.
BY SIZE
- 15 -
PERCENT OF HOUSEHOULD LABOR CONTRIBUTED BY MEMBERS OF THE HOUSEHOLDAND TYPE OF FARM OPERATION
HouseholdMember
Wife
.--cp,...- eq
m 1, HusbandE z1/1".--
Other
Em Wife
= C\14- r. cro il HusbandCU Zw ..---
,.... OtherN
WifeCU VDC1 .-4 I1- H K4sband10 2:-I---
Other
- WifeU0---
H 4 Husbanda) H>:im
f::-- Othermu.
.4-
O 0O Wife
Ca 4$ -VI 1`..
I-- >a)
II
ezrHusb-id
,..-z_Is-cO OtherZ
PERCENT OF HOUSEHOLD LABOR
None
Modest(1-10%)
Medium
(11-30%)
Large(Above 30%)
x S.D.
2.5 97.5 90.2 7.7
12.5 70.8 16.7 7.7 7.1
58.3 37.5 4.2 2.5 4.6
100.0 84.9 13.9
10.3 59.0 28.1 10.3 11.2
42.1 44.7 13.2 5.2 7.9
100.0 92.6 6.5
23.1 69.2 7.7 5.8 5.9
54.6 45.4 1.8 2.3
100.0 86.5 10.1
8.1 64.9 27.0 9.9 8.8
50.0 41.7 8.2 4.0 6.3
2.5 97.5 89.1 12.7
18.0 64.1 17.9 2.6 7.5 9.8
48.7 43.3 8.0 3.6 6.7
17

- 16 -
TABLE 5. AVERAGE NUMBER OF TASKS REPORTED, PERFORMED BY FARM WIFE, AND FARMWIFE'S FARM TASK PARTICIPATION SCORE BY SIZE AND TYPE OF FARM OPERATION
Type and Sizeof Farm Operation
Farm TasksReported
Farm Task Performed Farm Wife Farm TaskBy Farm Wife Participation Score (FTPj
X S.D. X S.D. X S.D.
Small (N=30) 25.4 4.6 12.3 10.5 30.0 22.7
Medium (N=42) 27.3 2.6 13.8 10.1 30.1 19.3
Large (N=16) 27.2 2.6 11.0 9.1 26.4 22.6
Livestock ?6.9 2.8 15.9 10.3 34.8 21.1
Non Livestock 26.4 4.1 10.1 9.0 24.4 19.6
18

- 17 -
Farm women reported conducting slightly fewer than half of the farm
tasks performed on their farm. Women on medium-sized farms did slightly more
farm tasks (13.8) on the average while those on larger farms performed a bit
fewer tasks (11.0) on the average. Nonetheless, farm women participated in
more than 26 percent of the farm labor, on the average, according to the FTP
scores; 30 percent for those on medium and small farms. This measure of farm
labor participation is in stark contrast of the global measure obtained by
asking the respondents what percent of farm labo Tmen contributed. As seen
in Table 3, the average contribution of farm women was half that indicated by
the FTP score in Table 5; mean contribution scores of 10.5 percent to 16.0
percent compared to FTP scores of 26.4 to 30.1. Once again, it is difficult
to determine which measure is a more accurate indicator. The discrepency,
however, does underscore the compltx nature of assessing farm women's economic
contribution to the farm and reinforces the potential significant
underestimation of women's farm labor even among farm women themselves.
Similar to farm tasks, the vast majority (i.e., 19 to 21) of the
household tasks were also reported as being done (see Table 6). In contrast
to farm tasks, however, little variation in the number of household tasks
performed was noted by size or type of farm operation. More than 16 of the 21
tasks were conducted by the farm wife, on the average. Women on small farms
and non-livestock farms reported performing slightly fewer household tasks, on
the average, than did their counterparts on medium and large farms or
livestock farms.
It is noteworthy that the discrepency between HTP scores reported it
Table 5 and the average household contribution reported in Table 4 is mach
less than for farm tasks. In fact, in relative terms the difference is nct
significant. This suggests that respondents conception of farm women's
19

- 18 -
TABLE 6. AVERAGE NUMBER OF HOUSEHOLD TASKS REPORTED, PERFORMED BY FARM WIFE,AND FARM WIFE'S HOUSEHOLD TASK PARTICIPATION SCORE (HTP) BY SIZE AND TYPE OFFARM OPERATION
Type and Sizeof Farm Operation
Farm TasksReported
Farm Task PerformedBy Farm Wife
Farm WifeParticipation
Farm TaskScore (FTP)
X S.D. X S.D. X S.D.
a)
Small (N=30) 19.1 1.9 16.2 5.1 80.5 14.7
N.r- Medium (N=42) 19.6 1.3 17.0 3.9 83.7 10.0V)
Large (N=16) 19.5 2.3 17.4 3.3 85.4 10.0
Livestock 19.6 1.2 17.6 3.2 84.1 11.5
I- Non Livestock 19.2 2.1 16.1 4.9 81.8 12.0
20

- 19
household labor is much more defined than is their corresponding farm labor
contribution.
Off-Farm Labor
Nearly one in three farm wives reported off-farm employment (See Figure
1). An additional 12 percent indicated they were locking for off-farm
employment. A slightly smaller proportion of farm husbands (22 percent)
reported both on and off-farm jobs. The majority of respondents (60 percent),
however, indicated that neither husband or wife worked off the farm; only 14.3
percent of the farms had dual career spouses who worked part-time off the
farm.
It is interesting to note that more than half of the farm women cited
expenses as the major reason for their off-farm employment (See Figure 2).
More notably, nonfarm expenses were mentioned more than twice as often (38.5
percent) as the precipitating cause for farm women's o:f-farm employment
compared to farm expenses (17.9 percent). This is supported by the fact that
30 percent of the off-farm income farm women generated went to home expenses,
on the average, compared to only 5 percent being spent on farm expenses.
Additionally, nearly one in four farm women (23.1 percent) indicated they held
off-farm jobs to maintain their careers.
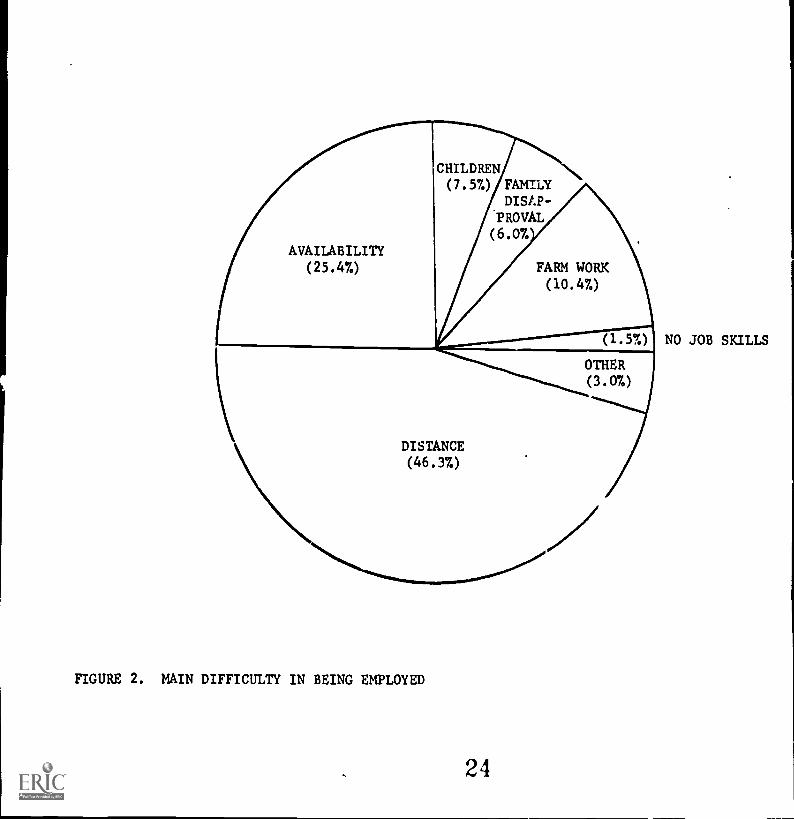
Finally we investigated what factors posed the most difficultly for
farm women in securing off-farm employment. Distance was mentioned by nearly
half (46.3 percent) of the respondents (See Figure 3). This response was not
surprising given the sparsely populated nature of North Dakota. A close
correlate to distance was the lack of available employment, cited by more than
one in four farm women as the major difficulty in securing employment. Wages
were curiously not mentioned by farmwomen as a major obstacle in off-farm
employment.
21

22
60
50
40 -
300-
20
10
0-
WIFE HUSBAND NEITHER BOTH HUSBAND WIFEONLY ONLY
FIGURE 1. OFF-FARM EMPLOYMENT23
DISTANCE(46.3%)
FIGURE 2. MAIN DIFFICULTY IN BEING EMPLOYED
24
NO JOB SKILLS

OTHEREXPENSES(38.5%)
GET OUT OFHOUSE(12.8%)
OTHER(7.7%)
FARM
EXPENSES(17.9%)
MAINTAINCAREER(23.1')
FIGURE 3. MAIN REASON FOR HAVI1G OFF-FARM EMPLOYMENT
23 -
Summary and Conclusions
We investigated in this antic;., the use value production of farm women
in North Dakota. Use value production recognizes non-income earning activity
(non-market production) as a vital component in the contribution to economic
well-being. This is particularly relevant when investigating the economic
input of women to their family farm since many do not earn a wage either on or
off the farm, yet they serve an important economic role. We found this to be
true in North Dakota as fewer than one in three farm women surveyed held
off-farm jobs and the vast majority did not receive a farm wage. Nonetheless,
they participated in more than 26 percent of the farm tasks performed on the
farm and cortributed at least 40 hours a week to farm-related tasks on the
average. This effort was above their household chores which consumed twice
that amount of time on the average. Moreover, farm women were left with the
overwhelming burgen, (i.e., more than 80 percent of the tasks) of the
household.
It is unrealistic to continue excluding farm women's economic
contribution to their farm. Inappropriate legislation (e.g., inheritance
tax), regulations (e.g., credit ratings, social security benefits) and
stereotypes continue to victimize farm women simply because labor statistics
are tied to the market. Yet, non-market activity, as shown in this paper is a
substantial component of the total labor involved in farming. If we are to
more acurately assess labor force activity, and more justly compensate those
involved in labor (e.g., divorce settlements, wrongful death benefits, social
security) we need to broaden our conception of work. The utilization of use
value production as an indicator of labor, we believe, is a positive first
stop.

APPENDIX

FARM TASKS
(1) Plan Cropping Schedule
(2) Prepare Fields for Planting
(3) Plant Small Grains(4) Plant Row Crops
(5) Apply Fertilizer(6) Apply Chemicals(7) Cultivate Row Crops(8) Work Summer Fallow
(9) Combine Small Grains(10) Haul Small Grains(11) Combine Row Crops(12) Haul Row Crops(13) Cut, Put Up Hay(14) Check Market Prices
(15) Haul Grain to Elevator
HOUSEHOLD TASKS
- 25 -
Appendix 1
FARM TASKS
(16) Buy, Get Machine Parts(17) Buy Farm Equipment(18) Minor Machine Repairs(19) Major Machinery Overhaul
(20) Fix Fence(21) Pay Farm Bills(22) Do Farm Bookkeeping(23) Feed Livestock(24) Do the Milking(25) Clean Milking Parlor(26) Clean Barns, Feeders(27) Care for Young Stock(28) Care of Poultry(29) Other Farm Tasks
HOUSEHOLD TASKS
(1)
(2)
(3)
Fix Breakfast
Cook DinnerCook Supper
(12) Dust Furniture(13) Vacuuming, Floor Care(14) Wash Windows
(4) Set Table (15) Repair Small Appliances
(5) Wash Dishes (16) Plumbing Work
(6) Grocery Shopping (17) Carpentry Repairs
(7) Baking (18) Tend Vegetable Garden
(8) Canning and Freezing (19) Yard Work
(9) Clothing Care (20) Pay Household Bills
(10) Child Care (21) Other Household Task
(11) Child Transportation

..i
- 26 -
Notes
1. The Purnell Act, which was passed by Congress in 1925, appropriated moneyto support research including rural home management studies. One
objective of these studies was to investigate homemakers' use of time inorder to offer suggestions which might promote efficient time mamagementand increase the availability of leisure time.
2. Prior to 1900, the Departments of Commerce and Labor did not reportunpaid work of family farm members. However, in 1910 a sensitivity to theimportant roles unpaid laborers performed, especially in an agriculturalcontext, forced a :Aefinition of active labor. People working regularlyat outdoor farm work (note the restriction to "outdoor") yet not receivinga wage were categorized as unpaid farm labor (Hill 1929). it is importantto note that this definitional alteration produced a 144 percent increasein women agricultural laborers between 1900 and 1910 as reported by theCensus Bureau. Distrusting of these figures which indicated that one infour farm laborers were women, the Department of Commerce again modifiedthe definition to distinguish between farm laborers working on their ownfarm and those working off their farm. The end product of this slightalteration combined with a January rather than April enumeration date wasa 45 percent reduction in the proportion of women farm laborers between1910 and 1920. Nonetheless, nearly one in three farm laborers on homefarms were women and, overall, one in five farm laborers were women(Truesdell 1926).
29

wr -27-
References
Beneria, Louredes. 1981. "Conceptualizing the Labor Force: TheUnderestimation of Women's Economic Activities," THE JOURNAL OFDEVELOPMENT STUDIES. Vol. 17(3): 10-28.
Brody, W.H. 1975. "Economic Value of a Housewife," Research and StatisticsNote No. 9, U.S. Department of Health, Education, and Welfare, S:cialSecurity Administration.
Crawford, Ina Z. 1927. "The Use of Time by Farm Women," University of IdahoAgricultural Experiment Station Bulletin No. 146, Moscow.
Fassinger, Polly A. and Harry Schwarzweller. 1984. "The Work of Farm Women:A Midwestern Study," in RESEARCH IN RURAL SOCIOLOGY AND DEVELOPMENT, byHarry Schwarzweller (ed.) Vol. 1, Greenwich, CT: Jai Press.
Gasson, Ruth. 1980. "Roles of Farm Women in England," SOCIOLGIA RURALIS20(3): 165-180.
Gauger, W. H. and K. E. Walker. 1980. "The Dollar Value of Household Work,"New York State College of Human Ecology, Cornell University InformationBulletin No. 60, Ithaca.
hefferan, Colien. 1982. "What is a Homemaker's Job Worth? Too ManyAnswers," JOURNAL OF HOME ECONOMICS (Fall): 30-33.
Hill, Joseph A. 1929. "Women in Gainful Occupations: 1870 to 1920," CensusMonograph IX, Washington, D.C.: U.. Government Printing Office.
Jones, Calvin and Rachel A. Rosenfeld. 1981. "American Farm Women: Findingsfrom a National Survey," NORC Report No. 130, Chicago: NationalOpinion Research Center.
Murphy, M. and J. Peskin. 1981. "Women at Work in the Home," Paperpresented at the American Statistical Association Meetings, Detroit.
Sawer, Barbara. 1973. "Predictors of Farm Wife's Involvement in GeneralManagement and Adoption Decisions," RURAL SOCIOLOGY (Winter): 412-426.
Truesdell, Leon E. 1926. "Farm Population of the United States," CensusMonograph VI. Washington, D.C.: U.S. Government Printing Office.
Walker, Kathryn and William G. Gauger. 1973. "Time avid Its Dollar Value inHousehold Work," FAMILY ECONOMICS REVIEW (Fall): 8-13.
Wilkening, Eugene and Lakshmi Bharadwaj. 1967. "Dimensions of Aspiration,Work Roles and Decision-Mking of Farm Husbands and Wives inWisconsin," JOURNAL OF MARRIAGE AND FAMILY 29 (November) 703-711.
Wilson, Maud. 1929. "Use of Time by Oregon Farm Homemakers," Oregon StateAgricultural College, Agricultural Experiment Station Bulletin No. 256,Corvallis.
30