document resume - eric · document resume ed 478 474 ps 031 397 author benson, carole, ed. title...
TRANSCRIPT

DOCUMENT RESUME
ED 478 474 PS 031 397
AUTHOR Benson, Carole, Ed.
TITLE America's Children: Key National Indicators of Well-Being,2003.
INSTITUTION Federal Interagency Forum on Child and Family Statistics,Washington, DC.; Westat, Inc., Rockville, MD.
PUB DATE 2003-07-00
NOTE 158p.; For 2002 edition, see ED 467 548.AVAILABLE FROM Health Resources and Services Administration Information
Center, 2070 Chain Bridge Road, Suite 450, Vienna, VA 22182(Single copies). Tel: 800-Ask-HRSA (Toll Free); e-mail:[email protected]; Web site: http://childstats.gov. For full text:http://childstats.gov/ac2003/pdf/ac2003.pdf.
PUB TYPE Numerical/Quantitative Data (110) Reports Descriptive(141)
EDRS PRICE EDRS Price MF01/PC07 Plus Postage.DESCRIPTORS Academic Achievement; Adolescents; Births to Single Women;
Child Abuse; *Child Health; Child Neglect; *Children; EarlyChildhood Education; Educational Indicators; ElementarySecondary Education; Employed Parents; Ethnicity; FamilyCharacteristics; Family Literacy; Health Insurance; HigherEducation; Immigrants; Infant Mortality; Limited EnglishSpeaking; Mortality Rate; National Surveys; Out of SchoolYouth; Poverty; Prenatal Care; Preschool Education; Race;*Social Indicators; *Socioeconomic Status; Substance Abuse;Tables (Data); Victims of Crime; Violence; *Well Being; YouthEmployment
IDENTIFIERS *Indicators; *United States
ABSTRACT
This report is the seventh to present nation-wide data on thewell-being of U.S. children. The statistical portrait is based on indicatorsof child well-being and on contextual measures describing the changingpopulation and family context. Part 1 of the report, "Population and FamilyCharacteristics," presents data that illustrate the changes that have takenplace during the past few decades in nine measures depicting the context ofchildren's lives, including children as a proportion of the population,racial and ethnic composition, and family structure and children's livingarrangements. Part 2 of the report, "Indicators of Children's Well-Being,"presents data on 25 key indicators in the areas of economic security,including secure parental employment, and access to health care; health,including a new "overweight" indicator; behavior and social environment,including substance abuse, and youth as victims or perpetrators of violentcrimes; and education, including families reading to young children and highschool academic course taking. For each background measure in part 1 andindicator in part 2, three components are presented: statements about why themeasure or indicator is important, figures showing important facts abouttrends or population groups, and highlights with information on the currentstatus, recent trends, and important differences by population groups noted.This year's report reveals significant progress in several dimensions ofwell-being: adolescents are more likely to take honors courses, children
Reproductions supplied by EDRS are the best that can be madefrom the original document.

overall are less likely to die in infancy or in adolescence, young women havecontinued the downward trend of giving birth in adolescence, and after adecade-long decline, the share of children with married parents has remainedunchanged since 1996. Less progress has been realized in the economicsecurity of children. The poverty rate remains stable, the percentage ofchildren with a parent employed full-time declined slightly, and thepercentage of households with children that encountered housing problemsmaintained the same rate since 1995. A special section of the report detailschanges in the lives of American children from 1990-2000 for selectedmeasures of population and family characteristics, economic security, andeducation. The report's appendices include detailed data tables and datasource descriptions. (HTH)
Reproductions supplied by EDRS are the best that can be madefrom the original document.

Federal Interagency Forum on Child and Family Statistics
America's Children:Key ational In icatorspf Well- ein
-MST COPY AVAILABLE
U S DEPARTMENT OF EDUCATIONOffice of Educational Research and Improvement
EDUCATIONAL RESOURCES INFORMATIONXCENTER (ERIC)
This document has been reproduced asreceived from the person or organizationoriginating It
Minor changes have been made toimprove reproduction quality
Points of view or opinions stated in thisdocument do not necessarily representofficial OERI position or policy.
For m onChild andFamily Statistics

America's Children:Key National Indicatorsof Well-Being Z003

Federal Interagency Forum on Child and Family Statistics
T he Federal Interagency Forum on Child and Family Statistics was founded in 1994. Executive Order No.13045 formally established it in April 1997 to foster coordination and collaboration in the collection andreporting of Federal data on children and families. Members of the Forum as of Spring 2003 are listedbelow.
Department of AgricultureFood and Nutrition ServiceOffice of Analysis, Nutrition and EvaluationAlberta C. FrostDirector
Department of CommerceU.S. Census BureauNancy GordonAssociate Director for Demographic Programs
Department of DefenseDefense Manpower Data CenterAnita LancasterAssistant Director for Program Management
Department of EducationNational Center for Education StatisticsVal PliskoAssociate Commissioner
Department of Health and Human ServicesAdministration for Children and FamiliesWade F. HornAssistant Secretary
Agency for Healthcare Research and QualityDenise DoughertySenior Advisor, Child Health
Maternal and Child Health BureauPeter van DyckAssociate Administrator
National Center for Health StatisticsEdward SondikDirector
National Institute of Child Health andHuman DevelopmentDuane AlexanderDirector
Office of the Assistant Secretary for Planning andEvaluationDon WinsteadDeputy Assistant Secretary for Human Services Policy
Department of Housing and Urban DevelopmentOffice of Policy Development and ResearchJeffrey M. LubellDivision Director for Policy Development
Department of JusticeBureau of Justice StatisticsCaroline Wolf HarlowSurvey StatisticianOffice of Research and Evaluation
National Institute of JusticeThomas FeuchtActing Assistant Director
Office of Juvenile Justice and Delinquency PreventionJ. Robert FloresAdministrator
Department of LaborBureau of Labor StatisticsKathleen P. UtgoffCommissioner
Women's BureauShinae ChunDirector
Department of TransportationNational Highway Traffic Safety AdministrationRose A. McMurrayAssociate Administrator for Planning, Evaluationand Budget
Environmental Protection AgencyOffice of Environmental InformationE. Ramona TrovatoPrincipal Deputy Assistant Administrator
National Science FoundationDivision of Science Resources StatisticsMary FraseDeputy Director
Office of Management and BudgetKatherine K. WallmanChief Statistician
Recommended citation: Federal Interagency Forum on Child and Family Statistics. America's Children: Key NationalIndicators of Well-Being, 2003. Federal Interagency Forum on Child and Family Statistics, Washington, DC: U.S.Government Printing Office.
This report was printed by the U.S. Government Printing Office in cooperation with the U.S. Department ofCommerce (U.S. Census Bureau), July 2003.
Single copies are available through the Health Resources and Services Administration Information Center whilesupplies last: 2070 Chain Bridge Road, Suite 450, Vienna, VA 22182; 1-800-Ask-HRSA; [email protected]. The report isalso available on the World Wide Web: http://childstats.gov.

Foreword
I n 1994, the Office of Management andBudget joined with six other Federalagencies to create the Interagency Forumon Child and Family Statistics. Formally
established in April 1997 through Executive Order No.13045, the Forum was called upon to developpriorities for collecting enhanced data on childrenand youth, improve the reporting and disseminationof information on the status of children to the policycommunity and the general public, and produce morecomplete data on children at the State and local levels.The Forum, which now has participants from 20Federal agencies as well as partners in private researchorganizations, fosters coordination, collaboration, andintegration of Federal efforts to collect and report dataon conditions and trends for children and families.
America's Children: Key National Indicators of Well-Being,2003 is the seventh report in an annual seriesprepared by the Forum agencies. As in past years,readers will find here an accessible compendium ofindicatorsdrawn from the most reliable officialstatisticsillustrative of both the promises and thedifficulties confronting our Nation's young people.The report presents 25 key indicators on importantaspects of children's lives. These indicators are easy tounderstand by broad audiences, objectively based onsubstantial research connecting them to reliable dataon child well-being, balanced so that no single area ofchildren's lives dominates the report, measuredregularly so that they can be updated to show trendsover time, and representative of large segments of thepopulation rather than one particular group. Thereport also presents data on nine contextual measuresthat describe changes in the characteristics of thepopulation as well as in children's family settings andliving arrangements.
As has been the case in previous volumes, this reportincludes a Population and Family Characteristicssection that provides key contextual measures,followed by sections that present key indicators in fourdomainsEconomic Security, Health, Behavior andSocial Environment, and Education. This year'sreport reflects several significant improvements. First,the section on Health Indicators has been expandedto include the percentage of overweight children as aregular key indicator. Second, there are two newmeasures that will be included each year in thePopulation and Family Characteristics sectionthepercentage of children living with at least one parentwho was foreign-born and the percentage of childrenbeing exposed to secondhand smoke. Third, users ofpast volumes of America's Children will see that the
Summary List of Indicators has been expanded toinclude three Population and Family Characteristicsmeasures. And, finally, this year's special featurehighlights changes in the lives of America's childrenfor nine key indicators, based on 1990 and 2000decennial census data for all 50 States and the Districtof Columbia. The Forum has long recognized theimportance of state-level data and welcomes thisopportunity to provide new information to our readers.
Each volume of America's Children highlights criticaldata gaps and challenges Federal statistical agencies todo better. Forum agencies are meeting that challengeby working to provide more comprehensive andconsistent information on the condition and progressof our Nation's children. Since the last report, Forumagencies have continued efforts to strengthen someindicators and to close critical data gaps, particularly inareas such as family structure and formation, themental health of children, and positive behaviorsassociated with improved child development.
The value of the America's Children reports and theextraordinary cooperation they represent reflect theForum's innovative, determined spirit to advance ourunderstanding of where our children are today andwhat may be needed to bring them a better tomorrow.The Forum agencies should be congratulated onceagain this year for joining together to address theircommon goals: developing a truly comprehensive set ofindicators on the well-being of America's children andensuring that this information is readily accessible inboth content and format. Their accomplishmentsreflect the dedication of the Forum agency staffmembers who coordinate the assessment of data needs,evaluate strategies to make data presentations moreconsistent, and work together to produce importantpublications and provide these products on theForum's website: http://childstats.gov. Last but not least,none of this work would be possible without thecontinued cooperation of millions of American citizenswho willingly provide the data that are summarized andanalyzed by staff in the Federal agencies.
We invite you to suggest ways in which we can enhancethis annual portrait of the Nation's most valuableresource: its children. I applaud the Forum'scollaborative efforts in producing this seventh annualreport and hope that our compendium will continueto be useful in your work.
Katherine K. WallmanChief StatisticianOffice of Management and Budget
0
Foreword 111

Acknowledgments
his report reflects the commitment andinvolvement of the members of the FederalInteragency Forum on Child and FamilyStatistics. It was prepared by the Writing
Subcommittee of the Reporting Committee of theForum. This year, the subcommittee was chaired byKristin Smith, U.S. Census Bureau. Other committeemembers included Julia Rhodes and John Kiely,National Center for Health Statistics; Dawn Aldridge,Food and Nutrition Service; David Johnson, Bureau ofLabor Statistics; Patrick Rooney, National Centerfor Education Statistics; Janet Chiancone, Officeof Juvenile Justice and Delinquency Prevention;Daniel Axelrad and Edward Chu, EnvironmentalProtection Agency; and Kathy Nelson, Department ofHousing and Urban Development.
The Reporting Committee of the Forum, chaired byKristin Smith, guided the development of the newindicators. Members of the Reporting Committee notrepresented on the Writing Subcommittee includedLinda Gordon, Bureau of Citizenship andImmigration Services; Laura Montgomery, GloriaSimpson, and Barbara Foley Wilson, National Centerfor Health Statistics; Robert Kominski, U.S. CensusBureau; Jeff Evans, National Institute of Child Healthand Human Development; Meredith Kelsey, Office ofthe Assistant Secretary for Planning and Evaluation,Department of Health and Human Services; WoodieKessel, Office of Disease Prevention and HealthPromotion; Zahid Khawaja, National Highway TrafficSafety Administration; Russ Scarato and Stella Yu,Maternal and Child Health Bureau; and SusanSchechter, Office of Management and Budget.
Other staff members of the Forum agencies provideddata, developed indicators, or wrote parts of thereport. They include Joseph Dalaker, Jason Fields,Arjun Adlakha, Shailesh Bhandari, Julia Overturf,Gregg Robinson, and Kirsten West, U.S. CensusBureau; Patsy Klaus and Michael Rand, Bureau ofJustice Statistics; Howard Hayghe, Rowena Johnson,and Robert McIntire, Bureau of Labor Statistics;Lawrence Barker, Centers for Disease Control andPrevention; Peter Basiotis, Mark Lino, and AndreaCarlson, Center for Nutrition Policy and Promotion;Chris Chapman, National Center for EducationStatistics; Robin Cohen, Cathy Duran, Lois Fingerhut,Donna Hoyert, and Stephanie Ventura, NationalCenter for Health Statistics; Barbara Allen-Hagen,Office of Juvenile Justice and Delinquency Prevention;James Colliver, National Institute on Drug Abuse; andMark Nord, Economic Research Service.
Other individuals who assisted with the reportincluded Yupin Bae, Pinkerton Computer Consultants,Inc.; and DeeAnn Brimhall and Linda Shafer,Education Statistics Services Institute.
Westat, in support of the U.S. Census Bureau, assistedthe committee in producing the report. Janice Kociolcoordinated and managed the production of thereport, including preparing files for agency updatesand providing assistance to the Reporting Committee.Christine Winquist Nord provided technical guidance.Kevin O'Donnell and Alison Fields providedsubstantive and technical guidance and reviewed alledits and data-related issues. Denise Pinkowitz assistedin the preparation of the report.
The following additional staff members made valuablecontributions in their reviews of the report: DeborahKlein, Bureau of Labor Statistics; Steven Carlson, Foodand Nutrition Service; Michael Kogan, Maternal andChild Health Bureau; Shelley Burns, Val Plisko, andJerry West, National Center for Education Statistics;Jennifer Madans, National Center for Health Statistics;Caroline Wolf Harlow, National Institute ofJustice;Robin Levine, U.S. Census Bureau; and Richard Bavier,Office of Management and Budget.
Carole Benson of Westat edited the report. Designcontributions came from Westat's Graphic ArtsDepartment, which designed the cover and flag pages,produced and updated the report's tables and figures,and updated and laid out the text. The logo wasdeveloped by John Jeter of the National Center forHealth Statistics. Barbara Blount, U.S. Census Bureau,coordinated the printing of the report. The NationalMaternal and Child Health Clearinghouse distributedthe report for the Forum.
America's Children: Key National Indicators of Well-Being, 2003

Highlights
America's Children: Key National Indicators ofWell-Being, 2003 is the seventh annual_report to the Nation on the condition ofchildren in America. Nine contextual
measures describe the changing population, family,and environmental context in which children areliving, and 25 indicators depict the well-being ofchildren in the areas of economic security, health,behavior and social environment, and education. Thisyear's report has a special section featuring decennialcensus data that portrays changes in the lives ofAmerica's children from 1990 to 2000 for all Statesand the District of Columbia for nine indicators.
It is noteworthy that this year America's Childrenintroduces an overweight indicator as a new measure ofchildren's health. Children in America are more likelyto be overweight than in previous years, and there aresignificant differences between boys and girls, as well asamong racial and ethnic groups. The prevalence ofoverweight children has emerged as a serious publichealth concern; tracking this indicator in America'sChildren provides data on an essential dimension of childwell-being. This year's report reveals significant progressin several other dimensions of child well-being.Adolescents are more likely to take honors courses,children overall are less likely to die in infancy or inadolescence, and young women have continued thedownward trend of giving birth in adolescence. After asteady, decades-long decline, the share of children withmarried parents has remained unchanged since 1996. Inlight of the large body of research linking familystructure to many of the other indicators in this report,this is an important finding. Less progress, however, hasbeen realized in the economic security of children. Aftermany years of decline, the poverty rate remained stable.In addition, the percentage of children with a parentemployed full time declined slightly, and the percentageof households with children that had any housingproblems has maintained the same rate since 1995. Yet,the percentage of children covered by health insurancemaintained the all-time high. These are some of thehighlights gleaned from America's Children: Key NationalIndicators of Well-Being 2003.
Part I: Population and FamilyCharacteristics
In 2001, there were 72.6 million children under age18 in the United States, or 25 percent of thepopulation, down from a peak of 36 percent at theend of the baby boom (1964). Children are projectedto remain a substantial percentage of the totalpopulation, and are projected to comprise 24 percentof the population in 2020.
The racial and ethnic diversity of America's childrencontinues to increase. In 2000, 64 percent of U.S.children were White, non-Hispanic; 15 percent were
Black, non-Hispanic; 4 percent were Asian/PacificIslander; and 1 percent were AmericanIndian/Alaska Native. The proportion of Hispanicchildren has increased faster than that of any otherracial and ethnic group, growing from 9 percent ofthe child population in 1980 to 16 percent in 2000.
Between 1980 and 1994, the rate of childbearing byunmarried women rose sharply for women of allages. For all age groups combined, this trendended in 1994. Birth rates for unmarried teenagershave dropped considerably since 1994, whileincreases in rates for women in their 20s and olderhave slowed. In 2001, the overall birth rate was 44births per 1,000 unmarried women ages 15-44.
In 2002, 69 percent of children under age 18 livedwith two married parents, down from 77 percent in1980. However, the percentage has remained stablesince 1995, ending a decades-long downward trend.
Children's exposure to secondhand smoke, asindicated by blood cotinine levels, dropped between1988-1994 and 1999-2000. Overall, 64 percent ofchildren ages 4 to 11 had cotinine in their blood in1999-2000, down from 88 percent in 1988-1994. In1999-2000, 18 percent had blood cotinine levelsmore than 1.0 nanograms per milliliter, down from26 percent in 1988-1994.
Part II: Indicators of Children'sWell-Being
Economic Security IndicatorsThe poverty rate for children living with familymembers has decreased substantially since 1993,when it reached a high of 22 percent. The ratedecreased to 16 percent in 2000 and has remainedstable since.
Despite the stall in the overall decline in childpoverty, the rate continued to decline for Blackchildren in female-householder families (47 percentin 2001 compared with 49 percent in 2000).
In 2001, 36 percent of U.S. households with childrenhad one or more of the following three housingproblems: physically inadequate housing, crowdedhousing, or housing that cost more than 30 percentof the household income. Fueled by rising housingcosts, this rate rose from 30 percent in 1978 to 36percent in 1995, and has remained stable since.
In 2001, the percentage of children covered by healthinsurance maintained the all-time high of 88 percentthat was attained in 2000. While government healthinsurance coverage has continued its upward trendsince 1999, the proportion of children covered byprivate health insurance dropped slightly in 2001,reversing the upward trend since 1994.
Highlights

Health Indicators
The proportion of children ages 6 to 18 who wereoverweight increased from 6 percent in 1976-1980to 15 percent in 1999-2000. Racial, ethnic, andgender disparities exist, such that in 1999-2000,Black, non-Hispanic girls and Mexican Americanboys were at particularly high risk of being overweight(24 percent and 29 percent, respectively).
The infant mortality rate has decreased steadily froma high of 10.9 deaths per 1,000 births in 1983 to alow of 6.9 deaths per 1,000 births in 2000. Infantmortality has dropped for all racial and ethnicgroups since 1983, but substantial racial and ethnicdisparities persist, with the Black, non-Hispanicinfant mortality rate consistently higher than that ofother racial or ethnic groups.
Adolescent mortality has steadily declined throughoutthe 1990s, from 89 deaths per 100,000 in 1991 to anall-time low of 67 deaths per 100,000 in 2000.
Deaths from firearm injuries among adolescentsdeclined between 1994 and 2000, particularly amongBlack and Hispanic males. For example, from 1994to 2000, the firearm homicide rate declined from126 to 52 deaths per 100,000 Black males and from49 to 22 deaths per 100,000 Hispanic males.
The birth rate for adolescents continued to declinein 2001 to 25 births per 1,000 females ages 15 to 17,representing the lowest rate ever recorded.
The decrease in adolescent births is apparent for allracial and ethnic groups and is notable among Blackadolescents. The birth rate among Black, non-Hispanic females ages 15 to 17 dropped by nearlyhalf between 1991 and 2001 (from 86 to 45 birthsper 1,000, respectively), completely reversing theincrease from 1986 to 1991.
Behavior and Social Environment IndicatorsIn 2001, daily cigarette use among 8th-, 10th-,and 12th-graders reached its lowest point sincethe beginning of the Monitoring the Future Survey(5 percent, 10 percent, and 17 percent, respectively),continuing the downward trend that began in 1997for 12th-graders and in 1996 for 10th- and 8th-graders.
From 2001 to 2002, the proportion of 10th-gradersreporting episodic heavy drinking (i.e., having atleast five drinks in a row at least once in theprevious 2 weeks) declined from 25 percent to 22percent. Rates remained stable from 2001 to 2002
IIAmerica's Children: Key National Indicators of Well-Being, 2003
among 8th- and 12th-graders, with 12 and 29percent, respectively, reporting this type of alcoholconsumption in 2002.
Between 2001 and 2002, illicit drug use in the past30 days declined from 23 percent to 21 percentamong 10th-graders. One-quarter of 12th-gradersand one-tenth of 8th-graders reported past-30-dayillicit drug use in 2002, unchanged from theprevious year.
Education IndicatorsThe percentage of high school graduates who hadtaken honors-level English courses increased from 29percent in 1998 to 34 percent in 2000. The percen-tage of 2000 high school graduates taking advancedmathematics, science, English, and foreign languagecourses has increased significantly since 1982.
In 2002, the percentage of 25- to 29-year-olds whoattained a bachelor's degree or higher remained atan all-time high of 29 percent. The percentage ofWhite, non-Hispanic 25- to 29-year-olds with abachelor's degree increased from 33 percent in2001 to 36 percent in 2002.
Special FeatureIn 2000, 68 percent of children under 18 years oldlived in married-couple families, down from 72percent in 1990. The decline in children living inmarried-couple families occurred in all States in theNation, with several States showing a decrease ofabout 7 percentage points. New Jersey had a smalldecrease (1.7 percentage points), from 74 percentin 1990 to 72 percent in 2000.
In 2000, 19 percent of children lived in crowdedhousing, up from 16 percent a decade earlier. InNevada, a rapidly-growing State, the proportion ofchildren living in crowded housing increased from 20percent in 1990 to 27 percent in 2000, the largestincrease in the Nation. However, the largest decreasewas found in Texas, where the rate decreased from 25percent in 1990 to 15 percent in 2000.
Nationally, the proportion of children ages 3 to 5enrolled in preprimary education rose from 42percent in 1990 to 61 percent in 2000, representingan increase of 19 percentage points. Geographicvariation in preprimary education among childrenages 3 to 5 is apparent, with most of the smallerincreases clustered among the Western states.Georgia, a Southern state, had the largest increase,from 41 percent in 1990 to 67 percent in 2000.

Summary List of Selected Measures and Indicators of Child Well-Being
Indicator Name Description of Measure or Indicator
Previous Change°Year of Data New Data BetweenValue (Year) Value (Year) Years
Population and Family Characteristics (selected measures)Difficulty speaking English Percentage of children ages 5 to 17
who speak a language other thanEnglish at home and have difficultyspeaking English
Percentage of children under age 18living with two married parentsPercentage of all births that are tounmarried women
Family structure and children'sliving arrangementsBirths to unmarried women
Economic SecurityChild poverty and familyincomeSecure parental employment
Housing problems
Food security and diet quality
Access to health care
HealthGeneral health status
Activity limitation
Overweight
Childhood immunization
Percentage of related children underage 18 in poverty
Percentage of children under age 18living with parents with at least one parentemployed full time all year
Percentage of households with childrenunder age 18 that report housing problemsPercentage of children under age 18 inhouseholds reporting child hunger dueto food insecurityPercentage of children ages 2 to 6with a good diet
Percentage of children under age 18covered by health insurancePercentage of children under age 18with no usual source of health care
Percentage of children under age18 in very good or excellent healthPercentage of children ages 5 to 17with any limitation in activity resultingfrom chronic conditionsPercentage of children ages 6 to 18who are overweight
Percentage of children ages 19 to 35months who received combined seriesimmunization coverage
5.1 (1995) 5.0 (1999) NS
69 (2001) 69 (2002) NS
33 (2000) 34 (2001) A
16 (2000) 16 (2001) NS
80 (2000) 79 (2001) NS
35 (1999) 36 (2001) NS
0.7 (1999) 0.6 (2001) NS
20 (1994- 20 (1999-1996) 2000) NS
88 (2000) 88 (2001) NS
7 (2000) 6 (2001)
82 (2000) 83 (2001) NS
7 (2000) 8 (2001) A
11 (1988- 15 (1999- A1994) 2000)
76 (2000) 77 (2001) NS
Legend: NS = No significant change A = Significant increase V = Significant decrease = not applicable
a Change noted is statistically significant.
Summary List of Measures and Indicators III

Summary List of Selected Measures and Indicators of Child Well-Being
Indicator Name Description of Measure or Indicator
Previous Change°Year of Data New Data BetweenValue (Year) Value (Year) Years
Health (cont.)Low birthweight
Infant mortality
Child mortality
Adolescent mortality
Adolescent births
Percentage of infants weighing lessthan 5.5 pounds at birthDeaths before the first birthdayper 1,000 live births
Deaths per 100,000 children ages1 to 4
Deaths per 100,000 children ages5 to 14
Deaths per 100,000 adolescents ages15 to 19
Births per 1,000 females ages 15 to 17
Behavior and Social EnvironmentRegular cigarette smoking Percentage of 8th-grade students who
reported smoking daily in the previous30 days
Percentage of 10th-grade students whoreported smoking daily in the previous30 days
Percentage of 12th-grade students whoreported smoking daily in the previous30 days
Alcohol use Percentage of 8th-grade students whoreported having five or more alcoholicbeverages in a row in the last 2 weeks
Percentage of 10th-grade students whoreported having five or more alcoholicbeverages in a row in the last 2 weeks
Percentage of 12th-grade students whoreported having five or more alcoholicbeverages in a row in the last 2 weeks
Illicit drug use Percentage of 8th-grade students whohave used illicit drugs in the previous30 days
Percentage of 10th-grade students whohave used illicit drugs in the previous30 days
Percentage of 12th-grade students whohave used illicit drugs in the previous30 days
Youth victims and perpetrators Rate of serious violent crimeof serious violent crimes victimizations per 1,000 youth ages
12 to 17
Serious violent crime offending rateper 1,000 youth ages 12 to 17
7.6 (2000) 7.7 (2001)
7.0 (1999) 6.9 (2000)
35 (1999) 32 (2000)
19 (1999) 18 (2000) V
69 (1999) 67 (2000) NS
27 (2000) 25 (2001) V
5.5 (2001) 5.1 (2002) NS
12 (2001) 10 (2002) V
19 (2001) 17 (2002) V
13 (2001) 12 (2002) NS
25 (2001) 22 (2002) V
30 (2001) 29 (2002) NS
12 (2001) 10 (2002) NS
23 (2001) 21 (2002) V
26 (2001) 25 (2002) NS
20 (1999) 16 (2000) NS
26 (1999) 17 (2000) NS
Legend: NS = No significant change = Significant increase = Significant decrease = not applicable
a Change noted is statistically significant.
1111America's Children: Key National Indicators of Well-Being, 2003
1.0

Summary List of Selected Measures and Indicators of Child Well-Being
Indicator Name Description of Measure or Indicator
PreviousYear of DataValue (Year)
New DataValue (Year)
Change°Between
Years
EducationFamily reading to young Percentage of children ages 3 to 5 whochildren are read to every day by a family member 54 (1999) 58 (2001) AEarly childhood care and Percentage of children ages 3 to 5 whoeducation are enrolled in early childhood centers 60 (1999) 56 (2001)
Mathematics and reading Average mathematics scale score ofachievement (0-500 scale) 9-year-olds 231 (1996) 232 (1999) NS
13-year-olds 274 (1996) 276 (1999) NS17-year-olds 307 (1996) 308 (1999) NS
Average reading scale score of9-year-olds 213 (1996) 212 (1999) NS13-year-olds 258 (1996) 259 (1999) NS17-year-olds 288 (1996) 288 (1999) NS
High school academiccoursetaking
Percentage of high school graduateswho completed high-level coursework in
mathematics 41 (1998) 45 (2000) NSscience 62 (1998) 63 (2000) NSEnglish 29 (1998) 34 (2000)foreign language 30 (1998) 30 (2000) NS
High school completion Percentage of young adults ages18 to 24 who have completedhigh school 87 (2000) 87 (2001) NS
Youth neither enrolled in Percentage of youth ages 16 to 19school nor working who are neither in school nor working 9 (2001) 9 (2002) NS
Higher education Percentage of high school graduatesages 25 to 29 who have completed abachelor's degree or higher 29 (2001) 29(2002) NS
Legend: NS = No significant change = Significant increase = Significant decrease = not applicable
a Change noted is statistically significant.
Summary List of Measures and Indicators II

About This Report
America's Children: Key National Indicators ofWell-Being, 2003, developed by the FederalInteragency Forum on Child and FamilyStatistics, is the seventh annual synthesis of
information on the status of the Nation's mostvaluable resource, our children. This report presents25 key indicators of the well-being of children. Theseindicators are monitored through official Federalstatistics covering children's economic security, health,behavior and social environment, and education. Thereport also presents data on nine key contextualmeasures and includes a special section featuring 1990and 2000 decennial census data for all fifty states andthe District of Columbia. The 20 agencies of theForum have also introduced improvements in themeasurement of several of the indicators presentedlast year.
Purpose of America's Children: KeyNational Indicators of Well-Being
This report provides the Nation with a broad annualsummary of national indicators of child well-being andmonitors changes in these indicators over time. TheForum hopes that this report will stimulate discussionsby policy-makers and the public, exchanges betweenthe data and policy communities, and improvementsin Federal data on children and families. In so doing,the Forum hopes that this report will lead toimprovements in the well-being of America's children.
The Federal Interagency Forum on Childand Family StatisticsThe Forum is a formal structure for collaborationamong 20 Federal agencies that produce or usestatistical data on children and families. The membersof the Forum are listed on the back of the cover page.Building on earlier cooperative activities, the Forumwas founded in 1994. It was formally established byExecutive Order No. 13045 in 1997 to foster thecoordination and integration of the collection andreporting of data on children and families. The twomajor publications produced by the Forum areAmerica's Children: Key National Indicators of Well-Being(produced annually since 1997) and NurturingFatherhood: Improving Data and Research on Male Fertility,Family Formation and Fatherhood (June 1998). TheForum also sponsored the Counting Couples Workshop in2001 to evaluate the data available and themeasurement of marriage, divorce, remarriage, andcohabitation. The Forum's primary missions are todevelop ways to improve consistency and enhance thecollection of data on children, youth, and families andto improve the reporting and dissemination ofinformation on the status of children and families tothe policy community and the general public.
Structure of the reportAmerica's Children: Key National Indicators of Well-Being,2003 is intended to present information and data onthe well-being of children in a nontechnical, user-friendly format. It is designed to complement othermore technical or comprehensive reports produced bythe Forum agencies. The report is divided into twoparts. The first part of the report, Population and FamilyCharacteristics, presents data that illustrate the changesthat have taken place during the past few decades innine measures depicting the context of children'slives. These background measures provide afoundation for understanding the key indicators andthe child population. They provide basic informationabout children in the United States and the social anddemographic changes occurring in the childpopulation. These data answer questions such as: Howmany children are there in the United States? Whatproportion of the population is under age 18? Howracially and ethnically diverse are our children? Howmany have difficulty speaking English? In what types offamilies do they live? What is the quality of theirenvironment? The second part, Indicators of Children'sWell-Being, contains data on key indicators of how wellwe are doing in providing economic security,educational opportunity, and a healthy and safeenvironment in which children can play, learn, andgrow. Unlike the data presented in Part I of the report,which simply describe the changing context in whichchildren live, the data in Part II offer insight into howwell children are faring by providing information infour key areas of child well-being: economic security,health, behavior and social environment, andeducation. For each background measure in Part I:Population and Family Characteristics, and each indicatorin Part II: Indicators of Children's Well-Being, threecomponents are presented:
Statements about why the measure or indicator isimportant to understanding the condition ofchildren;Figures showing important facts about trends orpopulation groups; andHighlights with information on the current status,recent trends, and important differences bypopulation groups noted.
In addition, Appendix A: Detailed Tables containstabulated data for each measure and additional detailnot discussed in the main body of the report.Appendix B: Data Source Descriptions containsdescriptions of the sources and surveys used togenerate the background measures and the indicators.
About This Report III
12

Aspects of child well-being depicted inthis reportAmerica's Children: Key National Indicators of Well-Being,2003 covers four domains of child well-being:economic security, health, behavior and socialenvironment, and education. The economic securityindicators document poverty and income amongchildren and the accessibility of basic necessities suchas food, housing, and health care. The healthindicators document the physical health and well-beingof children by presenting information on their healthstatus, immunization coverage, death rates, andteenage births. The behavioral and social environmentindicators present information about young people'sparticipation in illegal or high-risk behaviors, such assmoking, drinking alcohol, using illicit drugs, andengaging in serious violent crimes. Finally, theeducation indicators examine how well we aresucceeding in educating our children, includingpreschoolers' exposure to reading and early education,measures of student achievement, rigorouscoursetaking in high school, and indicators of howmany young adults complete high school and college.
Special featureAt the end of Part II, America's Children: Key NationalIndicators of Well-Being, 2003 presents a special sectionfeaturing 1990 and 2000 decennial census data.Special features present measures that are either notavailable with sufficient frequency to be considered asregular key indicators, or are new regular measuresthat the Forum believes merit special attention whenfirst introduced into the America's Children report. Inboth cases, special features provide importantinformation on child well-being. This year's specialfeature highlights change in the lives of America'schildren using 1990 and 2000 decennial census datafor all 50 States and the District of Columbia. TheForum welcomes the opportunity to recognize theimportance of state-level data.
Changes since last yearAmerica's Children: Key National Indicators of Well-Being,2003 is similar to last year's report in both format andcontent. While most of the indicators presented lastyear have been included and updated, the Forum hasworked to improve the report in a number ofimportant ways. Some changes reflect improvementsin the availability of data for certain key indicators.Some changes clarify the concept being measured orexpand the indicator substantively. This year, thesection on Health indicators has been expanded toinclude children who are overweight as a regular keyindicator. In addition, two new measures are included
in the Population and Family Characteristics sectionchildren living with at least one foreign-born parent andchildren's exposure to secondhand smoke. Changeswere made to the Summary List of Indicators by includingthree Population and Family Characteristics measures.Finally, improvements were made to the activitylimitation indicator. The changes reflect the manyhelpful comments and suggestions for improvementsthat were received from readers and users of theprevious reports.
Children included in this reportIn order to convey a comprehensive understanding ofchild well-being, the report looks at the status of allchildren tinder age 18 living in the United States. A fewindicators provide data on older youth and youngadults (persons ages 18 to 29). In most casesthroughout the report, the word "children" refers toany person under age 18 living in a civilian ornoninstitutionalized setting in the United States. Insome other cases, such as vital statistics, all children areincluded. When data are being presented only forspecific age groups, this is indicated in the text (e.g.,children ages 1 to 4). As is also noted in the text, someindicators examine only particular groups of children(e.g., children living in family settings, children livingwith parents, children in certain age groups or gradelevels). For most of the indicators, the relevantinformation has been reported by an adult in thehousehold or family and not directly by the children.
In many cases, we have also presented the data onchildren by race and Hispanic origin. In most cases,Hispanics have been separated from the White andBlack categories and "non-Hispanic" follows the racedesignation, such as "White, non-Hispanic." In somecases, data for Hispanics were not available or couldnot be separated from data for race groups. In thesecases, data for race groups (White, Black, AmericanIndian/Alaska Native, and Asian/Pacific Islander)include Hispanics.
Selection of the key indicatorsAmerica's Children: Key National Indicators of Well-Being,2003 presents a selected set of key indicators ofenduring interest that measure critical aspects ofchildren's lives and are collected rigorously andregularly by Federal agencies. The Forum chose theseindicators through careful examination of availabledata. In determining this list of key indicators, theForum sought input from the Federal policy-makingcommunity, foundations, academic researchers, andState and local children's service providers. Theseindicators were chosen because they are:
IIIAmerica's Children: Key Notional Indicators of Well-Being, 2003

Easy to understand by broad audiences;Objectively based on substantial research connectingthem to child well-being and using reliable data;Balanced so that no single area of children's livesdominates the report;Measured regularly so that they can be updated andshow trends over time; andRepresentative of large segments of the population,rather than one particular group.
Data sourcesData for the key indicators are drawn primarily fromnational surveys and vital records. Federal agenciesregularly survey the population on many issues. Somenational surveys use interviewers to gather informationon children through a variety of methods, includingspeaking directly, by telephone or in person, withfamilies selected through rigorous sampling methods.Other surveys use questionnaires distributed directlyto youth to ask about their behavior. In addition, somenational data collection efforts directly assess studentsby giving them tests or by asking them to performcertain tasks. Federal agencies collect information onbirths and deaths from State health departments.These nationally representative surveys, along withdata collected through vital statistics, provide the bestavailable measures of the condition of U.S. children.Administrative data from social service agencies werenot used for measures in this report. The availabilityand quality of such data can be affected by policydifferences among agencies in various local areas andby resource constraints. Further information on datasources for this report is provided in Appendix B: DataSource Descriptions.
In the text of this report, percentages and rates arerounded to the nearest whole number, unless roundingwould mask significant differences. The text discusseschanges over time or between-group differences onlywhen differences are statistically significant.
Additional data neededAmerica's Children: Key National Indicators of Well-Being,2003 identifies critical gaps in the data available onchildren and youth. It challenges the Nation as awholeand the Federal statistical agencies inparticularto improve the monitoring of importantareas of children's lives. It also challenges Federalagencies to improve the timeliness with whichinformation on children is made available to policy-makers and the public.
At the end of Part I: Population and Family Characteristicsand at the end of each section in Part II: Indicators ofChildren's Well-Being, the report presents a description
of data and measures of child well-being in need ofdevelopment. These lists include many importantaspects of children's lives for which regular indicatorsare lacking or are in development, such ashomelessness, long-term poverty, mental health,disability, neighborhood environment, and earlychildhood development. In some of these areas, theForum is exploring ways to collect new measures andimprove existing ones. In others, Forum agencieshave successfully fielded surveys incorporating somenew measures but they are not yet available on aregular basis for monitoring purposes.
For further informationThere are several good places to obtain additionalinformation on each of the indicators found in thisreport. First, for many of the indicators, Appendix A:Detailed Tables contains additional detail not discussedin the main body of the report. For example, sometables show additional breakouts by gender, race andHispanic origin, or another category. Second,Appendix B: Data Source Descriptions containsinformation and descriptions of the sources andsurveys used to generate the indicators as well asinformation on how to contact the agency responsiblefor collecting the data or administering the relevantsurvey. Third, numerous publications of the Federalstatistical agencies provide additional detail on each ofthe key indicators included in this report, as well as onscores of other indicators. These reports includeTrends in the Well-Being of America's Children and Youth,published annually by the Office of the AssistantSecretary for Planning and Evaluation in the U.S.Department of Health and Human Services; TheCondition of Education, published annually by theNational Center for Education Statistics; and Health,United States, published annually by the NationalCenter for Health Statistics. Often these compendiacontain additional details not reported in America'sChildren. Appendix B: Data Source Descriptions alsocontains a list of agency contacts who can providefurther information on the relevant surveys andindicators. Finally, the Forum's website,http://chi/dstats.gov, contains many links to Forumagency publications that often provide more detailabout the indicators in this report.
America's Children on the InternetThe report can be found on the World Wide Web athttp://childstats.gov. The website version of the reportcontains all data for years that are presented in thefigures but not in the tables in this report. TheForum's website also contains information on theoverall structure and organization of the Forum, aswell as other reports, and news on current activities.
b 1fAbout This Report II

Also found on the website are links to internationalcomparative data and related reports of Forumagencies and other organizations providing moredetailed data. The website addresses of the Forumagencies are found below.
Agency Websites
Federal Interagency Forum on Child and FamilyStatistics:http://childstats.gov
Department of AgricultureFood and Nutrition Service:http://www.fns.usda.gov
Department of CommerceU.S. Census Bureau:http://www.census.gov
Department of DefenseOffice of the Deputy Assistant Secretary of Defense(Personnel Support, Families and Education):http://mfrc.calib.com
Department of EducationNational Center for Education Statistics:http://nces.ed.gov
Department of Health and Human ServicesAdministration for Children and Families:http://www.acf.dhhs.govAgency for Healthcare Research and Quality:http://www.ahrq.govMaternal and Child Health Bureau:http://www.mchb.hrsa.govNational Center for Health Statistics:http://www.cdc.gov/nchsNational Institute of Child Health and HumanDevelopment:http://www.nichd.nih.govNational Institute on Drug Abuse:http://www.nida.nih.govOffice of the Assistant Secretary for Planning andEvaluation:http://aspe.os.dhhs.gov
Department of Housing and Urban DevelopmentOffice of Policy Development and Research:http://www.huduser.org
111 America's Children: Key National Indicators of WellBeing, 2003
Department of JusticeBureau of Justice Statistics:http://www.ojp.usdoj.gov/bjsNational Institute of Justice:http://www.ojp.usdoj.gov/nijOffice of Juvenile Justice and DelinquencyPrevention:http://www.ojjdp.ncjrs.org
Department of LaborBureau of Labor Statistics:http: / /www.bls.govWomen's Bureau:http://www.dol.gov/wb
Department of TransportationNational Highway Traffic Safety Administration:http://www.nhtsa.dot.gov
Environmental Protection AgencyOffice of Children's Health Protection:http://yosemite.epa.gov/ochp/ochpweb.nsf/homepage
National Science FoundationDivision of Science Resources Statistics:http://www.nsf.gov/sbe/srs
Office of Management and BudgetStatistical and Science Policy Office:http://www.whitehouse.gov/omb/inforeg/statpolicy.htm
15

Table of Contents
Foreword
Acknowledgments ii
Highlights iii
Summary List of Indicators
About This Report ix
Part I: Population and Family Characteristics 1
Child Population 2
Children as a Proportion of the Population 3
Racial and Ethnic Composition 4
Children of at Least One Foreign-Born Parent 5
Difficulty Speaking English 6
Family Structure and Children's Living Arrangements 7
Births to Unmarried Women 8
Child Care 10
Children's Environments 12
Data Needed 14
Part II: Indicators of Children's Well-Being 15
Economic Security Indicators 15
Child Poverty and Family Income 16
Secure Parental Employment 18
Housing Problems 19
Food Security and Diet Quality 20
Access to Health Care 22
Indicators Needed 24
Health Indicators 25
General Health Status 26
Activity Limitation 27
Overweight 28
Childhood Immunization 29
Low Birthweight 30
Infant Mortality 31
Child Mortality 32
Adolescent Mortality 34
Adolescent Births 36
Indicators Needed 37
Behavior and Social Environment Indicators 39
Contents44i4r 4
XIII

Regular Cigarette Smoking 41
Alcohol Use 42
Illicit Drug Use 43
Youth Victims and Perpetrators of Serious Violent Crimes 44
Indicators Needed 46
Education Indicators 47
Family Reading to Young Children 48
Early Childhood Care and Education 49
Mathematics and Reading Achievement 50
High School Academic Coursetaking 52
High School Completion 53
Youth Neither Enrolled in School Nor Working 54
Higher Education 55
Indicator Needed 56
Special Section 57
Changes in the Lives of America's Children: 1990 to 2000 57
Introduction 58
Population and Family Characteristic Measures 59
Economic Security Indicators 60
Education Indicators 61
Notes to Indicators 63
Appendices 71
Appendix A: Detailed Tables 71
Appendix B: Data Source Descriptions 129
America's Children: Key National Indicators of Well-Being, 2003
11

P art I: Population and Family Characteristics
presents data that illustrate the changes
in the population and family contexts in which
America's children are being raised. Nine key
measures present data on trends in the size
and composition of the child population,
the composition of their families, and the
environment in which they live. The
background measures provide an
important context for understanding therY
key indicators of well-being presented
in Part II.
frj
PART I
Population andFamily Characteristics
t
16

Child Population
he number of children determines the demand for schools, health care, and other services and facilitiesthat serve children and their families.
Figure POP1
Number (in millions)
100
80
60
40
20
0
Number of children under age 18 in the United States, 1950-2001and projected 2002-20
1950 1960 1970 1980
NOTE: Population projections are based on the Census 2000 counts.
SOURCE: U.S. Census Bureau, Population Estimates and Projections.
In 2001, there were 72.6 million children in theUnited States, 300,000 more than in 2000. Thisnumber is projected to increase to 80.3 millionin 2020.The number of children under 18 has grownduring the last half-century, increasing about halfagain since 1950.During the "baby boom" (1946 to 1964), thenumber of children grew rapidly.During the 1970s and 1980s, the number ofchildren declined and then grew slowly.
1990 2000 2010 2020
Projected
Beginning in 1990, the rate of growth in thenumber of children increased, although not asrapidly as during the baby boom.In 2001, there were approximately equal numbersof childrenbetween 23 and 25 millionin eachage group 0 to 5, 6 to 11, and 12 to 17 years of age.
Bullets contain references to data that can be found in TablePOP1 on page" 75.
America's Children: Key National Indicators of WellBeing, 2003
19

Children as a Proportion of the Population
Elhough children represent a smaller percentage of the population today than in 1960, theyarenevertheless a stable and substantial portion of the population.
Percent
60
40
20
Children under age 18 and adults ages 65 and older as a percentage of theU.S. population, 1950-2001 and projected 2002-20
Children under 18
Adults 65 and older
01950 1960 1970 1980
NOTE: Population projections are based on the Census 2000 counts.
SOURCE: U.S. Census Bureau, Population Estimates and Projections.
In 2001, children made up 25 percent of thepopulation, down from a peak of 36 percent at theend of the "baby boom."Since the mid-1960s, children have been decreasingas a proportion of the total U.S. population.Children are projected to remain a fairly stablepercentage of the total population. They areprojected to comprise 24 percent of the populationin 2020.In contrast, senior citizens (adults ages 65 andolder) have increased as a percentage of the totalpopulation since 1950, from 8 to 12 percent in 2001.By 2020, they are projected to make up 16 percentof the population.
1990 2000 2010
Projected
2020
Together, children and senior citizens make up the"dependent population" (those persons who,because of their age, are less likely to be employedthan others). In 1950, children made up 79 percentof the dependent population; by 2001, they madeup 67 percent. This percentage is expected tocontinue to decrease, to 60 percent in 2020.
Bullets contain references to data that can be found in TablePOP2 on page 76.
Part I: Population and Family Characteristics IIII9 LI

Racial and Ethnic Composition
R acial and ethnic diversity has grown dramatically in the United States in the last three decades. Thisincreased diversity appeared first among children, and later in the older population and is projected to
increase even more in the decades to come.
Figure POP3
Percent
80
60
40
20
0
Percentage of children under age 18 by race and Hispanic origin, 1980-2000and projected 2001-20
White, non-Hispanic
Hispanic
Black, non-Hispanic
Asian/Pacific Islander
1980 1990 2000
kaa
American IndiaLAlaska Native
2010
Projected
2020
NOTE: All population figures for the year 2000 shown here are estimates based on the 1990 U.S. Census; they do not reflect Census2000 counts. Population Figures for 2001-20 are projections.
SOURCE: U.S. Census Bureau, Population Estimates and Projections.
In 2000, 64 percent of U.S. children were White,non-Hispanic; 16 percent were Hispanic;15 percent were Black, non-Hispanic; 4 percentwere Asian/Pacific Islander; and 1 percent wereAmerican Indian/Alaska Native.The percentage of children who are White, non-Hispanic has decreased from 74 percent in 1980 to64 percent in 2000.The percentages of Black, non-Hispanic andAmerican Indian/Alaska Native children have beenfairly stable during the period from 1980 to 2000.The number of Hispanic children has increasedfaster than that of any other racial and ethnicgroup, growing from 9 percent of the childpopulation in 1980 to 16 percent in 2000. By 2020,it is projected that more than 1 in 5 children in theUnited States will be of Hispanic origin.
The percentage of Asian/Pacific Islander childrendoubled from 2 to 4 percent of all U.S. childrenbetween 1980 and 2000. Their percentage isprojected to continue to increase to 6 percent in2020.Increases in the percentages among Hispanic andAsian/Pacific Islander children reflect higherfertility and immigration rates than those of othergroups. Much of the growth in the percentage ofHispanic children is due to the relatively highfertility of Hispanic women.
Bullets contain references to data that can be found in TablePOP3 on page 77.
America's Children: Key National Indicators of Well-Being, 2003

Children of at Least One Foreign-Born Parent
elhe foreign-born population of the United States has risen dramatically since 1970.1 This increase in thepast generation has largely been from Latin America and Asia, and represents an increase in the
diversity of language and cultural backgrounds of children growing up in the United States.2 As a result oflanguage and cultural barriers confronting children and their parents, children with foreign-born parentsmay need additional resources both at school and at home to successfully progress in school and transition toadulthood. Data on the nativity of the population have been available from the Current Population Surveysince 1994 and from the Decennial Census since 1850.3
'
Percent
90
80
70
60
50
40
30
20
10
0
Percentage of children under age 18 by nativity of child and parents, 1994-2002
Native children with native parents
Native children with a foreign-born parent
Foreign-born children with a foreign-born parent
1994 1995 1996 1997 1998 1999 2000 2001 2002
NOTE: Includes all children under age 18 except children in group quarters. Children living in households with no parents presentare not shown in this figure, but are included in the bases for the percentages. Native parents means that all of the parents that thechild lives with are native born, while foreign-born means that one or both of the child's parents are foreign-born. Anyone with UnitedStates citizenship at birth is considered native, which includes persons born in the U.S., in U.S. outlying areas, and persons bornabroad with at least one American parent.
SOURCE: U.S. Census Bureau, March Current Population Survey.
In 2002, 16 percent of children were nativechildren with at least one foreign-born parent, and4 percent were foreign-born children with at leastone foreign-born parent. Overall, the percent ofchildren living in the U.S. with at least one parentwho was foreign-born rose from 15 percent in 1999to 20 percent in 2002.The percentage of children whose parents have lessthan a high school diploma is much higher amongchildren with at least one foreign-born parent thanamong children with native parents. In 2002, 41percent of foreign-born children with at least oneforeign-born parent had a parent with less than ahigh school degree, compared with 36 percent ofnative children with at least one foreign-bornparent and 10 percent of native children withnative parents.In 2002, foreign-born children with foreign-bornparents were more likely than native children withforeign-born parents to live below the poverty level,27 and 20 percent, respectively.
Children with a foreign-born parent more often livein central cities than children with native parents.In 2002, 42 percent of foreign-born children with aforeign-born parent lived in central cities, 41percent of native children with at least one foreign-born parent lived in central cities, and only 26percent of native children of native parents lived incentral cities.Children with at least one foreign-born parent,regardless of their own nativity status, more oftenlived in a household with two parents present. In2002, 81 percent of children with at least oneforeign-born parent lived with two parents,compared with only 69 percent of children withnative parents.
Bullets contain references to data that can be found in TablePOP4 on pages 78-79. Endnotes begin on page 63.
e 22Part I: Population and Family Characteristics

Difficulty Speaking English
Elhildren who speak languages other than English at home and who also have difficulty speaking English4may face greater challenges progressing in school and, once they become adults, in the labor market.
Once it is determined that a student speaks another language, school officials must, by law, evaluate thechild's English ability to determine whether the student needs services (such as special instruction to improvehis or her English) and provide these services if needed.
Percent
30
25
20
15
10
5
0
Percentage of children ages 5 to 17 who speak a language other than Englishat home and who have difficulty speaking English by region, 1999
Total Northeast
Speak another language at home
Midwest South West
Speak another language at home and speak English with difficulty
SOURCE: U.S. Census Bureau, October Current Population Survey. Tabulated by the U.S. Department of Education, National Center forEducation Statistics.
The number of school-age children (ages 5 to 17)who spoke a language other than English at homeand who had difficulty speaking English was 2.6million in 1999, double the number (1.3 million) in1979. This represented 5 percent of all school-agechildren in the United States in 1999.The percentage of children who have difficultyspeaking English varies by region of the country,from 2 percent of children in the Midwest to 11percent of children in the West.Likewise, the percentage of children who speakanother language at home (with or withoutdifficulty speaking English) varies by region of thecountry, from 8 percent of children in the Midwestto 29 percent of children in the West. Thisdifference is due largely to differing concentrationsof immigrants and their descendants in the regions.
White, non-Hispanic and Black, non-Hispanicchildren are less likely than children of Hispanicorigin or other races to have difficulty speakingEnglish. One percent of White, non-Hispanic andBlack, non-Hispanic children spoke anotherlanguage at home and had difficulty speakingEnglish in 1999, compared with 23 percent ofchildren of Hispanic origin and 12 percent ofchildren of other races.
Bullets contain references to data that can be found in TablePOPS on page 80. Endnotes begin on page 63.
America's Children: Key National Indicators of Well-Being, 2003

Family Structure and Children's Living Arrangements
©he number of parents a child lives with is associated with the economic, parental, and community resources availableto children and their well-being. On average, the presence of two married parents is associated with more favorable
outcomes for children both through, and independent of, added income. Children who live in a household with only oneparent are substantially more likely to have family incomes below the poverty line, and to have more difficulty in their livesthan are children who live in a household with two married parents (biological, step, or adoptive).'
Figure POP6
Percent
80
60
40
20
Percentage of children under age 18 by presence of married parents inhousehold, 1980-2002
Two married parents
No parent Father only
01980 1985 1990 1995
Mother only
_LZWRIENSEtsimentlr7ertimiri
2000 2002
SOURCE: U.S. Census Bureau, March Current Population Survey.
NOTE: The category "two married parents" includes children who live with a biological, step, or adoptive parent who is married with his orher spouse present. If a second parent is present and not married to the first parent, then the child is identified as living with a single parent.
In 2002, 69 percent of children under age 18 livedwith two married parents, down from 77 percent in1980. However, the percentage has remained stablesince 1995, ending a decades-long downward trend.In 2002, about one-fifth (23 percent) of children livedwith only their mothers, 5 percent lived with onlytheir fathers, and 4 percent lived with neither oftheir parents.6White, non-Hispanic children are much more likelythan Black children and Hispanic children to live withtwo married parents. In 2002, 77 percent of White, non-Hispanic children lived with two married parents,compared with 38 percent of Black children and 65percent of Hispanic children.Since 1995, the share of Black children living with twomarried parents has increased significantly from 33percent in 1995 to 38 percent in 2002. The proportionof Hispanic children living with two married parents wasnot significantly different in 1995 than it was in 2002.Both Black children and Hispanic children weresignificantly less likely to live with a single parent in2002 compared with 1995. The proportion of Blackchildren living with a single parent declined from 56percent in 1995 to 53 percent in 2002, while theproportion of Hispanic children living with a singleparent declined from 33 percent to 30 percent over thesame time period.
While the proportion of all children living with singleparents was the same in 2002 as in 1995, and theproportion of Black children and of Hispanic childrenliving with single parents declined over this time period,these patterns were primarily affected by changes in theproportion of children living with a single mother. Theproportion of all children living with a single fatheractually increased from 4 percent in 1995 to 5 percentin 2002.These changes in family structure are especiallyimportant in light of the large body of research linkingfamily structure to many of the other indicators inthis report.?The measure of detailed living arrangements ofchildren (POP5.B in America's Children 2001) is notincluded in this year's report because recent data arenot available. For information on the detailed livingarrangements of children, see the following U.S. CensusBureau report: P70-74 Living Arrangements of Childrenavailable athttp://www.census.gov/population/www/socdemo/child/la-child.html.
Bullets contain references to data that can be found in TablePOP6 on page 81. Endnotes begin on page 63.
Part I: Population and Family Characteristics N24

Births to Unmarried Women
101ncreases in births to unmarried women are among the many changes in American society that haveaffected family structure and the economic security of children.8 Children of unmarried mothers are at
higher risk of having adverse birth outcomes, such as low birthweight and infant mortality, and are morelikely to live in poverty than children of married mothers.9-I3
Figure POP7.A Birth rates for unmarried women by age of mother, 1980-2001
Births per 1,000 unmarried women in specific age group
100
SOURCE: Centers for Disease Control and Prevention, National Center for Health Statistics, National Vital Statistics System.
There were 44 births for every 1,000 unmarriedwomen ages 15 to 44 in 2001.14,15Between 1980 and 1994, the birth rate forunmarried women ages 15 to 44 increased from 29to 46 per 1,000. Between 1995 and 2001, the ratehas fluctuated little, ranging from 43 to 44 per1,000.12,14'15
Between 1980 and 1994, birth rates increasedsharply for unmarried women in all age groups.The birth rate for unmarried women ages 15 to 17increased from 21 to 32 per 1,000, and the rate forunmarried women ages 18 to 19 rose from 39 to 69per 1,000. The birth rate for unmarried womenages 20 to 24 increased from 41 to 71 per 1,000.Between 1994 and 2001, birth rates by age declinedfor all women under age 20, and increasedsomewhat for women in age groups 20 to 24through 40 to 44 years.12,14,15The long-term rise between 1960 and 1994 in thenonmarital birth rate is linked to a number offactors.12 The proportion of women ofchildbearing age who are unmarried increased(from 29 percent in 1960 to 46 percent in 1994),
concurrent with an increase in nonmaritalcohabitation. About 25 percent of unmarriedwomen aged 25 to 39 were in cohabitingrelationships in 1995.16 The likelihood that anunmarried woman will marry before the child isborn declined steeply from the early 1960s to theearly 1980s and continued to fall, although moremodestly, through the early 1990s.17 At the sametime, childbearing within marriage declined: birthsto married women declined from 4 million in 1960to 2.7 million in 1994, and the birth rate formarried women fell from 157 per 1,000 in 1960 to83 per 1,000 in 1994.10-12,15 These measuresstabilized in the mid- 1990s and then increasedslowly, as the nonmarital birth rate steadied duringthis period.12,15Between 1994 and 2001, nonmarital birth rates byage changed relatively little, although rates foryounger teens 15 to 17 fell nearly one-third. Ratesin 2001 remained highest for women aged 20 to24.14'15
inAmerica's Children: Key National Indicators of Well-Being, 2003

151hildren are at greater risk for adverse consequences when born to a single mother because the social,emotional, and financial resources available to the family may be more limited.9 The proportion of births to
unmarried women is useful for understanding the extent to which children born in a given year may be affected byany disadvantagesocial, financial, or healthassociated with being born outside of marriage. The percentage ofbirths to unmarried women is a function of several factors, including birth rates for married and unmarried womenand the number of unmarried women.18 Significant changes occurred in all these measures between 1980 and2001. 11,12,19
-
Percent
100
80 _____
60
40 ----
20--
Percentage of all births that are to unmarried women by age of mother,1980 and 2001
0All
ages
III 1980
Under Ages Agesage 15 15-17 18-19
2001
Ages Ages Ages20-24 25-29 30-34
Ages35-39
SOURCE: Centers For Disease Control and Prevention, National Center for Health Statistics, National Vital Statistics System.
In 2001, 34 percent of all births were to unmarriedwomen.The percentage of all births to unmarried womenrose sharply from 18 percent in 1980 to 33 percentin 1994.12 From 1994 to 2001, it has increasedslightly to 34 percent. 10,12
Between 1980 and 2001, the proportions of birthsto unmarried women rose sharply for women in allage groups. Among teenagers, the proportions werehigh throughout the period and continued to rise,from 62 to 88 percent for ages 15 to 17 and from 40to 75 percent for ages 18 to 19. The proportionsmore than doubled for births to women in theirtwenties, rising from 19 to 50 percent for ages 20 to24 and from 9 to 24 percent for ages 25 to 29. Theproportion of births to unmarried women in theirthirties increased from 8 to 14 percent. 10,12
Age 40and
older
One-third of all births, including 4 in 10 first births,were to unmarried women in 2001. Nearly two-thirds of women under age 25 having their firstchild were not married.20The increases in the proportions of births tounmarried women, especially during the 1980s, arelinked to sharp increases in the birth rates forunmarried women in all age groups during thisperiod, concurrent with declines in birth rates formarried women. In addition, the number ofunmarried women increased by about one-fourth asmore and more women from the baby-boomgeneration postponed marriage.12,19During the late 1990s, the pace of increase in theproportions slowed. The comparative stability islinked to a renewed rise in birth rates formarried women.10'12
Bullets contain references to data that can be found inTables POP7.A and POP7.B on page 82. Endnotes beginon page 63.
2Part I: Population and Family Characteristics fl

Child Care
ncreasing proportions of children are spending substantial amounts of time in the care of a child careprovider other than their parents. While researchers continue to assess the effects of child care on child
development, it is important to monitor over time the way many children receive care. This measurepresents two important aspects of child care usage for preschoolers: overall use of different provider typesregardless of parents' work status (POP8.A) and a historical trend of the primary child care provider used byemployed mothers for their preschoolers (POP8.B).21
Figure POP8.A
Percent
90
80
70
60
50
40
30
20
10
0Parental care only
III 0-2 years
Percentage of children from birth through age six, not yet in kindergarten bytype of care arrangement, 2001
Total in nonparental care Care in homeby a relative
3-6 years, not yet in kindergarten
r 1
Care in homeby a nonrelative
Center-based programs
NOTE: Some children participate in more than one type of arrangement, so the sum of all arrangement types exceeds the total percentagein nonparental care. Center-based programs include day care centers, prekindergartens, nursery schools, Head Start programs, and otherearly childhood education programs. Relative and nonrelative care can take place in either the child's own home or another home.
SOURCE: U.S. Department of Education, National Center for Education Statistics, National Household Education Survey.
Figure POP8.AIn 2001, 61 percent of children from birth throughage 6 (not yet in kindergarten) received some formof child care on a regular basis from persons otherthan their parents. This translates to approximately12 million children and is about the sameproportion of children in child care as in 1995.The type of child care received is related to the ageof the child. Children from birth through age 2were more likely to be in home-based care, eitherwith a relative or nonrelative, than to be in center-based care. Children ages 3 to 6 who were not yet inkindergarten were more likely to be in a center-based child care arrangement (including nurseryschools and other early childhood educationprograms) than in home-based care with either arelative or a nonrelative.
Figure POP8.B
Percentage of preschoolers (children under age 5) of
employed mothers by primary child care arrangement,
selected years 1985-9922
Percent
40
Other nonrelative careCenter-based care
30 /
20Grandparent
10 Father care Other relative care
01985
Mother care
1988 1990 1991 1993 1995 1997 1999
NOTE: The primary arrangement is the arrangement used for the longestnumber of hours per week while the mother worked.
SOURCE: U.S. Census Bureau, Survey of Income and
Program Participation.
10 America's Children: Key National Indicators of Well-Being, 2003
27

Egoncern for the well-being of grade-school-age children has drawn attention to their child carearrangements and out-of-school activities, including time spent unsupervised.23 School-age children spend
their weekday, nonschool time in child care arrangements but also engage in a variety of enrichment activitiessuch as sports, arts, clubs, academic activities, community service, and religious activities. Some of these childrenalso spend time caring for themselves without adult supervision. This measure presents the most recent data onhow grade-school-age children spend their out-of-school time.
Figure POP8.0
Percent
60
50
40
30
20
10
Percentage of children in kindergarten through eighth grade by weekdaycare and activities, 2001
Child care
Parental care Home-based Center-basedonly care care
1111 Kindergarten-3rd grade
Self care
4th-8th grade
PActivities
Total in anyactivity
Sports Religiousactivities
NOTE: Some children participate in more than one type of care arrangement or activity. For self care, parents reported that their child isresponsible for himself/herself before or after school on a regular basis. Parents reported on organized before- or after-school activitiesthat are undertaken by their child on a regular basis. For a full listing of activities, see Table POP8.C.
SOURCE: U.S. Department of Education, National Center for Education Statistics, National Household Education Survey.
Figure POP8.BIn 1999, half of preschoolers (children under age5) with employed mothers were primarily cared forby a relative while their mother worked, while 22percent were primarily cared for by nonrelatives ina center-based arrangement and 20 percent byother nonrelatives in a home-based environment.In 1999, grandparents and other relatives were theprimary child care provider for 21 percent and 8percent of preschoolers of employed mothers,respectively.Families in poverty with an employed mother reliedto a greater extent on grandparents (24 percent) orother relatives (13 percent) as their primary childcare arrangement for their preschooler than didfamilies not in poverty (20 percent and 7 percent,respectively).Higher proportions of preschoolers of employedmothers living at or above the poverty line wereprimarily cared for by a nonrelative (43 percent)than preschoolers living below the poverty line (38percent) in 1999.
Figure POP8.0About half (51 percent) of children in kindergartenthrough third grade and those in grades four toeight (52 percent) received some nonparental childcare in 2001.Older children were more likely to care forthemselves before or after school than youngerchildren. Three percent of children in kindergartenthrough third grade and 25 percent of children infourth through eighth grade cared for themselvesregularly either before or after school.Children in the higher grades were more likely toengage in some kind of organized before- or after-school activity than were children in the lowergrades. Children from families in poverty were lesslikely to participate in activities than children whosefamilies were at or above poverty. Children inkindergarten through eighth grade were more likelyto participate in sports than in any other activity.
Bullets contain references to data that can be found in TablesPOP8.A-POP8. Con pages 83-85. Endnotes begin on page 63.
."4
Part I: Population and Family Characteristics III

Children's Environments
Elhe environment in which children live plays an important role in their health and development.Children need a clean, safe place in which they can grow and play. Children may be more vulnerable to
environmental contaminants because of their increased potential for exposure to pollutants, since they eat,drink, and breathe more per body weight than adults. In addition, environmental contaminants in air, food,drinking water, and other sources are associated with a number of different ailments, and these contaminantsmay disproportionately affect children because they are still developing.2428 One important measure ofenvironmental quality is the percentage of children living in areas that do not meet the National Ambient AirQuality Standards. Polluted air is associated with increased asthma episodes and other respiratory illnesses.While air pollution is one important measure of children's environments, further research is needed todevelop a more complete measure of overall environmental quality for children.
Figure POP9.A
Percent
35
Percentage of children under age 18 living in areas that do not meet one or more ofthe Primary National Ambient Air Quality Standards, 1990-2001
10
5
0
Particulate matter
Carbon monoxide
1990 1995 2001
NOTE: The U.S. Environmental Protection Agency has set national air quality standards for six principal pollutants: carbon monoxide (CO), lead
(Pb), nitrogen dioxide (NO2), ozone (Os), particulate matter (PM), and sulfur dioxide (SO2). Nitrogen dioxide and sulfur dioxide are not included inthe graph because essentially all areas met the Primary National Ambient Air Quality Standards for these pollutants after 1991.
SOURCE: U.S. Environmental Protection Agency, Office of Air and Radiation, Aerometric Information Retrieval System.
In 2001, 19 percent of children lived in areas thatdid not meet one or more of the Primary NationalAmbient Air Quality Standards, an improvementfrom 28 percent in 1990. The Clean Air Actestablished Primary National Ambient Air QualityStandards which are designed to establish limits toprotect public health, including the health ofsensitive populations such as children and individualswith asthma.In 2001, 1 percent of children lived in areas thatdid not meet the National Ambient Air QualityStandard for lead. High levels of lead aredangerous to children because they can lead toneurological and developmental problems.
Figure POP9.A does not reflect the new standards forparticulate matter and ozone being implemented bythe Environmental Protection Agency to betterprotect public health, including children's health.Ozone accounts for most of the areas that do notmeet the Primary National Ambient Air QualityStandards. Both particulate matter and ozone cancause respiratory problems and aggravate respiratorydiseases, such as asthma, in children. These problemscan lead to increased emergency room visits andhospitalizations.
America's Children: Key National Indicators of Well-Being, 2003
up 29

hildren who are exposed to environmental tobacco smoke, also known as secondhand smoke, have an[§Iincreased probability of experiencing a number of adverse health effects, including infections of the
lower respiratory tract, bronchitis, pneumonia, fluid in the middle ear, and sudden infant death syndrome(S1DS).29-31 Secondhand smoke can also play a role in the development and exacerbation of asthma.32-38
Cotinine, a breakdown product of nicotine, is a marker for recent (previous 1-2 days) exposure tosecondhand smoke. The average (geometric mean) blood cotinine level in children living in homes wheresomeone smokes is 1.0 ng/mL.39
Figure POP9.B
Percent
100
80
60
40
20
0
Percentage of children ages 4 to 11 with specified blood cotinine levels by raceand ethnicity, 1988-1994 and 1999-2000
1988-1994
1999-2000
1988-1994
1999-2000
1988-1994
1999-2000
1988-1994
1999-2000
Total
III More than1.0 ng/ml.
White, non-Hispanic Black, non-Hispanic Mexican American
0.05 to1.0 ng/mL
NOTE: Cotinine is detectable at or above 0.05 nanograms per milliliter (ng/mL). Cotinine levels are reported for nonsmoking children only.
SOURCE: Centers for Disease Control and Prevention, National Center for Health Statistics, National Health and Nutrition Examination Survey.
Figure POP9.0 Percentage of households
with children under age 7 where someone smokes
regularly, selected years 1994-1999
Percent35
30
25
20
15
10
5
01994 1996 1999
NOTE: Percentages represent households with survey respondent answering
"yes" to this question: 'Do you allow anyone to smoke in your home on
a regular basis?"SOURCE: U.S. Environmental Protection Agency, Office of Air and Radiation,
Survey on Radon Awareness and Environmental Tobacco Issues.
Children's exposure to secondhand smoke, asindicated by blood cotinine levels, dropped between1988-1994 and 1999-2000. Overall, 64 percent ofchildren ages 4 to 11 had cotinine in their blood in1999-2000, down from 88 percent in 1988-1994. In1999-2000, 18 percent had blood cotinine levels morethan 1.0 ng/mL, down from 26 percent in 1988-1994.Racial and ethnic disparities exist such that in 1999-2000, 86 percent of Black, non-Hispanic childrenages 4 to 11 had cotinine in their blood comparedwith 63 percent of White, non-Hispanic children and49 percent of Mexican American children. A smallerproportion of Mexican American children hadblood cotinine levels more than 1.0 ng/mLcompared with children of other racial groups.The percentage of homes with children under 7 inwhich someone smokes on a regular basis decreasedfrom 29 percent in 1994 to 19 percent in 1999.
Bullets contain references to data that can be found in TablesPOP9.A-POP9.0 on pages 86 and 87. Endnotes begin onpage 63.
Part I: Population and Family Characteristics III30)

Data Needed
Population and Family Characteristics
Current data collection systems at the national level do not provide extensive detailed information on children'slives, their families and their caregivers. Certain topical databases provide some of this information, but data needsto be collected across domains of child well-being regularly enough to discern trends in where, how, and withwhom children spend their time. More data are also needed on:
Family interactions. Increasing the detail ofinformation collected about family structure andimproving the measurement of cohabitation andfamily dynamics were among the key suggestionsfor improvement emerging from the 2001Counting Couples Workshop, sponsored by theForum. Other suggestions included increasing theinformation collected for nonresident parents,especially fathers; developing standard indicators tobe included on multiple data collections; andincluding measures of family-related values andattitudes. More information from the workshop isavailable online at http://www.childstats.gov.Time use. A regular source of data is needed to trackhow and where children spend their time and howthese patterns change over time. For example,valuable insights would be provided by data on howmuch time children spend in school, in day care, inafter-school activities, using a computer, interactingwith one or both parents, and how much timeyouth spend at work. Currently, Federal surveyscollect information on the amount of time childrenspend on certain activities, such as watchingtelevision and on participation rates in specificactivities or care arrangements, but no regularFederal data source examines time spent on thewhole spectrum of children's activities. Theinclusion in surveys of additional questions on timeuse by children and adults is currently beinginvestigated by several member agencies of theForum. The Bureau of Labor Statistics has initiateda continuous time use survey that will cover timeinvested in the care of children, as well as timespent in other labor market and non-labor marketactivities. The survey will also include responsesfrom youth ages 15 and over. The initial resultsshould be available in mid-2004.
IIAmerica's Children: Key National Indicators of Well-Being, 2003
Children's environments. Further data are needed tomonitor the environments of children and theirpotential exposure to environmental contaminants.In particular, data are needed to describe children'spotential exposure to contaminants in drinkingwater and food.
3!

Part II: Indicators of Children's Well -Being
contains data on key indicators that
measure the health, security, and safety of the
social environment in which children play,
learn, and grow. Unlike the data presented in
Part I of the report, which describe the
changing context in which children live, the
data in Part II offer insight into the condition of
American children by providing information in
four key areas of child well-being: economic
security, health, behavior and social
environment, and education.
PART II
Indicators ofChildren's Well-Being
Economic Security IndicatorsThe well-being of children depends greatly on thematerial well-being of their family. The EconomicSecurity indicators presented in this section attempt
to measure a family's ability to access basic
material needs. The first two indicators measurethe economic well-being of children through thefamily's access to income and the employment
status of the resident parent or parents. The finalthree indicators measure the accessibility of three
economic necessitieshousing, food, and healthcare. Additional important indicators of children'seconomic well-being for which data are notavailable include measures of family income andpoverty over longer periods of time, as well ashomelessness.

Child Poverty and Family Income
hildhood poverty has both immediate and lasting negative effects. Children in low-income families fareless well than children in more affluent families for many of the indicators presented in this report,
including indicators in the areas of economic security, health, and education. Compared with children livingin families above the poverty line, children living below the poverty line are more likely to have difficulty inschool,40 to become teen parents,'" and, as adults, to earn less and be unemployed more frequently.° Thechild poverty rate provides important information about the percentage of U.S. children whose currentcircumstances make life difficult and jeopardize their future economic well-being.
Indicator ECON I .A
Percent
60
40
20
Percentage of related children under age 18 in poverty by family structure,1980-2001
01980 1985 1990
Female-householder families
All families
Married-couple families
1995 2001
NOTE: Estimates refer to children under age 18 who are related to the householder. In 2001, the average poverty threshold for a familyof four was $18,104 in annual income.
SOURCE: U.S. Census Bureou, March Current Population Survey.
The proportion of children living in families withincomes below the poverty threshold was 16 percentin 2001. The official poverty rate for children hasfluctuated since the early 1980s: it reached a high of22 percent in 1993, decreased to 16 percent in 2000,and has remained stable since.42 In response to theNational Academy of Sciences's recommendations,the U.S. Census Bureau is researching alternativepoverty measures.43The poverty rate for children living in female-householder families (no spouse present) alsofluctuated since 1980, but experienced a steeperdecline between 1993 and 2000 than did the rate forall children. In 1993, 54 percent of children living infemale-householder families were living in poverty; by2001, this proportion had decreased to 39 percent.This change is even more pronounced for Blackchildren: the percentage of Black children living infemale-householder families in poverty waveredaround 66 percent until 1993 and has since declinedto 47 percent in 2001.Children under age 6 are more likely to be living infamilies with incomes below the poverty line than
children ages 6 to 17. In 2001, 18 percent of childrenunder age 6 lived in poverty, compared with 15percent of older children.Children in married-couple families are much lesslikely to be living in poverty than children living onlywith their mothers. In 2001, 8 percent of children inmarried-couple families were living in poverty,compared with 39 percent in female-householderfamilies.This contrast by family structure is especiallypronounced among certain racial and ethnic groups.For example, in 2001, 10 percent of Black children inmarried-couple families lived in poverty, comparedwith 47 percent of Black children in female-householder families. Twenty percent of Hispanicchildren in married-couple families lived in poverty,compared with 49 percent in female-householderfamilies.The poverty rate is much higher for Black orHispanic children than for White, non-Hispanicchildren. In 2001, 9 percent of White, non-Hispanicchildren lived in poverty, compared with 30 percentof Black children and 27 percent of Hispanic children.
16 America's Children: Key Notional Indicators of Well-Being, 2003
4.

lahe full distribution of the income of children's families is important, not just the percentage of childrenliving in poverty. The rise in the number of children living in affluent families tells us that a growing
proportion of America's children live in households experiencing economic well-being. The growing gapbetween rich and poor children suggests that poor children may experience more relative deprivation even ifthe percentage of poor children is declining.
Percent
100
Percentage of related children under age 18 by family income relative to thepoverty line, 1980-2001
80
60
40
20
o3c1of,"rXrA
01980 1985 1990 1995 2001
NOTE: Estimates refer to children under age 18 who are related to the householder. The income classes are derived from the ratio of thefamily's income to the family's poverty threshold. Extreme poverty is less than 50 percent of the poverty threshold (i.e., $9,052 for a familyof four in 2001). Poverty is between 50 and 99 percent of the poverty threshold (i.e., between $9,052 and $18,103 for a family of fourin 2001). Low income is between 100 and 199 percent of the poverty threshold (i.e., between $18,104 and $36,207 for a family offour in 2001). Medium income is between 200 and 399 percent of the poverty threshold (i.e., between $36,208 and $72,415 for afamily of four in 2001). High income is 400 percent of the poverty threshold or more (i.e., more than $72,416 for a family of four in
2001).44
SOURCE: U.S. Census Bureau, March Current Population Survey.
In 2001, more children lived in families withmedium income (33 percent) than in other incomegroups. Smaller percentages of children lived infamilies with low income and with high income (22and 29 percent, respectively).The percentage of children living in families withmedium income fell from 41 percent in 1980 to 33percent in 2001, while the percentage of childrenliving in families with high income rose from 17 to29 percent.
The percentage of children living in familiesexperiencing extreme poverty was 7 percent in1980. This percentage rose to 10 percent in 1992and has gradually decreased to 7 percent in 2001.Concurrently, three times as many children lived infamilies with very high incomes in 2001 as in 1980(13 and 4 percent, respectively).
Bullets contain references to data that can be found inTables ECON1.A and ECONI.B on pages 88-89. Endnotesbegin on page 63.
BEST COPY AVAfLABLE
Part II: Indicators of Children's Well-Being III3t

Secure Parental Employment
ecure parental employment reduces the incidence of poverty and its attendant risks to children. Sincemost parents who obtain health insurance for themselves and their children do so through their
employers, a secure job can also be a key variable in determining whether children have access to health care.Secure parental employment may also enhance children's psychological well-being and improve familyfunctioning by reducing stress and other negative effects that unemployment and underemployment canhave on parents.45,46 One measure of secure parental employment is the percentage of children whoseresident parent or parents were employed full time during a given year.
Indicator ECON2
Percent
100
80
60
40
20
0
Percentage of children under age 18 living with at least one parent employedfull time all year by family structure, 1980-2001
Children living with two married parents
All children living with parent(s)
Children living with single father
Children living with single mother
1980 1985 1990
SOURCE: U.S. Bureau of Labor Statistics, March Current Population Survey.
The percentage of children who had at least oneparent working year round, full time fell slightly in2001 to 79 percent. This was slightly below its peakof 80 percent reached the year before, but aboutthe same as in 1999. Despite the decline, thisproportion still remained quite high in its historicalcontext. Since 1992, when the proportion was at itslowest point for the decade (71 percent), the trendin secure parental employment has paralleled theoverall trend in employment, rising by about 10percentage points to its peak in 2000.This past year, the change in secure parentalemployment was similar for children living inmarried two-parent and single-mother families. Overthe decade, however, a disproportionate share of theincrease in the percentage of children living with atleast one parent employed full time all year was dueto the increase in the percentage of children livingwith single mothers who are employed.In 2001, 89 percent of children living in marriedtwo-parent families had at least one parent who wasa full-time, year-round worker. In contrast, 69percent of children living with a single father and48 percent of children living with a single motherhad a parent who worked full time all year.Children living in poverty are much less likely tohave a parent working full time all year than
1995 2001
children living at or above the poverty line (32percent and 87 percent, respectively, in 2001).For children living with two married parents, 54percent of children living below the poverty linehad at least one parent working full time all year,compared with 92 percent of children living at orabove the poverty line.In recent years, however, children living below thepoverty line have become increasingly likely to haveone or two parents working full time all year. In1993, 21 percent of children below poverty had atleast one parent working full time all year. In 2001,this statistic was 32 percent.Black, non-Hispanic children and Hispanicchildren were less likely than White, non-Hispanicchildren to have a parent working full time all year.About 73 percent of Hispanic children and 65percent of Black, non-Hispanic children lived infamilies with secure parental employment in 2001,compared with 84 percent of White children.During the past two decades, the percentage ofchildren living in married two-parent families in whichboth the mother and father worked full time all yearhas almost doubled, increasing from 17 to 32 percent.
Bullets contain references to data that can be found in TableECON2 on pages 90-91. Endnotes begin on page 63.
America's Children: Key National Indicators of Well-Being, 2003
35

Housing Problems
nadequate, crowded, or costly housing can pose serious problems to children's physical, psychological, orLi material well-being.47 The percentage of households with children that report that they are living inphysically inadequate," crowded, and/or costly housing provides an estimate of the percentage of childrenwhose well-being may be affected by their family's housing.
Indicator ECON3
Percent
40
30
20
10
0
Percentage of households with children under age 18 that report housingproblems by type of problem, selected years 1978-2001
1978 1983
Any housing problem
Cost burden
Inadequate housing
Crowded housing
1989 1993 1995 1997 1999 2001
NOTE: Data are available for 1978, 1983, 1989, 1993, 1995, 1997, 1999, and 2001.
SOURCE: U.S. Census Bureau and the U.S. Department of Housing and Urban Development, Annual Housing Survey and AmericanHousing Survey. Tabulated by the U.S. Department of Housing and Urban Development.
In 2001, 36 percent of U.S. households (both ownersand renters) with children had one or more of threehousing problems: physically inadequate housing,crowded housing, or housing that cost more than 30percent of household income.49The share of U.S. households with children thathave any housing problems rose from 30 percentin 1978 to 36 percent in 1995 and has remainedstable since.Inadequate housing, defined as housing with severeor moderate physical problems, has become slightlyless common. In 2001, 7 percent of households withchildren had inadequate housing, compared with 9percent in 1978.Crowded housing, defined as housing in whichthere is more than one person per room, has alsodeclined slightly among households with children,from 9 percent in 1978 to 6 percent in 2001.Improvements in housing conditions, however, havebeen accompanied by rising housing costs. Between1978 and 2001, the percentage of households withchildren with a cost burdenthat is, paying morethan 30 percent of their income for housingrosefrom 15 percent to 28 percent. The percentage with
severe cost burdens, paying more than half of theirincome for housing, rose from 6 to 11 percent.Households that receive no rental assistance andhave severe cost burdens or physical problems aredefined as having severe housing problems.5° In2001, 11 percent of households with children hadsevere housing problems. Although the 1997, 1999,and 2001 data are not directly comparable withestimates for earlier years, severe housing problemsincreased from 8 percent in 1978 to 12 percent in1995 because of a rise in the percentage of familiesreporting severe cost burdens.Severe housing problems are especially prevalentamong very-low-income renters.51 In 2001, 31percent of very-low-income renter households withchildren reported severe housing problems, withsevere cost burden the major problem. Althoughthe percentage of these families having severehousing problems has fallen since 1978, the numberwith such problems grew from 1.4 million in 1978 to1.8 million in 2001, again because the number ofhouseholds with severe cost burdens rose.
Bullets contain references to data that can be found in TableECON3 on page 92. Endnotes begin on page 63.
Part II: Indicators of Children's Well-Being 111

Food Security and Diet Quality
131hildren's good health and development depend on a diet sufficient in nutrients and calories. A family'sability to provide for their children's nutritional needs is linked to the family's food securitythat is, to
its access at all times to enough food for an active, healthy life.52 Food-insecure households report difficultyobtaining enough food, reduced diet quality, anxiety about their food supply, increased use of emergencyfood sources or other coping behaviors, and, sometimes, reduced food intake and hunger. In most of thesehouseholds, children's eating patterns are disrupted to some extent, and in about 1 out of 4 food-insecurehouseholds, children's food intake is reduced at times because the household cannot afford enough food.However, childrenespecially younger childrenin U.S. households are usually protected from hunger evenif adults are hungry because they lack sufficient resources for food. Only in the most severely food-insecurehouseholds are children as well as adults hungry due to the food insecurity in the household.53
Indicator ECON4.A
Percent
50
40
30
20
10
0
Percentage of children under age 18 in food-insecure households by povertystatus and presence of hunger, selected years 1995-2001
1111111.111 Mr' or ma1995 1998 1999 2000 2001 1995 1998 1999 2000 2001 1995 1998 1999 2000 2001
All Below poverty At or above poverty
II With adult and child hunger a With adult hunger only Food insecure without hunger
NOTE: Statistics are not shown For 1996 and 1997 because differences in screening procedures make them not comparable with the other years. Thesestatistics should be compared across 2-year, 4-year, or 6-year periods to avoid seasonal effects that result from year-to-year alternation in the month in whichthe survey was conducted.
SOURCE: U.S. Census Bureau, Food Security Supplement to the Current Population Survey; U.S. Department of Agriculture, Economic Research Service andFood and Nutrition Service.
Just under half a million children (0.6 percent)lived in households with child hunger in 2001,statistically unchanged from 1999 and down from1.3 percent in 1995. In 2001, 4.1 percent of allchildren lived in households classified as foodinsecure with hunger, up from 3.8 percent in 1999but below the 1995 rate of 6.1 percent. In most ofthese households, however, hunger did not extendto the children.Children living in poverty are much more likelythan others to experience food insecurity andhunger. In 2001, about 2.6 percent of the childrenliving in poverty were in households with hungeramong children, compared with 0.3 percent ofchildren in households with incomes at or above
the poverty line. In 2001, nearly 45.9 percent ofchildren living in poverty were in food-insecurehouseholds, compared with 11.5 percent ofchildren living at or above the poverty line.Most food-insecure households do not reporthunger among household members. For example,of the 17.6 percent of children who lived in food-insecure households in 2001, most (13.5 percent)lived in households classified as food insecurewithout hunger, 3.5 percent lived in householdswith hunger among adults only, and 0.6 percentlived in households with hunger among both adultsand children.
20 America's Children: Key National Indicators of Well-Being, 2003
3

©he diet quality of children and adolescents is of concern because poor eating patterns established inchildhood usually transfer to adulthood. Such patterns are major factors in the increasing rate of child
obesity over the past decades and are contributing factors to certain diseases. The Healthy Eating Index(HEI) is a summary measure of diet quality. The HEI consists of 10 components, each representing differentaspects of a healthful diet. Components 1 through 5 measure the degree to which a person's diet conforms tothe U.S. Department of Agriculture's Food Guide Pyramid serving recommendations for the five major foodgroups: grains, vegetables, fruits, milk, and meat/meat alternatives. Components 6 and 7 measure fat andsaturated fat consumption. Components 8 and 9 measure cholesterol intake and sodium intake, andcomponent 10 measures the degree of variety in a person's diet. Scores for each component are given equalweight and added to calculate an overall HEI score. This overall HEI score is then used to determine dietquality based on a scale established by nutrition experts.54
Indicator ECON4.B
Percent
100
80
60
40
20
0
Percentage of children ages 2 to 18 by age and diet quality as measured by theHealthy Eating Index, selected years 1989-90, 1994-96, 1999-2000
1989-1990
1994-1996
1999-2000
1989-1990
1994-1996
1999-2000
1989-1990
1994-1996
1999-2000
Ages 2-6 Ages 7-12 Ages 13-18
Poor diet III Needs improvement Good diet
NOTE: The maximum combined score for the 10 components is 100. An HEI score above 80 implies a good diet, an HEI score between51 and 80 implies a diet that needs improvement, and an HEI score less than 51 implies a poor diet. Data for three time periods are notnecessarily comparable because of methodological differences in data collection.
SOURCE: U.S. Department of Agriculture, Center for Nutrition Policy and Promotion using data from 1989-91 and 1994-96, ContinuingSurvey of Food Intake of Individuals, and 1999-2000 National Health and Nutrition Examination Survey.
In 1999-2000, as in previous years, most childrenhad a diet that was poor or needed improvement,as indicated by their HEI score.As children get older, their diet quality declines. In1999-2000, among children ages 2 to 6, 20 percent hada good diet, 74 percent had a diet needing improve-ment, and 6 percent had a poor diet. For those ages7 to 12, 8 percent had a good diet, 79 percent had adiet needing improvement, and 13 percent had apoor diet.The lower-quality diets of older children are linked todeclines in their fruit and sodium scores.
Children in families below poverty are less likely thanhigher-income children to have a diet rated as good.In 1999-2000, for children ages 2 to 6, 17 percent ofthose in poverty had a good diet, compared with 22percent of those living at or above the poverty line.
Bullets contain references to data that can be found in TablesECON4.A ECON4.D on pages 93-95. Endnotes begin onpage 63.
Part II: Indicators of Children's Well-Being 1/1

Access to Health Care
NIhildren with access to health care have reasonable assurance of obtaining the medical attention neededto maintain their physical well-being. Access involves both the availability of a regular source of care and
the ability of the child's family, or someone else, to pay for it. Children with health insurance (governmentor private) are much more likely than children without insurance to have a regular and accessible sourceof health care. The percentage of children who have health insurance coverage for at least part of the yearis one measure of the extent to which families can obtain preventive care or health care for a sick orinjured child.
Indicator ECON5.A
Percent
100
80
60
40
20
0
Percentage of children under age 18 covered by health insurance by type ofhealth insurance, 1987-2001
1987 1990
Any health insurance
Private health insurance
Government health insurance
1995 2001
NOTE: Government health insurance for children consists primarily of Medicaid, but also includes Medicare, SCHIP (the State Children'sHealth Insurance Programs), and CHAMPUS/Tricare, the health benefit program for members of the armed forces and their dependents.Estimates beginning in 1999 include follow-up questions to verify health insurance status. Estimates for 1999 through 2001 are notdirectly comparable with earlier years, before the verification questions were added. Children are considered to be covered by healthinsurance if they had government or private coverage any time during the year.
SOURCE: U.S. Census Bureau, March Current Population Survey.
In 2001, 88 percent of children had healthinsurance coverage at some point during the year,maintaining the all-time high established in 2000.However, between 85 and 88 percent of childrenhave had health insurance in each year since 1987.The number of children who had no healthinsurance at any time during 2001 was 8.5 million(12 percent of all children), which was similarto 2000.The proportion of children covered by privatehealth insurance decreased from 74 percent in1987 to 66 percent in 1994, then increased to 70percent in 1999, but dropped down to 68 percentin 2001. During the same time period, theproportion of children covered by governmenthealth insurance grew from 19 percent in 1987 to ahigh of 27 percent in 1993. Government healthinsurance decreased until 1999 and then began toclimb again to 26 percent in 2001.55
Hispanic children are less likely to have healthinsurance than either White, non-Hispanic or Blackchildren. In 2001, 76 percent of Hispanic childrenwere covered by health insurance, compared with93 percent of White, non-Hispanic children and 86percent of Black children.Overall rates of coverage are about the same bychild's age. However, the type of insurance doesvary by the age of the child: government-providedinsurance decreases but private health insuranceincreases with age.
ElAmerica's Children: Key National Indicators of Well-Being, 2003
39,

/a he health of children depends at least partially on their access to health services. Health care forchildren includes physical examinations, preventive care, health education, observations, screening,
immunizations, and sick care.56 Having a usual source of carea particular person or place a child goes forsick and preventive carefacilitates the timely and appropriate use of pediatric services.57,58 Emergencyrooms are excluded here as a usual source of care because their focus on emergency care generally excludesthe other elements of health care.59
Indicator ECON5.B
Percent
35
30
25
15
10
0
Percentage of children under age 18 with no usual source of health care by typeof health insurance, 1993-2001
Uninsured/--
Total
Publicnsurance,--=
*. PrivateInsurance
1993 1994 1995 1996 1997 1998 1999 2000 2001
NOTE: Emergency rooms are excluded as a usual source of care. A break is shown in the lines because in 1997, the National HealthInterview Survey was redesigned. Data for 1997-2001 are not strictly comparable with earlier data.
SOURCE: Centers for Disease Control and Prevention, National Center for Health Statistics, National Health Interview Survey.
In 2001, 6 percent of children had no usual sourceof health care, which is the lowest rate recordedsince 1993.There are differences in the percentage of childrenhaving no usual source of care by type of healthinsurance coverage. In 2001, children with publicinsurance, such as Medicaid, were more likely tohave no usual source of care than were childrenwith private insurance (5 percent and 2 percent,respectively).Uninsured children are much more likely to haveno usual source of care than are children who havehealth insurance. Children who were uninsuredwere nearly twelve times as likely as those withprivate insurance to have no usual source of carein 2001.
In 2001, 12 percent of children in families belowthe poverty line had no usual source of care,compared with 4 percent of children in higher-income families.Older children are slightly more likely thanyounger children to lack a usual source of healthcare. In 2001, 6 percent of children ages 5 to 17had no usual source of care, compared with 4percent of children ages 0 to 4.
Bullets contain references to data that can be found in TablesECON5.A and ECON5.B on pages 96-97. Endnotes beginon page 63.
4.0
Part II: Indicators of Children's Well-Being El

Indicators Needed
Economic Security
Economic security is multifaceted, and several measures are needed to adequately represent its various aspects.While this year's report provides some information on economic and food security, additional indicators areneeded on:
Economic security. Changes in children's economicwell-being over time need to be anchored in anaverage standard of living context. Multiplemeasures of family income or consumption, someof which might incorporate estimates of variousfamily assets, could produce more reliable estimatesof changes in children's economic well-being overtime.Long-term poverty among families with children.Although good Federal data are available on childpoverty and alternative measures are beingdeveloped (see Indicators ECON1.A and ECON1.B,Child Poverty and Family Income, and thediscussion of alternative poverty rates on page 89),
IIAmerica's Children: Key National Indicators of Well-Being, 2003
the surveys that collect these data do not captureinformation on long-term poverty. Long-termpoverty among children can be estimated fromexisting longitudinal surveys, but changes tocurrent surveys would be needed to provideestimates on a regular basis. Since long-termpoverty can have serious negative consequences forchildren's well-being, regularly collected andreported data are needed to produce regularestimates.Homelessness. At present, there are no regularlycollected data on the number of homeless childrenin the United States, although there have beenoccasional studies aimed at estimating this number.
41

Indicators ofChildren's Well-Being
Health IndicatorsThe World Health Organization defines health as
"a state of complete physical, mental, and socialwell-being, and not merely the absence of diseaseor infirmity." This section presents information onseveral important measures of child health. Datadepicted include indicators of general health andchronic disease, a measure of birth outcomes (lowbirthweight), mortality rates, overweight,immunization rates, and rates of births toadolescents. Important measures for which dataare not available include child abuse and neglect,mental health, and disability.

General Health Status
INhe health of children and youth is fundamental to their well-being and development. Parentalreports of their children's health provide one indication of the overall health status of the Nation's
children. This indicator measures the percentage of children whose parents report them to be in very goodor excellent health.
Indicator HEALTH1
Percent
100
80
60
40
20
0
Percentage of children under age 18 in very good or excellent health bypoverty status, 19842001
At or above poverty
Total
Below poverty
1984 1985 1990 1995 2001
NOTE: In 1997, the National Health Interview Survey was redesigned. Data for 1997-2001 are not strictly comparable with earlier data.
SOURCE: Centers for Disease Control and Prevention, National Center for Health Statistics, National Health Interview Survey.
In 2001, about 83 percent of children werereported by their parents to be in very good orexcellent health.Children under age 5 are slightly more likely to bein very good or excellent health than are childrenages 5 to 17 (85 and 82 percent, respectively).White, non-Hispanic children were more likelythan Black, non-Hispanic and Hispanic children tobe in very good or excellent health. In 2001, 87percent of White, non-Hispanic children werereported to be in very good or excellent health,compared with 74 percent of Black, non-Hispanicchildren and 77 percent of Hispanic children.
Child health varies by family income. Childrenliving below the poverty line are less likely thanchildren in higher-income families to be in verygood or excellent health. In 2001, about 71percent of children in families below the povertyline were in very good or excellent health,compared with 86 percent of children in familiesliving at or above the poverty line.Each year, children at or above the poverty linewere substantially more likely to be in very good orexcellent health than were children whose familieswere below the poverty line. However, the healthgap between children below and those at or abovethe poverty line decreased slightly between 1984and 2001.
Bullets contain references to data that can be found in TableHEAL7'Hl on page 98. See indicator ECON1.A andECON1.B on pages 16-17 for a description of child poverty.
elAmerica's Children: Key National Indicators of Well-Being, 2003

Activity Limitation
rm imitation of activity refers to a reduction in an individual's usual age-appropriate activities that results from aL.M physical, mental, or emotional problem. "Age-appropriate" refers to the activities in which the individualwould normally engage in at his/her age, such as school for children 5 to 17 years of age. In children, activitylimitation is a broad measure of health and functioning in areas such as understanding or accomplishingroutine schoolwork, eating, bathing, dressing, playing, and walking. Chronic health conditions that limitchildren's activities include, but are not restricted to: hearing, visual, and speech problems; learningdisabilities; mental retardation and other developmental problems (such as cerebral palsy); mental andemotional problems; and a variety of chronic health problems (such as asthma). The long-term impact ofactivity limitation in children can often be ameliorated by use of health care and educational services.60,61
Percent
12
10
6
4
2
Percentage of children ages 5 to 17 with any limitation in activity resulting fromchronic conditions by gender, selected years 1997-2001
Total
MaleEI Female
01997 1999 2000 2001
Some activity limitation
1997 1999 2000 2001
Activity limitationindicated by participation
in special education
1997 1999 2000 2001
Activity limitation indicatedby other limitations
NOTE: Data are available for 1997, 1999, 2000, and 2001. Children are identified as having activity limitations by asking parentswhether children (1) are limited in their ability to walk, to care for themselves, or to participate in any other activities, and whether they (2)receive special education services. Positive responses to either indicate some activity limitation. Children with activity limitations arecategorized as children with activity limitation indicated by participation solely in special education and children with activity limitationsindicated by other limitations, which includes some children who also receive special education services.
SOURCE: Centers for Disease Control and Prevention, National Center for Health Statistics, National Health Interview Survey.
In 2001, approximately 8 percent of children ages 5to 17 were reported to have limitations of activity dueto chronic conditions. Six percent were identified ashaving activity limitations solely by their participationin special education. Two percent had limitationsaffecting their ability to walk, care for themselves, orparticipate in other activities.Activity limitations, particularly those requiringspecial education services, are reported more oftenfor males than for females. The reasons for thisgender difference is unclear, however; maturational,behavioral, social, and diagnostic explanations havebeen proposed.62
Children in families of lower socioeconomic status(as measured by family income and parentaleducation) have higher rates of activity limitationscompared with children in higher socioeconomicstatus families. Among children ages 5 to 17, 12percent of children living in families with incomesbelow the poverty line had activity limitations due tochronic conditions in 2001, compared with 8 percentof children living in families with incomes at orabove the poverty line.
Bullets contain references to data that can be found in TableHEALTH2 on page 99. Endnotes begin on page 63.
41Part II: Indicators of Children's Well-Being ra

Overweight
O verweight adolescents often become overweight adults, with an increased risk for a wide variety of poorhealth outcomes including diabetes, stroke, heart disease, arthritis and certain cancers.63,64 The immediate
consequences of overweight in childhood are often psychosocial but also include cardiovascular risk factorssuch as high blood pressure, high cholesterol, and the precursors to diabetes.65 The prevalence of overweightamong U.S. children changed relatively little from the early 1960's through 1980; however, since 1980 it hasincreased sharply.66 The reasons for the increase in children who are overweight are not entirely clear andlittle is known about the prevention and treatment of overweight on a population basis. Numerous factors(e.g. advances in technology and trends in eating out) have been suggested as causes; however, definitive datalinking these factors to the recent trends are lacking. On an individual basis, it is clear that overweight is a resultof an imbalance between energy intake and energy expenditure. Recent national estimates indicate that onlyhalf of U.S. children participate in vigorous physical activity 67 and less than a quarter eat the recommended 5or more servings of fruits and vegetables per day,68 both of which are likely to contribute to the current highrates of overweight. In addition to individual factors such as these, it is essential that we identify the social,economic, and cultural forces contributing to the increasing prevalence of overweight among U.S. children.
Indicator HEALTH3
Percent
30
25
20
15
10
5
0
Total
White, Black,non- non-
Hispanic Hispanic
II 1976-1980
Percentage of children ages 6 to 18 who are overweight, by gender, race, andHispanic origin, selected years 1976-1980, 1988-1994, and 1999-2000
MexicanAmerican
Males
White, Black,non- non-
Hispanic Hispanic
1988-1994 1999-2000
MexicanAmerican
Females
White, Black,non- non-
Hispanic Hispanic
MexicanAmerican
NOTE: Data for Mexican American children are not available from 1976-80 due to differences in reporting of race and Hispanic origin.Overweight is defined as body mass index (BMI) at or above the 95th percentile of the 2000 Centers for Disease Control and PreventionBMI-for-age growth charts. BMI is calculated as weight in kilograms divided by the square of height in meters.
SOURCE: Centers for Disease Control and Prevention, National Center for Health Statistics, National Health and Nutrition Examination Survey.
Since the 1980s, there has been a steady increase inthe proportion of children who are overweight. In1976-1980, only 6 percent of children ages 6 to 18were overweight. By 1988-1994 this proportion hadrisen to 11 percent, and continued to climb to 15percent by 1999-2000.Data from 1999-2000 indicate that substantial racialand ethnic disparities exist such that largerpercentages of Black, non-Hispanic, and MexicanAmerican children are overweight compared withWhite, non-Hispanic children.Black, non-Hispanic girls and Mexican Americanboys are at particularly high risk of being
111 America's Children: Key National Indicators of Well-Being, 2003
overweight. In 1999-2000, 24 percent of Black, non-Hispanic girls and 29 percent of Mexican Americanboys were overweight.Among adolescent males ages 12 to 18, virtuallyno differences existed between ethnic groups in1988-94. By 1999-2000, there were large ethnicdifferences: 12 percent of White, non-Hispaniccompared with 21 percent of Black, non-Hispaniccompared with 30 percent of Mexican Americanmales were overweight.
Bullets contain references to data that can be found in TableHEALTH3 on page 100. Endnotes begin on page 63.
45

Childhood Immunization
A dequate immunization protects children against several diseases that killed or disabled children in pastdecades. Rates of childhood immunization are one measure of the extent to which children are
protected from serious vaccine-preventable illnesses. The combined immunization series (often referred to asthe 4:3:1:3 combined series) rate measures the extent to which children have received the recommendeddoses of four key vaccinations.
Indicator HEALTH4
Percent
100
80
60
40
20
0
Percentage of children ages19 to 35 months with the 4:3:1:3 combined series ofvaccinations by poverty status, 1996-2001
At or above poverty
Total
Below poverty
1996 1997 1998 1999 2000 2001
NOTE: Vaccinations included in the combined series are 4 doses of a vaccine containing diphtheria and tetanus toxoids (either diphtheria,tetanus toxoids, and pertussis vaccine [DTP] or diphtheria and tetanus toxoids vaccine [DT]), 3 doses of polio vaccine, 1 dose of a measles-containing vaccine (MCV), and 3 doses of Haemophilus influenzae type b (Hib) vaccine. The recommended immunization schedule for childrenis available at http://www.cdc.gov/nip/recs/child-schedule.pdf.
SOURCE: Centers for Disease Control and Prevention, National Immunization Program and National Center for Health Statistics, NationalImmunization Survey.
In 2001, 77 percent of children ages 19 to 35 monthshad received the recommended combined series ofvaccines (often referred to as the 4:3:1:3 combinedseries).Children with family incomes below the poverty levelhad lower rates of coverage with the combined seriesthan children with family incomes at or above thepoverty line-72 percent of children below povertycompared with 79 percent of higher-income children.Rates of coverage with the full series of vaccines(4:3:1:3)were higher among White, non-Hispanicchildren than among Black, non-Hispanic orHispanic children. Seventy-nine percent of White,non-Hispanic children ages 19 to 35 months receivedthese immunizations compared with 71 percent ofBlack, non-Hispanic children and 77 percent ofHispanic children.Overall and for children living above and below thepoverty level, coverage with the combined seriesremained relatively stable between 1999 and 2001, asdid the gap in coverage between children in familiesliving above and below the poverty level.
Coverage with three or more doses of Hib vaccineamong children ages 19 to 35 months remainedrelatively stable at 93 percent from 1996-2001.In addition to the combined series of vaccines, thereare other important immunizations such as those forhepatitis B and varicella (chicken pox). Coveragewith three or more doses of hepatitis B vaccineamong children ages 19 to 35 months increased from82 percent in 1996 to 89 percent in 2001.Coverage with varicella (chicken pox) vaccine amongchildren ages 19 to 35 months continued to increasefrom 58 percent in 1999 to 76 percent in 2001. Gainsin coverage for varicella vaccine were seen among allchildren regardless of race or ethnicity and povertylevel; however, children living at or above the povertyline had higher coverage levels than children livingbelow the poverty level.
Bullets contain references to data that can be found in TableHEALTH4 on page 101.
Part II: Indicators of Children's Well-Being El

Low Birthweight
rgiow-birthweight infants (infants born weighing less than 2,500 grams, or about 5.5 pounds) are at higherrisk of death or long-term illness and disability than are infants of normal birthweight.6" Low
birthweight results from an infant's being born preterm (before 37 weeks' gestation) or from being small forhis or her gestational age.
Indicator HEALTH5
Percent
15
10
5
Black, non-Hispanic
Mb
Hispanic
Percentage of infants born of low birthweight by mother's race and Hispanic origin,1980-2001
Total
White, non-Hispanic
Asian/Pacific Islander
American Indian/Alaska Native
01980 1985 1990 1995
SOURCE: Centers for Disease Control and Prevention, National Center for Health Statistics, National Vital Statistics System.
The percentage of infants born of low birthweight was
7.7 in 2001, up slightly from 7.6 percent recorded ineach year from 1998 to 2000. The low-birthweight ratehas increased slowly but steadily since 1984, when itwas 6.7 percent. The rate for 2001 was the highestsince 1972.10'20The low-birthweight rate for Black, non-Hispanicinfants is significantly higher than that of any otherracial or ethnic group. From 1990 to 2001 the low-birthweight rate among Black, non-Hispanic infantsvaried between 13.6 and 13.1 percent. Infants ofother racial and ethnic groups experiencedincreases in low-birthweight rates between 1990 and2001: among White, non-Hispanic infants the raterose from 5.6 to 6.8, among Hispanic infants it rosefrom 6.1 to 6.5, among Asians/Pacific Islanders itrose from 6.5 to 7.5, and among AmericanIndians/Alaska Natives it rose from 6.1 to 7.3, thehighest it has been in three decades.The percentage of low-birthweight births varieswidely within Hispanic and Asian/Pacific Islandersubgroups. Data for 2001 indicate that amongHispanics, women of Mexican origin had the lowest
2001
percentage of low-birthweight infants (6.1 percent)and Puerto Ricans the highest (9.3 percent). AmongAsian/Pacific Islander subgroups, low-birthweightrates were lowest among women of Chinese origin(5.3 percent) and highest among women of Filipinoorigin (8.7 percent).About 1.4 percent of infants were born with very lowbirthweight (less than 1,500 grams, or about 3.25pounds) in each year from 1996 to 2001, up from 1.3percent in each year from 1989 to 1995 and 1.2percent in each year from 1981 to 1998.One reason for the recent increase in lowbirthweight over the past several years is that thenumber of twin, triplet, and higher-order multiplebirths has increased.10,70,71 Twins and othermultiples are much more likely than singletoninfants to be of low birthweight; 55 percent of twinsand 94 percent of triplets, compared with 6 percentof singletons, were of low birthweight in 2001.However, even among singletons, there has been anincrease in low birthweight.'°
Bullets contain references to data that can be found in TableHEAL7'H5 on page 102. Endnotes begin on page 63.
30 America's Children: Key National Indicators of Well-Being, 2003
17k

Infant Mortality
n nfant mortality is defined as the death of an infant before his or her first birthday. The infant mortality rateEi is an important measure of the well-being of infants, children, and pregnant women because it is associatedwith a variety of factors, such as maternal health, quality of and access to medical care, socioeconomicconditions, and public health practices.72 In the United States, about two-thirds of infant deaths occur in thefirst month after birth and are due mostly to health problems of the infant or the pregnancy, such as pretermdelivery or birth defects. About one-third of infant deaths occur after the first month and may be influenced bysocial or environmental factors, such as exposure to cigarette smoke or inadequate access to health care.73
Indicator HEALTH6
Infant deaths per 1,000 live births
20
15
10
Infant mortality rates by race and Hispanic origin, selected years 1983-2000
Black, non-Hispanic
TotalAmerican Indian/Alaska Native
Hispanic
White, non-Hispanic
01983 1985
...Asian/Pacific Islander
1990 1995 2000
NOTE: Data are available for 1983-91 and 1995-2000.74 Infant deaths are deaths before a child's first birthday.
SOURCE: Centers for Disease Control and Prevention, National Center for Health Statistics, National Linked File of Live Births andInfant Deaths.
The 2000 infant mortality rate for the United Stateswas 6.9 deaths per 1,000 live births, a slight dropfrom the 1999 rate of 7.0.From 1999 to 2000, infant mortality decreased forWhite, non-Hispanic, Black, non-Hispanic,Hispanic, and American Indian/Alaska Nativeinfants; however, the rate increased forAsian/Pacific Islander infants.Infant mortality has dropped for all racial andethnic groups since 1983, but substantial racialand ethnic disparities remain. Black, non-Hispanic and American Indian/Alaska Nativeinfants have consistently had a higher infantmortality rate than that of other racial or ethnicgroups. For example, in 2000, the Black, non-Hispanic infant mortality rate was 13.6 infantdeaths per 1,000 live births and the AmericanIndian/Alaska Native rate was 8.3, bothsignificantly higher than the rates among White,non-Hispanics (5.7), Hispanics (5.6), orAsians/Pacific Islanders (4.9).
Infant mortality rates also vary within racial andethnic populations. For example, among Hispanicsin the United States, the infant mortality rate for2000 ranged from 4.5 for infants of Cuban andCentral/South American origins to a high of 8.2 forPuerto Ricans. Among Asians/Pacific Islanders,infant mortality rates ranged from 3.5 for infants ofChinese origin to 9.1 for Native Hawaiians.
Bullets contain references to data that can be found in TableHEALTH6 on page 103. Endnotes begin on page 63.
Part 11: Indicators of Children's Well-Being 111
48

Child Mortality
hild death rates are the most severe measure of ill health in children. These rates have generallydeclined over the past two decades. Deaths to children ages 1 to 4 are calculated separately from those
for children ages 5 to 14 because causes and death rates vary substantially by age.
Indicator HEALTH7.A
Deaths per 100,000 children ages 1-4
100
80
Death rates among children ages 1 to 4 by race and Hispanic origin, 1980-2000
60
40 41111141111%.,
20
01980
Hispanic
Black
1985 1990
White, non - Hispanic
1995
11111111.6
Asian/Pacific Islander
2000
NOTE: Death rates for American Indians/Alaska Natives are included in the total but are not shown separately because the numbers ofdeaths were too small to calculate reliable rates.
SOURCE: Centers for Disease Control and Prevention, National Center for Health Statistics, National Vital Statistics System.
Death rates among
children ages 1 to 4 by cause of death, 2000
Deaths per 100,000 children ages 1,1
14
12
10
8
6
4
2
0
Unintentional injuries 111111 Homicide
Ell Birth defects HIM Heart disease
Cancer 1111111 Pneumonia/Influenza
elAmerica's Children: Key National Indicators of Well-Being, 2003
In 2000, the death rate for children ages 1 to 4 was 32per 100,000 children.Between 1980 and 2000, the death rate declined byalmost half for children ages 1 to 4.Among children ages 1 to 4, Black children had thehighest death rate in 2000, at 50 per 100,000 children.Asian/Pacific Islander children had the lowest deathrate, at 22 per 100,000.Among children ages 1 to 4, unintentional injurieswere the leading cause of death at 12 per 100,000,followed by birth defects and cancer at 3 per100,000 children each.Motor vehicle traffic crashes are the most commontype of injury among children. Use of childrestraint systems, including safety seats, boosterseats, and seat belts, can greatly reduce the numberand severity of injuries to child occupants of motorvehicles. In 2000, 44 percent of child occupantsages 1 to 4 who died in crashes were unrestrained.75
fi

D eath rates for children ages 5 to 14 are lower than those for children under age 5. The leading cause ofdeath for children at this age remains unintentional injuries, but some other causes of death, such as
birth defects, are less common among children ages 5 to 14 than among children ages 1 to 4.
Death rates among children ages 5 to 14 by race and Hispanic origin, 1980-2000
Deaths per 100,000 children ages 5-14
100
80
60
40
20
0
Hispanic'White, non-Hispanic
Black
Total
_4114amerommiftivieumm
Asian/Pacific Islander
1980 1985 1990 1995 2000
NOTE: Death rates for American Indians/Alaska Natives are included in the total but not shown separately because the numbers ofdeaths were too small to calculate reliable rates.
SOURCE: Centers for Disease Control and Prevention, National Center for Health Statistics, National Vital Statistics System.
Indicator HEALTH7.D Death rates among
children ages 5 to 14 by cause of death, 2000
Deaths per 100,000 children ages 5-14
14
12
10
8
6
4
2
0 I Bullets contain references to data that can be found in Tables
The death rate in 2000 for children ages 5 to 14 was 18per 100,000 children.Between 1980 and 2000, the death rate declined byapproximately 40 percent, from 31 to 18 deaths per100,000 children ages 5 to 14.Similar to mortality patterns for children under theage of 5, among children ages 5 to 14, Black childrenhad the highest death rates in 2000 at 24 deaths per100,000, and Asians/Pacific Islanders had the lowestdeath rate at 12 per 100,000.Among children ages 5 to 14, unintentional injurieswere the leading cause of death, followed by cancer,birth defects, and homicides.The majority of unintentional injury deaths amongchildren ages 5 to 14 result from motor vehicle trafficcrashes. More than 64 percent of children ages 5 to 14who died as occupants in motor vehicle crashes in2000 were not wearing a seatbelt or other restraint.75
UM Unintentional injuries Homicide 14EALTH7.A and HEAUEH7.B on pages 104-105. EndnotesNM Cancer NM Heart disease begin on page 63.
Birth defects 37ii.,1 Pneumonia/Influenza
411
Part II: Indicators of Children's Well-Being

Adolescent Mortality
ompared with younger children, adolescents ages 15 to 19 have much higher mortality rates.Adolescents are much more likely to die from injuries sustained from motor vehicle traffic accidents or
firearms.76 This difference illustrates the importance of looking separately at mortality rates and causes ofdeath among teenagers ages 15 to 19.
Indicator HEALTH8.A Death rates among adolescents ages 15 to 19 by cause of death, 1980-2000
Deaths per 100,000 adolescents ages 15-19
100
80
All causes
01980 1985
All motor vehicle traffic injuries
All firearm injuries
1990 1995 2000
SOURCE: Centers for Disease Control and Prevention, National Center for Health Statistics, National Vital Statistics System.
In 2000, the death rate for adolescents ages 15 to 19was 67 deaths per 100,000. Overall, the rate hasdeclined substantially since 1980, despite a periodof increase between 1986 and 1991. Injury, whichincludes homicide, suicide, and unintentionalinjuries, continues to account for more than 3 of 4deaths among adolescents.20Injuries from motor vehicles and firearms are theprimary causes of death among adolescents. In2000, motor vehicle traffic-related injuriesaccounted for 25 of the 67 deaths per 100,000youth ages 15 to 19 (37 percent), while firearminjuries accounted for 13 of the 67 deaths per100,000 youth ages 15 to 19 (19 percent).Motor vehicle injuries were the leading cause ofdeath among adolescents for each year between 1980and 2000, but the motor vehicle death rate declinedby more than one-third during the time period.In 1980, motor vehicle traffic-related deaths amongadolescents ages 15 to 19 occurred almost threetimes as often as firearm injuries (intentional andunintentional). By 2000, the rate of motor vehicletraffic-related deaths was less than double that offirearm injuries.
Motor vehicle traffic-related and firearm deathrates have followed different trends since 1980.From 1980 to 1985, both rates declined; in thefollowing years, however, the motor vehicle trafficdeath rate continued to decline modestly while thefirearm death rate increased markedly. During theyears 1992 to 1994, the two rates differed onlyslightly. However, since 1994, the firearm death ratehas decreased by more than half while the motorvehicle death rate has decreased only slightly.Most of the increase in firearm injury deathsbetween 1983 and 1993 resulted from an increasein homicides. The firearm homicide rate amongyouth ages 15 to 19 more than tripled from 5 to 18per 100,000 between 1983 and 1993. At the sametime, the firearm suicide rate rose from 5 to 7 per100,000. From 1994 to 2000, the firearm homiciderate declined by over one-half and the firearmsuicide rate declined by nearly one-third.After injuries, additional leading causes of deathfor adolescents include cancer, heart disease, andbirth defects."
America's Children: Key National Indicators of Well-Being, 2003
51

Indicator HEALTH8.B Injury death rates among adolescents ages 15 to 19 by gender, race, Hispanicorigin, and type of injury, 2000
Deaths per 100,000 adolescents ages 15-19
100
80
60
40
20
0White,
non-Hispanic
Male
Black Hispanic American Indian/ Asian/Pacific White,Alaska Native Islander non-Hispanic
IIIAll motor vehicle traffic injuries All firearm injuries
Female
MIFF tw,iBlack Hispanic American Indian/ Asian/Pacific
Alaska Native Islander
NOTE: There were too few firearm deaths to calculate a reliable rate for American Indian/Alaska Native females andAsian/Pacific Islander females.
SOURCE: Centers for Disease Control and Prevention, National Center for Health Statistics, National Vital Statistics System.
Motor vehicle and firearm injury deaths are bothmore common among male than among femaleadolescents. In 2000, the motor vehicle trafficdeath rate for males was nearly twice the rate forfemales, and the firearm death rate among maleswas eight times that for females.Among adolescents in 2000, motor vehicle injurieswere the most common cause of death among allfemales, as well as among White, non-Hispanic,Hispanic, American Indian/Alaska Native, andAsian/Pacific Islander males. Firearm injuries werethe most common cause of death among Blackmales. Black males were more than twice as likelyto die from a firearm injury as from a motor vehicletraffic injury.Deaths from firearm suicides were more commonthan deaths from firearm homicides among White,non-Hispanic adolescents, while the reverse isfound for Black and Hispanic adolescent males.
Deaths from firearm injuries among adolescentsdeclined between 1994 and 2000, particularlyamong Black and Hispanic males. From 1994 to2000, the firearm homicide rates for Black andHispanic adolescent males declined substantially,from 126 to 52 per 100,000 for Black males, andfrom 49 to 22 per 100,000 for Hispanic males.
Bullets contain references to data that can be found in TableHEALTH8 on pages 106-107. Endnotes begin on page 63.
52Part II: Indicators of Children's Well-Being III

Adolescent Births
B earing a child during adolescence is often associated with long-term difficulties for the mother and herchild. These consequences are often attributable to poverty and the other adverse socioeconomic
circumstances that frequently accompany early childbearing.77 Compared with babies born to older mothers,babies born to adolescent mothers, particularly young adolescent mothers, are at higher risk of lowbirthweight and infant mortality. 10,13,69 They are more likely to grow up in homes that offer lower levels ofemotional support and cognitive stimulation, and they are less likely to earn high school diplomas. For themothers, giving birth during adolescence is associated with limited educational attainment, which in turn canreduce future employment prospects and earnings potentia1.78 The birth rate of adolescents under age 18 isa measure of particular interest because the mothers are still of school age.
Indicator HEALTH9 Birth rates for females ages 15 to 17 by race and Hispanic origin, 1980-2001
live births per 1,000 females ages 15-17
100
80
60
40
20
Black Black, non-Hispanic
01980 1985
White
1990
American Indian/Alaska Native
Total
White, non-Hispanic
Asian/Pacific Islander
1995 2001
NOTE: Rates for 1980-89 are calculated for all Whites and all Blacks. Rates for 1980-89 are not shown for Hispanics; White, non-Hispanics;or Black, non-Hispanics because information on the Hispanic origin of the mother was not reported on the birth certificates of most states.
SOURCE: Centers for Disease Control and Prevention, National Center for Health Statistics, National Vital Statistics System.
In 2001, the adolescent birth rate was 25 per 1,000young women ages 15 to 17. There were 145,324births to these young women in 2001. The 2001 ratewas a record low for the Nafion. 10,14,15
The birth rate among adolescents ages 15 to 17declined more than one-third, from 39 to 25 birthsper 1,000, between 1991 and 2001. This declinefollows a one-fourth increase between 1986 and1991. The 2001 rate was a record low for youngadolescents.14,15'79There are substantial racial and ethnic disparities inbirth rates among adolescents ages 15 to 17. In 2001,the birth rate for this age group was 10 per 1,000 forAsians/Pacific Islanders, 14 for White, non-Hispanics,31 for American Indians/Alaska Natives, 45 for Black,non-Hispanics, and 53 for Hispanics.14The birth rate for Black, non-Hispanic femalesages 15 to 17 dropped by nearly half between 1991and 2001, completely reversing the increasebetween 1986 and 1991. The birth rate for White,non-Hispanic teens declined by two-fifths during1991-2001.15
The birth rate for Hispanics in this age groupdeclined more modestly in the 1990s; the rate fellby about one-fourth between 1991 and 2001.15In 2001, 88 percent of births to females ages 15 to17 were to unmarried mothers, compared with 62percent in 1980 (See POP7.B).The birth rates for first and second births for ages15 to 17 declined by one-third and one-half,respectively, between 1990 and 2001.The pregnancy rate (the sum of births, abortions,and fetal losses per 1,000 females) declined bynearly one-third for adolescents ages 15 to 17during 1990 to 1999, reaching a record low of 56per 1,000 in 1999. Rates for births, abortions, andfetal losses declined for young adolescents in the1990s.15,80,81
Bullets contain references to data that can be found in TableHEALTH9 on page 108 and Table POP7.B on page 82.Endnotes begin on page 63.
elAmerica's Children: Key Notional Indicators of Well-Being, 2003
53

Indicators Needed
HealthNational indicators in several key dimensions of health are not yet available because of difficulty in definitions andmeasurement, particularly using survey research. The following health-related areas have been identified aspriorities for indicator development by the Federal Interagency Forum on Child and Family Statistics:
Disability. The Forum is very interested indeveloping an improved measure of functioningthat can be derived from regularly collected data.Such a measure is often referred to as a disabilitymeasure. The difficulties inherent in developingsuch a measure relate to the fact that disability is acomplicated, multidimensional concept. Manydefinitions of disability are currently in use bypolicy-makers and researchers, but there is littleagreement regarding which aspects of functioningshould be included or how they should bemeasured. Disability is best thought of as anumbrella term that includes pathology,impairment, functional limitations, task limitations,and activity limitations as well as characteristics ofthe environment that can be either a barrier or asupport to the activity of the individual. Themeasurement of functioning and disability inchildren is critically important, and the Forum isworking on determining which aspects of disabilityshould be reported in this volume, and ondeveloping indicators that address these coreaspects of health-related well-being.Mental health. An international panel of experts inthe area of children's mental health has beenworking with staff at the National Institute ofMental Health, the Center for Mental HealthServices in the Substance Abuse and Mental HealthServices Administration, and Forum agencies todetermine data needs and develop better measuresto obtain data on children's mental health. As aresult of this collaborative effort, new questionswere recently added to the National Center forHealth Statistics' annual National Health InterviewSurvey. Some data have been collected, and plansare being made to evaluate the data and conduct avalidity study.
Child abuse and neglect. Also needed are regular,reliable estimates of the incidence of child abuseand neglect that are based on sample surveys ratherthan administrative records. One estimate of childabuse and neglect was presented as a special featurein America's Children, 1997. Since administrative dataare based on cases reported to authorities, it islikely that these data underestimate the magnitudeof the problem. Estimates based on sample surveydata could potentially provide more accurateinformation; however, a number of issues stillpersist, including how to effectively elicit thissensitive information, how to identify theappropriate respondent for the questions, andwhether there is a legal obligation for the surveyorto report abuse or neglect.
54Part II: Indicators of Children's Well-Being III
Indicators ofChildren's Well-Being
Behavior and Social
Environment IndicatorsThe indicators in this section present data on
selected measures of young people's personalbehavior and aspects of their social environmentthat may affect them. The indicators focus on illegal
or high-risk behaviors, including smoking cigarettes,drinking alcohol, using illicit drugs, and involvementin serious violent crimes, either as offender orvictim. In addition to these indicators, readersshould consider positive behaviors of children,aspects of neighborhood environment, and otheraspects of risk and problem behaviors in evaluating
this dimension. Sources for some of these indicatorsare being sought.

Regular Cigarette Smoking
moking has serious long-term consequences, including the risk of smoking-related diseases and the riskof premature death, as well as causing increased health care costs associated with treating the illnesses.82
Many adults who are addicted to tobacco today began smoking as adolescents, and it is estimated that morethan 5 million of today's underage smokers will die of tobacco-related illnesses.83 These consequencesunderscore the importance of studying patterns of smoking among adolescents.
Indicator BEH1
Percent
60
50
40
30
20
10
01980
Percentage of students who reported smoking cigarettes daily in the previous 30days by school grade, 1980-2002
1985
12th-graders
10th-graders
8th-graders
1990 1995
SOURCE: National Institutes of Health, National Institute on Drug Abuse, Monitoring the Future Survey.
Between 2001 and 2002, the rate of daily smokingin the past month decreased from 12 percent to 10percent among 10th-graders and from 19 percentto 17 percent among 12th-graders. These declines,and similar decreases for 8th-graders in otherindicators of cigarette smoking, continue decreasesseen since 1997 for 12th-graders and 1996 for 8th-and 10th-graders. Five percent of 8th-gradersreported daily smoking in the past month in 2002,unchanged from 2001. For each grade, the rates ofdaily smoking in 2002 are the lowest in the historyof the survey (since 1975 for 12th-graders and since1991 for 8th- and 10th-graders).Long-term trends for high school seniors show thatdaily smoking declined from 21 percent in 1980 tojust over 17 percent in 1992, increased to 25percent in 1997, and declined to just under 17percent in 2002.
2000 2002
Males and females are generally similar in theirrates of daily smoking. Among males, 5 percent of8th-graders, 9 percent of 10th-graders, and 17percent of 12th-graders reported daily smoking inthe past 30 days in 2002; among females, thecorresponding rates were 5 percent for 8th-graders,11 percent for 10th-graders, and 16 percent for12th-graders.Rates of smoking differ substantially between racialand ethnic groups. White students have the highestrate of smoking, followed by Hispanics and thenBlacks. Among high school seniors in 2002, 22percent of Whites reported daily smoking, comparedwith 9 percent of Hispanics and 6 percent of Blacks.
Bullets contain references to data that can be found in TableBEH1 on page 109. Endnotes begin on page 63.
Part II: Indicators of Children's Well-Being III
56

Alcohol Use
A lcohol is the most commonly used psychoactive substance during adolescence. Its use is associated withmotor vehicle accidents, injuries, and deaths; with problems in school and in the workplace; and with
fighting, crime, and other serious consequences.84 Early onset of heavy drinking may be especiallyproblematic, potentially increasing the likelihood of negative outcomes.
Indicator BEH2
Percent
60
50
40
30
20
10
Percentage of students who reported having five or more alcoholicbeverages in a row in the last 2 weeks by grade, 1980-2002
10th-graders
8th-graders
01980 1985 1990 1995
SOURCE: National Institutes of Health, National Institute on Drug Abuse, Monitoring the Future Survey.
From 2001 to 2002, the proportion of 10th-gradersreporting episodic heavy drinking (i.e., having atleast five drinks in a row at least once in theprevious 2 weeks) declined from 25 percent to 22percent. Rates remained stable from 2001 to 2002among 8th- and 12th-graders, with 12 and 29percent, respectively, reporting this type of alcoholconsumption in the past 2 weeks in 2002.Long-term trends for high school seniors indicate apeak in 1981, when 41 percent reported heavydrinking. Over the next 12 years, the percentage ofhigh school seniors reporting heavy drinkingdeclined gradually to a low of 28 percent in 1993.Since 1993, the prevalence of this behavior has heldfairly steady.Among 12th-graders, males are more likely to drinkheavily than are females. In 2002, 34 percent of12th-grade males reported heavy drinking,compared with 23 percent of 12th-grade females. Asadolescents get older, the differences betweenmales and females in this drinking behavior appearto become more pronounced. Among 10th-graders,the gender difference in heavy drinking has been
111 America's Children: Key National Indicators of WellBeing, 2003
2000 2002
found in earlier years (e.g., 29 percent for malesversus 21 percent for females in 2001), but a sharpdecline in drinking among males brought the ratescloser in 2002 (24 percent for males versus 21percent for females).Heavy drinking is much more likely among Whiteand Hispanic secondary school students thanamong their Black counterparts. For example,among 12th-graders, 12 percent of Blacks reportedheavy drinking in 2002, compared with 34 percentof Whites and 26 percent of Hispanics. Similarly,among 10th-graders, 12 percent of Blacks reportedheavy drinking, compared with 26 percent ofWhites and 27 percent of Hispanics.
Bullets contain references to data that can be found in TableBEH2 on page 110. Endnotes begin on page 63.
57

Illicit Drug Use
D rug use by adolescents can have immediate as well as long-term health and social consequences. Cocaineuse is linked with health problems that range from eating disorders to disability to death from heart
attacks and strokes.85 Marijuana use poses both health and cognitive risks, particularly for damage topulmonary functions as a result of chronic use.86'87 Hallucinogens can affect brain chemistry and result inproblems with learning new information and memory.88 As is the case with alcohol use and smoking, druguse is a risk-taking behavior that has potentially serious negative consequences.
Indicator BEH3
Percent
60
50
40
30
20
10
0
Percentage of students who reported using illicit drugs in the previous 30 daysby grade, 1980-2002
1980 1985
12th-graders
10th-graders
8th - graders
1990 1995 2000 2002
NOTE: Illicit drugs include marijuana, cocaine (including crack), heroin, hallucinogens (including LSD, PCP, and ecstasy [MDMA]),amphetamines (including methamphetamine), and nonmedical use of psychotherapeutics.
SOURCE: National Institutes of Health, National Institute on Drug Abuse, Monitoring the Future Survey.
Between 2001 and 2002, illicit drug use in the past30 days declined from 23 percent to 21 percentamong 10th-graders. One-quarter of 12th-gradersand one-tenth of 8th-graders reported past 30-dayillicit drug use in 2002, unchanged from theprevious year.Twelve-year trends for 8th- and 10th-graders showthat past-30-day illicit drug use increased from theearly to mid-1990s, peaking in 1996 at 15 percentand 23 percent in the respective grades. For 8th-graders, illicit drug use then declined graduallyfrom 1996 to 2001 and decreased further in 2002;for 10th-graders, it remained stable until thedecrease between 2001 and 2002.Longer-term trends for high school seniors show
that past-30-day illicit drug use declined from 37percent in 1980 to 14 percent in 1992. The ratethen rose sharply, reaching 26 percent in 1997, andhas remained around that level through 2002.
Among 12th-graders, more males than femalesreport illicit drug use (29 percent compared with22 percent, respectively, in 2002). For youngerstudents, gender differences are less dramatic butare in the same direction. Between 2001 and 2002,past-30-day illicit drug use by males declined from13 to 11 percent among 8th-graders and from 25 to22 percent among 10th-graders; illicit drug use byfemales in these grades remained stable over thisperiod.White and Hispanic students generally have higherillicit drug use rates than do Black students.Among 10th-graders, for example, 23 percent ofWhites and 21 percent of Hispanics reported past-30-day illicit drug use, compared with 16 percentof Blacks in 2002.
Bullets contain references to data that can be found in TableBEH3 on page 111. Endnotes begin on page 63.
Part II: Indicators of Children's Well-Being 1111

Youth Victims and Perpetrators of Serious Violent Crimes
Egiiolence affects the quality of life of young people who experience, witness, or feel threatened by it. Inaddition to the direct physical harm suffered by young victims of serious violence, such violence can
adversely affect victims' mental health and development and increase the likelihood that they themselves willcommit acts of serious violence.89,99 Youth ages 12 to 17 are twice as likely as adults to be victims of seriousviolent crimes,91 which include aggravated assault, rape, robbery (stealing by force or threat of violence), andhomicide.
Indicator BEH4.A Rate of serious violent crime victimization of youth ages 12 to 17by gender, 1980-2000
Youth victims per 1,000 juveniles ages 12-17
80
60
Male
40Total
20
01980 1985 1990 1995 2000
NOTE: Serious violent crimes include aggravated assault, rape, robbery (stealing by force or threat of violence), and homicide. Becauseof changes made in the victimization survey, data prior to 1992 are adjusted to make them comparable with data collected under theredesigned methodology. Numbers for 2000 are preliminary and do not contain final homicide estimates.
SOURCE: U.S. Department of Justice, Bureau of Justice Statistics, National Crime Victimization Survey. Federal Bureau of Investigation,Uniform Crime Reporting Program, Supplementary Homicide Reports.
In 2000, the rate at which youth were victims ofserious violent crimes was 16 crimes per 1,000juveniles ages 12 to 17, totaling about 390,000such crimes.The serious violent crime victimization ratefluctuated between 34 and 43 per 1,000 from 1980to 1990 and peaked at 44 per 1,000 in 1993. Since1993, the rate of serious violent crime against youthhas decreased by 63 percent, down to 16 per 1,000in 2000.
Males are more than twice as likely as females to bevictims of serious violent crimes. In 2000, theserious violent crime victimization rate was 23 per1,000 male youth, compared with 10 per 1,000female youth.In 2000, the serious violent crime victimization ratefor youth dropped more for younger teens (ages 12to 14) than for older teens (ages 15 to 17). In 2000,the rate for older teens dropped to 19 per 1,000and for younger teens dropped to 14 per 1,000.
America's Children: Key National Indicators of Well-Being, 2003
59

he level of youth violence in society can be viewed as an indicator of youths' ability to control theirbehavior, as well as the adequacy of socializing agents such as families, peers, schools, and religious
institutions to supervise or channel youth behavior to acceptable norms. One measure of the serious violentcrime committed by juveniles is the incidence rate of serious violent juvenile crime.
Indicator BEH4.B
Crimes per 1,000 youth ages 12-17
80
60
AO
20
01980
Serious violent crime offending rate by youth ages 12 to 17, 1980-2000
1985 1990 1995 2000
NOTE: This rote is the ratio of the number of crimes (aggravated assault, rape, and robbery; i.e., stealing by force or threat of violence)reported to the National Crime Victimization Survey for which the age of the offenders was known, plus the number of homicides reportedto police that involved at least one juvenile offender perceived by the victim (or by law enforcement in the case of homicide) to be 12through 17 years of age, to the number of juveniles in the population. Because of changes made in the victimization survey, data prior to1992 are adjusted to make them comparable with data collected under the redesigned methodology. Numbers for 2000 are preliminary
and do not contain final homicide estimates.
SOURCE: U.S. Deportment of Justice, Bureau of Justice Statistics, National Crime Victimization Survey. Federal Bureau of Investigation,
Uniform Crime Reporting Program, Supplementary Homicide Reports.
According to reports by victims, in 2000 the seriousviolent crime offending rate was 17 crimes per1,000 juveniles ages 12 to 17, totaling 413,000 suchcrimes involving juveniles. This is a 67 percentdrop from the 1993 high and the lowest raterecorded since the national victimization surveybegan in 1973.Reports by victims indicate that between 1980 and1989, the serious violent juvenile crime offendingrate fluctuated between 29 and 40 per 1,000, andthen began to increase from 34 per 1,000 in 1989 toa high of 52 per 1,000 in 1993. Since then, the ratehas steadily dropped, to 17 per 1,000 in 2000.Based on victims' reports, since 1980 thepercentage of all serious violent crime involvingjuveniles has ranged from 19 percent in 1982 to 26percent in 1993, the peak year for youth violence.In 2000, 19 percent of all such victimizationsreportedly involved a juvenile offender.
In more than half (59 percent) of all serious violentjuvenile crimes reported by victims in 2000, morethan one offender was involved in the incident.Because insufficient detail exists to determine theage of each individual offender when a crime iscommitted by more than one offender, the numberof additional juvenile offenders cannot bedetermined. Therefore, this rate of serious violentcrime offending does not represent the number ofjuvenile offenders in the population, but rather thenumber of crimes committed involving juvenilesages 12 to 17 in relation to the juvenile population.
Bullets contain references to data that can be found in TablesBEH4.A and BEH4.B on pages 112-113. Endnotes beginon page 63.
p 60Part II: Indicators of Children's Well-Being

Indicators Needed
Behavior and Social Environment
A broader set of indicators than those presented in this section is needed to adequately monitor the socialenvironment and behaviors of youth. Other behavior and social environment measures are needed on:
Indicators of positive behaviors. The participation ofyouth in positive activities and the formation ofclose attachments to family, school, and communityhave been linked to positive outcomes in researchstudies. Additional research needs to be conductedto strengthen our understanding of positiveactivities and the aspects of those activities thatprotect youth from risk. Then, regular sources ofdata that can be used to monitor trends in theseimportant areas over time need to be developed.To that end, the Forum co-sponsored theIndicators of Positive Development conference toconceptualize, define, and measure positive youthdevelopment. The child care background measureshows participation rates in extracurricular activitiessuch as organized sports, clubs, arts, religiousactivities, and other school or community activities.In addition, the youth participation in volunteeractivities measure was presented as a special featurein the America's Children, 2000 report. Forumagencies are also examining the measurement andinfluence of young people's feelings of closenesswith their parents.
IIIIAmerica's Children: Key National Indicators of Well-Being, 2003
Neighborhood environment. Research shows thatgrowing up in distressed neighborhoods has aneffect over and above that of individual or familybackground characteristics on child well-being. Asurvey is being implemented that would, for thefirst time, enable the monitoring of America'scommunities and neighborhoods over time andidentify distressed neighborhoods in whichchildren are living.Youth violence. According to victim reports, 19percent of violent crimes in 2000 involved a youthoffender between the ages of 12 and 17. Sincecrime data are reported by victims, not perpetrators,the indicator on serious violent crime offending byyouth does not provide critical information on thenumber and characteristics of youthful offendersinvolved in serious crime. Additional work isneeded to produce a more comprehensive anduseful measure of the prevalence of violenceamong young people.
Al,

Indicators ofChildren's Well-Being
Education IndicatorsThe education of children shapes their own
personal development and life chances, as well as
the economic and social progress of our Nation.This section presents key indicators of how well
children are learning and progressing from earlychildhood through postsecondary school. Two
indicators related to early childhood developmentare presented: family reading to young childrenand participation in early childhood care andeducation. Both measures are placeholders for a
direct recurring assessment of what preschoolers
know and can do, which is not yet available. Scoreson national assessments of mathematics and
reading for elementary, middle, and high schoolstudents are presented, followed by an indicator onadvanced coursetaking. Completion rates for highschool and college indicate the extent to which
students have attained a basic education and are
prepared for higher levels of education or theworkforce. By contrast, the indicator on youthneither enrolled in school nor working tracks theextent to which youth are at risk of limiting theirfuture prospects at a critical stage of their lives.
62

Family Reading to Young Children
R eading to young children promotes language acquisition and correlates with literacy development and,later on, with achievement in reading comprehension and overall success in schoo1.92 The percentage of
young children read aloud to daily by a family member is one indicator of how well young children are beingprepared for school. Mother's education is consistently related to whether children are read to by a familymember.
Indicator ED1
Percent
100
80
Percentage of children ages 3 to 5 who were read to every day in the last weekby a family member by mother's education, selected years 1993-2001
College graduate
Vocational/technical or some college60
Total
40 High school/GED
Less than high school
20
0
1993 1995 1996 1999 2001
NOTE: Data are available for 1993, 1995, 1996, 1999, and 2001. Estimates are based on children ages 3 to 5 who have yet toenter kindergarten.
SOURCE: U.S. Department of Education, National Center for Education Statistics, National Household Education Survey.
In 2001, 58 percent of children ages 3 to 5 wereread to daily by a family member, a higher rate thanin 1993. The percentage has fluctuated between 53and 58 percent since 1993.In 2001, 73 percent of children whose motherswere college graduates were read to every day. Incomparison, daily reading occurred for 60 percentof children whose mothers had some postsecondaryeducation, 49 percent of children whose mothershad completed high school but had no furthereducation, and 42 percent of children whosemothers had not finished high school.White, non-Hispanic children were more likely tobe read to every day than either Black, non-Hispanic or Hispanic children. Sixty-four percentof White, non-Hispanic children, 48 percent ofBlack, non-Hispanic children, and 42 percent ofHispanic children were read to every day.
111 America's Children: Key National Indicators of Well-Being, 20t13,
Children in families with incomes below the povertyline were less likely to be read to every day thanwere children in families with incomes at or abovethe poverty line. Forty-eight percent of children infamilies in poverty were read to every day in 2001,compared with 61 percent of children in families ator above the poverty line.Children living with two parents were more likely tobe read to every day than were children who livewith one or no parent. Sixty-one percent ofchildren in two-parent households were read toevery day in 2001, compared with 48 percent ofchildren living with one or no parent.
Bullets contain references to data that can be found in TableED1 on page 114. Endnotes begin on page 63.

Early Childhood Care and Education
Ike family reading, participation in an early childhood education program can provide preschoolers withskills and enrichment that can increase their chances of success in school. Studies have demonstrated
that participation in high-quality early childhood education programs has short-term positive effects on IQand achievement and long-term positive effects on low-income minority children's school completion.93Until an ongoing direct measure of preschoolers' cognitive, behavioral, and social skills is available for thismonitoring report, this indirect indicator monitors the percentage of children who are exposed to a varietyof early childhood education programs.
Indicator ED2
Percent
100
80
60
40
20
Percentage of children ages 3 to 5 who are enrolled in center-based early childhoodcare and education programs by poverty status, selected years 1991-2001
At or above poverty
Below pover
01991 1993 1995 1996 1999 2001
NOTE: Data are available for 1991, 1993, 1995, 1996, 1999, and 2001. Estimates are based on children who have yet to enterkindergarten. Poverty estimates for 1991 and 1993 are not comparable to those for later years.
SOURCE: U.S. Department of Education, National Center for Education Statistics, National Household Education Survey.
In 2001, 56 percent of children ages 3 to 5 who hadnot yet entered kindergarten attended center-basedearly childhood care and education programs.These programs include day care centers, nurseryschools, preschool programs, Head Start programs,and prekindergarten programs.Between 1991 and 2001, the percentage of childrenof this age attending early childhood programsvaried between 53 and 60 percent.Children living in poverty were less likely to attendthese programs than were those living in families ator above poverty in 2001 (47 percent comparedwith 59 percent).Children with more highly educated mothers aremore likely to attend an early childhood programthan other children. Seventy percent of childrenwhose mothers had completed college attendedsuch programs in 2001, compared with 38 percentwhose mothers had less than a high school education.
White, non-Hispanic and Black, non-Hispanic childrenare more likely than Hispanic children to attend anearly childhood program. In 2001, 59 percent ofWhite, non-Hispanic and 64 percent of Black, non-Hispanic children ages 3 to 5 attended such programs,compared with 40 percent of Hispanic children.Children with employed mothers are more likelyto participate in early childhood care and educationprograms than children of mothers not in thelabor force.
Bullets contain references to data that can be found in TableED2 on page 115. Endnotes begin on page 63.
Part II: Indicators of Children's Well-Being el

Mathematics and Reading Achievement
he extent and content of students' knowledge, as well as their ability to think, learn, and communicate,affect their ability to succeed in the labor market as adults. On average, students with higher test scores
will earn more and will be unemployed less often than students with lower test scores.94 Mathematics andreading achievement test scores are important measures of students' skills in these subject areas, as well asgood indicators of achievement overall in school. To assess progress in mathematics and reading, theNational Assessment of Educational Progress measures national trends in the academic performance ofstudents at ages 9, 13, and 17.
Indicator ED3.A Average mathematics scale scores for students age 13 by race and Hispanicorigin, selected years 1982-99
Average score (on a scale from 0-500)
320
300
280
260
240
220
200
01982
Hispanic
White
Total
Black
1986 1990 1992 1994 1996 1999
NOTE: Data are available for 1982, 1986, 1990, 1992, 1994, 1996, and 1999. The mathematics proficiency scale ranges from 0 to500, with the following skill levels associated with the corresponding scale score:
Level 150: Simple arithmetic facts
Level 200: Beginning skills and understandings
Level 250: Numerical operations and beginning problem solving
Level 300: Moderately complex procedures and reasoning
Level 350: Multi-step problem solving and algebra
SOURCE: U.S. Department of Education, National Center for Education Statistics, National Assessment of Educational Progress.
Average mathematics scores increased for all agegroups between 1982 and 1999.Scores in 1999 did not improve significantly overthe last assessment in 1996 in reading ormathematics in any of the three age groupstestedages 9, 13, and 17.
White, non-Hispanic students have had consistentlyhigher reading and mathematics scores than eitherBlack, non-Hispanic or Hispanic students at ages 9,13, and 17. The gaps between non-Hispanic Whitesand Blacks and between non-Hispanic Whites andHispanics decreased in each subject in some agegroups during the 1980s and 1990s, but widened forothers. Larger reductions in these gaps occurredduring the 1970s because of gains in the scores ofBlack, non-Hispanic and Hispanic students.
50 America's Children: Key National Indicators of Well-Being, 2003 65

Average
320
300
280
260
240
220
200
0
I : Averageselected
score (on a scale from 0-500)
reading scale scores
years 1980-99for students age 13 by race and Hispanic origin,
= FirHis anic
Total
---serainsessooMrurew.tifilisag'Black
1980 1984 1988 1990 1992 1994 1996 1999
NOTE: Data are available for 1980, 1984, 1988, 1990, 1992, 1994, 1996, and 1999. The reading proficiency scale ranges from0 to 500, with the following skill levels associated with the corresponding scale score:
Level 150: Simple, discrete reading tasks
Level 200: Partial skills and understanding
Level 250: Interrelates ideas and makes generalizations
Level 300: Understands complicated information
Level 350: Learns from specialized reading materials
SOURCE: U.S. Department of Education, National Center for Education Statistics, National Assessment of Educational Progress.
Average reading scores have not improved amongstudents ages 9, 13, or 17 since 1980.On average, students at ages 13 and 17 whoseparents have completed more years of school havehigher reading and mathematics scores than dotheir peers whose parents have had fewer years ofeducation.95
Girls had higher reading scores than boys at allthree ages in 1999. In 1996, boys outperformedgirls in mathematics at all three ages, but that gapwas no longer significant in 1999. At ages 9 and 13,the differences between boys and girls were notsignificant for most years between 1980 and 1996.
Bullets contain references to data that can be found in TablesED3.A and ED3.B on pages 116 -117. Endnotes begin onpage 63.
Part II: Indicators of Children's Well-Being
66

High School Academic Coursetaking
10ince A Nation at Risk was published in 1983, school reforms have emphasized increasing the number ofacademic courses students take in high school. Research has shown a strong relationship between the
level of difficulty of courses students take and their performance on assessments. For both college-bound andnon-college-bound students, assessment scores increased more for students taking advanced courses than forstudents who did not take advanced courses.96 Studies have also shown that students who take advancedcoursework, such as Calculus, in high school are more likely to enroll in college and succeed beyond college.97
Indicator ED4
Percent
100
80
60
40
20
0
Percentage of high school graduates who completed high-level coursework inmathematics, science, English, and foreign language, selected years 1982-2000
1982 1987 1990 1992 1994
Science
Mathematics
Foreign langua.e
English
1998 2000
NOTE: Data are available for 1982, 1987, 1990, 1992, 1994, 1998, and 2000. High-level coursework includes the following:mathematics: courses above Algebra II; science: chemistry, physics, or advanced biology; English: more courses at the honors level thanat the low academic or regular level; and foreign language: a third-year, fourth-year, or advanced placement course. For a detailed listingof courses, see Tables ED4.A, ED4.B, ED4.C, and ED4.D.
SOURCE: U.S. Department of Education, National Center for Education Statistics, High School and Beyond Survey, National EducationLongitudinal Study of 1988, and National Assessment of Educational Progress Transcript Study.
Forty-five percent of 2000 high school graduateshad taken at least one advanced mathematicscourse (defined as a course above Algebra II), anincrease from 26 percent of 1982 high schoolgraduates. In addition, the percentage of 2000 highschool graduates taking a nonacademic or low-levelacademic course as their most advanced course was7 percent, compared with 24 percent for 1982graduates.In science, more than half (63 percent) of all 2000high school graduates had taken physics, chemistry,or advanced biology, more than the percentage of1982 graduates who had taken these courses (35percent). In addition, the percentage of studentswho had taken a physical science course lower thanbiology, chemistry, and physics as their mostadvanced course dropped from 27 percent of 1982graduates to 9 percent of 2000 graduates.
Thirty-four percent of all 2000 high schoolgraduates took honors-level English courses, anincrease from 13 percent of 1982 high schoolgraduates. There was no detectable differencebetween the percentage of 1982 and 2000graduates taking low academic level courses (10and 11 percent, respectively).More high school students are taking foreignlanguage courses. Thirty percent of 2000 highschool graduates had taken a third- or fourth-yearor advanced placement course, compared with 15percent of 1982 graduates. Seventeen percent of2000 high school graduates did not take any foreignlanguage course, compared with 46 percent of 1982high school graduates.
Bullets contain references to data that can be found in TablesED4.A-ED4.D on pages 118-121. Endnotes begin onpage 63.
America's Children: Key National Indicators of Well-Being, 2003
67

High School Completion
A high school diploma or its equivalent represents acquisition of the basic reading, writing, andmathematics skills a person needs to function in modern society. The percentage of young adults ages
18 to 24 with a high school diploma or an equivalent credential is a measure of the extent to which youngadults have completed a basic prerequisite for many entry-level jobs as well as higher education.
Indicator ED5
Percent
100
80
60
40
20
0
Percentage of adults ages 18 to 24 who have completed high schoolby race and Hispanic origin, 1980-2001
White, non-Hispanic
Total
Black, non-Hispanic
1980 1985 1990 1995 2001
NOTE: Percentages are based only on those not currently enrolled in high school or below. Prior to 1992, this indicator was measured ascompleting 4 or more years of high school rather than the actual attainment of a high school diploma or equivalent.
SOURCE: U.S. Census Bureau, October Current Population Survey. Tabulated by the U.S. Department of Education, National Center forEducation Statistics.
In 2001, 87 percent of young adults ages 18 to 24had completed high school with a diploma or analternative credential such as a General EducationDevelopment (GED) certificate. The high schoolcompletion rate has increased slightly since 1980,when it was 84 percent.The rate at which Black, non-Hispanic youthcompleted high school increased between 1980 and1990, from 75 percent to 83 percent. It hasfluctuated since then and was at 86 percent in 2001.Among White, non-Hispanics, the high schoolcompletion rate increased from 88 percent in 1980to 91 percent in 2001.
Hispanic youth have had a consistently lower highschool completion rate than White, non-Hispanicand Black, non-Hispanic youth. Since 1980, thehigh school completion rate for Hispanic youth hasfluctuated between 57 and 67 percent and was at 66percent in 2001.Most young adults complete high school by earninga regular high school diploma. Others completehigh school by earning an alternative credential,such as a GED. Between 1990 and 1999, thediploma rate declined by 4 percentage points,decreasing from 81 percent to 77 percent. Incomparison, the alternative credential rate increasedby 5 percentage points, from 4 to 9 percent.98
Bullets contain references to data that can be found in TableED5 on page 122. Endnotes begin on page 63.
Part II: Indicators of Children's Well-Being

Youth Neither Enrolled in School Nor Working
HIhe transition from adolescence to adulthood is a critical period in each individual's life. Youth ages 16 to19 who are neither in school nor working are detached from both of the core activities that usually
occupy teenagers during this period. Detachment from school or the workforce, particularly if this situationlasts for several years, puts youth at increased risk of having lower earnings and a less stable employmenthistory than their peers who stayed in school and/or secured jobs.99 The percentage of youth who are notenrolled in school and not working is one measure of the proportion of young people who are at risk oflimiting their future prospects.
Percent
25
20
15
10
5
0
Percentage of youth ages 16 to 19 who are neither enrolled in schoolnor working by gender, race, and Hispanic origin, 1984-2002
Hispanic
Total
1984 1990
Female Black, non-Hispanic
Male
SOURCE: Bureau of Labor Statistics, Current Population Survey.
In an average week during the 2002 school year,about 9 percent of youth ages 16 to 19 were neitherenrolled in school nor working.The proportion of youth neither enrolled norworking declined between 1991 and 1998, and hassince stabilized. Most of the decline in theproportion of youth neither enrolled nor workingoccurred among young women. In 1991, 13 percentof young women were neither in school norworking. By 2002, this proportion had decreased to9 percent. Nevertheless, young women continue tobe slightly more likely to be detached from theseactivities than young men.Black, non-Hispanic and Hispanic youth areconsiderably more likely to be detached from theseactivities than White, non-Hispanic youth. In 2002,13 percent of Hispanic youth and 14 percent ofBlack, non-Hispanic youth were neither in schoolnor working, compared with 7 percent of White,non-Hispanic youth.
White, non-Hispanic
1995 2002
The proportion of Black, non-Hispanic youth who areneither enrolled in school nor working has decreasedfrom 19 percent in 1984 to 14 percent in 2002. Theproportion of Hispanic youth who are neitherenrolled in school nor working has also decreased,from 18 percent in 1984 to 13 percent in 2002.Older youth, ages 18 to 19, are more than three timesas likely to be detached from these activities as youthages 16 to 17. In 2002, 14 percent of youth ages 18 to19 were neither enrolled in school nor workingcompared with 4 percent of youth ages 16 to 17.In contrast to the unchanging percentage of youthwho are neither enrolled in school nor working, thepercentage of youth who are both enrolled andemployed has decreased in recent years. Between1999 and 2002, the percentage of youth ages 16 to19 who are both enrolled and employed decreasedfrom 31 to 27 percent, which is similar to thepercentage in 1990.
Bullets contain references to data that can be found inTables ED6.A and ED6.B on pages 123-124. Endnotesbegin on page 63.
America's Children: Key National Indicators of Well-Being, 2003
f9

Higher Education
igher education, especially completion of a bachelor's or more advanced degree, generally enhances aperson's employment prospects and increases his or her earning potential.m The percentage who have
completed a bachelor's degree is one measure of the percentage of young people who have successfullyapplied for and persisted through a program of higher education.
Indicator ED7
Percent
60
50
40
30
20
10
Percentage of 25- to 29-year-olds who have completed a bachelor's or moreadvanced degree by race and Hispanic origin, 1980-2002
White, non-Hispanic
Total
Black, non-Hispanic
01980 1985 1990
Hispanic
1995 2002
NOTE: Prior to 1992, this indicator was measured as completing 4 or more years of college rather than the actual attainment of a bachelor'sdegree.
SOURCE: U.S. Census Bureau, March Current Population Survey. Tabulated by the U.S. Department of Education, National Center for
Education Statistics.
In 2002, 29 percent of 25- to 29-year-olds hadearned a bachelor's or higher degree.This percentage increased between 1980 and 2002,from 23 to 29 percent; since 1996, the percentagehas fluctuated between 27 and 29 percent.White, non-Hispanic persons ages 25 to 29 weremore likely than either Black, non-Hispanics orHispanics in the same age group to have earned abachelor's degree. In 2002, 36 percent of White,non-Hispanics, 18 percent of Black, non-Hispanics,and 9 percent of Hispanics in this age group hadearned a bachelor's degree or higher.
Since 1980, the percentage of Hispanic 25- to 29-year -olds who earned bachelor's degrees or higherhas fluctuated between 8 and 11 percent and was at9 percent in 2002.The percentage of Black, non-Hispanic 25- to 29-year -olds who earned a bachelor's degree increasedfrom 12 percent in 1980 to 18 percent in 2002.In 2002, 8 percent of 25- to 29-year-olds had earnedan associate's degree but had not subsequentlyearned a bachelor's degree.
Bullets contain references to data that can be found in TableED7 on page 125. Endnotes begin on page 63.
Part II: Indicators of Children's Well-Being 11

Indicator Needed
Education
Regular, periodic data collections are needed to collect information on young children's cognitive, social, andemotional development.
Early childhood development. Although this reportoffers indicators of young children's exposure toreading and early childhood education, a regularsource of data is needed to monitor specific social,intellectual, and emotional skills of preschoolersover time. One assessment of kindergartners' skillsand knowledge was presented as a special feature inAmerica's Children, 2000.
IIAmerica's Children: Key National Indicators of Well-Being, 20K
71

T his special section, Changes in the Lives
of America's Children: 1990 to 2000,
provides information about children for all
50 States and the District of Columbia from the
1990 and 2000 Censuses. This special census
data section discusses nine indicators covering
three general domains of the report:
Population and Family Characteristics,
Economic Security, and Education.
SPECIAL SECTION
Changes in the Livesof America's Children:1990 to 2000
72

Introduction
inhe key indicators presented in America's Children come from a wide variety of data sources, includingroutine surveys, administrative data, estimation systems, and special or one-time data collections.
Consideration has been given over time to data sources that allow for routine updating in the report. Most ofthese data sources, while recurring, can only provide information about children for the Nation, as a whole.At the same time, data users and policy-makers continue to look for indicators of child well-being that candescribe the status of children in States and if possible, at even smaller geographic areas.
Once every 10 years, the decennial census provides the opportunity to generate snapshots of the populationfor very small geographic units. Much more than a complete count of the Nation's population, the censusprovides important social, economic, and housing detail about the population, allowing policy-makers andplanners to see how characteristics have changed over time in cities, towns, and neighborhoods.
The data presented in this special decennial census section show change for two points in time only, 1990 and2000, and thus does not consider the point in time that a trend may have changed direction or stabilizedduring the intervening years. When fully implemented, the American Community Survey (ACS) will provideupdates of these characteristics for all states, cities, counties, metropolitan areas, and population groups of65,000 or more every year, replacing the once-every-ten-year collection of these items. This will allow data usersto see the fluctuations in the characteristics that occur between the years of the decennial censuses.
This section presents nine indicators of child well-being from the 1990 and 2000 decennial Censuses, closelyaligned to indicators presented routinely in this volume. What is unique about this section is that data for theitems highlighted here are shown for all 50 States and the District of Columbia. Doing so allows one to see thevariability that exists across the Nation, as well as providing details of change during the past decade.
The scope of the census content is not as wide as that of the 20-plus indicators America's Children routinelyprovides. This special census data section discusses nine indicators, covering three general domains of thereport: Population and Family Characteristics, Economic Security, and Education. Because of differences inquestionnaire design and administration, estimates from the census may not be exactly comparable to thosefrom the routine measures reported in America's Children. However, because these data are all from the samedata collection instrument, and the instrument changed little from 1990 to 2000, they provide a rare andconsistent glimpse of the change in several indicators for the States as well as the Nation as a whole.m1
In all the maps shown in this section, estimates, which are based on a sample of the population, are used topartition the States into groups that reflect a specific percentage point change range between 1990 and 2000.As with all sample survey estimates, these estimates may vary from the actual values due to sampling andnonsampling errors, which could possibly result in a State being assigned to a different group. States indifferent groups may not be significantly different from one another, and States in the same group may besignificantly different.
America's Children: Key National Indicators of Well-Being, 2003
ft' 73

Population and Family Characteristic Measures
0 ne important aspect of children's lives has to do with their own characteristics and those of the family inwhich they live. Indicators in this section speak to the changing shape of the family and the issues of an
increasing foreign-born population, some of whom have English language difficulties.
Change in percentage of children under age 18 living in married-couple families,1990 and 2000
AK
HI
Percentage point change
Decrease of less than 4.2
Decrease of 4.2 to 5.6
Decrease of 5.6 or more
(National average: decrease of 4.2)
MT
WY
NMOK
MO
AR
KY
Ttd
LAMS At
ME
PA-
NJWV , ODE
DC 4I
NOTE: Children in married-couple families are the never-married biological,adopted, and step sons and daughters of a married householder or a marriedsubfamily reference person.
SOURCE: U.S. Census Bureau, 1990 and 2000 Censuses.
Children living in married-couple familiesIn 2000, 68 percent of children under 18 years oldlived in married-couple families, down from 72percent in 1990.102 Utah had the highestpercentage of children in married-couple familiesin both 1990 and 2000 (84 percent and 81 percent,respectively).Figure SPECIALLA shows the extent of decline inchildren living in married-couple families from 1990to 2000. This decrease occurred in all States in theNation, with several States showing a decrease ofabout 7 percentage points. New Jersey had a smalldecrease (1.7 percentage points) from 74 percent in1990 to 72 percent in 2000. While many childrenstill live in married-couple families, these data show atrend that extends across the country.
Children with difficulty speaking EnglishNationally, the proportion of children ages 5 to 17with difficulty speaking English increased from 5percent in 1990 to 7 percent in 2000.103 MostStates experienced such an increase, with thelargest percentage point increase occurring inNevada, where it rose from 4 percent in 1990to 9 percent in 2000.
In 1990, California, Texas, and New Mexico had thehighest percentages of children with difficultyspeaking English (15 percent, 11 percent, and 10percent, respectively). By 2000, Arizona hadreplaced New Mexico as the third highest, so that in2000, the percentage of children with difficultyspeaking English was 16 percent in California, 12percent in Texas, and 11 percent in Arizona.
Foreign-born childrenIn 2000, 4 percent of children living in the UnitedStates were foreign-born, up from 3 percent in 1990.104California experienced a two percentage-pointdrop of foreign-born children from 1990 to 2000;however, despite this drop, California remainedthe State with the highest percentage at 9 percentin 2000.Five States had increases of 2.5 percentage points ormore in the proportion of foreign-born children:Arizona, Colorado, Nevada, Oregon andWashingtonall of which were also States that sawtheir percentages of children with difficultyspeaking English increase.
Bullets contain references to data that can be found in TableSPECIALLA on page 126. Endnotes begin on page 63.
f t 74Changes in the Lives of America's Children: 1990-2000

Economic Security Indicators
©ndicators of economic security reflect families' abilities to meet their children's material needs. Themeasures in this section address issues of crowded housing, child poverty, and parental employment
complementary but varied indicators of the economic conditions in which children live.
Change in percentage of children under 18 living in crowded housing, 1990 and 2000
MA
CT RINJ
DE
MD
DC
Percentage point change
111 Increase of 2.8 or more
111 Increase of up to 2.8
ICNo significant change
Decrease
(National average: increase of 2.8)
NOTE: Children living in crowded housing live in a house where the number of peopleper room is greater than one.
SOURCE: U.S. Census Bureau, 1990 and 2000 Censuses.
Children in crowded housingIn 2000, 19 percent of children lived in crowdedhousing, up from 16 percent a decade earlier.105Children living in two Western States (California andHawaii) and the District of Columbia experienced thehighest rates of crowded housing, all with rates of 30percent or higher. These same areas had the highestlevels of crowded housing in 1990 as well. In contrast,the lowest rates of children living in crowded housingwere found in three Northeastern States in 2000Maine, New Hampshire, and Vermont all had rates ofaround 6 percent or lower.Figure SPEC1ALLB shows the change in the percentof children living in crowded housing from 1990 to2000 by State. In Nevada, the fastest growing State inthe Nation,106 the proportion of children living incrowded housing increased from 20 percent in 1990 to27 percent in 2000, the largest increase in the Nation.However, the largest decrease was found in Texas,where the rate decreased from 25 percent in 1990 to15 percent in 2000.
Children in families in povertyChild poverty decreased for the Nation as a wholefrom 18 percent in 1990 to 16 percent in 2000.107Wide variations in child poverty were noted for Statesin 2000, from a low of 7 percent in New Hampshire tohighs of above 25 percent in Louisiana and Mississippi.The rate of child poverty was 31 percent in the Districtof Columbia.
Louisiana and Mississippi had large declines inchild poverty over the 1990s, even though they hadthe highest levels among the States in 2000. Despitea decrease in child poverty for the Nation as a wholeand for many individual States, child povertyincreased significantly over the decade in five Statesand the District of Columbia.
Children with at least one parent employed full timeIn 2000, 83 percent of children lived in families withat least one parent employed full time, up from 77percent in 1990.108Iowa, Kansas, Nebraska, New Hampshire, and Utahhad 84 percent or more children living in suchfamilies in both 1990 and 2000. Conversely, twoStates (Louisiana and Mississippi) and the Districtof Columbia had some of the lowest percentages ofchildren living with at least one parent employedfull time (less than 77 percent) in both 1990 and2000. These areas also had high rates of childpoverty in both years.The largest gain in parental employment was foundin Michigan, where the rate of children living infamilies with an employed parent rose from 73percent in 1990 to 84 percent in 2000.
Bullets contain references to data that can be found in TableSPECIALLB on page 127. Endnotes begin on page 63.
60 America's Children: Key National Indicators of Well-Being, 2003
75

Education Indicators
ducation represents a major investment in fostering the well-being of children. The three indicators inthis sectionpreprimary education, high school completion, and 'detached youth'help track this
concept from early childhood through young adulthood.
Change in percentage of children aged 3 to 5 enrolled in preprimary education,
1990 and 2000
WA
OR
NV
AK
HI
CA
Percentage point change
1111 Increase of 22.1 or more
1111 Increase of 19.4 to 22.1
Increase of up to 19.4
(National average: increase of 19.4)
ID
UT
AZ NM
TX
IAMI NY
N1"IN CT RI
, MD
DC
V
iNlj
ME
MA
AL
SC
NOTE: Enrolled in preprimary education includes those in kindergarten, preschool,and nursery school.
SOURCE: U.S. Census Bureau, 1990 and 2000 Censuses.
Preprimary educationNationally, the proportion of children aged 3 to 5enrolled in preprimary education rose from 42percent in 1990 to 61 percent in 2000, representingan increase of 19 percentage points.m°In 2000, more than 70 percent of children aged 3 to5 living in Connecticut, New Jersey, and the Districtof Columbia were enrolled in preprimary education,representing the highest rates in the Nation. Incontrast, North Dakota had less than 50 percentenrolled in preprimary education.Figure SPECIALLC clearly shows the geographicvariation in the change in preprimary educationamong children aged 3 to 5, with most of the smallerincreases clustered among the Western States.Georgia, a Southern State, had the largest increasefrom 41 percent in 1990 to 67 percent in 2000.
High school completionNationally, the percentage of people aged 18 to 24
who had completed high school110 declined from 84percent in 1990 to 82 percent in 2000. Part of thisdecrease was fueled by changes in the demographiccomposition of this age group. Even thoughcompletion rates over the decade rose for non-Hispanics, they decreased slightly for Hispanics. Thisfact, combined with an increase in the proportionof Hispanics in the population aged 18 to 24 (who
have lower completion levels compared with non-Hispanics), acted to lower the overall high schoolcompletion rate.111Declines occurred in many States where the proportionof young Hispanics in the population increased, such asin Arizona, Colorado, Nevada, and North Carolina.Twelve States and the District of Columbia experiencedincreases in high school completion rates. The rate inWest Virginia increased 3 percentage points from 1990to 2000.
Detached youth112In 2000, 9 percent of youth aged 16 to 19 neitherworked nor attended school, representing a decreasefrom 10 percent in 1990. Several States experienceddecreases of around 2 percentage points. In contrast,the rate significantly increased in six States (Colorado,Delaware, Hawaii, North Carolina, South Carolina, andSouth Dakota).In both 1990 and 2000, about 14 percent of youth aged16 to 19 living in the District of Columbia wereconsidered detached youths.In contrast, in 1990 and 2000, only about 5 percent ofyouth aged 16 to 19 in North Dakota neither workednor attended school.
Bullets contain references to data that can be found in TableSPECIAL] .0 on page 128. Endnotes begin on page 63.
Changes in the Lives of America's Children: 1990-2000

Notes to Indicators
77

Notes to Indicators
1 Schmid ley, A.D. and Gibson, C.J. (1999). Profile of the Foreign-Born Population in the United States: 1997.Current Population Reports, P23-195, U.S. Government Printing Office, Washington, DC: U.S. Census Bureauavailable at http://www.census.gov/prod/99pubs/p23-195.pdf.
2 Lollock, L. (2001). The Foreign-Born Population in the United States: March 2000, Current Population Reports,P20-534. Washington, DC: U.S. Census Bureau. Available at http://www.census.gov/prod/99pubs/p23-195.pdf.
3 Gibson, C.J. and Lennon, E. (1999). Historical Census Statistics on the Foreign-Born Population of the United States: 1850-1990, Population Division Working Paper No. 29. Washington, DC: U.S. Census Bureau. Available athttp://www.census.gov/population/www/documentation/twps0029/twps0029.html.
4 Adult respondents were asked if the children in the household spoke a language other than English at home andhow well they could speak English. Categories used for reporting were "Very well," "Well," "Not well," and "Not atall." All those who were reported to speak English less than "Very well" were considered to have difficulty speakingEnglish based on an evaluation of the English-speaking ability of sample children in the 1980s.
5 Biblarz, T.J. and Raftery, A.E. (1999). Family Structure, Educational Attainment, and Socioeconomic Success:Rethinking the Pathology of Matriarchy. American Journal of Sociology, 105 (2), 321-365.
6 The majority of children who live with neither of their parents are living with grandparents or other relatives.Some live with foster parents or other nonrelatives.
7 McLanahan, S. and Sandefur, G. (1994). Growing up with a Single Parent: What Hurts, What Helps. Cambridge,MA: Harvard University Press.
8 National Center for Health Statistics. (1995). Report to Congress on out-of wedlock childbearing. Hyattsville, MD:National Center for Health Statistics.
9 McLanahan, S. (1995). The consequences of nonmarital childbearing for women, children, and society. InNational Center for Health Statistics, Report to Congress on out-of-wedlock childbearing. Hyattsville, MD: National Centerfor Health Statistics.
10 Martin, J.A., Hamilton, B.E., Ventura, SI, Menacker, F., Park, M.M., and Sutton, P.D. (2002). Births: Final datafor 2001. National Vital Statistics Reports, 51 (2). Hyattsville, MD: National Center for Health Statistics.
11 Ventura, SJ. (1995). Births to unmarried mothers: United States, 1980-92. Vital and Health Statistics, 53 (Series21). Hyattsville, MD: National Center for Health Statistics.
12 Ventura, SJ. and Bachrach, C.A. (2000). Nonmarital childbearing in the United States, 1940-99. National VitalStatistics Reports, 48 (16). Hyattsville, MD: National Center for Health Statistics.
13 Mathews, T.J., Menaker, F.E., and MacDorman, M.F. (2002). Infant mortality statistics from the 2000 periodlinked birth/infant death data set. National Vital Statistics Reports, 50 (12). Hyattsville, MD: National Center forHealth Statistics.
14 Ventura, SJ., Hamilton, B.E., and Sutton, P.D. (2003). Revised birth and fertility rates for the United States, 2000and 2001. National Vital Statistics Reports, 51 (4). Hyattsville, MD: National Center for Health Statistics.
15 Hamilton, B.E., Sutton, P.D., and Ventura, S.J. (2003). Revised birth and fertility rates for the 1990s: UnitedStates, and new rates for Hispanic populations, 2000 and 2001. National Vital Statistics Reports, 51 (In preparation).Hyattsville, MD: National Center for Health Statistics.
16 Bumpass, L.L., and Lu, H.H. (2000). Trends in cohabitation and implications for children's family contexts inthe United States. Population Studies, 54, 29-41.
IIIAmerica's Children: Key National Indicators of Well-Being, 2003
78

17 Bachu, A. (1999). Trends in premarital childbearing: 1930 to 1994. Current Population Reports, P23-197.Washington, DC: U.S. Census Bureau.
18 The birth rate for unmarried women is the number of births per 1,000 unmarried women in a given age group, forexample, 20 to 24 years. The percentage of all births that are to unmarried women is the number of birthsoccurring to unmarried women, divided by the total number of births. The percentage of all births that are to unmarriedwomen is affected by the birth rate for married women, the birth rate for unmarried women (who account for nearlyone-third of all births), and the proportion of women of childbearing age who are unmarried. The percentage ofbirths to unmarried women increased very slightly in recent years, because increases in the birth rate for unmarriedwomen were offset by increases in births for married women.
19 U.S. Census Bureau.(various years). Marital status and living arrangements (annual reports). Current PopulationReports, Series P-20. (Beginning in 1995, reports are available on the U.S. Census Bureau website athttp://www.census.gov/population/www/socdemo/ms-la.html.)
20 National Center for Health Statistics. (2002). Unpublished tabulations.
21 To provide a comprehensive picture of the child care arrangements parents use to care for their preschoolers,this indicator draws on the strengths of two different Federal data setsthe National Household Education Survey(NHES) and the Survey of Income and Program Participation (SIPP). Using NHES (POP8.A) data, the percentageof children in each type of arrangement is shown, to provide total usage rates. Because some children are cared forby more than one type of provider, the numerator is the number of children in the particular arrangement and thedenominator is all children. Using SIPP (POP8.B) data, the historical trend of the primary child care provider isshown because there is an interest in the care arrangement that is used by employed mothers for the greatestnumber of hours each week. In this case, the numerator is the number of children of employed mothers who spendthe greatest number of hours in the particular arrangement each week and the denominator is all children ofemployed mothers.
22 Center-based care includes day care centers, nursery schools, and preschools. Home-based care or othernonrelative care includes family day care providers, in-home babysitters, and other nonrelatives providing care ineither the child's or provider's home. Other relatives include aunts, uncles, and cousins. Mother care includes careby the mother while she worked. To see trends in individual child care arrangement types refer to Smith, Kristin.(2002). Who's Minding the Kids? Child Care Arrangements: Spring 1997. Current Population Reports, P70-86. U.S.Census Bureau, Washington, DC.
23 Since grade-school-age children differ from preschoolers in their development and have a greater need forstructured activities and educational programs, the child care arrangements and enrichment activities forgradeschool-age children are presented in a separate indicator.
24 U.S. Environmental Protection Agency. (1994). Supplement to the Second Addendum (1986) to Air Quality Criteria forParticulate Matter and Sulfur Oxides (1982): Assessment of new findings on sulfur dioxide acute exposure health effects inasthmatic individuals (EPA/600/FP-93/002). Research Triangle Park, NC: U.S. Environmental Protection Agency.
25 U.S. Environmental Protection Agency. (1995). Review of the National Ambient Air Quality Standards for NitrogenOxides: Assessment of scientific and technical information (EPA-452/R-95-005). Research Triangle Park, NC: U.S.Environmental Protection Agency.
26 U.S. Environmental Protection Agency. (1996). Air quality criteria for ozone and related photochemical oxidants(EPA/600/P-93/004aF). Research Triangle Park, NC: U.S. Environmental Protection Agency.
27 U.S. Environmental Protection Agency. (1996). Air quality criteria for particulate matter (EPA/600/P-95/001aF).Research Triangle Park, NC: U.S. Environmental Protection Agency.
28 U.S. Environmental Protection Agency. (1986). Air quality criteria for lead: Volume III (EPA-600/8-83/028cF).Research Triangle Park, NC: U.S. Environmental Protection Agency.
Notes to Indicators II

29 Benninger, M.S. (1999). The impact of cigarette smoking and environmental tobacco smoke on nasal and sinusdisease: A review of the literature. American Journal of Rhinology, 13 (6), 435438.
Dybing, E. and Sanner, T. (1999). Passive smoking, sudden infant death syndrome (SIDS) and childhoodinfections. Human and Experimental Toxicology, 18 (4), 202-205.
31 U.S. Environmental Protection Agency. (1992). Respiratory Health Effects of Passive Smoking: Lung Cancer and OtherDisorders. Washington, DC: EPA Office of Research and Development.http://cfpub.epa.gov/ncea/cfm/ets/etsindex.cfm.
32 Mannino, D.M., Moorman, J.E., Kingsley, B., Rose, D., and Repace, J. (2001). Health effects related toenvironmental tobacco smoke exposure in children in the United States: Data from the Third National Health andNutrition Examination Survey. Archives of Pediatrics and Adolescent Medicine, 155 (1), 36-41.
Lanphear, B.P., Aligne, C.A., Auinger, P., Weitzman, M., and Byrd, R.S. (2001). Residential exposures associatedwith asthma in US children. Pediatrics, 107 (3), 505-511.
34 Gergen, PJ., Fowler, J.A., Maurer, KR., Davis, W.W., and Overpeck, M.D. (1998). The burden of environmentaltobacco smoke exposure on the respiratory health of children 2 months through 5 years of age in the UnitedStates: Third National Health and Nutrition Examination Survey, 1988 to 1994. Pediatrics 101, (2), E8.
35 National Academy of Sciences. (2000). Clearing the Air: Asthma and Indoor Air Exposures. Washington, DC: NationalAcademy Press. Available at http: // books .nap.edu /catalog /9610.html.
36 Lindfors, A., Hage-Hamsten, M. V., Rietz, H., Wickman, M., and Nordvall, S.L. (1999). Influence of interaction ofenvironmental risk factors and sensitization in young asthmatic children. Journal of Allergy and Clinical Immunology104, 755-762.
37 Wahlgren, D.R., Hovell, M.F., Meltzer, E.O., and Meltzer, S.B. (2000). Involuntary smoking and asthma. CurrentOpinions in Pulmonary Medicine 6, 31-36.
38 Centers for Disease Control and Prevention. (2001). Cigarette smoking among adults-United States, 1999.Morbidity and Mortality Weekly Report 50 (40), 869-873.
39 Mannino, D.M., Caraballo, R., Benowitz, N., Repace, J. (2001). Predictors of cotinine levels in US children: Datafrom the Third National Health and Nutrition Examination Survey. CHEST, 120, 718-724.
40 Duncan, G. and Brooks-Gunn, J. (Eds.). (1997). Consequences of growing up poor. New York, NY: Russell Sage Press.
41 An C., Haveman, R., and Wolfe, B. (1993). Teen out-of-wedlock births and welfare receipt: The role ofchildhood events and economic circumstances. Review of Economics and Statistics, 75 (2), 195-208.
42 From 1999 onward, the poverty rate estimates for children could not be distinguished statistically from theprevious low of 16 percent in 1979.
43 To learn more about the U.S. Census Bureau's experimental measures, see Short, K (2001). ExperimentalPoverty Measures: 1999. Current Population Reports, P60-216. Washington, DC: U.S. Census Bureau.
44 These income categories are similar to those used in the Economic Report of the President (1998). A similarapproach is found in Hernandez, D.J. (1993). America's children: Resources from family, government, and the economy.New York, NY: Russell Sage Foundation for the National Committee for Research on the 1990 Census, except thatHernandez uses the relationship to median income to define his categories. For either method, the medium andhigh income categories are at similar levels of median family income.
66 America's Children: Key National Indicators of Well-Being, 2003
b0

45 Mayer, S.E. (1997). Income, employment and the support of children. In Hauser, R.M., Brown, B.V., and Prosser,W. (Eds.), Indicators of children's well being. New York, NY: Russell Sage Press.
46 Smith, J.R., Brooks-Gunn, J., and Jackson, A.P. (1997). Parental employment and children. In Hauser, R.M.,Brown, B.V., and Prosser, W. (Eds.), Indicators of children's well-being. New York, NY: Russell Sage Press.
47 Kaufman, T. (1996). Housing America's future: Children at risk. Washington, DC: National Low Income HousingCoalition.
48 The definition includes households lacking complete plumbing for exclusive use, having unvented room heatersas the primary heating equipment, and having multiple upkeep problems such as water leakage, open cracks orholes, broken plaster, or signs of rats.
49 Paying 30 percent or more of income for housing may leave insufficient resources for other basic needs. NationalAcademy of Sciences. (1995). Measuring poverty: A new approach. Washington, DC: National Academy Press.
50 Income-eligible families who report either severe housing cost burdens or severe physical problems with theirhousing and do not receive rental assistance are considered by the U.S. Department of Housing and UrbanDevelopment to have "priority" housing problems. Because of questionnaire changes, 1997 and 1999 data onassisted families, priority problems, and severe physical problems are not comparable to earlier data.
51 "Very-low-income renters" are renter households with incomes at or below half the median family income,adjusted for household size, in their geographic area.
52 Life Sciences Research Office and American Institute of Nutrition. (1990). Core indicators of nutritional state fordifficult to sample populations. Bethesda, MD: Life Sciences Research Office and American Institute of Nutrition.
53 Nord, M., et al. (2002). Household Food Security in the United States, 2001. Food and Nutrition Assistance ResearchReport No. 29. Washington, DC: Food and Rural Economics Division, Economic Research Service, U.S.Department of Agriculture.
54 For additional results and more details on the Healthy Eating Index and how it is computed, see Basiotis, P.P.,Carlson, A., Gerrior, S.A., Juan, W.Y., and Lino, M. (2002). The Healthy Eating Index: 1999-2000 (CNPP-12). Centerfor Nutrition Policy and Promotion. Washington, DC: U.S. Department of Agriculture. Available athttp://www.cnpp.usda.gov/cnpp/Pubs/HEI/HEI99-00report.pdf.
55 The percentages of children covered by government and private insurance do not add up to the percentage ofall children covered by health insurance because some children have both government and private insurance.
56 Green, M. (Ed.). (1994). Bright futures: Guidelines for health supervision of infants, children, and adolescents.Arlington, VA: National Center for Education in Maternal and Child Health.
57 Simpson, G., Bloom, B., Cohen, R.A., and Parsons, P.E. (1997). Access to health care. Part 1: Children. Vital andHealth Statistics, 10 (Series 196). Hyattsville, MD: National Center for Health Statistics.
58 Bartman, B.A., Moy, E., and D'Angelo, LJ. (1997). Access to ambulatory care for adolescents: The role of a usualsource of care. Journal of Health Care for the Poor and Underserved, 8, 214-226.
Folton, G.L. (1995). Critical issues in urban emergency medical services for children. Pediatrics, 96 (2), 174-179.
so Newacheck, P.W. and Starfield, B. (1988). Morbidity and use of ambulatory care services among poor andnonpoor children. American journal of Public Health, 78 (8), 927-933.
61 Newacheck, P.W., Halfon, N., and Budetti, P.P. (1986). Prevalence of activity-limiting chronic conditions amongchildren based on household interviews. Journal of Chronic Disease, 39 (2), 63-71.
Notes to Indicators ill

62 Shaywitz, S.E., Shaywitz, B.A., Fletcher, J.M., and Escobar, M.D. (1990). Prevalence of reading disability in boysand girls: Results of the Connecticut Longitudinal Study. Journal of the American Medical Association, 264, 998-1002
63 Serdula, M.K., Ivery, D., Coates, RJ., Freedman, D.S., Williamson, D.F., and Byers, T. (1993). Do obese childrenbecome obese adults? A review of the literature. Preventive Medicine, 22, 167-177.
64 Pi-Sunyer, F.X. (1991). Health complications of obesity. American Journal of Clinical Nutrition, 53, 15955-16035.
65 Dietz, W.H. (1998). Health consequences of obesity in youth: Childhood predictors of adult disease. Pediatrics,105, 518-525.
66 Ogden, C.L., Flegal, KM., Carroll, M.D., and Johnson, C.L. (2002). Prevalence and trends in overweight amongU.S. children and adolescents, 1999-2000. Journal of the American Medical Association, 288 (14), 1728-1732.
67 Physical activity and health: a report of the surgeon general. Atlanta, GA: National Center for Chronic DiseasePrevention and Health Promotion; Centers for Disease Control and Prevention.
68 Grunbaum, J.A., Kann, L., Kinchen, S.A., Williams, B., Ross, J.G., Lowry, R., and Kolbe, L. (2002). Youth RiskBehavior Surveillance-United States, 2001. Morbidity and Mortality Weekly Report, 2002: 5 l(SS04), 1-64.
69 Kiely, J.L., Brett, K.M., Yu, S., and Rowley, D.L. (1994). Low birthweight and intrauterine growth retardation. InWilcox, L.S. and Marks, J.S. (Eds.), From data to action: CDC's public health surveillance for women, infants, and children(pp. 185-202). Atlanta, GA: Centers for Disease Control and Prevention.
7° Martin, J.A. and Park, M.M. (1999). Trends in twin and triplet births: 1980-97. National Vital Statistics Reports, 47(24). Hyattsville, MD: National Center for Health Statistics.
71 Martin, J.A. and Taffel, S.M. (1995). Current and future impact of rising multiple birth ratios on low birthweight.Statistical Bulletin, 76 (2). New York, NY: Metropolitan Life Insurance Company.
72 Kleinman, J.C. and Kiely, J.L. (1991). Infant mortality. Healthy People 2000 Statistical Notes, 1 (2). Hyattsville, MD:National Center for Health Statistics.
73 Centers for Disease Control and Prevention. (1995). Poverty and infant mortality, United States, 1988. Morbidityand Mortality Weekly Report, 44 (49), 922-927.
74 No linked file was produced for data years 1992 through 1994, as a transition was made from cohort data toperiod data. For period linked files, the numerator consists of all infant deaths occurring in the period that havebeen linked to their corresponding birth certificates, whether the birth occurred in that year or the previous year.National Center for Health Statistics. (1997). Public use data file documentation: Linked birth/infant death dataset-1995 period data. Hyattsville, MD: National Center for Health Statistics. Prager, K. (1994). Infant mortality bybirthweight and other characteristics: United States, 1985 birth cohort. Vital and Health Statistics, 20 (24).Hyattsville, MD: National Center for Health Statistics. MacDorman, M.F. and Atkinson, J.O. (1998). Infant mortalitystatistics from the linked birth/infant death data set-1995 period data. Monthly Vital Statistics Report, 46 (6,Supplement 2). Hyattsville, MD: National Center for Health Statistics.
75 Estimates from the Fatality Analysis Reporting System, National Highway Traffic Safety Administration.
76 Fingerhut, L.A. and Warner, M. (1997). Injury chartbook. Health, United States, 1996-97. Hyattsville, MD: NationalCenter for Health Statistics.
77 Klerman, L.V. (1993). Adolescent pregnancy and parenting: Controversies of the past and lessons for the future.Journal of Adolescent Health, 14, 553-561.
68 America's Children: Key National Indicators of Well-Being, 2003
82

78 Maynard, R.A. (Ed.). (1996). Kids having kids: A Robin Hood Foundation special report on the costs of adolescentchildbearing. New York, NY: The Robin Hood Foundation.
79 Ventura, ST, Mathews, TT, and Hamilton, B.E. (2001). Births to teenagers in the United States, 1940-2000.National Vital Statistics Reports, 49 (10) . Hyattsville, MD: National Center for Health Statistics.
80 Ventura, SJ., Mosher, W.D., Curtin, S.C., et al. (2001). Trends in pregnancy rates for the United States, 1976-97:An update. National Vital Statistics Reports, 49 (3). Hyattsville, MD: National Center for Health Statistics.
81 Ventura, ST, Abma, J.C., Mosher, W.D., and Henshaw, S. (2003). Revised pregnancy rates for 1991-97 and newrates for 1998-99: United States. National Vital Statistics Reports, 51 (In preparation). Hyattsville, MD: National Centerfor Health Statistics.
82 Kessler, D.A., Witt, A.M., Barnett, P.S., et al. (1996). The Food and Drug Administration's regulation of tobaccoproducts. New England Journal of Medicine, 335 (13), 988-994.
83 Centers for Disease Control and Prevention. (1996). Projected smoking-related deaths among youth-UnitedStates. Morbidity and Mortality Weekly Report, 45 (44), 971-974.
84 National Institute on Alcohol Abuse and Alcoholism. (1997). Ninth special report to the U.S. Congress on alcohol andhealth, from the Secretary of Health and Human Services, June 1997 (NIH Publication No. 97-4017). Bethesda, MD:National Institutes of Health.
85 Blanken, A.J. (1993). Measuring use of alcohol and other drugs among adolescents. Public Health Reports, 108(Supplement 1).
86 National Institute on Drug Abuse. (1995). Marijuana: Facts parents need to know (NCADI Publication No.PHD712). Washington, DC: U.S. Department of Health and Human Services.
87 Pope Jr., H.G., and Yurgelun-Todd, D. (1996). The residual cognitive effects of heavy marijuana use in collegestudents. Journal of the American Medical Association, 275 (7).
88 U.S. Public Health Service. (1993). Measuring the health behavior of adolescents: The Youth Risk BehaviorSurveillance System and recent reports on high-risk adolescents. Public Health Reports, 108 (Supplement 1).
89 Finkelhor, D. and Dziuba-Leatherman, J. (1994). Victimization of children. American Psychologist, 49 (3), 173-183.
90 Lauritsen, J.L., Laub, J.H., and Sampson, R. J. (1992). Conventional and delinquent activities: Implications forthe prevention of violent victimization among adolescents. Violence and Victims, 7 (2), 91-108.
91 Snyder, H.N. and Sickmund, M. (1999). Juvenile offenders and victims: 1999 national report (Publication No. NCJ178257, p. 26). Washington, DC: Office of Juvenile Justice and Delinquency Prevention.
92 Wells, C.G. (1985). Preschool literacy-related activities and success in school. In Olson, D., Torrance, N., andHildyard, A. (Eds.), Literacy, language, and learning: The nature and consequences of literacy (pp. 229-255).Cambridge, England: Cambridge University Press.
93 Barnett, S.W. (1992). Benefits of compensatory preschool education. Journal of Human Resources, 27, 279-312.
94 Decker, P.T., Rice, J.K., Moore, M.T., and Rollefson, M. (1997). Education and the economy: An indicators report.Washington, DC: National Center for Education Statistics.
95 Data on parents' level of education are not reliable for 9-year-olds.
S3Notes to Indicators III

96 Chen, X., Tuma, J., Daniel, B., and Scott, L. (Forthcoming). Trends in high school academic coursetaking:Mathematics, science, English, and foreign language course completion. Washington, DC: National Center for EducationStatistics.
97 Horn, L., Nunez, A.M., and Bobbitt, L. (2000). Mapping the road to college: First-generation students' math track,planning strategies, and context for support. Washington, DC: National Center for Education Statistics.
98 Some of these changes may be related to changes in the survey and collection procedures in 1994.
99 Brown, B. (1996). Who are America's disconnected youth? Report prepared for the American Enterprise Institute.Washington, DC: Child Trends, Inc.
100 American Council on Education. (1994). Higher education today: Facts in brief. Washington, DC: American Councilon Education, Division of Policy Analysis and Research.
101 The estimates in this special section are based on responses from a sample of the population. As with all surveys,estimates may vary from the actual values because of sampling variation or other factors. All statements made in thisreport have undergone statistical testing and are significant at the 90 percent confidence level, unless otherwise noted.
102 Children in married-couple families are the never-married biological, adopted, and step-sons and step-daughtersof a married householder or married subfamily reference person. POP6 shows trends for intervening years andindicates that the downward trend leveled off in 1995 and has remained stable since.
103 Children who have difficulty speaking English speak a language other than English at home and speak Englishless than "very well." This includes those who speak English "well," "not very well," and "not at all."
104 Foreign-born children were not born in the 50 States, the District of Columbia, U.S. outlying territories, orabroad to American parents.
105 Children living in crowded housing live in a house where the number of persons per room is greater than one.
106 Perry, M.J. and Mackun, P.J. (2001). Population Change and Distribution, 1990 to 2000. Census 2000 Brief, SeriesC2KBR/01-2. U.S. Census Bureau, Washington, DC.
107 Child poverty includes children living in households who are related to the householder and whose familyincome and family size put the child below the poverty threshold. Poverty data collected in the 1990 and 2000Censuses refer to poverty in calendar year 1989 and 1999, respectively. The average poverty threshold for a familyof four was $12,674 in 1989 and $17,029 in 1999.
108 Children with at least one parent employed full time are the never-married biological, adopted, and step-sonsand step-daughters of the householder or a subfamily reference person who are living with one or two parents whoare employed and working at least 35 hours per week.
109 Preprimary education includes enrollment in kindergarten, preschool, or nursery school.
110 This proportion excludes people ages 18 to 24 who are still enrolled at the high school level.
111 Smith, K., Kominski, R., and Overturf, J. (2003). Changes in the Lives of U.S. Children: 1990-2000. Poster presentedat the Annual Meetings of the Population Association of America. Minneapolis, MN, May 2003.
112 "Detached youth" are people ages 16 to 19 who are not enrolled in school and are not employed.
70 America's Children: Key National Indicators of Well-Being, 2003

T ables include data from 1950-2002,
where available. Due to space
APPENDICES
Appendix A:Detailed Tables
limitations in this printed publication, selected
years of data are shown when applicable. Full
tables, including data from intervening years,
are available on the Forum's website at
http: / /childstats.gov.
85

Detailed Tables
Table POP1 Child population: Number of children under age 18 in the United States by age, selected years1950-2001 and projected 2002-2020 75
Table POP2 Children as a proportion of the population: Persons in selected age groups as a percentage of the totalU.S. population, and children under age 18 as a percentage of the dependent population, selected years 1950-2001and projected 2002-2020 76
Table POP3 Racial and ethnic composition: Percentage of U.S. children under age 18 by race andHispanic origin, selected years 1980-2000 and projected 2001-2020 77
Table POP4 Children of at least one foreign-born parent: Percentage of children under age 18 by nativity of childand parents by parent's education, poverty status, and other characteristics, selected years 1994-2002 78
Table POP5 Difficulty speaking English: Children ages 5 to 17 who speak a language other than Englishat home, and who are reported to have difficulty speaking English by race, Hispanic origin, and region,selected years 1979-99 80
Table POP6 Family structure and children's living arrangements: Percentage of children under age 18by presence of married parents in household, race, and Hispanic origin, selected years 1980-2002 81
Table POP7.A Births to unmarried women: Birth rates for unmarried women by age of mother,selected years 1980-2001 82
Table POP7.B Births to unmarried women: Percentage of all births that are to unmarried women by age of mother,selected years 1980-2001 82
Table POP8.A Child care: Percentage of children from birth through age 6, not yet in kindergarten, by typeof care arrangement and child and family characteristics, 1995 and 2001 83
Table POP8.B Child care: Percentage of preschoolers (children under age 5) of employed mothers by primarychild care arrangement, selected years 1985-99 84
Table POP8.0 Child care and activities: Percentage of children in kindergarten through 8th grade by weekdaycare and before- and after-school activities by grade level, poverty, race, and Hispanic origin, 2001 85
Table POP9.A Children's environments: Percentage of children under age 18 living in areasthat do not meet one or more of the Primary National Ambient Air Quality Standards, 1990-2001 86
Table POP9.B Blood cotinine levels: Percentage of children ages 4 to 17 with specified blood cotinine levelsby age, race, and ethnicity, 1988-1994 and 1999-2000 87
Table POP9.0 Exposure to secondhand smoke: Percentage of homes with children under age 7 where someonesmokes regularly, selected years 1994-1999 87
Table ECON1.A Child poverty: Percentage of related children under age 18 living below selected poverty levelsby age, family structure, race, and Hispanic origin, selected years 1980-2001 88
Table ECON1.B Income distribution: Percentage of related children under age 18 by family income relative to thepoverty line, selected years 1980-2001 89
Table ECON2 Secure parental employment Percentage of children under age 18 living with at least one parentemployed full time all year by family structure, race, Hispanic origin, poverty status, and age, selected years 1980-2001 . . .90
Table ECON3 Housing problems: Percentage of households with children under age 18 that report housingproblems by type of problem, selected years 1978-2001 92
Table ECON4.A Food security: Percentage of children under age 18 in food-insecure households by poverty statusand presence of hunger, selected years 1995-2001 93
Table ECON4.B Diet quality: Percentage of children ages 2 to 18 by age and diet quality as measured by the HealthyEating Index, 1989-90, 1994-96, 1999-2000 94
Table ECON4.0 Diet quality: Percentage of children ages 2 to 18 by age and diet quality as measured by the HealthyEating Index, 1989-90, 1994-96, 1999-2000 94
laAmerica's Children: Key National Indicators of Well-Being, 2003

Table ECON4.D Healthy Eating Index: Overall and component mean scores and percentagesfor children ages 2 to 18, 1989-90, 1994-96, 1999-2000 95
Table ECON5.A Access to health care: Percentage of children under age 18 covered by health insuranceby type of health insurance, age, race, and Hispanic origin, 1987-2001 96
Table ECON5.B Usual source of care: Percentage of children under age 18 with no usual sourceof health care by age, type of health insurance, and poverty status, 1993-2001 97
Table HEALTH1 General health status: Percentage of children under age 18 in very good or excellenthealth by age, poverty status, race, and Hispanic origin, selected years 1984-2001 98
Table HEALTH2 Activity limitation: Percentage of children ages 5 to 17 with limitation in activity resultingfrom chronic conditions by age, gender, poverty status, race, and Hispanic origin, selected years 1997-2001 99
Table HEALTH3 Overweight: Percentage of children ages 6 to 18 who are overweight by gender, race, andHispanic origin, 1976-1980, 1988-1994, and 1999-2000 100
Table HEALTH4 Childhood immunization: Percentage of children ages 19 to 35 months vaccinated for selecteddiseases by poverty status, race, and Hispanic origin, selected years 1996-2001 101
Table HEALTH5 Low birthweight: Percentage of infants born of low-birthweight by detailed mother's race andHispanic origin, selected years 1980-2001 102
Table HEALTH6 Infant mortality: Death rates among infants by detailed race and Hispanic originof mother, selected years 1983-2000 103
Table HEALTH7.A Child mortality: Death rates for children ages 1 to 4 by gender, race, Hispanic origin,and cause of death, selected years 1980-2000 104
Table HEALTH7.B Child mortality: Death rates for children ages 5 to 14 by gender, race, Hispanic origin,and cause of death, selected years 1980-2000 105
Table HEALTH8 Adolescent mortality: Death rates among adolescents ages 15 to 19 by gender, race, Hispanicorigin, and cause of death, selected years 1980-2000 106
Table HEALTH9 Adolescent births: Birth rates by mother's age, race, and Hispanic origin, selected years1980-2001 108
Table BEH 1 Regular cigarette smoking: Percentage of 8th-, 10th-, and 12th-grade students who reported smokingcigarettes daily in the previous 30 days by grade, gender, race, and Hispanic origin, selected years 1980-2002 109
Table BEH2 Alcohol use: Percentage of 8th-, 10th-, and 12th-grade students who reported having fiveor more drinks in a row in the past 2 weeks by grade, gender, race, and Hispanic origin,selected years 1980-2002 110
Table BEH3 Illicit drug use: Percentage of 8th-, 10th-, and 12th-grade students who have used illicit drugs inthe previous 30 days by grade, gender, race, and Hispanic origin, selected years 1980-2002 111
Table BEH4.A Youth victims of serious violent crimes: Number and rate of victimizations for youthages 12 to 17 by age, race, and gender, selected years 1980-2000 112
Table BEH4.B Serious violent juvenile crime rate: Number and rate of serious crimes involvingyouth ages 12 to 17, selected years 1980-2000 113
Table ED1 Family reading: Percentage of children ages 3 to 5 who were read to every dayin the last week by a family member by child and family characteristics, selected years 1993-2001 114
Appendix A: Detailed Tables

Table ED2 Early childhood care and education: Percentage of children ages 3 to 5 who are enrolledin center-based early childhood care and education programs by child and family characteristics,selected years 1991-2001 115
Table ED3.A Mathematics achievement: Average scale scores of students ages 9, 13, and 17 by ageand child and family characteristics, selected years 1982-99 116
Table ED3.B Reading achievement: Average scale scores of students ages 9, 13, and 17 by age andchild and family characteristics, selected years 1980-99 117
Table ED4.A High school academic coursetaking: Percentage distribution of high school graduates by thehighest level of advanced mathematics courses taken, selected years 1982-2000 118
Table ED4.B High school academic coursetaking: Percentage distribution of high school graduates by thehighest level of advanced science courses taken, selected years 1982-2000 119
Table ED4.0 High school academic coursetaking: Percentage distribution of high school graduates by thelevel of English courses taken, selected years 1982-2000 120
Table ED4.D High school academic coursetaking: Percentage distribution of high school graduates by thelevel of foreign language courses taken, selected years 1982-2000 121
Table ED5 High school completion: Percentage of adults ages 18 to 24 who have completed high school by race,Hispanic origin, and method of completion, selected years 1980-2001 122
Table ED6.A Youth neither enrolled in school nor working: Percentage of youth ages 16 to 19 who areneither enrolled in school nor working by age, gender, race, and Hispanic origin, selected years 1984-2002 123
Table ED6.B Youth enrolled in school and working: Percentage of youth ages 16 to 19 who areenrolled in school and working by age, gender, race, and Hispanic origin, selected years 1984-2002 124
Table ED7 Higher education: Percentage of 25-to 29-year-olds attaining associate's and bachelor's degrees orhigher by highest degree attained, race, and Hispanic origin, selected years 1980-2002 125
Table SPECIAL1.A Population and family: Selected population and family measures of child well-being by state,1990 and 2000 126
Table SPECIALl.B Economic security: Selected economic security indicators of child well-being by state,1990 and 2000 127
Table SPECIALl.0 Education: Selected educational indicators of child well-being by state, 1990 and 2000 128
11 America's Children: Key Notional Indicators of Well-Being, 2003.1'014A 0.

Table POP1 Child population: Number of children under age 18 in the United States by age,selected years 1950-2001 and projected 2002-2020
Number (in millions)
Estimates Projected
Age group 1950 1960 1970 1980 1990 1995 1997 1998 1999 2000 2001 2010 2020
All children 47.3 64.5 69.8 63.7 64.2 69.5 70.9 71.4 71.9 72.3 72.6 74.4 80.3
Age group
Ages 0-5 19.1 24.3 20.9 19.6 22.5 23.7 23.3 23.2 23.1 23.1 23.3 25.6 27.5
Ages 6-11 15.3 21.8 24.6 20.8 21.6 23.0 24.0 24.5 24.8 25.0 24.8 24.4 26.9
Ages 12-17 12.9 18.4 24.3 23.3 20.1 22.7 23.5 23.8 24.0 24.2 24.5 24.4 26.0
NOTE: Population projections are based on the 2000 Census counts.
SOURCE: U.S. Census Bureau, Current Population Reports, Estimates of the population of the United States by single years of age, color,and sex: 1900 to 1959 (Series P-25, No. 311); Estimates of the population of the United States, by age, sex, and race: April 1, 1960, to July1, 1973 (Series P-25, No. 519); Preliminary estimates of the population of the United States by age, sex, and race: 1970 to 1981 (Series P-25, No. 917); Methodology and assumptions for the population projections of the United Slates: 1999 to 2100 (Population Division Working PaperNo. 38); and unpublished vintage 1999 estimates tables for 1980-1990, intercensal estimates for 1991-2000, vintage 2001 estimates, andpopulation projections for 2001-2020 that are unpublished.
Appendix A: Detailed Tables El

Table POP2 Children as a proportion of the population: Persons in selected age groups as apercentage of the total U.S. population, and children under age 18 as a percentageof the dependent population, selected years 1950-2001 and projected 2002-2020
Estimates Projected
Age group 1950 1960 1970 1980 1990 1995 1997 1998 1999 2000 2001 2010 2020
Percentage of total population
Ages 0-17 31 36 34 28 26 26 26 26 26 26 25 24 24Ages 18-64 61 55 56 61 62 61 61 62 62 62 62 63 60Ages 65+ 8 9 10 11 13 13 13 13 13 12 12 13 16
Children under age 18 as a percentage of the dependent population°
Ages 0-17 79 79 78 71 67 67 67 67
a The dependent population includes all persons ages 17 and under, and 65 and over.
67 67 67 65 60
NOTE: Population projections are based on the 2000 Census counts.
SOURCE: U.S. Census Bureau, Current Population Reports, Estimates of the population of the United States by single years of age, color,and sex: 1900 to 1959 (Series P-25, No. 311); Estimates of the population of the United States, by age, sex, and race: April 1, 1960, to July1, 1973 (Series P-25, No. 519); Preliminary estimates of the population of the United States by age, sex, andrace: 1970 to 1981 (Series P-25, No. 917); Methodology and assumptions for the population projections of the United States: 1999 to 2100(Population Division Working PaperNo. 38); and unpublished vintage 1999 estimates tables for 1980-1990, intercensal estimates for 1991-2000, vintage 2001 estimates, andpopulation projections for 2001-2020 that are unpublished.
76America's Children: Key National Indicators of Well-Being, 2003
00 0

Table POPS Racial and ethnic composition: Percentage of U.S. children under age 18 by raceand Hispanic origin, selected years 1980-2000 and projected 2001-2020
Estimates Projected
Race and Hispanicorigin
1980 1985 1990 1995 1996 1997 1998 1999 2000 2010 2020
White, non-Hispanic 74 72 69 67 66 66 65 65 64 59 55Black, non-Hispanic 15 15 15 15 15 15 15 15 15 14 14
Hispanic° 9 10 12 14 14 15 15 16 16 21 23
Asian/Pacific Islanderb 2 3 3 4 4 4 4 4 4 5 6American Indian/ 1 1 1 1 1 1 1 1 1 1 1
Alaska Nativeb
a Persons of Hispanic origin may be of any race.
b Excludes persons in this race group who are of Hispanic origin.
NOTE: All population figures for the year 2000 shown here are estimates based on the 1990 Census; they do not reflect 2000 Census counts.
SOURCE: U.S. Census Bureau, Current Population Reports, Estimates of the population of the United States by single years of age, color,and sex: 1900 to 1959 (Series P-25, No. 311); Estimates of the population of the United States, by age, sex, and race: April 1, 1960, to July1, 1973 (Series P-25, No. 519); Preliminary estimates of the population of the United States by age, sex, and race: 1970 to 1981 (Series P-25, No. 917); Methodology and assumptions for the population projections of the United States: 1999 to 2100 (Population Division Working PaperNo. 38); and unpublished vintage 1999 estimates tables for 1980-2000 that are available on the U.S. Census Bureau website.
Appendix A: Detailed Tables Ifil

Table POP4 Children of at least one foreign-born parent: Percentage of children under age 18by nativity of child and parents° by parent's education, poverty status, and othercharacteristics, selected years 1994-2002
1994 1996 1998Native Foreign-born
childForeign-born Native Foreign-born
childchild parent parent parentand Native Foreign- and Native Foreign- and Native Foreign-
Characteristic parents child born child parents child born child parents child born child
Children under age 18 living with 56,338one or both parents
Percent of all children` 82
Education of parentLess than high school 14
High school graduate 35
Some college or associate's degree 28
Bachelor's degree or more 23
Poverty statusdBelow poverty 20At or above poverty 80
Area of residenceCentral city of MSAe 27Outside central city, in MSAe 48Outside metropolitan area 25
Presence of parentsTwo married parents present 70Living with mother only 26Living with father only 4
'Presence of adults other than parentsOther relatives only 17
Nonrelatives only 5
Both relatives and nonrelatives 1
No other relatives or nonrelatives 78
8,176 2,160 56,369 9,157 2,449 56,237 9,883 2,298
12 3 80 13 3 80 14 3
38 48 13 39 49 12 37 4521 20 34 21 16 34 23 22
19 11 29 19 12 30 18 11
22 21 23 22 22 23 23 22
28 41 18 27 39 17 25 3972 59 82 73 61 83 75 61
43 48 26 42 48 26 43 4951 47 51 51 46 51 50 456 6 23 6 6 22 7 6
82 78 69 80 80 69 82 7816 19 27 17 17 26 15 20
2 3 4 3 2 5 3 3
25 36 17 24 34 17 26 295 5 6 3 3 6 4 4
1 3 1 1 2 1 1 2
68 56 76 72 61 77 68 65
111 America's Children: Key National Indicators of Well-Being, 2003

Children of at least one foreign-born parent: Percentage of children under age 18by nativity of child and parents° by parent's education, poverty status, and othercharacteristics, selected years 1994-2002
2000 2001 b 2002b
Table POP4 (cont.)
Characteristic
Nativechildandparent
Foreign-bornparent
Nativechild
Foreign-bornparent
Nativechild
Foreign-bornparent
Nativechild
Foreign- andborn child parent
Nativechild
Foreign- andborn child parent
Nativechild
Foreign-born child
Children under age 18 living withone or both parents
56,340 10,211 2,465 55,367 10,999 2,677 55,264 11,518 2,654
Percent of all childrenc 79 14 3 77 16 4 76 16 4
Education of parent (
Less than high school 11 36 43 11 36 41 10 36 41
High school graduate 33 23 23 32 22 20 32 23 21
Some college or associate's degree 31 18 12 31 19 12 31 18 12
Bachelor's degree or more 26 23 22 26 24 27 27 23 27
LPoverty statusdBelow poverty 15 20 30 14 20 26 14 20 27
At or above poverty 85 80 70 86 80 74 86 80 73
Area of residenceCentral city of MSAe 25 42 48 25 41 46 26 41 42
Outside central city, in MSAe 53 52 46 54 53 49 54 52 51
Outside metropolitan area 22 6 5 21 6 5 21 7 7
Presence of parents1
Two married parents present( 70 82 81 70 82 81 69 81 81
Living with mother only 25 15 15 25 16 16 26 16 16
Living with father only 5 3 4 5 3 3 5 3 4
Presence of adults other than parentsOther relatives only 6 26 37 17 27 30 17 26 31
Nonrelatives only 6 4 5 6 4 5 6 5 5
Both relatives and nonrelatives 1 1 2 1 2 2 1 2 3
No other relatives or nonrelatives 76 68 56 76 67 63 77 68 61
a Native parents means that all of the parents that the child lives with are native born, while foreign-born means that at least one of thechild's parents is foreign-born. Anyone with United States citizenship at birth is considered native, which includes persons born in theU.S., in U.S. outlying areas, and persons born abroad with at least one American parent.
b Beginning with March 2001, data are from the Expanded CPS Sample and use population controls based on Census 2000.
`The percent of all children is of all children under age 18, including those living with no parents and excluding children in group quarters.
d The poverty status groups are derived from the ratio of the family's income to the family's poverty threshold. Below 100 percent ofpoverty refers to children living below the poverty line, 100 percent to 199 percent of poverty refers to children living in low incomehouseholds, and 200 percent of poverty and above refers to children living in medium and high income households. See ECON1.B forthe income levels.
e An MSA is a Metropolitan Statistical Area. The United States Office of Management and Budget (OMB) defines metropolitan areas(MAs) according to published standards that are applied to Census Bureau data. The 1990 standards provide that each newly qualifyingMSA must include at least: 1) one city with 50,000 or more inhabitants, or 2) a Census Bureau-defined urbanized area (of at least 50,000inhabitants) and a total metropolitan population of at least 100,000 (75,000 in New England).
r The category "two married parents" includes children who live with a biological, step, or adoptive parent who is married with his or herspouse present. If a second parent is present and not married to the first parent, then the child is identified as living with a single parent.
SOURCE: U.S. Census Bureau, March Current Population Survey.
Lk riR Appendix A: Detailed Tables II

Table POP5 Difficulty speaking English: Children ages 5 to 17 who speak a language otherwho are reported to have difficulty speaking English°
and region, selected years 1979-99than English at home, andby race, Hispanic origin,
Characteristic 1979 1989 1992 1995b 1999b
Children who speak another language at home
Number (in millions) 3.8 5.3 6.4 6.7 8.8
Percentage 8.5 12.6 14.2 14.1 16.7
Race and Hispanic originWhite, non-Hispanic 3.2 3.5 3.7 3.6 3.9Black, non-Hispanic 1.3 2.4 4.2 3.0 4.5Hispanicc 75.1 71.2 76.6 73.9 70.9Other, non-Hispanicd 44.1 53.4 58.3 45.5 51.0
RegioneNortheast 10.5 13.5 16.2 15.1 17.7Midwest 3.7 4.9 5.6 5.9 7.5South 6.8 10.7 11.1 11.7 14.3West 17.0 24.2 27.2 26.4 28.8
Children who speak another language at home and have difficulty speaking English
Number (in millions) 1.3 1.9 2.2 2.4 2.6
Percentage 2.8 4.4 4.9 5.1 5.0
Race and Hispanic originWhite, non-Hispanic 0.5 0.8 0.6 0.7 1.0Black, non-Hispanic 0.3 0.5 1.3 0.9 1.0Hispanicc 28.7 27.4 29.9 31.0 23.4Other, non-Hispanicd 19.8 20.4 21.0 14.1 11.7
RegioneNortheast 2.9 4.8 5.3 5.0 4.4Midwest 1.1 1.3 1.6 2.3 2.0South 2.2 3.8 3.5 3.4 3.6West 6.5 8.8 10.4 11.4 10.5
a Respondents were asked if the children in the household spoke a language other than English at home and how well they could speakEnglish. Categories used for reporting were "Very well," "Well," "Not well," and "Not at all." All those reported to speak English less than"Very well" were considered to have difficulty speaking English based on an evaluation of the English-speaking ability of a sample of thechildren in the 1980s.
b Numbers in 1995 and after may reflect changes in the Current Population Survey because of newly instituted computer-assistedinterviewing techniques and/or because of the change in the population controls to the 1990 Census-based estimates, with adjustments.
Persons of Hispanic origin may be of any race.
d Most in this category are Asians/Pacific Islanders, but American Indian/Alaska Native children also are included.
e Regions: Northeast includes Connecticut, Maine, Massachusetts, New Hampshire, New Jersey, New York, Pennsylvania, Rhode Island,and Vermont. Midwest includes Illinois, Indiana, Iowa, Kansas, Michigan, Minnesota, Missouri, Nebraska, North Dakota, Ohio, SouthDakota, and Wisconsin. South includes Alabama, Arkansas, Delaware, District of Columbia, Florida, Georgia, Kentucky, Louisiana,Maryland, Mississippi, North Carolina, Oklahoma, South Carolina, Tennessee, Texas, Virginia, and West Virginia. West includes Alaska,Arizona, California, Colorado, Hawaii, Idaho, Montana, Nevada, New Mexico, Oregon, Utah, Washington, and Wyoming.
NOTE: All nonresponses to the language questions are excluded from the tabulations, except in 1999. In 1999, imputations wereinstituted for nonresponse on the language items.
SOURCE: U.S. Census Bureau, October (1992, 1995, and 1999) and November (1979 and 1989) Current Population Surveys. Tabulatedby the National Center for Education Statistics.
80America's Children: Key National Indicators of Well-Being, 2003
94

structure and children's living arrangements: Percentage of children under18 by presence of married parents in household, race, and Hispanic origin,
years 1980-2002
Table POP6 Family
Race, Hispanic origin,
ageselected
and family type 1980 1985 1990 1995 1996 1997 1998 1999 2000 2001° 2002°
Total
Two married parentsb 77 74 73 69 68 68 68 68 69 69 69Mother only` 18 21 22 23 24 24 23 23 22 22 23Father only` 2 2 3 4 4 4 4 4 4 4 5No parent 4 3 3 4 4 4 4 4 4 4 4
White, non-Hispanic
Two married parentsb - 81 78 77 77 76 77 77 78 77Mother only` - 15 16 16 17 16 16 16 16 16Father only` 3 3 4 4 5 4 4 4 4No parent - 2 3 3 3 3 3 3 2 3
Black
Two married parentsb 42 39 38 33 33 35 36 35 38 38 38Mother only` 44 51 51 52 53 52 51 52 49 48 48Father only` 2 3 4 4 4 5 4 4 4 5 5No parent 12 7 8 11 9 8 9 10 9 10 8
Hispanicd
Two married parentsb 75 68 67 63 62 64 64 63 65 65 65Mother only` 20 27 27 28 29 27 27 27 25 25 25Father only` 2 2 3 4 4 4 4 5 4 5 5No parent 3 3 3 4 5 5 5 5 5 6 5
- = not available
a Beginning with March 2001, data are from the expanded Current Population Survey sample and use population controls based onCensus 2000.
b Excludes families where parents are not living as a married couple.
c Because of data limitations, includes some families where both parents are present in the household but living as unmarried partners.
d Persons of Hispanic origin may be of any race.
NOTE: Family structure refers to the presence of biological, adoptive, and stepparents in the child's household. Thus, a child with abiological mother and stepfather living in the household is said to have two married parents.
Two married parents family:In the Current Population Survey, children live in a two-parent family if they are living with a parent who is married with his or herspouse present. This is not an indicator of the biological relationship between the child and the parents. The parent who is identifiedcould be a biological, step, or adoptive parent. If a second parent is present and not married to the first parent, then the child isidentified as living with a single parent.
Single parent family:A "single" parent is defined as a parent who is not currently living with a spouse. Single parents may be married and not living with theirspouse, they may be divorced, widowed, or never married. As with the identification of two-parents described above, if a second parent ispresent and not married to the first, then the child is identified as living with a single parent.
SOURCE: U.S. Census Bureau, Families and Living Arrangements, Current Population Reports, annual reports are available athttp://www.census.gov/population/www/socdemo/hh-fam.html. Detailed tables from 1994 to 1998 are available on the U.S. CensusBureau website at http://www.census.gov/population/www/socdemo/ms-la.html.
95) 111Appendix A: Detailed Tables

Table POP7.A Births to unmarried women: Birth rates for unmarried women by age of mother,selected years 1980-2001
(Live births to unmarried women per 1,000 in specific age group)
Age of mother 1980 1985 1990 1995 1996 1997 1998 1999 2000 2001
Total ages 15-44 29.4 32.8 43.8 44.3 43.8 42.9 43.3 43.3 44.0 43.8
Age group
Ages 15-17 20.6 22.4 29.6 30.1 28.5 27.7 26.5 25.0 23.9 22.0Ages 18-19 39.0 45.9 60.7 66.5 64.9 63.9 63.7 62.4 62.2 60.6Ages 20-24 40.9 46.5 65.1 68.7 68.9 68.9 70.4 70.7 72.1 71.2Ages 25-29 34.0 39.9 56.0 54.3 54.5 53.4 55.4 56.8 58.5 59.5Ages 30-34 21.1 25.2 37.6 38.9 40.1 37.9 38.1 38.1 39.3 40.4Ages 35-39 9.7 11.6 17.3 19.3 19.9 18.7 18.7 19.0 19.7 20.4Ages 40-44 2.6 2.5 3.6 4.7 4.8 4.6 4.6 4.6 5.0 5.3
NOTE: Births to unmarried women were somewhat underreported in Michigan and Texas during the years 1989-93; data since 1994 havebeen reported on a complete basis. Ventura, S.J. and Bachrach, C.A. (2000). Nonmarital childbearing in the United States, 1940-99.National Vital Statistics Reports 48 (16). Hyattsville, MD: National Center for Health Statistics.
SOURCE: Centers for Disease Control and Prevention, National Center for Health Statistics, National Vital Statistics System. Hamilton,B.E., Sutton, P.D., and Ventura, S.J. (2003). Revised birth and fertility rates for the 1990s: United States, and new rates for Hispanicpopulations, 2000 and 2001. National Vital Statistics Reports, 51. (In preparation.) Hyattsville, MD: National Center for Health Statistics.Ventura, S.J., Hamilton, B.E., and Sutton, P.D. (2003). Revised birth and fertility rates for the United States, 2000 and 2001. National VitalStatistics Reports, 51 (4). Hyattsville, MD: National Center for Health Statistics. Ventura, S.J. and Bachrach, C.A. (2000). NonmaritalChildbearing in the United States, 1940-99. National Vital Statistics Reports 48 (16). Hyattsville, MD: National Center for Health Statistics.
Table POP7.B Births to unmarried women: Percentage of all births that are to unmarried womenby age of mother, selected years 1980-2001
Age of mother 1980 1985 1990 1995 1996 1997 1998 1999 2000 2001
All ages 18.4 22.0 28.0 32.2 32.4 32.4 32.8 33.0 33.2 33.5
Age group
Under age 15 88.7 91.8 91.6 93.5 93.8 95.7 96.6 96.5 96.5 96.3Ages 15-17 61.5 70.9 77.7 83.7 84.4 86.7 87.5 87.7 87.7 87.8Ages 18-19 39.8 50.7 61.3 69.8 70.8 72.5 73.6 74.0 74.3 74.6Ages 20-24 19.3 26.3 36.9 44.7 45.6 46.6 47.7 48.5 49.5 50.4Ages 25-29 9.0 12.7 18.0 21.5 22.0 22.0 22.5 22.9 23.5 24.4Ages 30-34 7.4 9.7 13.3 14.7 14.8 14.1 14.0 14.0 14.0 14.3Ages 35-39 9.4 11.2 13.9 15.7 15.7 14.6 14.4 14.4 14.3 14.4Ages 40 and older 12.1 14.0 17.0 18.1 18.4 17.1 16.7 16.5 16.8 17.1
SOURCE: Centers for Disease Control and Prevention, National Center for Health Statistics, National Vital Statistics System. Ventura, S.J.(1995). Births to unmarried mothers: United States, 1980-92. Vital and Health Statistics, Series 21 (53). Hyattsville, MD: National Center forHealth Statistics. Ventura, SJ., Martin, IA., Curtin, S.C., Menacker, F., and Hamilton, B.E. (2001). Births: Final data for 1999. NationalVital Statistics Reports, 49 (1). Hyattsville, MD: National Center for Health Statistics. Ventura, S.J. and Bachrach, C.A. (2000). Nonmaritalchildbearing in the United States, 1940-99. National Vital Statistics Reports, 48 (16). Martin, J.A., Hamilton, B.E., Ventura, S.J., Menacker, F.,and Park, M.M. (2002). Births: Final data for 2000. National Vital Statistics Reports, 50 (5). Hyattsville, MD: National Center for HealthStatistics. Martin, J.A., Hamilton, B.E., Ventura, S.J., Menaker, F., Park, M.M., and Sutton, P.D. (2002). Births: Final Data for 2001.National Vital Statistics Reports, 51 (2). Hyattsville, MD: National Center for Health Statistics.
111 America's Children: Key National Indicators of Well-Being, 2003 .2. 98

Table POP8.A Child care: Percentage of children from birth through age 6, not yet inkindergarten, by type of care arrangement and child and family characteristics,1995 and 2001
CharacteristicParental care
only
Type of nonparental care arrangement
Total innonparental careb
Care in a home°Center-based
program`By a relative By a nonrelative
1995 2001 1995 2001 1995 2001 1995 2001 1995 2001
Total 40 39 60 61 21 23 18 16 31 34
Age/grade in school
Ages 0-2 51 48 50 52 23 23 19 18 12 17
Ages 3-6, not yet in kindergarten 26 26 74 74 19 22 17 14 55 56
Race and ethnicity
White, non-Hispanic 38 38 62 62 18 20 21 19 33 35Black, non-Hispanic 34 26 66 75 31 34 12 14 33 41
Hispanicd 54 53 46 47 23 23 12 12 17 20Other, non-Hispanic 42 35 58 65 25 23 13 15 28 37
Poverty status
Below poverty 50 46 50 54 24 26 10 10 24 27At or above poverty 36 37 64 63 20 22 21 18 33 35
Mother's highest level of educations
Less than high school 62 56 38 44 20 21 7 9 16 21
High school graduate/GED 44 43 56 58 23 26 15 14 26 28Vocational/technical or some college 34 37 66 64 24 25 19 16 34 36College graduate 28 32 72 69 15 17 28 23 43 42
Mother's employment status°
35 hours or more per week 12 15 88 85 33 33 32 26 39 42Less than 35 hours per week 25 29 75 71 30 32 26 20 35 36Looking for work 58 57 42 43 16 16 4 9 25 25Not in the labor force 68 68 32 32 7 6 6 5 22 24
a Relative and nonrelative care can take place in either the child's own home or another home.
b Some children participate in more than one type of nonparental care arrangement. Thus, details do not sum to the total percentage ofchildren in nonparental care.
c Center-based programs include day care centers, prekindergartens, nursery schools, Head Start programs, and other early childhoodeducation programs.
d Persons of Hispanic origin may be of any race.
Children without a mother in the home are excluded from estimates of mother's highest level of education and mother's employmentstatus.
NOTE: Some children participate in more than one type of arrangement, so the sum of all arrangement types exceeds the totalpercentage in nonparental care. Center-based programs include day care centers, prekindergartens, nursery schools, Head Startprograms, and other early childhood education programs. Relative and nonrelative care can take place in either the child's own homeor another home.
SOURCE: U.S. Department of Education, National Center for Education Statistics, National Household Education Survey.
Appendix A: Detailed Tables 13

Table POP8.B Child care: Percentage of preschoolers (children under age 5) of employed mothersby primary child care arrangement, selected years 1985-99
Characteristic 1985 1988 1990 1991 1993 1995 1997 1999
Type of child care (during mother's work hours)
Mother care° 8.1 7.6 6.4 8.7 6.2 5.4 3.3 3.1
Father care° 15.7 15.1 16.5 20.0 15.9 16.6 19.0 18.5Grandparent care 15.9 13.9 14.3 15.8 17.0 15.9 18.3 20.8Other relative careb 8.2 7.2 8.8 7.7 9.0 5.5 7.4 8.0Center-based care` 23.1 25.8 27.5 23.1 29.9 25.1 21.5 22.1
Other nonrelative cared 28.2 28.9 25.1 23.4 21.6 28.5 22.5 20.3Others 0.8 1.6 1.3 1.6 1.1 2.9 8.1 7.3
Below poverty
Mother care° 11.3 9.5 8.1 5.1 4.5 3.1
Father care° 15.0 26.7 16.2 23.3 23.2 15.2Grandparent care - 19.4 16.3 20.0 26.0 24.0 23.9Other relative careb - 11.3 11.4 15.8 5.0 11.6 12.9Center-based care` 21.6 21.1 21.0 29.7 19.9 19.0Other nonrelative cared 21.1 15.1 18.8 18.9 18.4 18.6Othere - 0.3 0.2 0.0 3.4 9.3 7.4
At or above poverty
Mother care° 7.3 8.5 5.9 6.1 3.6 3.0Father care° - 15.1 19.4 16.0 18.1 21.3 19.0Grandparent care 13.4 15.6 16.0 16.8 20.3 20.4Other relative careb 6.8 7.3 8.0 4.8 6.7 7.4Center-based care` 27.8 25.1 32.3 27.8 26.9 22.2Other nonrelative cared 29.6 24.2 21.8 33.0 26.1 20.7Othere 0.0 0.1 0.0 2.8 8.0 7.3- = not available
a Mother and father care includes care while the mother worked.
b Other relatives include aunts, uncles, and cousins.
C Center-based care includes day care centers, nursery schools, and preschools.
d Other nonrelative care includes family day care providers, in-home babysitters, and other nonrelatives providing care in either thechild's or provider's home.
Other includes children in kindergarten/grade school, in a school-based activity, self care, or reported to have no regular arrangement.
NOTE: Data are available for 1985, 1988, 1990, 1991, 1993, 1995, 1997, and 1999. Poverty statistics exclude those with missing data.
SOURCE: U.S. Census Bureau, Survey of Income and Program Participation.
America's Children: Key National Indicators of Well-Being, 2003
t

Table POP8.0 Child care and activities: Percentage of children in kindergarten through 8th gradeby weekday care and before- and after-school activities by grade level, poverty,race, and Hispanic origin, 2001
Care arrangement orgrade level and activity Total Poverty status Race and Hispanic origin°
grade
Belowpoverty
At or abovepoverty
White, Black,non-Hispanic non-Hispanic Hispanic
Other,non-Hispanic
Kindergarten through 3rdCare arrangements
Parental care onlyb 49.5 51.0 49.1 53.4 33.6 52.2 45.3Nonparental careb 50.5 49.0 50.9 46.6 66.4 47.8 54.7Home-based carec 29.9 27.9 30.5 28.2 39.2 30.4 21.7Center-based care 24.4 25.7 24.1 21.6 33.4 21.6 36.4Self care 2.7 2.8 2.6 1.6 5.8 3.0 3.7
Activities
Any activityb 42.7 19.7 49.1 53.6 27.5 22.3 34.5Artsd 14.9 6.4 17.3 17.6 13.2 6.7 16.5Sports 27.1 7.2 32.6 36.1 10.9 12.9 21.5Clubs 2.6 1.4 2.9 3.2 1.5 2.0 0.9Academic activitiese 4.0 1.3 4.7 4.3 3.9 2.8 3.9Community services 3.8 1.0 4.6 5.3 2.0 1.5 1.1
Religious activities 17.8 8.1 20.4 21.5 13.8 10.1 13.4Scouts 13.0 4.0 15.4 18.2 5.5 4.2 6.2
4th through 8th gradeCare arrangements
Parental care onlyb 47.7 43.2 48.8 51.8 34.1 46.1 49.2Nonparental careb 52.3 56.8 51.2 48.2 65.9 53.9 50.8Home-based care' 21.2 25.0 20.2 19.0 28.7 23.6 15.6Center-based care 18.1 22.6 16.9 13.9 28.2 22.2 21.3Self care 24.5 24.6 24.5 23.5 30.4 21.3 24.7
Activities
Any activityb 53.3 28.7 59.3 62.9 35.5 34.8 50.4Artsd 22.9 9.6 26.2 27.1 16.6 11.8 25.1Sports 39.0 15.8 44.7 47.3 24.2 23.4 35.3Clubs 7.5 3.1 8.5 9.1 3.7 4.9 7.2Academic activitiese 9.3 7.1 9.8 8.9 11.6 6.5 12.7Community services 11.4 5.0 12.9 13.5 6.8 7.1 13.1Religious activities 26.5 13.5 29.7 31.7 17.5 17.0 22.0Scouts 9.8 3.3 11.4 13.4 3.5 3.3 6.7
a Persons of Hispanic origin may be of any race.
b Children may have multiple nonparental child care arrangements and be involved in more than one activity; thus the total of the threekinds of nonparental arrangements may not sum to the category, "Nonparental care"; likewise, the seven activities listed may not sum tothe category, "Any activity." Activities include organized programs a child participates in outside of school hours that are not part of abefore- or after-school program.
Home-based care includes care that takes place in a relative's or nonrelative's private home.
d Arts includes activities such as music, dance, and painting.
e Academic activities includes activities such as tutoring or math lab.
SOURCE: U.S. Department of Education, National Center for Education Statistics, National Household Education Survey.
Appendix A: Detailed Tables el

- ' Children's environments: Percentage of children under age 18 living in areasthat do not meet one or more of the Primary National Ambient Air QualityStandards, 1990-2001
1990 1991 1992 1993 1994 1995 1996 1997 1998 1999 2000 2001
One or more standards 28.0 31.9 20.9 24.3 23.6 30.9 19.9 21.9 23.2 24.0 15.5 18.5
Pollutant
Ozone 22.6 25.1 16.9 21.0 19.0 27.7 16.4 18.5 20.7 21.7 13.3 15.0Carbon monoxide 9.5 8.5 6.2 5.1 6.6 5.0 5.7 3.8 4.3 3.7 3.8 0.2Particulate matter 8.0 6.3 9.6 2.7 2.3 10.0 1.5 2.4 2.0 2.1 2.4 3.2Lead 2.2 6.0 1.8 2.1 1.7 1.8 1.6 1.4 1.6 0.2 0.5 1.0
Nitrogen dioxide 3.7 3.7 0.0 0.0 0.0 0.0 0.0 0.0 0.0 0.0 0.0 0.0Sulfur dioxide 0.5 2.1 0.1 0.5 0.1 0.1 0.1 0.1 0.1 0.1 0.1 0.0
NOTE: Percentages are based on the number of children living in counties not meeting a National Ambient Air Quality Standard,divided by the total population.
For more information on the emissions standards that are used in calculating these percentages, please see the following report: Officeof Air Quality Planning and Standards. (2000). National air quality and emissions trends report, 1998. Research Triangle Park, NC: U.S.Environmental Protection Agency.
The standards can also be found at http://www.epa.gov/oar/aqtrnd98/chapter2.pdf.
SOURCE: U.S. Environmental Protection Agency, Office of Air and Radiation, Aerometric Information Retrieval System.
America's Children: Key National Indicators of Well-Being, 2003

levels: Percentage of children ages 4 to 17 with specified bloodby age, race, and ethnicity, 1988-1994 and 1999-2000
Table POP9.B Blood cotininecotinine levels
Characteristic 1988-1994 1999-2000
Children ages 4-17
TotalAny detectable cotinine 87.4 64.2Blood cotinine more than1.0 ng/mL 23.7 17.0
White, non-HispanicAny detectable cotinine 86.7 63.0Blood cotinine more than1.0 ng/mL 24.2 19.8
Black, non-HispanicAny detectable cotinine 94.5 83.1Blood cotinine more than1.0 ng/mL 36.6 22.1
Mexican AmericanAny detectable cotinine 83.5 48.2Blood cotinine more than1.0 ng/ml. 10.7 4.9
Children ages 4-11
TotalAny detectable cotinine 87.7 64.4Blood cotinine more than1.0 ng/mL 25.7 17.7
White, non-HispanicAny detectable cotinine 86.4 62.7Blood cotinine more than1.0 ng/mL 25.9 20.7
Black, non-HispanicAny detectable cotinine 94.5 85.6Blood cotinine more than1.0 ng/mL 37.2 22.9
Mexican AmericanAny detectable cotinine 83.8 48.6Blood cotinine more than1.0 ng/ml. 11.4 4.7
Children ages 12-17
TotalAny detectable cotinine 87.0 63.9Blood cotinine more than1.0 ng/mL 21.1 16.0
White, non-HispanicAny detectable cotinine 87.0 63.3Blood cotinine more than1.0 ng/mL 21.7 18.4
Black, non-HispanicAny detectable cotinine 94.4 79.8Blood cotinine more than1.0 ng/mL 35.9 21.0
Mexican AmericanAny detectable cotinine 83.0 47.5Blood cotinine more than1.0 ng/mL 9.7 5.1
NOTE: "Any detectable cotinine" indicates blood cotinine levels at or above 0.05 nanograms per milliliter (ng/mL), the detectable level ofcotinine in blood. Cotinine levels are reported for nonsmoking children only.
SOURCE: Centers for Disease Control and Prevention, National Center for Health Statistics, National Health and Nutrition Examination Survey.
Table POP9.0 Exposure to secondhand smoke: Percentage of homes with children under age 7where someone smokes regularly, selected years 1994-1999
1994 1996 1999
Children under age 7Percentage 28.7 27.6 19.0
NOTE: Percentages represent households with survey respondent answering "yes" to this question: "Do you allow anyone to smoke in yourhome on a regular basis?"
SOURCE: U.S. Environmental Protection Agency, Office of Air and Radiation, Survey on Radon Awareness and Environmental Tobacco Issues.
Appendix A: Detailed Tables 131

Table ECON 1.A Child poverty: Percentage of related children° under age 18 living below selectedpoverty levels by age, family structure, race, and Hispanic origin, selected years1980-2001
Characteristic 1980 1985 1990 1995 1996 1997 1998 1999b 2000b 20016
Under 100 percent of poverty
Children in all familiesRelated children 18 20 20 20 20 19 18 17 16 16
White, non-Hispanic 12 11 10 11 10 9 9 9Black 42 43 44 42 40 37 36 33 31 30Hispanicc 33 40 38 39 40 36 34 30 28 27
Related children under age 6 20 23 23 24 23 22 21 18 18 18Related children ages 6-17 17 19 18 18 18 18 17 16 15 15
Children in married-couple familiesRelated children 10 10 10 10 9 9 8 8
White, non-Hispanic 7 6 5 5 5 5 5 5Black 18 13 14 13 12 11 9 10Hispanic' 27 28 29 26 23 22 21 20
Related children under age 6 12 11 12 11 10 9 9 9Related children ages 6-17 10 9 9 9 9 8 8 7
Children in female-householder families, no husband presentRelated children 51 54 53 50 49 49 46 42 40 39
White, non-Hispanic - 40 34 35 37 33 29 28 29Black 65 67 65 62 58 55 55 52 49 47Hispanicc 65 72 68 66 67 63 60 52 50 49
Related children under age 6 65 66 66 62 59 59 55 51 50 49Related children ages 6-17 46 48 47 45 45 45 42 39 36 35
All childrend 18 21 21 21 21 20 19 17 16 16
Under 50 percent of poverty
Children in all familiesRelated children 7 8 8 8 8 8 8 6 6 7
White, non-Hispanic - - 4 3 4 4 4 3 3 3Black 17 22 22 20 20 20 17 15 15 16Hispanicc 14 16 14 16 13 11 9 10
Under 150 percent of poverty
Children in all familiesRelated children 29 32 31 32 31 30 29 28 26 27
White, non-Hispanic 21 19 19 19 18 17 16 17Black 57 59 57 56 56 51 52 48 45 46Hispanicc 55 59 57 56 52 49 47 46
= not available
a A related child is a person under age 18 who is related to the householder by birth, marriage, or adoption, but is not the householderor the householder's spouse.b Data for 1999, 2000, and 2001 use Census 2000 population controls. Data for 2000 and 2001 are from the expanded CPS sample.c Persons of Hispanic origin may be of any race.
d Includes children not related to the householder.
NOTE: Unless otherwise noted, estimates refer to children under age 18 who are related to the householder. The poverty level is basedon money income and does not include noncash benefits, such as food stamps. Poverty thresholds reflect family size and compositionand are adjusted each year using the annual average Consumer Price Index level. The average poverty threshold for a family of four was$18,104 in 2001. The levels shown here are derived from the ratio of the family's income to the family's poverty threshold. For moredetail, see U.S. Census Bureau, Series P-60, No. 219.
SOURCE: U.S. Census Bureau, Current Population Survey, Annual Demographic Supplement Current Population Reports, Consumerincome, Series P-60, various years.
America's Children: Key National Indicators of Well-Being, 2003 2

Table ECON 1.B Income distribution: Percentage of related children under age 18 by familyincome relative to the poverty line, selected years 1980-2001
Poverty level 1980 1985 1990 1995 1996 1997 1998 1999° 2000° 2001°
Extreme poverty 6.6 8.1 8.3 7.9 8.4 8.5 7.6 6.5 6.3 6.6Below poverty,
but above extreme poverty11.3 12.0 11.6 12.2 11.4 10.8 10.7 10.1 9.4 9.1
Low income 24.0 22.8 21.8 22.5 22.7 21.4 21.2 21.9 21.3 21.9Medium income 41.4 37.7 37.0 34.5 34.0 34.4 33.5 32.8 34.0 33.2High income 16.8 19.4 21.3 22.8 23.5 25.0 27.0 28.7 29.0 29.2Very high income 4.3 6.1 7.4 8.9 9.2 10.1 11.2 12.3 12.6 12.9
a Data for 1999, 2000, and 2001 use Census 2000 population controls. Data for 2000 and 2001 are from the expanded CPS sample.
NOTE: Unless otherwise noted, estimates refer to children under age 18 who are related to the householder. The income classes arederived from the ratio of the family's income to the family's poverty threshold. Extreme poverty is less than 50 percent of the povertythreshold (i.e., $9,052 for a family of four in 2001). Poverty is between 50 and 99 percent of the poverty threshold (i.e., between $9,052and $18,103 for a family of four in 2001). Low income is between 100 and 199 percent of the poverty threshold (i.e., between $18,104and $36,207 for a family of four 2001). Medium income is between 200 and 399 percent of the poverty threshold (i.e., between $36,208and $72,415 for a family of four in 2001). High income is 400 percent of the poverty threshold or more(i.e., $72,416 or more for a familyof four in 2001). Very high income is 600 percent of the poverty threshold and over (i.e., $108,624 or more for a family of four in 2001).[These income categories are similar to those used in the Economic report for the President (1998). A similar approach is found inHernandez, D. J. (1993). America's children: Resources from family, government, and the economy. New York: Russell Sage Foundation for theNational Committee for Research on the 1980 Census, except that Hernandez uses the relationship to median income to define hiscategories. The medium and high income categories are similar for either method.]
SOURCE: U.S. Census Bureau, Current Population Survey, Annual Demographic Supplement.
The Measurement of Poverty
The measurement of poverty used in this report is the official poverty measure used by the U.S. Census Bureau. A child is living belowpoverty if the child lives in a family with before-tax cash income below a defined level of need, called the poverty line. The official povertyline in use today was devised in the early 1960s based on the minimum cost of what was considered to be a nutritionally adequate diet. As
originally defined, the poverty index signified the inability of families to afford the basic necessities of living, based on the budget andspending patterns of those Americans with an average standard of living. Since then, the poverty line has been updated annually forinflation using the Consumer Price Index for all urban consumers. The poverty line depends on the size of the family and the number ofchildren in the family.
A 1995 report by the National Research Councils recommended changing the definition of both the poverty thresholds and theresources that are used to measure poverty. Its recommendations included the following:
Defining income: On the one hand, the definition of family income should be expanded to include other important resources ofpurchasing power, such as the earned income tax credit, food stamps, and housing subsidies. On the other hand, some necessaryexpenditures that reduce a family's resources available for basic consumption needs should be subtracted from income, such astaxes, necessary child care and other work-related expenditures, child support payments, and out-of-pocket medical expenditures.
Setting a threshold: Poverty thresholds should be adjusted to provide a more accurate measure of family income requirements.First, the consumption bundle used to derive thresholds should be based on food, clothing, and shelter, not food consumptionalone. Second, thresholds should reflect regional variations in housing costs. Third, thresholds should be adjusted for family sizein a more consistent way than is currently done. Finally, thresholds should be updated to reflect changes in expenditure patternsover time.
Recent U.S. Census Bureau reports2 used key elements of the National Research Council proposal to estimate alternative poverty ratesfrom 1990 to 1997. These estimates produced increases in child poverty from 1990 to 1993 similar to, and decreases in poverty from 1993to 1997 somewhat larger than, those under the official measure. These changes reflect that the new measure more completely accountsfor in-kind transfers, such as food stamps and housing benefits, and for work-related expenditures. As a result, the new measure tends todecrease the relative poverty rate of children who are more likely to live in families that receive in-kind transfers and to increase therelative poverty rate of children living with employed low-income persons with higher work-related expenses.
I Citro, C.F. and Michael, R.T. (Eds.). (1995). Measuring poverty: A new approach. Washington, DC: National Academy Press.
2 U.S. Census Bureau. (1999). Experimental poverty measures: 1990-1997. Current Population Reports, Series P-60-205. Short, K. (2001).Experimental Poverty Measures: 1999. Current Population Reports, Series P-60-216. Washington, DC: U.S. Census Bureau.
103Appendix A: Detailed Tables gm

Table ECON2 Secure parental employment: Percentage of children under age 18 living with atleast one parent employed full time all year° by family structure, race, Hispanicorigin, poverty status, and age, selected years 1980-2001
Characteristic 1980 1985 1990 1995 1996 1997 1998 1999 2000 2001
All children living with parent(s)b
Total 70 70 72 74 75 76 77 79 80 79
Race and Hispanic originWhite, non-Hispanic 75 77 79 81 82 82 84 84 85 84Black, non-Hispanic 50 48 50 54 56 58 58 64 66 65Hispanic` 59 55 60 61 64 67 68 71 72 73
Poverty statusBelow poverty 21 20 22 25 25 26 31 31 34 32At or above poverty 81 82 85 86 87 88 87 88 88 87
AgeChildren under 6 67 67 68 69 71 72 74 76 76 76Children ages 6-17 72 72 74 76 77 78 79 80 81 80
Children living in families maintained by two married parents
Total 80 81 85 87 88 88 89 90 90 89
Race and Hispanic originWhite, non-Hispanic 81 83 86 89 90 91 91 91 92 91Black, non-Hispanic 73 76 84 85 87 85 86 88 90 89Hispanic` 71 70 74 77 79 80 82 83 85 84
Poverty statusBelow poverty 38 37 44 46 48 48 56 52 58 54At or above poverty 84 87 89 91 92 92 92 93 93 92
AgeChildren under 6 76 79 83 86 87 87 88 89 89 88Children ages 6-17 81 82 85 87 88 89 89 90 91 90
With both parents workingfull time all year
17 20 25 28 30 31 31 32 33 32
Children living in families maintained by single mothersd
Total 33 32 33 38 39 41 44 47 49 48
Race and Hispanic originWhite, non-Hispanic 39 39 40 46 47 46 52 52 53 52Black, non-Hispanic 28 25 27 33 35 39 39 46 49 48Hispanic` 22 22 24 27 27 34 36 39 38 42
Poverty statusBelow poverty 7 7 9 14 10 13 17 18 20 19At or above poverty 59 59 60 61 64 66 66 66 67 67
AgeChildren under 6 20 20 21 24 27 28 31 35 36 38Children ages 6-17 38 37 40 45 45 47 50 52 55 53
90America's Children: Key National Indicators of Well-Being, 2003
1O4

Table ECON2 (cont.)
Characteristic
Secure parental employment: Percentage of children under age 18 living with atleast one parent employed full time all year° by family structure, race, Hispanicorigin, poverty status, and age, selected years 1980-2001
1980 1985 1990 1995 1996 1997 1998 1999 2000 2001b
Children living in families maintained by single fathersd
Total 57 60 64 67 67 70 70 70 68 69
Race and Hispanic originWhite, non-Hispanic 61 62 68 72 69 72 72 76 74 71
Black, non-Hispanic 41 59 53 64 60 67 66 51 52 58Hispanics 53 53 59 58 66 68 69 65 68 72
Poverty statusBelow poverty 15 23 21 24 30 29 34 28 21 29
At or above poverty 68 69 74 79 77 80 79 79 79 78
AgeChildren under 6 48 57 58 54 61 62 65 66 65 67Children ages 6-17 59 62 67 74 70 74 72 71 70 70
a Full-time, all-year employment is defined as usually working full time (35 hours or more per week) for 50 to 52 weeks.
b Total children living with parent(s)(in thousands) 60,683 61,264 63,351 68,090 68,275 68,408 68,814 69,118 69,126 69,514
Total living with relatives but not with parent(s)(in thousands) 1,954 1,379 1,455 2,160 2,016 2,137 2,159 2,187 2,212 2,002
c Persons of Hispanic origin may be of any race.
d Includes some families where both parents are present in the household, but living as unmarried partners.
SOURCE: U.S. Bureau of Labor Statistics, March Current Population Survey.
O5Appendix A: Detailed Tables 111
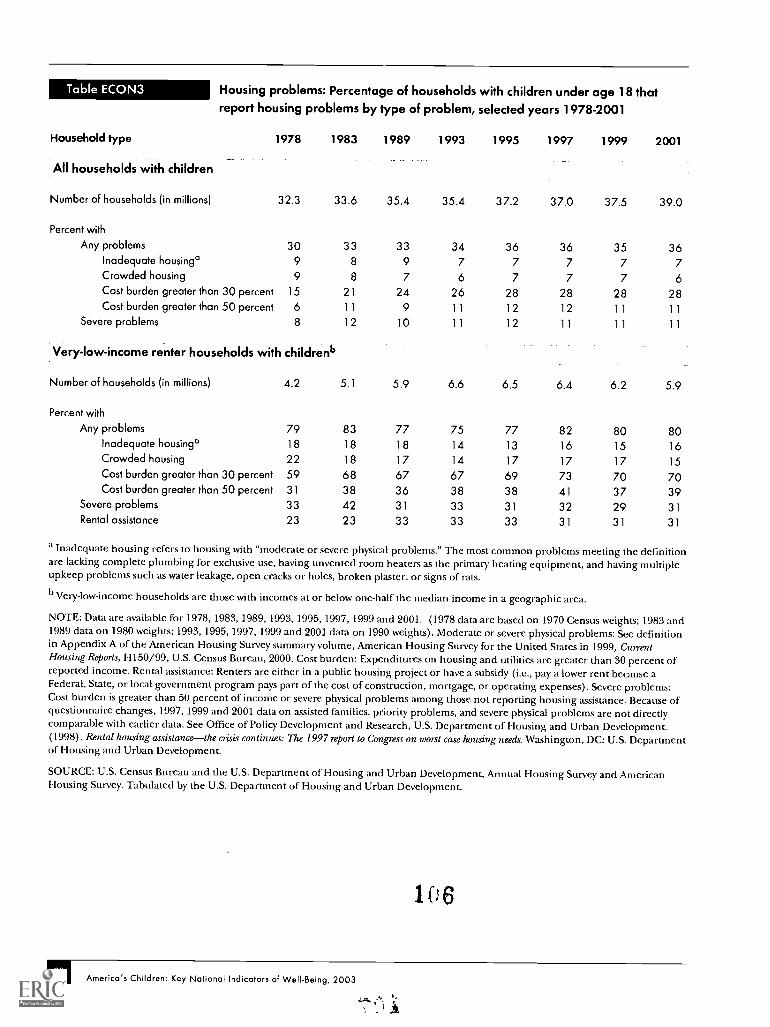
Table ECON3 Housing problems: Percentage of households with children under age 18 thatreport housing problems by type of problem, selected years 1978-2001
Household type 1978 1983 1989 1993 1995 1997 1999 2001
All households with children
Number of households (in millions) 32.3 33.6 35.4 35.4 37.2 37.0 37.5 39.0
Percent with
Any problems 30 33 33 34 36 36 35 36Inadequate housing° 9 8 9 7 7 7 7 7Crowded housing 9 8 7 6 7 7 7 6Cost burden greater than 30 percent 15 21 24 26 28 28 28 28Cost burden greater than 50 percent 6 11 9 11 12 12 11 11
Severe problems 8 12 10 11 12 11 11 11
Very-low-income renter households with childrenb
Number of households (in millions) 4.2 5.1 5.9 6.6 6.5 6.4 6.2 5.9
Percent with
Any problems 79 83 77 75 77 82 80 80Inadequate housing° 18 18 18 14 13 16 15 16Crowded housing 22 18 17 14 17 17 17 15Cost burden greater than 30 percent 59 68 67 67 69 73 70 70Cost burden greater than 50 percent 31 38 36 38 38 41 37 39
Severe problems 33 42 31 33 31 32 29 31Rental assistance 23 23 33 33 33 31 31 31
a Inadequate housing refers to housing with "moderate or severe physical problems." The most common problems meeting the definitionare lacking complete plumbing for exclusive use, having unvented room heaters as the primary heating equipment, and having multipleupkeep problems such as water leakage, open cracks or holes, broken plaster, or signs of rats.
b Very-low-income households are those with incomes at or below one-half the median income in a geographic area.
NOTE: Data are available for 1978, 1983, 1989, 1993, 1995, 1997, 1999 and 2001. (1978 data are based on 1970 Census weights; 1983 and1989 data on 1980 weights; 1993, 1995, 1997, 1999 and 2001 data on 1990 weights). Moderate or severe physical problems: See definitionin Appendix A of the American Housing Survey summary volume, American Housing Survey for the United States in 1999, CurrentHousing Reports, H150/99, U.S. Census Bureau, 2000. Cost burden: Expenditures on housing and utilities are greater than 30 percent ofreported income. Rental assistance: Renters are either in a public housing project or have a subsidy (i.e., pay a lower rent because aFederal, State, or local government program pays part of the cost of construction, mortgage, or operating expenses). Severe problems:Cost burden is greater than 50 percent of income or severe physical problems among those not reporting housing assistance. Because ofquestionnaire changes, 1997, 1999 and 2001 data on assisted families, priority problems, and severe physical problems are not directlycomparable with earlier data. See Office of Policy Development and Research, U.S. Department of Housing and Urban Development.(1998). Rental housing assistancethe crisis continues: The 1997 report to Congress on worst case housing needs. Washington, DC: U.S. Departmentof Housing and Urban Development.
SOURCE: U.S. Census Bureau and the U.S. Department of Housing and Urban Development, Annual Housing Survey and AmericanHousing Survey. Tabulated by the U.S. Department of Housing and Urban Development.
106
IIAmerica's Children: Key National Indicators of Well-Being, 2003

Table ECON4.A Food security: Percentage of children under age 18 in food-insecure householdsby poverty status and presence of hunger, selected years 1995-2001
Characteristic 1995° 1998 1999 2000 200lb
All children
In food-insecure households 19.4 19.7 16.9 18.0 17.6
Food insecure with hunger, any member 6.1 4.7 3.8 4.1 4.1
Food insecure with hunger, adult only 4.8 3.7 3.1 3.3 3.5
Food insecure with hunger, adult and child 1.3 1.0 0.7 0.8 0.6
Below poverty
In food-insecure households 44.4 48.7 44.0 47.2 45.9
Food insecure with hunger, any member 15.6 14.2 11.8 11.9 12.9
Food insecure with hunger, adult only 12.2 11.2 9.6 9.7 10.3
Food insecure with hunger, adult and child 3.4 3.0 2.2 2.2 2.6
At or above poverty
In food-insecure households 11.2 12.6 10.5 11.5 11.5
Food insecure with hunger, any member 3.0 2.3 1.9 2.1 2.2
Food insecure with hunger, adult only 2.4 1.8 1.5 1.6 1.9
Food insecure with hunger, adult and child 0.6 0.5 0.4 0.5 0.3
Data for 1995 are not precisely comparable to more recent years, due to a change in the method of screening CPS sample householdsinto the Food Security Supplement. However, the effect on 1995 statistics (a slight downward bias) is perceptible only for the broadestcategory of household food insecurity identified, "In food-insecure households."
b Food insecurity and hunger statistics should be compared across 2-year, 4-year, or 6-year periods to avoid seasonal effects that resultfrom year-to-year alternation in the month in which the survey was conducted.
NOTE: The food security measure (ECON4.A) is based on data collected annually in the Food Security Supplement to the CurrentPopulation Survey (CPS). The most severe level reported is based on the Children's Food Security Scale, while the less severe levels arebased on the broader Household Food Security Scale. The three levels of severity reported are nested, in the sense that householdsexperiencing more severe levels of insecurity are subsets of those households that experience less severe levels. The dividing lines, ordesignated thresholds, between the successive categories reflect a consensus judgment of an expert working group on food securitymeasurement. For detailed explanations, see Food and Nutrition Service (2000). Guide to Measuring Household Food Security, Revised 2000.Alexandria, VA: Food and Nutrition Service; Economic Research Service (2002). Measuring Children's Food Security in U.S. households,1995-99. Washington, DC: Economic Research Service; and Economic Research Service (2002). Household food security in the United Slates,2001. Washington, DC: Economic Research Service.
SOURCE: United States Department of Agriculture, Food and Nutrition Service and Economic Research Service (ERS). Tabulated byERS.
1 017
Appendix A: Detailed Tables El

Table ECON4.B Diet quality: Percentage of children ages 2 to 18 by age and diet quality asEating Index, 1989-90, 1994-96, 1999-2000measured by the Healthy
Characteristic Ages 2-6 Ages 7-12 Ages 13-18
1989-90Good diet 20 11 5Needs improvement 74 82 72Poor diet 6 7 23
1994-96Good diet 20 9 5Needs improvement 70 75 69Poor diet 10 16 27
1999-2000Good diet 20 8 4Needs improvement 74 79 77Poor diet 6 13 19
NOTE: A Healthy Eating Index (HEI) score above 80 implies a good diet, an HEI score between 51 and 80 implies a diet that needsimprovement, and an HEI score less than 51 implies a poor diet. See Table ECON4.D for a description of the HEI and average scores byage.Data for the three time periods are not necessarily comparable because of methodological differences in data collection.
SOURCE: U.S. Department of Agriculture, 1989-90, and1994-96, Continuing Survey of Food Intakes by Individuals, and Centers forDisease Control and Prevention, 1999-2000 National Health and Nutrition Examination Survey.
Table ECON4.0 Diet quality: Percentage of children ages 2 to 18 by age and diet quality asEating Index, 1989-90, 1994-96, 1999-2000
Ages 7-12 Ages 13-18Characteristic
1989-90At or below poverty
measured by the Healthy
Ages 2-6
Good diet 9 11 3Needs improvement 74 75 72Poor diet 17 15 25
Above povertyGood diet 23 11 5Needs improvement 74 83 72Poor diet 3 5 23
1994-96At or below poverty
Good diet 16 7 3Needs improvement 72 74 66Poor diet 12 19 31
Above povertyGood diet 29 10 5Needs improvement 66 75 69Poor diet 9 15 26
1999-2000At or below poverty
Good diet 17 7 3
Needs improvement 78 75 78Poor diet 5 18 19
Above povertyGood diet 22 8 4Needs improvement 72 81 76Poor diet 6 11 20
NOTE: A Healthy Eating Index (HEI) score above 80 implies a good diet, an HEI score between 51 and 80 implies a diet that needsimprovement, and an HEI score less than 51 implies a poor diet. See Table ECON4.D for a description of the HEI and average scores byage.Data for the three time periods are not necessarily comparable because of methodological differences in data collection.
SOURCE: U.S. Department of Agriculture, 1989-90 and 1994-96, Continuing Survey of Food Intakes by Individuals, and Centers forDisease Control and Prevention, 1999-2000 National Health and Nutrition Examination Survey.
America's Children: Key National Indicators of Well-Being, 2003

Table ECON4.D
Component
Healthy Eating Index: Overall and component mean scores and percentages forchildren ages 2 to 18, 1989-90, 1994-96, 1999-2000
1989-90 1994-96 1999-2000
Ages Ages Ages2-6 7-12 13-18 2-6 7-12 13-18 2-6 7-12 13-18
HEI scoreOverall 70.2 66.6 59.2 69.4 64.6 59.9 70.3 64.1 61.0
1. Grains 7.6 7.0 6.3 7.7 7.5 6.9 8.0 7.5 6.8
2. Vegetables 5.2 5.0 5.6 5.3 5.2 5.9 5.6 4.8 5.3
3. Fruits 6.2 4.6 3.1 6.0 4.1 3.2 5.8 3.7 3.1
4. Milk 8.6 8.3 6.7 7.3 7.1 5.3 7.3 6.9 7.5
5. Meat 6.6 7.0 7.1 5.7 5.7 6.3 5.4 5.5 6.0
6. Total fat 6.7 6.9 6.1 7.3 7.1 7.0 7.3 7.2 7.1
7. Saturated fat 3.7 4.2 4.0 5.5 5.7 6.2 5.8 6.2 6.2
8. Cholesterol 9.4 8.7 8.1 9.0 8.6 7.6 9.0 8.6 8.1
9. Sodium 9.1 7.3 5.8 8.4 6.6 5.6 8.0 6.4 5.7
10. Variety 7.2 7.7 6.5 7.3 7.1 6.0 8.1 7.5 7.2
Percentage of children meeting the dietary recommendations for each component1. Grains 25.6 11.3 15.2
2. Vegetables
3. Fruits
4. Milk
5. Meat
6. Total fat
7. Saturated fat
8. Cholesterol
9. Sodium
10. Variety
7.0
33.0
59.6
14.1
17.9
9.9
87.1
59.8
30.3
7.7
11.0
50.4
20.0
16.8
5.9
75.9
26.3
39.5
11.9
6.5
28.4
25.3
11.6
9.0
70.2
23.4
25.6
37.4
21.8
39.7
43.5
19.4
38.6
27.8
82.9
57.3
42.3
27.8
20.5
16.0
40.2
17.3
33.9
28.0
78.6
31.0
39.2
24.9
28.6
11.8
20.4
27.7
37.0
37.1
68.6
28.6
30.1
41.4
29.1
35.9
42.5
16.7
38.7
34.0
83.3
51.5
57.3
35.4
18.2
12.9
37.2
17.9
36.5
34.8
79.3
30.0
49.3
27.5
22.3
12.9
25.9
24.1
37.8
34.1
73.9
31.1
45.0
NOTE: The Healthy Eating Index (HEI) examines the diet of all Americans. The Index consists of 10 components, each representingdifferent aspects of a healthful diet. Components 1 to 5 measure the degree to which a person's diet conforms to the U.S. Department ofAgriculture's Food Guide Pyramid serving recommendations for the five major food groups: grains (bread, cereal, rice, and pasta),vegetables, fruits, milk (milk, yogurt, and cheese), and meat/meat alternatives (meat, poultry, fish, dry beans, eggs, and nuts).Component 6 measures total fat consumption as a percentage of total food energy (calorie) intake. Component 7 measures saturated fatconsumption as a percentage of total food energy intake. Components 8 and 9 measure total cholesterol intake and total sodium intake,respectively. Component 10 measures the degree of variety in a person's diet. Each component of the Index has a maximum score of 10and a minimum score of 0. Intermediate scores are computed proportionately. High component scores indicate intakes close torecommended ranges or amounts. The maximum combined score for the 10 components is 100. An HEI score above 80 implies a gooddiet, an HEI score between 51 and 80 implies a diet that needs improvement, and an HEI score less than 51 implies a poor diet. Data forthe three time periods are not necessarily comparable because of methodological differences in data collection.
SOURCE: U.S. Department of Agriculture, 1989-90 and 1994-96, Center for Nutrition Policy and Promotion, Continuing Survey of FoodIntakes by Individuals, and Centers for Disease Control and Prevention, 1999-2000 National Health and Nutrition Examination Survey.
1 0 9
Appendix A: Detailed Tables 12

Table ECON5.A Access to health care: Percentage of children under age 18 covered by healthinsurance° by type of health insurance, age, race, and Hispanic origin, 1987-2001
Characteristic 1987 1990 1991 1992 1993 1994 1995 1996 1997 1998 19996 20006 20016
All health insurance
Total 87 87 87 87 86 86 86 85 85 85 87 88 88
Age
Ages 0-5 88 89 89 89 88 86 87 86 86 84 87 89 89Ages 6-11 87 87 88 88 87 87 87 85 86 85 88 89 89Ages 12-17 86 85 85 85 83 85 86 84 83 84 87 88 87
Race and Hispanic origin
White, non-Hispanic 90 90 90 90 89 89 90 89 89 89 92 93 93Black 83 85 85 86 84 83 85 81 81 80 84 86 86Hispanicc 72 72 73 75 74 72 73 71 71 70 74 75 76
Private health insurance
Total 74 71 70 69 67 66 66 66 67 68 70 70 68
Age
Ages 0-5 72 68 66 65 63 60 60 62 63 64 66 66 64Ages 6-11 74 73 71 71 70 67 67 67 68 68 70 70 69Ages 12-17 75 73 72 71 69 70 71 70 69 70 73 73 72
Race and Hispanic origin
White, non-Hispanic 83 81 80 80 78 77 78 78 78 79 81 81 80Black 49 49 45 46 46 43 44 45 48 47 52 53 52Hispanicc 48 45 43 42 42 38 38 40 42 43 46 45 44
Government health insuranced
Total 19 22 24 25 27 26 26 25 23 23 23 24 26
Age
Ages 0-5 22 28 30 33 35 33 33 31 29 27 27 29 31Ages 6-11 19 20 22 23 25 25 26 25 23 23 23 25 26Ages 12-17 16 18 19 19 20 20 21 19 19 19 19 20 20
Race and Hispanic origin
White, non-Hispanic 12 15 16 17 19 18 18 18 17 16 16 17 19Black 42 45 48 49 50 48 49 45 40 42 40 42 42Hispanicc 28 32 37 38 41 38 39 35 34 31 33 35 37
a Children are considered to be covered by health insurance if they had government or private coverage at any time during the year.Some children are covered by both types of insurance; hence, the sum of government and private is greater than the total.b Estimates beginning in 1999 include follow-up questions to verify health insurance status and use the Census 2000-based weights.Estimates for 1999 through 2001 are not directly comparable with earlieryears, before the verification questions were added.
c Persons of Hispanic origin may be of any race.
d Government health insurance for children consists mostly of Medicaid, but also includes Medicare, the State Children's HealthInsurance Programs (SCHIP), and Civilian Health and Medical Care Program of the Uniformed Services (CHAMPUS/Tricare).
SOURCE: U.S. Census Bureau, unpublished tables based on analyses from the March Current PopulationSurvey.
96America's Children: Key National Indicators of Well-Being, 2003

Table ECON5.B Usual source of care: Percentage of children under age 18 with no usual source ofhealth care° by age, type of health insurance, and poverty status, 1993-2001
Characteristic 1993 1994 1995 1996 1997b 199E3 19996 2000b 20016
[Children ages 0-17
Total 8.0 6.8 6.3 6.3 6.9 6.5 6.7 7.0 5.8
Type of insurance
Private insurance` 3.9 3.4 3.0 3.0 3.3 2.9 3.3 3.4 2.4
Public insurance" 10.8 6.3 6.6 6.0 5.2 5.8 5.9 4.8 5.4No insurance 24.3 21.7 22.1 23.2 27.6 28.0 28.5 29.7 28.0
Poverty status
Below poverty 15.2 11.0 10.4 10.0 12.8 11.6 13.3 12.1 11.7At or above poverty 5.5 5.4 4.9 5.0 5.4 5.2 5.1 5.8 4.0
[Children ages 0-4
Total 5.2 4.4 4.2 4.2 4.2 4.0 4.2 4.5 4.0
Type of insurance
Private insurance` 1.8 1.7 1.3 1.5 2.0 1.5 1.9 2.2 1.3
Public insurance" 7.3 4.1 5.0 4.0 3.7 3.4 4.0 3.2 4.6No insurance 18.6 16.1 17.2 18.7 16.6 20.5 20.5 18.8 23.1
Poverty status
Below poverty 10.8 6.8 7.4 6.0 7.2 6.9 8.6 8.4 8.7At or above poverty 3.1 3.5 3.0 3.4 3.0 3.1 3.5 4.1 2.6
[Children ages 5-17
Total 9.2 7.9 7.1 7.2 8.0 7.4 7.7 7.9 6.4
Type of insurance
Private insurance` 4.7 4.0 3.6 3.5 3.8 3.4 3.8 3.8 2.8Public insurance" 13.3 7.8 7.8 7.4 6.2 7.3 6.9 5.7 5.7No insurance 26.2 23.7 23.8 24.6 31.2 30.4 31.0 33.5 29.4
Poverty status
Below poverty 17.6 13.0 11.8 11.9 15.4 13.8 15.3 13.6 13.0At or above poverty 6.4 6.2 5.7 5.5 6.3 5.9 5.7 6.4 4.5
a Excludes emergency rooms as a usual source of care.
b In 1997, the National Health Interview Survey was redesigned. Data for 1997-2001 are not strictly comparable with earlier data.
Children with both public and private insurance coverage are placed in the private insurance category.
d As defined here, public health insurance for children consists mostly of Medicaid or other public assistance programs, including Stateplans. Beginning in 1999, the public health insurance category also includes the Children's Health Insurance Program (CHIP). It doesnot include children with only Medicare or the Civilian Health and Medical Care Program of the Uniformed Services(CHAMPUS/CHAMP-VA/Tricare).
SOURCE: Centers for Disease Control and Prevention, National Center for Health Statistics, National Health Interview Survey.
Appendix A: Detailed Tables97

health status: Percentage of children under age 18 in very good or excellentage, poverty status, race, and Hispanic origin, selected years 1984-2001
Table HEALTH1 General
health by
Age and poverty status 1984 1985 1990 1995 1996 1997° 1998° 1999° 2000° 2001
Children ages 0-17
Total 78 79 81 80 81 82 83 83 82 83
Poverty status
Below poverty 62 64 66 65 66 68 70 71 70 71
At or above poverty 83 84 84 84 85 86 87 86 85 86
Race and Hispanic origin
White, non-Hispanic 82 84 85 85 85 87 88 87 86 87Black, non-Hispanic 65 66 69 71 74 73 74 74 74 74Hispanicb 66 68 75 69 69 73 74 77 75 77
Children ages 0-4
Total 79 80 81 81 81 84 85 85 85 85
Poverty status
Below poverty 66 69 70 67 69 74 76 73 74 74At or above poverty 84 85 85 85 85 88 89 88 88 88
Race and Hispanic origin
White, non-Hispanic 83 86 85 86 86 89 90 89 89 89Black, non-Hispanic 66 67 72 72 75 77 77 78 77 78Hispanicb 70 69 75 70 69 75 77 78 77 80
Children ages 5-17
Total 77 78 80 80 81 81 82 82 81 82
Poverty status
Below poverty 60 62 64 64 65 65 67 70 68 70At or above poverty 82 83 84 84 85 86 87 86 84 86
Race and Hispanic originWhite, non-Hispanic 82 83 84 85 85 86 87 86 85 87Black, non-Hispanic 65 66 67 70 73 71 72 73 73 72Hispanicb 65 67 75 69 69 72 73 76 74 76
a In 1997, the National Health Interview Survey was redesigned. Data for 1997-2001 are not strictly comparable with earlier data.
b Persons of Hispanic origin may be of any race.
SOURCE: Centers for Disease Control and Prevention, National Center for Health Statistics, National Health Interview Survey.
IIAmerica's Children: Key National Indicators of Well-Being, 2003
112
T

Table HEALTH2 Activity limitation: Percentage of children ages 5 to 17 with limitation in activityresulting from chronic conditions° by age, gender, poverty status, race andHispanic originb, selected years 1997-2001
Characteristic Total Male Female
1997 1999 2000 2001 1997 1999 2000 2001 1997 1999 2000 2001
Children ages 5-17Total 7.8 7.0 7.0 8.0 10.0 8.8 8.9 10.4 5.5 5.2 5.1 5.5
Special education only` 5.4 5.3 5.1 6.2 7.2 6.8 6.5 8.2 3.5 3.8 3.6 4.0
Other limitationsd 2.4 1.7 2.0 1.8 2.8 2.0 2.4 2.2 2.0 1.4 1.5 1.5
Poverty status
Below poverty 10.8 10.7 10.5 12.0 13.4 13.5 12.2 14.8 8.3 7.8 8.7 9.2
Special education only` 7.2 7.6 7.8 9.2 9.4 9.7 9.2 11.6 4.9 5.5 6.3 6.9
Other limitationsd 3.7 3.0 2.7 2.8 4.0 3.8 3.0 3.2 3.3 2.2 2.4 2.3
At or above poverty 7.6 7.1 7.1 8.2 9.8 9.1 9.3 10.8 5.2 5.1 4.9 5.5Special education only` 5.4 5.6 5.1 6.3 7.2 7.3 6.8 8.5 3.4 3.9 3.5 4.0Other limitationsd 2.2 1.5 2.0 1.8 2.6 1.8 2.5 2.2 1.8 1.2 1.5 1.5
Race or Hispanic originWhite, non-Hispanic 8.3 7.5 7.5 8.5 10.7 9.1 9.4 11.1 5.8 5.8 5.5 5.8
Special education only` 5.8 5.7 5.4 6.6 7.7 7.2 6.9 8.8 3.8 4.2 3.9 4.1
Other limitationsd 2.5 1.8 2.1 2.0 3.0 1.9 2.5 2.2 2.0 1.6 1.6 1.7
Black, non-Hispanic 8.4 7.0 7.8 9.3 10.6 9.6 10.2 11.8 6.1 4.4 5.4 6.7Special education only` 5.5 4.9 5.8 7.3 7.2 6.7 7.8 9.3 3.7 3.2 3.9 5.2
Other limitationsd 2.9 2.1 2.0 2.0 3.4 2.9 2.5 2.5 2.5 1.3 1.5 1.5
Hispanicb 5.9 5.7 5.3 5.5 7.6 7.1 6.6 7.1 4.2 4.2 3.9 3.9
Special education only` 4.0 4.5 3.7 4.3 5.4 5.8 4.7 5.7 2.5 3.1 2.6 2.8
Other limitationsd 1.9 1.2 1.6 1.2 2.1 1.3 1.9 1.4 1.7 1.1 1.3 1.1
a Chronic conditions usually have a duration of more than 3 months.
b Persons of Hispanic origin may be of any race.
Special education is provided under the Individuals with Disabilities Education Act (IDEA). Special education services are designed tomeet the individual needs of the child, and may take place in a regular classroom setting, a separate classroom, a special school, a privateschool, at home, or at a hospital. To be eligible for special education services, children must have a condition that adversely affects theireducational performance.
d Other limitations include limitations in ability to walk, care for themselves, or any other activities.
NOTE: The prevalence of activity limitation among 5 to 17-year-olds is based on parent responses in the National Health Interview Surveyfamily core questionnaire. The child was considered to have an activity limitation if the parent gave a positive response to any of thefollowing questions about the child: (1) "Because of a physical, mental, or emotional problem, does (child's name) need the help ofother persons with personal care needs, such as eating, bathing, dressing, or getting around inside the home?" (2) "Because of a healthproblem does (child's name) have difficulty walking without any special equipment?" (3) "Is (child's name) limited in any way because ofdifficulty remembering or because of periods of confusion?" "Is (child's name) limited in any activities because of physical, mental, oremotional problems?" (4) "Does (child's name) receive special education?"
SOURCE: Centers for Disease Control and Prevention, National Center for Health Statistics, National Health Interview Survey.
Appendix A: Detailed Tables el

Table HEALTH3 Overweight: Percentage of children ages 6 to 18 who are overweight by gender,race, and Hispanic origin, 1976-1980, 1988-1994, and 1999-2000
Total Male Female
1976- 1988- 1999- 1976- 1988- 1999- 1976- 1988- 1999-1980 1994 2000 1980 1994 2000 1980 1994 2000
Children ages 6-18Total° 5.7 11.2 15.3 5.5 11.8 15.9 5.8 10.6 14.6
Race or Hispanic originWhite, non-Hispanic 4.9 10.5 11.6 4.7 11.3 12.0 5.1 9.6 11.1Black, non-Hispanic 8.2 14.0 21.5 5.8b 11.5 19.0 10.7 16.5 24.1Mexican American 15.4 24.5 16.1 28.5 14.7 20.1
Children ages 6-11Total° 6.1 11.3 15.3 6.2 11.6 16.0 6.0 11.0 14.5
Race or Hispanic originWhite, non-Hispanic 5.6 10.2 11.8 6.1 10.7 12.0 5.2 9.8
1 16E'Black, non-Hispanic 9.0 14.6 19.5 6.8b 12.3 17.1 11.2 17.0 22.2Mexican American 16.4 23.7 - 17.5 27.3 15.3 19.6
Children ages 12-18Total° 4.7 11.1 15.3 3.7 12.0 15.9 5.7 10.2 14.7
Race or Hispanic originWhite, non-Hispanic 4.3 10.8 11.3 3.6 12.0 12.1 5.0 9.5 10.5Black, non-Hispanic 7.5 13.3 23.6 * 10.7 21.3 10.3 16.0 26.0Mexican American - 14.2 25.4 - 14.4 30.3 14.0 20.7
= not available
= Estimates are considered unreliable (relative standard error greater than 40 percent)
a Totals include data for racial/ethnic groups not shown separately.
b Estimates are unstable because they are based on a small number of persons (relative standard error greater than 30 percent).
NOTE: Overweight is defined as body mass index (BMI) at or above the 95th percentile of the 2000 Centers for Disease Control andPrevention BMI-for-age growth charts (http://www.cdc.gov/growthcharts). BMI is calculated as weight in kilograms divided by thesquare of height in meters.
SOURCE: Centers for Disease Control and Prevention, National Center for Health Statistics, National Health and Nutrition ExaminationSurvey.
100America's Children: Key National Indicators of Well-Being, 2003
- 2 114

Childhood immunization: Percentage of children ages 19 to 35 months vaccinated for
selected diseases by poverty status, race, and Hispanic origin, selected years 1996-2001
Total Below poverty At or above poverty
Characteristic 1996 1998 1999 2000 2001 1996 1998 1999 2000 2001 1996 1998 1999 2000 2001
TotalCombined series (4:3:1:3)° 77 79 78 76 77 69 74 73 71 72 80 82 81 78 79Combined series (4:3:1)b 78 81 80 78 79 71 76 75 72 73 81 83 82 79 80DTP (4 doses or more)° 81 84 83 82 82 73 80 79 76 77 84 86 85 84 84Polio (3 doses or more) 91 91 90 90 89 88 90 87 87 87 92 92 91 90 90Measles-containing (MCV)d 91 92 92 91 91 87 90 90 89 89 92 93 92 91 92Hib (3 doses or more)° 92 93 94 93 93 88 91 91 90 90 93 95 95 95 94Hepatitis B (3 doses or more)1 82 87 88 90 89 78 85 87 87 87 83 88 89 91 90Varicella9 12 43 58 68 76 5 41 55 64 74 15 44 58 69 77
White, non-HispanicCombined series (4:3:1:3)° 79 82 81 79 79 68 77 76 73 71 81 83 82 80 80Combined series (4:3:1)b 80 83 82 80 80 70 79 77 74 72 82 84 83 81 81
DTP (4 doses or more)c 83 87 86 84 84 72 82 81 78 75 85 88 86 85 85Polio (3 doses or more) 92 92 90 91 90 88 91 88 88 87 93 93 91 91 91
Measles-containing (MCV)d 92 93 92 92 92 86 91 90 88 87 93 94 93 92 92Hib (3 doses or more)e 93 95 95 95 94 87 92 93 92 89 94 96 95 95 95Hepatitis B (3 doses or more)1 82 88 89 91 90 75 87 88 88 86 83 88 89 92 90Varicella9 15 42 56 66 75 6 37 51 58 67 16 43 57 68 76
Black, non-HispanicCombined series (4:3:1:3)° 74 73 74 71 71 70 72 72 69 69 78 74 77 72 74Combined series (4:3:1)b 76 74 75 72 73 73 74 74 70 71 80 76 78 73 75DTP (4 doses or more)` 79 77 79 76 76 75 77 78 75 74 82 79 83 78 78Polio (3 doses or more) 90 88 87 87 85 88 88 86 85 84 92 87 88 87 86Measles-containing (MCV)d 89 89 90 88 89 88 89 90 88 88 91 90 91 87 90Hib (3 doses or more)e 90 90 92 93 90 87 90 91 92 87 92 90 94 93 91
Hepatitis B (3 doses or more)1 82 84 87 89 85 79 86 86 89 85 86 83 90 90 85Varicella9 9 42 58 67 75 3 40 57 60 71 13 44 60 72 77
HispanichCombined series (4:3:1:3)° 71 75 75 73 77 68 73 73 70 73 74 79 78 74 79Combined series (4:3:1)b 73 77 77 75 79 70 76 76 73 76 75 80 80 75 80DTP (4 doses or more)` 77 81 80 79 83 73 79 78 76 79 79 83 82 80 83Polio (3 doses or more) 89 89 89 88 91 88 90 89 88 90 90 90 90 87 91
Measles-containing (MCV)d 88 91 90 90 92 88 91 90 90 91 89 93 91 90 93Hib (3 doses or more)e 89 92 92 91 93 88 92 91 88 91 90 94 95 93 94Hepatitis B (3 doses or more)1 80 86 85 88 90 79 83 87 87 88 82 88 88 90 91
Varicella9 8 47 61 70 80 6 44 59 70 81 11 48 62 70 82
a The 4:3:1:3 combined series consists of 4 doses of diphtheria and tetanus toxoids and pertussis vaccine (DTP), 3 doses of polio vaccine,1 dose of a measles-containing vaccine(MCV), and 3 doses of Haemophilus influenzae type b (Hib) vaccine.
b The 4:3:1 combined series consists of 4 doses of diphtheria and tetanus toxoids and pertussis vaccine (DTP), 3 doses of polio vaccine,and 1 dose of a measles-containing vaccine (MCV).
c Diphtheria and tetanus toxoids and pertussis vaccine (DTP).
d Respondents were asked about measles-containing vaccine, including MMR (measles-mumps-rubella) vaccines.
e Haemophilus influenzae type b (Hib) vaccine.
f The percentage of children ages 19 to 35 months of who received 3 doses of hepatitis B vaccine was low in 1994, because universalinfant vaccination with a 3-dose series was not recommended until November 1991.
g Recommended in July 1996. Administered on or after the first birthday, unadjusted for history of varicella illness (chicken pox).
h Persons of Hispanic origin may be of any race.
SOURCE: Centers for Disease Control and Prevention, National Center for Health Statistics and National Immunization Program,National Immunization Survey.
Appendix A: Detailed Tables101

Table HEALTH5 Low birthweight: Percentage of infants born of low-birthweight by detailedmother's race and Hispanic origin, selected years 1980-2001
Characteristic 1980 1985 1990 1995 1996 1997 1998 1999 2000 2001
Low birthweight (less than 2,500 grams, about 5.5 pounds)
Total 6.8 6.8 7.0 7.3 7.4 7.5 7.6 7.6 7.6 7.7Race and Hispanic originWhite, non-Hispanic 5.7 5.6 5.6 6.2 6.4 6.5 6.6 6.6 6.6 6.8Black, non-Hispanic 12.7 12.6 13.3 13.2 13.1 13.1 13.2 13.2 13.1 13.1Hispanic° 6.1 6.2 6.1 6.3 6.3 6.4 6.4 6.4 6.4 6.5
Mexican American 5.6 5.8 5.5 5.8 5.9 6.0 6.0 5.9 6.0 6.1Puerto Rican 9.0 8.7 9.0 9.4 9.2 9.4 9.7 9.3 9.3 9.3Cuban 5.6 6.0 5.7 6.5 6.5 6.8 6.5 6.8 6.5 6.5Central and South American 5.8 5.7 5.8 6.2 6.0 6.3 6.5 6.4 6.3 6.5Other and unknown Hispanic 7.0 6.8 6.9 7.5 7.7 7.9 7.6 7.6 7.8 8.0
Asian/Pacific Islander 6.7 6.2 6.5 6.9 7.1 7.2 7.4 7.4 7.3 7.5Chinese 5.2 5.0 4.7 5.3 5.0 5.1 5.3 5.2 5.1 5.3Japanese 6.6 6.2 6.2 7.3 7.3 6.8 7.5 7.9 7.1 7.3Filipino 7.4 6.9 7.3 7.8 7.9 8.3 8.2 8.3 8.5 8.7Hawaiian and part Hawaiian 7.2 6.5 7.2 6.8 6.8 7.2 7.2 7.7 6.8 7.9Other Asian/Pacific Islander 6.8 6.2 6.6 7.1 7.4 7.5 7.8 7.8 7.7 7.8
American Indian/Alaska Native 6.4 5.9 6.1 6.6 6.5 6.8 6.8 7.1 6.8 7.3
Very low birthweight (less than 1,500 grams, about 3.25 pounds)
Total 1.15 1.21 1.27 1.35 1.37 1.42 1.45 1.45 1.43 1.44Race and Hispanic originWhite, non-Hispanic 0.86 0.90 0.93 1.04 1.08 1.12 1.15 1.15 1.14 1.17Black, non-Hispanic 2.46 2.66 2.93 2.98 3.02 3.05 3.11 3.18 3.10 3.08Hispanic° 0.98 1.01 1.03 1.11 1.12 1.13 1.15 1.14 1.14 1.14
Mexican American 0.92 0.97 0.92 1.01 1.01 1.02 1.02 1.04 1.03 1.05Puerto Rican 1.29 1.30 1.62 1.79 1.70 1.85 1.86 1.86 1.93 1.85Cuban 1.02 1.18 1.20 1.19 1.35 1.36 1.33 1.49 1.21 1.27Central and South American 0.99 1.01 1.05 1.13 1.14 1.17 1.23 1.15 1.20 1.19Other and unknown Hispanic 1.01 0.96 1.09 1.28 1.48 1.35 1.38 1.32 1.42 1.27
Asian/Pacific Islander 0.92 0.85 0.87 0.91 0.99 1.05 1.10 1.08 1.05 1.03Chinese 0.66 0.57 0.51 0.67 0.64 0.74 0.75 0.68 0.77 0.69Japanese 0.94 0.84 0.73 0.87 0.81 0.78 0.84 0.86 0.75 0.71Filipino 0.99 0.86 1.05 1.13 1.20 1.29 1.35 1.41 1.38 1.23Hawaiian and part Hawaiian 1.05 1.03 0.97 0.94 0.97 1.41 1.53 1.41 1.39 1.50Other Asian/Pacific Islander 0.96 0.91 0.92 0.91 1.04 1.07 1.12 1.09 1.04 1.06
American Indian/Alaska Native 0.92 1.01 1.01 1.10 1.21 1.19 1.24 1.26 1.16 1.26
a Persons of Hispanic origin may be of any race.
NOTE: Excludes live births with unknown birthweight. Low-birthweight infants weigh less than 2,500 grams at birth, about 5.5 pounds.Very-low-birthweight infants weigh less than 1,500 grams, about 3.25 pounds. Trend data for births to Hispanic and to White and Black,non-Hispanic women are affected by expansion of the reporting area in which an item on Hispanic origin is included on the birthcertificate. These two factors affect numbers of events, composition of the Hispanic population, and maternal and infant healthcharacteristics. The number of States in the reporting area increased from 22 in 1980 to 23 and the District of Columbia (DC) in 1983-87,30 and DC in 1988, 47 and DC in 1989, 48 and DC in 1990, 49 and DC in 1991-92, and all 50 States and DC from 1993 forward. Trend datafor births to Asian/Pacific Islander and Hispanic women are also affected by immigration.
SOURCE: Centers for Disease Control and Prevention, National Center for Health Statistics, National Vital Statistics System. Ventura, S.J.,Martin, J.A., Curtin, S.C., Menacker, F., and Hamilton, B.E. (2001). Births: Final data for 1999. National Vital Statistics Reports, 49 (1).Martin, J.A., Hamilton, B.E., Ventura, S.J., Menacker, F., and Park, M.M. (2002). Births: Final data for 2000. National Vital Statistics Reports,50 (5). Hyattsville, MD: National Center for Health Statistics.Martin, J.A., Hamilton, B.E., Ventura, SJ., Menacker, F., and Park, M.M.(2002). National Vital Statistics Reports, 50 (5), Hyattsville, MD: National Center for Health Statistics. Martin, J.A., Hamilton, B.E., Ventura,S.J., Menaker, F., Park, M.M., and Sutton, P.D. (2002). Births: Final Data for 2001. National Vital Statistics Reports, 51 (2). Hyattsville, MD:National Center for Health Statistics.
102America's Children: Key National Indicators of Well-Being, 2003 116

mortality: Death rates among infants by detailed race and Hispanic originmother, selected years 1983-2000
Table HEALTH6 Infant
(Infant deaths per 1,000 live births)
of
Characteristic 1983 1985 1986 1987 1988 1989 1990 1991 1995° 1996° 1997° 1998° 1999°2000°
Total 10.9 10.4 10.1 9.8 9.6 9.5 8.9 8.6 7.6 7.3 7.2 7.2 7.0 6.9
Race and Hispanic originWhite, non-Hispanic 9.2 8.6 8.3 8.1 7.8 7.8 7.2 7.0 6.3 6.0 6.0 6.0 5.8 5.7
Black, non-Hispanic 19.1 18.3 18.0 17.5 18.0 18.0 16.9 16.6 14.7 14.2 13.7 13.9 14.1 13.6
Hispanicb 9.5 8.8 8.4 8.2 8.3 8.1 7.5 7.1 6.3 6.1 6.0 5.8 5.7 5.6
Mexican American 9.1 8.5 7.9 8.0 7.8 7.7 7.2 6.9 6.0 5.8 5.8 5.6 5.5 5.4
Puerto Rican 12.9 11.2 11.8 9.9 11.6 11.7 9.9 9.7 8.9 8.6 7.9 7.8 8.3 8.2
Cuban 7.5 8.5 7.6 7.1 7.3 6.2 7.2 5.2 5.3 5.1 5.5 3.6 4.7 4.5
Central and South American 8.5 8.0 7.7 7.7 7.2 7.4 6.8 5.9 5.5 5.0 5.5 5.3 4.7 4.6
Other and unknown Hispanic 10.6 9.5 9.2 8.7 9.1 8.4 8.0 8.2 7.4 7.7 6.2 6.5 7.2 6.9
Asian/Pacific Islander 8.3 7.8 7.8 7.3 6.8 7.4 6.6 5.8 5.3 5.2 5.0 5.5 4.8 4.9
Chinese 9.5 5.8 5.9 6.2 5.5 6.4 4.3 4.6 3.8 3.2 3.1 4.0 2.9 3.5
Japanese 6.0 7.2 6.6 7.0 6.0 5.5 4.2 5.3 4.2 5.3 3.5 3.4 4.6
Filipino 8.4 7.7 7.2 6.6 6.9 8.0 6.0 5.1 5.6 5.8 5.8 6.2 5.8 5.7
Hawaiian and part Hawaiian 11.2 9.9 11.9 12.2 9.2 11.4 8.0 7.6 6.6 5.6 9.0 10.0 7.1 9.1
Other Asian/Pacific Islander 8.1 8.5 8.3 7.6 7.0 7.3 7.4 6.3 5.5 5.7 5.0 5.7 5.1 4.8
American Indian/Alaska Native 15.2 13.1 13.9 13.0 12.7 13.4 13.1 11.3 9.0 10.0 8.7 9.3 9.3 8.3
* = number too small to calculate a reliable rate
a Beginning with data for 1995, rates are on a period basis. Earlier rates are on a cohort basis. Race-specific data for 1995-2000 areweighted to account for unmatched records.
b Persons of Hispanic origin may be of any race.
Trend data for Hispanic women are affected by expansion of the reporting area in which an item on Hispanic origin is included on thebirth certificate, as well as by immigration. These two factors affect numbers of events, composition of the Hispanic population, andmaternal and infant health characteristics. The number of States in the reporting area increased from 22 in 1980 to 23 and the District ofColumbia (DC) in 1983-87, 30 and DC in 1988, 47 and DC in 1989, 48 and DC in 1990, 49 and DC in 1991, and all 50 States and DC from1993 forward.
NOTE: Rates for race groups from the National Linked Files of Live Births and Infant Deaths vary slightly from those obtained viaunlinked infant death records using the National Vital Statistics System because the race reported on the death certificate sometimesdoes not match the race on the infant's birth certificate. Rates obtained from linked data (where race is obtained from the birth, ratherthan the death, certificate) are considered more reliable, but linked data are not available before 1983 and are also not available for1992-94.
SOURCE: Centers for Disease Control and Prevention, National Center for Health Statistics, National Linked Files of Live Births andInfant Deaths.
1 7Appendix A: Detailed Tables
103

Table HEALTH7.A Child mortality: Death rates for children ages 1 to 4 by gender, race, Hispanicorigin, and cause of death, selected years 1980-2000
(Deaths per 100,000 children in each group)
Characteristic 1980 1985 1990 1995 1996 1997 1998 1999 2000
Ages 1-4
Total° 63.9 51.8 46.8 40.4 38.0 35.5 34.1 34.2 32.4
GenderMale 72.6 58.5 52.4 44.5 41.8 39.4 37.1 37.9 35.9Female 54.7 44.8 41.0 36.0 34.0 31.5 31.0 30.3 28.7
Race and Hispanic originbWhite 57.9 46.6 41.1 35.2 33.0 31.8 30.2 30.8 29.2White, non Hispanics 45.3 37.6 34.2 32.4 31.5 29.8 30.1 28.5Black 97.6 80.7 76.8 66.4 62.6 54.4 55.8 52.6 49.9Hispanic" - 46.1 43.5 36.3 32.9 30.7 29.4 30.9 29.6
Asian/Pacific Islander 43.2 40.1 38.6 26.5 26.6 26.9 20.1 24.9 21.6
Leading causes of deatheUnintentional injuries 25.9 20.2 17.3 14.4 13.7 13.0 12.6 13.0 11.9Cancer 4.5 3.8 3.5 3.1 2.7 2.8 2.4 2.7 2.7Birth defects 8.0 5.9 6.1 4.4 4.1 3.8 3.7 3.6 3.2Homicide 2.5 2.5 2.6 2.9 2.7 2.4 2.6 2.5 2.3Heart disease 2.6 2.2 1.9 1.6 1.4 1.4 1.4 1.2 1.2Pneumonia/influenza 2.1 1.6 1.2 1.0 1.1 1.2 0.9 0.8 0.7
Injury-related deaths by causeeAll injuries (intentionaland unintentional) 28.9 23.0 19.9 17.3 16.5 15.4 15.3 15.1 14.5
Motor vehicle traffic related 7.4 5.9 5.3 4.4 4.4 4.2 4.1 3.7 3.7Drowning 5.7 4.4 3.9 3.5 3.1 3.1 3.4 3.3 3.3Fire and burns 6.1 4.8 4.0 3.1 2.9 2.5 1.9 2.2 2.1Firearms 0.7 0.7 0.6 0.6 0.5 0.5 0.5 0.4 0.3Suffocation 1.9 1.4 1.3 1.3 1.3 1.1 1.2 1.2 1.2Pedestrian (non-traffic)f 1.5 1.1 0.9 0.7 0.7 0.7 0.7 0.7 0.6Fall 0.9 0.6 0.6 0.3 0.3 0.3 0.3 0.4 0.2
- = not available
a Total includes American Indians/Alaska Natives.
b Death rates for American Indians/Alaska Natives are not shown separately, because the numbers of deaths were too small for thecalculation of reliable rates and American Indians are underreported on the death certificate.
E Trend data for Hispanics and White, non-Hispanics are affected by expansion of the reporting area in which an item on Hispanic originis included on the death certificate, as well as by immigration. These two factors affect numbers of events, composition of the Hispanicpopulation, and health characteristics. Tabulations are restricted to a subset of the States that include the item on the death certificateand that meet a minimal quality standard. The quality of reporting has improved substantially over time, so that the minimal qualitystandard was relaxed in 1992 to those areas reporting Hispanic origin on at least 80 percent of records. The number of States in thereporting area increased from 15 in 1984 to 17 and the District of Columbia (DC) in 1985; 18 and DC in 1986-87; 26 and DC in 1988; 44and DC in 1989; 45, New York State (excluding New York City), and DC in 1990; 47, New York State (excluding New York City), and DCin 1991; 48 and DC in 1992; and 49 and DC in 1993-96; complete reporting began in 1997. The population data in 1990 and 1991 do notexclude New York City.
d Persons of Hispanic origin may be of any race.
e Cause-of-death information for 1980-98 is classified according to the Ninth Revision of the International Classification of Diseases.Cause-of-death information for 1999-2000 is classified according to the Tenth Revision of the International Classification of Diseases.
f Includes deaths occurring on private property. Pedestrian deaths on public roads are included in the motor vehicle traffic-related category.
SOURCE: Centers for Disease Control and Prevention, National Center for Health Statistics, National Vital Statistics System.
104America's Children: Key National Indicators of Well-Being, 2003
'44 1
118

Table HEALTH7.B Child mortality: Death rates for children ages 5 to 14 by gender, race, Hispaniccause of death, selected years 1980-2000origin, and
(Deaths per 100,000 children in each group)
Characteristic 1980 1985 1990 1995 1996 1997 1998 1999 2000
Ages 5-14
Total° 30.6 26.5 24.0 22.2 21.2 20.2 19.3 18.6 18.0
GenderMale 36.7 31.8 28.5 26.4 24.9 23.3 22.7 21.5 20.9Female 24.2 21.0 19.3 17.9 17.4 17.0 15.8 15.6 15.0
Race and Hispanic originbWhite 29.1 25.0 22.3 20.5 19.5 18.6 17.8 17.2 17.0White, non-Hispanic° 23.1 21.5 20.1 19.2 18.8 17.9 17.3 17.1Black 39.0 35.5 34.4 32.0 30.4 29.2 27.4 26.5 24.2Hispanic°,d 19.3 20.0 19.9 19.1 16.0 16.0 15.6 15.7Asian/Pacific Islander 24.2 20.8 16.9 17.5 14.7 16.0 15.6 12.7 12.3
Leading causes of death°Unintentional injuries 15.0 12.6 10.4 9.2 8.7 8.5 8.1 7.6 7.3Cancer 4.3 3.5 3.1 2.7 2.6 2.6 2.5 2.5 2.5Birth defects 1.6 1.4 1.5 1.2 1.2 1.1 0.9 1.0 1.0Homicide 1.2 1.2 1.3 1.5 1.3 1.1 1.1 1.1 0.9Heart disease 0.9 1.0 0.9 0.8 0.8 0.8 0.8 0.7 0.7Pneumonia/influenza 0.6 0.4 0.4 0.3 0.3 0.4 0.3 0.2 0.2
Injury-related deaths by causesAll injuries (intentionaland unintentional) 16.7 14.7 12.7 11.5 10.8 10.4 10.1 9.4 9.1
Motor vehicle traffic related 7.5 6.6 5.6 5.1 4.8 4.7 4.4 4.1 4.0Drowning 2.5 1.8 1.5 1.2 1.2 1.1 1.1 0.9 0.9Fire and burns 1.5 1.4 1.0 0.9 0.9 0.8 0.8 0.7 0.7Firearms 1.6 1.8 1.9 1.9 1.5 1.4 1.3 1.0 0.9Suffocation 0.9 0.9 0.8 0.8 0.8 0.8 0.9 0.8 0.8Pedestrian (non-traffic)f 0.2 0.1 0.1 0.1 0.1 0.1 0.1 0.2 0.2Fall 0.3 0.2 0.1 0.2 0.1 0.1 0.1 0.1 0.1
- = not available
a Total includes American Indians/Alaska Natives.
b Death rates for American Indians/Alaska Natives are not shown separately, because the numbers of deaths were too small for thecalculation of reliable rates and American Indians are underreported on the death certificate.
Trend data for Hispanics and White, non-Hispanics are affected by expansion of the reporting area in which an item on Hispanic originis included on the death certificate as well as by immigration. These two factors affect numbers of events, composition of the Hispanicpopulation, and health characteristics. Tabulations are restricted to a subset of the States that include the item on the death certificateand that meet a minimal quality standard. The quality of reporting has improved substantially over time, so that the minimal qualitystandard was relaxed in 1992 to those areas reporting Hispanic origin on at least 80 percent of records. The number of States in thereporting area increased from 15 in 1984 to 17 and the District of Columbia (DC) in 1985; 18 and DC in 1986-87; 26 and DC in 1988; 44and DC in 1989; 45, New York State (excluding New York City), and DC in 1990; 47, New York State (excluding New York City), and DCin 1991; 48 and DC in 1992; and 49 and DC in 1993-96; complete reporting began in 1997. The population data in 1990 and 1991 do notexclude New York City.
d Persons of Hispanic origin may be of any race.
e Cause-of-death information for 1980-98 is classified according to the Ninth Revision of the International Classification of Diseases.Cause-of-death information for 1999-2000 is classified according to the Tenth Revision of the International Classification of Diseases.
f Includes deaths occurring on private property. Pedestrian deaths on public roads are included in the motor vehicle traffic-related category.
SOURCE: Centers for Disease Control and Prevention, National Center for Health Statistics, National Vital Statistics System.
Appendix A: Detailed Tables 105

Table HEALTH8 Adolescent mortality: Death rates among adolescents ages 15 to 19 by gender,race, Hispanic origin, and cause of death,° selected years 1980-2000
(Deaths per 100,000 adolescents ages 15-19)
Characteristic 1980 1985 1990 1995 1996 1997 1998 1999 2000
Total, all races
All causes 97.9 80.5 88.4 82.1 77.5 73.6 69.5 68.6 67.1Injuries 78.1 62.8 71.4 65.0 61.5 57.5 54.2 52.7 51.6
Motor vehicle traffic 42.3 33.1 33.0 27.8 27.8 26.5 25.6 25.3 25.3All firearm 14.7 13.3 23.5 24.1 20.9 18.5 16.0 14.4 12.9
Firearm homicide 7.0 5.7 14.0 15.3 13.1 11.5 9.6 8.5 7.7Firearm suicide 5.4 6.0 7.5 6.9 6.1 5.9 5.5 4.9 4.4
Males
White, non-Hispanic
All causes 105.1 105.7 94.9 91.2 90.8 88.1 87.1 86.1
Injuries - 86.2 87.5 76.4 74.3 72.8 71.1 69.2 69.4Motor vehicle traffic - 47.6 46.9 38.0 39.0 37.3 36.8 35.9 36.7All firearm 17.0 20.4 19.7 16.7 16.6 15.4 14.2 12.3
Firearm homicide 3.7 3.9 4.4 3.6 4.3 3.4 3.0 2.5Firearm suicide - 10.5 13.3 12.5 10.9 10.6 10.5 9.7 8.6
Black
All causes 134.5 125.5 199.9 200.1 183.2 162.5 147.7 137.7 130.1
Injuries 105.3 96.7 174.1 169.4 156.0 137.5 121.2 110.8 103.0Motor vehicle traffic 24.3 21.9 28.6 28.6 27.7 28.4 25.2 24.1 22.5
All firearm 46.7 46.5 119.8 118.9 107.7 89.6 74.6 67.1 61.5Firearm homicide 38.4 36.6 105.2 101.4 91.7 77.2 63.7 56.3 51.7Firearm suicide 3.4 5.4 8.8 10.5 9.1 8.3 7.5 7.0 6.9
Hispanicb
All causes - 121.3 131.4 124.9 111.8 98.4 90.1 87.8 90.5Injuries - 103.7 115.9 109.5 95.8 83.2 76.6 73.6 75.9
Motor vehicle traffic 42.8 40.7 29.0 29.0 25.5 24.8 26.0 29.4All firearm 31.2 51.7 60.1 48.3 41.4 33.8 29.5 27.9
Firearm homicide 20.9 39.7 47.1 38.1 30.5 25.8 22.9 21.9Firearm suicide 6.7 8.6 9.1 6.7 7.8 5.5 5.0 4.6
American Indian/Alaska NativeAll causes 248.3 167.5 183.7 147.8 139.8 144.5 116.0 128.8 122.2
Injuries 222.7 148.4 157.2 133.5 123.8 129.3 106.2 118.0 108.5Motor vehicle traffic 107.9 66.3 63.3 52.9 45.5 58.3 42.9 46.8 47.4All firearm 40.6 29.2 29.6 43.9 39.6 35.1 35.4 30.2 22.0
Firearm homicide * 19.7 * * * * *
Firearm suicide 26.7 * * 24.4 19.2 21.8 15.8 *
Asian/Pacific IslanderAll causes 69.1 57.8 73.1 65.2 61.2 52.8 51.1 50.2 51.0
Injuries 53.5 47.4 62.3 51.9 52.0 39.8 39.1 37.8 39.1
Motor vehicle traffic 25.5 21.0 24.1 14.4 20.2 11.7 13.4 12.9 14.7All firearm 9.2 22.2 26.9 18.1 17.4 13.2 10.9 8.8
Firearm homicide 12.6 18.6 12.9 13.4 9.7 7.5 5.7Firearm suicide 8.3 6.1 * * * * *
106America's Children: Key National Indicators of Well-Being, 2003 . 120

. Adolescent mortality: Death rates among adolescents ages 15 to 19 by gender,race, Hispanic origin, and cause of death,' selected years 1980-2000
(Deaths per 100,000 adolescents ages 15-19)
Characteristic 1980 1985 1990 1995 1996 1997 1998 1999 2000
Females
White, non-Hispanic
All causes- 46.4 44.2 43.6 42.4 43.8 42.1 42.4 41.0Injuries 33.7 32.3 31.8 30.9 31.8 30.5 30.3 29.3
Motor vehicle traffic 22.5 22.6 22.5 21.9 22.5 22.1 21.6 20.8All firearm - 3.8 3.9 3.6 3.4 3.3 2.8 2.3 2.2
Firearm homicide 1.1 1.3 1.7 1.3 1.3 1.0 0.9 0.9Firearm suicide - 2.2 2.2 1.7 1.9 1.9 1.6 1.3 1.2
Black
All causes 50.3 44.6 54.4 55.1 52.3 47.8 42.3 45.2 43.7Injuries 25.5 22.9 30.8 31.9 30.1 26.2 22.4 24.9 22.5
Motor vehicle traffic 6.6 7.5 9.7 10.5 12.0 10.1 8.3 11.0 10.0
All firearm 7.5 6.1 12.1 13.9 11.5 9.0 7.8 8.2 5.7Firearm homicide 6.2 5.0 10.4 12.1 9.7 7.3 6.6 7.0 4.9Firearm suicide 0.6 0.7 * 1.6 * * *
Hispanicb
All causes 33.6 35.2 35.3 32.7 31.0 30.4 30.5 28.7In juries 20.7 22.7 23.0 20.5 19.8 20.3 19.6 18.4
Motor vehicle traffic - 10.7 10.4 12.1 10.4 11.6 11.4 10.9 10.7
All firearm - 4.5 6.8 5.7 3.9 4.3 4.0 3.6 2.7Firearm homicide * 4.9 4.5 2.2 3.0 2.6 2.6 2.0Firearm suicide * * * * * *
American Indian/Alaska NativeAll causes 77.4 69.9 73.1 56.3 52.9 48.4 41.8 49.9 52.8
Injuries 64.3 56.8 61.1 43.2 40.6 35.0 34.7 37.8 44.9Motor vehicle traffic 41.7 29.6 34.9 27.2 21.2 20.9 20.5 21.2 26.8All firearm * * * * * * *
Firearm homicide * * * * * * *
Firearm suicide * * * * * * *
Asian/Pacific IslanderAll causes 26.7 32.1 25.8 28.1 26.0 27.5 24.5 25.2 20.6
Injuries 16.7 19.3 18.2 19.4 17.5 17.6 15.7 15.5 11.9
Motor vehicle traffic * * 10.9 12.5 8.0 11.9 9.3 8.7 5.5All firearm * * * * * * *
Firearm homicide * * * * * * *
Firearm suicide * * * * * * *
-= not available
* = number too small to calculate a reliable rate
a Cause-of-death information for 1980-98 is classified according to the Ninth Revision of the International Classification of Diseases.Cause-of-death information for 1999 and 2000 is classified according to the Tenth Revision of the International Classification of Diseases.
b Persons of Hispanic origin may be of any race.
SOURCE: Centers for Disease Control and Prevention, National Center for Health Statistics, National Vital Statistics System.
!41.7 121Appendix A: Detailed Tables
107

Table HEALTH9 Adolescent births: Birth rates by mother's age, race, and Hispanic origin, selected years
1980-2001
(Live births per 1,000 females in specified age group)
Characteristic 1980 1985 1990 1995 1996 1997 1998 1999 2000 2001
All racesAges 10-14 1.1 1.2 1.4 1.3 1.2 1.1 1.0 0.9 0.9 0.8Ages 15-17 32.5 31.0 37.5 35.5 33.3 31.4 29.9 28.2 26.9 24.7Ages 18-19 82.1 79.6 88.6 87.7 84.7 82.1 80.9 79.1 78.1 76.1Ages 15-19 53.0 51.0 59.9 56.0 53.5 51.3 50.3 48.8 47.7 45.3
White, totalAges 10-14 0.6 0.6 0.7 0.8 0.7 0.7 0.6 0.6 0.6 0.5Ages 15-17 25.5 24.4 29.5 29.7 28.0 26.6 25.6 24.5 23.3 21.4Ages 18-19 73.2 70.4 78.0 80.0 77.4 74.8 73.9 72.8 72.3 70.8Ages 15-19 45.4 43.3 50.8 49.5 47.5 45.5 44.9 44.0 43.2 41.2
White, non-HispanicAges 10-14 0.4 0.5 0.4 0.4 0.4 0.3 0.3 0.3 0.3Ages 15-17 22.4 23.2 22.0 20.6 19.4 18.4 17.1 15.8 14.0Ages 18-19 67.7 - 66.6 65.9 63.8 61.9 60.8 59.3 57.5 54.8Ages 15-19 41.2 42.5 39.3 37.6 36.0 35.3 34.1 32.6 30.3
Black, totalAges 10-14 4.3 4.5 4.9 4.1 3.5 3.1 2.8 2.5 2.3 2.0Ages 15-17 72.5 69.3 82.3 68.6 63.4 59.4 55.5 50.7 49.0 43.9Ages 18-19 135.1 132.4 152.9 134.6 130.1 127.4 124.3 120.1 118.8 114.0Ages 15-19 97.8 95.4 112.8 94.4 89.6 86.3 83.5 79.1 77.4 71.8
Black, non-HispanicAges 10-14 4.6 5.0 4.2 3.6 3.2 2.9 2.6 2.4 2.1Ages 15-17 77.2 84.9 70.6 65.0 60.9 57.0 52.0 50.1 44.9Ages 18-19 146.5 157.5 138.5 133.4 130.4 127.4 123.1 121.9 116.7Ages 15-19 105.1 116.2 97.2 91.9 88.3 85.7 81.0 79.2 73.5
Hispanic°Ages 10-14 1.7 - 2.4 2.6 2.4 2.1 1.9 1.9 1.7 1.6Ages 15-17 52.1 65.9 67.9 64.1 61.0 58.4 56.9 55.5 52.8Ages 18-19 126.9 147.7 146.7 140.5 132.9 131.7 129.8 132.6 135.5Ages 15-19 82.2 - 100.3 99.3 94.6 89.6 87.9 86.8 87.3 86.4
American Indian/Alaska NativeAges 10-14 1.9 1.7 1.6 1.6 1.6 1.5 1.5 1.4 1.1 1.0Ages 15-17 51.5 47.7 48.5 44.7 42.7 41.1 39.8 36.5 34.1 31.4Ages 18-19 129.5 124.1 129.3 121.8 112.9 106.8 106.5 97.9 97.1 94.8Ages 15-19 82.2 79.2 81.1 72.9 68.2 65.2 64.7 59.9 58.3 56.3
Asian/Pacific IslanderAges 10-14 0.3 0.4 0.7 0.7 0.6 0.5 0.5 0.4 0.3 0.2Ages 15-17 12.0 12.5 16.0 15.1 14.3 13.5 13.2 11.8 11.6 10.3Ages 18-19 46.2 40.8 40.2 42.2 38.6 37.0 36.9 36.5 32.6 32.8Ages 15-19 26.2 23.8 26.4 25.5 23.5 22.3 22.2 21.4 20.5 19.8
- = not available
Persons of Hispanic origin may be of any race. Trend data for Hispanic women are affected by expansion of the reporting area in whichan item on Hispanic origin is included on the birth certificate as well as by immigration. These two factors affect numbers of events,composition of the Hispanic population, and maternal and infant health characteristics. The number of States in the reporting areaincreased from 22 in 1980 to 23 and the District of Columbia (DC) in 1983-87, 30 and DC in 1988, 47 and DC in 1989, 48 and DC in 1990,49 and DC in 1991-92, and 50 and DC in 1993. Rates in 1981-88 were not calculated for Hispanics, black, non-Hispanics, and white, non-Hispanics because estimates for these populations were not available. Recent declines in teenage birth rates parallel but outpace thereductions in birth rates for unmarried teenagers (POP7A). Birth rates for married teenagers fell sharply between 1990 and 2001, butrelatively few teenagers are married.
SOURCE: Centers for Disease Control and Prevention, National Center for Health Statistics, National Vital Statistics System. Hamilton, B.E.,Sutton, P.D., and Ventura, S.J. (2003). Revised birth and fertility rates for the 1990s: United States, and new rates for Hispanic populations,2000 and 2001. National Vital Statistics Reports, 51. (In preparation.) Hyattsville, MD: National Center for Health Statistics. Ventura Sj.,Hamilton, B.E., and Sutton, P.D. (2003). Revised birth and fertility rates for the United States, 2000 and 2001. National Vital Statistics Reports,51 (4). Hyattsville, MD: National Center for Health Statistics. Martin, J.A., Hamilton, B.E. ,Ventura, SJ., Menacker, F., Park, M.M., andSutton, P.D. (2002). Births: Final data for 2001. National Vital Statistics Reports, 51 (2). Hyattsville, MD: National Center for Health Statistics.
108America's Children: Key National Indicators of Well-Being, 2003. , 122

Table BEH 1 Regular cigarette smoking: Percentage of 8th-, 10th-, and 12th-grade studentswho reported smoking cigarettes daily in the previous 30 days by grade, gender,race, and Hispanic origin, selected years 1980-2002
Characteristic 1980 1985 1990 1995 1996 1997 1998 1999 2000 2001 2002
8th-graders
Total 9.3 10.4 9.0 8.8 8.1 7.4 5.5 5.1
GenderMale 9.2 10.5 9.0 8.1 7.4 7.0 5.9 5.4Female 9.2 10.1 8.7 9.0 8.4 7.5 4.9 4.9
Race and Hispanic origin°White, non-Hispanic 10.5 11.7 11.4 10.4 9.7 9.0 7.5 6.0Black, non-Hispanic 2.8 3.2 3.7 3.8 3.8 3.2 2.8 2.8Hispanicb 9.2 8.0 8.1 8.4 8.5 7.1 5.0 4.4
10th-graders
Total 16.3 18.3 18.0 15.8 15.9 14.0 12.2 10.1
GenderMale 16.3 18.1 17.2 14.7 15.6 13.7 12.4 9.4Female 16.1 18.6 18.5 16.8 15.9 14.1 11.9 10.8
Race and Hispanic origin°White, non-Hispanic - 17.6 20.0 21.4 20.3 19.1 17.7 15.5 13.3Black, non-Hispanic - - 4.7 5.1 5.6 5.8 5.3 5.2 5.2 5.0Hispanicb 9.9 11.6 10.8 9.4 9.1 8.8 7.4 6.4
12th-graders
Total 21.3 19.5 19.1 21.6 22.2 24.6 22.4 23.1 20.6 19.0 16.9
GenderMale 18.5 17.8 18.6 21.7 22.2 24.8 22.7 23.6 20.9 18.4 17.2Female 23.5 20.6 19.3 20.8 21.8 23.6 21.5 22.2 19.7 18.9 16.1
Race and Hispanic origin°
White, non-Hispanic 23.9 20.4 21.8 23.9 25.4 27.8 28.3 26.9 25.7 23.8 21.8Black, non-Hispanic 17.4 9.9 5.8 6.1 7.0 7.2 7.4 7.7 8.0 7.5 6.4Hispanicb 12.8 11.8 10.9 11.6 12.9 14.0 13.6 14.0 15.7 12.0 9.2
- = not available
a Estimates for race and Hispanic origin represent the mean of the specified year and the previous year. Data have been combined toincrease subgroup sample sizes, thus providing more stable estimates.
b Persons of Hispanic origin may be of any race.
SOURCE: Johnston, L.D., O'Malley, P.M., and Bachman, J.G. (2002). Monitoring the Future National Survey Results on Drug Use, 1975-2001Volume I: Secondary School Students (NIH Pub. No. 02-5106). Bethesda, MD: National Institute on Dwg Abuse. Tables D-48 and D-49. Datafor 2002 are from press release of December 16, 2002, and unpublished tabulations from Monitoring the Future, University of Michigan.
.s 123Appendix A: Detailed Tables
109

Table BEH2 Alcohol use: Percentage of 8th-, 10th-, and 12th-grade students who reportedhaving five or more drinks in a row in the past 2 weeks by grade, gender, race,and Hispanic origin, selected years 1980-2002
Characteristic 1980 1985 1990 1995 1996 1997 1998 1999 2000 2001 2002
8th-graders
Total 14.5 15.6 14.5 13.7 15.2 14.1 13.2 12.4
Gender
Male 15.1 16.5 15.3 14.4 16.4 14.4 13.7 12.5
Female 13.9 14.5 13.5 12.7 13.9 13.6 12.4 12.1
Race and Hispanic origin°
White, non-Hispanic 13.9 15.1 15.1 14.1 14.3 14.9 13.8 12.7
Black, non-Hispanic 10.8 10.4 9.8 9.0 9.9 10.0 9.0 9.4
Hispanicb 22.0 21.0 20.7 20.4 20.9 19.1 17.6 17.8
10th-graders
Total 24.0 24.8 25.1 24.3 25.6 26.2 24.9 22.4
GenderMale 26.3 27.2 28.6 26.7 29.7 29.8 28.6 23.8Female 21.5 22.3 21.7 22.2 21.8 22.5 21.4 21.0
Race and Hispanic origin°White, non-Hispanic - - 25.4 26.2 26.9 27.0 27.2 28.1 27.4 25.5Black, non-Hispanic - - - 13.3 12.2 12.7 12.8 12.7 12.9 12.6 12.4
Hispanicb - - - 26.8 29.6 27.5 26.3 27.5 28.3 27.7 26.5
12th-graders
Total 41.2 36.7 32.2 29.8 30.2 31.3 31.5 30.8 30.0 29.7 28.6
GenderMale 52.1 45.3 39.1 36.9 37.0 37.9 39.2 38.1 36.7 36.0 34.2Female 30.5 28.2 24.4 23.0 23.5 24.4 24.0 23.6 23.5 23.7 23.0
Race and Hispanic origin°White, non-Hispanic 44.3 41.5 36.6 32.3 33.4 35.1 36.4 35.7 34.6 34.5 33.7Black, non-Hispanic 17.7 15.7 14.4 14.9 15.3 13.4 12.3 12.3 11.5 11.8 11.5
Hispanicb 33.1 31.7 25.6 26.6 27.1 27.6 28.1 29.3 31.0 28.4 26.4
-= not available
a Estimates for race and Hispanic origin represent the mean of the specified year and the previous year. Data have been combined toincrease subgroup sample sizes, thus providing more stable estimates.
b Persons of Hispanic origin may be of any race.
SOURCE: Johnston, L.D., O'Malley, P.M., and Bachman, J.G. (2002). Monitoring the Future national survey results an drug use, 1975-2001Volume I: Secondary School Students (NIH Publication No. 02-5106). Bethesda, MD: National Institute on Drug Abuse. Tables D-44 and D-45. Datafor 2002 are from a press release of December 16, 2002 and unpublished tabulations from Monitoring the Future, University of Michigan.
110America's Children: Key National Indicators of Well-Being, 2003 124

Table BEH3 Illicit drug use: Percentage of 8th-, 10th-, and 12th-grade students who have used illicit
drugs in the previous 30 days by grade, gender, race, and Hispanic origin, selectedyears 1980-2002
Characteristic 1980° 1985 1990 1995 1996 1997 1998 1999 2000 2001 2002
8th-graders
Total 12.4 14.6 12.9 12.1 12.2 11.9 11.7 10.4
GenderMale 12.7 14.6 13.3 11.9 12.6 12.0 13.2 11.2
Female 11.9 14.1 12.3 11.9 11.7 11.3 9.9 9.5
Race and Hispanic originb
White, non-Hispanic 10.9 13.2 13.7 12.4 11.3 11.2 11.2 10.6Black, non-Hispanic - - 9.1 10.5 10.8 10.2 11.1 10.8 9.6 9.1
Hispanic` - 16.7 16.5 15.9 15.9 17.0 15.2 15.0 15.3
10th-graders
Total 20.2 23.2 23.0 21.5 22.1 22.5 22.7 20.8
GenderMale 21.1 24.3 24.8 22.5 23.7 25.4 24.9 21.7Female 19.0 21.9 21.0 20.5 20.4 19.5 20.5 19.8
Race and Hispanic originb
White, non-Hispanic 19.7 22.4 23.8 23.1 22.6 23.0 23.4 22.9Black, non-Hispanic 15.5 17.0 17.7 16.4 15.8 17.0 17.6 16.2
Hispanic` 20.6 22.5 24.2 24.2 23.8 23.7 23.3 21.4
12th-graders
Total 37.2 29.7 17.2 23.8 24.6 26.2 25.6 25.9 24.9 25.7 25.4
Gender
Male 39.6 32.1 18.9 26.8 27.5 28.7 29.1 28.6 27.5 28.4 28.5Female 34.3 26.7 15.2 20.4 21.2 23.2 21.6 22.7 22.1 22.6 21.8
Race and Hispanic originb
White, non-Hispanic 38.8 30.2 20.5 23.8 24.8 26.4 27.5 27.0 25.9 26.5 27.2Black, non-Hispanic 28.8 22.9 9.0 18.3 19.7 20.0 19.4 20.2 20.3 18.7 18.2
Hispanic` 33.1 27.2 13.9 21.4 22.6 23.9 24.1 24.4 27.4 25.3 23.4
= not available
a Beginning in 1982, the question about stimulant use (i.e., amphetamines) was revised to get respondents to exclude the inappropriatereporting of nonprescription stimulants. The prevalence rate dropped slightly as a result of this methodological change.
b Estimates for race and Hispanic origin represent the mean of the specified year and the previous year. Data have been combined toincrease subgroup sample sizes, thus providing more stable estimates.
c Persons of Hispanic origin may be of any race.
NOTE: Illicit drugs include marijuana, cocaine (including crack), heroin, hallucinogens (including LSD, PCP, and ecstasy IMDMAI),amphetamines (including methamphetamine), and nonmedical use of psychotherapeutics.
SOURCE: Johnston, L.D., O'Malley, P.M., and Bachman, J.G. (2002). Monitoring the Future national survey results on drug use, 1975-2001Volume I: Secondary School Students (NIH Publication No. 02-5106). Bethesda, MD: National Institute on Drug Abuse Tables 2-2 and 5-3. Data for2002 are from a press release of December 16, 2002, and demographic disaggregations are from unpublished tabulations fromMonitoring the Future, University of Michigan.
1 °I.41- 4.- ILO
Appendix A: Detailed Tables IIII

Table BEH4.A Youth victims of serious violent crimes: Number and rate of victimizations foryouth ages 12 to 17 by age, race, and gender, selected years 1980-2000
Characteristic 1980 1985 1990 1995 1996 1997 1998 1999 2000
Rate per 1,000 youth ages 12-17
Age12-17 37.6 34.3 43.2 28.3 30.3 27.1 24.6 20.4 16.312-14 33.4 28.1 41.2 26.7 24.9 23.5 20.4 20.4 13.715-17 41.4 40.3 45.2 30.0 35.8 30.7 28.6 20.5 19.0
Race
White 34.1 34.4 37.0 25.5 27.7 27.6 24.2 18.7 15.4Black 60.2 35.2 77.0 44.5 43.4 30.4 31.0 32.0 23.4Other 21.7 28.8 37.3 23.7 31.2 9.7 11.7 13.2 7.6
GenderMale 54.8 49.8 60.5 39.0 40.4 33.1 32.2 26.8 22.8Female 19.7 18.2 24.9 17.0 19.7 20.7 16.5 13.7 9.5
Number of victimizations of youth ages 12-17
Age12-17 877,104 742,815 866,272 633,301 687,638 622,242 569,935 477,682 393,05612-14 364,437 295,972 412,125 303,287 281,992 266,461 233,500 237,031 166,05715-17 512,667 446,843 454,147 330,014 405,646 355,781 336,435 240,651 226,999
Race
White 658,539 606,739 593,596 451,830 498,628 502,846 444,663 344,896 293,365Black 206,227 113,960 238,141 154,013 152,095 107,541 110,314 115,612 91,229Other 12,292 22,111 34,523 27,445 36,902 11,845 14,953 17,165 8,456
Gender
Male 651,976 550,860 623,509 447,695 471,282 390,870 383,546 322,259 280,879Female 225,127 191,955 242,763 185,606 216,356 231,372 186,389 155,422 112,177
NOTE: Serious violent crimes include aggravated assault, rape, robbery, and homicide. Aggravated assault is an attack with a weapon,regardless of whether or not an injury occurred, or an attack without a weapon when serious injury resulted. Robbery is stealing by forceor threat of force. Because of changes in the victimization survey, data prior to 1992 are adjusted to make them comparable with datacollected under the redesigned methodology. Victimization rates were calculated using population estimates from the U.S. CensusBureau's Current Population Reports. Such population estimates normally differ somewhat from population estimates derived from thevictimization survey data. The rates may therefore differ marginally from rates based upon the victimization survey-derived populationestimates. The preliminary data for 2000 do not include final homicide estimates. Revised numbers that reflect the final homicideestimates will be available at a later time on the Forum's website (http://childstais.gov). Rates may also be revised to reflect final U.S.Census Bureau population estimates for 1990-2000.
SOURCE: U.S. Department of Justice, Bureau of Justice Statistics, National Crime Victimization Survey, and. Federal Bureau ofInvestigation, Uniform Crime Reporting Program, Supplementary Homicide Reports.
IIIIAmerica's Children: Key National Indicators of Well-Being, 2003
2,6

Table BEH4.B Serious violent juvenile crime rate: Number and rate of serious crimes involvingyouth ages 12 to 17, selected years 1980-2000
Characteristic 1980 1985 1990 1995 1996 1997 1998 1999 2000
Rate per 1,000 youth ages 12-17
Total 34.9 30.2 39.1 36.3 35.5 30.7 26.5 26.1 17.2
Number of serious violent crimes
Total (in millions) 3.8 3.4 3.5 3.3 3.3 3.0 2.8 2.5 2.2
Number involving
youth ages 12-17(in thousands) 812 652 785 812 805 706 616 610 413
Percentage involving
youth ages 12-17 21.3 19.4 22.4 24.7 24.7 23.2 22.2 24.1 18.8
Percentage of juvenile
crimes involving
multiple offenders 61.4 61.4 61.1 54.5 53.1 53.4 52.9 47.1 58.6
NOTE: This rate is the ratio of number of crimes (aggravated assault, rape, and robbery; i.e., stealing by force or threat of violence)reported to the National Crime Victimization Survey for which the age of the offenders was known or perceived to be 12 to 17 years ofage, plus the number of homicides reported to police that involved at least one juvenile offender 12 to 17 years of age, to the number ofjuveniles in the population. Because of changes in the victimization survey, data prior to 1992 are adjusted to make them comparable todata collected under the redesigned methodology. Preliminary data for 2000 do not include final homicide estimates. Revised numbersthat reflect the final homicide estimates will be available at a later time on the Forum's website (http://childstals.gov). Rates may also berevised to reflect final U.S. Census Bureau population estimates for 1990-2000.
SOURCE: U.S. Department ofJustice, Bureau ofJustice Statistics, National Crime Victimization Survey, and Federal Bureau ofInvestigation, Uniform Crime Reporting Program, Supplementary Homicide Reports.
4:7Appendix A: Detailed Tables III

Family reading: Percentage of children ages 3 to 5° who were read to every dayin the last week by a family member by child and family characteristics, selectedyears 1993-2001
Characteristic 1993 1995 1996 1999 2001
Total 53 58 57 54 58
Gender
Male 51 57 56 52 55
Female 54 59 57 55 61
Race and Hispanic origin
White, non-Hispanic 59 65 64 61 64
Black, non-Hispanic 39 43 44 41 48
Hispanicb 37 38 39 33 42
Other, non-Hispanic 59
Poverty status`
Below poverty 44 48 46 38 48
At or above poverty 56 62 61 58 61
Family typed
Two parents 55 61 61 58 61
One or no parent 46 49 46 43 48
Mother's highest level of educatione
Less than high school graduate 37 40 37 39 42
High school graduate/GED 48 48 49 45 49
Vocational/technical or some college 57 64 62 53 60College graduate 71 76 77 71 73
Mother's employment status
Worked 35 hours or more per week 52 55 54 49 55
Worked less than 35 hours per week 56 63 59 56 63
Looking for work - 56Not in labor force 55 60 59 60 58
- = not available
a Estimates are based on children who have yet to enter kindergarten.
b Persons of Hispanic origin may be of any race.
c Poverty estimates for 1993 are not comparable to later years because respondents were not asked for exact household income.
d Refers to adults' relationship to child and does not indicate marital status.
e Children without mothers in the home are not included in estimates dealing with mother's education or mother's employment status.
f Unemployed mothers are not shown separately but are included in the total.
SOURCE: U.S. Department of Education, National Center for Education Statistics, National Household Education Survey.
1111 America's Children: Key National Indicators of Well-Being, 2003
A

Table ED2 Early childhood care and education: Percentage of children ages 3 to 5° who areenrolled in center-based early childhood care and education programsb by child andfamily characteristics, selected years 1991-2001
Characteristic 1991 1993 1995 1996 1999 2001
Total 53 53 55 55 60 56
Gender
Male 52 53 55 55 61 54
Female 53 53 55 55 59 59
Race and Hispanic origin
White, non-Hispanic 54 54 57 57 60 59
Black, non-Hispanic 58 57 60 65 73 64
Hispanic` 39 43 37 39 44 40
Other, non-Hispanic 53 51 57 45 66 61
Poverty statusd
Below poverty 44 49 45 44 52 47
At or above poverty 56 53 59 59 62 59
Family type
Two parents 50 52 55 54 59 57
One or no parent 54 54 56 58 62 56
Mother's highest level of educations
Less than high school graduate 32 33 35 37 40 38
High school graduate/GED 46 43 48 49 52 47
Vocational/technical or some college 60 60 57 58 63 62
College graduate 72 73 75 73 74 70
Mother's employment status'
Worked 35 hours or more per week 59 61 60 63 65 63
Worked less than 35 hours per week 58 57 62 64 64 61
Looking for work 43 48 52 47 55 47
Not in labor force 45 44 47 43 52 47
a Estimates are based on children who have yet to enter kindergarten.
b Center-based programs include day care centers, Head Start programs, preschool, nursery school, prekindergarten, and other earlychildhood programs.
c Persons of Hispanic origin may be of any race.
d Poverty estimates for 1991 and 1993 are not comparable to later years because respondents were not asked for exact household income.
e Children without mothers in the home are not included in estimates dealing with mother's education or mother's employment status.
SOURCE: U.S. Department of Education, National Center for Education Statistics, National Household Education Survey.
121 Appendix A: Detailed Tables III

Table ED3.A Mathematics achievement: Average scale scores of students ages 9, 13, and 17 byage and child and family characteristics, selected years 1982-99
Characteristic 1982 1986 1990 1992 1994 1996 1999
Age 9
Total 219 222 230 230 231 231 232
GenderMale 217 222 229 231 232 233 233Female 221 222 230 228 230 229 231
Race and Hispanic originWhite, non-Hispanic 224 227 235 235 237 237 239Black, non-Hispanic 195 202 208 208 212 212 211Hispanic° 204 205 214 212 210 215 213
Age 13
Total 269 269 270 273 274 274 276
GenderMale 269 270 271 274 276 276 277Female 268 268 270 272 273 272 275
Race and Hispanic originWhite, non-Hispanic 274 274 276 279 281 281 283Black, non-Hispanic 240 249 249 250 252 252 251Hispanic° 252 254 255 259 256 256 259
Parents' educationLess than high school 251 252 253 256 255 254 256Graduated high school 263 263 263 263 266 267 264Some education after high school 275 274 277 278 277 278 279Graduated college 282 280 280 283 285 283 286
Age 17
Total 299 302 305 307 306 307 308
GenderMale 302 305 306 309 309 310 310Female 296 299 303 305 304 305 307
Race and Hispanic originWhite, non-Hispanic 304 308 310 312 312 313 315Black, non-Hispanic 272 279 289 286 286 286 283Hispanic° 277 283 284 292 291 292 293
Parents' educationLess than high school 279 279 285 286 284 281 289Graduated high school 293 293 294 298 295 297 299Some education after high school 304 305 308 308 305 307 308Graduated college 312 314 316 316 318 317 317
a Persons of Hispanic origin may be of any race.
NOTE: Parents' level of education is the highest educational attainment of either parent. Data on parents' level of education are notreliable for 9-year-olds.
The mathematics proficiency scale ranges from 0 to 500:Level 150: Simple arithmetic factsLevel 200: Beginning skills and understandingsLevel 250: Numerical operations and beginning problem solvingLevel 300: Moderately complex procedures and reasoningLevel 350: Multi-step problem solving and algebra
SOURCE: U.S. Department of Education, National Center for Education Statistics, National Assessment of Educational Progress(NAEP), NAEP 1999 trends in academic progress.
IIIAmerica's Children: Key National Indicators of Well-Being, 20,034-, R.
4130

Table ED3.B Reading achievement: Average scale scores of students ages 9, 13, and 17 byage and child and family characteristics, selected years 1980-99
Characteristic 1980 1984 1988 1990 1992 1994 1996 1999
Age 9
Total 215 211 212 209 211 211 213 212
GenderMale 210 208 208 204 206 207 207 209Female 220 214 216 215 215 215 218 215
Race and Hispanic originWhite, non-Hispanic 221 218 218 217 218 218 220 221Black, non-Hispanic 189 186 189 182 185 185 191 186Hispanic° 190 187 194 189 192 186 195 193
rAge 13
Total 259 257 258 257 260 258 258 259
GenderMale 254 253 252 251 254 251 251 254Female 263 262 263 263 265 266 264 265
Race and Hispanic originWhite, non-Hispanic 264 263 261 262 266 265 266 267Black, non-Hispanic 233 236 243 242 238 234 234 238Hispanic° 237 240 240 238 239 235 238 244
Parents' educationLess than high school 239 240 247 241 239 237 239 238Graduated high school 254 253 253 251 252 251 251 251Some education after
high school271 268 265 267 270 269 269 270
Age 17
Total 286 289 290 290 290 288 288 288
GenderMale 282 284 286 284 284 282 281 282Female 289 294 294 297 296 295 295 295
Race and Hispanic originWhite, non-Hispanic 293 295 295 297 297 296 295 295Black, non-Hispanic 243 264 274 267 261 266 266 264Hispanic° 261 268 271 275 271 263 265 271
Parents' educationLess than high school 262 269 267 270 271 268 267 265Graduated high school 278 281 282 283 281 276 273 274Some education after
high school299 301 300 300 299 299 298 298
a Persons of Hispanic origin may be of any race.
NOTE: Parents' level of education is the highest educational attainment of either parent. Data on parents' level of education are notreliable for 9-year-olds.
The reading proficiency scale has a range from 0 to 500:Level 150: Simple, discrete reading tasksLevel 200: Partial skills and understandingLevel 250: Interrelates ideas and makes generalizationsLevel 300: Understands complicated informationLevel 350: Learns from specialized reading materials
SOURCE: U.S. Department of Education, National Center for Education Statistics, National Assessment of Educational Progress(NAEP), NAEP 1999 trends in academic progress.
131 IllAppendix A: Detailed Tables

coursetaking: Percentage distribution of high school graduates
of advanced mathematics courses taken, selected years 1982-2000
Table ED4.A High school academic
by the highest level
Characteristic 1982 1987 1990 1992 1994 1998 2000
Non-or low academic
Total 24.1 19.5 17.2 12.5 11.8 8.9 6.5
Middle academic
Total 48.8 50.1 51.6 49.0 49.4 48.9 48.0
Level I 30.6 27.0 25.4 22.7 22.5 21.2 18.6Level II 18.2 23.1 26.2 26.4 26.9 27.7 29.4
Advanced academic
Total 26.3 29.5 30.6 38.1 38.1 41.4 44.6
Level I 15.6 12.9 12.9 16.4 16.3 14.4 14.1Level II 4.8 9.0 10.4 10.9 11.6 15.2 18.0Level III 5.9 7.6 7.2 10.7 10.2 11.8 12.5
NOTE: Totals do not add to 100 because a small percentage of students completed no mathematics or only basic or remedial-level courses.
Mathematics academic levels are:
Nonacademic: General Mathematics I or II; Basic Mathematics I, II, or III; consumer mathematics; technical or vocational mathematics;and mathematics review.
Low academic: Pre-algebra; Algebra I (taught over 2 years); and Geometry (informal).
Middle academic I: Algebra I; plane geometry; plane and solid geometry; Unified Mathematics I and II; and pure mathematics.
Middle academic II: Algebra II and Unified Mathematics III.
Advanced academic I: Algebra III; algebra/trigonometry; algebra/analytical geometry; trigonometry; trigonometry/solid geometry;analytical geometry; linear algebra; probability; probability/statistics; statistics (other); and independent study.
Advanced academic II: Precalculus and introduction to analysis.
Advanced academic III: Advanced Placement calculus; calculus; and calculus/analytical geometry.
SOURCE: U.S. Department of Education, National Center for Education Statistics, High School and Beyond (1982); National EducationLongitudinal Study of 1988 (1992); National Assessment of Educational Progress Transcript Study (1987, 1990, 1994, and 1998, and 2000).
111 America's Children: Key National Indicators of Well-Being, 20036-...
132

Table ED4.B High school academic coursetaking: Percentage distribution of high school graduates
by the highest level of advanced science courses taken, selected years 1982-2000
Characteristic 1982 1987 1990 1992 1994 1998 2000
Low academic
Total 27.2 15.8 12.8 9.7 10.0 9.3 8.7
Primary physical science 12.2 6.7 4.2 2.8 1.9 3.0 2.8Secondary physical scienceand basic biology
15.0 9.1 8.7 6.9 8.2 6.3 5.9
Middle academic
General biology 35.2 41.5 37.0 36.4 34.1 28.6 27.5
Advanced academic
Total 35.4 41.9 49.5 53.5 55.3 61.5 63.0
Chemistry I or physics I 14.9 21.4 25.8 27.1 29.4 30.2 30.5Chemistry I and physics I 5.9 10.6 12.3 12.2 13.0 16.3 14.8Chemistry II or physics II oradvanced biology
14.6 9.9 11.4 14.3 12.9 15.1 17.9
NOTE: Totals do not add to 100 because a small percentage of students completed no science or only basic or remedial-level courses.
Science academic levels are:
Primary physical science: Physical science; applied physical science; earth science; college preparatory earth science; and unified science.Secondary physical science and basic biology: Astronomy, geology; environmental science; oceanography; general physics; and basicbiology I.
General biology: General biology I; ecology; zoology; marine biology; human physiology; and general or honors biology II.
Chemistry I or Physics I: Introductory chemistry; chemistry I; organic chemistry; physical chemistry; consumer chemistry; general physics;and physics I.
Chemistry I and Physics I: 1 chemistry and 1 physics course from the list above.
Chemistry II or Physics II or advanced biology: International Baccalaureate (IB) biology 11; IB biology III; AP biology; field biology;genetics; biopsychology; biology seminar; biochemistry and biophysics; bio-chemistry; botany; cell and molecular biology; cell biology;microbiology; anatomy; chemistry II; IB chemistry II; IB chemistry III; AP chemistry; physics II; IB physics; AP physics B; AP physics C:mechanics; AP physics C: electricity/magnetism; and physics II without calculus.
SOURCE: U.S. Department of Education, National Center for Education Statistics, High School and Beyond (1982); National EducationLongitudinal Study of 1988 (1992); National Assessment of Education Progress Transcript Study (1987, 1990, 1994, 1998, and 2000).
0." 111
Appendix A: Detailed Tables III

High school academic coursetaking: Percentage distribution of high schoolgraduates by the level of English courses taken, selected years 1982-2000
Characteristic 1982 1987 1990 1992 1994 1998 2000
Low academic
Total 10.0 22.1 19.6 18.0 17.6 13.7 10.7
Middle academic
Total 76.7 55.6 60.2 57.3 56.5 56.1 54.7
Advanced academic
Total 13.3 21.5 19.6 24.4 25.1 29.3 33.9
Less than 50 percent in honors 6.1 7.9 7.0 7.6 7.7 9.1 11.650-74 percent in honors 3.3 5.0 3.6 5.8 5.4 7.7 7.275 percent or more in honors 3.8 8.7 9.1 11.1 12.0 12.4 15.1
NOTE: Totals do not add up to 100 because a small percentage of students completed no English courses or only English as a secondlanguage (ESL) courses.
English academic levels are:
Low academic: The student has taken at least one low academic course, without having taken an honors-level course.
Middle academic: all completed English courses classified at grade level; no low academic level or honors courses.
Less than 50 percent honors: The number of completed courses classified as honors level, when divided by the total number ofcompleted low academic-, regular-, and honors-level courses, yields a percentage less than 50.
50-74 percent in honors: The number of completed courses classified as honors level, when divided by the total number of completedlow academic-, regular-, and honors-level courses, yields a percentage of between 50 and 74.
75 percent or more in honors: The number of completed courses classified as honors level, when divided by the total number ofcompleted low academic-, regular-, and honors-level courses, yields a percentage between 75 and 100.
SOURCE: U.S. Department of Education, National Center for Education Statistics, High School and Beyond (1982); National EducationLongitudinal Study of 1988 (1992); National Assessment of Educational Progress Transcript Study (1987, 1990, 1994, 1998, and 2000).
1
120America's Children: Key National Indicators of Well-Being, 2003
-
131

Table ED4.D High school academic coursetaking: Percentage distribution of high schoolby the level of foreign language courses taken, selected years 1982-2000graduates
Characteristic 1982 1987 1990 1992 1994 1998 2000
iNo foreign language
Total 45.6 33.3 26.9 22.5 22.3 19.4 17.4
Low academic
Total 39.8 47.5 51.4 51.8 51.8 50.7 52.8
Year 1 or less 20.4 22.6 21.2 19.9 19.8 19.2 18.0Year 2 19.5 24.9 30.2 32.0 32.1 31.5 34.9
Advanced academic
Total 14.6 19.2 21.7 25.7 25.9 30.0 29.8
Year 3 8.9 11.9 12.9 14.8 15.0 17.4 16.5Year 4 4.5 5.4 5.6 7.7 7.8 8.6 7.8Advanced placement 1.2 1.9 3.2 3.2 3.1 4.1 5.4
NOTE: Foreign language coursetaking based upon students taking classes in Spanish, French, Latin, and German.
SOURCE: U.S. Department of Education, National Center for Education Statistics, High School and Beyond (1982); NationalLongitudinal Study of 1988 (1992); National Assessment of Educational Progress Transcript Study (1987, 1990, 1994, 1998, and 2000).
I 31Appendix A: Detailed Tables II

Table ED5 High school completion: Percentage of adults ages 18 to 24° who have completedhigh school by race, Hispanic origin, and method of completion, selected years1980-2001
Characteristic 1980 1985 1990 1995b 1996b 1997b 1998b 1999b 2000b,c 2001 b'c
Totaid
Total completing
high schools
84 85 86 85 86 86 85 86 87 87
Method of completionDiploma - - 81 78 76 77 75 77 -Equivalentf 4 8 10 9 10 9 - -
White, non-Hispanic
Total completinghigh school°
88 88 90 90 92 91 90 91 92 91
Method of completionDiploma 85 83 81 81 80 82 - -Equivalentf 5 7 11 9 10 9 -
Black, non-Hispanic
Total completing
high schoole
75 81 83 85 83 82 81 84 84 86
Method of completionDiploma 78 75 73 72 72 73Equivalentf 5 9 10 10 10 11
Hispanic9
Total completinghigh schoole
57 67 59 63 62 67 63 63 64 66
Method of completionDiploma 55 54 55 59 52 55Equivalentf 4 9 7 8 11 9
-= not available
a Excludes those enrolled in high school or below.
b Data for 1994 and subsequent years are not strictly comparable with data for 1980-93, because of major revisions in the CurrentPopulation Survey (CPS) questionnaire and data collection methodology and because of the inclusion of 1990 Census-based populationcontrols in the estimation process.
Method of high school completion is not reported for 2000 and later years because of changes in General Education Development (GED)items in the October CPS School Enrollment Supplement, making the data not comparable to previous years.
d Percentages are not shown separately for non-Hispanic Asians/Pacific Islanders and American Indians/Alaska Natives, but they areincluded in the total.
e From 1980 to 1991, high school completion was measured as completing 4 years of high school rather than the actual attainment of ahigh school diploma or equivalent.
f Diploma equivalents include alternative credentials obtained by passing examinations such as the GED test.
g Persons of Hispanic origin may be of any race.
SOURCE: U.S. Census Bureau, October Current Population Survey (various years). Tabulated by the U.S. Department of Education,National Center for Education Statistics.
1 3 6
1111 America's Children: Key National Indicators of Well-Being, 2003
F3 7 it

Table ED6.A Youth neither enrolled in school nor working: Percentage of youth ages 16 to 19who are neither enrolled in school nor working by age, gender, race, andHispanic origin, selected years 1984-2002
Characteristic 1984 1985 1990 1995° 1996° 1997° 1998° 1999° 2000° 2001° 2002°
All youth ages 16-19
Total 12 11 10 9 9 9 8 8 8 9 9
GenderMale 9 9 8 8 8 8 8 7 7 8 8
Female 14 13 12 11 11 10 9 9 9 9 9
Race and Hispanic origin
White, non-Hispanic 10 9 8 7 7 7 6 6 6 6 7
Black, non-Hispanic 19 18 15 14 15 14 13 13 13 14 14
Hispanicb 18 17 17 16 16 14 14 14 13 13 13
Youth ages 16-17
Total 5 5 5 4 4 4 4 4 4 4 4
GenderMale 4 5 4 4 4 4 4 4 3 4 4
Female 6 6 5 5 5 4 4 4 4 4 4
Race and Hispanic origin
White, non-Hispanic 5 5 4 3 3 3 3 3 3 3 3
Black, non-Hispanic 6 6 6 6 5 6 5 5 5 5 5
Hispanicb 11 10 10 9 8 8 8 9 7 7 5
Youth ages 18-19
Total 18 17 15 15 15 14 13 13 12 13 14
Gender
Male 14 13 12 12 13 12 12 11 11 12 13
Female 21 20 18 17 17 15 13 14 13 15 15
Race and Hispanic origin
White, non-Hispanic 14 14 12 11 11 10 9 9 9 10 11
Black, non-Hispanic 32 30 23 24 25 23 21 21 21 22 24
Hispanicb 25 24 24 23 23 20 19 20 18 19 20
a Data for 1994 and subsequent years are not strictly comparable with data for prior years, because of major revisions in the CurrentPopulation Survey questionnaire and data collection methodology and because of the inclusion of 1990 Census-based populationcontrols in the estimation process.
b Persons of Hispanic origin may be of any race.
NOTE: The information relates to the labor force and enrollment status of persons ages 16 to 19 in the civilian noninstitutionalizedpopulation during an "average" week of the school year. The percentages represent an average based on responses to the surveyquestions for the months that youth are usually in school (January through May and September through December). Results are basedon uncomposited estimates and are not comparable to data from published tables.
SOURCE: U.S. Bureau of Labor Statistics, Current Population Survey.
IIIIAppendix A: Detailed Tables
137

enrolled in school and working: Percentage of youth ages 16 to 19 who arein school and working by age, gender, race, and Hispanic origin, selected
1984-2002
Table ED6.B Youth
enrolledyears
Characteristic 1984 1985 1990 1995° 1996° 1997° 1998° 1999° 2000° 2001° 2002°
All youth ages 16-19
Total 25 26 28 29 29 29 29 31 30 28 27
Gender
Male 25 26 27 28 28 28 29 29 29 26 24Female 25 26 28 30 30 30 33 32 32 30 29
Race and Hispanic originWhite, non-Hispanic 29 30 33 35 35 35 36 36 36 34 32Black, non-Hispanic 10 12 15 16 15 16 19 17 19 16 15Hispanicb 18 15 17 16 17 17 18 18 19 20 17
Youth ages 16-17
Total 28 29 29 30 30 29 31 31 31 28 25
GenderMale 28 29 29 29 28 29 30 30 29 27 23Female 28 29 30 31 31 30 32 31 32 30 28
Race and Hispanic originWhite, non-Hispanic 33 34 36 37 37 36 38 37 37 34 31Black, non-Hispanic 10 12 15 16 16 15 17 17 19 16 13Hispanicb 18 15 17 14 15 15 17 17 18 17 15
Youth ages 18-19
Total 23 23 26 28 28 28 30 30 30 28 28
GenderMale 23 23 25 27 28 27 27 28 28 26 26Female 23 23 26 30 29 30 33 32 31 30 30
Race and Hispanic originWhite, non-Hispanic 26 26 30 33 34 33 35 36 35 33 33Black, non-Hispanic 11 12 15 17 15 16 21 18 18 16 17Hispanicb 17 15 16 19 18 19 19 19 20 22 19
a Data for 1994 and subsequent years are not strictly comparable with data for prior years, because of major revisions in the CurrentPopulation Survey questionnaire and data collection methodology and because of the inclusion of 1990 Census-based populationcontrols in the estimation process.
b Persons of Hispanic origin may be of any race.
NOTE: The information relates to the labor force and enrollment status of persons ages 16-19 in the civilian noninstitutionalizedpopulation during an "average" week of the school year. The figures represent an average based on responses to the survey questions for themonths that youth are usually in school (January through May and September through December). Results are based on uncompositedestimates and are not comparable to data from published tables. Data for the groups of youth not shown herethose employed and not inschool and those not employed and in schoolare available on the website version of the report at htip://childstals.gov.
SOURCE: U.S. Bureau of Labor Statistics, Current Population Survey.
America's Children: Key National Indicators of Well-Being, 2003 1384

Table ED7 Higher education: Percentage of 25- to 29-year-olds attaining associate's andbachelor's degrees or higher by highest degree attained, race, and Hispanicorigin, selected years 1980-2002
Characteristic 1980 1985 1990 1995° 1996° 1997° 1998° 1999° 2000° 2001° 2002°
LBachelor's degree or higherb
Total 23 22 23 25 27 28 27 28 29 29 29
Race and Hispanic originWhite, non-Hispanic 25 24 26 29 32 33 32 34 34 33 36Black, non-Hispanic 12 12 13 15 15 14 16 15 18 18 18Hispanic` 8 11 8 9 10 11 10 9 10 11 9
Associate's degree7
Total 8 8 8 9 9 9 9 8
Race and Hispanic originWhite, non-Hispanic - 9 9 9 9 10 10 9 9Black, non-Hispanic - - 7 7 6 7 9 8 9 8Hispanic` - 4 5 6 6 6 6 6 6
= not available
a Data for 1994 and subsequent years are not strictly comparable with data for prior years because of major revisions in the CurrentPopulation Survey questionnaire and data collection methodology and because of the inclusion of 1990 Census-based populationcontrols in the estimation process.
b This was measured as having completed 4 or more years of college, 1980-1991.
c Persons of Hispanic origin may be of any race.
NOTE: Analyses of the 1993 Baccalaureate and Beyond Longitudinal Study indicated that about 10 percent of all persons attaining abachelor's degree in that year had previously earned an associate's degree. Source: National Center for Education Statistics.
SOURCE: U.S. Census Bureau, March Current Population Survey. Tabulated by the U.S. Department of Education, National Center forEducation Statistics.
Appendix A: Detailed Tables 11111
1 9

Table SPECIAL1.A Population and family: Selected population and family measures of child well-beingby state, 1990 and 2000
Living in married-couple familiesb
Percent of children under 18°With difficulty speaking English° Who are foreign-bornd
1990 2000 Change° 1990 2000 Change° 1990 2000 Change°
Nation 72.2 68.0 -4.2 5.2 6.6 1.4 3.3 4.4 1.1
StateAlabama 68.6 64.0 -4.6 1.0 1.5 0.5 0.3 0.9 0.6Alaska 76.2 70.3 -5.9 3.4 4.3 0.9 1.0 2.2 1.2Arizona 71.1 66.4 -4.7 8.7 11.0 2.3 3.5 6.7 3.2Arkansas 71.8 65.7 -6.1 0.9 2.3 1.4 0.4 1.5 1.1
California 70.4 67.3 -3.1 14.7 16.4 1.7 10.9 9.4 -1.5Colorado 75.3 72.7 -2.6 2.9 5.7 2.8 1.5 4.5 3.0Connecticut 74.8 71.0 -3.8 5.0 5.1 NS 2.6 4.0 1.4Delaware 71.9 64.8 -7.1 2.4 3.4 1.0 0.9 2.6 1.7District of Columbia 35.8 33.0 -2.8 4.8 5.5 NS 4.1 5.1 1.0Florida 67.9 63.4 -4.5 5.5 6.6 1.1 5.0 6.3 1.3Georgia 67.6 64.0 -3.6 1.6 3.9 2.3 1.1 3.4 2.3Hawaii 74.2 67.0 -7.2 5.6 6.2 0.6 4.7 5.3 0.6Idaho 81.8 77.1 -4.7 2.0 3.2 1.2 1.0 2.6 1.6Illinois 72.0 68.8 -3.2 4.8 7.0 2.2 2.9 4.8 1.9Indiana 75.5 70.4 -5.1 1.8 2.3 0.5 0.4 1.3 0.9Iowa 81.0 75.9 -5.1 1.4 2.5 1.1 0.5 1.9 1.4Kansas 78.9 74.2 -4.7 1.8 3.4 1.6 1.1 2.6 1.5Kentucky 75.2 69.3 -5.9 1.0 1.5 0.5 0.3 1.0 0.7Louisiana 64.0 58.3 -5.7 1.8 1.7 NS 0.7 0.7 NSMaine 77.3 71.5 -5.8 1.1 1.1 NS 0.4 1.0 0.6Maryland 69.5 65.7 -3.8 2.7 3.4 0.7 2.6 3.8 1.2Massachusetts 74.5 71.3 -3.2 5.3 5.5 0.2 3.5 4.5 1.0Michigan 70.9 67.8 -3.1 1.6 2.5 0.9 0.9 2.3 1.4Minnesota 80.9 76.1 -4.8 2.0 3.9 1.9 1.2 3.4 2.2Mississippi 62.1 56.4 -5.7 1.1 1.3 0.2 0.2 0.5 0.3Missouri 74.3 68.0 -6.3 1.3 1.9 0.6 0.4 1.3 0.9Montana 77.7 72.3 -5.4 0.9 1.5 0.6 0.3 0.7 0.4Nebraska 80.6 75.1 -5.5 1.0 3.3 2.3 0.5 2.5 2.0Nevada 70.4 65.7 -4.7 4.4 9.4 5.0 3.7 6.8 3.1New Hampshire 80.8 75.5 -5.3 1.3 1.5 0.2 0.7 1.7 1.0New Jersey 73.7 72.0 -1.7 6.0 6.5 0.5 4.6 6.5 1.9New Mexico 70.1 63.2 -6.9 10.4 10.1 NS 2.2 3.8 1.6New York 68.3 64.7 -3.6 8.1 8.8 0.7 6.1 7.1 1.0North Carolina 70.0 66.3 -3.7 1.8 3.5 1.7 0.6 2.9 2.3North Dakota 83.0 77.1 -5.9 0.7 1.2 0.5 0.1 1.1 1.0Ohio 73.5 68.2 -5.3 1.8 2.0 0.2 0.5 1.1 0.6Oklahoma 74.3 67.9 -6.4 1.5 2.7 1.2 0.7 1.8 1.1
Oregon 74.6 70.8 -3.8 2.5 5.5 3.0 1.8 4.4 2.6Pennsylvania 74.8 69.9 -4.9 2.5 2.9 0.4 0.9 1.7 0.8Rhode Island 73.9 66.8 -7.1 5.5 6.6 1.1 4.2 4.5 NSSouth Carolina 66.9 61.6 -5.3 1.2 2.0 0.8 0.4 1.2 0.8South Dakota 79.6 73.0 -6.6 1.3 2.4 1.1 0.2 1.2 1.0Tennessee 70.7 65.6 -5.1 1.1 1.8 0.7 0.5 1.4 0.9Texas 72.5 68.6 -3.9 11.2 12.1 0.9 4.0 5.9 1.9Utah 84.3 81.1 -3.2 1.8 3.6 1.8 0.9 3.2 2.3Vermont 77.5 72.8 -4.7 0.8 1.3 0.5 0.4 1.7 1.3Virginia 73.7 69.4 -4.3 2.2 3.4 1.2 2.2 3.3 1.1
Washington 75.1 71.5 -3.6 3.3 5.3 2.0 2.5 5.0 2.5West Virginia 76.9 70.5 -6.4 0.8 0.8 NS 0.2 0.4 0.2Wisconsin 77.4 73.2 -4.2 2.0 3.3 1.3 0.9 2.0 1.1
Wyoming 79.7 73.6 -6.1 1.2 1.5 0.3 0.4 0.8 0.4
a Children under 18 excludes householders, subfamily reference persons, or their spouses and those living in group quarters.b Children in married-couple families are the never-married biological, adopted, and step-sons and step-daughters of a marriedhouseholder or a married subfamily reference person.C Children with difficulty speaking English are between 5 and 17 years, speak a language other than English at home, and speak Englishless than "very well." This group includes those who speak English "well," "not very well," and "not at all."d Foreign-born children are those not born in the 50 States, the District of Columbia, U.S. outlying territories, or abroad to American parents.c Represents the percentage point change from 1990 to 2000. "NS" indicates nonsignificant change at the 90-percent confidence level.SOURCE: U.S. Census Bureau, 1990 and 2000 Censuses.
1113 America's Children: Key National Indicators of Well-Being, 2003 140

Table SPECIALLB Economic security: Selected economic security indicators of child well-being bystate, 1990 and 2000
Living in crowded housingb
Percent of children under 18°In families in poverty` Living with at least one parent
who is employed full timed
1990 2000 Changee 1990 2000 Changee 1990 2000 Change'
Nation 16.2 19.0 2.8 17.7 16.0 -1.7 76.9 82.6 5.7
StateAlabama 13.3 11.7 -1.6 23.7 21.0 -2.7 74.9 80.3 5.4Alaska 20.8 24.8 4.0 10.7 11.0 NS 74.4 83.0 8.6Arizona 25.5 29.5 4.0 21.4 18.6 -2.8 76.1 82.2 6.1Arkansas 15.3 15.0 NS 24.8 21.2 -3.6 75.3 81.5 6.2California 34.6 41.3 6.7 17.6 18.8 1.2 73.1 78.7 5.6Colorado 9.7 14.7 5.0 14.8 10.7 -4.1 80.6 86.6 6.0Connecticut 8.6 9.7 1.1 10.2 10.0 NS 80.1 85.3 5.2Delaware 8.3 10.1 1.8 11.5 11.8 NS 81.7 84.1 2.4District of Columbia 31.6 35.6 4.0 24.7 31.0 6.3 59.8 61.3 1.5Florida 19.8 22.0 2.2 18.1 17.0 -1.1 77.1 81.7 4.6Georgia 13.9 15.9 2.0 19.5 16.6 -2.9 76.3 82.4 6.1Hawaii 37.4 40.3 2.9 10.9 13.4 2.5 79.1 77.4 -1.7Idaho 14.0 15.8 1.8 15.5 13.6 -1.9 82.5 87.6 5.1Illinois 14.1 17.0 2.9 16.6 13.8 -2.8 77.5 83.3 5.8Indiana 8.6 9.2 0.6 13.8 11.6 -2.2 81.5 86.5 5.0Iowa 5.9 7.9 2.0 13.8 10.4 -3.4 84.4 89.0 4.6Kansas 9.0 11.3 2.3 13.7 11.4 -2.3 83.9 88.7 4.8Kentucky 9.9 8.6 -1.3 24.2 20.2 -4.0 73.9 81.3 7.4Louisiana 20.1 18.9 -1.2 30.9 26.1 -4.8 68.3 76.2 7.9Maine 6.3 5.5 -0.8 13.0 12.9 NS 77.9 84.1 6.2Maryland 9.2 11.2 2.0 10.8 10.2 -0.6 80.6 84.9 4.3Massachusetts 8.8 9.8 1.0 12.8 11.5 -1.3 76.6 83.2 6.6Michigan 9.5 11.7 2.2 18.1 13.3 -4.8 73.2 83.8 10.6Minnesota 7.1 10.6 3.5 12.3 9.1 -3.2 82.3 88.4 6.1Mississippi 20.9 18.4 -2.5 33.1 26.5 -6.6 68.9 76.4 7.5Missouri 9.8 10.2 0.4 17.3 15.1 -2.2 79.2 85.0 5.8Montana 9.9 12.5 2.6 19.8 18.2 -1.6 77.2 84.2 7.0Nebraska 6.3 9.9 3.6 13.3 11.7 -1.6 86.2 88.7 2.5Nevada 19.7 27.3 7.6 12.8 13.4 0.6 81.1 84.0 2.9New Hampshire 5.8 5.9 NS 7.0 7.2 NS 84.1 88.5 4.4New Jersey 12.4 14.6 2.2 10.9 10.7 -0.2 80.4 85.1 4.7New Mexico 24.2 25.1 0.9 27.3 24.4 -2.9 72.9 78.9 6.0New York 19.7 22.8 3.1 18.6 19.5 0.9 73.3 77.4 4.1North Carolina 11.1 12.7 1.6 16.7 15.6 -1.1 79.0 83.8 4.8North Dakota 7.4 8.3 0.9 16.7 13.4 -3.3 82.0 88.5 6.5Ohio 7.2 7.3 0.1 17.4 13.9 -3.5 76.7 84.7 8.0Oklahoma 12.1 14.1 2.0 21.2 19.0 -2.2 77.8 83.5 5.7Oregon 12.3 17.5 5.2 15.0 13.9 -1.1 78.3 83.8 5.5Pennsylvania 7.3 8.1 0.8 15.2 14.2 -1.0 78.2 83.9 5.7Rhode Island 8.9 11.1 2.2 13.4 16.4 3.0 76.2 80.7 4.5South Carolina 14.8 12.6 -2.2 20.5 18.3 -2.2 76.3 81.3 5.0South Dakota 11.4 13.3 1.9 19.7 16.5 -3.2 83.2 86.1 2.9Tennessee 10.8 11.3 0.5 20.5 17.5 -3.0 76.6 82.5 5.9Texas 24.8 14.9 -9.9 23.8 20.0 -3.8 76.4 82.8 6.4Utah 15.2 15.4 NS 12.1 9.6 -2.5 85.8 88.8 3.0Vermont 6.0 6.0 NS 11.4 10.6 -0.8 79.9 85.9 6.0Virginia 9.4 10.6 1.2 12.8 11.8 -1.0 81.3 85.6 4.3Washington 12.2 16.9 4.7 13.8 13.0 -0.8 78.6 84.3 5.7West Virginia 7.7 6.6 -1.1 25.6 23.7 -1.9 70.7 79.0 8.3Wisconsin 8.4 10.3 1.9 14.4 10.7 -3.7 80.8 87.8 7.0Wyoming 9.1 10.6 1.5 14.1 13.7 NS 82.4 87.0 4.6
' Children under 18 excludes householders, subfamily reference persons, or their spouses and those living in group quarters.b Children living in crowded housing live in a house where the number of people per room is greater than 1.C Child poverty includes children living in households who are related to the householder and whose family income and family size put thechild below the poverty threshold. Poverty data collected in the 1990 and 2000 censuses refer to poverty in calendar year 1989 and 1999,respectively. The average poverty threshold for a family of four was $12,674 in 1989 and $17,029 in 1999.d Children of at least one parent employed full time include children who are the never-married biological, adopted, and step sons anddaughters of a householder or a subfamily reference person who are living with one or two parents who are employed and working at least35 hours per week.e Represents the percentage point change from 1990 to 2000. "NS" indicates nonsignificant change at the 90-percent confidence level.SOURCE: U.S. Census Bureau, 1990 and 2000 Censuses.
Appendix A: Detailed Tables 1111

Table SPECIALl.0 Education: Selected educational indicators of child well-being by state, 1990 and2000
3- to 5-year olds enrolledin preprimary education'b
Percent of18- to 24-year olds whocompleted high schools
16- to 19-year olds neitherworking nor in school°
1990 2000 Changed 1990 2000 Changed 1990 2000 Changed
Nation 42.0 61.4 19.4 83.6 82.4 -1.2 9.9 9.0 -0.9StateAlabama 40.7 59.4 18.7 80.7 79.1 -1.6 11.1 10.7 -0.4Alaska 37.3 51.6 14.3 87.1 85.9 -1.2 11.5 10.3 -1.2Arizona 35.0 53.0 18.0 79.9 76.0 -3.9 11.7 11.9 NSArkansas 33.8 56.5 22.7 81.9 82.0 NS 11.4 10.3 -1.1California 43.0 59.8 16.8 76.2 78.0 1.8 11.1 9.4 -1.7Colorado 40.4 61.5 21.1 87.0 82.0 -5.0 8.1 9.6 1.5Connecticut 53.7 72.2 18.5 88.3 86.9 -1.4 7.7 7.0 -0.7Delaware 47.7 64.1 16.4 87.2 83.7 -3.5 7.4 9.2 1.8District of Columbia 58.0 76.4 18.4 82.3 84.9 2.6 14.3 14.4 NSFlorida 44.1 65.0 20.9 79.7 79.7 NS 10.9 9.3 -1.6Georgia 40.5 67.3 26.8 80.2 77.1 -3.1 11.1 10.9 NSHawaii 50.2 63.4 13.2 92.1 91.5 -0.6 7.8 8.9 1.1Idaho 33.4 50.0 16.6 84.9 85.1 NS 7.9 7.6 NSIllinois 44.7 64.1 19.4 85.4 83.0 -2.4 9.8 9.1 -0.7Indiana 35.2 50.9 15.7 84.9 84.0 -0.9 9.7 8.3 -1.4Iowa 40.6 58.8 18.2 92.1 90.2 -1.9 6.2 5.3 -0.9Kansas 37.1 59.4 22.3 88.7 86.2 -2.5 7.5 6.9 -0.7Kentucky 33.6 57.1 23.5 81.1 82.0 0.9 13.3 11.0 -2.3Louisiana 45.7 66.9 21.2 80.0 79.5 -0.5 13.8 12.1 -1.7Maine 39.7 58.0 18.3 88.4 89.8 1.4 8.4 6.3 -2.1Maryland 50.9 69.5 18.6 86.0 86.4 0.4 9.3 8.6 -0.7Massachusetts 49.0 69.7 20.7 89.1 90.0 0.9 8.0 6.5 -1.5Michigan 46.4 63.0 16.6 86.2 85.1 -1.1 9.9 7.7 -2.2Minnesota 35.6 58.6 22.9 92.0 89.5 -2.5 5.8 4.9 -0.9Mississippi 43.0 62.8 19.8 80.6 78.5 -2.1 11.9 12.0 NSMissouri 35.8 58.0 22.2 85.0 84.3 -0.7 10.1 8.9 -1.2Montana 33.0 54.1 21.1 88.2 88.4 NS 7.6 7.7 NSNebraska 37.0 57.9 20.9 91.8 88.6 -3.2 5.8 5.8 NSNevada 34.2 49.5 15.3 78.0 72.6 -5.4 11.5 12.3 NSNew Hampshire 39.2 61.9 22.7 87.4 88.4 1.0 7.6 5.2 -2.4New Jersey 51.4 72.8 21.4 86.6 85.4 -1.2 8.7 7.5 -1.2New Mexico 33.8 52.9 19.1 81.6 78.8 -2.8 11.4 11.8 NSNew York 50.2 69.4 19.2 85.4 83.8 -1.6 9.9 9.2 -0.7North Carolina 39.3 62.1 22.8 84.0 80.2 -3.8 9.5 10.3 0.8North Dakota 28.8 48.4 19.6 94.3 93.8 -0.5 4.8 4.6 NSOhio 37.5 59.2 21.7 86.3 85.4 -0.9 9.0 7.7 -1.3Oklahoma 36.3 58.9 22.6 84.9 82.9 -2.0 10.5 9.4 -1.1Oregon 36.6 53.2 16.6 83.2 81.8 -1.4 9.8 9.3 NSPennsylvania 42.0 60.6 18.6 88.1 88.3 0.2 8.7 7.3 -1.4Rhode Island 45.0 65.8 20.8 86.2 87.9 1.7 8.4 8.2 NSSouth Carolina 46.8 65.1 18.3 82.6 80.8 -1.8 9.5 10.6 1.1South Dakota 30.1 52.5 22.4 90.2 88.0 -2.2 6.6 7.5 0.9Tennessee 35.3 56.9 21.6 80.6 81.9 1.3 11.7 9.2 -2.5Texas 39.9 58.4 18.5 78.8 76.0 -2.8 11.1 10.7 -0.4Utah 38.3 53.3 15.0 87.8 87.2 -0.6 8.0 7.4 -0.6Vermont 41.1 61.7 20.6 89.7 91.2 1.5 7.1 5.6 -1.5Virginia 44.1 63.8 19.7 85.8 86.5 0.7 8.3 7.5 -0.8Washington 39.7 56.9 17.2 85.5 84.2 -1.3 8.8 8.2 -0.6West Virginia 31.0 50.5 19.5 82.4 85.4 3.0 13.1 11.6 -1.5Wisconsin 38.2 58.7 20.5 89.4 88.0 -1.4 6.0 5.8 NSWyoming 33.8 55.2 21.4 89.2 88.4 NS 7.7 7.3 NS
a Excludes children living in group quarters.b Enrolled in preprimary education includes children in kindergarten, preschool, or nursery school.
Universe excludes those still enrolled in high school or below.d Represents the percentage point change from 1990 to 2000. "NS" indicates nonsignificant change at the 90-percent confidence level.
SOURCE: U.S. Census Bureau, 1990 and 2000 Censuses.
111 America's Children: Key National Indicators of Well-Being, 2003S- 142

Appendix B: DataSource Descriptions
143

Data Source Descriptions
Aerometric Information Retrieval System 131
American Housing Survey 131
Continuing Survey of Food Intakes by Individuals 131
Current Population Survey 132
Decennial Census Data 132
High School and Beyond 134
Monitoring the Future 134
National Assessment of Educational Progress 135
National Assessment of Educational Progress High School Transcript Studies 135
National Crime Victimization Survey 135
National Education Longitudinal Study of 1988 136
National Health and Nutrition Examination Survey 136
National Health Interview Survey 137
National Household Education Survey 138
National Immunization Survey 138
National Linked File of Live Births and Infant Deaths 139
National Vital Statistics System 139
Population Estimates 140
Population Projections 141
Survey of Income and Program Participation 141
Surveys on Radon Awareness and Environmental Tobacco Smoke Issues 141
Uniform Crime Reports 142
130 America's Children: Key National Indicators of Well-Being, 2003rd;
144

Data Source Descriptions
Aerometric Information Retrieval SystemThe Aerometric Information Retrieval System (AIRS)is a repository of information about airborne pollutionin the United States and various World HealthOrganization (WHO) member countries. The systemis administered by the U.S. Environmental ProtectionAgency (EPA), Office of Air Quality Planning andStandards (OAQPS), Information Transfer andProgram Integration Division (ITPID), located inResearch Triangle Park, North Carolina. Data oncriteria pollutants consist of air quality measurementscollected by sensitive monitoring equipment atthousands of sites across the Nation operated by Stateand local environmental agencies. Each monitormeasures the concentration of a particular pollutantin the air. Monitoring data indicate the averagepollutant concentration during a time interval, usually1 hour or 24 hours.
Information on the AIRS system is available online athttp://www.epa.gov/airs.
Information about surveys on radon awareness andenvironmental tobacco smoke issues is available onlineat http://www.epa.gov/envirohealth/children.
Agency Contact:Barbara ParzygnatU.S. Environmental Protection AgencyPhone: (919) 541-5474
American Housing SurveyThis survey provides data necessary for evaluatingprogress toward "a decent home and a suitable livingenvironment for every American family," affirmed in1949 and 1968 legislation. The data come from a U.S.Census Bureau nationwide sample survey in odd-numbered years for national, regional, andmetropolitan/non-metropolitan data and from surveys in47 metropolitan statistical areas over a multi-year cycle.These data detail the types, size, conditions, characteristics,costs and values, equipment, utilities, and dynamics of thehousing inventory; describe the demographic, financial,and mobility characteristics of the occupants; and givesome information on neighborhood conditions. In 1997,the survey was conducted using computer-assisted personalinterviewing for the first time, and questions on rentalassistance and physical problems were also changed.Therefore, data from 1997, 1999, and 2001 on assistedfamilies, priority problems, and severe physical problemsare not comparable to earlier data.
Information about the American Housing Survey isavailable online athttp://www.census.gov/hhes/www/ahs.html.
Agency Contact:Kathy NelsonU.S. Department of Housing and Urban DevelopmentPhone: (202) 708-1520, x5917
Continuing Survey of FoodIntakes by Individuals
The Continuing Survey of Food Intakes by Individuals(CSFII) is designed to measure what Americans eatand drink. Uses of the survey include monitoring thenutritional adequacy of American diets, measuring theimpact of food fortification on nutrient intakes,developing dietary guidance and related programs,estimating exposure of population groups to foodcontaminants, evaluating the nutritional impact offood assistance programs, and assessing the need foragricultural products. Individuals were asked toprovide 3 consecutive days of dietary data. The 1994-96CSFII also included individuals living in householdsand oversampling of the low-income population. Ineach of the 3 survey years, respondents were asked toprovide, through in-person interviews, food intakedata on 2 nonconsecutive days, with both days ofintake collected by the 24-hour recall method. The1998 sample of children ages 2 to 9 was designed as asupplement to the 1994-1996 CSFII. Dietary recallmethods were the same in both samples. Intake datawere provided for 3,937 children under 18 years of agein 1989-91, and 4,011 children ages 2 to 9 in 1998.
For more information on the CSFII 1989-91, seeTippett, KS., Mickle, SJ., Goldman, J.D., et al. (1995).Food and nutrient intakes by individuals in the UnitedStates, 1 day, 1989-91 (NFS Rep. No. 91-2). U.S.Department of Agriculture, Agricultural ResearchService.
For more information on the CSFII 1994-96, seeTippett, KS. and Cypel, Y.S. (Eds.). (1998). Design andoperation: The Continuing Survey of Food Intakes byIndividuals and the Diet and Health Knowledge Survey,1994-96 (NFS Rep. No. 96-1). U.S. Department ofAgriculture, Agricultural Research Service.
Information about the CSFII is available online athttp://www.barc.usda.gov/bhnrc/foodsurvey/home.htm.
Agency Contact:Manna MoshfeghAgricultural Research ServiceU.S. Department of AgriculturePhone: (301) 734-8457
For information on the Healthy Eating Index:P. Peter BasiotisCenter for Nutrition Policy and PromotionU.S. Department of AgriculturePhone: (703) 305-7600
4 14Appendix B: Data Source Descriptions III

Current Population SurveyCore survey and supplements. The Current PopulationSurvey (CPS) is a nationwide survey of about 60,000households conducted monthly for the Bureau of LaborStatistics by the U.S. Census Bureau. At present, thereare 754 CPS sampling areas in the United States, withcoverage in every State and the District of Columbia.
The CPS core survey is the primary source ofinformation on the employment characteristics of thenoninstitutionalized civilian population, ages 15 andolder, including estimates of unemployment releasedevery month by the Bureau of Labor Statistics.
In addition to the core survey, monthly CPSsupplements provide additional demographic and socialdata. The March demographic supplement and theOctober school enrollment supplement provideinformation used to estimate the status and well-being ofchildren. The March and October supplements havebeen administered every year since 1947. Every year, theOctober supplement to the CPS asks questions onschool enrollment by grade and other schoolcharacteristics about each member of the householdages 3 and older. Data on the highest level of schoolcompleted or degree attained are derived from theMarch supplement to the CPS. The April foodsecurity supplement, introduced in 1995, is describedin detail below.
In 1994, the CPS questionnaire was redesigned, and thecomputer-assisted personal interviewing method wasimplemented. In addition, the 1990 Census-basedpopulation controls, with adjustments for the estimatedpopulation undercount, were introduced. For moreinformation regarding the CPS, its sampling structure,and estimation methodology, see U.S. Department ofLabor, Bureau of Labor Statistics. (1997). Explanatorynotes and estimates of error. Employment and Earnings,44 (1), 225-242.
Effective with the release of July 2001 data, official laborforce estimates from the CPS reflect the expansion ofthe monthly CPS sample from about 50,000 to about60,000 eligible households. This expansion of themonthly CPS sample was one part of the CensusBureau's plan to meet the requirements of the StateChildren's Health Insurance Program (SCHIP)legislation. The SCHIP legislation requires the CensusBureau to improve state estimates of the number ofchildren who live in low-income families and lack healthinsurance. These estimates are obtained from theAnnual Demographic Supplement to the CPS. InSeptember 2000, the Census Bureau began expandingthe monthly CPS sample in 31 states and the District ofColumbia. States were identified for samplesupplementation based on the standard error of theirMarch estimate of low-income children without health
111/1 America's Children: Key National Indicators of WellBeing, 2003
insurance. The additional 10,000 households wereadded to the sample over a 3-month period. A morecomprehensive description of the CPS that incorporatesthe revisions and methodological changes introduced in1994 and in July 2001 may be accessed athttp://www.censtis.gov/prod/2002pubs/tp63rv.pdf.
Food security supplement. The food security supplement isa survey instrument developed through a long andrigorous process. The content of the supplement isbased on material reported in prior research on hungerand food security. It was subjected to extensive testing bythe U.S. Census Bureau. It reflects the consensus ofnearly 100 experts at the 1994 Food Security andMeasurement Conference convened jointly by theNational Center for Health Statistics and the Food andNutrition Service of the U.S. Department of Agriculture.The supplement was developed, tested, and refinedfurther by the conferees, members of a Federalinteragency working group, and survey methodsspecialists for the U.S. Census Bureau's Center forSurvey Methods Research. The survey contains asystematic set of questions validated as measures ofseverity of food insecurity on both a 12-month and a 30-day basis. Data presented in this report are 12-monthdata from the CPS food security supplements. Therespondents completing the supplement includedhouseholds at all income levels, both above and belowthe Federal poverty threshold. Special final supplementsample weights were computed to adjust for thedemographic characteristics of supplement non-interviews.
Economic Research Service, Food Security BriefingRoom: http://www.ers.usda.gov/briefing/foodsecurity/
Information about the CPS is available online athttp://www.b1s.census.gov/cps/cpsmain.htm.
Agency Contacts:For information on food security:Dawn AldridgeFood and Nutrition ServiceU.S. Department of AgriculturePhone: (703) 305-2132
For information on family structure:Fertility and Family Statistics BranchU.S. Census BureauPhone: (301) 763-2416
For information on secure parental employment,family income, and youth neither enrolled in schoolnor working:David JohnsonBureau of Labor StatisticsPhone: (202) 691-6580
146

For information on poverty, family income,and access to health care:Poverty and Health Statistics BranchU.S. Census BureauPhone: (301) 763-3215
For information on higher education:Tom SnyderNational Center for Education StatisticsE-mail: [email protected]
For information on difficulty speaking English:Edie McArthurNational Center for Education StatisticsE-mail: [email protected]
For information on high school completion:Chris ChapmanNational Center for Education StatisticsE-mail: [email protected]
For information on early childhood education:Jerry WestNational Center for Education StatisticsE-mail: [email protected]
Decennial Census DataEvery ten years, beginning with the first census in 1790,the United States government conducts a census, orcount, of the entire population as mandated by the U.S.Constitution. The 1990 and 2000 censuses were takenApril 1 of their respective years. As in several previouscensuses, two forms were useda short form and a longform. The short form was sent to every household, andthe long form, containing the 100 percent questions,plus the sample questions, was sent to approximatelyone in every six households.
The Census 2000 short form questionnaire includedseven questions for each household: name, sex, age,relationship, Hispanic origin, race, and whether thehousing unit was owned or rented. The long form askedmore detailed information on subjects such aseducation, employment, income, ancestry, homeownercosts, units in a structure, number of rooms, plumbingfacilities, etc. Decennial censuses not only count thepopulation but also sample the socio-economic status ofthe population, provide a tool for the government,educators, business owners, and others to get a snapshotof the state of the Nation. A more comprehensivedescription of Census 2000 is available athttp://www.census.gov/mso/www/c2000basics.
The data contained in this special section are based onthe sample of households who responded to the 1990and 2000 Census long form questionnaires. Nationally,approximately one out of every six housing units wasincluded in this sample. As a result, the sample estimatesmay differ somewhat from the100-percent figures thatwould have been obtained Wall housing units, peoplewithin those housing units, and people living in groupquarters had been enumerated using the samequestionnaires, instructions, enumerators, and so forth.The sample estimates also differ from the values thatwould have been obtained from different samples ofhousing units, people within those housing units, andpeople living in group quarters. The deviation of asample estimate from the average of all possible samplesis called the sampling error.
In addition to the variability that arises from thesampling procedures, both sample data and 100-percentdata are subject to nonsampling error. Nonsamplingerror may be introduced during any of the variouscomplex operations used to collect and process data.Such errors may include: not enumerating everyhousehold or every person in the population, failing toobtain all required information from the respondents,obtaining incorrect or inconsistent information, andrecording information incorrectly. In addition, errorscan occur during the field review of the enumerators'work, during clerical handling of the censusquestionnaires, or during the electronic processing ofthe questionnaires.
Nonsampling error may affect the data in two ways: (1)errors that are introduced randomly will increase thevariability of the data and, therefore, should be reflectedin the standard errors; and (2) errors that tend to beconsistent in one direction will bias both sample and100-percent data in that direction. For example, ifrespondents consistently tend to underreport theirincomes, then the resulting estimates of households orfamilies by income category will tend to be understatedfor the higher income categories and overstated for thelower income categories. Such biases are not reflectedin the standard errors.
While it is impossible to completely eliminate error froman operation as large and complex as the decennialcensus, the Census Bureau attempts to control thesources of such error during the data collection andprocessing operations. The primary sources of error andthe programs instituted to control error in Census 2000are described in detail in Summary File 3 TechnicalDocumentation in Chapter 8, "Accuracy of the Data,"located athttp://www.census.gov/prod/cen2000/doc/sf3.pdf.
1 7 Appendix B: Data Source Descriptions II

All statements in this special Census section haveundergone statistical testing and all comparisons aresignificant at the 90-percent confidence level, unlessotherwise noted. The estimates in tables, maps, andother figures may vary from actual values due tosampling and nonsampling errors. As a result,estimates in one category may not be significantlydifferent from estimates assigned to a differentcategory. Further information on the accuracy of thedata is located athttp://www.census.gov/prod/cen2000/doc/sf3.pdf.
Agency Contacts:For information on the indicators:Kristin SmithU.S. Census BureauPhone: (301) 763-2416
For further information on the computation and useof standard errors:Decennial Statistical Studies DivisionU.S. Census BureauPhone: (301) 763-4242
High School and Beyond
The High School and Beyond (HS&B) longitudinalsurvey was first administered in 1980 to a stratified,nationally representative sample of approximately30,000 high school sophomores and 28,000 highschool seniors from more than 1,000 high schools.Follow-up surveys were administered in 1982, 1984,1986, and 1992. In-school waves (1980 and 1982)entailed the administration of a student questionnaireand a cognitive test battery. In the Base Year (1980),data were also collected from students' parents andschool principals, while the teachers of sampledstudents were asked to complete a checklist onstudents' behavior and performance in class. As part ofthe First Follow-up, high school transcripts werecollected for a probability subsample of nearly 18,500members of the 1980 sophomore cohort. The sampledesign for the transcript study increased therepresentation of racial/ethnic minorities, privateschool students, dropouts, transfer students, earlygraduates, and students whose parents had previouslycompleted a parent questionnaire. The mode of datacollection for the out-of-school waves of the study wasself-administered mail-back questionnaires in 1984 and1986 and Computer Assisted Telephone Interviewing(CATI) in 1992. In addition, a postsecondary schooltranscript study was conducted for First and SecondFollow-up senior cohort respondents and Third andFourth Follow-up sophomore cohort respondents whoreported attending postsecondary institutions in thosewaves of the study.
111 America's Children: Key National Indicators of Well-Being, 2003
In this report, the analysis sample for the indicatorsthat used HS&B high school transcript dataconsisted of all 1982 high school graduates withcomplete transcripts. Of the 15,941 students on thetranscript file, 11,195 students were high schoolgraduates with complete transcripts.
Information on the HS&B First Follow-up and thehigh school transcript study can be found inJones, C., et al. (1983). High School and Beyond, 1980Sophomore Cohort, First Follow-up (1982), Data file user'smanual. Washington, DC: National Center forEducation Statistics. Jones, C., et al. (1983). HighSchool and Beyond Transcript Survey (1982), Data fileuser's manual. Washington, DC: National Center forEducation Statistics.
Information about HS&B is available online athttp://nces.ed.gov/surveys/hsb/.
Agency Contact:Aurora D'AmicoNational Center for Education StatisticsE-mail: Aurora.D'[email protected]
Monitoring the FutureThe Monitoring the Future (MTF) Study is acontinuing series of surveys intended to assess thechanging lifestyles, values, and preferences ofAmerican youth. Each year since 1975, high schoolseniors from a representative sample of public andprivate high schools have participated in this study.The 2002 survey is the 12th to include comparablesamples of 8th- and 10th-graders in addition toseniors. The study is conducted by the University ofMichigan's Institute for Social Research (ISR) under agrant from the National Institute on Drug Abuse. Thesurvey design consists of a multi-stage random samplewhere the stages include selection of geographicareas, selection of one or more schools in eachselected area, and selection of a sample of studentswithin each school. Data are collected in the spring ofeach year using questionnaires administered in theclassroom by representatives from ISR. The 2002survey included 13,544 high school seniors from 120schools, 14,683 10th-graders from 133 schools, and15,489 8th-graders from 141 schools (a total of 43,716students from 394 schools).
Information about MTF is available online athttp://www.nida.nih.gov/DrugPages/MTF.html andhttp://monitoringthefuture.org/
Agency Contact:James ColliverNational Institute on Drug AbusePhone: (301) 402-1846
148

National Assessment ofEducational ProgressThe National Assessment of Educational Progress(NAEP) is mandated by Congress to monitorcontinuously the knowledge, skills, and performance ofthe Nation's children and youth. To measure long-termtrends in educational performance, NAEP hasperiodically assessed students ages 9, 13, and 17 inreading, mathematics, and science since the early 1970s.To ensure accurate measurement of trends, items andprocedures have remained the same ineach assessment. A variation of matrix sampling is usedso that the results from a large number ofitems can be generalized to an entire population.Nationally representative samples of approximately15,000 students were assessed in each subject in 1999,the last year for which results were available as of thisprinting. An estimated 10 percent of the schoolpopulation is classified as having a disability or limitedEnglish proficiency. Nearly half of these students havebeen included in assessments, although the percentagesvary by grade and subject being assessed. In its short-term assessments described below, NAEP is starting tooffer accommodations to disabled and limitedEnglish proficient students to remove barriersto their participation.
NAEP also conducts assessments in various academicsubjects to measure short-term trends for periods ofapproximately 10 years. Data from many of theseassessments are available for participating States as wellas the Nation as a whole.
Students in public and nonpublic schools are sampled.A charter school could be sampled, since such schoolsare within the universe of public schools, but home-schoolers are not included.
Information about NAEP is available online athttp://nces.ed.gov/nationsreportcard.
Agency Contact:Arnold GoldsteinNational Center for Education StatisticsE-mail: [email protected]
National Assessment of EducationalProgress High School Transcript StudiesConducted in association with NAEP, the High SchoolTranscript Study (HSTS) provides coursetaking anddemographic information for a nationallyrepresentative, stratified sample of high school seniors.Sample sizes have ranged from approximately 21,000to 25,000 students in approximately 300 schools. TheHSTS provides the Department of Education andother education policymakers with information
regarding current course offerings and coursetakingpatterns in the Nation's secondary schools. Inaddition, it provides information on the relationshipof student coursetaking patterns to achievement asmeasured by NAEP. Excluded students were those whodid not graduate from high school, had not received a"regular" or "honors" diploma, or did not havecomplete transcript data. For all transcripts andsamples, a course identification code number, basedon the Classification of Secondary School Courses(CSSC), was assigned to each course taken by astudent. Courses were further classified into subject(e.g., mathematics) and program (e.g., academic)areas using a 1998 revision of the CSSC (Bradby, D.and Hoachlander, E.G. (1999). 1998 Revision of thesecondary school taxonomy. Washington, DC: NationalCenter for Education Statistics).
More information about the NAEP HSTS can befound in U.S. Department of Education. NationalCenter for Education Statistics. The 1998 High SchoolTranscript Study Tabulation: Comparative Data on CreditsEarned and Demographics for 1998, 1994, 1990, 1987,and 1982 High School Graduates, (NCES 2001-498) byStephen Roey, Nancy Caldwell, Keith Rust, EyalBlumstein, Tom Krenzke, Stan Legum, Judy Kuhn,Mark Waksberg, and Jacqueline Haynes.
Information about the NAEP High School TranscriptStudy is available online at http://nces.ed.gov/nationsreportcard/studies/hsts.asp.
Agency Contact:Janis BrownNational Center for Education StatisticsE-mail: [email protected]
National Crime Victimization SurveyThe National Crime Victimization Survey (NCVS) isthe Nation's primary source of information oncriminal victimization. In earlier years, researchersobtained data from a nationally representative sampleof roughly 49,000 households that include more than100,000 persons ages 12 and older on the frequency,characteristics, and consequences of criminalvictimization in the United States. In recent years, thesample size for the NCVS has been decreased. Thesample for the most recent year, 2000, was 43,000households and 80,000 persons ages 12 and older. Thesurvey reports the likelihood of victimization by rape,sexual assault, robbery, assault, theft, householdburglary, and motor vehicle theft for the population as awhole, as well as for segments of the population such asadolescents over age 11, women, the elderly, members ofvarious racial groups, city dwellers, and other groups.Victims are also asked whether they reported the
i4Appendix B: Data Source Descriptions III

incident to the police and, in the instances of personalviolent crimes, they are asked about the characteristics ofthe perpetrator. The NCVS provides the largest nationalforum for victims to describe the impact of crime andthe characteristics of violent offenders. It has beenongoing since 1973 and was redesigned in 1992.
Information about the NCVS is available online athttp://www.ojp.usdoj.gov/bjs/cvict.htm#Programs.
Agency Contact:Michael RandBureau of Justice StatisticsPhone: (202) 616-3494
National Education Longitudinal Studyof 1988
The National Education Longitudinal Study of 1988(NELS:88) is a longitudinal study of the 8th-gradeclass of 1988 sponsored by the National Center forEducation Statistics (NCES). The Base Year survey wasadministered to about 24,000 8th-graders in morethan 1,000 schools with an 8th-grade class. The First,Second, Third, and Fourth Follow-up surveys revisitedthe same sample of students in 1990, 1992, 1994, and2000 when most of the 1988 8th-graders were in 10th-grade, in 12th-grade, and then 2 and 6 years out ofhigh school. For each in-school follow-up, the studentsample was "freshened" to obtain a representativecross-sectional sample of 10th-graders (in 1990) and12th-graders (in 1992). In-school waves entailed theadministration of a student questionnaire and abattery of cognitive tests in the subject areas ofmathematics, English, science, and socialstudies/history. Students' teachers, principals, andparents were also surveyed. In addition, as part of theSecond Follow-up, high school transcripts werecollected for (1) all students attending a subset ofSecond Follow-up schools selected for the transcriptstudy; (2) all dropouts and dropouts attendingalternative programs who had attended high schoolfor a minimum of one term; (3) all early graduates;and (4) sample members with disabilities thatprevented them from completing a questionnaire andcognitive test battery in the Base Year, First Follow-up,and Second Follow-up. Transcripts were coded usingthe Classification of Secondary School Courses asupdated for the 1990 National Assessment ofEducational Progress, High School Transcript Study.Students were subsequently surveyed in the Third andFourth Follow ups through Computer AssistedTelephone Interviewing (CATI).
In this report the analysis sample for indicators thatused NELS:88 transcript data consisted of all 1992 highschool graduates with complete transcripts. Of the17,285 students on the transcript file, 13,506 studentswere high school graduates with complete transcripts.
Information on the NELS:88 Second Follow-up Surveyand the Transcript Study can be found in Ingels, S.J.,Dowd, KL., Baldridge, J.D., Stripe, J.L., Bartot, V.H.,and Frankel, M.R. (1994). National EducationLongitudinal Study of 1988 Second Follow-Up: Studentcomponent data file user's manual(NCES 94-374). Washington, DC: National Centerfor Education Statistics.
Ingels, SJ., Dowd, KL., Taylor, J.T., Bartot, V.H.,Frankel, M.R., and Pulliam, P.A. (1995). NationalEducation Longitudinal Study of 1988 Second Follow-Up:Transcript Component Data File User's Manual.Washington, DC: National Center for EducationStatistics (NCES 95-377).
Information about NELS 88 is available online athttp://nces.ed.gov/surveys/nels88/.
Agency Contact:Jeffrey OwingsNational Center for Education StatisticsE-mail: [email protected]
National Health and NutritionExamination SurveyThe National Health and Nutrition ExaminationSurvey (NHANES) is conducted by the NationalCenter for Health Statistics of the Centers for DiseaseControl and Prevention. The survey is designed toassess the health and nutritional status of the non-institutionalized civilian population through directphysical examinations and interviews, using a complexstratified, multi-stage, probability sampling design.Interviewers obtain information on personal anddemographic characteristics, including age, householdincome, and race and ethnicity by self-reporting or asreported by an informant. The first survey, NHANES I,was conducted during the period 1971-1974; NHANESII covered the period 1976-1980; and NHANES IIIcovered the period 1988-1994. Only NHANES III (inits first phase, conducted 1988-91), however, collecteddata on serum cotinine levels. NHANES III providedcotinine data for children ages 4-17. Descriptions ofthe survey design, the methods used in estimation, andthe general qualifications of the data are presented inthe following:
150
11:1 America's Children: Key Notional Indicators of Well-Being, 2003

Plan and Operation of the Third National Healthand Nutrition Examination Survey, 1988-94: Series1: Programs and Collection Procedures, No. 32.Vital and Health Statistics, Hyattsville, MD: NationalCenter for Health Statistics.
Starting in 1999, NHANES changed to a continuoussurvey visiting 15 U.S. locations per year and surveyingand reporting for approximately 5,000 peopleannually. However, two or more years of data arenecessary for adequate sample sizes for sub-groupanalyses.
NHANES Data Used to Calculate the Healthy Eating Index.The Federal Government's National Health andNutrition Examination Survey (NHANES) providesinformation on people's consumption of foods andnutrients, as well as extensive health-related data, andinformation about Americans' demographic andsocioeconomic characteristics. NHANES data for 1999-2000 the most recent data availablewere used tocompute the HEI. Previous HEI reports were based ondata from the Federal Government's ContinuingSurvey of Food Intakes by Individuals (CSFII).
NHANES 1999-2000 is a complex, multistageprobability sample of the civilian noninstitutionalizedpopulation of the United States. Individuals of all ageswere sampled. The NHANES 1999-2000 sampleincludes expanded samples of Mexican Americans,African Americans, adolescents 12 to 19 years, andadults 60 years and older. In 2000, the sampleindividual selection probabilities were modified toincrease the number of sampled persons in low-income, non-Hispanic White population domains.Additionally, screening and sampling rates wereadjusted for women of childbearing age to increasethe number of pregnant women included in thesample. Statistical weights were used to make thesample representative of the U.S. population. Formore information on the NHANES data, seehttp://www.cdc.gov/nchs/data/nhanes/guidelinesl.pdf.
The HEI was computed for all individuals 2 years andolder, because dietary guidelines are applicable topeople of these ages only. Pregnant women wereexcluded from this analysis because of their specialdietary needs. The final analytical sample size was8,070 people.
Information about NHANES is available online athttp://www.cdc.gov/nchs/nhanes.htm.
Agency Contacts:For information on overweight:Cynthia OgdenNational Center for Health StatisticsPhone: (301) 458-4405
For information on the Healthy Eating Index:Peter BasiotisCenter for Nutrition Policy and PromotionUnited States Department of AgriculturePhone: (703) 305-7600
National Health Interview SurveyThe National Health Interview Survey (NHIS) is acontinuing nationwide sample survey of thenoninstitutionalized civilian population in which dataare collected during personal household interviews.Interviewers obtain information on personal anddemographic characteristics, including race andethnicity, by self-reporting or as reported by a memberof the household. Investigators also collect data aboutillnesses, injuries, impairments, chronic conditions,activity limitation caused by chronic conditions,utilization of health services, and other health topics.Each year the survey is reviewed and special topics areadded or deleted. For most health topics, the surveycollects data over an entire year.
The NHIS sample includes an oversample of Black andHispanic persons and is designed to allow thedevelopment of national estimates of health conditions,health service utilization, and health problems of thenoninstitutionalized civilian population of the UnitedStates. The response rate for the ongoing part of thesurvey has been between 94 and 98 percent over theyears. In 1997, the NHIS was redesigned; estimatesbeginning in 1997 are likely to vary slightly from thosefor previous years. Interviewers collected information forthe basic questionnaire on 100,618 persons in 2000,including 28,495 children.
Descriptions of the survey design, the methods used inestimation, and the general qualifications of the data arepresented in:
Massey, J.T., Moore, T.F., Parsons, V.L., and Tadros, W.(1989). Design and estimation for the NationalHealth Interview Survey, 1985-1994. Vital and HealthStatistics, 2 (110). Hyattsville, MD: National Centerfor Health Statistics.
Botman, S.L., Moore, T.F., Moriarity, C.L., andParsons, V.L. (2000). Design and estimation for theNational Health Interview Survey, 1995-2004. Vital andHealth Statistics, 2 (130). Hyattsville, MD: NationalCenter for Health Statistics.
Appendix B: Data Source Descriptions
151

Additional background and health data for childrenare available in Blackwell, D and Tonthat, L. (2002).Summary statistics for U.S. children: National HealthInterview Survey, 1998. Vital and Health Statistics, 10(208). Hyattsville, MD: National Center for HealthStatistics.
Information about the NHIS is available online ath ttp://www.cdc.gov/n chs/n h is. h tm.
Agency Contacts:For information on activity limitations and generalhealth status:John KielyNational Center for Health StatisticsPhone: (301) 458-4432
For information on usual source of health care:Robin CohenNational Center for Health StatisticsPhone: (301) 458-4152
National Household Education SurveyThe National Household Education Surveys Program(NHES), conducted by the National Center forEducation Statistics (NCES), collects detailedinformation about education issues through ahousehold-based survey using telephone interviews.The sample for the NHES is drawn from thenoninstitutionalized civilian population in householdshaving a telephone in the 50 States and the District ofColumbia. In each survey, between 44,000 and 60,000households are screened to identify persons eligiblefor one of the topics. Generally, each collection coverstwo topical surveys, and researchers conduct between2,500 and 25,000 interviews for each survey. The dataare weighted to permit nationally representativeestimates of the population of interest. In addition,the NHES design samples minorities at a higher ratethan nonminorities to increase the reliability ofestimates for these groups.
The 1991 NHES included a survey on early childhoodprogram participation. Investigators screenedapproximately 60,000 households to identify a sampleof about 14,000 children, ages 3 to 8. They interviewedparents in order to collect information about thesechildren's educational activities and the role of thefamily in the children's learning. In 1993, NCESfielded a school readiness survey in which parents ofapproximately 11,000 children age 3 through secondgrade were asked about their children's experiences inearly childhood programs, developmental level, schooladjustment and related problems, early primary schoolexperiences, general health and nutrition status, homeactivities, and family characteristics, including familystability and economic risk factors. In 1995, NCES alsofielded an early childhood program participation
survey, similar to that of 1991. It entailed screeningapproximately 44,000 households and interviewing14,000 parents of children from birth through thirdgrade. In 1996, NCES fielded a survey of parent andfamily involvement in education, interviewing nearly21,000 parents of children from age 3 through 12thgrade. About 8,000 youth in grades 6 through 12 werealso interviewed about their community service andcivic involvement. The 1999 NHES was designed tocollect end-of-the-decade estimates of key indicatorscollected in previous NHES surveys and also collecteddata from children and their parents about plans forthe child's education after high school. Interviewswere conducted with 24,000 parents of childrenranging from newborns through 12th-graders,approximately 8,000 students in grades 6 through 12in the youth interview, and nearly 7,000 adults.
Three surveys were fielded as part of the 2001 NHES.The Early Childhood Program Participation survey wassimilar in content to the 1995 collection and collecteddata about the education of 7,000 prekindergartenchildren ranging in age from birth to 6. The Before-and After-School Programs and Activities surveycollected data about nonparental care arrangementsand educational and noneducational activities inwhich children participate before- and after-school.Data were collected for approximately 10,000kindergarten through 8th graders. The third surveyfielded in 2001 was the Adult Education and LifelongLearning survey, which gathered data about theformal and informal educational activities of 11,000adults.
Information about the NHES is available online athttp://nces.ed.gov/nhes.
Agency Contact:Chris ChapmanNational Center for Education StatisticsPhone: (202) 502-7414E-mail: [email protected]
National Immunization SurveyThe National Immunization Survey (NIS) is acontinuing nationwide telephone sample survey offamilies with children ages 19 to 35 months. Estimatesof vaccine-specific coverage are available for theNation, the States, and 28 urban areas.
The NIS uses a two-stage sample design. First, arandom-digit-dialing sample of telephone numbers isdrawn. When households with age-eligible children(19-35 months) are contacted, the interviewer collectsinformation on the vaccinations received by all age-eligible children. The interviewer also collectsinformation on the vaccination providers. In thesecond phase, all vaccination providers are contacted
1111America's Children: Key National Indicators of Well-Being, 2003
152

by mail. Providers' responses are combined withinformation obtained from the households to renderestimates of vaccination coverage levels moreaccurately. Final estimates are adjusted fornoncoverage of households without telephones.
Information about the NIS is available online athttp://www.nisabt.org and on the NIS website athttp://www.cdc.gov/NIP/coverage.
Agency Contact:Lawrence BarkerCenters for Disease Control and PreventionPhone: (404) 639-8560
National Linked File of Live Births andInfant DeathsThe National Linked File of Live Births and InfantDeaths is a data file for research on infant mortality.Beginning with the 1995 data, this file is produced intwo formats. The file is released first as a period datafile and later as a cohort file. In the birth cohortformat, it includes linked vital records for infants bornin a given year who died in that calendar year or thenext year, before their first birthday. In the periodformat, the numerator consists of all infant deathsoccurring in one year, with deaths linked to thecorresponding birth certificates from that year or theprevious year. The linked file includes all the variableson the national natality file, as well as medicalinformation reported for the same infant on the deathrecord and the age of the infant at death. The use oflinked files prevents discrepancies in the reporting ofrace between the birth and infant death certificates.Although discrepancies are rare for White and Blackinfants, they can be substantial for other races.National linked files are available starting with thebirth cohort of 1983. No linked file was produced forthe 1992 through 1994 data years. Match completenessfor each of the birth cohort files is about 98 percent.
For more information, see:
Prager, K. (1994). Infant mortality by birthweight andother characteristics: United States, 1985 birth cohort.Vital and Health Statistics, 20 (24). Hyattsville, MD:National Center for Health Statistics.
Mathews, T.J., Menacker F., and MacDorman, M.F.(2002). Infant mortality statistics from the 2000period linked birth/infant death data set. NationalVital Statistics Report, 50 (12). Hyattsville, MD: NationalCenter for Health Statistics.
Information about the National Linked File of LiveBirths and Infant Deaths is available online athttp://www.cdc.gov/nchs/linked.htm.
Agency Contact:For information on infant mortality:Marian MacDormanNational Center for Health StatisticsPhone: (301) 458-4356
National Vital Statistics System
Through the National Vital Statistics System, theNational Center for Health Statistics (NCHS)collects and publishes data on births and deaths inthe United States. NCHS obtains information onbirths and deaths from the registration offices of allStates, New York City, and the District of Columbia.
Demographic information on birth certificates, suchas race and ethnicity, is provided by the mother atthe time of birth. Hospital records provide the basefor information on birthweight, while funeraldirectors and family members provide demographicinformation on death certificates. Medicalcertification of cause of death is provided by aphysician, medical examiner, or coroner.
Information on Hispanic origin. The number of Statesgathering information on births to parents ofHispanic origin has increased gradually since 1980-81, when 22 States included this information onbirth certificates. By 1993, the Hispanic origin ofthe mother was reported on birth certificates in all50 States and the District of Columbia. Similarly,mortality data by Hispanic origin of decedent havebecome more complete over time. In 1997, therewas complete reporting of deaths by Hispanic originin all 50 states and the District of Columbia.
Population denominators. The natality and mortalityrates shown in this report for 1991-2000 have beenrevised, based on populations consistent with thecensus conducted on April 1, 2000. Rates previouslypublished in America's Children: Key NationalIndicators of Well-Being were based on populationsprojected from the 1990 census. The populationestimates for 2000 and 2001 can be found on theInternet at:http://www.cdc.gov/nchs/about/major/dvs/popbridge/popbridge.htm. It was necessary to createpopulation estimates for 2000 and 2001 that wereconsistent with the race categories used in the 1990Census. The revised intercensal population estimatesfor 5-year age groups for 1991-99 can also be foundon the Internet at:http://www.cdc.gov/nchs/about/major/dvs/popbridge/popbridge.htm. The estimates forfemales 15-19 years were adjusted to obtainpopulation denominators for birth rates forteenagers 15-17 years (Health9) and birth rates forunmarried teenagers (Pop7.A).
Appendix II: Data Source Descriptions IIII

Detailed information on the methodologies used todevelop the revised populations, including thepopulations for birth rates for teenagers and birthrates for unmarried teenagers, is presented inseveral publications.
For more information about these methodologies,see:
Ventura, SJ., Hamilton, B.E., Sutton, P.D. (2003).Revised birth and fertility rates for the United States,2000 and 2001. National Vital Statistics Reports, 51 (4).Hyattsville, MD: National Center for HealthStatistics.
Hamilton, B.E., Sutton, P.D., and Ventura, S.J.(2003). Revised birth and fertility rates for the 1990s:United States, and new rates for Hispanicpopulations, 2000 and 2001. National Vital StatisticsReports, 51. (In preparation.) Hyattsville, MD:National Center for Health Statistics.
National Center for Health Statistics. (2002).Unpublished estimates of the April 1, 2000, UnitedStates population by age, sex, race, and Hispanicorigin, prepared under a collaborative arrangementwith the U.S. Census Bureau. 2002. Available on theInternet at:http://www.cdc.gov/nchs/about/major/dvs/popbridge/popbridge.htm
Ingram, D.D., Weed, J.A., Parker, J.D., Hamilton,B.E., Schenker, N., Arias, E, Madans, J. (2003,forthcoming) U.S. Census 2000 Population withBridged Race Categories. Vital Health Stat 2.
Anderson, R.N., Arias, E. (2003). The Effect ofRevised Populations on Mortality Statistics for theUnited States, 2000. National Vital Statistics Reports,51 (In preparation) Hyattsville, MD: National Centerfor Health Statistics.
Preliminary data. NCHS continuously receivesstatistical records from the States' vital registrationsystems, providing preliminary data. Investigatorsweight individual records of births and deaths toindependent counts of vital events registered in eachState and reported to NCHS. These independentcounts, aggregated for a 12-month period, serve ascontrol totals and are the basis for the individualunit record weights in the preliminary file. Forselected variables, unknown or not-stated values areimputed. The percentage not stated is generally 1percent or less.
For more information on national natality andmortality data, see:
National Center for Health Statistics. TechnicalAppendix. Vital Statistics of the United States, I(Natality) (1992), (DHHS Publication No. (PHS) 96-1100), and II (Mortality), Part A (1996) (DHHSPublication No. (PHS) 96-1101). Washington, DC:Public Health Service.
Information about the National Vital StatisticsSystem is available online athttp://www.cdc.gov/nchs/nvss.htm.
Agency Contacts:For information on births to unmarried women, lowbirthweight, and adolescent births:Stephanie VenturaNational Center for Health StatisticsPhone: (301) 458-4547
For information on child mortality:Donna HoyertNational Center for Health StatisticsPhone: (301) 458-4279
For more information on adolescent mortality:Lois FingerhutNational Center for Health StatisticsPhone: (301) 458-4213
Population EstimatesDecennial Census data serve as benchmarks for derivingnational population estimates, which are also based ondata from the following agencies: births and deaths(National Center for Health Statistics); immigrants(Immigration and Naturalization Service); ArmedForces (U.S. Department of Defense); net movementbetween Puerto Rico and the U.S. mainland (PuertoRico Planning Board); and federal employees abroad(Office of Personnel Management and U.S.Department of Defense). Similar data serve as the basisfor State estimates, which are also derived from a varietyof data series, including school statistics from Statedepartments of education and parochial school systems.
Customarily, after the decennial population census,intercensal population estimates for the precedingdecade are prepared to replace postcensal estimatesfor that decade.
For more information, see U.S. Bureau of the Census.(1998). U.S. population estimates by age, sex, race,and Hispanic origin: 1980-1997. Current PopulationReports (PPL-91R),Washington, DC.
Information about population estimates is availableonline at http://eire.census.gov/popest/estimates.php.
Agency Contact:Kirsten WestU.S. Census BureauPhone: (301) 763-2110
140 America's Children: Key National Indicators of Well-Being, 2003
154

Population ProjectionsThe population projections for the U.S. is provisionaland takes into consideration the results of the 2000Census. It is based on the 2000 Census, official post-census estimates, as well as vital registration data fromthe National Center for Health Statistics. Theassumptions are based on those used in 2000 withsome adjustments for consistency with newinformation. These projections have not beencalculated for race or Hispanic origin. Projections in theRacial and Ethnic Composition table are based on themost recent population estimates from the 1990 Census.
Low, middle, and high growth assumptions are madeabout fertility, mortality, and international migration.The current middle series assumptions are that:
Fertility will see little change over time, with levelsfor each racial/ethnic group converging to about2.1 children per woman in the long run.Mortality will continue to improve, with lifeexpectancy for each racial/ethnic groupconverging to about 90 years by 2100.Net international migration will fluctuate, withlevels in 2100 becoming lower than those in 1999.In the long run, levels of in-migration for Hispanicand White populations will decrease, while Asianand African in-migration will increase.
For more information, see U.S. Bureau of the Census.(1996). Population projections of the United States by age,sex, race, and Hispanic origin (1130, Series P25).Washington DC: U.S. Bureau of the Census.
Information about population the most currentprojections is available online athttp://www.census.gov/population/www/projections/natproj.html.
Agency Contact:Greg SpencerU.S. Census BureauPhone: (301) 763-2332
Survey of Income and ProgramParticipationCore survey and topical modules. Implemented by the U.S.Census Bureau since 1984, the Survey of Income andProgram Participation (SIPP) is a continuous series ofnational longitudinal panels, with a sample size rangingfrom approximately 14,000 to 36,700 interviewedhouseholds. The duration of each panel ranges from 2%years to 4 years, with household interviews every 4 months.
The SIPP collects detailed information on income, laborforce participation, participation in government assistanceprograms, and general demographic characteristics tomeasure the effectiveness of existing government programs,
to estimate future costs and coverage of governmentprograms, and to provide statistics on the distribution ofincome in America. In addition, topical modules providedetailed information on a variety of subjects, includinghealth insurance, child care, adult and child well-being,marital and fertility history, and education and training.The U.S. Census Bureau releases cross-sectional, topicalmodules and longitudinal reports and data files. In 1996,the SIPP questionnaire was redesigned to include a new4-year panel sample design and the computer-assistedpersonal interviewing method.
Information about the SIPP is available online athttp://www.sipp.census.gov/sipp.
Agency Contact:Judy EargleU.S. Census BureauPhone: (301) 763-3819
Surveys on Radon Awareness andEnvironmental Tobacco Smoke IssuesIn 1994 and 1996, EPA's Indoor EnvironmentsDivision commissioned a commercial contractor,Survey Communications, Inc., to conduct surveys onradon awareness and environmental tobacco smokeissues. Approximately 31,000 households in the 50States were contacted in 1994 and 1996. All interviewswere conducted by telephone using a random digitdialing sampling methodology. Both the 1994 and the1996 surveys asked whether the household includedany children under the age of 7. In addition, theyasked the following:
Does anyone in your household smoke cigarettes,cigars, or a pipe?Do you allow anyone to smoke in your home on aregular basis?
In the 1994 survey, 6,411 households had childrenunder age 7. In the 1996 survey, 6,851 householdshad children under the age of 7. The percentages ofhomes with children under age 7 in which someonesmokes, or in which someone smokes regularly, wereobtained by crossing the question on children with theappropriate question on smoking in the household.
In 1999, EPA commissioned the Center for SurveyResearch and Analysis at the University of Connecticutto conduct a similar but much smaller survey. Theresults of this survey were based on 1,005 telephoneinterviews with respondents located in the contiguous48 states, using a random digit dialing samplingmethodology. The survey questions regarding smokingin the home were similar to the questions in the 1994and 1996 surveys. In the 1999 survey there were 225households with children 6 years of age or younger.
i'4 155
Appendix B: Data Source Descriptions 111

Although the 1999 survey was substantially smallerthan the 1994 and 1996 surveys, all three surveys weredesigned to produce nationally representative samples.
Agency Contact:Philip JalbertU.S. Environmental Protection Agency,Office of Air and Radiation(202) 564-9431E-mail: [email protected]
Uniform Crime ReportsThe Federal Bureau of Investigation's (FBI's)Uniform Crime Reports (UCR) Program, whichbegan in 1929, collects information on the followingcrimes reported to law enforcement authorities:homicide, forcible rape, robbery, aggravated assault,burglary, larceny-theft, motor vehicle theft, and arson.Arrests are reported for 21 additional crimecategories.
The UCR data are compiled from monthly lawenforcement reports or individual crime incidentrecords transmitted directly to the FBI or tocentralized State agencies that then report to the FBI.In 1997, law enforcement agencies active in the UCRProgram represented approximately 254 million U.S.inhabitants-94 percent of the total population. TheUCR Program provides crime counts for the Nation asa whole, as well as for regions, States, counties, cities,and towns. This permits studies among neighboringjurisdictions and among those with similarpopulations and other common characteristics.
UCR findings for each calendar year are published ina preliminary release in the spring, followed by adetailed annual report, Crime in the United States,issued in the following calendar year. In addition tocrime counts and trends, this report includes data oncrimes cleared, persons arrested (age, gender, andrace), law enforcement personnel (including thenumber of sworn officers killed or assaulted), and thecharacteristics of homicides (including age, gender,and race of victims and offenders, victim-offenderrelationships, weapons used, and circumstancessurrounding the homicides). Other special reportsare also available from the UCR Program.
Information about the UCR is available online athttp://www.fbi.gov.
Agency Contact:Uniform Crime ReportsPrograms Support SectionCriminal Justice Information Services DivisionFederal Bureau of Investigation1000 Custer Hollow RoadClarksburg, West Virginia 26306
MIAmerica's Children: Key National Indicators of Well-Being, 2003
156

157 Indicators of Children's Well-Being: Data Source Descriptions

U.S. Department of EducationOffice of Educational Research and Improvement (OERI)
National Library of Education (NLE)Educational Resources Information Center (ERIC)
NOTICE
Reproduction Basis
ElkicEducational Ben= Ishoollon Ceele
This document is covered by a signed "Reproduction Release (Blanket)"form (on file within the ERIC system), encompassing all or classes ofdocuments from its source organization and, therefore, does not require a"Specific Document" Release form.
This document is Federally-funded, or carries its own permission toreproduce, or is otherwise in the public domain and, therefore, may bereproduced by ERIC without a signed Reproduction Release form (either"Specific Document" or "Blanket").
EFF-089 (1/2003)
Pc-03/357