document resume ed 378 500 cg 025 902 author title ... · cadpe funds in cadpe-recipient and...
TRANSCRIPT

DOCUMENT RESUME
ED 378 500 CG 025 902
AUTHOR Romero, Frank; And OthersTITLE California Programs To Prevent and Reduce Drug,
Alcohol, and Tobacco Use among In-School Youth:1992-93 Annual Evaluation Report.
INSTITUTION Southwest Regional Lab., Los Alamitos, CA.SPONS AGENCY California State Dept. of Education, Sacramento.REPORT NO SWRL-DATE-92-93-YR3-FRPUB DATE Mar 94NOTE 108p.
PUB TYPE Reports Evaluative/Feasibility (142)
EDRS PRICE MF01/PC05 Plus Postage.DESCRIPTORS Adolescents; Alcohol Abuse; Children; Curriculum
Development; *Drinking; *Drug Use; EarlyIntervention; Elementary Secondary Education; *HighRisk Students; *Prevention; State Programs; *StudentBehavior; Tobacco
IDENTIFIERS *California
ABSTRACTThe program implementation and cost data, along with
the student substance use and program exposure data, of the Drug,Alcohol, and Tobacco Education (DATE) Program are presented. The datacame from a random sample of California public school districts. Thisevaluation concentrates on five components of the DATE Program: (1)
Curriculum delivery; (2) Curriculum training; (3) Staff development;(4) Student identification and referral; and (f) Positive alter,lativeactivities. To address these components, the following questions wereasked: What are schools doing to prevent the use of alcohol, tobacco,and other drugs (ATOD)? What ATOD prevention education dO studentsreceive? What are the costs associated with providing ATOD preventionin the schools? What are the current outcomes related to ATODprevention education? What effects have ATOD prevention educationyielded in the past two years? What were the effects of the loss offunds, as well as the threat of diminished funding, on ATODprevention education? Results indicated that student ATOD use mostlyremained constant over two years. These stable or constant ATOD-userates seemingly indicate the inefficacy of the DATE Program, but, theevaluation concludes, the context in which this stability occurredrenders this stability an impressive accomplishment. (RJM)
************************************************************************ Reproductions supplied by EDRS are the best that can be made *
from the original document.***********************************************************************


cc.,
CALIFORNIA PROGRAMS
TO PREVENT AND REDUCE
DRUG, ALCOHOL,
AND TOBACCO USEAMONG IN- SCHOOL YOLTH:
ANNUAL EVALUATION REPORT
Prepared by the Southwest Regional Laboratory
for the California Department of Education
March 1994
This report 'as prepared by the DATE Evaluation project staff:Frank Romero, project director; Jerry Bailey, Clifford Carr, John Flaherty, Treseen Fleming,Joni Radio Gaynor, Denise Houle, Rita Karam, Melody Lark, Tamera Martino, and Carol Thomas.Project Document No. SWRL-DATE 92-93-YR3-FR
Southwest Regional Laboratory4665 Lampson AvenueLos Alamitos, CA 90720
(310) 598-7661

CONTENTS Executive Summary 1What Are Schools Doing in ATOD Prevention? 1
What ATOD Prevention Education Do Students Receive? 4What Are the Costs Associated With Providing ATOD
Prevention Education in the Schools? 5What Are the Current Outcomes Related to ATOD
Prevention Education? 6What Outcomes Have Resulted From 1991-92 to 1992-93
Related to ATOD Prevention Education? 9What Were the Effects of the Loss of CADPE Funds and the
Threat of the Loss of TUPE Funds on ATOD PreventionEducation? 10
Introduction and Description of the Drug, Alcohol, andTobacco Education Evaluation 13
I tgislative Context of the DATE Evaluation 13Key Policy and Evaluation Questions 13Sampling Plan 14
What Are Schools Doing in ATOD Prevention? 18Delivery of ATOD Prevention Curricula 18Training of ATOD Prevention Curricula 20Staff Development Training (Noncurriculum Specific) 21Focus and Extent of Staff Development Training 22Identification and Referral 24Use of Positive Alternative Activities in Prevention 29
What ATOD Prevention Education Do Students Receive? 32Student Exposure to School -Based Tobacco Prevention
Curricula and Activities 32Student Exposure to School-Based Tobacco-Related
Services 33Student Exposure to School-Based AOD Prevention
Curricula and Activities 34Student Exposure to School-Based AOD Services 36
What Are the ATOD Prevention Education Costs in theSchools? 38
The Per-Student Cost of Providing DATE ProgramComponents 38
Stakeholder Contribution to the DATE ProgramComponents 39
Per-Student Cost of Exposure to ATOD PreventionCurricula 42
4 iii

iv
Per-Student Cost of Training Staff in the Use of ATODPrevention Curricula 43
Per-Student Cost of Identifying and Referring Students forATOD-Related Issues 45
Per-Student Cost of Providing ATOD Prevention StaffDevelopment 46
Per-Student Cost of Providing Positive Alternative ActivitiesTo Students 47
Targeting Resources to Students With High ATOD UseLevels 49
Current ATOD Prevention Education Outcomes 49Student Attitudes/Knowledge Toward Tobacco 49Student Attitudes/Knowledge Toward AODs 51Use of Tobacco 52Use of AODs 54Comparisons With Other Surveys 56Effects of the Current Program on Student Attitudes and
Knowledge 64
1991-93 ATOD Prevention Education Outcomes 69Changes in Program Delivery From 1991-92 to 1992-93 69Changes in Students' Attitudes Toward and Knowledge of
Tobacco From 1991-92 to 1992-93 71Changes in Students' Attitudes Toward and Knowledge of
AODs From 1991-92 to 1992-93 72Changes in Students' Substance Use From 1991-92 to
1992-93 72
What Were the Effects of the Loss of CADPE Funds and theThreat of the Loss of TUPE Funds on ATODPrevention Education? 74
The Effect of the Loss of CADPE Funds on PreventionEducation 75
The Effect of the Threat of Losing TUPE Funds onPrevention Education 79
Findings and Recommendations 83Context of the 1992-93 DATE Program 84Reaching for Effective Prevention and Intervention
Strategies 88Recommendations 89A Final Note 90
r-J

References 91
Appendix 93
6v

TABLES Table 1 List of 32 Counties Participating in the 1992-93DATE Evaluation 16
Table 2 Percentage of Staff Development Training SponsoredBy Each Organization 22
Table 3 Percentage of Schools Where Specified IndividualsAre Involved in Identifying and ReferringStudents With ATOD-Related Problems 27
Table 4 Percentage of Respondents Listing a ParticularIntervention as Part of Their School's Proceduresfor Handling ATOD Use 28
Table 5 Minimum Per-Student Cost of Each Component 38Table 6 Student Percentage of Perceived Harmfulness of
Varying Levels of Cigarette Consumption, Grades7-12 50
Table 7 Percentage of Students Responding Positively toAOD Knowledge and Attitude Items,Grades 4-6 51
Table 8 Percentage of Students Providing AppropriateResponses Testing Knowledge of AOD Effects,Grades 7-12 52
Table 9 Comparison of Results for Cigarette Use Among 11thand 12th Graders, DATE, CSS, and NSS, 1991-93(Percentage of Students Who Have Smoked) 57
Table 10 Comparison of Results, 11th and 12th Graders, 1991-93 DATE, CSS, and NSS (by percentage) 60
Table 11 Percentage of Students Identifying Changes inTobacco-Related Attitudes and Knowledge Due tothe DATE Program, Grades 4-6 65
Table 12 Percentage of Students Identifying Changes in AOD-Related Altitudes and Knowledge Due to theDATE Program, Grades 4-6 66
Table 13 Percentage of Students Identifying Changes inTobacco-Related Attitudes, Knowledge, andIntentions Due to the DATE Program,Grades 7-12 67
Table 14 Percentage of Students Identifying Changes in AODRelated Knowledge, Attitudes, and Intentions Dueto the DATE Program, Grades 7-12 6S
Table A-1 Number of Instructional Hours Per Student, byCurriculum and Grade Level 95
Table A-2 Percentage of Students in Each Grade LevelReceiving Instruction, by Curriculum 97
vii

FIGURES Figure 1 Date Evaluation Design 15Figure 2 Number of Instructional Hours Per Student on
Tobacco, AODs, and Other Issues by Grade 19Figure 3 Percentage of Staff Involved in Curriculum
Training 21Figure 4 Total Number of Hours for All Personnel by TrF.ning
Topic 23Figure 5 Sources of Student identification 25Figure 6 Types of On-Campus Referrals 26Figure 7 Types of Off-Campus Referrals 26Figure 8 Alternative Activity Hours Per Student by Activity
Category 30Figure 9 Percentage of Students Participating in Alternative
Activities by Grade and Category of Activity 31Figure 10 Percentage of Students Experiencing Tobacco-Related
Events, Grades 4-6 32Figure 11 Percentage of Students Experiencing Tobacco-Related
Events, Grades 7-12 33Figure 12 Percentagt, of Students Reporting Availability of and
Participation in Tobacco-Related Services, Grades7-12 34
Figure 13 Percentage of Students Experiencing AOD-RelatedEvents, ('rades 4-6 35
Figure 14 Percentage of Students Experiencing AOD-RelatedEvents, Grades 7-12 36
Figure 15 Percentage of Students Reporting Availability of andParticipation in AOD-Related Individual Services,Grades 7-12 37
Figure 16 Percentage of Students Reporting Availability of andParticipation in AOD-Related Group Services,Grades 7-12 37
Figure 17 Percentage of Stakeholder Contributions to BudgetItems of the Five Components 40
Figure 18 Percentage of Stakeholder Contributions to the FiveComponents 41
Figure 19 Percentage of Stakeholder Contributions to ATODPrevention Curricula 43
Figure 20 Percentage of Stakeholder Contributions to ATODPrevention Curricula Training 44
Figure 21 Percentage of Stakeholder Contributions to theIdentification and Referral Process 46
Figure 22 Percentage of Stakeholder Contributions to ATODPrevention Staff Development 47
ix

Figure 23 Percentage of Contributions to Positive AlternativeActivities 48
Figure 24 Percentage of Students Who Ever Smoked, Smokedin Past 30 Days, or Smoked Daily, by Grade 53
Figure 25 Percentage of Students Using AODs in the Past SixMonths, Grades 7-12 55
Figure 26 Percentage of Students Using Alcohol, Cannabis(Marijuana and Hashish), and All Other IllicitDrugs in Their Lifetime and in the Past SixMonths, Grades 7-12 56
Figure 27 Lifetime Use of Cigarettes by Grade Level (i.e.,"Have you ever smoked a cigarette?") 58
Figure 28 Current Cigarette Smoking by Grade Level (AnySmoking Within the Last 30 Days) 58
Figure 29 Use of Alcohol in Last 6 (DATE, CSS) or 12 (NSS)Months 61
Figure 30 Use of Marijuana/Hashish in Last 6 (DATE, CSS) or12 (NSS) Months 62
Figure 31 Use of Illicit Drugs (Except Marijuana and Hashish)in Last 6 (DATE, CSS) or 12 (NSS) Months 63
Figure 32 Differences Between 1991-92 and 1992-93 inPercentage of Students Experiencing Tobacco-Related Events, Grades 4-6 (positive percentagesindicate increases for 1992-93) 69
Figure 33 Differences Between 1991-92 and 1992-93 inPercentage of Students Experiencing ADD-Related Events, Grades 4-6 (positive percentagesindicate increases for 1992-93) 70
Figure 34 Differences Between 1991-92 and 1992-93 inPercentage of Students Experiencing Tobacco-Related Events, Grades 7-12 (positive percentagesindicate increases for 1992-93) 70
Figure 35 Differences Between 1991-92 and 1992-93 inPercentage of Students Experiencing AOD-Related Events, Grades 7-12 (positive percentagesindicate increases for 1992-93) 71
Figure 36 Percentage of Students Who Smoked Daily orSmoked in. Past 30 Days, by Grade, 1991-92 to1992-93 73
Figure 37 Percentage of Students Using Alcohol, Cannabis(Marijuana and Hashish), and All Other IllicitDrugs in the Past Six Months in 1991-92 and1992-93, Grades 7-12 74
x a
Figure 38 Cancellation or Reduction of Services Due to CADPELoss in CADPE-Recipient and Non-CADPE-Recipient Schools 76
Figure 39 Effect of Loss of CADPE Funds on DATE Staff inCADPE-Recipient and Non-CADPE-RecipientSchools 77
Figure 40 Obtaining Other Funds in Response to the Loss ofCADPE Funds in CADPE-Recipient andNonrecipient Schools 78
Figure 41 Effects of the Threat of Losing TUPE Funds on TotalDATE Program 79
Figure 42 Cancellation or Reduction of Services Due to theThreat of Losing TUPE Funds 80
Figure 43 Effect of the Threat of Losing TUPE Funds on DATEStaff 81
Figure 44 Effects of the Threat of Losing TUPE Funds onInstructional and Noninstructional DATEMaterials 82
Figure 45 Obtaining Other Funding in Response to the Threat ofLosing TUPE Funds 82
xi

EXECUTIVESUMMARY
What Are SchoolsDoing in ATOD
Prevention?
This year's evaluation of the Drug, Alcohol, and TobaccoEducation (DATE) Program represents the Southwest RegionalLaboratory's (SWRL's) second annual effort to collect programimplementation and cost data, and student substance use andprogram exposure data from a random sample of Californiapublic school districts. The data collected during the 1992-93school year revealed that substantial amounts of curricula,student identification and referral services, and positivealternative activities were delivered to students in grades K-12.Teachers and other school staff received a considerable amountof curriculum and staff development training. These ampleamounts of program delivery and training occurred despitereductions in DATE Program funds allocated by the TobaccoUse Prevention Education (TUPE) and Drug-Free Schools andCommunities (DFSC). Although schools received fewer DATEProgram funds, they leveraged more than a seven-fold return insupport for the program that consisted of funds from othersources, donations, and contributions of resources.
In comparison to the 1991-92 school year, student exposureto DATE-related prevention education in 1992-93 generallyincreased for elementary school students and slightly decreasedfor secondary school students. Rates of student alcohol, tobacco,and other drug (ATOD) use remained constant 1;\,.ttween the twoschool years.
The data collected for this year's evaluation focused on fivecomponents of the DATE Program: (a) curriculum delivery;(b) curriculum training; (c) staff development; (d) studentidentification and referral; and (e) positive alternative activities.The DATE curriculum component was divided into curriculumdelivery and curriculum-specific training to examine the extent ofimplementation and cost of these two components. The decisionto focus on these components was based on the belief that manyof the other components in the comprehensive model (i.e.,involvement of law enforcement, community, and parents) weresubsumed to a great extent in the components included in thisyear's evaluation. This summary of findings is organizedaccording to the following key questions that guided thisevaluation.
Curriculum Delivery
1. Students in grades 5-8 received the greatest amount of ATODprevention instruction, with an average of 26-29 hours perstudent.
111

2. Students in grade 5 received the most instruction in tobaccouse prevention (7.4 hours per student), followed by studentsin grade 8 (6.1 hours per student). Likewise, alcohol andother drug (AOD) issues were emphasized in grades 5-8,ranging from 7.2-7.9 hours per student.
3. As found in the 1991-92 evaluation, 11th and 12th graderswere least likely to receive instruction in ATOD preventioncurricula with less than 6 hours per student.
4. Health, Here's Looking at You 2000, and district-developedcurricula were among the most widely implemented ATODprevention curricula reported in the 1991-92 and 1992-93evaluations.
5. Most of the ATOD prevention curricula addressed thefollowing topics: information; health consequences ofATOD use; personal skills development; and social skillsdevelopment.
6. Schools spent $27.55 per student on curriculum deliveryduring the 1992-93 school year.
Curriculum Training
1. Almost half of the curriculum training hours were devoted totwo curricula: Here's Looking at You 2000 and Quest Skillsfor Growing.
2. Schools spent $5.05 per student on curriculum trainingduring the 1992-93 school year.
Staff Development Training
1. Teachers received the most ATOD prevention training (77%of all training hours), followed by counselors aid nurses(9%).
2. AOD issues accounted for 27% of all training hours, tobaccoissues for 12%, and the remaining 61% were spent on otherprevention strategies such as social skills training andbuilding self-esteem.
3. Staff development training focused on alternative classroomstrategies (15% of all staff training hours), dynamics of high-
2 3.

risk behavior (14%), implementation of an early interventionmodel (12%), and risk and protective factors (12%).
4. Schools spent $7.12 per student on staff development trainingduring the 1992-93 school year.
Student Identification and Referral
1. A total of 6.5% of the students enrolled in schools wereidentified as having ATOD-related problems during the1992-93 school year.
2. Teachers identified twice as many students as any othersource. Self-identifications were the next most commonsource.
3. Poor academic performance, changes in academicperformance, or a change in overall behavior were reasonsfor student identifications in almost half of the cases.Interestingly, students identified specifically for AOD useand tobacco use comprised only 16% and 8% of the cases,respectivel,,.
4. Five percent of the students enrolled in the schools werereferred for on-campus services during the 1992-93 schoolyear. inly 2.8% of the total student population were referredfor services outside of school.
5. Most of the schools indicated that they had a formalprocedure for identifying and referring students with ATOD-related problems. Not surprisingly, teachers played the mostintegral part of that process, being involved in identifyingstudents at 85% of the schools and helping refer students at73% of the schools.
6. Schools spent $28.69 per student on student identificationand referral services during the 1992-93 school year.
F ,sitive Alternative Activities
1. On the average, about one school day (6.3 hours) wasprovided to students in the form of positive alternativeactivities throughout the school year.
1.33

What ATODPrevention
Education DoStudents Receive?
4
2. Recreational activities accounted for the largest portion(25%) of student hours, but only 3% of the studentsparticipated.
3. Eighteen percent of the students participated in Red RibbonWeek, the event attended by the most students, and theparticipation level was constant (within ±3%) across allgrades.
4. Schools spent $15.38 per student on providing positivealternative activities during the 1992-93 school year.
Student Exposure to School-Based Tobacco PreventionCurricula and Activities
Grades 4-6
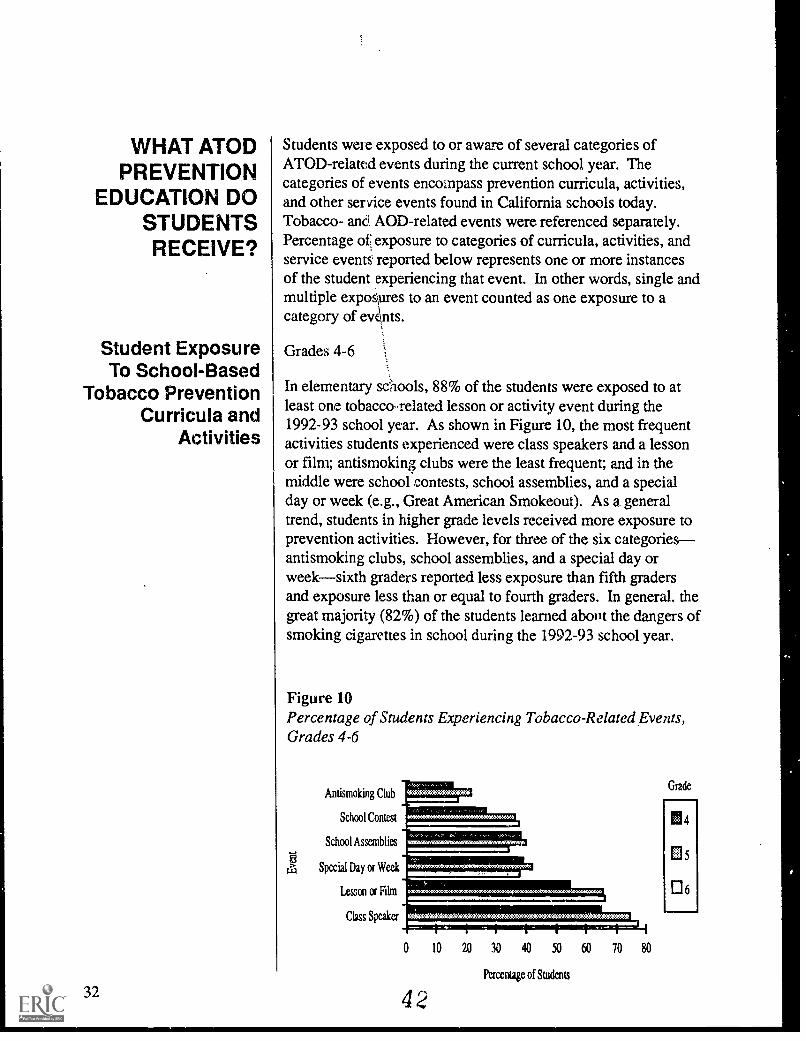
1. In elementary schools, 88% of the students were exposed toat least one tobacco lesson and activity event. Studentsexperienced class speakers and a lesson or film the most;antismoking clubs the least; and in the middle were schoolcontests, school assemblies, and a special day or week.
Grades 7-12
1. Forty-one percent of all secondary school students reportedexposure to at least one tobacco lesson and activity event.The most frequent tobacco prevention event was a lesson in ahealth class followed by a class speaker. The general trendfor secondary school students was that those in higher gradesreported less exposure.
Student Exposure to School-Based Tobacco Services
Grades 7-12
1. More secondary school students were aware of a supportgroup or class for help in quitting tobacco than any othertobacco cessation service. Almost half of the students (47%)indicated they did not know if any of the listed cessationservices on the survey were available and another 26% saidnone of the services were available. Almost three quarters ofthe students were not aware of any school-based help forstopping tobacco use.
14

What Are the CostsAssociated WithProviding MOD
PreventionEducation in the
Schools?
Student Exposure to School-Based ATOD PreventionCurricula and Activities
Grades 4-6
1. Ninety-one percent of the elementary school students wereexposed to at least one AOD lesson and activity event. Thethree most frequently reported events were: class speakers, alesson or film, and a special day or week (e.g., Red RibbonWeek). Anti-AOD clubs were the least experienced event.
Grades 7-12
1. Fifty-one percent of all secondary school students reportedexposure to at least one AOD lesson and activity event. Themost frequent AOD prevention event was Red Ribbon Weekfollowed by three categories with similarly reportedexposure: school assemblies, a lesson in health class, and aclass speaker. Sober dances were experienced by the fewestnumber of students. Lessons in a regular class were the nextlowest category reported. The exposure trend in secondaryschools is that students in higher grades reported less AODcurricula and activity events. Roughly half of the studentsreported that they did not take part in any of these events.
Student Exposure to School-Based AOD Services
Grades 7-12
1. The two most frequently cited types of individual helpavailable were one-on-one peer counseling for personalproblems and academic help from a peer. Twice as manystudents were aware of peer counseling for help withpersonal problems than any other type of group help. Peercounseling also was the most frequently reported group helpin which students participated.
1. California schools spent at least $83.78 per student to providestudents with curricula, positive alternative activities, andidentification and referral services, and to provide schoolpersonnel with staff development and ATOD curriculumtraining. This amount is more than seven times as much asthe $10.29 per student allocation received by schools fromDFSC and TUPE funding initiatives.
155

What Are theCurrent Outcomes
Related to ATODPreventionEducation?
6
2. The stakeholder with the largest contribution of resources tothe five components was the district's general funds at 63%.TUPE contributed approximately 9% and DFSC 7% of theresources for the five components.
3. Schools spent the most .:sources on the identification andreferral process (at least $28.69 per student) and ondelivering ATOD prevention curricula to students (at least$27.55 per student). A smaller, yet significant, amount wasspent on positive alternative activities (at least $15.38 perstudent), staff development (at least $7.12 per student), andcurriculum training (at least $5.05 per student).
4. Within each of the five components, the majority ofresources supported staff time, especially teachers, aides, andreleased time. This accounts for the large contributions ofdistrict general funds.
5. The effects of a potential loss of TUPE and DFSC funds werenegative and widespread, as expressed by DATEcoordinators in a cost survey. More than half of the DATEcoordinators interviewed stated there would be a negativeimpact on the general prevention and intervention processeswithin their overall DATE Program if funding were to Ix- cut.
6. If DATE funding were to be cut, DATE coordinatorsbelieved there is a strong chance that DATE programs wouldbe reduced or eliminated and therefore services to studentswould be reduced. Contact among schools, districts, andtheir surrounding communities also would be reduced.
Student Attitudes/Knowledge Toward Tobacco
Grades 4-6
1. Elementary school students have an overwhelminglynegative attitude toward tobacco use. Over 90% think thatsmoking cigarettes is bad for one's health, smells bad, anddoes not make a person look cool. A little more than 75%did not think that kids who smoke had more friends (though16% were unsure) or that smokers were more grown up.
16

Grades 7-12
1. Secondary school students are very knowledgeable about theharmfulness of cigarette smoking. They know that greaterharm to ore's health is caused by more cigarettes smoked fora longer period.
Student Attitudes/Knowledge Toward AODs
Grades 4-6
1. Elementary school students hold very negative attitudestoward AOD use. However, the majority (61%) were notaware that alcohol affects kids more than adults.
Grades 7-12
1. Frequent use of alcohol and marijuana were thought to be ofmoderate or great harm by 75% and 82% of the students,respectively. More than 85% of the students across the gradelevels were aware that alcohol is the most widely abuseddrug and is the most common cause of fatal car accidents,that drinking alcohol can affect an unborn baby, and thatanabolic steroids are addictive. Only a little more than half(52%) were aware of the similarity in alcohol content ofdifferent types of alcoholic beverages.
Use of Tobacco
Cigarette Smoking, Grades 4-6
1. In grades 4-6, 87% of the students had never smoked acigarette in their lifetime, not even a puff. Nine percent ofthe students had smoked cigarettes one or two times and 4%smoked three or more times. Four percent also reportedsmoking more than 100 cigarettes. Only 3% of all studentshad smoked a cigarette in the past month.
Cigarette Smoking, Grades 7-12
1. In grades 7-12, 56% of the students reported smokingcigarettes in their lifetime, some as little as one or two puffs.Of the lifetime smokers, 30% (about 17% of all students)smoked more than the 100 cigarette limit forexperimentation. Only 34% of the lifetime smokers (about18% of all students) smoked cigarettes in the past 30 days.
17 7

Thus, two thirds of the lifetime smokers were not currentsmokers. Only 21% of the current smokers reported dailysmoking.
Smokeless Tobacco, Grades 7-12
1. Sixteen percent of 7th-12th graders reported using smokelesstobacco in their lifetime. Of the lifetime smokeless-tobaccousers, 22% were current users (about 4% of all students), halfhaving chewed or snuffed during one or two days in the pastmonth and the other half using smokeless tobacco from threeto nine days.
Use of AODs
Grades 4-6
1. Nineteen percent of the elementary school students havedrunk alcohol without their parents' knowledge and 9% havebeen drunk. In their lifetime, 6% have sniffed substancessuch as glue to get high and 4% have smoked marijuana.Students in higher grades were more likely to use AODs.
Grades 7-12
1. Seventy-one percent of the secondary school students havedrunk alcohol in their lifetime and 58% have drunk alcohol inthe past six months. Twenty-four percent of the studentshave drunk five or more drinks during one occasion in thetwo weeks prior to the survey. Thirty-seven percent of thestudents have used illicit substances and 29% have done so inthe past six months.
Effects of the Current DATE Program on Student Attitudes
1. At least four of every five elementary school students learnedin school to say "no" to cigarette offers from friends and thatsmoking is bad for one's health. Sixty percent of the studentsalso learned to talk with their parents about smoking. Thirty-two percent reported that they were less interested insmoking as a result of their prevention education.
16
And Knowledge
Grades 4-6
What OutcomesHave Resulted
From 1991-92 to1992-93 Related toATOD Prevention
Education?
2. As a result of their education in the current school year, over75% felt they did not want to use AODs, felt that it was okayto say "no" to offers from friends for AODs, and learned thatAOD use is bad for one's health. Similar to the tobaccofindings, 60% of the students learned to talk with theirparents about AODs, and 36% were less interested in tryingAODs.
Grades 7-12
1. Students identified many positive effects of their tobacco-related prevention education: Twelve percent said they werebetter able to resist peer pressure to use tobacco; 16%became less interested in using tobacco; 23% learned toavoid or reduce tobacco use; and 32% learned about itsharmfulness. Most current and daily cigarette smokers werenot learning to seek treatment.
2. Students also identified many positive effects of their AOD-related prevention education: Thirteen percent said theywere better able to resist peer pressure to use AODs; 17%became less interested in using marijuana and 22% were lessinterested in using alcohol; 24% learned about AOD'sharmfulness; and 26% learned to avoid or reduce tobaccouse. There was no impact on talking with parents andseeking treatment. There is a great disparity between thenumber of students using AODs and the few who learned toseek treatment.
Changes in Program Delivery From 1991-92 to 1992-93
1. The percentage of students aware of or participating intobacco- or AOD- related services remained constant from1991-92 to 1992-93.
Changes in Students' Attitudes Toward and Knowledge ofTobacco From 1991-92 to 1992-93
1. Generally, attitudes toward and knowledge about tobaccoremained constant from 1991-92 to 1992-93. Most studentscontinued to have very negative attitudes toward tobacco use.
9

What Were theEffects of the Loss
Of CADPE FundsAnd the Threat ofThe Loss of TUPE
Funds on ATODPreventionEducation?
10
Changes in Students' Attitudes Toward and Knowledge ofAODs From 1991-92 to 1992-93
1. Generally, the attitudes toward and knowledge of AODs from1991-92 to 1992-93 remained constant. During both schoolyears, most students believed that frequent drinking ofalcohol and use of marijuana were harmful.
Changes in Tobacco Use From 1991-92 to 1992-93
1. Tobacco use between the two years remained constant forboth elementary and secondary school students. Forexample; in 1991-92, 12% of the elementary school studentsreported smoking during their lifetime; in 1992-93, 13%reported similar behavior. This consistent rate also was truefor current smoking (in the pa. t 30 days) rates: 14% in 1991-92 and 13% in 1992-93.
Changes in AOD Use From 1991-92 to 1992-93
1. With one exception, AOD use remained constant between thetwo years. For example, lifetime use rates across theelementary grades in 1991-92 were 20%, 4%, and 6% foralcohol consumption (without parental knowledge), smokingmarijuana, and sniffing glue, respectively; these ratesremained stable in 1992-93. The one exception was anincrease in the number of secondary school studentsconsuming five or more alcoholic beverages during oneoccasion in the past two weeks. The rate for this behaviorincreased from 19% to 24% between the two years.
Overall Effect of the Loss of Comprehensive Alcohol andDrug Prevention Education (CADPE) Funds on DATE
1. With less money available to fund the DATE Program, 70%of the CADPE-recipient districts reported setbacks incarrying through the DATE Program as planned. Mostdistricts reduced portions of their DATE Program and a fewdelayed or canceled implementing new portions.
Effect of the Loss of CADPE Funds on DATE Services
1. Sixty-four percent of CADPE-recipicut districts had toreduce portions of their DATE programs. The most common
2O

reductions were in alternative activities, followed by staff in-services and counseling services for students.
Effect of the Loss of CADPE Funds on DATE Staff
1. Thirty-seven percent of the CADPE-recipient districtsreported that the loss of CADPE funds negatively impactedtheir staff. Specifically, 29% of the districts reportedreducing their DATE staff; most of those laid off werecounselors, followed by law enforcement personnel.
Effect of the Loss of CADPE Funds on Instructional/Noninstructional DATE Materials
1. Instructional and noninstructional materials (e.g., books forcurriculum, audiovisual equipment), which are essential tothe DATE Program, also were impacted by the loss ofCADPE funds. Sixteen percent of the districts receivingCADPE funds reduced the amount of instructional/noninstructional materials used, while others were unable topurchase such materials or had to use materials previouslyowned.
District Response to the Loss Of CADPE Funds
1. In spite of the loss of CADPE funds, districts tried tocontinue implementing the DATE Program to the best oftheir capabilities. Six percent of the CADPE-recipientdistricts coped with this loss by replanning and redesigningthe DATE Program to focus on a more limited scope. Tenpercent explored other funding sources through submittinggrant proposals to the state as well as seeking financialsupport from the community. Twenty-four percent reportedusing other available funds, such as general fu ds and cityfunds, while 16% reported the use of other DATE funds (i.e.,TUPE and DFSC).
Overall Effect of the Threat of Losing TUPE Funds on DATE
1. The threat of losing TUPE funds hindered districts andschools from making long-term plans and decisions regardingthe DATE Program. Many districts and schools did notintegrate programs for fear they would not be consistentlyfunded. As a result of the delay in receiving TUPE money,the DATE Program as a whole was negatively impacted.
011

Effect of the Threat of Losing TUPE Funds on DATEServices
1. Twenty-one percent of the districts and schools reportedreducing some portions of the DATE Program, especiallythose related to curricula, direct counseling services, and staffdevelopment services.
Effect of the Threat of Losing TUPE on DATE Instructionaland Noninstructional Materials
1. Instructional and noninstructional materials used for theDATE Program also were impacted by the threat of losingTUPE funds. Eleven percent of districts and 15% of schoolschanged their purchasing habits. Most commonly they wereunable to purchase the necessary instructional andnoninstructional DATE materials. Others had to delaypurchasing such materials or they had to reduce the amountof materials used for the DATE Program.
Response to the Threat of Losing TUPE Funds
1. Six percent of the districts and 4% of the schools reportedreductions in the amount of TUPE money spent on the DATEProgram. Nineteen percent of the districts and 10% of theschools responded to the threat of losing TUPE funds byretaining money that could be carried over for the 1993-94school year. Districts (13%) and schools (16%) also soughtother funding sources (e.g. community, foundations, cities) tosupport the DATE Program. Fifteen percent of districts and4% of schools reported the use of available funds, other thanDATE, to keep the program intact.
12

INTRODUCTIONAND
DESCRIPTIONOF THE DRUG,
ALCOHOL, ANDTOBACCO
EDUCATIONEVALUATION
Legislai;ve Contextof the DATE
Evaluation
Key PolicyAnd Evaluation
Questions
In 1990 the Southwest Regional Laboratory (SWRL) wascontracted by the Office of Healthy Kids, Healthy California,California Department of Education (CDE) to evaluate the Drug,Alcohol, and Tobacco Education (DATE) Program. SWRL andits subcontractors, Duerr Evaluation Resources and HealthEducation and Communication Consultants, have completed thethird year of the three-year evaluation. Third-year evaluationefforts focused on deriving statewide estimates of the impact ofthe DATE Program on student use rates for alcohol, tobacco, andother drugs (ATODs) and correlates of ATOD use.
Assembly Bill 75 (AB 75) (Chapter 1331/89) allocated themajority of Proposition 99 funds and mandated that the CDE:"In consultation with the State Department of Health Services,develop a mechanism for the evaluation of programs whichreceive funds under this chapter." Further, AB 75, Section24164 (c) mandates that the Department of Health Servicesdevelop a mechanism for a systematic, independent evaluation ofvarious efforts established under this bill. One of thecomponents of this evaluation is based on tobacco controlprograms funded under AB 75. Recent amendments (AB 99,Section 24168.7) to the original requirements specified theconduct of an evaluation employing an unbiased sample ofprograms and students from which findings could be generalizedto the statewide population.
A third legislative effort also framed the evaluation.California budget control language of Chapter 467 of 1990 (SB899) (Item 6110-001-890) called for "a longitudinal evaluation ioassess the effectiveness of local drug and alcohol abuseeducation and prevention programs."
Several major policy issues set the framework for the evaluation.Foremost, what are schools doing in ATOD preventioneducation? Additionally, what ATOD prevention educationservices are youth exposed to in schools? What are the costsassociated with providing ATOD prevention education servicesin schools? What are the outcomes related to providing ATODprevention education in schools?
To address these policy issues, SWRL examined:
program implementationthe extent towhich ATOD use prevention and
2 ' 13

Sampling Plan
intervention programs have beenestablished in the schools;
program exposurethe extent to whichstudents have been exposed to ATOD useprevention programs;
program coststhe extent to whichresources have translated into relevantATOD use prevention programs andactivities for students; and
program outcomesthe impact of ATODuse prevention programs on theknowledge, attitudes, and behaviors ofstudents.
In addition, the third-year evaluation effort examined thedistricts' organizational structures and their influence on DATEprograms and services to help address the policy questions.Organizational issues centered on the extent to which:
the organizational structure in the schooldistricts influences the DATE Program;
the organizational values held by DATEproviders influence the DATE Program;
the organizational stability ororganizational change influences theDATE Program; and
the organizational climate (i.e., the qualityof the social and psychologicalrelationships, in combination with thephysical environment) influences theDATE Program.
Pacific Institute for Research and Evaluation is completingthe organizational study. Therefore, these data will not beincluded in this report and will be published separately.
The basic evaluation design in the third year called for gatheringinformation across a random sample of 119 school districts, 290schools, and 18,850 students. Additional data collection
14 21

occurred in a subset of school districts to study the districts'organizational dynamics and their influence on the DATEProgram. Figure 1 details the evaluation design. The samplewas designed to be representative of the school districts, schools,and students in the state as a whole. Table 1 lsts the 32 countiesincluded in the sample.
Figure 1DATE Evaluation Design
Study of Probability Samplesof Districts, Schools and Students
Costs
StaffCurriculumParent activitiesIn-kindTrainingCommunityinvolvementAlternative activitiesEvaluation
Student useStudent knowledgeStudent attitudesStudent behaviors
Studentsf
Parents
2
Implementation
StaffingProgram control
CurriculumProgram activitiesTrainingCommunityinvolvement
tt§T COPY AVAILABLE
15

Table 1List of 32 Counties Participating in the 1932-93 DATEEvaluation
County
Alameda Kings Placer Santa BarbaraButte Lassen Riverside Santa ClaraContra Costa Los Angeles Sacramento SolanoEl Dorado Madera San Bernardino StanislausFresno Mann San Diego TehamaHumboldt Merced San Francisco TulareImperial Napa San Joaquin VenturaKern Orange San Mateo Yuba
Sample Selection of Districts
The goal of the sampling plan was to develop a procedure bywhich student data could be collected that would providegeneralizable estimates of program implementation and studentexposure. The sampling plan also had to enhance theevaluation's ability to investigate DATE Evaluation questions atmultiple organizational levels. These two requirements ::z:t thegeneral parameters for the sample design, how large the sampleshould be, and how the sample should be drawn.
The DATE Evaluation used a multistage probability sampleof California's student population. The probability of selectionof any specific district was proportional to the district's studentenrollment as of fall 1990. This sampling plan ensured that the11 largest districts in California were included in the sample. Italso ensured that every California public school student had anequal chance of selection and, as a consequence, that all minoritypopulations and geographic regions of the state wereproportionally inch-led in the statewide sample. These featuresof the plan maximized the generalizability of the results andenhanced the viability of the evaluation.
2616

Sample Selection of Schools
Schools were sampled at the second stage of selection. Forselected districts with at least two or more schools, two schoolswere selected from that district each time the district was selectedin the first stage of the selection process. For selected districtswith only one school, only that school was included in the sample.The total number of schools included in the sample was 284. Arequirement for the second stage of the sampling process was thatif a sampled district had any elementary or middle school withless than 50 students, similar schools were linked before thesecond-stage selection so that each linkage was large enough toinclude at least 50 students. For the high schools, if a sampleddistrict had any high schools (9-12) with less than 100 students,similar schools were linked before the second-stage selection sothat each linkage was large enough to include at least 100students. The final sample included 267 schools for the studentsurvey and 225 schools for the program information.
Sample Selection of Students
Students were sampled at the third stage from each schoolselected at the second stage. This was a random selection of 50students from elementary and middle schools and 100 studentsfrom high schools in the sampl'e. The samples were generatedfrom the school rosters supplied by the schools. Each sample wasdrawn randomly by a SWRL researcher. Surveys were completedby 12,403 students.
Data Collection
Data collection for the five components was accomplishedthrough three instruments: a program form for each component,structured interviews for each component, and a cost survey. Theprogram forms for each component contained cost,implementation, and exposure data. The structured interviewswere conducted to supplement the data collected on the forms.Finally, the cost survey asked questions regarding the DATEfunds for the 1992-93 school year, such as how the loss ofComprehensive Alcohol and Drug Prevention Education(CADPE) and the potential loss of other prevention funds affectedthe schools' DATE programs. In addition, a student survey wasadministered to over 12,000 students in California.
17

WHAT ARESCHOOLS
DOING IN ATODPREVENTION?
Delivery of ATODPrevention
Curricula
18
The student data were collected using a standardizedadministered survey. This instrument served as a second meansof assessing program implementation and exposure to the fourcomponents mentioned above, as well as to the other componentsof DATE. The student survey was designed as a comprehensive,
standardized, multiple-choice instrument.
The DATE Evaluation included an examination of selectedcomponents of the DATE comprehensive prevention educationmodel. These components included: curriculum delivery,curriculum training, positive alternative activities, studentidentification and referral, and staff development. Thecurriculum component was divided into two components (i.e.,curriculum delivery and curriculum-specific training) to examinethe extent of implementation and cost of delivering ATODprevention curricula to students as well as training staff on thevarious curricula.
The amount of ATOD prevention curricula delivered to studentsvaried across grade levels as illustrated in Figure 2. Students ingrades 5 through 8 received the greatest amount of instruction,with an average of between 26 and 29 hours per student.Students in grades 11 and 12 received much less instruction thanany other gradea finding that also was observed in the 1991-92DATE Evaluation.
Students in all grades received some instructionspecifically to prevent tobacco use. The number of hours spenton tobacco issues was greatest for grade 5 with 7.4 hours,followed by 6.1 hours for students in grade 8. In contrast, theamount of tobacco use prevention curricula provided to studentsin grades 11 and 12 was negligible (see Figure 2). Across thegrade levels, 19% of the curriculum time was devoted to tobacco
issues.AOD use prevention also was addressed at all grade levels,
with the greatest concentration in grades 5 through 8, rangingfrom 7.2 to 7.9 hours per student. A little more than one quarterof the curriculum time for all grades was devoted to AOD issues.
The largest proportion of instructional time in all gradeswas spent on broader prevention strategies such as fostering self-esteem and developing social skills, including refusal andcommunication skills.

Figure 2Number of Instructional Hours Per Student on Tobacco, AODs,And Other Issues by Grade
12
11
10
9
65
4
3
2
111111111~11111INIMM
111/110111111111MINNINNI
B22222222222222222i222222222111111111 O11111111M1111111111111111111
W+M.4:46:44::.:44::4::::44:444:440:44:44
1111.11111111111MIN
...:;1112.2222222MOI:=2:11:5!:.5t:t:iggt:tKit'Sf;t:t:*;
0 5 10 15 20
Number of Hours Per Student
® . Tobacco 0 AOD 5: Other
25 30
The content of the curricula delivered to students tended toaddress information about ATODs, health consequences ofATOD use, and skills building. These topical areas wereaddressed 70% to 100% of the time in the curricula. However,science curricula typically did not address personal and socialskills development, and family life curricula did not addressATOD information and health consequences of ATOD use.
The most common ATOD prevention curricula reported forthe 1991-92 evaluation (i.e., Here's Looking at You 2000[HLAY 2000]; Drug and Alcohol Resistance Education [DARE];health; and QUEST Skills for Adolescence [QUEST SFA]) alsowere among the most prevalent curricula for the 1992-93 schoolyear. Overall, health curricula were the most prevalent, followedby HLAY 2000. Health classes were the prevailing mode ofATOD prevention curriculum delivery for students in grades 9-10, which is not surprising given the requirement for students inthese grades to complete a health course. HLAY 2000 wasemphasized in grades 2-8 as illustrated in Appendix A. Othercurricula tended to be emphasized in the specific grades forwhich they were developed. For example, fifth graders received
19
Training of ATODPrevention
Curricula
20
the greatest number of hours of DARE, and instructional time forQUEST SFA was relatively high for students in grades 6 and 7.
There was a notable difference in the percentage ofstudents receiving prevention curricula across grade levels.Students in K-8 received instruction in one or more preventioncurricula as reflected by the totals in Appendix B. However, amuch smaller percentage of students in grades 9-12receivedsimilar instruction. Juniors and seniors in high school were theleast likely to receive ATOD use prevention curricula. Thisfinding is consistent with the curriculum implementation resultsof the 1991-92 evaluation.
Schools delivered 20,683 staff hours of training specificallyrelated to ATOD prevention curricula during the 1992-93 schoolyear. Of these staff hours, 32% were devoted to training staff onHLAY 2000. As illustrated in Figure 3, QUEST Skills ForGrowing (QUEST SFG), health, and other ATOD preventioninstruction also accounted for a significant amount of the totalamount of curriculum staff training hours. This coincides withHLAY 2000 and health being the two most widely implementedcurricula and accounting for over half of the total resources usedfor curriculum delivery during the 1992-93 school year. Fewstaff were trained in curricula such as Discover, Science, Tribes,and similar instruction offered through the Healthy KidsRegional Center (HKRC).
Although staff other than teachers and aides did receivesome curriculum training during the school year, teachers andaides undoubtedly received the most training across curricula.Given that it is usually teachers and aides who provide classroominstruction in ATOD prevention, it is understandable that theyreceived the most training and were trained in several differentcurricula. Teachers and aides, counselors and nurses, andprincipals and assistant principals tended to receive training invarious curricula, while central-office staff were mainly trainedin HLAY 2000 (69%).

Staff DevelopmentTraining
(NoncurriculumSpecific)
Figure 3Percentage of Staff Involved in Curriculum Training
HKRCTribes
ScienceDiscover
Family LifeTobacco
QUEST SFADARE
District DevelopedPeer Program
HealthAll Other
QUEST SFGHLAY 2000
0 5 10 15 20 25 30
Percentage of Staff
35
Teachers and ti Central-Office Staff
Aides
Counselors and 0Nurses
Principals,
Assistant
Principals, and
Secretaries
Type of Staff Development Training
There were several types of staff development training during theschool year. For example, workshops and in-services were themost prevalent types of training, and there were a fewconferences and staff development days. Regardless of the typeof training, teachers received the most (77%), followed by:counselors and nurses; principals, assistant principals, andsecretaries; central - office staff; consultants; and communityprofessionals and agencies (all less than 10%).
Training was sponsored by districts, schools, counties,community-based organizations, or other entities (see Table 2).Respondents could indicate multiple sponsors for a giventraining; therefore, the percentages sum to more than 100%.District-sponsored training was the most common, followedequally by school-sponsored training and others.

Focus and Extent ofStaff Development
Training
22
Table 2Percentage of Staff Development Training Sponsored by EachOrganization
Sponsor of training Percentage
District 51Their own school 28Another school 3
County 17
City 1
Community-based organizationOther sponsor 28
In addition to staff at their own school, the followingprofessionals also were involved in the training either as trainersor participants: district personnel (43%), personnel from otherschools (36%), county personnel (21%), representatives fromcommunity-based organizations (11%), city personnel (2%), andother staff (18%).
It is important to keep in mind that staff development trainingusually addressed a range of topics. Generally, other preventionstrategies such as refusal skills and fostering self-esteem wereincluded as well as ATOD-specific material in keeping with themore comprehensive approach. Although these topics oftenoverlap, we requested that respondents separate tobacco issuesand AOD issues from all other issues.
The largest number of training hours was spent on otherprevention issues (61%), followed by AOD issues (27%). Thesmallest number of hours was spent on tobacco-specific issues(12%). Tobacco and AOD training included broader preventionissues such as self-esteem, skills building, conflict resolution,gang information, refusal skills, and AIDS/HIV information.Because the ether issues included such a wide range of topics,more time was devoted to this entire group of topics than thetobacco-specific or AOD- specific topics. While last year'srespondents were asked only to differentiate between tobacco-and AOD-specific training topics, the proportion of this year's

training time focusing on tobacco- and AOD-specific issues isconsistent with the findings of the 1991-92 evaluation.
The largest number of noncurriculum-specific staff traininghours (over 4,000) was spent on alternative classroom strategies,dynamics of high-risk behavior, implementation of the earlyintervention model, and risk and protective factors as illustratedin Figure 4. The topics where the most time was spent (e.g., riskand protective factors) involved staff who work most directlywith students. Therefore, it is not surprising that the fewestnumber of hours was devoted to policy enforcement andcommunity involvement. Also, policy enforcement tended to becovered for a briefer period of time within the training, partlybecause most teachers and other personnel already were familiarwith the policies. Moreover, training covering topics such aspeer counseling and parent involvement would include only afew staff members (i.e., the school-based intervention team,commonly referred to as the core team). Over 3,000 staff hourswere spent on other topics such as AIDS/HIV awareness, ganginformation, and fetal alcohol syndrome.
Figure 4Total Number of Hours for All Personnel by Training Topic
Policy aforcament
Community
Involvanent 11/11MPeer Counseling
000
Parent Involvement
Service and ReferralI- Strategiesao
Support Group
Et: Risk and Protective
Factors
Intervention Model
HighRisk Behavior
Alternative Strategies
Other
=be
-11111.1111111111.
0 1,000 2,000 3,000 4,000 5,000 6,000
33
Total Staff Hours
23
IdentificationAnd Referral
24
An identification was defined as any situation in which a studentwas recognized as having an ATOD-related problem, whether ornot he/she was referred for services. A referral was defined asany situation in which a student received services, either oncampus or off campus. The exact number of identifications bysource and by reason is difficult to determine because a studentcould be identified on more than one occasion and eachidentification could come from more than one source and formore than one reason. For example, while we can report thenumber of identifications made as a result of alcohol use, wecannot determine if alcohol was the only reason, or even theprimary reason for such identifications. Nevertheless, breakingdown the identifications by source and reason helps explain whois identifying students in need of ATOD-related services andwhy.
Identification of Students
Of the students enrolled at th) 225 schools, a total of 6.5% wasidentified as having ATOD-related problems during the 1992-93school year. Twenty-four percent of those students, or 1.5% ofthe total, were identified more than once. Teachers wereprimarily responsible for identifying the students, accounting fortwice as many identifications as any other source (see Figure 5).The next highest source of identifications was the studentsthemselves, with 16% of the identifications coming fromstudents who came forward as a result of an ATOD-relatedproblem. Core teams, families, and peers each were involved inidentifying students in 10% to 15% of the cases.
The reasons why students were identified varied. Pooracademic performance, changes in academic performance, or achange in overall behavior were reasons for studentidentifications in almost half of the cases. Emotional changeswas the reason for identification 18% of the time. Interestingly,students who were identified specifically for AOD use andtobacco use comprised only 16% and 8% of the cases,respectively.
3.1

Figure 5Sources of Student Identification
Law &forcemeat
Peer
Family
COM
E tOherlzS Core Team, Student`6*
Study Team
Self
Teacher
I I I I
0 5 10 15 20 2.5 30 35 40
Percentage of Identifications
On-Campus Referral of Students
Once identified as having an ATOD-related problem, studentswere most often referred for on-campus services. Five percent ofthe students enrolled in the 225 schools were referred for on-campus services during the 1992-93 school year. Most of thosestudents participated in some type of counseling, either on anindividual basis (30%) or as part of a group (20%). Anadditional one fifth of the students were referred to the assistantprincipal at their school, while core teams and other on-campusservices were involved in about 15% of the referrals each, asseen in Figure 6. Furthermore, 58% of the students receiving on-campus services were follow-ups.
25

26
Figure 6Types of On-Campus Referrals
8
rn
I8
Care Team
Support Group
Assistant Principal
Individual Counseling
0 10 15 20
Percentage of Referrals
Off -Campus Referral of Students
30 35
A smaller percentage of students was referred to off-campusservices during the 1992-93 school year. Of the total studentpopulation at the schools providing identification and referraldata, 2.8% were identified for services outside of school, and justunder two thirds of those referrals were for individual or supportgroup counseling services. Child Protective Services and lawenforcement services were required for just over one fifth of thestudents identified (see Figure 7).
Figure 7Types of Off-Campus Referrals
8
Law Enforcement
Child Protective
Services
Other
Community-Based
0 Individual Counseling
Community-Based
Support Group
0 5 10 15 20 25 30 35
36
Percentage of Referrals

Identification and Referral Procedures
Most of the schools indicated that they had a formal procedurefor identifying and referring students with ATOD-relatedproblems. Not surprisingly, teachers played the most integralpart of that process, being involved in identifying and referringstudents at most of the schools (see Table 3). After teachers,proximity to students seemed to indicate the extent to whichpersons were involved in identifying or referring students forATOD-related problems. More specifically, the studentsthemselves, their peers, and their families were involved inidentifying students at almost one third to one half of the schoolsin the sample. Principals, counselors, and core teams, however,were more likely to be involved in referring students for servicesafter they had been identified.
Table 3Percentage of Schools Where Specified Individuals Are Involved inIdentifying and Referring Students With ATOD-Related Problems
Staff positionPercentage ofschools wherestaff identifystudents
Percentage ofschools wherestaff referstudents
Teachers 85 73Students 44Parents or family members 33 25Peers 26 19Principal or assistant principal 24 40Counselor or psychologist 20 39Core team 18 47Law enforcement or Child 6 2
Protective ServicesNurse 2 6
Generally, the identification and referral proceduresoperated at the schools in the following manner. If schoolofficials believed a student at their school possessed tobacco, or
3 27

28
was intoxicated or "high" while at school, half of the schoolsindicated that students would be suspended. Sending the studentto the principal or the assistant principal, and contacting thestudent's parents were the reported procedures at nearly half ofthe schools, as seen in Table 4. As might be expected, referralsto counseling, to a nurse or a medical team, or to lawenforcement agencies were more common for those students whowere high or intoxicated while at school, rather than for thosewho possessed tobacco.
Ta ble 4Percentage of Respondents Listing a Particular Intervention asPart of Their School's Procedures for Handling ATOD Use
Staff responses to observingATOD use
SuspensionSend to principal or assistant
principalCall/notify parentTalk to studentSend to school counselorEmphasized education/
counselingConfiscateStated "not a problem"Send to a specified program or
classMeet with child and parentRefer to community-based
counselingExpelRefer to core teamSend to nurse or medical
evaluationRefer to law enforcementIsolate or separate studentOther responses
Percentageof tobaccouse observed
Percentageof AODuse observed
57 5051 48
41 4934 2024 2718 9
16 N/A14 11
13 11
11 14
8 23
6 146 11
4 20
3 31
N/A 15
<10 <10
3b

Use of PositiveAlternative
Activities inPrevention
These varying procedures illustrate the complexity of thestudent identification and referral process within DATEprograms. While some schools indicated that they had aregimented process for dealing with ATOD-related issues, othersseemed to treat each student individually. Therefore, what itightconstitute a formal identificatior or referral at one school could,in another school, simply be resolved by an informal meetingbetween the student and teacher, or could even be dismissed as"not a problem" by school officials.
In the 1991-92 DATE Evaluation, districts were required toreport positive alternative activities in terms of six categories:
recreational sports leagues;
visual and performing arts;
special interest clubs;
service clubs;
drug-free social events; and
ATOD action groups.
It was discovered that as broad as these categories were,they still did not capture the entire range of activities. For the1992-93 DATE Evaluation, respondents were given thefollowing guidelines that had been developed in conjunction withthe CDE Healthy Kids, Healthy California Office, as to what
constituted positive alternative activities:
have as the central focus the reduction of targeted riskfactors and/or enhancing targeted protective and resiliencyfactors;
include a consistently reinforced "no-use message";
are not held during regular class time (e.g.,assemblies). Time before school, after school,during lunch breaks, and during special field tripshowever, is allowable;
do not use DATE funds to supplant other resources;and
3U 29

do not include intramural sports (unless they meetall of the above criteria).
The activities were grouped into tne following categories:
recreation;
drug-free social events;
Red Ribbon Week;
special interest clubs; and
all others.
Figure 8 depicts student participation in various positivealternative activities. All positive alternative activities togetherp wided about 6.3 hours of student time. Recreation accountedfor the most hours. The largest single contributors to the "all-other" category (peer programs, visual and performing arts,tutoring, and cultural activities) furnished less than 2 hours each.
Figure 8Alternative Activity Hours Per Student by Activity Category
o
<
All OtherSpecial ln:erest Clubs
Red Ribbon WeekDrug-Free Events
Recreation
0.0 02 OA 0.6 0.8 1.0 12
Student Hours/Enrollment
r 1181 One-Tine Event 0 Ongoing Events
30 4 0
IA 1.6

Alternative activities were not uniformly provided acrossgrade levels (see Figure 9). The percentage of student:.participating was lowest in kindergarten and rose steadily up tograde 8. It dropped down for grade 9 and rose back steadily tograde 12. Interestingly, the percentage of students participatingin Red Ribbon Week was very steady at about 18% for allgrades. The percentage of students participating in drug-freesocial events increased across grades. While recreationaccounted for much of the students' time, the studentparticipation percentage was relatively low, reaching a maximumof 9% at sixth grade. That recreation did not reach all that manystudents also was a finding in the 1991-92 DATE Evaluation.
Figure 9Percentage of Students Participating in Alternative Activities byGrade and Category of Activity
78 1=11.9
10
11
;III111101111.111.11.11=11FMMMSMO
INZOMMIM1=1111
12 111.11MIIIIEINEEME7777:77771r10 20 30 40 50 60 70 80 90
Percentage of Students
111 Red Ribbon 13 Drug-Free Recreation Special Interest l OtherWeek Events Clubs
31
WHAT ATODPREVENTION
EDUCATION DOSTUDENTSRECEIVE?
Student ExposureTo School-Based
Tobacco PreventionCurricula and
Activities
32
Students were exposed to or aware of several categories ofATOD-related events during the current school year. Thecategories of events encompass prevention curricula, activities,and other service events found in California schools today.Tobacco- and AOD-related events were referenced separately.Percentage of exposure to categories of curricula, activities, andservice events reported below represents one or more instancesof the student experiencing that event. In other words, single andmultiple exposgres to an event counted as one exposure to acategory of evelnts.
Grades 4-6
In elementary s600ls, 88% of the students were exposed to atleast one tobaccrelated lesson or activity event during the1992-93 school year. As shown in Figure 10, the most frequentactivities students experienced were class speakers and a lessonor film; antismoking clubs were the least frequent; and in themiddle were school contests, school assemblies, and a specialday or week (e.g., Great American Smokeout). As a. generaltrend, students in higher grade levels received more exposure toprevention activities. However, for three of the six categoriesantismoking clubs, school assemblies, and a special day orweeksixth graders reported less exposure than fifth gradersand exposure less than or equal to fourth graders. In general. thegreat majority (82%) of the students learned about the dangers ofsmoking cigarettes in school during the 1992-93 school year.
Figure 10Percentage of Students Experiencing Tobacco-Related Events,Grades 4-6
ria
Antismoking Club
School Contest
School Assemblies
Special Day or Week
Lessee or Film
Class Speaker
0 10 20 30 40 50 60 70 80
42Percentage of Students
Grade
el 4
05
0 6

Student ExposureTo School-BasedTobacco-Related
Services
Grades 7-12
Forty-one percent of all secondary school students were exposedto at least one tobacco-related lesson or activity event. As shownin Figure 11, the most frequent tobacco prevention event was alesson in a health class followed by a class speaker. One-timeevents, such as health fairs, were experienced by the feweststudents. In contrast to elementary school students, the generaltrend for secondary school students was that those in highergrades reported less exposure. The only category in which thistrend was reversed was one-time events. There seems to be morewillingness on the part of the older students to participate in theone-time events.
Figure 11Percentage of Students Experiencing Tobacco-Related Events,Grades 7-12
Other
One-Time Event
Regular Class
Lesson
School Assemblies
Essay/Poster/
Homework
Class Speaker
Health Class Lesson
Grades 7-12
0 5 10 15 20
Percentage of Students
25 30
Gado
7M8
La9
0io
12
When asked about the availability of smoking cessation services,secondary school students were most aware of a support group orclass for help in quitting tobacco (see Figure 12). Almost half ofthe students (47%) indicated they did not know if any of thelisted cessation services were available and another 26% werenot aware of any services. Taken at face value, almost threequarters of the students were not aware of any school-based help
333

Student ExposureTo School-BasedAOD Prevention
Curricula andActivities
34
for stopping tobacco use. Of all students, at least 2% participatedin one of the tobacco cessation services listed in the survey and6% reported using some other type of help for stopping tobaccouse.
When asked about ease of access to smoking cessationservices, such as the ease of joining a support group at school forhelp with stopping tobacco use, 35% of the students felt thatsupport groups for stopping tobacco use would be easily acces-sible and 25% thought that access was not easy. However, 40%of the students did not address access because they reported thattheir schools did not have tobacco cessation support groups.
Figure 12Percentage of Students Reporting Availability of andParticipation in Tobacco-Related Services, Grades 7-12
No Use Contract
No Use Club
8 Support GroupFor Concerned
Others
Other
Support Group or
Class for Quitting
Grades 4-6
0 2 4 6 8 10
Percentage of Students
12 14
111 Availability
0 Participation
Ninety-one percent of all elementary school students wereexposed to at least one AOD-related curriculum and activityevent (see Figure 13). The three most frequently reported eventsby e !mentary school students were class speakers, a lesson orfilm, and a special day or week (e.g., Red Ribbon Week). Thesewere experienced by more than 60% of the students. Anti-AODclubs were the least experienced prevention event. As withtobacco prevention curricula and activities, the trend was thatstudents in higher grade levels reported more exposure to
44

prevention activities. Eighty-one percent of the students alsoindicated that they had learned about the dangers of AOD use inschool this year.
Figure 13Percentage of Students Experiencing AOD-Related Events,Grades 4-6
Antidrinking
Antidrug Club
School Contest
Assembly or Rally
Special Day or Week
Lessoo or Film
Class Speaker
Grades 7-12
/...; 5"
0 20 40 60 80
Pr-Pntage of Students
Grade
Os
6
Fifty-one percent of the secondary school students were exposedto at least one AOD-related lesson or activity event (see Figure14). The most frequent AOD prevention event was Red RibbonWeek followed by three categories with similarly reportedexposure: school assemblies, a lesson in health class, and a classspeaker. Sober dances were experienced by the fewest students,and lessons in a regular class were the next lowest category ofprevention activity reported. The exposure trend in secondaryschools is that students in higher grades reported less AODcurriculum and activity events. The one-time event category inwhich this trend was clearly reversed was sober dances, which isunderstandable given the increased emphasis on sobriety atschool proms. Roughly half of the students reported they did nottake part in any of these events.
4) 35

Student ExposureTo School-Based
AOD Services
36
Figure 14Percentage of Students Experiencing AOD-Related Events,Grades 7-12
Sober Dance
Lesson in RegularClass
Essay/Poster/
Homework
Lesson on LifeSkills
Lesson in Health
Class
School Assemblies
Class Speaker
Red Ribbon Week
Grades 7-12
, . . . ... . .41.1111.411111
0 5 10 15 20 25 30 35
Percentage of Students
Grade
IN
D9
lo
CI u
®12
Generally, secondary school students felt that there was someavailability of AOD-related services in schools. However, theirreported participation level was quite low. Students reportedrates of less than 30% for the two most frequently cited types ofindividual help available: one-on-one peer counseling forpersonal problems and academic help from a peer (see Figure15). These two types of services also were the most frequenttypes of individual help in which students participated. Whilethe fewest number of students was aware of the availability ofcontracts to not use AODs, a teacher or counselor meeting withstudents and their parent(s) was the least reported service inwhich students participated. Twice as many students were awareof peer counseling for help with personal problems than anyother type of group help (see Figure 16). Peer counseling also
4b

was the most frequently reported group help in which studentsparticipated.
Figure 15Percentage of Students Reporting Availability of andParticipation in AOD-Related Individual Services, Grades 7-12
8
Other
No Use Contract
Tutored by Teacher
Met With Adult for
Personal Problems
Staff Met With Student
Academic Help
One-on-One Peer Counseling
III Availability
Participation
0 5 10 15 20
Percentage of Studans
25
Figure 16Percentage of Students Reporting Availability of andParticipation in AOD-Related Group Services, Grades 7-12
8
Recovery Support
Group
Support Group for
Personal Problems
Discuss Gangs
Peer Counseling
.11.1.1.104
4 '7
30
IS Availability
0 Participation
1111111MISIEMZEMEI
5 10 15 20 25
Percentage of Students
37

WHAT ARE THEATOD
PREVENTIONEDUCATION
COSTS IN THESCHOOLS?
The Per-StudentCost of Providing
DATE ProgramComponents
38
The 1992-93 DATE Evaluation included a cost analysis ofindividual school-based components in the California DATEProgram, rather than a cost analysis of the comprehensive model.As previously stated, these components included: curriculumdelivery, curriculum training, positive alternative activities,identification and referral services, and staff development. Datafor curriculum delivery and curriculum training were collectedand analyzed separately to distinguish between the cost ofdelivering ATOD prevention curricula to students and trainingstaff on the use of ATOD prevention curricula.
At a minimum, California schools spent $83.78 per student toprovide students with prevention education curricula, positivealternative activities, identification and referral services, and toprovide personnel with staff development and ATOD training incurricula (see Table 5). Seventy-seven percent of this amount($64.52 per student) were spent on school personnel, includingcentral-office staff, principals, assistant principals, secretaries,teachers, aides, released time, counselors, and nurses. Releasedtime is the substitute costs incurred by staff attending DATE-related activities. Specifically, 52% of the amount spent on thesefive components were for personnel paid at the teacher level(e.g., teachers, aides, some DATE coordinators, released time).Schools spent a significantly smaller per-student amount on otherschool personnel such as those paid at the counselor or nurselevel (13%), principals, assistant principals, secretaries (11%),and central-office staff (2%). Moreover, the remaining 23%were distributed among community professionals and agencies(12%); consultants (4%); materials, stipends, and travel (5%);and miscellaneous expenses (2%).
Table 5Minimum Per-Student Cost of Each Component
Component Per student cost ($)
Curriculum delivery 27.55Curriculum training 5.05Identification and referral process 28.69Staff development 7.12Positive alternative activities 15.38
Total 83.78

StakeholderContribution to the
DATE ProgramComponents
As mentioned previously, the 1992-93 DATE Program wasfunded by two California initiatives, Drug-Free Schools andCommunities (DFSC) and Tobacco Use Prevention Education(TUPE). These two funding initiatives and the agencies thatadminister these funds are funding sources or stakeholdersbecause they have a "stake" or an investment in DATE. DFSCallocated $3.254 per student enrollee, plus an additionalpercentage based on their Chapter 1 funding to public and privateCalifornia schools. School districts could carry over 25% of thecurrent year's entitlement amount to a subsequent year. Onlypublic schools received approximately $3.914 per average dailyattendance (ADA) of TUPE funds, plus a small amount of moneyfor county administration. School districts could carry over anyamount of the TUPE funds during the three years of projectfunding. Given that DATE is in its third year, during 1992-93districts could have spent up to approximately $11.742 perstudent of TUPE funds for the entire DATE Program.
Many other stakeholders funded parts of or invested inDATE programs by contributing time, money, and otherresources. For example, some stakeholders (other than TUPEand DFSC) (see Figure 17) included agencies that funded otherstate and federal grants (e.g., School Improvement grant, Chapter1), cities, counties and communities surrounding the schools,private organizations, and people who donated their time orresources. The city invested in DATE largely through theinvolvement of local law enforcement agencies. Similarly, thecounty contributed to DATE through sheriff organizations,county offices of education, and health services, to name just afew. The private organizations that invested in DATE variedfrom local hospitals to United Way and the American Heart,Lung, and Cancer Associations.
39

40
Figure 17Percentage of Stakeholder Contributions to Budget Items of theFive Components
Miscellaneous
Mataials, Stipends,And Travel
Consultants
CommunityProfessionals
Counselors and Nurses
Teachers, Aides, andReleased Time
Principals, AssistantPrincipals, and Secretaries
Central-Office Staff
0 10 20 30 40
Contritution
50
TUPE 0 DFSC 0 General Funds t Other
60
In addition, school districts and schools themselves alsoinvested in California's DATE programs and therefore wereconsidered stakeholders. For example, school districts becamestakeholders when school staff (e.g., teachers, principals,assistant principals) spent time implementing a component ofDATE and the staff time was paid for by the district's generalfunds. Similarly, schools became stakeholders when they reliedon school club resources to sponsor various DATE-relatedevents.
There was a considerable range in the amount of resourcescontributed by each of the stakeholders, as illustrated in Figure18. TUPE contributed approximately 9% and DFSC 7% of theresources for these five components. Other stakeholderscontributed the remaining 84%. These other stakeholdersprovided a wide range of support, from community- and school-sponsored contributions at 1%, to district general funds at 63%.In the middle of the range were: cities (6%), the state (4%),donated resources (3%), the federal government and counties(2% each), and private and other contributions (1% each).
50

Figure 18Percentage of Stakeholder Contributions to the Five Components
School FundsCommunity
PrivateOther
CountyFederal
DonationsStale
CityDFSCTUPE
General Funds
0 10 20 10 40 50 ; 60 70
Contributions
The extremely large contribution from district general fundsis not surprising considering the five components included in thisyear's evaluation. All of the components analyzed this year areschool-based. That is, for the most part, the compolents aredelivered at the school by school staff. For example, ATODprevention curricula are delivered to students during class timeby teachers. Similarly, staff often receive released time orstipends to participate in curriculum and staff developmenttraining. School counselors, teachers, principals, and nurses arethe staff most involved in the identification and referral process.Finally, positive alternative activities typically are delivered tostudents either during lunch, or before and after school. All ofthese staff activities are paid for with general funds, either partlyor entirely. Given the need for considerable involvement byschool staff in these activities, it is not surprising that the datarevealed such a high level of support on the part of the district.
Nevertheless, we should not assume that school districts donot need the DFSC and TUPE contributions to continueimplementing DATE programs. Districts pay for teacher andother staff time, regardless of the content of the curriculumtraining and staff development they receive, or the curricula theydeliver to students. However, the TUPE and DFSC fundinginitiatives were generated as a means of facilitating acomprehensive approach to implementing ATOD use preventionprograms. These programs were to include, for example,delivering ATOD curricula to students and training of staff.Therefore, although teachers and other staff are paid with districtgeneral funds to deliver curricula and receive training, it is
415.1

Per-Student Cost ofExposure to ATOD
PreventionCurricula
42
because of the DFSC and TUPE contributions that districts, and,in turn, schools, were able to incorporate an ATOD focus intothese components. As illustrated in interviews with the DATEcoordinators that will be discussed later in this report, TUPE andDFSC funds provided the foundation for many DATE programsupon which were built services augmented by community andother outside resources.
The cost of exposing students to ATOD prevention curricula wasderived from the cost of delivering ATOD prevention curricula tostudents. The data revealed that, on average, at least $27.55 perstudent was spent to expose students to ATOD preventioncurricula. About 77% of this amount ($21.19 per student) wenttoward paying for staff time, most of which was for teachers,aides, and released time. The remaining 23% largely paid forresources from community professionals and agencies (seeFigure 19).
As expected, given the large amount of staff time requiredto deliver curricula to students, school district general funds werethe largest contributor at 74% (see Figure 19). Cities also weresignificant contributors at 11%. The city contribution wastypically due to the involvement of local law enforcement in suchactivities as delivering the DARE curriculum to students. Inaddition, TUPE and DFSC contributed 6% and 4%, respectively.The remaining contributions ranged from 2% from counties toless than 1% from the other stakeholders.

Per-Student Cost ofTraining Staff in the
Use of ATODPrevention
Curricula
Figure 19Percentage of Stakeholder Contributions to ATOD PreventionCurricula
E'
Counselors and Nurses
Teachers, Aides, and
Released Time
Principals, AssistantPrincipals, and Secretaries
Miscellaneous
Materials, Stipends,
And Travel
Consultants
CommunityProfessionals
Central-Office Staff
Of the 14% contributed by other stakeholders,ill% came from city stakeholders.
0 10 20 30 40 50 60 70
Contributions
Iei TUP E 0 DFSC 0 General Funds Other
At least $5.05 per student was spent training staff in the use ofATOD curricula, which included personnel time, in conjunctionwith released time, stipends, and materials related to thecurriculum training. Figure 20 lists the distribution of resourcesand the stakeholder contributions to each budget item. Notsurprisingly, almost half of the resources expended (49%) wasfor school staff time, with the largest proportion paid to teachers,aides, and released time (36%). Community professionals andconsultants accounted for 20%; training materials, stipends, andtravel (largely stipends and instructional materials) accounted for10%; and finally, miscellaneous expenses accounted for a largeproportion (22%) of the resources expended on this component.
J J43

44
Figure 20Percentage of Stakeholder Contributions to ATOD PreventionCurricula Training
Miscellaneous
Materials, Stipends,and Travel
Consultants
Community
Professionals
Counselors and Nursesac
Teachers, Aides, and
Released Time
Principals, AssistantPrincipals, and Secretaries
Central-Office Staff
Of the 22% contributed by other stakeholders,
21.6% came from state stakeholders (other
than TUPE and DFSC).
0 5 10 15 20 25 30 . 35
Percentage of Contributions
40
TUPE/11 DFSC C3 General Funds 13:1 Other
The state contributed the majority of resources needed totrain staff in the use of ATOD curricula, either through DATEfunds (43%) or through other state funding (30%), such as schoolimprovement or state mentor funds. Nearly all of themiscellaneous expenses (21.6%) were paid for with these statecontributions. TUPE funds (25%) went largely toward teacher,aide, and released time (9%); central-office staff (6%);consultants (3%); and materials, stipends, and travel (4 %),Similarly, DFSC funds (18%) typically supported teacher, aide,and released time (8%); consultants (3%); and materials,stipends, and travel (3%). Within the curriculum trainingcomponent, school district general funds (16%) did not dominatethe contributions made by the stakeholders, although they didmake a large contribution to teachers, aides, and released time(12%).
5.1

Per-Student Cost ofIdentifying and
Referring StudentsFor ATOD-Related
Issues
Capturing the cost of the identification and referral processes inschools was du ficult because, by nature, it is a daily process withunclear bounds lies. That is, most staff are trained to constantlylook for signs and symptoms of ATOD-related issues and followthrough with the appropriate action within their school'sidentification and referral process. However, the actualidentification and referral processes vary greatly across schoolsbecause there is a variety of participants in the ATOD-relatedidentifications (e.g., core teams, student attendance reviewboards [SARBs], law enforcement, teachers). Nevertheless,SWRL is confident that the methodology used in this evaluationallowed us to account for the minimum cost of identifying andreferring students with ATOD-related issues. An effort wasmade to capture the time spent by all staff involved in theprocess, including those employed by the district and thoseoutside of the district.
The minimum amount of resources spent on theidentification and referral process was $28.69 per student. Asillustrated in Figure 21, 85% of this expenditure was for schoolstaff time, including teacher, aide, and released time (32%);counselors and nurses (29%); and other school staff such asprincipals, assistant principals, and secretaries (23%).Community professionals and agencies also contributed theirresources (13%). The remaining resources were for consultants(2%), central-office staff (1%) and miscellaneous expenses (lessthan 1%).
Given the high amount of school staff involved in theidentification and referral process, it was not surprising that 72%of the contribu'dons for this component were from district generalfunds. TUPE contributed 9% and DFSC 4% of the resources,which also tended to pay for teachers, aides, released time, andcounselors and nurses. Other contributions from federal funds,such as Chapter 1, accounted for 4% while cities contributed 3%.All of the other sta.:eholders contributed 2% or less.
45
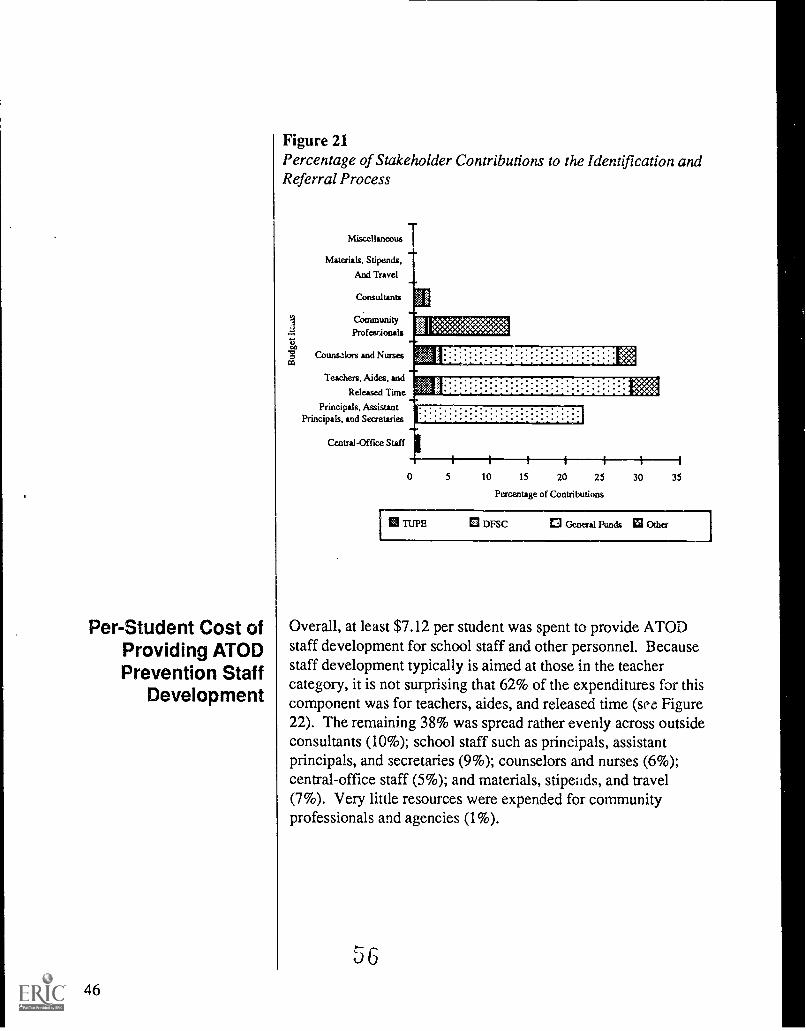
Per-Student Cost ofProviding ATODPrevention Staff
Development
46
Figure 21Percentage of Stakeholder Contributions to the Identification andReferral Process
Miscellaneous
Materials, Stipends,
And Travel
Consultants
CommunityProfesrionals
Counszlors and Nursesco
Teachers, Aides, and
Released Time pal' - -: : : :
: : : : : : : : :*KO
Principals, Assistant F. .
Principals, and Secretaries l : : : : : : : : :
Central-Office Staff I
0 5 10 15 20 25
Percentage of Contributions
30 35
El TOPE DFSC 0 General Funds El Other
Overall, at least $7.12 per student was spent to provide ATODstaff development for school staff and other personnel. Becausestaff development typically is aimed at those in the teachercategory, it is not surprising that 62% of the expenditures for thiscomponent was for teachers, aides, and released time (sr e Figure22). The remaining 38% was spread rather evenly across outsideconsultants (10%); school staff such as principals, assistantprincipals, and secretaries (9%); counselors and nurses (6%);central-office staff (5%); and materials, stipends, and travel(7%). Very little resources were expended for communityprofessionals and agencies (1%).
56

Per-Student Cost ofProviding Positive
AlternativeActivities to
Students
Given the large amount of staff time necessary for staffdevelopment, it is not surprising that district general fundsrepresented the largest contribution (61%), followed by TUPE(17%) and DFSC (12%) (see Figure 22). TUPE contributedlargely to teachers, aides, and released time (6%) and outsideconsultants (5%). Likewise, DFSC contributed to the samebudget items at 5% and 4%, respectively. Other state funding,such as school improvement and mentor funds, represented 4%of the stakeholder contributions. All other contributions were2% or less.
Figure 22Percentage of Stakeholder Contributions to ATOD PreventionStaff Development
Miscellaneous
Materials, Stipends,
And Travel
Consultants
Community
Professionak
Counseloes and Nurses
Teachers, Aides, and
Released Time
Principals, AssistantPrincipals, and Secretaries
Central-Office Staff
0 10 20 30 40 50
Percentage of Contributions
60 70
I123 TIRE D DFSC 0 General Funds D Other
To be included as part of the DATE Program, positivealternative activities must meet the following requirements: (a)focus on the reduction of targeted risk factors and/or enhancingtargeted protective and resiliency factors; (b) consistentlyreinforced no-use message; (c) are not held during regular classtime (e.g., assemblies) but rather are held before or after school,
r-J47

48
during lunch, and during special field trips; (d) do not use DATEfunds to supplant other resources; and (e) do not includeintramural sports (unless they meet all of the above criteria).Keeping these requirements in mind, California, on average,spent at least $15.38 per student to provide positive alternativeactivities to students. Once again, a large proportion of thisamount was due to staff time (69% or $10.65 per student),including a large percentage of teacher, aide, and released time(49%) for supervising the activities. Community professionals,agencies, and consultants combined accounted for 15%.Materials, stipends, and travel (12%) and miscellaneous expenses(4%) also were included in the expenditures. All of these resultsare displayed in Figure 23.
Figure 23Percentage of Contributions to Positive Alternative Activities
of
ro
Miscellaneous
Materials, Stipends,And Travel
Consultants
CommunityProfessionals
Counselors and Nurses
Teachers, Aides, andReleased Time
Principals, AssistantPrincipals, and Secretaries
Central-Office Staff
Of the 16% contributed by other
stakeholders, 11% was donated.
i:ttt:t.tt:t:000«:t
0 10 20 30 40
Percentage of Contributions
50
TUPE 0 DFSC 0 General Funds Other
Although general funds (44%), TUPE (9%), and DFSC(10%) continued to make significant contributions, 13% of theresources for positive alternative activities were donated. Most ofthe donated time was contributed by the staff themselves (e.g.,
00

TargetingResources to
Students With HighATOD Use Levels
CURRENT ATODPREVENTION
EDUCATIONOUTCOMES
Student Attitudes/Knowledge Toward
Tobacco
teachers supervising an after-school activity). Schools also usedfederal funds (4.3%) to provide positive alternative activities fortheir students, such as Chapter 1, special education, and othercategorical funds.
Are resources provided by the CDE and local schools andcommunities targeting students with high ATOD use levels?Using program implementation intensity indices that werecomputed from the cost data for the curriculum delivery,identification and referral process, and positive alternativeactivity components of the DATE Program, a comparison wasmade of schools that had high program implementation withthose that did not. Generally, it was found that schools with highlevels of program implementation were using their resources forstudent populations that report high levels of substance use. Theresources provided by the CDE and local schools andcommunities for prevention education are, in fact, targetingstudents with high ATOD-use levels.
In determining the impact that resulted from the implementationof prevention programs in the schools, SWRL examinedstudents' current (a) attitudes toward ATOD use, (b) knowledgeabout the harms of ATOD use, and (c) behavior of using ATODs.
Grades 4-6
Elementary school students have an overwhelmingly negativeattitude toward tobacco use. Over 90% think that smokingcigarettes is bad for one's health, smells bad, and does not makea pers a look cool. More than 75% did not think that kids whosmoke had more friends or that smokers were more grown up.
Grades 7-12
Secondary school students were very knowledgeable about thedose-response relationship between the harmfulness of cigarettesmoking and both frequency and duration of the smokingbehavior. Students knew that greater harm to one's health wascaused by more cigarettes smoked for a longer period of time(see Table 6). For example, only 32% thought that smoking onecigarette per day for one year would produce moderate to great1 arm while 94% thought that smoking 20 cigarettes per day for'0 years would produce similar amounts of harm. One problem
Jt- 49

50
with students being so aware of the dose-response relationship isthat they develop a comparative mind set and begin to think thatexperimentation is relatively harmless.
Table 6Student Percentage of Perceived Harmfulness of Varying LevelsOf Cigarette Consumption, Grades 7-12
Perceived harmfulness
Noharm
Slightharm
Moderateharm
Greatharm
1 cigarette per day for 21 48 19 13
1 year10 cigarettes per day 4 20 40 36
for 1 year20 cigarettes per day 3 7 22 69
for 1 year1 cigarette per day for 11 19 33 37
10 years10 cigarettes per day 3 6 18 72
for 10 years20 cigarettes per day 3 3 6 88
for 10 years
Only 4% of the nonsmoking students think they will trysmoking during the next year. This is an important statistic forprojecting the onset of smoking in the future and a credit to theschool programs that have been able to defer some interest insmoking by providing useful information about the harms oftobacco. However, these students held an incorrect impression.Fifty-seven percent believe that most of their peers smoke, whichis almost three times higher than the actual rate of current smok-ing.
Secondary school students were more aware of somespecific effects of cigarette smoking than others. For example,when questioned about carbon monoxide, 81% knew it was incigarette smoke and 72% knew that levels of carbon monoxideincreased in the blood within a few moments of smoking.However, when questioned about other physiologic responses, a
60

Student Attitudes/Knowledge Toward
AODs
little less than half (49%) were aware that smoking does notsteady your hands and 64% incorrectly thought that smokingcauses your heart to beat slower. The latter findings reveal that,although secondary school students know a great deal abouttobacco use and its harms, there is room for improvement. Thisis particularly the case regarding student knowledge about socialnorms and the effects of tobacco.
Grades 4-6
As with tobacco, elementary school students hold very negativeattitudes toward AOD use. More than 80% of the studentsresponded pc itively to five of the seven AOD knowledge andattitude items included in the survey (see Table 7). However,41% believe that adults drink alcohol daily and the majority(61%) were not aware that alcohol affects kids more than adults.
Table 7Percentage of Students Responding Positively to AODKnowledge and Attitude Items, Grades 4-6
Percentage
Attitude and knowledge items Grade Grade Grade4 5 6
Bad for health to drink alcohol 86 89 89Bad for health to use marijuana 92 94 91Bad for health to use inhalants 81 83 84Use of alcohol during pregnancy
can hurt the unborn baby93 94 95
Drinking is the most commoncause of auto accidents
85 87 85
Almost all adults drink every day 41 41 41Alcohol does the same thing to a
kid's body as to an adult's body66 61 53
Grades 7-12
Secondary school students also were well informed about AODuse. Frequent use of alcohol and marijuana were thought to be of
6151

Use of Tobacco
moderate or great harm by 75% and 82% of the secondary schoolstudents, respectively. More than 85% of the students across thegrade levels were aware that alcohol is the most widely abuseddrug and is the most common cause of fatal car accidents, thatdrinking alcohol can affect an unborn baby, and that anabolicsteroids are addictive (see Table 8). And, a little more than half(52%) were aware of the similarity in alcohol content of differenttypes of alcoholic beverages.
Table 8Percentage of Students Providing Appropriate Responses TestingKnowledge of AOD Effects, Grades 7-12
Grade
Knowledge items 7 8 9 10 11 12
A bottle of beer and a glass of wine haveequivalent amounts of alcohol.
49 42 47 57 55 56
Alcohol is the most widely abused drug. 78 79 85 88 89 93Drinking while pregnant can harm the unborn
baby.94 96 96 97 97 98
Alcohol is the most common cause of fatalcar accidents.
93 97 96 97 96 98
Anabolic steroids are addictive. 78 84 86 90 89 92
Cigarette SmokingGrades 4-6
Eighty-seven percent of grade 4-6 students reported that they hadnever smoked a cigarette in their lifetime, not even a puff. Only9% of the students had smoked cigarettes one or two times and4% had smoked three or more times. Four percent also reportedsmoking more than 100 cigarettes. Twenty-three percent of thelifetime smokers (about 3% of all students) had smoked acigarette in the past month, two thirds having smoked onecigarette and one third having smoked from 2 to 5 cigarettes inthe past month. This 3% of all students are the students who arethe current smokers in elementary schools.

Cigarette SmokingGrades 7-12
Fifty-six percent of grade 7-12 students reported smokingcigarettes in their lifetime, some as little as one or two puffs (seeFigure 24). The criterion for determining if adult smokers havemoved from the tobacco experimentation stage to a dependencestage (an addiction to nicotine) with cigarettes is whether theperson has smoked more than 100 cigarettes in his/her lifetime.While this is not as accurate an indicator with adolescents,because,of the difference in their smoking behavior (lesseramounts on more sporadic occasions), they were asked thisquestion for the purpose of categorizing students on a continuumof use. Seventy percent of the lifetime smokers (about 40% ofall students) are experimenters. Conversely, 30% of the lifetimesmokers (about 17% of all students) smoked more than the 100cigarette limit for experimentation.
Across grades 7-12, 34% of the lifetime smokers (about18% of all students) smoked cigarettes in the 30 days prior tosurvey administration, the time frame used to determine currentsmoking status. Thus, two thirds of the lifetime smokers are notcurrent smokers. About half of the current smokers smoked 5 orless days in the 30-day period. Only 21% of the current smokers(and 4% of all students) reported daily smoking. The highestrate of current smokers is at grade 12 with 24% of the studentsindicating that they had smoked in the past 30 days and thelowest was at grade 7 with a 10% rate.
Figure 24Percentage of Students Who Ever Smoked, Smoked in Past 30Days, or Smoked Daily, by Grade
70
60
4 5 6 7 8 9 10 11 12
Grade
6i53

Use of AODs
54
Smokeless Tobacco Grades 7-12
Sixteen percent of 7th-12th graders reported using smokelesstobacco in their lifetime. Of the lifetime smokeless tobaccousers, 22% (about 4% of all students) are current users, halfhaving chewed or snuffed during one or two days in the pastmonth and the other half using from three to nine days. Also,half of the current users reported chewing or snuffing once perday when using in the past month and the other half two to fivetimes per day.
Grades 4-6
About one fifth (19%) of the elementary school students havedrunk alcohol without their parents' knowledge and about onetenth (9%) have been drunk in their lifetime. Six percent havesniffed substances like glue to get high and 4% have smokedmarijuana. Students in higher grades were more likely to useAODs that those in lower grades. Because of the sensitive natureof the AOD items, elementary school students were not askedabout current use, only lifetime use.
Grades 7-12
Across the secondary grade levels, more than 7 of every 10students (71%) reported drinking alcohol in their lifetime and58% drank alcohol in the past six months. About one quarter ofthe students have had five or more drinks during one occasion inthe two weeks prior to the survey. Thirty-seven percent of thestudents have used illicit substances and 29% have done so in thepast six months. When marijuana and hashish were excluded,other illicit drug lifetime use at ross the grade levels was 23%with 17% of the students using in the past six months.
Beer, wine, liquor, and marijuana were the only AODs usedby more than 10% of secondary school students at any gradelevel during the past six months (see Figure 25). As withelementary students, the trend is for more use by students inhigher grades. For example, 27% of the students in grade 7drank beer in the last six months and 60% of the students ingrade 12 did the same. However, there was one exception. Theexception is the use of inhalants, which is more prevalent inlower grades. This is not surprising because inhalants are readilyavailable and accessible to younger students. Metabene is a
61

nonexistent drug used in the survey both to help identify studentswho are inappropriately responding to the ATOD items and todetermine the reliability of the responses.
Figure 25Percentage of Students Using AODs in the Past Six Months,Grades 7-12
Metabene
Barbiturates
Heroin
Sedatives
Steroids
Tranquilizes
Pa'
Narcotics
Cocaine
inhalants
Hallucinogens
Hashish
Amphetamines
LSD
Marijuana
Liquor
Wi
Box
0 10 20 30 40 50 60
Percentage of Students
70
Grade
7
MI a
Q9
0 to
0 it
12
To compare current AOD use levels with the nationalestimates provided in the Monitoring the Future (MTF) Survey,AOD use levels were aggregated into three composite indices ofAOD use: all alcohol, all cannabis (marijuana and hashish), andall other illicit drugs. The lifetime and past six-month use ratesall increase by grade level (see Figure 26). In comparison to thenational AOD use rates, California secondary school students
6555

Comparisons WithOther Surveys
56
generally drink less alcoholic beverages, use more cannabis(marijuana and hashish), and are about equivalent in use of otherillicit drugs. For example, 87% of the students in grade 12nationwide have drunk alcohol in their lifetime compared to 84%of California students in grade 12. The national annual use ratefor high school seniors was 76% and the California six-monthuse rate was 72%. Although these rates are not directlycomparable, we have found from other surveys that the twoestimates are generally consistent.
Figure 26Percentage of Students Using Alcohol, Cannabis (Marijuana andHashish), and All Other Illicit Drugs in Their Lifetime and in thePast Six Months, Grades 7-12
a0
tr
90
80
70
60
50 .
40 _._....--_..--
30 ...-..... _. - .:4:_, C°
20 1r
10
1 1
7 3 9 10
Grade
Alcohol Ever
---0 Alcohol Last SixMonths
--- -- Cannabis Ever
--- 4 - -- Cannabis Last SixMonths
Other Illicit DrugsEver
far Other Illicit DrugsLast Six Months
This section provides comparisons of the 1992-93 DATE resultswith the 1993-1994 California Student Substance Use Survey(CSS) and the 1993 National High School Senior Survey (NSS),as well as to the findings of these surveys in 1991-92. DATE-CSS comparisons can be made for grades 7, 9, and 11, whileDATE-NSS comparisons can be made for grades 8, 10, and 12.Comparison with the CSS is facilitated by the use of manyidentical items in the two surveys, but additional challenges dueto differences in question wording, behaviors assessed, and timeperiods do arise when comparing DATE and the NSS. For
66

example, the NSS asks about drug use over the previous year (12months) while DATE and the CSS measure use in the prior 6months. However, it is doubtful that there is a significantdifference in adolescent recall of drug use between the past 6 andpast 12 months. Furthermore, despite concerns of this nature,comparisons are still informative, and overall trends inprevalence rates can be identified.
Comparisons: Cigarette Use
Table 9 and Figures 27 and 28 present comparative data oncigarette smoking. Across all three surveys, there is generalagreement that, by the 12th grade, nearly two thirds of studentshave tried cigarette smoking. Some use in their lifetime wasreported by 53% of CSS 11th graders, 64% of DATE 11thgraders, 67% of DATE 12th graders, and 62% of NSS 12thgraders. Lifetime smoking rates consistently rise across thegrade levels in all three surveys (see Figure 27). The CSS ratesare the lowest for all grades, being between 10 points and 15points below the DATE/NSS levels at all grade levels. TheDATE and NSS results are nearly identical, except at the 8th-grade level, where DATE is 5% higher.
Table 9Comparison of Results for Cigarette Use Among 1 1 th and 12thGraders, DATE, CSS, and NSS, 1991-93 (Percentage of StudentsWho Have Smoked)
Cigarette use
CSS 11th DATE 11th
Percentage1991-92 1993-94
Percentage1991-92 1992-93
Lifetime 49.1 52.8 46.8 62.2Past month 28.5 29.1 22.1 23.4Daily 9.7 12.3 5.2 5.1
DATE 12th NSS 12th
Percentage PercentageCigarette use 1991-92 1992-93 1991 1992 1993
Lifetime 51.8 63.2 63.1 61.8 61.9Past month 24.4 24.0 28.3 27.8 29.9Daily 5.8 7.2 18.5 17.2 19.0
57

58
Figure 27Lifetime Use of Cigarettes by Grade Level (i.e., "Have you eversmoked a cigarette?")
70
60
50
40
30
20
10
6 7 8 9 10 11 12
Grade Level
z ---DATE (1992-93)
--National HS SeniorSurvey (1993)
--- California StudentSurvey (1993-94)
Figure 28Current Cigarette Smoking by Grade Level (Any Smoking Withinthe Last 30 Days)
35
30
25
20
15
10
5
...... ..1...
. ,..'""i-
..
0
6 7 8 9 10 11 12
Grade Level
DATE (1992-93)
National HSSenior Survey(1993)
-Z-- - CaliforniaStudent Survey(1993-94)
Measures of current smoking (past month) offer asomewhat contradictory view, with DATE students reporting thelowest rates at all grade levels (see Figure 28). NSS rates aresimilar to the DATE findings, averaging less than 5 pointshigher, while the CSS results are markedly higher, ranging from5 points higher at both the 7th and 11th grade levels to 13 pointshigher at the 9th grade level. Indicators of daily smokingprovide a similar picture, with only 7% of DATE 12th gradersreporting smoking every day, compared to 12% of CSS studentsand 19% of NSS students.
66

The trends between 1991 and 1993 are somewhat muddled,as the CSS data indicate a slight rise in lifetime prevalence (49%to 53%), while the DATE results indicate a much more dramaticincrease in only a single-year period (47% to 64% for llthgraders, and 52% to 67% for 12th graders). In contrast, the NSSrates remained steady at 62% in 1992 and 1993, which is 1%lower than the 1991 rate. Thus, it appears that Californiastudents are reporting more lifetime use, countering a nationaltrend. However, current smoking rates appear to have remainedstable in California, whereas they increased from 28% to 30%nationally. The difference between lifetime and current use canbe taken as a gauge of the noncontinuation rate, that is, theproportion of youth who have tried a drug but do not continue itsuse. Both CSS and DATE surveys show noncontinuation rateshave been increasing between 1991 and 1993, from 41% to 44%among CSS 11th. graders, 51% to 63% among DATE llthgraders, and from 53% to 63% among DATE 12th graders. Incontrast, the NSS noncontinuation rate declined from 55% to51%. This suggests that, although experimentation rates mayhave increased in California, we are making relative progress inpreventing youth who ever experiment with trying cigarettesfrom continuing that practice.
In Table 10, AOD prevalence rates for the past two DATEsurveys (1991-92 and 1992-93) of students in grades 11 and 12are compared with results from the two most recent (1991-92 and1993-94) CSS surveys of students in grades 11 and the past three(1991-1993, inclusive) NSS surveys of students in grade 12.
6 59

Tab
le 1
0C
ompa
riso
n of
Res
ults
, llth
and
12t
h G
rade
rs, 1
991-
93 D
AT
E, C
SS, a
nd N
SS (
by p
erce
ntag
e)
CSS
11t
hD
AT
E 1
1th
DA
TE
12t
hN
SS 1
2th
Subs
tanc
e us
e19
9119
9319
91-2
1992
-319
91-2
1992
-319
9119
9219
9:L
ifet
ime
Alc
ohol
84.9
a79
.8a
86.3
84.3
88.3
87.4
88.0
87.5
87.0
Bee
n dr
unk
57.3
61.8
63.8
65.5
70.1
69.8
65.4
63.4
62.5
Mar
ijuan
a-
44.2
-30
.4-
42.6
36.7
32.6
35.3
Inha
lant
s-
18.9
-12
.6-
8.8
17.6
16.6
17.4
Coc
aine
/cra
ck8.
4-
9.5
-9.
67.
86.
16.
1A
mph
etam
ine/
stim
ulan
ts-
13.3
-13
.2-
11.1
15.4
13.9
15.1
Psyc
hede
lics
-13
.614
.613
.19.
69.
210
.9A
ny il
licit
drug
35.3
46.6
37.8
37.8
47.7
42.6
44.1
40.7
42.9
Bee
n in
toxi
cate
d31
.139
.636
.237
.844
.639
.2-
--
Cra
ck4.
58.
6-
--
-3.
12.
62.
fPa
st 6
(C
SS)/
12 (
NSS
) m
onth
sA
lcoh
ol76
.574
.369
.667
.371
.872
.377
.776
.876
.0A
ny il
licit
drug
37.7
46.5
33.3
36.2
38.3
37.5
29.4
27.1
31.0
Mar
ijuan
a29
.440
.129
.631
.734
.231
.923
.921
.926
.(O
ther
illic
it dr
ugsb
23.2
26.6
18.1
21.4
22.8
18.0
16.2
14.9
17.1
Coc
aine
6.6
4.9
3.9
4.8
4.4
3.4
3.5
3.1
3.2
Am
phet
amin
e/st
imul
ant
6.8
10.1
6.1
8.0
7.8
5.5
8.2
7.1
8.4
Bar
bitu
rate
s2.
11.
70.
40.
80.
50.
83.
42.
83.
4In
hala
nts
10.3
13.1
3.7
6.2
5.5
2.7
6.6
6.2
7.(
LSD
8.1
12.2
7.9
7.4
9.4
7.4
5.2
5.6
6.E
Past
mon
thA
lcoh
ol-
50.1
--
--
54.0
51.3
51.(
Past
two
wee
ksH
eavy
(5-
i-dr
inks
in a
row
)26
.021
.628
.232
.430
.631
.329
.827
.927
..!
abas
ed o
n da
ta p
rovi
ded
for
age
of in
itiat
ion
thro
ugh
age
16.
excl
udin
g m
ariju
ana/
hash
ish.

Comparisons: Alcohol Use
Alcohol use rates show a great deal of similarity among the threesurveys in the 11th and 12th grades, but significant differencesare seen in the results from the earlier grades (see Table 10 andFigure 29). Fewer (>10 percentage points lower) DATE studentsreport using alcohol in the past six months than CSS students atboth the 7th and 9th grades, yet the use rates are nearly identicalby the 11th grade. The results from the NSS closely parallel theDATE results, with a slight gap (of 8%) between the two surveysat the 10th-grade level. All three surveys demonstrate aconsistent trend toward increased use with age, which appears toaverage slightly below 50% upon entry into junior high, rising tothree quarters of the students reporting using alcohol by the endof their time in high school.
Figure 29Use of Alcohol in Last 6 (DATE, CSS) or 12 (NSS) Months
6 7 8 9 10 11 12
Grade Level
DATE (1992-93)
-National HSSenior Survey(1993)
----X-- CaliforniaStudent Survey(1993-94)
Lifetime use rates for all three surveys are even moresimilar, with no large differences (more than 5 percentage points)between the surveys at any measurement point. As would beexpected, these are slightly higher than the more recent 6- and12-month rates, starting at about 55% in the 7th grade and risingsteadily to around 85% in the 12th grade. Binge or heavydrinking (defined as five or more drinks in a row within the pasttwo weeks or month) was reported at a higher rate by DATEstudents in 11th and 12th grades (32% and 31%) than either CS S
61

students in 11th grade (22%) or NSS seniors (28%). Similardifferences were found for lifetime drunkenness.
All three surveys show that 6- and 12-month use rates andlifetime prevalence rates remained stable or slightly declinedover the period 1991-93. In contrast, there was little consistencyin measures of level of use. The DATE survey found a slightincrease in heavy drinking and lifetime drunkenness amongstudents in 11th grade but stable rates among those in 12th grade.The CSS reported a decline in heavy drinking but a slight rise inlifetime drunkenness. NSS rates for both declined.
Comparisons: Other Drug Use
Survey differences were greater for use of marijuana and otherillicit drugs than for alcohol. DATE students fall in between theother two surveys in 6- and 12-month rates of marijuana use,with CSS students reporting the most use and NSS studentsreporting the least (see Figure 30). The CSS results indicate adramatic rise in use rates as students get older, starting from alow of around 10% in the 7th grade and increasing to 40% by the11th grade. In contrast to this pattern, both the DATE and NSSresults indicate a more gradual rise, topping out at around 30% inthe 12th grade. Lifetime use of marijuana also shows the samepattern of results, with the CSS finding that 4 4% of students in11th grade report having used marijuana, while the DATE surveyfound that 30% of students in 11th grade and 43% of students in12th grade report using it, and the NSS found that 35% ofstudents in 12th grade report us'ng it.
Figure 30Use of Marijuana /Hashish in Last 6 (DATE, CSS) or 12 (NSS)Months
40 ..X35 .30
25 .20
15
10
5
62
8 9 10 11 12
Grade Level
6DATE (1992-93)
-- -National HSSenior Survey(1993)
-- I -- CaliforniaStudent Survey(1993-94)

Figure 31 shows a comparison of the rates of recent use ofother illicit drugs across the three surveys. Data for the NSS areavailable only for students in grade 12, and this rate is nearlyidentical to the DATE students in grade 12 (17.11% vs. 18%,respectively). The comparison between DATE and CSS shows avery similar pattern to the marijuana rates, with the CSS findingsranging from 5% to 10% higher than the DATE findings. Thegreatest difference is in the reports of 9th graders (CSS, 30%;DATE, 16%), and the smallest discrepancy was for the 11thgraders (CSS, 27%; DATE, 21%). Lifetime rates, however,show a slightly different pattern, with all three surveys indicatingthat around 45% of all high school seniors have tried an illicitsubstance (see Table 10).
Figure 31Use of Illicit Drugs (Except Marijuana and Hashish) in Last 6(DATE, CSS) or 12 (NSS) Months
6 7 8 9 10 11 12
Grade Level
e --DATE (1992-93)
--National HSSenior Survey(1993)
-x-- - CaliforniaStudent Survey(1993-94)
Between 1991-1993, CSS results indicate a pronouncedincrease in marijuana use among llth-grade students. TheDATE survey indicates only a slight increase in that grade and adecline among 12th-grade students. Among NSS 12th graders,use declined between 1991 and 1992 but then increasedmarkedly to a rate higher than 1991. Thus both CSS and NSSindicate use, whereas DATE results are more mixed.
7363

Effects of theCurrent Program on
Student AttitudesAnd Knowledge
64
Discussion of Findings From the DATE, CSS, and NSSSurveys
The results of the comparative analysis of the DATE ProgramSurvey with the California Student Survey (CSS) and theNational High School Senior Survey (NSS) raise a number ofpoints for consideration. First, it appears that experimentationwith alcohol is nearly universal, with greater than 85% ofstudents in each survey reporting some use during their lifetimeand three quarters reporting use within the past six months. Userates appear to be relatively stable, with only minor deviations ineither direction in any of the most recent surveys. Overall itappears that California has not been participating in the declinesin drinking that have been evident nationally. The DATE samplereported lower rates of illicit drug use than the CSS and itsestimate may be more in line with the national results from theNSS. It does appear that use of marijuana or hashish inCalifornia is a more significant problem than in the rest of thecountry, with use rates roughly 5 points higher than national ratesat each grade level surveyed.
Lifetime reports of cigarette use by DATE students arehigher than either the CSS or the NSS. However, current anddaily smoking rates are lower than those reported in either of theother surveys. It would appear that this major difference is dueto the significant increase in smoking from last year to this yearin the DATE responses. This change did not occur in either ofthe other surveys and appears to be something of an anomaly inthe overall context.
Grades 4-6
The school programs seemed to have had some effect onelementary school students' attitudes toward and knowledge oftobacco use. At least four of every five elementary schoolstudents learned in school to say no to offers of cigarettes fromfriends (80%) and that smoking is bad for one's health (see Table11). Sixty percent of the students also learned to talk with theirparents about smoking. An important statistic is that almost onethird of the students (32%) reported that they were less interestedin smoking as a result of their prevention education.

Table 11Percentage of Students Identifying Changes in Tobacco-RelatedAttitudes and Knowledge Due to the DATE Program, Grades 4-6
Attitude and knowledge items
Percentage
Grade Grade Grade4 5 6
Learned how to say no to cigarettesLearned smoking is bad for
my healthLearned how to talk to my parents
about smoking
78 82 8383 87 83
62 58 46
What I learned changed my feelingsabout smoking:
less interested 30 32 36more interested 5 5 5
Similarly, school programs seem to have had some effecton elementary school students' attitudes toward and knowledgeof AOD use. As a result of their experience in DATE preventionprograms in the current school year, at least three fourths of thestudents felt that: they did not want to use AODs; it was okay tosay no to offers from friends of AODs; and AOD use is bad forone's health (see Table 12). Similar to their attitudes toward andknowledge of tobacco, 60% of the students learned to talk withtheir parents about AODs and 36% were less interested in tryingAODs in the future.
(U
65

Table 12Percentage of Students Identifying Changes in AOD-RelatedAttitudes and Knowledge Due to the DATE Program, Grades 4-6
Percentage
Attitude and knowledge items Grade Grade4 5
Grade6
Made me not want to use AODs 72 78 75Helped me learn to say no to AOD use 77 82 79Learned that AOD use is bad for health 84 88 85Learned to talk to parents about AODs 63 63 50What I learned changed my feelings
about AOD use:less interested 34. 35 41more interested 5 5 6
Grades 7-12
Secondary school students identified four positive effectsregarding tobacco use as a result of their tobacco preventioneducation. On the average it helped 12% resist peer pressure touse tobacco, 16% became less interested in using tobacco, 23%learned to avoid or reduce tobacco use, and 32% learned aboutits harmfulness (see Table 13). Very few learned to talk to theirparents about tobacco or seek treatment for tobacco use.Considering the rates of current and daily use (see Figure 24), themajority of current and daily cigarette smokers are not learninghow to seek out treatment for stopping tobacco use.
7666

Table 13Percentage of Students Identifying Changes in Tobacco-RelatedAttitudes, Knowledge, and Intentions Due to the DATE Program,Grades 7-12
Attitude, knowledge, and intention items
Percentage
Grade7
Grade Grade8 9
Learned how to avoid/reduce tobacco use 31 27 20Learned how to resist pressure to use tobacco 12 15 12Learned how to talk to parents about tobacco 2 2 2Learned about the health risks of tobacco 31 33 31Learned how to seek treatment for tobacco use 1 1 0Changed my interest in using tobacco:
less interested 23 20 16more interested 2 1 2
Attitude, knowledge, and intention items
Percentage
Grade10
Grade Grade11 12
Learned how to avoid/reduce tobacco use 22 19 20Learned how to resist pressure to use tobacco 11 9 11Learned how to talk to parents about tobacco 1 1 1
Learned about the health risks of tobacco 32 32 36Learned how to seek treatment for tobacco use 1 1 0Changed my interest in using tobacco:
less interested 18 11 11more interested 2 2 1
Positive effects similar to those reported for tobacco wereidentified by students as AOD-related outcomes resulting fromtheir AOD prevention education. On the average, 13% werehelped in resisting peer pressure to use AODs, 17% became lessinterested in using marijuana and 22% were less interested inusing alcohol, 24% learned about AODs' harmfulness, and 26%learned to avoid AODs or reduce AOD use (see Table 14). Also,strategies for talking with parents about AOD use and seekingtreatment were generally not learned in their prevention programexperience. Again, as with tobacco, there is a great disparitybetween the number of students using AODs and the few wholearned to seek treatment.
67

68
Table 14Percentage of Students Identifying Changes in AOD-RelatedKnowledge, Attitudes, and Intentions Due to the DATE Program,Grades 7-12
Attitude, knowledge, and intention items
Percentage
Grade7
Grade8
Grade9
Learned to avoid or reduce using AODs 32 30 25Helped me resist peer pressure to use AODs 15 17 13Learned harmfulness of AODs 25 24 22Helped me seek treatment/counseling for AOD use 3 2 1
Helped me talk with my parents about AODs 6 4 3
Made me wani to try AODs 2 3 4Changed my interest in trying alcohol:
less interested 26 26 24more interested 5 4 3
Changed my interest in trying marijuana:less interested 22 23 18more interested 4 3 3
Learned to avoid or reduce using AODs 28 17 24Helped me resist peer pressure to use AODs 13 11 14Learned harmfulness of AODs 29 24 22Helped me seek treatment/counseling for AOD use 2 1 1
Helped me talk with my parents about AODs 3 3 4Made me want to try AODs 3 2 2Changed my interest in trying alcohol:
less interested 21 18 20more interested 4 3 3
Changed my interest in trying marijuana:less interested 17 12 13more interested 4 4 3
There appears to be a need to emphasize strategies on howto seek treatment in prevention programs targeting secondaryschool students. This is particularly important given that 24% ofall secondary school students have had five drinks or more in arow on at least one occasion in the two weeks preceding thesurvey. Part of the strategy will involve dealing with denialbecause it needs to be addressed in encouraging studentsubstance abusers to seek treatment. Denial is apparent becauseonly 3% reported having or feeling the need to have treatment orcounseling for their AOD use.
7
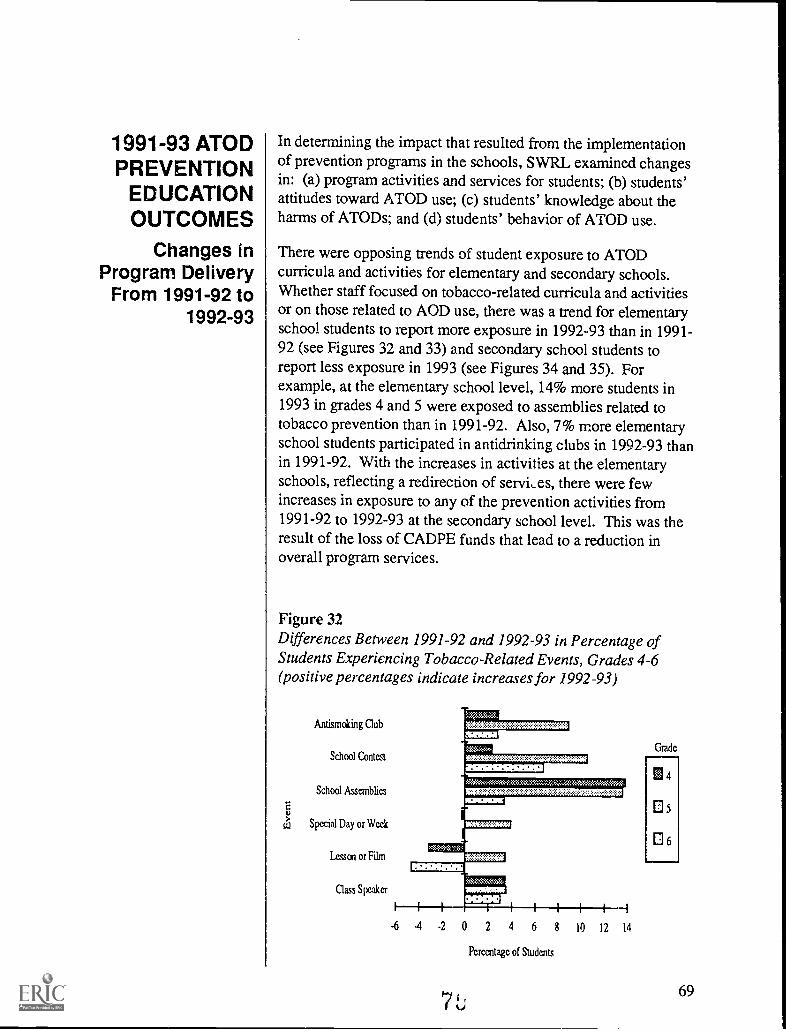
1991-93 ATODPREVENTION
EDUCATIONOUTCOMES
Changes inProgram Delivery
From 1991-92 to1992-93
In determining the impact that resulted from the implementationof prevention programs in the schools, SWRL examined changesin: (a) program activities and services for students; (b) students'attitudes toward ATOD use; (c) students' knowledge about theharms of ATODs; and (d) students' behavior of ATOD use.
There were opposing trends of student exposure to ATODcurricula and activities for elementary and secondary schools.Whether staff focused on tobacco-related curricula and activitiesor on those related to AOD use, there was a trend for elementaryschool students to report more exposure in 1992-93 than in 1991-92 (see Figures 32 and 33) and secondary school students toreport less exposure in 1993 (see Figures 34 and 35). Forexample, at the elementary school level, 14% more students in1993 in grades 4 and 5 were exposed to assemblies related totobacco prevention than in 1991-92. Also, 7% more elementaryschool students participated in antidrinking clubs in 1992-93 thanin 1991-92. With the increases in activities at the elementaryschools, reflecting a redirection of services, there were fewincreases in exposure to any of the prevention activities from1991-92 to 1992-93 at the secondary school level. This was theresult of the loss of CADPE funds that lead to a reduction inoverall program services.
Figure 32Differences Between 1991-92 and 1992-93 in Percentage ofStudents Experiencing Tobacco-Related Events, Grades 4-6(positive percentages indicate increases for 1992 -93)
Antismoking Club
School Contest
School Assemblies
0) Special Day or Week
Lessen or Film
Class Speaker
IRIERIZINIMER. 44. V, %%%%%
-6 -4 -2 0 2 4 6 8 10 12 14
7
Percentage of Students
Grade
4
05
El 6
69

Figure 33Differences Between 1991-92 and 1992-93 in Percentage ofStudents Experiencing AOD-Related Events, Grades 4-6(positive percentages indicate increases for 1992-93)
Antidrinking or
Antidrug Club
School Contest
Assembly or Rally
Special Day or Week
Lesson or Film
Class Speaker
-4 -2 0 2 4 6 8 10
Percentage of Students
12
Figure 34Difference Between 1991-92 and 1992-93 in Percentage ofStudents Experiencing Tobacco-Related Events, Grades 7-12(positive percentages indicate increases for 1992-93)
Grade
if 7
®8
0 9
0 10
D II
12
70
School Assemblies
Class Speaker
Esuy/Poster/Homework
Health Class Lesson
-10 -8 -6 -4 -2 0
Percentage of Students
OV'
2 4
Grade
11-171
05
06

Changes inStudents' Attitudes
Toward andKnowledge ofTobacco From
1991-92 to 1992-93
Figure 35Difference Between 1991-92 and 1992-93 in Percentage ofStudents Experiencing AOD-Related Events, Grades 7-12(Positive percentages indicate increases for 1992-93)
Crack
7
El
0 9
io
D
® 12
WPM.ww*Xis
Sober Dance
Lesson in Regular Class
Essay/Postcriliomewoiic
Lesson on Life Skills
.1110000:59%
OCONC0630245nesemoodsagia.
Class Speaker
Lesson in Health Class
School Assemblies
Red Ribbot -k
25 -20 -15 -10 -5 0 5 10
Percentage of Students
Generally, the attitudes toward tobacco and the knowledge abouttobacco remained constant from 1991-92 to 1992-93. Althoughthe data from 1991-92 to 1992-93 are not directly comparablebecause of a slight change in the survey, students generallybelieved that daily use of cigarettes is harmful, regardless of thenumber of cigarettes smoked daily and how many years peoplesmoked. Less than 4% of the students believed that dailysmoking causes no harm. Most of the students understood thatcigarette smoke contains carbon monoxide and affects a person'sheart. However, the majority of the students (a little over half)still have the incorrect impression that most students their agesmoke cigarettes, despite research findings that state this is nottrue.
81 71

Changes inStudents' Attitudes
Toward andKnowledge of AODs
From 1991-92 to1992-93
Changes inStudents'
Substance UseFrom 1991-92 to
1992-93
72
Generally, the attitudes toward AODs and the knowledge aboutAODs remained constant from 1991-92 to 1992-93. During both1991-92 and 1992-93, most students believed that frequentdrinking of alcohol and use of marijuana were harmful. Only avery small percentage (all less than 7%) believed that frequentuse of these substances caused no harm. The majority of studentsknew about the effects of drinking alcohol. At least 80% of thestudents knew that: (a) alcohol is the most widely abused drug;(b) the effects that drinking has on a pregnant woman's unbornbaby; and (c) alcohol is the most common cause of fatal caraccidents. In addition, about half of the students understood thata bottle of beer and a glass of wine contain about the sameamount of alcohol. In addition, 87% of the students knew that aperson could become addicted to anabolic steroids.
Changes in Tobacco Use
Generally, tobacco use for elementary and secondary schoolstudents remained constant from 1991-92 to 1992-93. In 1991-92, 12% of the elementary school students reported smokingduring their lifetime; in 1993, 13% reported similar behavior.This lack of difference also was true for current smoking (in thepast 30 days) rates: 14% in 1991-92 and 13% in 1992-93. Ratesof current and daily smoking for secondary school students forthe two years nearly match (see Figure 36). For example, atgrades 8, 10, and 12, the rates of smoking in the past 30 days in1991-92 were 13%, 21%, and 24%. In 1992-93, the rates forthese same grade levels were 15%, 21%, and 24%. There wereno significant differences for either rate at of the gradelevels.
5

Figure 36Percentage of Students Who Smoked Daily or Smoked in Past 30Days, by Grade, 1991-92 to 1992-93
is
Grade
Changes in AOD Use
Srro-'.ed Daily (93)
- Smoked Daily (92)
-- Smoked in Past 30
Days (93)
-0 Smoked in Past 30Days (92)
AOD use between 1991-92 and 1992-93 remained constant forthe most part. Lifetime use rates across the elementary grades in1991-92 were 20%, 4%, and 6% for alcohol consumption(without parental knowledge), smoking marijuana, and sniffingglue, respectively. In 1992-93, the rates for the elementarygrades were 19%, 4%, and 6%. Rates of AOD use for secondaryschool students in the past six months, as summarized by thealcohol (beer, wine, and liquor), cannabis (marijuana andhashish), and other illicit drug indices, were virtually identical(see Figure 37). The one exception is in the percentage ofstudents using alcohol heavily, that is, consuming five or moredrinks in a row on at least one occasion in the two weekspreceding the survey. This rate increased from 19% to 24%.
8,; 73

WHAT WERETHE EFFECTS
OF THE LOSS OFCADPE FUNDS
AND THETHREAT OF THE
LOSS OF TUPEFUNDS ON ATOD
PREVENTIONEDUCATION?
74
Figure 37Percentage of Students Using Alcohol, Cannabis (Marijuana andHashish), and All Other Illicit Drugs in the Past Six Months in1991-92 and 1992-93, Grades 7-12
afi
80
70
60
50
40
30
20
10
0
7 8 9 10
Grade
11 12
-' Aloohol Last Six
Months (92)
0 Alcohol Last SixMonths (93)
- - Cannabis Last SixMonths (92)
0 Cannabis Last SixMonths (93)
- Other Illicit Drugs
Last Six Months(92)
Other Illicit DrugsLast Six Months(93)
In 1992, the Office of Criminal Justice Planning (OCJP)withdrew its funding support (CADPE) for school-basedprevention education. These funds were aimed at ATODprevention for California's elementary and middle schoolstudents. During this same time, the funds available from TUPEwere threatened. During the budget process in July 1992, theCalifornia governor's budget reflected that no monies would beallocated to any educational programs. Monies for educationalprograms were not approved until the end of September, whenthe governor's budget was passed. At that time, funds wererequested for TUPE, reflecting an 8% decrease from the previousyear's allocation. Thus, there was a three-month delay in TUPEfunds, a delay that occurred during a critical time of planning andhiring staff for the 1992-93 DATE programs. Because it wasanticipated that this withdrawal of CADPE funds and the threatof losing TUPE funds would have a significant impact on someDATE programs, DATE staff (primarily coordinators) wereasked to complete a survey about the possible effects that thesefunding changes for ATOD prevention and intervention serviceswould have on the DATE programs. The effects on California's
81

The Effect of theLoss of CADPE
Funds onPreventionEducation
DATE programs are presented below, both at the district andschool level.
In general, 88% of the districts reported they received CADPEfunds for 1991-92, the previous school year, while 9% reportednot receiving CADPE funds for that year. Of the schools inCADPE-recipient districts, 58% reported receiving CADPEfunds in the 1991-92 school year, while 30% reported notreceiving CADPE funds that year. The remaining district's (3%)and schools (12%) did not indicate whether they were CADPErecipients. Seventy-six percent of the districts and 84% of theschools that received CADPE funds in the 1991-92 school yearrated the effect of the loss of CADPE on the DATE Program asvery negative or somewhat negative.
Overall Effect of the Loss of CADPE Funds on DATE
With less money available to fund the DATE Program, 70% ofthe CADPE-recipient districts reported setbacks in carryingthrough the DATE Program as planned. Sixty-four percent ofthese districts reduced portions of their DATE Program and afew districts delayed (6%) or canceled (4%) implementation ofnew ones.
Sixty-one percent of CADPE-recipient schools reported animpact on their DATE Program compared to 31%.of non-CADPE-recipient schools. The reduction of some portions of theDATE Program was the most common action taken by bothCADPE-recipient schools (58%) and non-CADPE-recipientschools (27%), followed by canceling or delaying theimplementation of some new portions of the DATE Program.
Effect of the Loss of CADPE Funds on DATE Services
Most commonly, CADPE-recipient districts reduced programsconcerned with alternative activities (26%), followed by staff in-services (12%) and counseling services for students (19%).
Similarly, most of the reduced or canceled programs inCADPE-recipient schools and non-CADPE-recipient schoolswere related to alternative activities, counseling services tostudents, and staff in-services. CADPE, in general, funded thearea of direct services for students in elementary and middleschools. Its loss lead to the reduction of these services asdepicted in Figure 38.
85 75

76
Figure 38Cancellation or Reduction of Services Due to CADPE Loss inCADPE-Recipient and Non-CADPE-Recipient Schools
8
Assemblies
Parent Educational
Programs
Curricuhim
In-Services
Counseling
Alternative Activities
O Non-CADPE Schools
CADPE Schools
0 S 10
Percentage of Schools
15
Effect of the Loss of CADPE Funds on DATE Staff
20
Thirty-seven percent of the CADPE-recipient districts reportedthat the loss of CADPE funds negatively impacted their staff.Specifically, 29% of the districts reported a reduction in theirDATE staff; most of those laid off were counselors followed bylaw enforcement personnel. The relatively high reduction ofcounselors was because their salaries were largely paid for byCADPE. Nine percent of the districts reduced the time spent bytheir staff on DATE-related activities, while others (6%) reducedstaff-released time.
Similarly, in both CADPE-recipient schools and non-CADPE-recipient schools, the loss of CADPE affected fundingfor school personnel working on the DATE Program. Twenty-three percent of CADPE-recipient schools and 8% of non-CADPE-recipient schools reported a negative impact on schoolstaff, especially regarding a reduction in the number and the timespent by them on the DATE Program (see Figure 39).
86

Figure 39Effect of Loss of CADPE Funds on DATE Staff in CADPE-Recipient and Non-CADPE-Recipient Schools
Inability To Hire Staff
0.0
Reduction in Teachers
Being Trained
Reduction in Staff
Being Trained
Reduction in Released
Time
Reduction in Staff
Hours
Reduction in Staff
Nan- CADPE Schools
CADPE Schools
0 2 4 6 8 10 12 14
Percentage of Schools
Effect of the Loss of CADPE Funds on Instructional/Noninstructional DATE Materials
Instructional and noninstructional materials (e.g., books forcurriculum and audiovisual equipment), which are essential tothe DATE Program, also were impacted by the loss of CADPEfunds. Sixteen percent of the districts receiving CADPE fundsreduced the amount of instructional/noninstructional materialsused, while others (10%) were unable to purchase such materials.
Twenty-five percent of CADPE-recipient schools and 10%of non-CADPE-recipient schools reported a similar impact oninstructional/noninstructional DATE materials. Most commonly,schools had to reduce the amount of materials used for the DATEProgram. Some CADPE-recipient schools were unable topurchase DATE materials, and others used previously ownedmaterials.
8 "i 77

Response to the Loss Of CADPE Funds
In spite of the loss of CADPE funds, districts tried to continueimplementing the DATE Program to the best of their capabilities.Six percent of the CADPE-recipient districts coped with this lossby replanning and redesigning the DATE Program to focus on amore limited scope. Some CADPE-recipient districts (10%)explored other funding sources through submitting grantproposals to the state as well as seeking financial support fromthe community. Almost one quarter of the districts reported theuse of other available funds, such as general funds and cityfunds, and 16% reported the use of other DATE funds (i.e.,TUPE and DFSC).
School and district responses to the loss of CADPE fundswere similar. Twenty-five percent of CADPE-recipient schoolsand 6% of non-CADPE-recipient schools depended on additionalfunds from school-site funds, general funds, and city funds,while 13% of CADPE-recipient schools and 12% of nonrecipientschools used other DATE funds (TUPE and/or DFSC). Fivvpercent of CADPE-recipient schools reported seeking othersupplemental funds from various sources such as foundations,corporate sponsors, and local service clubs (see Figure 40).
Figure 40Obtaining Other Funds in Response to the Loss of CADPE Fundsin CADPE-Recipient and Nonrecipient Schools
Sought Other SourcesOf Funds
Used Other DATEFunds
Used Other Sources ofFunds
78
Non-CADPE Schools
0 CADPE Schools
0 5 10 15
Percentage of Schools
20

The Effect of theThreat of LosingTUPE Funds on
PreventionEducation
Overall Effect of the Threat of Losing TUPE Funds on DATE
The threat of losing TUPE funds hindered districts and schoolsfrom making long-term plans and decisions regarding the DATEProgram. Many districts and schools did not integrate programsfor fear they would not be funded consistently. As a result of thedelay in receiving TUPE money in 1992-93, the DATE Programas a whole was impacted negatively. Thirty-one percent ofdistricts and 29% of schools responding to the survey reportedsuch an impact. Districts and schools had to reduce someportions of their existing DATE Program, and delay, and/orcancel implementing new ones (see Figure 41).
Figure 41Effects of the Threat of Losing TUPE Funds on Total DATEProgram
Not Implementing New
DATE Programs
Delay in Implementing
New DATE Programs
Reduction in DATE
Programs
0 School
111 Iattnd
0 5 10 15 20
Percentage of Districts and Schools
Effect of the Threat of Losing TUPE Funds on DATEServices
25
Twenty-one percent of the districts and schools reported areduction in some portions of the DATE Program, especiallythose related to curricula, direct counseling services, and staffdevelopment services (see Figure 42).
8 79

80
Figure 42Cancellation or Reduction of Services Due to the Threat ofLosing TUPE Funds
Alternative Activities
Parent EducationalProgram
In-Services
Counseling
Curriculum
I
0 School
El District
2 4
1
6 8
Percentage of Districts and Schools
Effect of the Threat of Losing TUPE Funds on DATE Staff
10
Five percent of the districts and schools reported reductions in orcancellation of program funding. This impacted staff fundingthat, in turn, affected the DATE staff. Fifteen percent of districtsand 7% of schools reported a negative impact on the DATE staff.These districts and schools reported reductions in the DATEpersonnel and/or the time spent on the DATE Program. Otherdistricts had to delay hiring additional staff needed for theprogram, as shown in Figure 43.
JU

Figure 43Effect of the Threat of Losing TUPE Funds on DATE Staff
Used School Personnel
Reduction in Release =Time
Reduction in Teachers
Being Trained
,§ Delay in Hiring
Personnel
Reduction in Staff
Hours
Reduction in Staff
. .
El school
District
0 2 4 6 8 10
Percentage of Districts and Schools
Effect of the Threat of Losing TUPE Funds on DATEInstructional and Noninstructional Materials
Instructional and noninstructional materials used for the DATEProgram also were impacted by the threat of losing TUPE funds.Eleven percent of districts and 15% of schools changed theirpurchasing habits. Most commonly, they were unable topurchase the necessary instructional and noninstructional DATEmaterials. Others had to delay purchasing such materials or theyhad to reduce the amount of materials used for the DATEProgram (see Figure 44).
91
81

Figure 44Effects of the Threat of Losing TUPE Funds on Instructional andNoninstructional DATE Materials
Use ExistingDATE Materials
Inability ToPurchase Tobacco
MaterialsReduction in
DATE Materials
Delay inPurchasing DATE
MaterialsInability to
Purchase DATEMaterials
VISISIRMS1
=RIMS
MIZZ88811M21$8121121888
Rkill65219551515=5=5:0511115
MISSISMISM22581%8M811:608151MISMMA
0 2 4 6
Percentage of Districts And Schools
Response to the Threat of Losing TUPE Funds
8
El School
121 District
Six percent of the districts and 4% of the schools reportedreductions in the amount of money spent on the DATE Program.Nineteen percent of the districts and 10% of the schoolsresponded to the threat of losing TUPE funds by retaining moneythat could be carried over for the 1993-94 school year. Districts(13%) and schools (16%) also sought other funding sources (e.g.,community, foundations, cities) to support the DATE Program.Fifteen percent of districts and 4% of schools reported the use ofavailable funds, other than DATE funds, to keep the DATEProgram intact (see Figure 45).
Figure 45Obtaining Other Funding in Response to the Threat of LosingTUPE Funds
Used Other DATEFunds
Used Other Sourcesof Funding
Explored OtherSources of Funding
Carried Over Funds
82
110111MI.1. .
.hc
111111111111M1111111111M111M1
0 5 10 15
Percentage of Districts and Schools
82
20
school
ei District
The loss of 1992-93 CADPE funds had a negative impacton CADPE-recipient districts and their corresponding schools. Itwas noted that the DATE Program affected not only CADPE-recipient schools but also non-CADPE-recipient schools. Thefollowing are two possible explanations for this effect on non-CADPE-recipient schools:
1. As a few DATE coordingtors mentioned,money was redirected from high schoolsto elementary and middle schools (that ingeneral received CADPE funds) tomaintain portions of the program. It isquite feasible that this occurred more oftenthan mentioned as a method for copingwith the loss of CADPE funds.
2. With the loss of CADPE funds, many ofthe districts had reductions and/orcancellations of DATE Program funds.Schools' share of funds for DATE wastherefore reduced regardless of whetherthey were CADPE-recipients.
. From discussions with some DATE coordinators, it appearsthat the brunt of the funding changes were not felt during the1992-93 school year. Because of carry-over money and thesupplies already available, schools and districts were able toweather the current school year. Many DATE coordinatorsstated that the funding changes would affect programs moredrastically during the 1993-94 school year when they haddepleted the cushion provided by carry-over money, and newmaterials would be needed.
The DFSC and TUPE investment in DATE produces more than aseven-fold return in support, which consists mainly of schooldistrict general fund expenditures for teachers, aides, andcounselors. It also includes funds, time, and other resourcescontributed by a wide range of stakeholders. The investmentalso has resulted in intensive training of school staff, and broadimplementation of curricula, as well as increased knowledge ofthe harms of ATOD use. These resources are reaching thedesired audience: Schools with higher rates of student ATODuse are spending more for prevention curricula, studentidentification and referral, and positive alternative activities.
93 83

Context of the1992-93 DATE
Program
Student ATOD use rates during the 1992-93 school yearremained constant with those for the previous year. This is truewith the exception of the measure for occasional excessive heavydrinking (drinking five or more drinks during one occasion in thepast two weeks). There was a statistically significant differenceobserved between the two years. In this case, the percentage ofstudents drinking as occasional excessive drinkers was higher in1992-93. All other ATOD rates were stable.
At first glance, stable or constant ATOD use rates mayappear to indicate that the DATE Program is not having apositive impact. However, the context in which this stabilityoccurred makes the lack of change seem an impressiveaccomplishment. This context is composed of economic andenvironmental factors: decreased program funding, widespreadadvertisement and promotion campaigns by the tobacco andalcohol industries, and increasing national trends in ATOD use.
External Context: Economics
In 1993, the tobacco and alcohol industries spent roughly $655million advertising and promoting their products. This estimateis based on the relatively safe assumption that advertisingexpenditures for tobacco and alcohol product campaigns areconsistent from year to year (unless a major new product line isintroduced, which has not occurred since the Joe Camelcampaign and the introduction of wine coolers). According tothe latest figures, the tobacco industry spent $1.2 million eachday or $438 million in 1990 to advei use and promote theirproducts in California (Slade, 1992). The standard nationalestimate of current alcohol industry expenditures foradvertisements and promotions is about $2 billion (G. Hacker,Center for Science in the Public Interest; personalcommunications, December 1993; H. Chinn, California Councilon Alcohol Problems, personal communication, December 1993).More precise estimates can be obtained from advertising industryreports. The top 10 alcoholic beverage media advertisersexpended $1.074 billion in 1992 (Gallo, 1993) on advertisements(e.g., TV, radio, newspapers, billboards), and the alcohol industryspent another $732.6 million in unmeasured promotions(R. Hammond, Alcohol Research Information Service, personalcommunication, December 1993) for a minimum total of about$1.8 billion nationally (a very conservative estimate). Withroughly 12% of the national population, California spent about
94

$217.2 million in 1992 for alcohol advertisements andpromotions. While some may argue that using the full amount ofthe advertising campaigils is a misrepresentation, there areseveral reasons to contend that these expenditures are aimed atadolescents. First, almost all tobacco and alcohol initiationbegins by the age of 18. Second, it has long been concluded thatthese ads and promotions, particularly those for tobacco, areaimed at initiation of use and not at brand switching. Third, withvery few exceptions, these advertisements are accessible byadolescents. And fourth, promotions, which account for about50% of all advertisement and promotion expenditures, by allappearances, are aimed at a very young audience.
In addition to advertisements and promotions, anothermethod was employed by the tobacco industry to induce morecigarette consumption in 1993: price reductions. A price warbegan when the cost of Marlboro cigarettes was reduced byabout 20%. The other major brands quickly followed suit in aneffort to compete with each other and their real nemesis: lessexpensive generic brands that were rapidly gaining market share.It is interesting to note that the first price reduction wasannounced at the same time an increase in federal tax oncigarettes was proposed. The tobacco industry is very aware ofthe effect that increased prices has on consumption, particularlyamong adolescents.
Internal Context: Economics
While the funding for the DATE Program was minimal to beginwith, it was drastically altered by the discontinuation of CADPEfunds by OOP in 1992-93, one of the DATE Program's threeoriginal funding initiatives. To make matters worse, the TUPEmonies were threatened and schools were aware c: that threat,causing disruption to program planning. The schools dideventually receive TUPE funds, reduced by about 25% from theprevious year, but after a substantial delay of approximatelythree months. The loss of CADPE funds and the threat of losingTUPE funds affected DATE programs throughout California inseveral negative ways: (a) programs were redesigned (e.g.,downsized); (b) there were reductions in or cancellations ofdirect services to students (e.g., curricula, counseling, positivealternative activities), the staff needed to deliver these services,as well as in-services and staff development; and (c) schoolswere unable to replenish or buy new program materials. There is
90 85

every indication that schools will be financially strapped evenmore in 1993-94 because the cushion provided by carry-overmoney in 1992-93 no longer exists. The negative impact of thesefunding changes were most noticeable in secondary schools,where students reported receiving less of each service category.
External Context: Social Norms
According to the most recent California Department of HealthServices findings (Pierce, Evans, Farkas, Cavin, Berry, Kramer,Kea ley, Rosbrook, Choi, & Kaplan, in press), the rate of adultcurrent cigarette consumption has leveled off at approximately20%. This reduction in use (from between 30% to 40% prior to1980) is setting a better example for our youth. The reduction inadult usage has been accompanied by a marked increase in thedissemination of information regarding the prevalence ofadolescent and adult smokiig and the effects of both smoking onthe smoker and second-hand smoke on innocent bystanders. Italso has been supplemented by a gamut of controls over tobaccouse and availability that, in combination, indicate that cigaretteconsumption is no longer as socially desirable. These controlsinclude: bans on indoor smoking both in public buildings and atwork sites; more stringent restrictions on tobacco promotions;increased state and (proposed) federal taxation on tobacco; lawsmaking access to vending machines increasingly more difficult;and pressure on retail distributors to ascertain the age of potentialcustomers.
Compared to tobacco control, there has not been as much ofa concerted effort in California to control alcohol consumption.While reductions in total liquor consumption for the populationhave been observed, wine and beer use has been relativelyunaffected. Adults and adolescents are more likely to consumealcohol than not, and this fact is not lost on students. Only onethird of the elementary school students thought that adults do notdrink every day. While three quarters of the secondary schoolstudents thought that frequent alcohol consumption producesmoderate or great harm, substantially more than half haveconsumed alcoholic beverages in the past six months and almostone of every four has drunk five or more drinks in the past twoweeks. Thus, if the perceived norm even closely approximatesreality, alcohol consumption is thought to be common andsomewhat acceptable.
86

External Context: Trends in National Adolescent ATOI, IseAnd Related Attitudes
The 1993 findings of the MTF study revealed across-the-boardstatistically significant increases in ATOD use for students ingrades 8, 10, and 12 (Johnston, Bachman, & O'Malley, 1994).This was accompanied by decreases in student perceptions of thedangers of ATOD use. In comparison, although the DATE-Irogram Survey is not capable of detecting changes as small asthe MTFCalifornia student ATOD use rates were stable. Also,perceived harmfulness of use and knowledge about the dangersof use, two commonly accepted correlates of use, were as high in1993 as they were in 1992.
Internal Context: Program Definition
The DATE Program is similar to the elephant in the traditionalSufi story: The definition differs according to who is touching itand who is descnbing it. This lack of programmatic clarity anddefinition is partly the result of school districts customizing theirprogram to meet local needs and partly due to differences amongschool districts in conceptualizing how the program should beimplemented and in their knowledge of what works effectively inprevention. In this time of ever decreasing resources, schooldistricts need technical assistance regarding program efficacyand how to align the intent of the program with itsimplementation.
Summary
Considering that student ATOD use is increasing nationally andthat the tobacco and alcohol industries are outspendingprevention advocates by roughly 140% (even after adding to theprevention pie, the monies disbursed by the CaliforniaDepartment of Health Services for its media campaign andcommunity prevention efforts), one would expect use to increase.However, student ATOD use has remained stable from last yearto this year. In the face of such well-financed opposition, theDATE Program is holding its own despite an approximate 25%reduction in state TUPE funds from the previous year.
87

Reaching forEffective Prevention
And InterventionStrategies
88
We have learned from research findings that several strategiescan maximize the effectiveness of prevention programs. Thesestrategies include: booster sessions, student assistance programs(SAPs), tobacco cessation programs, and community-basedefforts.
The effects of prevention curricula on ATOD use ratesrapidly decay unless booster sessions are delivered (Bell,Ellickson, & Harrison, 1993; Botvin, Baker, Filazzola, & Botvin,1990). Botvin et al. have incorporated booster sessions into theLife Skills Training series, and the DARE Program currently isassessing the effects of implementing booster sessions forstudents in grades 7 and 8 in a pilot program.
Comprehensive SAPs, which provide individual and groupcounseling through a variety of mechanisms such as core teams,have been shown to be effective in suppressing increases in ratesof ATOD use and improving student self-concept (Pollard &Houle, 1993). High rates of self-referral in these SAPsdemonstrated that student awareness led to increasedparticipation in these services.
The most recent surgeon general's report, PreventingTobacco Use Among Young People (U.S. Department of Healthand Human Services, 1994), acknowledges that, while mostyoung smokers want to quit, recruitment and retention insmoking cessation programs are difficult at best. In addition,success rates are negligible. However, smoking cessation is along-term process. Just as becoming habituated to smoking takestime, learning to quit and developing replacement behaviors takeseveral attempts. Those conducting smoking cessation researchon adults know that relapse is part of the quitting process and thatas smokers make more attempts to quit, they become better atbeing nonsmokers (Cohen, Lichtenstein, Prochaska, Rossi. Gritz,Carr, Orleans, Schoenbach, Biener, Abrams, De Clemente, Curry,Marlatt, Cummings, Emont, Giovino, & Ossip-Klein, 1989).Adolescent smokers need to be taught the same concepts to helpthem become more effective quitters.
The 1994 report of the surgeon general also mentions astrategy that acts synergistically with school-based preventionprograms to augment and prolong their effects. Community-based programs incorporating the involvement of parents, youth-oriented mass media and counter advertising, communityorganizations, or other elements of adolescents' socialenvironment can extend the benefits of school-based preventionprograms through high school.
96

Recommendations These research findings, in conjunction with the results of thecurrent survey, lay the groundwork for the following
recommendations for future DATE efforts.
The DATE Program needs a cleardefinition of the model and itscomponents in order to standardizeand focus prevention and reductionefforts target'ag school youth.
In general, most districts have used DATE Programmoney to establish significant, meaningful programs to helpstudents. The programs generally are consistent with the DATEapplication guidelines. However an amazing variety ofprogram activities was defined as part of the DATE Program.While most were legitimate interpretations of programdirectives, they vary in effectiveness. Programmaticcharacteristics and related effectiveness of the DATE modelshould be identified.
A minimum and more consistent levelof exposure to prevention curriculawould be beneficial in the secondarygrades.
As is evident in the findings, there is an inverserelationship between grade level and the amount of curriculumexposure. That is, the higher the grade level, the less theamount of curricula is provided to the student. Given thatcurrent ATOD use increases across grade levels, the CDEshould examine this delivery issue. Booster sessions to enhancethe elementary grade curricula and more developmentallyappropriate curricula for secondary school students, many ofwhom already use ATODs, need to be implemented.
The DATE model needs to bridge theprevention program to integrate moreintervention-like direct studentservices such as those providedthrough SAPs and smoking cessationprograms.
Significant numbers of school ge youth are current orheavy ATOD users; this is particularly true for high school
91'89

A Final Note
90
students. Most of the efforts currently employed are targetingprevention to stop initiation. The emphasis on prevention iswell-placed for younger students. Unfortunately, older studentsare beyond the prevention stage and require more interventiontypes of services. Currently the schools are not prepared toprovide intervention services. In addition, students would benefitfrom a more assertive effort by schools to make them aware ofthe existing intervention services.
The DATE model needs to integrate aneffective identification and referralsystem for identifying youth that haveATOD-related problem behaviors andrefer them to appropriate services eitherwithin the school or in the community.
We have learned from other research that when effectiveand visible identification and referral systems are in place inschools, students begin to self-refer for services related to ATODuse. In a recent study conducted by SWRL, as many as 50% ofthe youth served were self-referred to the program. This type ofsystem also includes a follow-up mechanism to ensure that youthwere in fact served. This type of system requires a schoolwideorientation of all staff in order to successfully implement thesystem.
In a time of shrinking resources both at the state and schoollevels, it would be wise to rethink the concept and framework forthe DATE model. With fewer resources, one needs to focus onwhere the greatest good can be achieved. Given what we havelearned in the DATE Program Evaluation and from otherresearch, it may be time to target the resources in a different waywith different models. One such model might be to implement ahigh level of prevention curricula in the elementary grades,maintain a lower level of curricula at the middle school level butemphasize prevention through prevention booster sessions, andprovide a reduced level of prevention curricula across all highschool grades integrated with an emphasis on interventionservices. This would maximize the efforts to reach both nonusersand current users at appropriate points in the use continuum.

REFERENCES Bell, R. M., Ellickson, P. L., & Harrison, E. R. (1993). Do drugprevention effects persist into high school? How projectALERT did with ninth graders. Santa Monica, CA: RAND.
Botvin, G. J., Baker, E., Filazzola, A. D., & Botvin, E. M.(1990). A cognitive-behavioral approach to substance abuseprevention: One-year follow-up. Addictive Behaviors, 15(1),47-63.
Cohen, S., Lichtenstein, E., Prochaska, J., Rossi, J., Gritz, E.,Carr, C., Orleans, C., Schoenbach, F., Biener, L., Abrams, D.,De Clemente, C., Curry, S., Malian, G., Cummings, K.,Emont, S., Giovino, G., & Ossip-Klein, D. (1989).Debunking myths about self-quitting: Evidence from tenprospective studies of persons quitting smoking bythemselves. American Psychologist, 44(11), 1,355-1,365.
Dawson, W. D. (1994, March 2). Funding priorities andeducation (letter to the editor). Los Angeles Times, p. B6.
Gallo, H. (1993). Ad spending a mixed bag in '92: Beer andwine outlays up; spirits and refreshers down. Impact, 23, 15.
Levin, H. M. (1983). Cost effectiveness: A primer (Newperspectives in evaluation: Vol. 4). Newbury Park, CA:Sage.
Johnston, L., Bachman, J., & O'Malley, P. (1994). Drug userises among American teen-agers, as fewer see dangers andas peer norms begin to change. Cigarette smoking amongteens also begins to increase. Ann Arbor, MI: University ofMichigan, News and Information Services.
Pierce, J. P., Evans, N., Farkas, A. J., Cavin, S. W., Berry, C.,Kramer, M., Kealey, S., Rosbrook, B., Choi, W., & Kaplan,R. M. (in press). Tobacco use in California: An evaluationof the tobacco control program, 1989 -1993. San Diego:University of California, Cancer Prevention and ControlProgram.
Pollard, J. A., & Houle, D. (1993). Student assistance programdemonstration project evaluation: Final report (Contract A-0366-8). Sacramento: Department of Alcohol and DrugPrograms.
101 91

Slade, J. (1992). A retreat in the tobacco war. Journal of theAmerican Medical Association, 268, 4.
U.S. Department of Health and Human Services. (1994).Preventing tobacco use among young people: A report of thesurgeon general. Atlanta: U.S. Department of Health andHuman Services, Public Health Service, Centers for DiseaseControl and Prevention, National Center for Chronic DiseasePrevention and Health Promotion, Office on Smoking andHealth.
10
92

Appendix
103
93

Tab
le A
-1N
umbe
r of
Ins
truc
tiona
l Hou
rs'P
er S
tude
nt, b
y C
urri
culu
man
d G
rade
Lev
el
Gra
de
Cur
ricu
lum
K1
23
45
67
89
1011
12T
otal
DA
RE
.2.2
.1.3
.86.
24.
61.
1.6
-.1
.1.1
.9
Dis
cove
r.9
.81.
11.
31.
3.5
.3.1
-.2
.6-
-.5
Dis
tric
t-de
velo
ped
.3.2
.3.4
.2.3
2.6
4.2
2.9
3.6
2.4
.71.
21.
7
Fam
ily li
fe.2
.2.2
.2.3
.9.3
.7.3
-.7
.1.1
.3
Hea
lth3.
42.
42.
82.
94.
76.
03.
33.
22.
515
.614
.91.
2.5
5.7
Hea
lthy
Kid
s R
egio
nal C
ente
r1.
01.
11.
1.9
.8.8
.9.4
HL
AY
200
02.
83.
55.
64.
17.
57.
27.
67.
713
.21.
53.
7.3
1.0
4.5
Peer
pro
gram
.3.7
.4.1
.4.8
1.4
.4
QU
EST
Ski
lls F
or A
dole
scen
ce.1
5.0
6.3
.8-
--
-.8
QU
EST
Ski
lls F
or G
row
ing
3.6
3.9
3.0
4.4
2.6
2.2
.41.
2
Scie
nce
.8.7
.1.4
.1.1
.2
Tob
acco
.1.1
.1.1
.21.
3.1
.1.3
.1.2
.1.1
.2
Tri
bes
.91.
01.
01.
1.1
.2
All
othe
r cu
rric
ula
1.8
2.0
1.9
1.5
2.3
2.4
1.9
3.8
4.3
1.6
.8.6
.71.
8
Tot
al15
.015
.217
.117
.020
.828
.027
.528
.726
.022
.924
.23.
95.
318
.7
105
104

Tab
le A
-2Pe
rcen
tage
of
Stud
ents
in E
ach
Gra
de L
evel
Rec
eivi
ng I
nstr
uctio
n, b
y C
urri
culu
m Gra
de
Cur
ricu
lum
K1
23
45
67
89
1011
12T
otal
DA
RE
108
510
1141
.29
127
11
18
Dis
cove
r5
46
76
43
11
33
Dis
tric
t-de
velo
ped
33
54
34
910
1212
412
128
Fam
ily li
fe1
11
12
22
31
21
1
Hea
lth9
1111
1023
2919
2313
1924
32
15
Hea
lthy
Kid
s R
egio
nal C
ente
r1
11
12
22
1
HL
AY
200
025
2933
3142
4038
3329
815
26
22
Peer
pro
gram
11
11
<1
QU
EST
Ski
lls F
or A
dole
scen
ce1
1213
52
QU
EST
Ski
lls F
or G
row
ing
88
799
87
23
Scie
nce
110
42
62
22
Tob
acco
33
34
615
63
101
4
Tri
bes
22
22
<1
All
othe
r cu
rric
ula
2727
2823
3031
2734
276
72
218
Tot
al94
9710
210
213
317
6'5
014
310
950
6223
2687
1 06
107

Nr
= L,thor.11,11-\
M(v".; I milp...11, 1 (luluI ots 11.unituN. ( 90-11113 II) .) S9S--(U) I
Jo-
, :
I