document resume ed 373 290 cg 025 605 author beckman
TRANSCRIPT

DOCUMENT RESUME
ED 373 290 CG 025 605
AUTHOR Beckman, Carol M.TITLE Career Maturity of Welfare Recipients.PUB DATE [94]
NOTE 108p.; Master of Science Thesis, Fort Hays StateUniversity.
PUB TYPE Dissertations/Theses Masters Theses (042)
EDRS PRICE MF01/PC05 Plus Postage.
DESCRIPTORS Career Choice; Careers; Decision Making; JobSatisfaction; Occupational Aspiration; VocationalInterests; *Vocational Maturity; *WelfareRecipients
IDENTIFIERS Career Maturity Inventory (Crites); Job Opportunitiesand Basic Skills Program
ABSTRACTTo investigate the career maturity of welfare
recipients, this thesis examines six independent variables: (1) race;
(2) sex; (3) age; (4) level of formal education; (5) general
intelligence; and (6) locus of control. Scales taken from the CareerMaturity Inventory served as the dependent variables. The sampleconsisted of 83 welfare recipients who were eligible for the JobOpportunities and Basic Skills (JOBS) program in a midwestern state.Of the 100 comparisons that were made, 30 were for main effects and70 were for interactions. Results for the main effects indicate thatindividuals who possess an internal locus of control are more maturein decisiveness and orientation, that females are more mature ininvolvement than males, and that individuals with generalintelligence (91 to 100) are more mature in compromise. As for thesignificant interactions, findings revealed the following positivecorrelations: (1) formal education, general intelligence, and locusof control with Involvement; (2) formal education and age with
Decisiveness; (3) race, sex, and general intelligence withIndependence; and (4) race and sex with Orientation. Five tables andthree figures offer statistical summaries. (RJM)
* Reproductions supplied by EDRS are the best that can be made* from the original document. ;.f

Date
CAREER MATURITY OF WELFARE RECIPIENTS
being
A Thesis Presented to the Graduate Faculty
of the Fort Hays State University in
Partial Fulfillment of the Requirements for
the Degree of Master of Science
by
Carol M. Beckman
B.S., Fort Hays State University
Approved
Approved
Major Professor
Chair, Graduate Council
Li-1
CD PERMISSION TO REPRODUCE THIS U S DEPARTMENT OF EDUCATION
MATERIAL HAS BEEN GRANTED BY Othce of Educational Research and Improvement
EDUCATIONAL RESOURCES INFORMATIONCENTER (ERIC)
7' This document has been reproduced asreceived from Ine person or organaabonoog.nat.ng .1Minor changes have been made to improve,enroduct.on gush!),
C- k /net fri
CNJ
CD
TO THE EDUCATIONAL RESOURCESINFORMATION CENTER (ERIC)
Paints of Stew or opinions staled tntrusdocumienl do not necessarily repreSent officalOE RI posthon or sabcy BEST COPY AVAILABLE

Graduate Committee Approval
The Graduate Committee of Carol M. Beckman hereby
approves her thesis as meeting partial fulfillment of the
requirement for the Degree of Master of Science.
Date
Approved
Approved
Approved
Approved
ii
Chair, Graduate Committee
Committee Member
Committee Member
Committee Member

Table of Contents
Introduction
Career Maturity
Page
1
1
Welfare Recipients and Career Maturity 3
Race, Sex, Age, Level of Formal Education and
Career Maturity 8
General Intelligence and Career Maturity 12
Locus of Control and Career Maturity 14
Summary 17
Statement of the Problem 18
Rationale and Importance of the Research 18
Composite Null Hypotheses 20
Independent Variables and Rationale 21
Definitions of Variables 22
Independent Variables 22
Dependent Variables 23
Limitations of the Study 23
Methodology 24
Setting 24
Subjects 24
Instruments 25
General Aptitude Test Battery 25
Rotter's I-E Scale 27
Career Maturity Inventory - Attitude Scale
Counseling Form B-1 27
v

Design 28
Data Collection Procedures 31
Research Procedures 32
Data Analysis 33
Results 34
Discussion 72
Summary 72
Related Literature and the Results of the
Present Study 74
Generalizations 77
Recommendations 78
References 79
vi
J

List of Tables
Page
Table 1: A Comparison of Mean Career Maturity
Inventory - Attitude Scale Counseling
Form B-1 Scores for Welfare Recipients
According to Level of Formal Education,
General Intelligence, and Locus of Control
Employing a Three-Way Analysis of variance 36
Table 2: A Comparison of Mean Career Maturity
Inventory - Attitude Scale Counseling
Form B-1 Scores for Welfare Recipients
According to Level of Formal Education,
General Intelligence, and Age EmployinL; a
Three-Way Analysis of Variance 44
Table 3: A Comparison of Mean Career Maturity
Inventory Attitude Scale Counseling
Form B-1 Scores for Welfare Recipients
According to Level of Formal Education,
Locus of Control, and Age Employing a
Three-Way Analysis of Variance 50
Table 4: A Comparison of Mean Career Maturity
Inventory - Attitude Scale Counseling
Form B-1 Scores for Welfare Recipients
According to General Intelligence, Locus of
Control, and Age Employing a Three-Way
Analysis of Variance 58
vii

Table 5: A Comparison of Mean Career Maturity
Inventory - Attitude Scale Counseling
Form B-1 Scores for Welfare Recipients
According to Race, Sex and General Intelligence
Employing a Three-Way Analysis of Variance... 64
viii

List of Figures
Page
Figure 1: The Interaction Between the Independent
Variables General Intelligence and Locus
of Control for the Dependent Variable
Involvement 42
Figure 2: The Interaction Between the Independent
Variables Formal Education and Age for
the Dependent Variable Decisiveness 56
Figure 3: The Interaction Between the Independent
Variables Race and Sex for the Dependent
Variable Orientation 71
ix

Appendix A:
Appendix B:
Appendix C:
Appendix D:
Appendix E:
List of Appendixes
Page
Correlation Coefficients Between Item
and Total Score for the I-E Scale 85
Permission to Utilize Data Generated
from Pre-Orientation Vocational
Assessment Sessions Conducted with
Welfare Recipients Who were Eligible
for the JOBS Program 88
Sample Letter to Subjects 91
Verbal Instructions for Test
Administration 93
Instructions for Administration of the
I-E Scale 96
x

Abstract
The purpose of the researcher was to investigate the
career maturity of welfare recipients. The following six
independent variables were investigated: race, sex, age,
level of formal education, general intelligence, and locus
of control. Dependent variables were scores from the
following five scales of the Career Maturity Inventory
Attitude Scale Counseling Form B-1: Decisiveness,
Involvement, Independence, Orientation, and Compromise. The
sample consisted of 83 welfare recipients who were eligible
for the Job Opportunities and Basic Skills (JOBS) program in
a midwestern state. Five composite null hypotheses were
tested at the .05 level of significance employing a three-
way analysis of variance (general linear model).
A total of 100 comparisons were made plus 75 recurring.
Of the 100 comparisons made, 30 were for main effects and 70
for interactions. Of the 30 main effects, 6 were
statistically significant at the .05 level. Of the 70
interactions, 5 were statistically significant at the .05
level.
The results of the present study appeared to support
the following generalizations:
1. individuals with internal locus of control are more
mature in Decisiveness,
2. individuals with internal locus of control are more
mature in Orientation,
xi

3. females are more mature in Involvement than males,
4. individuals with general intelligence (91 to 100)
are more mature in Orientation,
5. individuals with general intelligence (91 to 100)
are more mature in Compromise, and
6. significant interactions for
(a) the independent variables general intelligence
and locus of control for the dependent variable Involvement,
(b) the independent variables formal education,
general intelligence, and locus of control for the dependent
variable Involvement,
(c) the independent variables formal education and
age for the dependent variable Decisiveness,
(d) the independent variables race, sex, and
general intelligence for the dependent variable
Independence, and
(e) the independent "ariables race and sex for the
dependent variable Orientation.
xii

Introduction
Career Maturity
Vocational maturity (career maturity) has been defined
as the level of competence people reach and demonstrate when
dealing with the tasks and problems associated with
vocational development at various life stages (Super &
Overstreet, 1960). Vocational development has become known
as the process through which people make vocational choices
(Super, 1955).
In researching vocational development, Super, et al.
(1957) theorized it as being on a continuum that involved
both growth and learning. Their theory involved five life
stages taken from Charlotte Buehler who wrote about general
development. These five stages were: (1) growth from zero
to age 14; (2) exploration from 14 to 25; (3) establishment
from 25 to 45; (4) maintenance from 45 to anywhere from 55
to 75; and finally, (5) decline, which can start as early as
age 55, but generally begins around age 65 until death.
Super, et al. (1957) stated:
If the individual's behavior develops normally, without
being arrested, then he will progress from -ne stage to
another with increasing age, although his rate of
development, and therefore the age at which he enters
the various stages, may differ from that of other
individuals. (p. 35)
According to Super et al. (1957), vocational behavior
1

2
and development have three major factors. The first is the
roles each person plays. Society places specific sets of
expectancies, or roles, on each of its members. The second
is personal factors. The following are personal factors:
intelligence, special aptitudes, interests, values,
attitudes, and persc -lity. The third is situational
factors which includes anything external to the individual.
The following are examples: socioeconomic status (SES),
atmosphere of the home, societal biases, and familial
attitudes. Thus, vocational development is a process which
takes place on a continuum of time and involves much more
than a single vocational choice at a single point in time.
Crites (1965) stated, "...vocational choice is a
comprehensive, multifaceted, ongoing process which
encompasLes many interrelated behaviors of the individual at
various points in his prework life" (p. 2).
Super (1955) identified five dimensions of vocational
maturity. He reported these dimensions as a basis for
measuring vocational maturity. The dimensions were the
following: (1) Orientation to Vocational Choice, (2)
Information and Planning, (3) Consistency of Vocational
Preference, (4) Crystallization of Traits and Aptitudes, and
(5) Wisdom of Vocational Preference. Crites (1965) proposed
that three of these dimensions could be condensed into two
dimensions which he labeled the following: (1) choice
competencies, and (2) choice attitudes. His theory of
13

3
vocational maturity contained four group factors. Two were
Super's (1955), (1) consistency of vocational choice and
(2) wisdom of vocational choice; and two were his own, (3)
choice competencies, and (4) choice attitudes.
The original concept of vocational maturity (career
maturity) was thought to be applicable only to adolescents
according to Super and Kidd (1979). In more recent years,
researchers have started looking at the career maturity of
adults (Super & Kidd, 1979; and Manuele, 1983). Super et
al. (1957) stated, "In judging the normality of one's
behavior from a statistical point of view, one should be
concerned with what group the individual is being compared.
An individual could be considered normal in one group and
abnormal in another" (p. 56).
Welfare Recipients and Career Maturity
Since 1935, many members of American society have
become part of a special group or population known as
welfare recipients. It was in 1935 that the Aid to Families
with Dependent Children (AFDC) program became part of the
Social Security Act, to provide assistance to widows and
children in need (Nightingale, 1989). This special
population has b'en studied and discussed by many
researchers (Nightingale, 1989; Sklar, 1987; Cull and Hardy,
1973; Randolph & McCarthy, 1991; Rolle, 1977; and Bartlett,
1968) over the years. Various programs have been in place
to aid welfare recipients in gaining needed social services
1 ti

4
and help with job search and training needs. According to
Chisman and Woodworth (1992), the current program, Job
Opportunities and Basic Skills (JOBS), was part of the
Family Support Act of 1988. The JOBS program was designed
to assist AFDC recipients to become self-sufficient by
providing the necessary employment related activities and
supportive services. Mandatory components were the
following: (1) educational activities (e.g., high school or
equivalent education, basic and/or remedial education, or
English as a Second Language); (2) job skill training; (3)
job readiness activities (e.g., Job Finder's Club, Life
Skills classes); and (4) job development and placement
activities. The program must also include at least two of
the following components: (1) group or individual job
search; (2) on-the-job training; (3) work supplementation
programs; or (4) community work experience programs (Chisman
& Woodworth). Thus, the program was designed not just to
help welfare recipients find jobs, but to increase their
educational levels and enhance their overall lifestyles.
Furstenberg, Brooks-Gunn, and Morgan (1987) made the
following statement:
...there are real life courses characterized by welfare
dependency, non-marriage, low education, and high
fertility. Those whose life course takes such a
trajectory are likely to remain on this path. But if
they can escape, if they can alter this trajectory by

5
getting a stable job, entering a stable marriage,
acquiring educational credentials or curtailing
subsequent fertility, they are no more likely than
others to fall back within this trajectory. Moreover,
children benefit as their mother's life situation
improves. (p. 128)
Randolph and McCarthy (1991) reported individuals who
live in poverty have a low self esteem. The low self esteem
results from a feeling of powerlessness and failure to
behave in a traditional or "normal" manner based on
society's expectations. Cull and Hardy (1973) described
people living in poverty as having a "stronger orientation
in the present and in short-term perspective rather than in
long-term planning and goals" (p. 121). They have a
"definite feeling of fatalism and the belief in chances;
impulsiveness and general inability to delay immediate
gratification or make definite plans for the future" (p.
121-122). They have a "thinking process that could be
termed much more concrete in character than abstract" (p.
122). They have:
general feelings of inferiority and an acceptance of
authoritarianism; therefore, when an individual who has
lived in a poverty environment during the formative
years of his growth and development becomes disabled,
the reaction is g..._nerally substantially different from
those who have been reared in a middle-class

6
environment. (p. 122)
Another important characteristic of families in poverty
reported by Cull and Hardy (1973) was that they were in
constant crises. Families in poverty were described as
having a constant lack of financial stability, an increased
amount of stress, children getting into trouble, the lack of
or loss of employment, and insufficient nutrition and health
care. Cull and Hardy stated, "These constant crises have
the effect of draining all energy from the family and its
members. Such emotionality takes a high toll in terms or
overall ability of a family unit or of an individual" (p.
123).
Sklar (1987) pointed out "that between 25 and 75
percent of all long term recipients, who can be classified
as employable, are functionally illiterate and lack
essential job skills required by employers" (p. 14).
Because so many recipients were found to be functionally
illiterate and to lack essential job skills, the Family
Support Act of 1988 JOBS program focused not only on work
requirements, but also on educational needs which included
gaining a high school diploma or its equivalent, basic
remedial education, vocational education, and in some cases,
post-secondary education (Nightingale, 1989).
Rolle (1977) studied the effectiveness of several
delivery systems for occupational information to minority
college students from low socioeconomic backgrounds. All

7
226 of his subjects were low-achieving in high school with
academic records and Scholastic Aptitude Test scores showing
little or no learning potential. The subjects were Black
college freshmen enrolled at two predominantly Black
colleges in the south. He used a posttest-only control
group design. The treatment consisted of three occupational
information delivery systems. The systems were described as
the following: (1) career logs - records of experiences,
perceptions, and reactions to occupational information; (2)
career simulations - job related experiences similar to real
life; and (3) written occupational briefs - occupational
briefs written by subjects in areas of their vocational
interest. By using treatment and control groups, he was
able to establish through an analysis of variance at the .05
level of confidence that "career planning experiences and
occupational explorations can be beneficial in raising
career maturity of individuals from disadvantaged/minority
groups" (p. 15).
Bartlett (1968) measured the vocational maturity and
personality variables of trainees participating in the
Manpower Development Training Act, a program designed to
train and retrain the unemployed. The sample consisted of
81 female and 69 male subjects ranging in age from 16 to 21.
He utilized the Vocational Development Inventory [(VDI),
Crites, 1965]; and through the use of a one-way analysis of
variance, he found that those trainees who scored higher on
1 Ls

8
the VDI also scored higher on the following personality
variables: self confidence (F= 5.20, p.01), achievement
(F=3.88, R<.01), dominance (F=3.68, p.05), and autonomy
(F=6.03, R<.01). He also found that those with a higher
educational attainment also had a high vocational maturity
score (F=11.21, p<.01). He concluded that the development
of vocational behavior was related to the development of
mature personality characteristics; and vocational
counselors should attempt to facilitate more mature
personality characteristics in their counselees.
Race, Sex, Acre, Level of Formal Education and Career
Maturity
Holland (1981) used a multiple regression analysis to
determine the relationships between career maturity and
socioeconomic status (SES), race, sex and age in 6th grade
students. For a randomly selected sample of 300 students
from 22 public schools in Georgia, Holland found SES to be
the best predictor of career attitudes (r=.40, 2<.01). The
higher the SES, the higher the score on the Career Maturity
Inventory - Attitude Scale (CMI-AS). Even though a
significant difference (F=43.96, R<.001) was found between
the mean scores of White and Black subjects on the CMI-AS,
the author maintained race wFs not an adequate predictor of
career attitudes. When race was paired with SES, a
significant multiple correlation coefficient was found
(F=37.24, R=.45, p<.05). More specifically, White students

9
from upper class backgrounds were found to be more career
mature, and Black and White students at lower and middle SES
had similar career mature attitudes. She did not find sex
and age to be significant predictors of career mature
attitudes for this adolescent group.
Luzzo (1991) studied the career maturity of 401
undergraduate college students from California State
University, Long Beach, in relation to SES and ethnic group.
Through a one-way analysis of variance, the researcher found
Caucasian-Americans (M=37.97) to be significantly more
career mature than Filipino (M=33.54) and Asian-American
(M=35.76) students (F=7.298, p<.001). No significant
difference was found for SES. He concluded that current
theories of career development and career counseling need to
be more Applicable to today's ethnically diverse
populations.
Lawrence and Brown (1976) used a multiple regression
analysis to gain a better understanding of the relationship
of many factors including self concept, SES, race and sex to
career maturity as measured by the CMI - Attitude Scale and
Competence Test. Their 226 subjects were 12th grade
students ranging in age from 16 to 19. For the total group,
self concept (r=.59) and race (r=.62) were found to be
significant predictors of career maturity at the .01 level.
They found White students to be more career mature (for
Black males vs. White males, t=-5.86, R<.01; and for Black

10
females vs. White females, t=-6.66, p<.01 on the CMI-AS).
No significant differences were found between males and
females.
McNair and Brown (1983) and Lee (1984) found similar
results in their studies. The authors of these studies
investigated ethnic and sex differences in 10th grade
students. Multiple regression analysis in both studies
confirmed that White students scored higher than non-White
students (McNair & Brown, F=29.08, p<.01; Lee, F=37.30,
p<.01). Lee (1984) did not find a significant F value for
males and females; however, McNair and Brown (1983) did find
females scored significantly higher than males on career
maturity (F=4.31, p<.05). Lawrence and Brown (1976), McNair
and Brown (1983), and Lee (1984) all suggested that career
counselors must be more aware of the diverse ethnic
populations with which they work.
Herr and Enderlein (1976) examined the differences in
mean scores on the CMI among 9th, 10th and 12th grade
students and between males and females. Their sample
consisted of 1,553 students from three large nonmetropolitan
schools in Pennsylvania. Through the use of a 3 X 3
analysis of variance with grade level and school being the
factors, the researchers found career maturity did increase
incrementally by grade level (F=46.31, p<.001;, but not
without other influences such as school effects, curriculum
choices, and sex differences. The researchers conducted a 2

11
X 3 analysis of variance with sex and grade as the factors,
and found females displayed more career maturity than males
at all grade levels (F=51.39, p<.001).
Healy, O'Shea, and Crook (1985) investigated the
relation of age and career attitudes in 158 students from a
metropolitan California state university. This college only
admitted students who ranked in the upper 50th percentile of
their high school or who had already achieved an associate
degree. The subjects' ages ranged from 18 to 30. They
found a positive correlation coefficient (r=.48, p<.01)
between career attitudes and age. They also found career
attitudes correlated with grade point average (r=.41,
p<.01).
Gladstone and Trimmer (1985) investigated the
predictors of success for welfare recipients in the Work
Incentive (WIN) program in southern Nevada. This welfare
reform program was designed to place welfare recipients in
training and employment. Gladstone and Trimmer postulated
that there were common elements among welfare recipients who
were successful (completed training or entered employment)
and among those who were not. The sample consisted of 29
volunteer and 27 mandatory participants, all of whom were
female. They had a mean age of 27 and an average education
level of 11.7. Ethnically, 59% were Black, 37% were White,
3% were Hispanic, and 1% Asian. All had requested training
and all needed it. They were all considered "non-job ready"

12
due to a lack of work history or current work skills. The
researchers did not find school grade completion a good
predictor because often times, even high school graduates
were found to need adult basic education. They found the
average grade level completed was 11.7; however, the average
literacy level as measured by the Basic Occupational
Literacy Test (BOLT) was at a 6th grade achievement level.
Gladstone and Trimmer reported the following:
Personality traits such as responsibility, self-esteem,
self-confidence, and independence certainly influence
one's success or failure in training or employment.
...The results of the assessment instruments used in
this study demonstrate that intelligent and
aiscretionary use of testing results in the vocational
counseling process is effective for predicting success
or failure in training or employment. (p. 69)
General Intelligence and Career Maturity
Gladstone and Trimmer (1985) obtained a measure of
general intelligence from their sample. They administered
the General Aptitude Test Battery (GATB) which produced a
"G" score, or a measure of general intelligence. The
researchers reported the "G" score as having five functional
levels with Level 1 being the highest and Level 5 being the
lowest. The levels were not defined by the researchers. A
definite relationship was found between "G" scores and
successful completion of training. Gladstone and Trimmer
7')-

13
reported 100% of the subjects with a "G" score at functional
Level 1 successfully completed training, 80% at Level 2, 71%
at Level 3, 63% at Level 4, and no subjects completed
training when their "G" score was at Level 5. "The average
'G' score of those who completed training was 107; and the
average for those who did not complete was 89" (p. 64). The
authors concluded the "G" score on the GATB can be utilized
in predicting success of welfare recipients in training and
employment. They stated "personality traits such as
responsibility, self esteem, self confidence, and
independence certainly influence one's success or failure in
training or employment" (p. 69).
Lawrence and Brown (1976) investigated intelligence as
a predictor of career maturity. They found intelligence, ,Jr
general aptitude, to be correlated with career maturity
(r=.56, p<.01). They stated, "one should not be surprised
to find that the less career mature may be less
intellectually bright" (p. 50). Conclusions from Lawrence
and Brown indicated separate equations should be utilized
with different predictors, such as SES and self concept,
depending on sex and race; and intelligence, race and sex
had a greater effect on career maturity than SES and self
concept. They stated "career maturity as measured by the
CMI is highly correlated with intelligence test scores"
(p. 51).
Palmo and Lutz (1983) studied the performance of

14
disadvantaged youth on the CMI and the Wechsler Adult
Intelligence Scale (WAIS). The sample consisted of 91 high
school dropouts and 29 graduates ranging from age 16 to 22.
The researchers found those who scored higher on the WAIS
also scored higher on the CMI (r=.51, R<.01). The
researchers concluded career maturity and general
intelligence were significantly related constructs for
disadvantaged populations.
West (1988) looked at the correlation of career
maturity and higher academic performance. His subjects were
69 college students; 30 were American Indian, 39 were non-
American Indian. Through the use of Pearson product-moment
correlations, West found a positive correlation between
career maturity and higher academic performance for the
total group (r=.3950, R=.030). Through the use of a t-test,
he also found a significant difference between mean career
maturity scores of the Indian and non-Indian groups for the
whole sample (t=2.55, R=.013). The author concluded that
ethnic minority students have significantly lower career
mature attitudes.
Locus of Control and Career Maturity
Rotter (1966) defined locus of control as the degree
to which an individual believes his rewards or
reinforcements are a result of his actions, or of fate, luck
or chance. In other words, an individual who has an
internal locus of control would be more personally, involved

15
in his vocational development and a person with an external
locus of control would be influenced by others or rely on
fate or luck to determine his life course.
Stebbing (1985) studied the effects of locus of control
on the career maturity of 61 undergraduate junior and senior
women from a large southwestern university. Through
regression and correlation analyses, she found locus of
control to be a valid predictor of career maturity (r=-.31,
R<.002).
Khan and Alvi (1983), Lokan, Boss, and Patsula (1982),
and Thomas and Carpenter (19-) all investigated locus of
control in relation to career' maturity in high school age
students. Even though different instruments were used in
each of the research projects, the researchers reached the
same conclusions. Individuals with an internal locus of
control will generally have a higher level of career
maturity.
Gable, Thompson, and Glanstein (1976) also studied
locus of control and career maturity. Their sample
consisted of 179 volunteer freshmen through senior level
female college students from a New England university.
Through an analysis of variance, the researchers found women
who were more internally controlled were also more career
mature (F=32.7, R<.01).
Amster and Lazarus (1982) studied the locus of control
of disadvantaged high school dropouts after conducting a

16
comprehensive review of the literature regarding the locus
of control of disadvantaged groups. Their review of the
literature did not produce much information about the
subject, and so, the authors conducted their study to obtain
data that could be considered normative. They administered
Rotter's I-E Scale to 197 disadvantaged high school dropouts
ranging in age from 16 to 21. The group had a mean I-E
score 9.95 (SD=3.1) with a range from 2 to 19. Females in
the group were slightly more external (M=10.37, SD=3.05)
than males (M=9.53, SD=3.14). The findings indicated no
statistically significant difference for I-E mean scores for
females and males (p<.09), but were consistent with the
literature regarding the I-E Scale from Rotter (1966).
Rodriguez and Blocher (1988) compared two methods of
increasing career maturity in Puerto Rican college women.
They hypothesized that the career maturity of students
participating in the "modified Adkins Career Choice Modular
Program" would be higher and their locus of control more
internal than that of students who participated in an
alternative career program or a control group. Their
investigation was for a sample of 66 Puerto Rican college
freshmen women who were academically and economically
disadvantaged. Through the use of a multivariate analysis
of covariance the researchers found a significant main
effect for treatment at p=.008. In other words, traditional
career development interventions produced increases in
27

17
career mature attitudes, and changes in locus of control
also resulted from these interventions. According to
Rodriguez and Blocher, "As people come to believe that they
can control their environments and their own future, career
attitudes may also become more mature" (p. 279).
Summary
The review of the literature assembled here covers
three major areas: (1) an overall view of career maturity;
(2) a description of welfare recipients and the welfare
reform program currently in existence; and (3) studies of
the various predictors of career maturity in different
populations related to race, sex, age, level of formal
education, general intelligence, and locus of control. Just
a few of these studies were similar in nature to the present
study. Bartlett (1968) studied the career maturity of
manpower trainees. His subjects ranged in age from 16 to
21, and were part of a low-income group, but were not
necessarily welfare recipients. Gable, Thompson, and
Glanstein (1976) researched the career maturity of women,
but limited their study to college freshmen through seniors.
Rodriguez and Blocher's (1988) study looked at the career
maturity of an economically disadvantaged group of women,
but again, the group was enrolled in college. Gladstone and
Trimmer (1985) looked at the predictors of success for
welfare recipients involved in a welfare program; however,
they did not look specifically at the career maturity of

18
welfare recipients. Most previous research of career
maturity has been conducted on adolescents or college-age
groups. Overall, the results of the studies reviewed
indicated an internal locus of control and a higher general
intelligence to be consistent predictors of career maturity
regardless of race, sex, age, or level of formal education.
In terms of race, sex, age, and level of formal education,
the results are less conclusive.
In recent years, welfare reform has been a major topic
of discussion within the nation. Many authors of the
studies cited in this literature review offered the
following suggestions for career development programs: (1)
counselors need to be more aware of the diverse cultural
populations with which they work, (2) counselors need to
encourage autonomy and assertiveness in their counselees in
order to bring about a more internal locus of control, and
(3) individuals from low socioeconomic backgrounds can
increase their vocational maturity by receiving occupational
information through career planning experiences.
Statement of the Problem
The purpose of the researcher was to investigate the
career maturity of welfare recipients.
Rationale and Importance of the Research
The author of the present study researched the special
population of welfare recipients with whom many counselors,
social workers, and sometimes educational personnel find

19
themselves working. It is essential for these professionals
to have knowledge of techniques and programs that work for
welfare recipients and which ones do not. Vocational
counselors may need to develop career development programs
for welfare recipients. With the results of this study,
they can increase their knowledge base from which to build
the foundation of such a program.
The current literature available offered little
substantial knowledge specifically about career maturity and
welfare recipients. The author of the present study
incorporated the population of welfare recipients into the
already existing body of knowledge regarding career
maturity. The author also attempted to clarify race, sex,
age, level of formal education, and career maturity for this
special population.
Results of the present study may be used by legislators
who work on the problem of welfare reform. The factors
identified with career maturity in welfare recipients can
then be emphasized in future programs. Vocational
counselors, social workers, and educational personnel who
work in welfare programs, may also find the results of this
study helpful. The professionals in the human service field
will be able to address specific issues found to be relevant
in working with welfare recipients. The following are
examples: promoting more internal locus of control and
remedial education programs that include enhancements to
I,

20
develop more mature career attitudes.
The results of the present study provided information
pertaining to the following questions:
1. Is there an association between welfare recipients'
race and career maturity?
2. Is there an association between welfare recipients'
sex and career maturity?
3. Is there an association between welfare recipients'
age and career maturity?
4. Is there an association between welfare recipients'
level of formal education and career maturity?
5. Is there an association between welfare recipients'
general intelligence and career maturity?
6. Is there an association between welfare recipients'
locus of control and career maturity?
Composite Null Hypotheses
Each hypothesis was tested at the .05 level of
significance.
1. The differences among the mean Career Maturity
Inventory - Attitude Scale Counseling Form B-1 scores
according to level of formal education, general
intelligence, and locus of control will not be statistically
significant.
2. The differences among the mean Career Maturity
Inventory - Attitude Scale Counseling Form B-1 scores
according to level of formal education, general

21
intelligence, and age will not be statistically significant.
3. The differences among the mean Career Maturity
Inventory - Attitude Scale Counseling Form B-1 scores
according to level of formal education, locus of control,
and age will not be statistically significant.
4. The differences among the Maturity
Inventory - Attitude Scale Counseling Form B-1 scores
according to general intelligence, locus of control, and age
will not be statistically significant.
5. The differences among the mean Career Maturity
Inventory - Attitude Scale Counseling Form B-1 scores
according to race, sex, and general intelligence will not be
statistically significant.
Independent Variables and Rationale
The six independent variables investigated were: (1)
race, (2) sex, (3) age, (4) level of formal education, (5)
general intelligence, and (6) locus of control. The
rationale for the selection of these variables was: (a) no
studies were located which dealt specifically with the
career maturity of welfare recipients (most of the research
regarding career maturity utilized adolescents and college
students), (b) many of the studies found were not current,
and (c) from the studies reviewed, few were conclusive in
determining the effects of race, sex, age, and level of
formal education on career maturity.

22
Definitions of Variables
Independent Variables
The information for the first four independent
variables was self reported on the answer sheet for the
General Aptitude Test Battery (GATB). Of the remaining two,
general intelligence was measured by the GATB; and locus of
control was self reported on Rotter's I-E Scale. The
following variables were investigated:
1. race - 3 levels (determined post hoc),
level one, White,
level two, Black, and
level three, Hispanic;
2. sex - 2 levels,
level one, male, and
level two, female;
3. age - 3 levels, (determined post hoc),
level one, age 18 to 24,
level two, age 25 to 31, and
level three, age 32 to 48;
4. level of formal education - 3 levels (determined
post hoc),
level one, less than high school diploma,
level two, high school diploma or GED, and
level three, more than high school diploma;
5. general intelligence - 4 levels (determined post
hoc),
) '3

23
level one, G = 80 or below,
level two, G = 81 to 90,
level three, G = 91 to 100, and
level four, G = 101 to 120; and
6. locus of control - 2 levels,
level one, internal - 0 to 10, and
level two, external - 11 to 23.
Dependent Variables
Scores from the following five scales of the Career
Maturity Inventory - Attitude Scale Counseling Form B-1 were
employed as the dependent variables (five items on the first
four scales and eight on the fifth scale were experimental
and not used in scoring):
1. Decisiveness - 15 items, possible scores are 0-10;
2. Involvement - 15 items, possible scores are 0-10;
3. Independence - 15 items, possible scores are 0-10;
4. Orientation - 15 items, possible scores are 0-10;
and
5. Compromise - 15 items, possible scores are 0-7.
Limitations of the Study
The following conditions might have affected the
results of the present study:
1. the sample was not random;
2. the subjects came from one geographical area;
3. tt: study was limited to subjects from a single
time interval;

4. most of the information was self reported; and
5. sample size.
Methodology
24
Setting
This study was conducted on welfare recipients who were
determined to be eligible for the Job Opportunity and Basic
Skills (JOBS) program in a midwestern state. The
geographical location included one major city with a
population of approximately 310,000, and several smaller
communities. The economic base of the area was supported
mainly by manufacturing; service (e.g., health care);
wholesale and retail trade; transportation, communication
and public utilities; finance, insurance and real estate;
and construction. In November of 1993, the area had an
unemployment rate of 5.9% which was higher than the previous
year when it was at 4.6% (Kansas Department of Human
ResourcesF December, 1993). This was due to massive layoffs
in 1993 at ol :a of the major aircraft manufacturing plants.
Subjects
The subjects were selected based on their eligibility
for the JOBS program. To be eligible for the JOBS program,
one must be receiving AFDC (i.e., cash assistance) from the
State Department of Social and Rehabilitation Services
(SRS). The subjects were identified by their JOBS program
casemanagers, and then notified by the casemanagers to
report to the researcher's office for a pre-orientation

25
vocational assessment. Child care assistance and a
transportation allowance was made available to those
subjects who requested it from the SRS JOBS program. The
sample consisted of 83 welfare recipients; 59 females, 24
males; and 64% were White, 30% were Black, and 6% were
Hispanic. The subjects ranged in age from 18 to 48.
Instruments
Three instruments were used. The answer sheet from the
General Aptitude Test Battery (GATB) was used to obtain
information regarding race, sex, age, and level of formal
education. The GATB was used to gain a measure of general
intelligence. The Rotter I-E Scale was used to obtain a
measure of a generalized locus of control. The Career
Maturity Inventory - Attitude Scale Counseling Form B-1 was
used as a measure of career maturity.
General Aptitude Test Battery. The General Aptitude
Test Battery (GATB) was used to measure general
intelligence. This instrument was developed by the United
States Employment Service (USES) and has been used by state
employment offices since 1947. It was normed on a sample
that consisted of 4000.people representative of the working
population of the 1940s which was oriented toward blue-
collar jobs. The GATB measures 9 aptitudes. They are the
following: general intelligence (G), verbal (V), numerical
(N), spatial perception (S), clerical perception (Q), form
perception (P), motor coordination (K), finger dexterity

26
(F), and manual dexterity (M).
The "G" score is the measure of general intelligence,
or general learning ability. It is defined as the ability
to reason and make judgements, and is essentially a measure
of overall academic ability. It is a combination score
obtained from three tests: the spatial perception, verbal
ability, and arithmetic reasoning tests. The mean for the
"G" score is 100 with a standard deviation of 20. The "G"
score correlates highly with both the "V" (r=.84) and the
"N" (r=.86) scores (no p value was reported). The "G" score
may be used as a guideline in predicting success in
training. A minimum "G" score of 100 may predict success
for junior college; 110 for a four-year college; and 120 for
graduate or professional school (U.S. Department of Labor,
Manpower Administration, 1979).
The General Aptitude Test Battery is a widely known and
used multiple aptitude battery and has been well established
with numerous studies of validity and reliability. One
study, conducted in 1954 by the Pennsylvania Agency, had a
sample which consisted of 95 males and 85 females. Subjects
were initially tested on Form A of the GATB, and then
retested on Form B one week later. The correlation
coefficient for the "G" score was reported at r=.92 for
males, and r=.90 for females. Another study was conducted
between 1956 and 1958 and included data from five states.
The total sample consisted of 168 males and 155 females.

27
Individuals were initially tested on Form B of the GATB, and
then retested on the same form two weeks later. The
correlation coefficient reported for the "G" score was r=.94
for both males and females (U.S. Department of Labor,
Manpower Administration, 1979).
Rotter's I-E Scale. Rotter's I-E scale was used to
measure the construct of locus of control. This scale was
devised by Rotter (1966), and, according to Stebbing (1985),
is one of the most widely used instruments for measuring a
person's internal or external orientation. The I-E scale is
a forced-choice, 29-item, self-report instrument. The 29
items include 6 filler statements to make the purpose of the
test remain somewhat unclear to the test taker. The score
is reported in terms of the total number of external choices
and can range from 0 to 23. Therefore, a low score
indicates a more internal locus of control, and a high score
signifies a more external orientation. The scale's internal
consistency has been determined by a Kuder-Richardson
reliability coefficient of r=.73; and its test-retest
reliability coefficient for one month has been reported at
r=.72 (Rotter, 1966).
Rotter (1966) reported correlation coefficients between
each item of the instrument and total score. These values
were cited in Appendix A.
Career Maturity Inventory - Attitude Scale Counseling
Form B-1. The Career Maturity Inventory - Attitude Scale

28
Counseling Form B-1 was used to measure career maturity.
This instrument was constructed by Crites (1978a) and,
according to Palma and Lutz (1983), is one of the most
widely used measures of career maturity. Form B-1 of the
attitude scale consists of 75 true-false items, 50 of which
are from the original Form A-1, and 25 are new items. Form
B-1 consists of the following five scales: Decisiveness,
Involvement, Independence, Orientation, and Compromise.
Possible scores on each of the scales is 0 to 10, except on
the Compromise scale. Possible scores are 0 to 7 for the
Compromise scale. It takes about 20 minutes to administer
Form B-1 of the Career Maturity Inventory - Attitude Scale.
This instrument was designed to elicit "the feelings, the
subjective reactions, the dispositions that the individual
has toward making a career choice and entering the world of
work" (Crites, 1978a, p. 3). Crites (1978b) reported Kuder-
Richardson (KR) 20 reliability coefficients which ranged
from .72 to .90. Internal consistency coefficients for the
five sub-scales on Form B-1 were the following:
Decisiveness, r=.67; Involvement, r=.62; Independence,
r==.71; Orientation, r=.72; and Compromise, r=.50 (1978b).
Design
A status survey factorial design was employed. The
independent variables utilized were: (a) race, (b) sex, (c)
age, (d) level of formal education, (e) general
intelligence, and (f) locus of control. The dependent

1
29
variables were scores from the following five scales of the
Career Maturity Inventory - Attitude Scale Counseling Form
B-1: Decisiveness, Involvement, Independence, Orientation,
and Compromise. The sample consisted of 83 subjects; 59
were female, 24 were male.
The following design was used with each composite null
hypothesis:
composite null hypothesis number 1, a 3 X 4 X 2
factorial design;
composite null hypothesis number 2, a 3 X 4 X 3
factorial design;
composite null hypothesis number 3, a 3 X 2 X 3
factorial design;
composite null hypothesis number 4, a 4 X 2 X 3
factorial design; and
composite null hypothesis number 5, a 3 X 2 X 4
factorial design.
McMillan and Schumacher (1984) cited 10 threats to
internal validity. The 10 threats were dealt with in the
following ways:
1. history did not pertain because the present
study was a status survey;
2. selection - all welfare recipients asked to
participate who came and completed instruments were
included;
3. statistical regression - did not pertain because

30
the present study was a status survey;
4. testing - did not pertain because the present
study was a status survey;
5. instrumentation - did not pertain because the
present study was a status survey;
6. mortality - did not pertain because the present
study was a status survey;
7. maturation - did not pertain because the present
study was a status survey;
8. diffusion of treatment - did not pertain because
the present study was a status survey;
9. experimenter bias - the same oral instructions
were given by the researcher to all groups during the
administration of the instruments and no treatment was
administered; and
10. statistical conclusion - two mathematical
assumptions were violated (random sample and equal numbers
of subjects in cells). The general linear model was used to
correct for unequal numbers of subjects in cells, and the
researcher did not project beyond the statistical procedures
employed.
McMillan and Schumacher (1984) cited 2 threats to
external validity. The 2 threats were dealt with in the
following ways:
1. population external validity - the sample was not
random; theref-re, the results should be generalized only to

31
groups similar to the sample; and
2. ecological external validity - the data were
collected by standard procedures and there was no treatment.
Data Collection Procedures
The researcher contacted the director of the Employment
Preparation Services (EPS), which administers the Job
Opportunities and Basic Skills (JOBS) program, to request
permission to use data from pre-orientation vocational
assessment sessions conducted with welfare recipients who
were determined to be eligible for the JOBS program
(Appendix B). The names of those welfare recipients who
were determined eligible for the JOBS program were placed on
schedules for the pre-orientation vocational assessment
sessions by their JOBS program casemanager. The recipients
whose names were on the schedules were notified by their SRS
casemanagers to report to the researcher's office on a
specified date and time (Appendix C).
The researcher administered the instruments in the same
order to each of the groups of recipients (Appendix D). The
size of the groups varied from 3 to 10 subjects. The
subjects were informed at a later time that parts of the
assessment were used for research purposes. The researcher
collected the answer sheets for each of the assessments, and
then the answer sheets for the GATB were mailed to the State
Department of Human Resources for machine scoring. When the
scored aptitude tests had been returned to the researcher,
4;

32
all data were assembled, necessary coding was made, and the
data were sent to the Fort State University Computer Center
for data analysis.
Research Procedures
The following steps were implemented in the present
study:
1. a research topic was selected;
2. related literature was obtained through data base
searches (i.e., ERIC, PSYCHLIT, Social Science Index, and
Thesis Abstracts from Ablah Library at The Wichita State
University, Wichita, Kansas);
3. resources were reviewed;
4. instruments were selected;
5. permission was obtained from the Department of
Social and Rehabilitation Services to utilize data generated
from pre-orientation vocational assessment sessions
conducted with welfare recipients in the JOBS program;
6. the Career Maturity Inventory - Attitude Scale
Counseling Form B-1 was obtained from Chronical Guidance
Publishers in Moravia, NY.
7. research proposal was written;
8. proposal was defended before the thesis. committee;
9. data were collected;
10. data were analyzed;
11. final document was written;
12. completed document was defended before the thesis

33
committee; and
13. final editing of the thesis.
Data Analysis
The following were compiled:
1. appropriate descriptive statistics;
2. three-way analysis of variance (general linear
model);
3. Bonferroni (Dunn) t test for means; and
4. Duncan's multiple-range test for means.
4 4

34
Results
The purpose of the researcher was to investigate the
career maturity of welfare recipients. The following
independent variables were investigated: race, sex, age,
level of formal education, general intelligence, and locus
of control. The dependent variables were scores from the
following five scales of the Career Maturity Inventory
Attitude Scale Counseling Form B-1: Decisiveness,
Involvement, Independence, Orientation, and Compromise. The
sample consisted of 83 welfare recipients who were eligible
for the Job Opportunities and Basic Skills (JOBS) program in
a midwestern state. Five composite null hypotheses were
tested at the .05 level of significance employing a three-
way analysis of variance (general linear model). A status
survey factorial design was employed. The following design
was used with each composite null hypothesis:
composite null hypothesis number 1, a 3 X 4 X 2
factorial design;
composite null hypothesis number 2, a 3 X 4 X 3
factorial design;
composite null hypothesis number 3, a 3 X 2 X 3
factorial design;
composite null hypothesis number 4, a 4 X 2 X 3
factorial design; and
composite null hypothesis number 5, a 3 X 2 X 4
factorial design.

35
The results section was organized according to
composite null hypotheses for ease of reference.
Information pertaining to each composite null hypothesis was
presented in a common format for ease of comparison.
It was hypothesized in composite null hypothesis number
1 that the differences among the mean Career Maturity
Inventory - Attitude Scale Counseling Form B-1 scores
according to level of formal education, general
intelligence, and locus of control would not be
statistically significant. Information pertaining to
composite null hypothesis number 1 was presented in Table 1.
The following were cited in Table 1: variables, group
sizes, means, standard deviations, F values, and p levels.

36
Table 1: A Comparison of Mean Career Maturity Inventory
Attitude Scale Counseling Form B-1 Scores for Welfare
Recipients According to Level of Formal Education, General
Intelligence, and Locus of Control Employing a Three-Way
Analysis of Variance
Variable n M*
S F value p level
Formal Education (A)
< H.S. diploma
H.S. diploma/GED
> H.S. diploma
General Intelligence (B)
80 or below
81 to 90
91 to 100
101 to 120
Locus of Control (C)
Internal
External
**Decisiveness
38 5.2 2.02
35 5.0 2.15 0.23 .7984
10 5.6 2.67
16 4.8 1.88
24 4.8 2.40
26 5.6 2.06
17 5.4 2.15
40 5.8 2.18
43 4.6 1.96
Interactions
A X B
A X C
B X C
AXBXC(continued)
4i
1.52 .2169
0.77 .3848
1.59 .1770
2.14 .1260
1.62 .1941
0.91 .4662

Table 1 (continued)
37
Variable n M S F value p level
Involvement
Formal Education (A)
38 8.1 1.73< H.S. diploma
H.S. diploma/GED 35 8.6 1.70 0.90 .4131
> H.S. diploma 10 8.6 1.51
General Intelligence (B)
80 or below 16 7.3 2.47
81 to 90 24 8.3 1.431.42 .2450
91 to 100 26 6.7 1.26
101 to 120 17 9.1 1.27
Locus of Control (C)
Internal 40 8.8 1.323.76 .0571
External 43 8.1 1.93
Interactions
A X B 1.21 .3158
A X C 0.61 .5476
B X C 3.28 .0266
A X B X C 2.80 .0334
(continued)
4 3

38
Table 1 (continued)
Variable n M S 17. value p level
Independence
Formal Education (A)
38 8.8 1.69< H.S. diploma
H.S. diploma/GED 35 8.7 1.38 0.33 .7182
> H.S. diploma 10 8.9 0.99
General Intelligence (B)
80 or below 16 8.4 1.63
81 to 90 24 9.2 1.371.07 .3684
91 to 100 26 8.7 1.61
101 to 120 17 8.8 1.25
Locus of Control (C)
Internal 40 9.0 1.312.37 .1285
External 43 8.6 1.62
Interactions
A X B 0.54 .7461
A X C 0.07 .9344
B X C 2.44 .0727
AXBXC 0.88 .4803
(continued)
4 a

Table 1 (continued)
39
Variable n M S F value p level
Orientation
Formal Education (A)
38 6.2 2.31< H.S. diploma
H.S. diploma/GED 35 6.7 2.17 0.45 .6408
> H.S. diploma 10 7.3 2.45
General Intelligence (B)
80 or below 16 5.6 2.58
81 to 90 24 6.6 1.810.82 .4904
91 to 100 26 7.0 2.51
101 to 120 17 6.6 2.06
Locus of Control (C)
Internal 40 7.1 2.262.86 .0957
External 43 6.0 2.17
Interactions
A X B 1.66 .1573
A X C 0.40 .6690
B X C 1.32 .2763
AXBXC 0.70 .5959
(continued)
,) 0
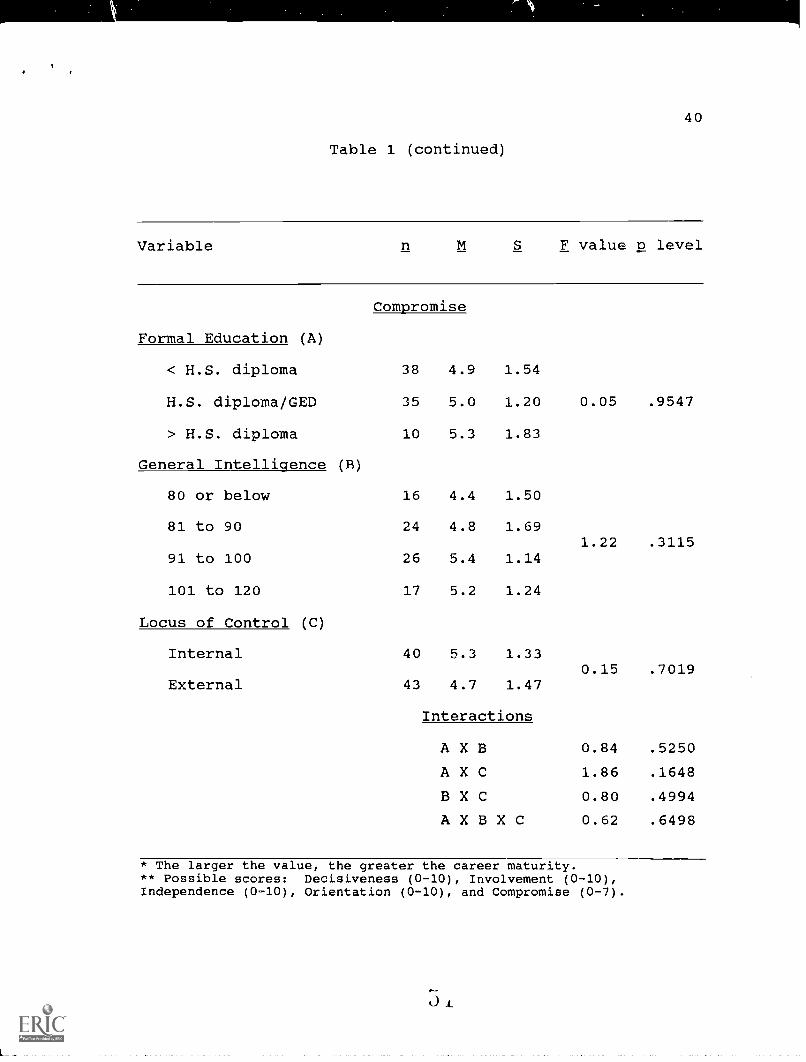
Table 1 (continued)
40
Variable n M S F value p level
Compromise
Formal Education (A)
38 4.9 1.54< H.S. diploma
H.S. diploma/GED 35 5.0 1.20 0.05 .9547
> H.S. diploma 10 5.3 1.83
General Intelligence (R)
80 or below 16 4.4 1.50
81 to 90 24 4.8 1.691.22 .3115
91 to 100 26 5.4 1.14
101 to 120 17 5.2 1.24
Locus of Control (C)
Internal 40 5.3 1.330.15 .7019
External 43 4.7 1.47
Interactions
A X B 0.84 .5250
A X C 1.86 .1648
B X C 0.80 .4994
AXBXC 0.62 .6498
* The larger the value, the greater the career maturity.** Possible scores: Decisiveness (0-10), Involvement (0-10),Independence (0-10), Orientation (0-10), and Compromise (0-7).
:5 4_

41
Two of the 35 p values were statistically significant
at the .05 level; therefore, the null hypotheses for these
comparisons were rejected. The statistically significant
comparisons were for interactions. The following
interactions were statistically significant:
1. the independent variables general intelligence and
locus of control for the dependent variable Involvement, and
2. the independent variables formal education, general
intelligence, and locus of control for the dependent
variable Involvement.
The interaction between the independent variables
general intelligence and locus of control for the dependent
variable Involvement was depicted in a profile plot. Figure
1 contains mean Involvement scores and curves for locus of
control.
5 2

42
Figure 1: The Interaction Between the Independent Variables
General Intelligence and Locus of Control for the Dependent
Variable Involvement
9.5
09.0
0
8.500
a) 8.0>r4
7.5
H7.0
al
6.5
(4)
(13)
80 or below 81 to 90
Locus of ControlInternalExternal-
(6)
I
91 to 100 101 to 120
General Intelligence
The interaction between the independent variables
general intelligence and locus of control for the dependent
variable Involvement was disordinal. The results cited in
Figure 1 indicated the following:
1. individuals with internal locus of control and
general intelligence of 101 to 120 had numerically the
largest mean Involvement scores of any subgroup, and
2. individuals with external locus of control and
general intelligence of 80 or below had numerically the

43
smallest mean Involvement scores of any subgroup.
The interaction among the independent variables formal
education, general intelligence, and locus -4* control for
the dependent variable Involvement was not depicted in a
profile plot. The interaction was not presented in a figure
due to the sample size and the nature of the data.
It was hypothesized in composite null hypothesis number
2 that the differences among the mean Career Maturity
Inventory - Attitude Scale Counseling Form B-1 scores
according to level of formal education, general
intelligence, and age would not be statistically
significant. Information pertaining to composite null
hypothesis number 2 was presented in Table 2. The following
were cited in Table 2: variables, group sizes, means,
standard deviations, F values, and R levels.

44
Table 2: A Comparison of Mean Career Maturity Inventory
Attitude Scale Counseling Form B-1 Scores for Welfare
Recipients According to Level of Formal Education, General
Intelligence, and Age Employing a Three-Way Analysis of
Variance
Variable F value R level
Decisiveness**
Formal Education (A)
(B)
38 5.2 2.02
35 5.0 2.15
10 5.6 2.67
0.17 .8407
< H.S. diploma
H.S. diploma/GED
> H.S. diploma
General Intelligence
80 or below 16 4.8 1.88
81 to 90 24 4.8 2.400.27 .8501
91 to 100 26 5.6 2.06
101 to 120 17 5.4 2.15
Age (D)
33 4.8 2.1718 to 24
25 to 31 32 5.2 2.24 0.36 .7014
32 to 48 18 5.7 1.87
Interactions
A X B 0.65 .6624
A X D 1.94 .1178
B X D 1.06 .3985
AXBXD 0.55 .7666
(continued)

45
Table 2 (continued)
Variable F value p level
Involvement
Formal Education (A)
(B)
38 8.1 1.73
35 8.6 1.70
10 8.6 1.51
0.85 .4348
< H.S. diploma
H.S. diploma/GED
> H.S. diploma
General Intelligence
80 or below 16 7.3 2.47
81 to 90 24 8.3 1.431.28 2901
91 to 100 26 8.7 1.26
101 to 120 17 9.1 1.27
Age (D)
33 8.4 1.7618 to 24
25 to 31 32 8.4 1.44 0.95 .3941
32 to 48 18 8.4 2.03
Interactions
A X B 0.17 .9720
A X D 1.15 .3410
B X D 0.14 .9905
AXBXD 1.38 .2378
(continued)

1
46
Table 2 (continued)
Variable n M S F value p level
Independence
Formal Education (A)
< H.S. diploma 38 8.8 1.69
H.S. diploma/GED 35 8.7 1.38 0.07 .9316
> H.S. diploma 10 8.9 0.99
General Intelligence (B)
80 or below 16 8.4 1.63
81 to 90 24 9.2 1.370.72 .5467
91 to 100 26 8.7 1.61
101 to 120 17 8.8 1.25
Age (D)
18 to 24 33 8.9 1.54
25 to 31 32 8.8 1.52 0.42 .6594
32 to 48 18 8.7 1.36
Interactions
A X B 0.27 .9259
A X D 0.28 .8916
B X D 0.60 .7266
AXBXD 0.74 .6171
(continued)
7

47
Table 2 (continued)
Variable n M S F value p level
Orientation
Formal Education (A)
38 6.2 2.31< H.S. diploma
H.S. diploma 35 6.7 2.17 0.32 .7305
> H.S. diploma 10 7.3 2.45
General Intelligence (B)
80 or below 16 5.6 2.58
81 to 90 24 6.6 1.811.55 .2124
91 to 100 26 7.0 2.51
101 to 120 17 6.6 2.06
Age (D)
33 6.2 2.3318 to 24
25 to 31 32 6.8 2.13 0.09 .9120
32 to 48 18 6.9 2.39
Interactions
A X B 1.79 .1302
A X D 1.60 .1872
B X D 0.90 .4994
AXBXD 1.15 .3488
(continued)

Table 2 (continued)
48
Variable n M S F value p level
Compromise
Formal Education (A)
38 4.9 1.54< H.S. diploma
H.S. diploma/GED 35 5.0 1.20 0.02 .9818
> H.S. diploma 10 5.3 1.83
General Intelligence (B)
80 or below 16 4.4 1.50
81 to 90 24 4.8 1.691.10 .3560
91 to 100 26 5.4 1.14
101 to 120 17 5.2 1.24
Age (D)
33 4.9 1.3518 to 24
25 to 31 32 5.1 1.50 0.25 .7809
31 to 48 18 4.9 1.51
Interactions
A X B 0.50 .7747
A X D 0.84 .5066
B X D 0.32 .9254
AXBXD 0.30 .9343
* The larger the value, the greater the career maturity.** Possible scores: Decisiveness (0-10), Involvement (0-10),Independence (0-10), Orientation (0-10), and Compromise (0-7).
5J

49
None of the 35 p values were statistically significant
at the .05 level; therefore, the null hypotheses for these
comparisons were retained. The results cited in Table 2
indicated no associations between independent and dependent
variables.
It was hypothesized in composite null hypothesis number
3 that the differences among the mean Career Maturity
Inventory - Attitude Scale Counseling Form B-1 scores
according to level of formal education, locus of control,
and age would not be statistically significant. Information
pertaining to composite null hypothesis number 3 was
presented in Table 3. The following were cited in Table 3:
variables, group sizes, means, standard deviations, F
values, and p levels.
G0

50
Table 3: A Comparison of Mean Career Maturity Inventory
Attitude Scale Counseling Form B-1 Scores for Welfare
Recipients According to Level of Formal Education, Locus of
Control, and Age Employing a Three-Way Analysis of Variance
Variable n M" S F value p level
Formal Education (A)
< H.S. diploma
H.S. diploma/GED
> H.S. diploma
Locus of Control (C)
Internal
External
ARg (D)
18 to 24
25 to 31
32 tc 48
Decisiveness
38 5.2 2.02
35 5.0 2.15 0.56 .5744
10 5.6 2.67
40 5.8 2.181.30 .2591
43 4.6 1.96
33 4.8 2.17
32 5.2 2.24 0.12 .8846
18 5.7 1.87
Interactions
A X C 0.72 .4903
A X D 2.61 .0435
C X D 1.31 .2757
AXCXD 1.11 .3501
(continued)
rt)

51
Table 3 (continued)
Variable n M S F value p level
Involvement
Formal Education (A)
< H.S. diploma 38 8.1 1.73
H.S. diploma/GED 35 8.6 1.70 0.50 .6077
> H.S. diploma 10 8.6 1.51
Locus of Control (C)
Internal 40 8.8 1.321.60 .2110
External 43 8.1 1.93
Agg (D)
18 to 24 33 8.4 1.76
25 to 31 32 8.4 1.44 0.68 .5090
32 to 48 18 8.4 2.03
Interactions
A X C 0.07 .9370
A X D 1.38 .2501
C X D 0.01 .9882
AXCXD 0.40 .7566
(continued)

52
Table 3 (continued)
Variable n M S F value p level
Independence
Formal Education (A)
< H.S. diploma 38 8.8 1.69
H.S. diploma/GED 35 8.7 1.38 0.08 .9241
> H.S. diploma 10 8.9 0.99
Locus of Control (C)
Internal 40 9.0 1.310.21 .6459
External 43 8.6 1.62
Age (D)
18 to 24 33 8.9 1.54
25 to 31 32 8.8 1.52 0.61 .5479
32 to 48 18 8.7 1.36
Interactions
A X C 1.19 .3094
A X D 0.15 .9624
C X D 0.22 .8042
AXCXD 0.96 .4151
(continued)
13

53
Table 3 (continued)
Variable F value p level
Orientation
Formal Education (A)
< H.S. diploma 38 6.2 2.31
H.S. diploma/GED 35 6.7 2.17 1.97 .1472
> H.S. diploma 10 7.3 2.45
Locus of Control (C)
Internal 40 7.1 2.262.04 .1577
External 43 6.0 2.17
Age (D)
33 6.2 2.3318 to 24
25 to 31 32 6.8 2.13 0.32 .7253
32 to 48 18 6.9 2.39
Interactions
A X C 0.40 .6693
A X D 1.21 .3144
C X D 0.66 .5180
AXCXD 0.12 .9484
(continued)
4

54
Table 3 (continued)
Variable n M S F value p level
Formal Education (A)
< H.S. diploma
H.S. diploma/GED
> H.S. diploma
Locus of Control (C)
Internal
External
Age (D)
18 to 24
25 to 31
32 to 48
Compromise
38 4.9 1.54
35 5.0 1.20 0.55 .5811
10 5.3 1.83
40 5.3 1.330.17 .6778
43 4.7 1.47
33 4.9 1.35
32 5.1 1.50 0.45 .6372
18 4.9 1.51
Interactions
A X C 1.36 .2625
A X D 1.90 .1202
C X D 0.27 .7632
AXCXD 1.51 .2213
* The larger the value, the greater the career maturity.** Possible scores: Decisiveness (0-10), Involvement (0-10),Independence (0-10), Orientation (0-10), and Compromise (0-7).

55
One of the 35 p values was statistically significant at
the .05 level; therefore, the null hypothesis for this
comparison was rejected. The statistically significant
comparison was for the interaction between independent
variables formal education and age for the dependent
variable Decisiveness.
The interaction between independent variables formal
education and age for the dependent variable Decisiveness
was depicted in a profile plot. Figure 2 contains mean
Decisiveness scores and curves for age.

56
Figure 2: The Interaction Between the Independent Variable
Formal Education and Age for the Dependent Variable
Decisiveness
Q)
P00U)
6.0
a)
5.5
1-1 5.00a)
04.5
04.0
7.5
7.0
6.5
3.5
3.0
Age,
18 -24-25-31=32 -48=
(14)
(2)
< H.S. Diploma H.S. Diploma/GED > H.S. Diploma
Formal Education
The interaction between the independent variables
formal education and age for the dependent variable
Decisiveness was disordinal. The results cited in Figure 2
indicated the following:
1. i_lividuals age 18 to 24 with formal education of
G 7

57
more than a high school diploma had numerically the largest
mean Decisiveness score of any subgroup, and
2. individuals age 32 to 48 with formal education of
more than a high school diploma had numerically the smallest
mean Decisiveness score of any subgroup.
It was hypothesized in composite null hypothesis number
4 that the differences among the mean Career Maturity
Inventory - Attitude Scale Counseling Form B-1 scores
according to level of general intelligence, locus of
control, and age would not be statistically significant.
Information pertaining to composite null hypothesis number 4
was presented in Table 4. The following were cited in Table
4: variables, group sizes, means, standard deviations, F
values, and p levels.
13

58
Table 4: A Comparison of Mean Career Maturity Inventory
Attitude Scale Counseling Form B-1 Scores for Welfare
Recipients According to General Intelligence, Locus of
Control, and Age Employing a Three-Way Analysis of Variance
Variable n M *S F value p level
Decisiveness**
General Intelligence (B)
80 or below 16 4.8 1.88
81 to 90 24 4.8 2.400.64 .5934
91 to 100 26 5.6 2.06
101 to 120 17 5.4 2.15
Locus of Control (C)
Internal 40 5.8 a 2.185.63 .0209
External 43 4.6b
1.96
Age (D)
33 4.8 2.1718 to 24
25 to 31 32 5.2 2.24 0.95 .3939
32 to 48 18 5.7 1.87
Interactions
B X C 0.97 .4128
B X D 1.02 4221C X D 0.76 .4707
BXCXD 0.15 .9796
(continued)
67

59
Table 4 (continued)
Variable F value R level
General Intelligence
80 or below
81 to 90
91 to 100
101 to 120
Locus of Control (C)
Internal
External
Age (D)
18 to 24
25 to 31
32 to 48
Involvement
(B)
16
24
7.3 2.47
8.3 1.431.01 .3964
26 8.7 1.26
17 9.1 1.27
40 8.8 2.182.54 .1160
43 8.1 1.96
33 8.4 1.76
32 8.4 1.44 0.31 .7347
18 8.4 2.03
Interactions
B X C 2.37 .0796
B X D 0.39 .8804
C X D 0.66 .5202
BXCXD 0.39 .8570
(continued)
7

60
Table 4 (continued)
Variable n M S F value p level
Independence
General Intelligence (B)
80 or below 16 8.4 1.63
81 to 90 24 9.2 1.370.69 .5628
91 to 100 26 8.7 1.61
101 to 120 17 8.8 1.25
Locus of Control (C)
Internal 40 9.0 1.311.84 .1800
External 43 8.6 1.62
Age (D)
33 8.9 1.5418 to 24
25 to 31 32 8.8 1.52 0.78 .4618
32 to 48 18 8.7 1.36
Interactions
B X C 2.17 .1009
B X D 0.84 .5411
C X D 0.49 .6162
BXCXD 0.67 .6513
(continued)
7l

Table 4 (continued)
61
Variable n M S F value p level
Orientation
General Intelligence (B)
80 or below 16 5.6 2.58
81 to 90 24 6.6 1.810.85 .4744
91 to 100 26 7.0 2.51
101 to 120 17 6.6 2.06
Locus of Control (C)
Internal 40 7.1a 2.266.67 .0122
External 43 6.01) 2.17
Age (D)
33 6.2 2.3318 to 24
25 to 31 32 6.8 2.13 0.71 .4962
32 to 48 18 6.9 2.39
Interactions
B X C 1.23 .3058
B X D 0.95 .4700
C X D 0.70 .4983
BXCXD 0.42 .8314
(continued)
7:2

62
Table 4 (continued)
Variable F value p level
Compromise
General Intelligence (B)
80 or below 16 4.4 1.50
81 to 90 24 4.8 1.691.07 .3667
91 to 100 26 5.4 1.14
101 to 120 17 5.2 1.24
Locus of Control (C)
Internal 40 5.3 1.333.47 .0676
External 43 4.7 1.47
Age (D)
33 4.9 1.3518 to 24
25 to 31 32 5.1 1.50 0.14 .8668
32 to 48 18 4.9 1.51
Interactions
B X C 0.32 .8134
B X D 0.35 .9059
C X D 0.48 .6194
BXCXD 0.45 .8143
* The larger the value, the greater the career maturity.** Possible scores: Decisiveness (0-10), Involvement (0-10),Independence (0-10), Orientation (0-10), and Compromise (0-7).ab Difference statistically significant at the .05 level according toBonferroni (Dunn) t test for means.
"i 3

63
Two of the 35 p values were statistically significant
at the .05 level; therefore, the null hypotheses for these
comparisons were rejected. The statistically significant
comparisons were for main effects. The following main
effects were statistically significant:
1. the independent variable locus of control for the
dependent variable Decisiveness, and
2. the independent variable locus of control for the
dependent variable Orientation.
The results in Table 4 indicated the following for main
effects:
1. individuals with internal locus of control had a
statistically larger mean Decisiveness score than those with
external locus of control, and
2. individuals with internal locus of control had a
statistically larger mean Orientation score than those with
external locus of control.
It was hypothesized in composite null hypothesis number
5 that the differences among the mean Career Maturity
Inventory - Attitude Scale Counseling Form B-1 scores
according to race, sex, and general intelligence would not
be statistically significant. Information pertaining to
composite null hypothesis number 5 was presented in Table 5.
The following were cited in Table 5: variables, group
sizes, means, standard deviations, F values, and p levels.
71i

64
Table 5: A Comparison of Mean Career Maturity Inventory
Attitude Scale Counseling Form B-1 Scores for Welfare
Recipients According to Race, Sex, and General Intelligence
Employing a Three-Way Analysis of Variance
Variable n M" S F value p level
Decisiveness**
Race (E)
White 53 5.0 2.22
Black 25 5.4 2.08 1.21 .3042
Hispanic 5 5.2 1.79
Sex (F)
Male 24 5.6 2.340.22 .6438
Female 59 5.0 2.05
General Intelligence (B)
80 or below 16 4.8 1.88
81 to 90 24 4.8 2.401.51 .2197
91 to 100 26 5.6 2.06
101 to 120 17 5.4 2.15
Interactions
E X F 0.00 .9947
E X B 0.57 .7244
F X B 0.56 .6412
EXFXB 1.08 .3032
(continued)

65
Table 5 (continued)
Variable F value p level
Involvement
Race (E)
White 53 8.5 1.77
Black 25 8.2 1.55 0.11 .8930
Hispanic 5 7.8 1.48
Sex (F)
Male 24 7.8a
2.019.62 .0028
Female 59 8.7b
2.48
General Intelligence (B)
80 or below 16 7.3a 2.47
81 to 90 24 8.3 1.43
b3.59 .0181
91 to 100 26 8.7 1.26
101 to 120 17 9.1b
1.27
Interactions
E X F 0.08 .7822
E X B 0.96 .4509
F X B 2.15 .1021
EXFXB 0.00 .9840
(continued)

66
Table 5 (continued)
Variable n M S F value p level
Independence
Race (E)
White 53 8.5 1.65
Black 25 8.2 0.86 0.94 .3977
Hispanic 5 7.8 1.52
Sex (F)
Male 24 7.8 1.820.62 .4349
Female 59 8.7 1.31
General Intelligence (B)
80 or below 16 7.3 1.63
81 to 90 24 8.3 1.371.12 .3472
91 to 100 26 8.7 1.61
101 to 120 17 9.1 1.25
Interactions
E X F 0.73 .:.063
E X B 1.16 .3406
F X B 0.85 .4738
E XFXB 5.14 .0268
(continued)

67
Table 5 (continued)
Variable F value R level
Orientation
Race (E)
White 53 6.1 2.25
Black 25 7.6 2.06 1.25 .2929
Hispanic 5 6.6 1.95
Sex (F)
Male 24 6.7 2.321.94 .1686
Female 59 6.5 2.26
General Intelligence (B)
80 or below 16 5.6g 2.58
81 to 90 24 6.6 1.813.80 .0142
91 to 100 26 7.0h
2.51
101 to 120 17 6.6 2.06
Interactions
E X F 3.95 .0511
E X B 0.10 .9926
F X B 2.11 .1075
EXFXB 1.34 .2511
(continued)

68
Table 5 (continued)
Variable F value R level
Compromise
Race (E)
White 53 5.0 1.45
Black 25 5.0 1.50 2.08 .1330
Hispanic 5 4.6 0.89
Sex (F)
Male 24 5.0 1.680.09 .7668
Female 59 5.0 1.33
General Intelligence (B)
80 or below 16 4.4 d 1.50
81 to 90 24 4.8 1.693.70 .0160
91 to 100 26 5.4e 1.14
101 to 120 17 5.2 1.24
Interactions
E X F 1.57 .2153
E X B 0.81 .5479
F X B 2.56 .0623
EXFXB 0.73 .3962
* The larger the value, the greater the career maturity.** Possible scores: Decisiveness (0-10), Involvement (0-10),Independence (0-10), Orientation (0-10), and Compromise (0-7).ab Difference statistically significant at the .05 level according toBonferroni (Dunn) t test for means.gh Difference statistically significant at the .05 level.de Difference statistically significant at the .05 level according toDuncan's multiple-range test for means.

69
Six of the 35 p values were statistically significant
at the .05 level; therefore, the null hypotheses for these
comparisons were rejected. Four of the statistically
significant comparisons were for main effects. The
following main effects were statistically significant:
1. the independent variable sex for the dependent
variable Involvement,
2. the independent variable general intelligence for
the dependent variable Involvement,
3. the independent variable general intelligence for
the dependent variable Orientation, and
4. the independent variable general intelligence for
the dependent variable Compromise.
The results cited in Table 5 indicated the following for
main effects:
1. females had a statistically larger mean Involvement
score than males,
2. individuals with general intelligence of 91 and
greater had a statistically larger mean Involvement score
than those with 90 or below,
3. individuals with general intelligence of 91 to 100
had a statistically larger mean Orientation score than those
with 80 or below, and
4. individuals with general intelligence of 91 to 100
had a statistically larger mea Compromise score than those
with 80 or below.

70
Two of the statistically significant comparisons were
for interactions. The following interactions were
statistically significant:
1. the independent variables race, sex, and general
intelligence for the dependent variable Independence, and
2. the independent variables race and sex for the
dependent variable Orientation.
The interaction among the independent variables race,
sex, and general intelligence for the dependent variable
Independence was not depicted in a profile plot. The
interaction was not presented in a figure due to the sample
size and the nature of the data.
The interaction between the independent variables race
and sex for the dependent variable Orientation was depicted
in a profile plot. Figure 3 contains mean Orientation
scores and curves for sex.

Figure 3: The interaction between Independent Variables
Race and Sex for the Dependent Variable Orientation
SexMale=Female-
8.0
7.5
7.0
6.5
6.0
5.5
5.0
(22),-,...
// ,,/ \ ..../ \ \/ \ \// \ \/ ... \
', 3)
...
(34),
White
(3)
(2)
Black Hispanic
71
Race
The interaction between the independent variables race
and sex for the dependent variable Orientation was
disordinal. The results cited in Figure 3 indicated the
following:
1. Black females had numerically the largest mean
Orientation score of any subgroup,
2. Black males had numerically the smallest mean
Orientation score of any subgroup, and
3. Black females had numerically larger mean
Orientation scores than Black males; and White males had
numerically larger mean Orientation scores than White
females.

72
Discussion
Summary
The purpose of the researcher was to investigate ti,e
career maturity of welfare recipients. The following six
independent variables were investigated: race, sex, age,
level of formal education, general intelligence, and locus
of control. Dependent variables were scores from the
following five scales of the Career Maturity Inventory -
Attitude Scale Counseling Form B-1: Decisiveness,
Involvement, Independence, Orientation, and Compromise. The
sample consisted of 83 welfare recipients who were eligible
for the Job Opportunities and Basic Skills (JOBS) program in
a midwestern state. Five composite null hypotheses were
tested at the .05 level of significance employing a three-
way analysis of variance (general linear model).
A total of 100 comparisons were made plus 75 recurring.
Of the 100 comparisons made, 30 were for main effects and 70
for interactions. Of the 30 main effects, 6 were
statistically significant at the .05 level. The following
main effects were statistically significant:
1. the independent variable locus of control for the
dependent variable Decisiveness,
2. the independent variable locus of control for the
dependent variable Orientation,
3. the independent variable sex for the dependent
variable Involvement,

73
4. the independent variable general intelligence for
the dependent variable Involvement,
5. the independent variable general intelligence for
the dependent variable Orientation, and
6. the independent variable general intelligence for
the dependent variable Compromise.
The results indicated the following for main effects:
1. individuals with internal locus of control had a
statistically larger mean Decisiveness score than those with
external locus of control,
2. individuals with internal locus of control had a
statistically larger mean orientation score than those with
external locus of control,
3. females had a statistically larger mean Involvement
score than males,
4. individuals with general intelligence of 91 and
greater had a statistically larger mean Involvement score
than those with 90 and less,
5. individuals with general intelligence of 91 to 100
had a statistically larger mean Orientation score than those
with 80 or below, and
6. individuals with general intelligence of 91 to 100
had a statistically larger mean Compromise score than those
with 80 or below.
Of the 70 interactions, 5 were statistically
significant at the .05 level. The following interactions
8 4

74
were statistically significant:
1. the independent variables general intelligence and
locus of control for the dependent variable Involvement,
2. the independent variables formal education, general
intelligence, and locus of control for the dependent
variable Involvement,
3. the independent variables formal education and age
for the dependent variable Decisiveness,
4. the independent variables race, sex, and general
intelligence for the dependent variable Independence, and
5. the independent variables race and sex for the
dependent variable Orientation.
Related Literature and the Results of the Present Study
Overall, the results of the studies reviewed indicated
an internal locus of control and a higher general
intelligence to be consistent predictors of career maturity
regardless of race, sex, age, and level of formal education.
In terms of race, sex, age, and level of formal education,
the results were less conclusive.
The results of the present study supported those
reported by Stebbing (1985), Khan and Alvi (1983), Lokan,
Boss, and Patsula (1982), Thomas and Carpenter (1976), and
Gable, Thompson, and Glanstein (1976). The results of these
studies indicated locus of control to be a valid predictor
of career maturity. The present researcher found a
statistically significant association between locus of
U)

75
control and the following three scales of the Career
Maturity Inventory - Attitude Scale Counseling Form B-1:
Decisiveness, Involvement, and Orientation.
Lawrence and Brown (1976) found a positive association
between intelligence and career maturity in their study of
9th, 10th, and 12th grade students. They also reported an
association among intelligence, race, sex, and career
maturity. The results of the present study supported those
of Lawrence and Brown. Subjects of the present study with a
higher general intelligence were found to also have a higher
career maturity on the following scales of the Career
Maturity Inventory - Attitude Scale Counseling Form B-1:
Involvement, Independence, Orientation, and Compromise.
The results of Lawrence and Brown (1976), McNair and
Brown (1983), and Lee (19b4) all indicated Whites as being
more career mature than Blacks. The results of the present
study failed to support the results of those studies
conclusively. The present researcher found Black females
had numerically the highest career maturity on the
Orientation Scale and Black males had numerically the lowest
career maturity. Also on the Orientation Scale, White males
were found to be numerically more career mature than White
females.
Lee (1984) and Herr and Enderlein (1976) reported
females as significantly more career mature than males.
However, Lawrence and Brown (1976) and McNair and Brown

76
(1983) did not report a significant difference between males
and females. The present researcher found that females were
significantly more career mature on the Involvement Scale of
the Career haturity Inventory - Attitude Scale Counseling
Form B 1 than males, thus, supporting the results of Lee,
and Herr and Enderlein.
Herr and Enderlein (1976) studied the career maturity
of 9th, 10th, and 12th grade students and reported that
career maturity increased with grade level, but not without
other influences such as school effects, curriculum choices,
and sex differences. Healy, O'Shea, and Crook (1985)
studied 18 to 30 year old college students and reported a
positive association between age and career maturity. That
is, career attitudes mature with age. The results of the
present study indicated individuals aged 18 to 24 with
formal education of more than a high school diploma had
numerically higher career maturity on the Decisiveness
Scale, thus, supporting the conclusions of Herr and
Enderlein, and Healy, O'Shea, and Crook for this age group.
The present researcher also found adults aged 32 to 48 with
formal education of more than a high school diploma had
numerically the lowest career maturity on the Decisiveness
Scale. Therefore, for this age group, the results of the
present study did not support the findings of Healy, O'Shea,
and Crook that career attitudes mature with age.

77
Generalizations
The results of the present study appeared to support
the following generalizations:
1. individuals with internal locus of control are more
mature in Decisiveness,
2. individuals with internal locus of control are more
mature in Orientation,
3. females are more mature in Involvement than males,
4. individuals with general intelligence (91 to 100)
are more mature in Orientation,
5. individuals with general intelligence (91 to 100)
are more mature in Compromise, and
6. significant interactions for
(a) the independent variables general intelligence
and locus of control for the dependent variable Involvement,
(b) the independent variables formal education,
general intelligence, and locus of control for the dependent
variable Involvement,
(c) the independent variables formal education and
age for the dependent variable Decisiveness,
(d) the independent variables race, sex, and
general intelligence for the dependent variable
Independence, and
(e) the independent variables race and sex for the
dependent variable Orientation.

78
Recommendations
The results of the present study appeared to support
the following recommendations:
1. the study should be replicated with a large random
sample,
2. the study should be replicated in a variety of
geographical areas, and
3. the study should be replicated as longitudinal.

79
References
Amster, J. B., & Lazarus, P. J. (1982). Locus of control
of disadvantaged high school dropouts: Preliminary data.
Perceptual and Motor Skills, 55, 1332-1334.
Bartlett, W. E. (1968). Vocational maturity and
personality variables of manpower trainees. Vocational
Guidance Quarterly, 17, 104-108.
Chisman, F. P., & Woodworth, R. S. (1992). The promise of
JOBS: Policies, programs and possibilities. A Report on
an Investigation of Basic Skills Instruction in the Job
Opportunities and Basic Skills Traiaing Program (JOBS).
Washington, DC: The Southport Institute for Policy
Analysis.
Crites, J. 0. (1965). Measurement of vocational maturity
in adolescence: I. Attitude test of the Vocational
Development Inventory. Psychological Monographs: General
and Applied, 79 (2 Whole No. 595).
Crites, J. 0. (1978a). Career Maturity Inventory
Administration and Use Manual (2nd ed.). Monteray, CA:
CTB/McGraw-Hill.
Crites, J. O. (1978b). Career Maturity Inventory: Theory
and Research Handbook (2nd ed.). Monteray, CA:
CTB/McGraw-Hill.
Cull, J. G., & Hardy, R. E. (1973). The big welfare mess:
Public assistance and rehabilitation approaches.
Springfield, IL: Charles C Thomas.

80
Furstenberg, F. F., Brooks-Gunn, J., & Morgan, S. P.
(1987). Adolescent mothers in later life. Cambridge,
NY: Cambridge University Press.
Gable, R. K., Thompson, D. L., & Glanstein, P. J. (1976).
Perceptions of personal control and conformity of
vocational choice as correlates of vocational
development. Journal of Vocational Behavior, 8, 259-267.
Gladstone, L., & Trimmer, H. W. (1985). Factors predicting
success in training and employment for WIN clients in
southern Nevada. Journal of Employment Counseling, 22,
59-69.
Healy, C. C., O'Shea, D. 0., & Crook, R. H. (1985).
Relation of career attitudes to age and career progress
during college. Journal of Counseling Psychology, 32,
239-244.
Herr, E. L., & Enderlein, T. E. (1976). Vocational
maturity: The effects of school, grade, curriculum and
sex. Journal of Vocational Behavior, 8, 227-238.
Holland, M. (1981). Relationships between vocational
development and self concept in sixth grade students.
Journal of Vocational Behavior, 18, 228-236.
Kansas Department of Human Resources. (December, 1993).
Labor market review. Topeka, KS: Division of Policy &
Management Analysis Labor Market Information Services.
Khan, S. B., & Alvi, S. A. (1983). Educational, social and
psychological correlates of vocational maturity. Journal
9

81
of Vocational Behavior, 22, 357-364.
Lawrence, W., & Brown, D. (1976). An investigation of
intelligence, self-concept, socioeconomic status, race,
and sex as predictors of career maturity. Journal of
Vocational Behavior, 9, 43-52.
Lee, C. C. (1984). Predicting the career choice attitudes
of rural Black, White, and Native American high school
students. Vocational Guidance Quarterly, 32, 177-184.
Lovan, J. J., Boss, M. W., & Patsula, P. J. (1982). A
study of vocational maturity during adolescence and locus
of control. Journal of Vocational Behavior, 20, 331-342.
Luzzo, D. A. (1991). Social class and ethnic differences
in college students' career maturity: A quantitative
and qualitative analysis. A paper presented at the
Annual Meeting of the American Educational Research
Association, Chicago, IL. (ERIC Document Reproduction
Service No. ED 333 152)
Manuele, C. A. (1983). The development of a measure to
assess vocational maturity in adults with delayed career
development. Journal of Vocational Behavior, 23, 45-63.
McMillan, J. H., & Schumacher, S. (1984). Research in
education: A conceptual introduction. Boston, MA:
Little, Brown and Company.
McNair, D., & Brown, D. (1983). Predicting the
occupational aspirations, occupational expectations, and
career maturity of Black and White male and female 10th

82
graders. Vocational Guidance Quarterly, 32, 29-36.
Nightingale, D. S. (1989). Effects of increased emphasis
on education-related activities for welfare recipients.
Washington, DC: The Urban Institute. (ERIC Document
Reproduction Service No. ED 315 524)
Palm, A. J., & Lutz, J. G. (1983). The relationship of
performance on the CMI to intelligence with disadvantaged
youngsters. Measurement and Evaluation in Guidance, 16,
139-148.
Randolph, G. C., II, & McCarthy, K. V. (1991). ADC mothers
reach self sufficiency through comprehensive support and
family development services program. (ERIC Document
Reproduction Service No. ED 343 052)
Rodriguez, M., & Blocher, D. (1988). A comparison of two
approaches to enhancing career maturity in Puerto Rican
college women. Journal of Counseling Psychology, 35,
275-280.
Rolle, G. F., Sr. (1977). Facilitating career development
of minority students. Atlanta, GA: Southern Association
of Colleges and Schools. (ERIC Document Reproduction No.
Ed 189 280)
Rotter, J. B. (1966). Generalized expectancies for
internal versus external control of reinforcement.
Psychological Monographs: General and Applied, 80,
Whole No. 609, p. 1-28.
Sklar, M. H. (1987). Welfare-to-work: Options through job
n3

83
training. Employment and training issues. (ERIC
Document Reproductive Service No. ED 282 039)
Stebbing, M. C. (1985). Human potential: A study of locus
of control, sex, role orientation, and career maturity.
A paper presented at the Annual Meeting of the American
Educational Research Association, 69th, Chicago, IL.
(ERIC Document Reproduction Service No. ED 257 953)
Super, D. E. (1955). Dimensions and measurement of
vocational maturity. Teachers College Record, 57,
151-163.
Super, D. E., Crites, J. O., Hummel, R. C., Moser, H. P.,
Overstreet, P. C., & Warnath, C. F. (1957). Vocational
development: A framework for research. New York:
Teachers College, Columbia University.
Super, D. E., and Kidd, K. M. (1979). Vocational maturity
in adulthood: Toward turning a model into a measure.
Journal of Vocational Behavior, 14, 255-270.
Super, D. E., & Overstreet, P. L. (1960). The vocational
maturity of ninth grade boys. New York: Teachers
College Press.
Thomas, H. B., & Carpenter, J. A. (1976). A developmental
study of the mediating effects of locus of control on
career maturity. A paper presented at the Annual Meeting
of the National Council on Measurement in Education,
San Francisco, CA. (ERIC Document Reproduction Service
No. Ed 134 593)
74

84
U.S. Department of Labor, Employment and Training
Administration, U.S. Employment Service. (1983). Manual
for the USES General Aptitude Test Battery. Section I:
Administration and Scoring (Forms C and D). Salt Lake
City, UT: Utah Department of Employment Security.
U.S. Department of Labor, Manpower Administration. (1979).
Manual for the USES General Aptitude Test Battery.
Section III: Development. Washington, DC: U.S.
Government Printing Office.
West, D. K. (1988). Comparisons of career maturity and its
relationship with academic performance. Journal of
American Indian Education, 27, 1-7.

85
Appendix A
Correlation Coefficients Between Item
and Total Score for the I-E Scale

86
Correlation Coefficients Between Item
and Total Score for the I-E Scale*
Item
Number
1.
2.
3.
4.
5.
6.
7.
8.
9.
10.
11.
12.
13.
14.
15.
16.
17.
18.
19.
20.
Biserial Correlation
Coefficient
(filler)
.260
. 182
.289
. 179
.319
.229
(filler)
. 164
.238
.301
.265
.271
(filler)
.288
.307
. 357
.310
(filler)
.271

21.
22.
23.
.152
.227
.255
24. (filler)
25. .480
26. .195
27. (filler)
28. .238
29. .109
* N=400, 200 males, 200 females
713
87

88
Appendix B
Permission to Utilize Data Generated
from Pre-Orientation Vocational Assessment
Sessions Conducted with Welfare Recipients
Who were Eligible for the JOBS Program

89
February 14, 1994
Phyllis Lewin, DirectorEmployment Preparation ServicesWest Hall, 2nd Floor300 SW OakleyTopeka, KS 6E606
Dear Ms. Lewin:
I am a vocational counselor with the DHR KanWork program inSedgwick County. I am working toward the completion of aMaster of Science degree in Counseling from Fort Hays StateUniversity. A thesis is required for completion of thisprogram. The topic I have chosen is the career maturity ofwelfare recipients.
My plan is to investigate race, sex, age, level of formaleducation, general intelligence (measured by the GeneralAptitude Test Battery), locus of control (measured byRotter's I-E Scale), and career maturity (measured by theCareer Maturity Inventory) of welfare recipients.
Recently I spoke with Linda Sorrell, Director of the SRSKanWork program in Sedgwick County, and gained her supportfor my research project. She has agreed to allow me toconduct pre-orientation vocational assessment sessions whichwould include the testing instruments mentioned above.
All new KanWork clients subject to initial contact in March,1994, will be scheduled for pre-orientation vocationalassessments (group sessions lasting approximately 4 hours).This is not a current practice in Sedgwick County, but hasbeen a long-time goal and will be viewed as a pilot project.In addition, the pre-crientation vocational assessments mayspeed up each client's career choice process. Ifsuccessful, consideration will be given to adopting thisprocedure to the intake process in Sedgwick County accordingto Ms. Sorrell.
Please consider this request to use data from theseassessments for my research thesis. No clients will beidentified by name, and all information will be treated as

90
group data. In addition, a profile will be completed oneach client which will be given to the SRS KanWorkcasemanagers to be used as part of their assessment.
Your immediate reply would be greatly appreciated. Pleasemark the appropriate response below:
Permission is hereby granted to Ms. Carol Beckman touse data collected during the pre-orientationvocational assessment sessions conducted with welfarerecipients in the KanWork program.
Permission is denied.
Please return this request to me in the enclosed envelope assoon as possible. If you have questions, please feel freeto contact me during office hours, 8:00 a.m. to 5:00 p.m. at(316) 266-8611.
Sincerely,
Carol BeckmanKanWork Vocational CounselorDepartment of Human Resources

91
Appendix C
Sample Letter to Subjects

r
92
Dear KanWork Client:
You are about to enter the KanWork program. Before you do,however, you are required to attend a pre-orientationvocational assessment.
This assessment will take approximately four (4) hours. Theresults of your assessment will help you and your KanWorkcasemanager decide upon your plan of action.
It is critical that you attend this assessment. Pleasereport to the Job Service Center, 402 East 2nd Street (2nd &Topeka) at 9:00 a.m. on Monday, March 14, 1994.
Please do not bring children as there are no accommodationsfor their care. If you need assistance with child care ortransportation, please contact the person listed below.
We look forward to seeing you!

93
Appendix D
Verbal Instructions
for Test Administration

94
Verbal Instructions for Test Administration
1. SAY: Thank you for coming to the pre-orientation
vocational assessment. The assessment you complete today
will provide information regarding your academic strengths
and abilities and career decision making skills.
Instructions will be provided to you for each assessment, so
please listen carefully.
2. SAY: The first assessment you will be taking is called
the General Aptitude Test Battery. This assessment will
provide information regarding your academic skills and
abilities, and give an indication of the types of jobs
and/or training you would be able to do easily. It is a
standardized test and because of that, the instructions will
be read verbatim from the manual.
3. The researcher used instructions for the administration
of the GATB - Form D from the Manual for the USES General
Aptitude Test Battery Section I: Administration and Scoring
(U.S. Department of Labor, Employment and Training
Administration, U.S. Employment Service, 1983).
4. The subjects were allowed a 10 minute break after all
of them had finished the GATB. Once all subjects had
returned and were settled, the researcher continued.
5. SAY: Now you will complete the second of the three
assessments This one is not timed. Please write your name
and today's date at the top of the assessment form.

95
6. HAND OUT THE I-E SCALE.
7. The researcher used instructions for the administration
of the I-E Scale taken from Rotter [(1966) Appendix E].
8. After all subjects had finished the I-E Scale, the
copies were collected.
9. SAY: The last assessment is also not timed. When you
finish, please hand it to me and then you may go. The
results of your assessment will be given to your KanWork
casemanager.
10. HAND OUT THE CAREER MATURITY INVENTORY - ATTITUDE SCALE
COUNSELING FORM B-1.
11. The researcher used instructions for the administration
of the Attitude Scale of the Career Maturity Inventory from
the Administration and Use Manual by Crites (1978a).
12. Participants were thanked individually as they handed
in the last .--..essment.
Instruments were handed out in the following order:
1. General Aptitude Test Battery;
2. I-E Scale; and
3. Career Maturity Inventory - Attitude Scale.
Additional items needed for the administration of the
instrument included the following:
1. No. 2 pencils;
2. scratch paper; and
3. a stopwatch.
I (;

96
Appendix E
Instructions for the I-E Scale

97
Instructions for the I-E Scale*
SAY: This is a questionnaire to find out the way in which
certain important events in our society affect different
people. Each item consists of a pair of alternatives
lettered a or b. Please select the one statement of each
pair (and only one) which you more strongly believe to be
the case as far as you're concerned. Be sure to select the
one you actually believe to be more true rather than the one
you think you should choose or the one you would like to be
true. This is a measure of personal belief: obviously
there are no right or wrong answers. ...Please answer these
items carefully but do not spend too much time on any one
item. Be sure to find an answer for every choice. Circle
either a or b on each question for the statement you believe
to be more true. In some instances you may discover that
you believe both statements or neither one. In such cases,
be sure to select the one you more strongly believe to be
the case as far as you're concerned. Also try to respond to
each item independently when making your choice; do not be
influenced by your previous choices.
* Adapted from, Rotter, J. B. (1966). Generalized
expectancies for internal versus external control of
reinforcement. Psychological Monographs: General and
Applied, 80, (1 Whole No. 609)
103