document resume ed 350 798 ec 301 611 … · document resume. ec 301 611. hayden, mary f. ......
TRANSCRIPT

ED 350 798
AUTHORTITLE
INSTITUTION
SPONS AGENCY
PUB DATECONTRACTNOTEAVAILABLE FROM
PUB TYPE
JOURNAL CIT
EDRS PRICEDESCRIPTORS
DOCUMENT RESUME
EC 301 611
Hayden, Mary F.Adults with Mental Retardation and OtherDevelopmental Disabilities Waiting forCommunity -Based Services in the U.S.Minnesota Univ., Minneapolis. Research and TrainingCenter on Residential Services and CommunityLiving.Administration on Developmental Disabilities (DHHS),Washington, D.C.; National Inst. on Disability andRehabilitation Research (ED/OSERS), Washington,DC.
Aug 9290DD145102; H133B89948; H133G202717p.
Institute on Community integration, University ofMinnesota, 109 Pattee Hall, 150 Pillsbury Dr., S.E.,Minneapolis, MN 55455.Collected Works Serials (022) ReportsResearch /Technical (143)Policy Research Brief; v4 n3 Aug 1992
MFO1 /PCO1 Plus Postage.Adults; *Community Programs; *Delivery Systems;*Developmental Disabilities; Government Role; HumanServices; *Mental Retardation; National Surveys;*Needs Assessment; State Agencies; State Government;State Programs
IDENTIFIERS *Waiting Lists
ABSTRACTA survey was conducted of the number and needs of
adults with mental retardation or other developmental disabilities(MR/DD) currently waiting for community services. Survey data wereobtained for 46 states and the District of Columbia. Respondentsincluded directors of state mental retardation/developmentaldisabilities programs, state developmental disabilities planningcouncils, state protection and advocacy agencies, and other agenciesand individuals. Results are analyzed in terms of type of agenciesthat maintain waiting lists (by state), number of people waiting forvarious types of services (by state), characteristics of the waitinglists, and characteristics of people waiting for services. The studyconcluded that: (1) few states gather waiting list information thatcan be useful for planning and for program development; (2) fewstates track who needs services and what type of services are beingsought; (3) many states have written procedures to prioritize servicerequests, but these procedures are typically centered around crisissituations; (4) there are thousands of people waiting for every typeof MR/DD service throughout the country; (5) every state is facedwith growing demands for community-based services; and (7) the mR/DDservice delivery system primarily provides services to people who arecurrently in the system, rather than those who live at home withtheir families. The study identified problems related to identifyingadults waiting for services, and noted issues that states shouldaddress in providing an equal opportunity service system. (Containsapproximately 90 references.) (JDD)

G,0 PolicyResearch Brief
CENTER ONRESIDENTIAL SERVICESAND COMMUNITY LIVINGCOLLEGE OF EDUCATION
U.S. ossimacon. OP EDUCATIONOthc ol Educliohl Flsa,ch ind ImprovementEDUCATIONAL RESOURCES INFORMATION
CENTER (ERIC)
pl<ss Corumnt has been ,e0,00uCed asreceived trom the Demon or organtzationonginating dMinor changes nave been mace to improverecdoduction ()gamy
Points of new o, 00inionS waled ,n this decodiem do not necessarily ,emesent othCiaiOE RI position or policy
UNIVERSITY OP MINNESOTA
Adults with Mental Retardation and Other Developmental DisabilitiesWaiting for Community-Based Services in the U.S.
III Introduction
Adults with mental retardation and other developmentaldisabilities (MR/DD) have a higher likelihood ofexperiencing limitations in major life activities than personswith any other major class of chronic mental, physical, orhealth conditions (La Plante, 1991). They also have thehighest likelihood of needing ongoing, life-long assistancein basic activities of daily living throughout their lives.Consequently, access to long-term care and related supportsfor adults with MR/DD has been a long standing concernamong people with MR/DD, family members, advocates,professionals, and policymakers.
Historically, long-term care and related services wereprimarily provided within large, segregated congregate carefacilities. However, due to legal, social, and philosophicalforces, there has been a dramatic decline in the number ofpeople with MR/DD living in large institutions and anincrease in the number living in community-based housing.Between 1977 and 1990, the number of residents with MR/DD in facilities with 15 or fewer residents increased from40,400 to 149,700, while the number of people in facilitieswith 6 or fewer residents grew from 20,400 to 98,900(Lakin, White, Prouty, Bruininks, & Kimm, 1991).
Today, the vast majority of people with MR/DD live innon-institutional settings. According to the National HealthInterview Survey (La Plante, 1988), there are approximatelytwo million people with developmental disabilities living inthe United States. About 15.6% live in institutional settingsand 84.4% live in non-institutional settings. Of those livingin non-institutional settings, the vast majority live at homewith their families. Consequently, families play asignificant role within the MR/DD service delivery system(Smull, 1989). In fact, families provide more support and
-u services to people with developmental des.' Aides than all ofA , the formal components of the service system, but many are
BEST COPY AVAILABLE 2
doing so without any type of formal assistance from the MR/DD service delivery systems (Lakin & Bruininks, 1985).
Despite the major successes of states imachieving thegoals of deinstitutionalization and the accompanyingdevelopment of a community-based service delivery system,a crisis threatens the community-based program movement.As Smull (1989) points out:
Demands and expectations have risen faster thanfunding. The "slack" in the system that was used tocope with unanticipated problems is gone.Institutions are operating programs at capacity withplans to reduce their census. Many communities havefew vacancies and no plans to expand. For thosewaiting, the practice of offering no support and onlyserving the truly desperate is maintaining a backlogof people in crisis. As the community service system,the institutions, and the "waiting list" all move intomore acute crisis they create a set of =duallyreinforcing pressures (p.2).
Recent studies not only support Smull's assertion thatthere is a growing demand for community-based services,but also that waiting lists have become a common reality forstate agencies. In a 1984 national survey, 22 states reportedthat they had an average of 335 persons waiting for MR/DDday or employment services (McDonnell, Wilcox, & Boles,1986). In a more recent national survey of day andemployment programs for persons with MR/DD, 27 MR/DDagencies reported that they maintain state level informationon the number of individuals who currently need day and/oremployment services but are not receiving these services(McGaughey, Lynch, Morganstern, Kiernan, & Schalock,1991). However, only 22 states were able to supply these
A summary of research on policy issues affecting persons with
developmental disabilities. Published by the Research and
Training Center on Residential Services and Community Living,Instih!te on Community Integration (UAP), Co Hew of Education,
University of Minnesota.

data. For these states, an average of 1,177 people per statewere waiting for day or employment services.
A national survey of state directors of the Associationfor Retarded Citizens (Arc) estimated that over 63,000people were waiting for community residential services,while over 76,000 were waiting for daytime programs(Davis, 1987). Although limitations to the study includedvarying methods of data source identification and datacollection across states, few state respondents believed thatall people in need of community-based residential servicesand day programs had been identified. The authorconcluded that the total number of people reported to bewaiting for services was a substantial underestimate of theunmet service needs of individuals with MR/DD.Furthermore, the Arc study and the later summary of the1990 reports of the State Planning Councils onDevelopmental Disabilities both observed that there are anumber of przzsures inhibiting the nations's capacity toprovide a sufficient supply of community services.
These pressures include the level of federal and statefunding that remain committed to institutional care, despitethe steadily decreasing institution populations and statebudgets that have not increased sufficiently to meet theneeds of people in the community. With respect toproviding community services to people not yet receivingservices, the Arc directors noted pressures that focusattention on people already in the system. For example,many states are under court order or legislative mandate tomove people who live in state-operated institutions tocommunity settings. Furthermore, many states arechallenged to meet the Omnibus Budget RecommendationAct (OBRA-1987) requirements to develop alternativeliving options for many people with MR/DD who live innursing homes.
The effect of these pressures is most evident for threegroups of people: residents of state-operated institutions;persons residing in Medicaid reimbursed nursing facilities;and people living with their families awaiting initial entryinto residential, vocational and/or habilitation servicesettings. For the latter group, the lack of adequateexpansion of the service delivery system is being mostseverely felt by three segments of the population: a) youngadults graduating from special education programs who arewaiting for vocational and habilitation services andcommunity residential services; b) parents of adult childrenwith MR/DD who want their family members to remain athome, but are seeking respite care and other supportservices; and c) elderly parents of adult children who areseeking out-of-home placement and, in addition, vocationaland habilitation services for the first time.
Although the need to move people from institutionalsettings to community residences is an important priority,policymakers are also challenged to .ddress the needs ofgreater numbers of people seeking access to the community-
2
based MR/DD services and programs. The reasons fordoing so are not merely humanitaian. As a recentinteragency report to the Secretary of the U.S. Departmentof Health and Human Services noted:
Even people with the most severe impairments haveno guaranteed access to services after they exitprograms provided through the public schools...Without a greater public commitment tocommunity services, many of these young adultscould end up losing most of the gains made throughspecial education and, in the process, begin a newtrend toward increased institutionalization (AssistantSecretary for Planning and Evaluation, 1988).
For growing numbers of critics, the focus solely onpeople within the system represents abdication of society'sresponsibility to others equally in need. Ironically, the mostserious problems in access to MR/DD programs todayappear to be for families who have kept their adult-childrenat home long beyond the age that most children typicallyleave home. Therefore, it is important for persons withMR/DD, family members, advocates, professionals, andpolicymakers to understand the magnitude of the problemand to identify factors that are causing the growth of waitinglist so that they can take proactive approaches to resolvingthe problem.
Purpose and Method of the Study
In 1990, the Center on Residential Services andCommunity Living at the University of Minnesotaundertook a study was undertaken to identify andsummarize current information and statistics availablewithin states to document the number and needs of personscurrently waiting for community services. Specifically, thesurvey obtained information related to the followingquestions:
By whom are current waiting lists maintained?
How many people with MR/DD are waiting forcommunity-based services?
What are the characteristics of waiting lists?
What are the characteristics of the people who arewaiting for services?
The process of identifying, obtaining, screening, andverifying states' data on persons waiting for services tookplace between March 1, 1990, and June 1, 1992. DuringSpring 1990, 355 letters were mailed to directors of stateMR/DD programs, state developmental disabilities planningcouncils, state protection and advocacy agencies, UniversityAffiliated Programs, and other agencies and individuals
3

potentially having access to or knowledge of statistics onpersons with MR/DD who were waiting for services. Theletters solicited information regarding related reports orstudies that these agencies may have generated thataddressed the four previously mentioned questions andabout individuals that would be important to contactregarding the existence of such documents.
To insure that information was obtained from eachstate, there were five subsequent follow-up mailings topeople who did not respond to the previous mailing(s) orwho were nominated as potentially useful referrals. Thesemailings included a form that asked the respondent toforward any reports and, if they did not have relatedmaterials, to identify the name, address, and telephonenumber of anyone who may have the information. Apostage paid reply envelope was enclosed.
After six mailings, information was obtained from allbut four states (CT, DE, IN, ME) and the District ofColumbia. During April and May of 1991, follow-uptelephone calls were made to each of their MR/DDagencies. Several people were contacted in each state. Atleast one response was obtained from each of these fourstates and the District of Columbia.
There were 149 reports identified and screened. TheMR/DD agencies sent 74 reports, the state planning councilson developmental disabilities sent 71 reports, and stateprotection and advocacy agencies sent 4 reports. Of the 149reports, 44 met the initial criterion for inclusion, which wasthat the report needed to contain information that related toone or more of the study questions. However, there was noreliable information available from 19 states. Therefore,follow-up telephone calls were made to the MR/DD stateagencies of those 19 states from November 1, 1991, throughDecember 20, 1991. Through these telephone calls, the bestavailable estimate of the total number of people waiting forservices was obtained.
The nature and quality of data varied considerably fromstate to state. Some states clearly indicated the type ofservice (e.g., residential, day habilitation, vocational, andrespite), where other states could not. To provide some typeof uniformity and consistency, the following classificationswere developed:
Residential Services: People who requestedcommunity-based residential placements.
Day Programs: People who requested placement inday activity centers, adult day care, and/or adult lifeskills programs.
Vocational Services: People who requested placementin vocational programs, work activity centers, workadjustment programs, sheltered workshops, supportedemployment programs, and/or vocational evaluations orjob placements.
Residential and Vocational Services: People whorequested both residential and vocational services.
Support Services: People who requested individual orfamily support services, adaptive/therapeuticequipment, respite care, and/or personal assistanceservices.
Other Services: People who requested any one of thefollowing services: behavioral intervention, casemanagement, counseling, daily living skills training,dental care, early intervention services, family subsidy,infant and toddler programs, intake assessment, patientservices, recreation and leisure activities, andtransportation.
As the screening process proceeded, the level of detailwithin these documents proved to be inadequate and, as aresult, the initial criterion for inclusion was expanded toassure data were derived from the most current and reliablesource. For example, many reports from stator planningcouncil on develonmental disabilities identified classes ofpeople who were in need of services, but did not provideestimates or the number of people within each class.Therefore, the final decision to include data in this reportwas based on the following rules that were applied in thefollowing hierarchical order:
Report data collected from 1989 through 1992.
Report data from a state MR/DD agency or from thestate data base.
When there were no data available from a state MR/DDagency, report follow-up telephone calls made to state-agency personnel.
When there were no data available from a state MR/DDagency, report data from a state planning council ondevelopmental disabilities.
When there were no data available from a state MR/DDagency or planning council, report data either from astate protection and advocacy agency or frotr a privateconsultant who was employed by the state MR/DDagency to evaluate the MR/DD service delivery system.
When there were no data available from a state MR/DDagency, state planning council on developmentaldisabilities or state protection and advocacy agency,report data from Davis (1987). Data from this studywere collected in 1986. Confirmation of currentreasonableness of the estimate was obtained.
There were numerous occasions where differentnumbers were provided for one type of service orprogram within one state. Report data that appearedmost accurate for each type of service or program wereused. When it was unclear which statistic was mostappropriate, follow-up telephone calls were made.When it was not possible to identify the most
34

appropriate statistic, the more conservative number wasreported.
Once the synthesis of information was completed,letters were mailed to respondents on February 15, 1992, torequest verification of the data and to obtain clarification ifneeded. Respondents were told that if they did not respondto the letter within six weeks, it would be assumed theinformation provided was correct. Thirty-two statesresponded to this final request.
Results
Type of Agencies That Maintain Waiting Lists
As presented in Table 1 (see page 5), 36 states maintainwaiting lists, 9 states do not maintain lists (CA, ID, IL, IA,KY, MI, ND, WV, WY), and 6 states did not clearlyindicate whether or not they maintain lists (AK, DC, GA,OR, RI, VT). Of the 36 states that maintain lists, 8 havemore than one agency collecting information (AL, LA, NJ,OH, TN, UT, VT, WA), 15 have a single state agency (AZ,DE, FL, HI, KS, ME, MD, MA, MT, NE, NM, NY, OK,SD, TX), 6 have a regional or district agency (CO, CT, 1N,MO, NV, NH), 4 have a county agency (MN, PA, SC, WI),and 3 have service providers collect information (AR, MS,NC).
Number of People Waiting for Services
Reported Number. As shown in Table 2 (see pages 6-7),60,876 people were reported to be waiting for residentialservices in 37 states. Another 35,095 persons were reportedto be waiting for day habilitation or vocational servicr-s, in32 states. Four states reported that 6,320 people werewaiting for both residential and vocational services. Therewere 32,902 people reported to be waiting for some type ofsupport services in 18 states, and 14,273 individuals werereported to be waiting for some other type of services in 20states. With 45 states reporting, people with MR/DD wereidentified as waiting for 186,272 separate community-basedservices.
Estimate for Missing Data. Since 6 states did not provideany information, estimates for missing data from these sixstates were desired. A proportional adjustment based on thetotal number of people living in non-reporting states by thetotal number of people in reporting states yielded anestimated additional 39,480 people waiting for services or225,752 people waiting for MRDD services in the UnitedStates.
4
Adjustment for Duplication. To try to estimate the actualnumber of people who are waiting for services, states wereasked if reported numbers were a duplicate count and, if yes,what percentage of the total count would they attribute toduplicate counting. Of 32 states that responded to thequestion, 26 states provided information regarding whetherall or parts of their reported statistics included duplicatecount. Based on these reports it was estimated that 19.5% ofthe reported number of people waiting for services could beattributed to duplicate counting. As a result, the totalnumber of services being waited for by people with MR/DDin the United States was adjusted to 181,835.
Characteristics of the Waiting Lists
Waiting List Tracking System. During the final mailing,states were asked if they had a computerized system tomaintain data related to people who are waiting for services.Of the 26 states that responded to the question, 46.2% saidthey had a fully operational computerized system, 30.8%indicated that they were in the process of developing acomputerized system, and the remaining 23.1% said theirsystem was of computerized.
When asked what type of information is contained intheir waiting lists, 26 states responded. These statesindicated that 20.8% of the respondents said they collectdemographic characteristics of each individnai; 19.8%include the date of entering the system; 18.8% list the typesof programs and/or funding sources for which eachindividual is eligible to receive; 16.6% provide informationrelated to an individual's personal characteristics; 10.9%collect assessment information related to an individual'sneeds, strengths, and limitations; 10.9% indicate if theindividual is receiving complete and appropriate services;and 2.0% provided other information.
When asked what type of services are requested byindividuals, 25 states responded. These states reported that15.6% needed residential services, 14.9% needed adult daytraining and habilitation, 12.3% needed supportedemployment, 11.7% needed supportive living or semi-independent living services, 11.7% needed family supportservices, 11.0% needed respite care, 9.7% neededcompetitive employment, 7.1% needed case management,and 5.8% needed specialized transportation services. Only7.1% of the 25 states stated that they determine if individualsdo not receive complete and appropriate services.
5
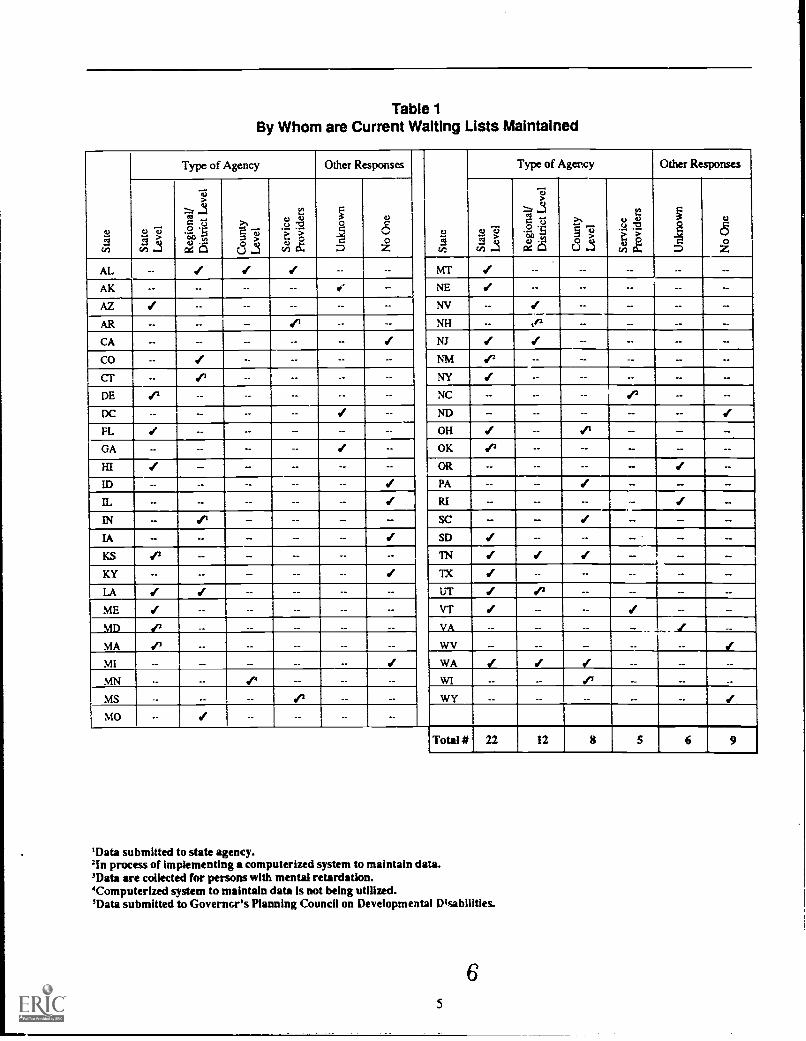
Table 1By Whom are Current Waiting Lists Maintained
Type of Agency Other Responses Type of Agency Other Responses
cn
,SRI
c4 ci
= 15
u a
ea cu
cn
=
D Z
US
RI=2t
. 'E4, nIx C
>sn
AL -- 1 1 1 -- -- MT / -- -- -- -- --
AK-- ._ i ._ NE --AZ-- -. -- NV __ -- --
AR-- -- NH _ if1 -- --
CA -- -- -- -- -- Sf NJ -- -- --
CO -- -- -- -- -- NM 1' -- -- --
CT-- NY --DE-- -- NC -- -- -- --
DC -- -- NI) _ _ --
FL -- -- OH -- --
GA-- -- -- -- OK -- -- -- --HI -- -- OR -- -- -- --
ID-- -- -- -- PA -- --
IL _ -- _ -- RI
IN _ SC IIA -- SD -- --
KS _ TN I _
KY-- -- -- -- -- TX 1 -- -- -- --
LA UT Sf _
ME I -- -- -- -- -- VT -- -- 1 --
MD 17 -- -- -- -- -- VA -- -- -- -- 1 _
MA WV
MI WA
MN -- 4 -- -- WI -- -- -- --
MS -- -- -- WY -- -- -- -- -- Sf
MO -- 1 -- -- -- --
Total # 22 12 8 5 6 9
'Data submitted to state agency.'In processor implementing a computerized system to maintain data.'Data are collected for persons with mental retardation.'Computerized system to maintain data Is not being utilized.'Data submitted to Governor's Planning Council on Developmental Disabilities.
65

Table 2Type of Services People Are Waiting for by State
State (ReferenceNumber')
Type of Services/Supports
TotalDate datawere Residential2
collected
DayHabilitation &/Vocational Services'
Residential&/Vocational"
Support' Other'
AL (6) 6/9/90 1,086 1,325 -- 776 -- 4,018
AK (20) 5/1/90 -- -- -- 517 601' 1.118
AZ(21) 12/11/90 145 416 -- -- 701 1,262
AR (37) 1990 271 272 -- 7 338 888
CA (28)' 3/9/92 -- -- -- -- -- --
CO (41) 11/30/90 1,616 1,202 -- -- 15 2,833
CT (24) 1/1/92 937 453 -- -- -- 1.390
DE (27) 4/1/91 179 24 -- -- -- 203
DC (48) 10/2491 210 52 -- -- -- 262
FL (32) 1/14/91 -- -- -- -- -- 4,673
GA (51) 11/29/89 1,179 -- -- -- -- 1,179
HI (53) 9/30/90 201 277 -- -- -- 478
ID (n/a)' -- -- -- -- -- -- --IL (9) (29) 1986 10,000 1,989 -- -- -- 11,989
IN (42) 4/31/91 2,048 1,096 -- -- -- 3,144
IA (9) 1986 2,000 1,700 -- -- 3,700
KS (39) 1115/91 932 672 -- 156 48 1,808
KY (31) 11/15/91 4,503 3,087 -- -- 807 8,397
LA (45) 4/18/90 0 550 -- 1,400 1,750 3,700
ME (2) 1/91 732 872 -- -- 1 1,605
MD (46) 7/1/91 2.392 2,968 -- 3,917 -- 9,277
MA (25) 2/18/92 1,749 513 265 2.000 -- 4,527
MI (n/a)' -- -- -- -- -- -- --
MN (15)
(16)
1991 560 1,272' -- 340 --
3,1351991 --- -- -- -- 96310
MS (36) 5/31/91 240 -- -- -- 240
MO (3) 1/1/92 1,617 -- -- -- 1.925 3.542
MT (7) 1a7/92 719 852 -- 561 -- 2,132
NE (33) 4/20/90 -- -- -- -- -- 539
NV (4.13,18,22) 11/13/91 116 -- -- -- 171 287
NH (34) 12/91 494 381 -- 104 -- 979
NJ (14) 2/92 3,023 360 -- -- 1,089" 4,472
NM (8) 12/18/91 127 274 -- 172 442 1,015
NY (19) 2/15/92 9,674 5,251 -- 16,007 -- 30,932
NC (38) 1989-90 -- 1,72712 -- -- 300 2.027
ND (30)' 1/15/91 -- -- .- .- -- _OH (49) 10/91 2.719 1,242 -- 535 227 4,723
OK (17) 5/20/91 391 -- -- 486 306" 2,158
6 7

Table 2 (cont'd.)
State (ReferenceNumber')
Date datawere
Type of Services/Supports
TotalResidential2collected
DayHabilitation &IVocational Services'
Residential&/Vocational'
Supports Other6
OR (23) 1987" -- 2,000 4,600 6,600
PA (44) 1990-91 3,995 -- -- -- -- 3.995
RI (12r -- -- -- -- -- -- --
SC (1) 7/17/90 847 441 -- 1.228
SD (5) 7191 -- -- 174's
TN (35) 12/31/91 544 869 -- -- 1,413
TX (43) 1989 -- -- -- -- -- 25,313
UT (52) 12/2191 370 205 207 43 1,262 2,087"
VT (50) 12/91 140 160 -- 72 194 566
VA (11)
(19)
1991 2,100 -- -- -- 4,479
1989 -- 1,130 -- -- 1,249
WA (47) 7/90 1,640 2,208 3,848 -- 7,696
WV (Wa)' -- -- -- -- -- -- --
WI (40) 9/1190 1,380 1,255 -- 1,209 1,884 5,728
WY (26) 1989 -- -- -- -- -- 4,301
TotalReported 60,876 35,095 6,320 32,902 14,273 186,272
'Reference number is the number preceding each entry in the Data Reviewed section.=Residential services include people who requested community-based residential placement.'Day programs include people who requested placement in day activity centers, adult day care, and/or adult life skills programs.
Vocational services include people who requested placement in competitive employment, sheltered workshops, supported employmentprograms, vocational evaluations or job placements, vocational programs, work activity centers, and/or work adjustment programs.
'Residential and vocational services include people who requested both residential and vocational services.'Support services include people who requested individual or family support services, adaptive/therapeutic equipment, respite care,and/or personal assistance services.
'Other services include people who requested any one of the following services: behavioral intervention, case management, cashsubsidies, counseling, daily living skills training, dental care, early intervention services, family subsidy, infant and toddler programs,intake assessment, patient services, recreation and leisure activities, and transportation.
'Alaska indicated that, at a minimum, 250 people in rural areas are not identified or receiving services and 351 people requested servicesand were on the state's waiting list for services.
'Data are unavailable or not collected.'Data was obtained from Davis (1987)."Number of people waiting to receive Title XIX Home and Community-Based Services (HCBS)."Number of people for whom services are presently being sought. They are individuals who are known to the service delivery systembut are not actively seeking services.
''North Carolina indicated that there were 990 people currently unservediunfunded,305 inappropriately served and needing vocationalactivation services, and 432 who can not be served in supported employment because no transportation is available.
"Oklahoma reported 875 people currently receive Title XIX Home and Community-Based Services (HCBS) and 35.% of this grouprequire additional or more complete services.
"Only 29 counties responded to state survey."South Dakota Indicated that 94 people are "truly waiting" for services where 80 people are on the planning list. The planning listincludes people whose needs (e.g., medical conditions or behavioral problems) are such that the community services system cannotserve them. They will wait until the state expands the system.
"Utah indicated that 1,456 people were provided with case management
8
BEST COPY fiAILABLE
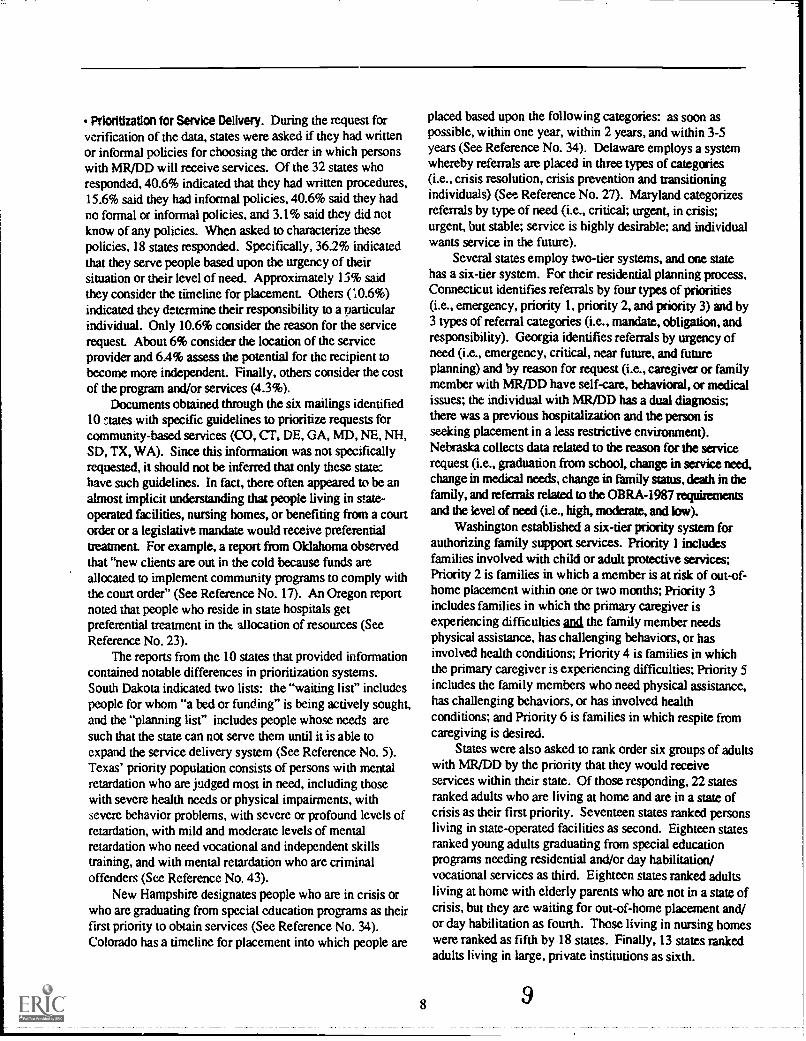
Prioritization for Service Delivery. During the request forverification of the data, states were asked if they had writtenor informal policies for choosing the order in which personswith MR/DD will receive services. Of the 32 states whoresponded, 40.6% indicated that they had written procedures,15.6% said they had informal policies, 40.6% said they hadno formal or informal policies, and 3.1% said they did notknow of any policies. When asked to characterize thesepolicies, 18 states responded. Specifically, 36.2% indicatedthat they serve people based upon the urgency of theirsituation or their level of need. Approximately 13% saidthey consider the timeline for placement. Others ('.0.6%)indicated they determine their responsibility to a particularindividual. Only 10.6% consider the reason for the servicerequest. About 6% consider the location of the serviceprovider and 6A% assess the potential for the recipient tobecome more independent. Finally, others consider the costof the program and/or services (4.3%).
Documents obtained through the six mailings identified10 mtes with specific guidelines to prioritize requests forcommunity-based services (CO, CT, DE, GA, MD, NE, NH,SD, TX, WA). Since this information was not specificallyrequested, it should not be inferred that only these state::have such guidelines. In fact, there often appeared to be analmost implicit understanding that people living in state-operated facilities, nursing homes, or benefiting from a courtorder or a legislative mandate would receive preferentialtreatment. For example, a report from Oklahoma observedthat "new clients are out in the cold because funds areallocated to implement community programs to comply withthe court order" (See Reference No. 17). An Oregon reportnoted that people who reside in state hospitals getpreferential treatment in tilt. allocation of resources (SeeReference No. 23).
The reports from the 10 states that provided informationcontained notable differences in prioritization systems.South Dakota indicated two lists: the "waiting list" includespeople for whom "a bed or funding" is being actively sought,and the "planning list" includes people whose needs aresuch that the state can not serve them until it is able toexpand the service delivery system (See Reference No. 5).Texas' priority population consists of persons with mentalretardation who are judged most in need, including thosewith severe health needs or physical impairments, withsevere behavior problems, with severe or profound levels ofretardation, with mild and moderate levels of mentalretardation who need vocational and independent skillstraining, and with mental retardation who are criminaloffenders (See Reference No. 43).
New Hampshire designates people who are in crisis orwho are graduating from special education programs as theirfirst priority to obtain services (See Reference No. 34).Colorado has a timeline for placement into which people are
8
placed based upon the following categories: as soon aspossible, within one year, within 2 years, and within 3-5years (See Reference No. 34). Delaware employs a systemwhereby referrals are placed in three types of categories(i.e., crisis resolution, crisis prevention and transitioningindividuals) (See Reference No. 27). Maryland categorizesreferrals by type of need (i.e., critical; urgent, in crisis;urgent, but stable; service is highly desirable; and individualwants service in the future).
Several states employ two-tier systems, and one statehas a six-tier system. For their residential planning process,Connecticut identifies referrals by four types of priorities(i.e., emergency, priority 1, priority 2, and priority 3) and by3 types of referral categories (i.e., mandate, obligation, andresponsibility). Georgia identifies referrals by urgency ofneed (i.e., emergency, critical, near future, and futureplanning) and by reason for request (i.e., caregiver or familymember with MR/DD have self-care, behavioral, or medicalissues; the individual with MR/DD has a dual diagnosis;there was a previous hospitalization and the person isseeking placement in a less restrictive environment).Nebraska collects data related to the reason for the servicerequest (i.e., graduation from school, change in service need,change in medical needs, change in family status, death in thefamily, and referrals related to the OBRA-1987 requirememsand the level of need (i.e., high, moderate, and low).
Washington established a six-tier priority system forauthorizing family support services. Priority 1 includesfamilies involved with child or adult protective services;Priority 2 is families in which a member is at risk of out-of-home placement within one or two months; Priority 3includes families in which the primary caregiver isexperiencing difficulties ang the family member needsphysical assistance, has challenging behaviors, or hasinvolved health conditions; Priority 4 is families in whichthe primary caregiver is experiencing difficulties; Priority 5includes the family members who need physical assistance,has challenging behaviors, or has involved healthconditions; and Priority 6 is families in which respite fromcaregiving is desired.
States were also asked to rank order six groups of adultswith MR/DD by the priority that they would receiveservices within their state. Of those responding, 22 statesranked adults who are living at home and are in a state ofcrisis as their first priority. Seventeen states ranked personsliving in state-operated facilities as second. Eighteen statesranked young adults graduating from special educationprograms needing residential and/or day habilitation/vocational services as third. Eighteen states ranked adultsliving at home with elderly parents who are not in a state ofcrisis, but they are waiting for out-of-home placement and/or day habilitation as fourth. Those living in nursing homeswere ranked as fifth by 18 states. Finally, 13 states rankedadults living in large, private institutions as sixth.
9

Characteristics of People Waiting for Services
Information received on the characteristics of personswaiting for services varied across states. Few statesreported much detail on the characteristics of people whowere waiting for services. No state had statistics related toclients' levels of mental retardation, functional limitations,and adaptive or maladaptive behaviors. However, manystates provided statistics related to a class of people thatincluded the number of people living at home, the numberof elderly parents maintaining an adult child at home, andthe number of older adults with MR/DD. Again, becausethese data were not directly requested initially requested, itcainot be assumed that they were not available where notreported.
?lace of Residence. During the final mailing, states wereasked to indicate what groups of people were included in thereported numbers. Of the 31 states who responded, 30.9%were living with their family or in their own homes; 25.5%were living in non-state operated facilities other thannursing homes; 202% were living in state-operamdfacilities other than nursing homes; 19.1% were living innursing homes; and 4.3% were living independently, inother states, in non-certified residences, or in community-based facilities and waiting to be transferred to anotherresidence.
Number of People Living at Home. Seven states providedinformation related to the number of people living with theirfamilies (CA, CO, GA, IN, MD, NH, OH). Californiaexpects an increasing demand for community living optionsfrom people who are living at home and who are aging. Areport by the California Department of DevelopmentalDisabilities (1990) indicated the following:
Between 1983 and 1989, the number of communityclients 22 years of age and older increased by 61percent as compared to a 23 percent increase inclients under 22 years of age. As clients age, theyare less likely to be cared for in their families'homes. Consequently, although only a small portionof children live out-of-home, a large proportion ofadults do. Put in another way, 87 percent ofcommunity clients under the age of 19 now live withtheir families. but only 51 percent of communityclients aged 19 to 49 live with family members.Among community clients aged 50 or older, only 23percent live with their families (See Reference No.28, p. 1-5 ).
Other states provided statistics, such as Ohio whichreported that of 6,035 people waiting for service, 41%currently live with their family (See Reference No. 49).Georgia noted that 44.5% of 1,179 people waiting for
services currently live with family or relative (See ReferenceNo. 51). Of all individuals needing a residential program inColorado (N= 2,442), 56.5% currently live at home (SeeReference No. 41). For adults and children with MR/DDwho live in Indiana and are waiting for services (N=2,290),67.3% are currently living with family members (SeeReference No. 42).
As of July 1, 1989, 3,506 adults were waiting forservices and lived in Maryland (Gold, Bowen, & Smull,1990). Of this number 56.8% lived with patents or relatives(See Reference No. 46). Of surveyed caregivers of adultsover the age of 21 (N=1,028), 53% reported that caring for afamily member was a moderate to severe problem. Ofcaregivers who reported their own health status (N=2,195),about 42% indicated their health was a moderate to severeproblem. Finally, New Hampshire (See Reference 34,Addendum) conveyed the difficulty that many families face:
Persons of this waiting list (adults living at home withfamilies) can change priority need at a moment'snotice, with the death of a parent, or an increase inthe health or behavior needs of the disabled familymember, or a stroke or heart attack afflicting one ofthe parents can require an immediate need foralternative residential services for the person with adevelopmental disability. The waiting list shouldtherefore, be seen as dynamic, with the needs of theindividuals and families changing at any time. Overtime, some of these individuals will become numberone priority clients in their need for residentialservices. (See Addendum p. 1)
Elderly Parents. Four states provided information related topeople with MR/DD who are living with elderly parents(MD, NH, OH, WA). Washington stated that "there are 353clients ... who are 40 years of age or older and are living withparents or relatives. These people will likely need residentialsupport in the future" (References No. 47, p. 36.). NewHampshire reported:
... the daily demands for supervision placed bydevelopmentally disabled persons on their familiestake a tremendous toll on their parents and siblings.Many of these families have been on these waitinglists for several years, including families who felt thatthey would get immediate relief as a result of (a courtorder) in the early 1980's. Typically, these parentsare in their 50's and 60's and still have their son ordaughter living with them, witn many of the familymembers in their 30's or 40's, well past the time when"non-disabled children wou!d have left the familyhom e." (See Reference No. 34, Addendum, p. 1)
For the 3,506 adults over the age of 21 and in need ofservices, Maryland found 37% of the caregivers were over
910

60 years of age, 12% were over 70 years of age, and 1%were over 80 years of age. Moreover, 23% of the agingcaregivers were single caregivers, and 44% were employedoutside the home (See Reference No. 46). Oregon indicatedthat for a sample of 200 people residing in the community,and waiting for vocz Tonal or residential services or both,almost 25% of the persons identified as primary caregiverswere 61 years of age or older.
Older Adults with MR/DD. Five states indicated the numberof elderly people with MR/DD (CO, OH, OR, NY, WA).Colorado found that of 843 adults over 21 years oldrequesting day services, 87.9% are between the ages of 21to 55 years, and 12.1% are 55 years old or older. Of 1,677adults over 21 years old who are in need of residentialservices, 91.2% are 21 to 55 years old and 8.8% are 55 orolder.
Ohio reported that of 6,035 adults over the age of 40waking for services, 22.9% were 40 to 55 years old, 10.5%were 56 to 69 years old, and 2.9% were 70 years old orolder. In a similar analysis, New York found that out of5,673 people waiting for services, 62.9% were 22 to 40years old, 8.8% were 45 to 59 years old, and 2.7% were 60years old or older. Similarly, in an Oregon sample of 238people living in the community who were waiting forservices, 16% were 31 to 40 years old, 10% were 41 to 50years old, 3% were 51 to 60 years old and 1% were 61 to 70years old.
Within the. state of Washington, 76.6% of the 3,033unserved people were 22 to 59 years old and 4.5% were 60years old or older. (See Reference No. 47) A report for theWashington Planning Council on DevelopmentalDisabilities noted:
Increasing life expectancy, efforts to reduce nursinghome placement of people with developmentaldisabilities, and the increasing number of clients 55to 64 years old are all factors which suggest that thepopulation of people with developmental disabilities65 years and older is likely to increase substantiallyby the end of the decade (Reference No. 47, p36).
Young Adult Graduates. Eight states provided informationrelated to the number of people graduating from specialeducation programs (CO, MD, MA, OH, OR, NY, TX, VT).Pasons leaving special education services are a specialconcern for Oregon because, like their counterparts in otherstates, they have no guarantee of gaining entry to the adultservices system. A recent planning document reported:
The number of persons with unmet needs grows everyyear by at least the number of high school specialeducation graduates for whom no adult services areavailable. According to Division staff, this numbertotals as many as 2100 individuals per year. Recent
development of supported employment opportunitiestied specifically to graduating high school studentshas dented this problem, but there are moregraduating students in need than there are committedresources. In light of the state' s considerablein estment in educating students with developmentaldisabilities, it is troubling that the support they needto maintain their gains and continue as productivecitizens is in many cases lacking (See Reference No.23 p. 34).
A report from Massachusetts indicated that it has aprogram named, "Turning 22", for recent school graduates.In 1989, there were 1,200 people in this program. In 1990,Colorado reported that 367 people enrolled in public schoolneeded day services, and 66.2% were between the ages of18 and 20.9 years. Moreover, 344 needed residentialservices, and 58.7% were between the ages of 18 and 20.9years.
Reports from Vermont and New York noted the currentproblems in providing access to community services tostudents "aging out" of educational services. Of the 5,673individuals reported in need of residential services, 15.5%are between the ages of 18 to 21 years and 62.8% arebetween the ages of 22 to 44 years old (See Reference No.19, p. 2).
As of February 1990, Texas had 29,372 persons withmental retardation and 1,091 persons with autism in thepublic school system. Of this group, 1,721 left the systemin 1988-89. A recent Texas state strategic plan noted that"on graduation there are often few, if any, services that helpstudents leaving the public school to continue theirindividual development and that help their integration in thecommunity" (See Reference No. 43, p. 28). The TexasDepartment of Mental Health and Mental Retardationestimated that 632 of these people will be part of the state'spriorip population. Th.. intends to seek specialfunding for 258 people who require intensive services.Another 374 people will require less intensive services, suchas prevocational and vocational services. They furtherstated that, at the same time, transition planning for personswho will leave the public school system will take place for2,814 persons.
10
Discussion
Reliably estimating the number and characteristics ofpeople on waiting lists for services is problematic at best.The study found a series of problems related to identifyingadults with MR/DD who are waiting for needed services andsupports. These problems include:
I1

Less than half of the states have formal data collectionsystems; the remaining states are either in the processof developing a state-wide data collection system, donot have a data collection system, or they may have aninformal system.
States who do have some type of data collection systemcollect data in a variety of ways and typically do notcollect statistics related to demographic or personalcharacteristics.
Few states believe they can accurately identify all of thepeople with service needs.
Eligibility for services is dependent upon whether or notthe state uses the federal definition of developmentaldisability or other functional definitions.
In addition, some state agencies only report numbers ofpeople with a particular developmental disability (e.g.,mental retardation and autism) who are waiting for servicesbut not persons with other types of disabilities (e.g., braintrauma injury, spina bifida). Furthermore, the waiting listsinclude only people who contacted the local or stateauthorities, and, as a result, the numbers do not includepeople who, for one reason or another, did not requestservices. Therefore, the numbers repoted in this study areunderestimates of the true number of people waiting forservices and supports.
Despite these problems, at least six conclusions can bedrawn from the study:
There is a large number of states that maintain waitinglists. However, few states gather information that canbe useful for planning and for finding the means ormethods to serve people who are unserved orunderserved.
Few states track who needs services and what type ofservices are being sought.
Many states have written procedures to prioritizeservice requests, however, these procedures aretypically centered around crisis situations.
There are thousands of people waiting for every type ofMR/DD service throughout the country.
Virtually every state is faced with growing demands forcommunity-based services that will most likelycontinue to increase, rather than decrease, over time..
The MR/DD service delivery system primarily provides:.,:rvices and supports to people who are currently in thesystem, rather than those who live at home with theirfamilies. Persons living at home and in need ofservices and support typically include young adults whorecently graduated from high school, older adults wholive with elderly parents, and elderly people with MR/DD.
Waiting lists for community-based services can be ameaningful tool for planning and policy development.These lists can provide information regarding individuals'ages, levels of mental retadation, functional limitations,adaptive behaviors, presence of challenging behaviors, andother demographic and personal characteristics that canassist policymakers in developing the amounts and types ofservices needed. Waiting lists can serve as a safety valve totake immediate pressure off the system to respond toindividuals who are in need of assistance. However, waitinglists can also become permanent indicators of society'sinability or unwillingness to respond to the need ofindividuals. At their worst, lists are indicators of systemcrisis and failure. This study presents waiting lists as areflection of a service delivery system that is driven bycrisis, underrepresenting those who are in need of servicesand supports, and unable to distinguished what services areneeded or who needs the services and supports.
States that want to provide a system where everyonewith MR/DD has an equal opportunity for services, willneed to address four issues:
12
BEST COPY AVAILABLE
Institution population decline. The federalgovernment continues to support institutions that servea dwindling population at a great expense to taxpayers.Braddock et al. (1990) predicts the U.S. institutionalcensus will drop below 60,000 in the year 2000, yetmore than S6 billion may well be associated with thefinancing of institutional care that year.
Preferential treatment. Recent litigation suggests thatthe federal government will continue to support thepreferential treatment of persons who areinstitutionalized over their counterparts who live athome. The Philadelphia Police and Fire Association forHandicapped Children brought a class action againstthe City of Philadelphia on behalf of persons withmental retardation living at home to challenge theconstitutionality of cuts in services (874 F.2d 169 [3rdcir. 1989]). The Appellate Court found the reduction orelimination of benefits for the class did not violateequal protection or due process. The Court stated:
Philadelphia could have believed that residentswho lost habilitative services and thereforeregressed would be more likely to beinstitutionalized than their counterparts who livewith their families. The families, which alreadyhave demonstrated their devotion to theirretarded children by caring for them at home.might be willing to keep them at home after theyhave regressed. In contrast, the residencesmight not be able to continue to care for suchresidents who, because of their regression, placegreater demands on the residential staff. Thedistrict court characterized the situation as

follows: "fill is as if (Philadelphia and theCommonwealth) seek to capitalize upon the loveand dedication of the families of the classmembers." (Dist.Ci.Op. at 1113, App. 844).Whatever our individual beliefs about thedesirability of such a policy may be, suchreliance on family dedication is not irrationalbecause it may serve to minimizeinstitutionalization.
Financing limits. Federal and state budget deficits andthe recession reduce the likelihood that states will beable to receive additional funding to expand the currentservice delivery systems. Therefore, states need todevelop creative finance strategies to reallocate currentbudgets away from institutional care toward thecommunity-based service system.
Option cost. Many people with MR/DD who live inlarge Intermediate Care Facilities for People withMental Retardation (ICF-MR) can benefit from living inless costly options. Most ICF-MR funding is beingused to finance large, residential living arrangements.Braddock et al. (1990) noted that a 1986 National Studyof Public Expenditures found 87% of ICF/MRreimbursements that year were associated withsupporting placements in large congregate care facilitieswith 16 or more beds.
In addition to these issues, an examination ofconstraints against community service development mustoccur, and strategies to overcome these constraints need tobe identified. State MR/DD directors identified a number ofprivate sector and federal, state, and local governmentconstraints against community-based services and supports(Hemp, Braddock, Bachelder, & Hassen, 1990). Forexample, federal constraints include restrictions, adverseinterpretations, and institutional incentives inherent in thefederal Medicaid program. Additionally, state constraintsinclude insufficient funding, inappropriate or lowreimbursement systems, and funding restrictions andinterpretations.
We need to better understand creative finance strategiesthat will enable governments and the private sector toprovide services and supports to all citizens with MR/DD.A number of strategies that states can employ includeflexible and individualized funding approaches, increasedfamily support services, and improved state governmentcollatoration with communities, local governments andcommunity service pro 'iders. (Hemp, 1992). In addition,we need to examine the methods and procedures for servicedelivery employed by the community-based service deliverysystem.
Conclusion
The service delivery system for persons with MR/DD is at acrossroad. As people in the late 1960's had the foresight topromote the development of community-based services, weare now in the position where we must decide whether ornot we will strive to make the necessary adjustments to thecurrent system to include and support everyone. We caneither continue to avoid confronting the issues raised, or wecan begin to take action. We can continue to serveprimarily people who are currently in the MR/DD servicedelivery system, or we can develop a more inclusive modelfor service delivery. We can continue to fiscally pit peoplewho live in institutional settings against those who live inthe community. If we fail to respond, the current problemswithin the system will take hold and will continue to growuntil the MR/DD system becomes completely unresponsiveto the people it serves. If we choose to take action, wewill need to re-conceptualize how the MR/DD system willdevelop and deliver community programs and, as aresult, will be more likely to attain the system that wasfirst envisioned.
12
II References
Data Reviewed: Sources of Information
(1) Anderson. D.A. (personal communication, correspondence,February 28, 1992). Department of Mental Retardation (DataManagement and Research). Columbia. SC.
(2) Braddick, J. (personal communication, correspondence, April22, 1991). Planning and Advisory Council or. DevelopmentalDisabilities (data was from the Bureau of Mental Retardation).Augusta, ME.
(3) Bright, J. (personal communication correspondence, February,1992). Department of Mental Health (Division of MentalRetardation and Developmental Disabilities). Jefferson City,MO.
(4) Bynum, D. (personal communication, correspondence,January 24, 1991). Department of Human Services (Divisionof Mental Hygiene and Mental Retardation, Northern NevadaMental Retardation Services). Sparks, NV.
(5) Campbell. E. (personal communication. telephoneconversation, November 13, 1991). Department of HumanServices (Division of Developmental Disabilities). Pierre, SD.Data confirmed by response to 2114192 mailing.
3
(6) Campbell. V.A. (personal communication. correspondence.April 17, 1992). Department of Mental Health and MentalRetardation (Applied Research Bureau), University ofAlabama. Tuscaloosa, AL. Data confirmed by 2114192mailing.
(7) Crosbie, D. (personal communication, correspondence.February 28, 1992). Department of Social and RehabilitationServices (Developmental Disabilities Division). Helena. MT.
(8) Dalessandri, T. (personal communication. telephoneconversation. December 2.1991). Department of Health andEnvironment (Division of Developmental Disabilities). SantaFe, NM.
(9) Davis, S. (1987). A National Report on Waiting Lists ofPeople with Mental Retardation for Community Services.Arlington, TX: Association for Retarded Citizens. DataConfirmed by response to 2114192 mailing.
(10) Department of Mental Health, Mental Retardation andSubstance Abuse Services (September, 1989). VirginiaccanrehensiveIgicligmusa,122¢. Richmond. VA:Author.
(11) Department of Mental Health, Mental Retardation andSubstance Abuse Services (1991). Mental RetardationSystem Review: Directions for the Year2. Richmond,VA: Author.
(12) DiMaio, F. (personal communication, telephone conversation.December 3,1991). Department of Mental Health, Met:talRetardation, and Hospitals (Division of RetardationDevelopmental Disabilities). Cranston, R!. Data are notavailable.
(13) Dodd, S. (;ersonal communication, telephone conversation,November 12, 1991). Department of Human Services(Division of Mental Hygiene and Mental Retardation,Southern Nevada Menial Retardation Services). Las Vegas,NV.
(14) Fettweis. P. (personal communication, correspondence,March 30. 1992). Department of Human Services (Divisionof Developmental Disabilities, Program Support Unit-Community Services). Trenton, NJ.
(15) Fields, T. (personal communication, telephone conversation,October 1991). Department of Human Services.Minneapolis, MN. Data confirmed by response to 2/14/92mailing.
(16) Franczyk, I. (personal communication, telephoneconversation, November 14, 1991). Department of HumanServices. St. Paul, MN. Data confirmed by response to 2/14/92 mailing.
(17) Goodell. D. (personal communication, telephoneconversation, May 20, 1991). Department of Human Services(Division of Developmental Disabilities, Community ServicesPrograms). Oklahoma City, OK.
(18) Guidera, S. (personal communication, telephone conversation,November 12, 1991). Department of Human Services(Division of Mental Hygiene and Mental Retardation).Carson City, NV.
(19) Hanky, A. (personal communication. correspondence.February, 1992). State Office of Mental Retardation andDevelopmental Disabilities (Program Research Unit).Albany, NY.
(20) Hoke, T. (personal communication, correspondence, May 1,1990). Department of Health and Social Services (Division ofMental Health and Developmental Disabilities). Anchorage,AK.
(21) Holmes, D. (personal communicadon, correspondence.December 11. 1990). Department of Economic Security(Division of Developmental Disabilities). Phoenix, AZ.
(22) Hosselkus. D. (personal communication, telephoneconversation, November 12, 1991). Department of HumanServices (Division of Mental Hygiene and Mental Retardation,Rural Nevada Mental Retardation Services). Carson City, NV.
(23) Human Services Researen Institute (August. 19140). OregonLong Range Plan for Developmental Disability Services:Commitment to Community. Manmouth, OR: Author.
(24) Johnson, L (personal communication, telephone conversation,March, 1992). Department of Mental Retardation (StrategicPlanning). East Hartford, CT. Data confirmed by response to2/14/92 mailing.
(25) Keilson, J. (personal communication, correspondence, March,1992). Department of Mental Retardation (CommunityPrograms and Operations). Boston, MA. Data confirmed byresponse to 2/14/92 mailing.
(26) Kor, R. (1990). Wyoming: Developmental Disabilities Two-Year Transitional Plan: 1990-91. Governors PlanningCouncil on Developmental Disabilities. Cheyenne, WY.Data confirmed by response to 2114 /92 mailing.
(27) Love, W.E. (personal communication, correspondence, April1, 1991). Department of Health and Social Services (Divisionof Mental Retardation). Dover, DE. Data confirmed byresponse to 2/14 /92 mailing.
(28) Marlowe, R.A. (personal communication, correspondence,March 9. 1992). Department of Developmental Services(Information Systems). Sacramento, CA. Data confirmed byresponse to 2/14/92 mailing.
(29) McIntosh-Wilson, Ersnell. (personal communication.correspondence, March 4, 1992). Department of MentalHealth and Developmental Disabilities. Springfield, IL. Dataconfirmed by response to 2114192 mailing.
(30) Noble, S. (personal communication, telephone conversation.November 12, 1991). Department of Human Services(Division of Developmental Disabilities). Bismarck, ND.
(31) O'Connell, G. (personal communication, telephoneconversation, November 15, 1991). Department of MentalHealth and Mental Retardation (Division of MentalRetardation). Frankfort, KY.
(32) Putnam. C. (personal communication, correspondence, March4, 1992). Department of Health and Rehabilitation Services(Developmental Services). Tallahassee, FL.
13
14

(33) Randall, V. (personal communication, correspondence,January 10, 1991). Department of Public Institution (Officeof Mental Retardation). Lincoln. NE. Data confirmed byresponse to 2/14/92 mailing.
(34) Reed, B. (personal communication, correspondence. March25, 1992). Department of Health and Human Services(Division of Mental Health and Developmental Services).Concord. NH.
(35) Riggall, G. (personal communication, correspondence,February, 1992). Department of Mental Health and MentalRetardation (Division of Mental Retzdation). Nashville, TN.
(36) Romine, L. (personal communication, correspondence, July12, 1991). Department of Mental Health (Bureau of MentalRetardation. Community Mental Retardation Services).Jackson, MS. Data confirmed by response to 2114192mailing.
(37) Routon, J. (personal comnunucation, correspondence, 1990).Department of Social Services (Developmental DisabilitiesServices). Little Rock: AR. Data confirmed by response to 2/14192 mailing.
(38) Sabula, M. (personal communication, memorandum toRegional Directors, July 12, 1990, regarding 1989-90 ADAPProgram Survey and Cost Findings). Department of HumanResources (Division of Mental Health, DevelopmentalDisabilities and Substance Abuse Services). Raleigh. NC.Data confirmed by response to 2114192 mailing.
(39) Sherraden. L.D. (personal communication, correspondence,January 15,1991). Department of Social and RehabilitationServices (Mental Health and Retardation Services). Topeka,KS.
(40) Stanek, S.J. (personal communication, correspondence,February, 1991). Council on Developmental Disabilities.Madison, WI. Data confirmed by response to 2/14/92mailing.
(41) Struxress, L. (personal communication, correspondence,January 3, 1991). Department of Institutions (Division forDevelopmental Disabilities). Denver, CO. Data confirmed byresponse to 2/14/92 mailing.
(42) Swaim, N. (personal communication, correspondence, April31, 1991). Department of Mental Health (Integrated FieldServi -es). Indianapolis, IN.
(43) Texas Department of Mental Health and Mental Retardation(February, 1990). Draft: Strategic Plan - FY 1992-1997.Unpublished manuscript.
(44) Toth, M. (personal communication. Telephone conversation,December 3, 1991). Department of Public Welfare (Office ofMental Retardation). Harrisburg, PA. Data confirmed byresponse to 2/14/92 mailing.
(45) Vincent, J.J. (personal communication, correspondence,February 17, 1992). Department of Health and Hospitals(Office of Human Services, Division of Mental Retardation).Baton Rouge. LA. Data confirmed by response to 2114192mailing.
(46) Wacker. W.T. (personal communication. correspondence,March 18.1992). Department of Health and Mental Hygiene(Developmental D :abilities Administration, Planning andStatistics). Baltimure, MD. Data confirmed by response to 2/14/92 mailing.
(47) Washington Developmental Disabilities Planning Council(January 25, 1991). Analysis of SeleBudgets for the 1991-1993 Biennium. Olympia: Author.Data confirmed by response to 2114192 mailing.
(48) Wells, R. F. (personal communication, correspondence,October 2, 1991). Department of Human Services (MentalRetardation and Developmental Disabilities Administration).District of Columbia.
(49) Wood, D. (personal communication, correspondence, May28,1992). Department of Mental Retardation andDevelopmental Disabilities (Office of Information System).Columbus. OH.
14
(50) Wood, T. (personal communication, correspondence. April,1992). Department of Mental Health and Mental Retardation(Division of Mental Retardation). Waterbury, VT.
(51) Wrensen. G.M. (personal conunumcation, correspondence,February 18, 1991). Department of Human Resources(Division of Mental Health, Mental Retardation. & SubstanceAbuse). Atlanta, GA.
(52) Wynkoop-Green, D. (personal communication,correspondence; February 26,1992). Department of HumanServices (Division for Services for People with Disabilities,Planning and Program Development). Salt Lake City, UT.
(53) Yamane, E. (personal communication, correspondence,December 3, 1990). Department of Health (Division ofDevelopmental Disabilities). Honolulu, HI. Data confirmedby response to 2/14/92 mailing.
Other References
Amado, A.N., Lakin, K.C., Menke. J.M. (1990). 1990 Chaffbook on services for people with developmental disabilities.Minneapolis: University of Minnesota, Center for ResidentialServices and Community Living, Institute on CommunityIntegration (UAP).
Beckman, P.J. (1983). Influence of selected child characteristicson stress in families of handicapped infants. American Journalof Mental Deficiency, aa, 150-156.
Braddock, D. & Fuijiura, G.T. (1989). politics. public policy,and the development of community services in the United States.Chicago: University of Illinois at Chicago, University AffiliatedProgram in the United States.
Braddock, D., Hemp. R., Fujiura, G., Bachelder, L., & Mitchell,D. (1990). The state of the states in developmental disabilities.Baltimore: Paul H. Brookes.
Cohen. S. (1982). Supporting families through respite care.Rehabilitation Literature 41(1-2), 7-11.
15
Cole, D. (1976). Out-of-home placement and family adaptation:A theoretical framework. American Journal of Mentaldeficiency, 1.226 -236.
Davis. S. (1987). A national status report on waiting lists ofpeople with mental retardation for community services.Arlington, TX: Association for Retarded Citizens of the UnitedStates.
Department of Developmental Disabilities (August, 1990) LongRange plan: 1990-95 Sacramento, CA: Office of Planning andPolicy Development.
Gallagher. JJ., Beckman, P., & Cross, A.H. (1983). Families ofhandicapped children: Sources of stress and its amelioration.Exceptional Children. al), 10-19.
Gold, L.C., Bowen, G.E., & Smull, M.W. (1990). 1990 sourcebook; Individuals on the waiting list for services funded by thedevelopmental disabilities administration, Baltimore: Universityof Maryland School of Medicine, Department of Pediatrics(Developmental Disabilities Program: Applied Research andEvaluation Unit).
Halpern, A.S. (1985). Transition: A look at the foundations.ExcosimaLCIaildro. a 479-486.
Hasazi. S.B., Gordon, L.R., & Roe, C.A. (1985). Factorsassociated with employment status of handicapped youth exitinghigh school from 1979 to 1983. EgoptienalChildien, 5_6, 455-469.
Hasazi. S.B., Hasazi, J.E., Gordon, L.R., Hull, M., & Johnson, R.(1989). Employmtait of youth with and without handicapsfollowing high school: Outcomes and correlates. The Journal ofSpecial Education, 2.2.243 -255.
Heller, T. & Factor, A. (In press). Aging family caregivers:Changes in burden and placement desires. American Journal onMental Retardation.
Heller, T. & Factor, A. (1991b). Permanency planning for adultswith mental retardation living with family caregivers. AmericanJournal on Mental Retardation, 26(2), 163-176.
Hemp, R. (1992). State agency and community providerperspectives on financing community services. Policy Researchadd, 4(1).
Hemp, R., Braddock, D., Bachelder, L., & Haasen, K. (1990,April). Creative financing of community services: The stateagency perspective - A working paper (Monograph No. 51).Chicago: Illinois University Affiliated Program inDevelopmental Disabilities, Institute for the Study ofDevelopmental Disabilities and the School of Public Health.
Jaskulski, T., Metzler, L., & Ziennan. S. (1990). The 1990reports: Forging a new era. Washington, DC: NationalAssoc...?in of Developmental Disabilities Councils.
Kiernan, McGaughey, Schalock, Lynch, & McNally (1991,April). National survey of state information sys'ems related today and employment programs. Boston: Training and ResearchInstitute for People with Disabilities. Developmental EvaluationCenter (UAP), and Children's Hospital.
Knoll, J.A. (1990). Family support: A challenge for the 1990's.Exceptional Parent 28-34.
Lakin, K.C. & Bruininks, R.H. (1985). Challenges to advocatesof social integration of developmentally disabled persons. InK.C. Lakin & R.H. Bruininks (Eds.) Strategies for achievingcommunity integration of developmentally disabled citizens.Baltimore: Brookes.
Lakin, K.C.. Bruininks, R.H., & Larson, S. (1991). The changingface of residential services. In L Rowitz (Ed.), Mentalretardation: Year 2000. New York: Springer-Veriag.
Laikin, K.C., Jaskulski, T.M., Hill, B.K., Bruininks, R.H. Menke,J.M., White, C.C., & Wright, E.A. (1989). Medicaid services forRegEoLatiklmeatalierardatima cnnelatedissinsaigng.Minneapolis: University of Minnesota, institute on CommunityIntegration.
Lakin, K.C., Prouty, R.W., White, C.C., Bruininks, R.H., &B.K. (1990). Intermediate Care Facilities for Persons withMental Retardation (ICFs,MR): Program utilizstion and residentcharacteristics. Minneapolis: University of Minnesota, Researchand Training Center for Residential Services and CommunityLiving.
LaPlante, M.P. (1991). Data on disability from the NationeHealth Interview Survey, 1983-1985. Washington, DC: Us.Department of Education.
LaPlante, M.P. (1991). Medical conditions associated withdisability. In I. Fitzgerald & S. Thompson-Hoffman (Eds.),Disability jathrUnitsdSlatst New York: Springer PublishingCo.
McDonnell, J., Wilcox, B., & Boles, S.M. (1986). Do we knowenough to plan for transition? A national survey of state agenciesresponsible for services to persons with severe handicaps. TheJournal of the Association for Persons with Severe Handicaps, U(1), 53-60.
McGaughey, MJ.. Lynch, S.A., Morganstem, D.R., Kiernan,W.E., & Schalock, R.L. (1991, April). A national survey of dayand employment programs for persons with developmentaldisabilities: Results from state MR/DD agenciel. Boston:Training Research Institute for People with Disabilities,Developmental Evaluation Center (UAP) and Children'sHospital.
Seltzer, G.B., Begun, A., Seltzer, M.M., & Krauss, M.W. (1991).Adults with mental retardation and their aging mothers: Impactsof siblings. Family Relations, 40, 310-317.
Seltzer, M. M.. & Krauss. M.W. (1989). Aging parents with adultmentally retarded children: Family risk factors and sources ofsupport. American Journal of Mental Retardation, 24 (3), 303-312.
Seltzer, M. M., Krauss, M.W., & Heller, T. (1990). Boston roundtable on research issues and application in nine andevelopmental disabilities. Boston: Gerontological Society ofAmerica.
Smull, M.W. (1989). Crisis ikthe community. Baltimore:University of Maryland at Baltimore. Department of Pediatrics,School of Medicine (Applied Research and Evaluation Unit).
BEST COPY AVAILABLE 15 16

Tausig, M. (1985). Factors in family decision-making aboutplacement for developmentally disabled individuals. AmericanJournal of Mental Deficiency, a2 (4), 352-361.
Townsend, A., Noelker, L.. Deimling, G., & Bass, D. (1989).Longitudinal impact of inter-household caregiving on adultchildren's mental health. Psychology and Aging, 4, 393-401.
Turnbull, H.R. & Tumbull, A.P. (1989). Report of consensusconference on principles of family research. Lawrence, KS:University of Kansas, Beach Center on Families and Disability.
Turnbull, A.P., Brotherson, M., & Summers, J ( 1985). Theimpact of deinstitutionalization on families: A family systemsapproach. In R.H. Bruininks & K.C. Lakin (Eds). Living andlearning in the least restrictive environment. Baltimore: Paul H.Brookes.
Wikler, L. M. (1986). Family stress theory and research onfamilies of children with mental retardation. In J. J. Gallagher &P. M. Vietze (Eds.), Families of handicapped persons: Researchprograms andsolicy issues (pp. 167-1%). Baltimore: Brooks.
Wolf, M .M.1,1978). Social validity: The case for subjectivemeasurement or how applied behavior analysis is finding itsheart. Jourml of Applied Behavior Analysis, 11, 203-214.
Policy Research Brief August 1992 Vol. 4, No. 3
Policy Research Brief is published by the Researchand Training Center on Residential Services andCommunity Living, Institute on Community Integration(UAP), College of Education, University of Minnesota.This publication was supported, in part, by CooperativeAgreements #H133B89948 and H133G2027 from theNational Institute on Disability and RehabilitationResearch (NIDRR), and Grant #90DD145102 from theAdministration on Developmental Disabilities (ADD).This issue was authored by Mary F..Hayden of theResearch and Training Center on Residential Servicesand Community Living. Managing editor is VickiGaylord. The author would like to acknowledge thecomments and support provided by Charlie Lakin, BobProuty, Paris De Paepe, and Richard Hemp. Theopinions expressed are those of the authors and do notnecessarily reflect the position of NIDRR, ADD, theCenter on Residential Services and Community Living,the Institute on Community Integration, or the College ofEducation.
Additional copies are available through the Instituteon Community Integration, University of Minnesota, 109Pattee Hall, 150 Pillsbury Drive SE, Minneapolis, MN55455 (612) 624-4512.
The University of Minnesota is anequal opportunity employer and educator.
Center on Residential Services and Community LivingInstitute on Community integrationUniversity of Minnesota110 Pattee Hall, 150 Pillsbury Drive SEMinneapolis, MN 55455
17
Non ProfitU.S. Postage
PAID
Minneapolis, UNPermit No.155