document resume ed 118 604
TRANSCRIPT

ED 118 604
AUTHORTITLE
INSTITUTION
SPONS AGENCYREPORT 30PUB DATENOTE
EDRS PRICEDESCRIPTORS
IDENTIFIERS
ABSTRACTThis study empirically investigated the validity and
utility of the stratified adaptive computerized testing modelIstradaptive]deeloped by Weiss (1973). The model presents a tailoredtesting strategy based on Binet IQ measurement theory and Lord's(1972) modern test theory. Nationally normed School and CoilegeAbility Test Verbal analogy items (SCAT-01) were used to construct anitem pool. Item difficulty and discrimination indices were resealedto normal ogive parameters on 249 items. Freshmen volunteers atFlorida State University were randomly assigned to stradaptive orconventional test groups. Both groups were tested viacathode-ray-tube (CRT) terminals coupled to a Control DataCtoration 6500 computer. The conventional tibjects took a SCAT-Nto t, while the stradaptive group took.individually,tAilored testsdrawn from the sate item, pool. Results showed significantly. higherreliability for the stradaptive group, and equivalent.*alidity.indices between stradaptive and conventional groups. Threestradaptive testing strategies averaged 19.2, 26.5, and 31.5 itemsper subject as compared with 48.4 items per conventional subject. A50% reduction from conventional test length produced. an equalprecision of 'measurement. for stradaptive subjects. Item latencycomparisons showed the stradapti e group required significantly
1longer perA.te thap conventions group members. It is recommendedthat time rather then nwmbei of teas be used in future:adalitive
/research as- a dependent variable. (Author/DM ,
************************************************************************ 4:'1 Documents acquired by ERIC include many informal unpublished *
* materials not available Zrom other sources. ERIC makes every effort ** to obtain, the best copy available. Nevertheless, items of marginal *
* reprbducibility are often encountered and this affects the quality *
* of 4e microfiche, and hardcopy reproductions.ERIC makes available *
* via the ERIC Document Reproduction Service (EDRS). EDRS'is not *
* responsible for the quality of the original document. Reproductions ** supplied by-EDRS are the best that can be made from the original. *
***********************************************************************
DOCUMENT RESUME
Waters, Brian K.Empirical Investigation ofModel 'for the MeasurementAir Force Human ResourcesFlying Training Div.Air Force Human ResourcesAPHRL-TR-75 -27Oct 7572p.
TM 005 090::
the Stradaptive Testingof Human Ability.Lab., Williams APB, Ariz.
Lab., Brooks AFB, Texas.
KZ-S0.83 HC-S3.50 Plus Postage*Ability; Branching; Comparative Analysis;-*Compiter,Oriented Programs; Group Tests; IndividualDifferences; Item Analysis; Modelsv Responhe Style(Tests);.Scoring; *Testing; Test, Reliability; *TestValidity; Vern' Ability*Stradaptive Testing
AFHRL-TR-75-27;:,
AIR FORCER
OCOC
¶ I-4
U S DEPARTMENT OF HEALTH.EDUCATIONS WELFARENATIONAL INSTITUTE OF
EDUCATION
THIS DOCUMENT HAS SEEN REPRO-DUCED EXACTLY AS RECEIVED FROM
THE PERSON OR ORGANIZATION ORIGIN?*TING IT POINTS OF VIEW OR OPINIONSSTATED DO NOT NECESSARILY REPRE-SENT OFFICIAL NATIONAL INSTITUTE OFEDUCATION POSITION OR POLICY
t
8
RiES0
EMPIRICAL INVESTIGATION OF THESTRADAPTIVETESTING MODEL FOR THE MEASUREMENT
OF HUMAN ABILITY
By
Brian K. Waters, Major, USAF
FLYING TRAINING DIVISIONWilliams Air Force Base, Arizona 85224
October 1975
Approved for public release; distribution unlimited.
LABORATORY
AIR. FORCE SYSTEMS COMMANDBROOKS MR FORCE BASE,TEXAS 78235
2

L
NOTICE
When US Government drawings, specifications, or other data are used
for any purpose other than a definitely related Government
procurement operation, the Government thereby incurs no
responsibility nor any obligation whatsoever, and the 'fact that the
Government may have formulated, furnished, or in any way supplied
the said drawings, specifications, or other data is not to be-regarded by
implication or otherwise, as in any manner licensing the holder or any
other person or corporation, or conveying any rights or permission to
manufacture, use, or sell any patented invention that may in any way
be related thereto.
This disseration was submitted by Flying Training Division, Air Force
Human Resources Laboratory, Williams Air Force Base, Arizona 85224,
under project 1121, with Hq. Air Force Human Resources Laboratory
(AFSC), Brooks Air Force Base, Texas 78235.
The views expressed are those of the author and do not necessarily
reflect the views of the United States Air Force or the Department of
Defense.
This report has been reviewed and cleared for open publication and/or
public release by the appropriate Office of Information (01) in
accordance with AFR 190-17 and DoDD 5230.9. There is no objection
to unlimited distribution of this report to the public at large, or by
DDC to the National Technical Information Service (NTIS).
This technical report has been reviewed and is approved.
WILLIAM V. HAGIN, Technical Director
Flying Training Division
Approved for publication.
HAROLD E FISCHER, Colonel, USAF
Commander

UnclassifiedSECURITY CLASSIFICATION OF THISPAGE (When Date Entered)
,REPORT DOCUMENTATION PAGE BE
READ INSTRUCTIONSBEFORE COMPLETING FORM
.. REPORT NUMBER
AFHRL-TR-75-27
2. GOVT ACCESSION NO...3. RECIPIENT'S CATALOG NUMBER
4. TITLE (end Subt'tle)
EMPIRICAL INVESTIGATION OF THE STRADAPTNE TESTINGMODEL FOR THE MEASUREMENT OF HUMAN ABILITY .
/7.
5. TYPE OF REPORT & PERIOD COVERED
Dissertation
S. PERFORMING ORG. REPORT 4UM3E4ls
AUTHOR(s)
Brian K. Waters .
S. CONTRACT OR GRANT NUMBER(a)
S. PERFORMING ORGANIZATION NAME AND ADDRESS
Flying Training DivisionAir Force Human Resources LaboratoryWilliams Air Force Base, Arizona 85224
10. PROGRAM ELEMENT. PROJECT, TASKAREA & WORK'UNIT NUMBERS
62703F11210310
II. CONTROLLING OFFICE NAME AND ADDRESS J.Hq Air Force Human Resources Laboratory (AFSC)Brooks Air Force Base, Texas 78235
,
12. REPORT DATEOctober 1975
13. NUMBER OF PAGES70.
14. MONITORING AGENCY NAME 3 ADDRESS(Il different 'from Controlling Office)I . .
IS. SECURITY CLASS. (of this report) -
Unclassified
ISA. DECLASSIFICATION/DOWNGRADINGSCHEDULE
S. DISTRIBUTION STATEMENT (of this Report)
Approved for public release; distribution unlimited.
.#4k
IT. DISTRIBUTION STATEMENT (of the abstra t entered in Block 20, If different from Report)
IS. SUPPLEMENTARY NOTES ,
The views expressed are those of the author and do not necessarily reflect the views of the United States or theDepartment of Defense.
. ..
IS. KEY WORDS (Co Hintwo on reverse side if ncaeary and identify by block number)
adiptive testingtailored testing'program testingcomputer-based testing
20. ABSTRACT (Continue on re Ide If necessary and identify by block number)
This study empirically investigated the validity and utility of the stratified adaptive computerized testingmodel ( stradaptive) developed by Weiss (1973). The model presents a tailored testing strategy based upon Binet IQ
`measurement theory and Lord's (1972) modern test .theory.
Nationally noribed School and College Ability Test Verbal analogy items (SCAT-V) were used to construct anitem pool. Item difficulty and discrimination indicea were rescaled to normal ogive parameters on 249 items.
.One hundred and three freshmen volunteers at Florida State University were randomly assigned to stradaptive
or conventional test grdups. Both groups were tested via cathode-ray-tube (CRT) terminals coupled to a ControlData Corporation 6500 computer..
DD 1 7,2M 1473 EDITION OF I NOV SS IS OBSOLETE UnclassifiedSECURITY CLASSIFICATION OF THIS PAGE (When Data Entered)
UndauntedSECURITY CLASSIFICATION OF THIS P AGE(Whon Data Enterod)
Item 20 (Continued)
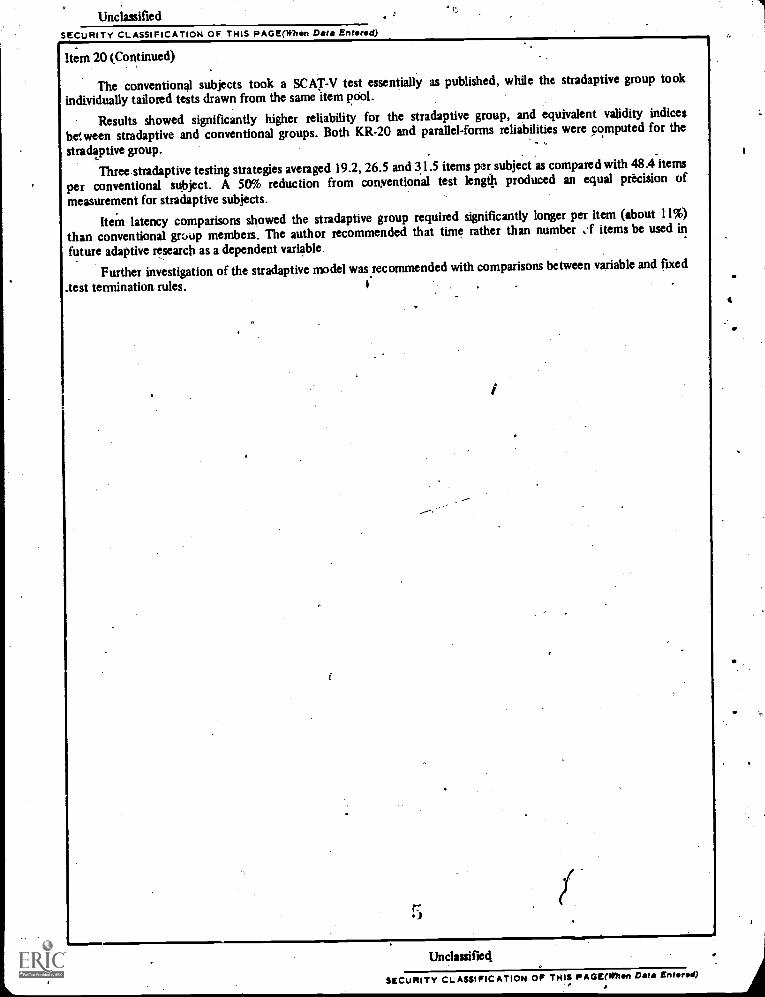
The conventional subjects took a SCAT-V test essentially as published, while the stradaptive group tookindividually tailored tests drawn from the same item pool.
Results showed significantly higher reliability for the stradaptive group, and equivalent validity indices
between stradaptive and conventional groups. Both KR-20 and parallel-forms reliabilities were computed for the
stradaptive group.
Three stradaptive testing strategies averaged 19.2, 26.5 and 31.5 items per subject as compared with 48.4 items
per conventional subject. A 50% reduction from conventional test length produced an equal precision ofmeasurement for stradaptive subjects.
Item latency comparisons showed the stradaptive group required significantly longer per item (about 11%)
than conventional group members. The author recommended that time rather than number .1 items be used in
future adaptive research as a dependent variable.
Further investigation of the stradaptive model was recommended with comparisons between variable and fixed
.test termination rules.
Unclassifiect
SECURITY CLASSIFICATION OF THIS PAGE(Whon Data infanta)

TABLE OF CONTENTS
ParI. Introduction 5
II. Review of Related Research 6
Fixed Number of Stages 10
Constant Step Sizes 10Variable Step Sizes 14
Variable Number of Stages 16
Constant Step Size 16Variable Step SiZes 17Summary of the Literatuib on Adaptive Testing 18
III. The Stradaptive Testing Model 19
The Item Batik 20Item Content and Format 23
Computer Program for Model Implementation 24
Instructional Sequence 24Testing Sequence 24Scoring Methods 25Termination Rules 26Stradaptive Test Output 27
-- IV. Procedures 27
Item Pool ConstructionSubject PoolResearch DesignData CollectionData AnalysisAttitudinal Data
V. Results and Discussion
Linear Test Reliability 34Linear Test Validity 35Stradaptive Pool Item Stratification 35Stradaptive Total-Test Reliability 36Stradaptive Test Validity 38Linear vs. Stradaptive Comparisons 40Omitting Tendency 41Correlation Between Scores of Subjects Who Took Both Stradaptive and linear Tests 41Attitudinal Information 42Testing Costs 42
V. Conclusions and Implications for Future Research 42
References 45
273031313232
33

Table of Contents (Continued)
Appendix A: Item Statistic Comparison 50
Appendix B: Transformation of Traditional Item Difficulty (Pg) and BiserialCorrtlation (ro) to Normal Ogive Parameters b
gand ag . 57
Appendix C: Form Letter 64
Appendix D: Description of Data 66
LIST OF ILLUSTRATIONS
Figure Page1 Adaptive testing research strategies 10
2 Efficiency of measurement as a function of ability level (after Lord, 1970; 1971a, b, c) 11
3 Bayroff's example two stage adaptive test (1964) 12
4 Example of 8step pyramidal adaptive test. (From Bayroff, 1964) 13
S Distribution of items, by difficulty level, in a stradaptive test (from Weiss, 1973) 21
6 Scatterplot of relationship between Ag and Bg 23
7 Entry point question for determining subject ability estimate (from Weiss, 1973) 24
8 Exampleofstradaptive testing report 28
9 Research design for linear versus stradaptive group assignment and comparison 32
LIST OF TABLES
Table1 Alternate Terminology Used to Describe Adaptive Testing Strategies and
Page
Their References 7
2 Classification of Research Studies on Adaptive Testing by Type andBranching Strategy 9
3 Item Difficulties (B) and Discriminations (A), based on Normal Ogive ParameterEstimates, for the Stradaptive Test Item Pool 22
4 Comparison ofSCAT Series II Verbal Forms 1A, 1B, 1C, 2A, & 2B (N = 3,133) 29
5 Descriptive Statistics of Difficulty (bg) and Discrimination (ag) NormalOgive Parameter 30
6 Comparison of Florida 12th Grade Verbal Test Scores (1973 StatewideAdministration vs. Subject Sample) 30
7 Comparison of Distributions of Linear and Stradaptive Group Florida 12thGrade Verbal Scores 31
8 Comparison of Distributions of 5 Linear Subtests 33
9 Distribution of Pooled Linear Test Scores 33
10 Analysis of Variance for Linear Test Person by Item Matrix 34
2
7

List of Tabks (Continued)
11 Comparison of Difficulty Distributions (Pc) for Linear andStradaptive Groups 35
12 Reported Correlations of SCAT-V Score.3 with External Criteria 35
13 Proportion of Items in Each Stratum Actually used in CRTStradaptive Testing (N = 55) 35
14 Analysis of Variance of Scoring Method 8 of Stradaptive TestPerson-by-Itein Matrix 36
15 Comparison of Parallel-Forms Reliabilities for 10 Stradaptive Test ScoringMethods under Three Termination Rules Stepped-Up to 50 Items 37
16 Comparison of Scoring Method 8 Parallel Form Reliability with KR-20 ReliabilityOver Three Termination Rules Stepped Up to 50 Items 38
17 Comparison of Validity Coefficients of 10 Stradaptive Test Scoring MethodsUnder Three Termination Rules 38
18 Effect of the Four Most Reliable Stradaptive Scoring Methods. Correlation with12V, Corrected for Attenuation 39
19 Comparison of Linear Test with Scoring Method 8 Under Three TerminationRules of the Stradaptive Test
20 Comparison of Average Number of Items for Linear Test and Three TerminationMethods of Alternate Form Stradaptive Tests 40
21 Comparison of Distributions of Item Latency Between Linear andStradaptive Groups 41
22 Linear and Stradaptive Scores of Subjects Who Took Both Tests 41
83
EMPI RICAL INVESTIGATION OF THE STRADAPTIVETESTING MODEL FOR THE MEASUREMENT.
OF HUMAN ABILITY
I. INTRODUCTION
This study investigated the validity and utility of the stratified adaptive, "stradaptive" computerizedtesting model proposed by Weiss and his colleagues in the Psychometric Methods Program, University ofMinnesota. The stradaptive model, theoretically, could provide a highly efficient means of assessing ability inlarge-scale testing situations. Such a model could readily be implemented in military training or industrialselection and classification situations._
The model is based upon the early work of Binet in the measurement of intelligence and upon Lord'srecent theoretical research in tailored testing. The model also utilizes modem latent trait theory and parameterestimates as detailed in Lord and Novick (1968).
Weiss and his associates have reported the theoretical development of the stradaptive model (Weiss,1973; DeWitt & Weiss, 1974; McBride & Weiss, 1974) including some examples of individual results. To date,no full empirical studies of the model have been published. Weiss' exploratory evidence appears promising, butleaves many questions unanswered. He suggests ten possible scoring methods, yet offers no evidence as to the"best" method. The evaluation of scoring methods appropriate for tailored testing was one of the secondarygoals of tlis study. The primary goal of this study was the validation of the model itself.
Comp lisons were made between the stradaptive group test scores and conventional group test scores,both presented via a cathode-ray-tube mode of testing. Reliability and validity indices relative to the specificsubject sample used in this experiment were calculated.
The stradaptive model is very sensitive to the accuracy of item parameter estimates. In order to minimizeitem parameter estimation errors, a large norming group is essential. Weiss and his colleagues were well aware ofthis constraint, and have suggested specific procedures for establishing a reliable item pool for adaptive testing(Larkin & Weiss, 1974). Nevertheless, the item pool used in their reported examples of stradaptive testing werebased on item parameter estimates calculated from norming groups of less than 200 subjects. In this currentstudy, items from the School & College Ability Test (SCAT) Series II Verbal Ability test (1966) which hadbeen nationally normed on a group of 3133 examinees comparable to the subjects in this experiment wereused. These items should provide more trustworthy item parameters for use in the investigation of the model.
Determining the merits of a particular testing strategy has been a major problem in previous studies oftailored testing. In any kind of tailored test, different examinees take different test items, thus prohibitingmany classical measurement indices of "goodness." Reliability assessment, particularly, has suffered due tothis problem. Traditional internal consistency calculations are not possible, and procedures such as Hoyt's([941) ANOVA reliability estimate apparently have unacceptable underlying assumptions (such as itemindependence when applied to tailored testing). One goal of this study was to determine an alternate formreliability of the stradaptive test scores and to compare this index with a Hoyt-type reliability index. Thisalternate form reliability index would provide a measure of the "goodness" of the stradaptive model as well asof the ANOVA reliability estimation procedure.
Validity, as well as reliability, must be adequate for a testing strategy to be "good." Eighty-seven of the103 subjects in this experiment had previously taken the Florida 12th Grade Verbal test composed of itemsidentical in form to the SCAT Series II Verbal items and 12 subjects had 12th Grade Verbal score estimatesderived from American College Testing (ACT) or College Entrance Examination Board (CEEB) Verbal Testscores. Both the Florida. 12th Grade test and the SCAT tests were produced by Educational Testing Service(EIS) and purportedly measured the same psychological dimension. Like thb SCAT, the Florida 12th Gradewas normed on a large sample of subjects comparable to the subjects in this experiment. Thus, the 12th Gradescores provided ideal external criteria scores for the stradaptive validity examination.
Item latency data was collected on all subjects in this experiment. Since each item wastailored to theexaminee's ability level, it was hypothesized that examinees on a tailored test would take more time per itemthan on a conventional test. If this hypothesis were supported, the dimension of testing time must beconsidered in evaluating a tailored testing model.
95

f.
11
There is little doubt that the use of interactive computer testing will increase enormously in the comingdecade. Research in this area has just started to reveal some of the potential benefits of tailored testing toinstitutions and indkiduab alike. Improved measurement accuracy and efficiency through the use of somekind of adaptive, computer-based testing, appear to be among these potential benefits. This study empirically.investigated one such proposal, the stradaptive testing model.
IL REVIEW OF RELATED RESEARCH
As the term imeies, adaptive testing is defined as a method of test construction wherein the itemspresented to a specific subject. are selected iteratively dependent upon his previous reiponses, thus "adapting"the test to the subject. Many terms have been used in the literature to refer to such an item selection strategy(Table 1). In this paper, the comprehensive term "adaptive testing" will be used to include any or all of thetesting strategies listed in Table 1.
Adaptive testing had its beginnings in the early work of Binet on the measurement of intelligence. Theoriginal Binet scale and the current version, the 1960 Stanford-Binet Scales (Tennan &Merrill, 1960) utilizedan adaptive strategy to estimate a subject's IQ. The testing begins with the examiner selecting the first item tobe presented, bas.- -d upon his judgment of the subject's ability level. Once testing starts, the examiner maypresent the items in varying orders, based somewhat upon examinee responses. The basal and ceiling ages of thesubject are, estimated in order to.present items which are neither too easy nor too hard for 0tesubject. This isdone through the construction of groups of items whose difficulties are centered around "mental ages," that is,"peaked" tests are formed in which about 50% of the nonning group of that chronological age responded witha correct answer to those items. Thus, the Stanford-Binet can be looked upon as a series of mini-tests designedto provide an efficient measure of the ability of each subject.
Theoretically, individual testing, as the case of the Binet, should provide more accurate measurementthan group testing. Nevertheless, individ testing strategies do have weaknesses. Obviously, the majorproblem is the cost of administration. tests must be administered by a highly-trained examiner workingon a one-to-one basis with the subject. Suc expenditure may be warranted for an individual case basis whensubjects are referred through external eval dons, but are dearly impractical on any large scale.
In addition to the cost deterrent, indlividual testing is plagued by several more technical problems. Weissand Betz (1973) cite numerous research studies suggesting differential examiner effects. Differential scoringeffects were cited, as well as interaction effects between the personality and social attributes.of both examinersand examinees. Thus, the theoretical gains in measurement efficiency attributed to an individual leafingstrategy may well be offset by the added variance in test scores due to uncontrolled factors in the testingprocess.
The paper and pencil mode of item presentation is, of course, the most common testing strategy. Anenormous volume of theoretical and empirical work has been done under the banner of classical measurementtheory. This field has made giant strides through the reduction of measurement error and thus, the improvedutility of the scales. Many practical situations demand that all subjects must take the same collection of testitems, with identical time limits, via the paper and pencil mode of presentation. Nevertheless, it must berealized that certain limitations are inherent in conventional test administration.
Careful training and standardization of group test administrators is intended to control for many of theinadequacies of individual test administration. Research evidence exists which shows that uncontrolledexaminer variables are still present. Weiss and Betz (1973) extensively- discussed five major areas in whichunwanted variance enters the group measurement process:
t; Administrator variables, such as sex or race:
2. Answer sheeteffects, in which answer sheet formats differentially affect test performance:_-
3. Item arrangement effects within a test:
4. Tuning and time limit effects:
5. An effect resulting from'the standa'rdized set of items which is administered to all examinees.
Stanley (197 Iiiiig.gests that the effective length of a test is considerably shorter than the actual lengdi ofthe test for a :peon!' examinee, since many items are too easy and many are too hard. The easy item,
and
610

TABLE 1
Alternate Terminology Used to Describe AdaptiveTesting Strategies and Their References.
TESTING STRATEGY REFERENCES
ADAPTIVE Kappauf, 1969: Wood, 1971: Wood, 1972:Betz & Weiss, 1973: Weise, 1973: Wetss &Betz, 19731 DeWitt & Weiss, 1974: Larkir& Weiss, 1974: McBride.& Weiss, 1974
BAYESIAN Novick, 1969: Owen, 1959, Urry, 1970:Urry, 1971
BRANCHING Waters, 19641 Bayroff, 1969: Waters,1970: Bayroff, 1971: Waters & Bayroff,1971, Bryson, 1971
FLEXILEVEL Lord, 1971b, d: Olivier, 1973:Olivier, 1974
MULTI-LEVEL Angoff & Huddleston, 1958 .
PROGRAMMED Bayroff, 19641 Hubbard, 1966: Bayroff& Seeley, 1967: Cleary, Linn & Rock,1968a,bs Linn, Rock de, Cleary, 1969
RESPONSE-CONTINGENT Wood, 1973.
SEQUENTIAL
TAILORED
CoWden, 1946: Wald, 1946: Moonan, 1950:Krathwohr & Huyser, 1956: Bayroff,Thomas & Anderson, 1960 Paterson, 1Q42:Seeley, Morton & Anderson, 1962:Cronbach & Gleser, 1965: Hansen, 1969:nappauf, 1969: Linn, hock & Cleary,1970: It/Cod, 1971: Wood, 1972
Lord, 1968: Owen, 1969: Owen, 1970,Stocking, 1969: Wood, 1969: Green, 1970:Holtzman, -1970: Lord, 1970: Lord,1971a,c,e: KaliSch, 1974
1.i
7
waste of time and testing costs, while the too hard items encourage guessing and add all the measurementproblems associated with this source of extraneous variance: Tins, a standard set of items, peaked at the meanof the norming group is only truly optimal for a subject of mean ability on the dimension being measured.Consistent with this, information theory research has shown that a test peaked at a difficulty value of .5provides optimum measurement (maximizes internal consistency) for examinees of the subject's ability level(Hick, 1951; Lord, 1970, 1971, 1971a, 1971d, 1971e).
In addition to the previously mentioned problem whetein-the -standard set of items contributes toguessing, another serious problem arises. Many research studies have shown that guessing isnot a consistenttrait throughout the ability continuum (Lord, 1957, 1959; Baker, 1964; Nunnally, 1967;Boldt, 1968). Lowability subjects guess more often than high ability subjects, creating differentialmeasurement accuracy alongthe ability continuum.
The literature implies that both conventional paper and pencil group tests, and traditional, individuallyadministered tests are not always optimally suited to large-scale ability testing. Adaptive testing appears tooffer a feasible and practical alternative to these two modes of test administration. It involves selecting a testitem for presentation based upon the subject's response to the previous itemor items.
The prin'ciple underlying the Binet testing strategye.g., that the difficulty of the test items selected fora given suhject should be peaked around the subject's ability level, not the total group's ability level, is also thebasis of the stradaptive model.
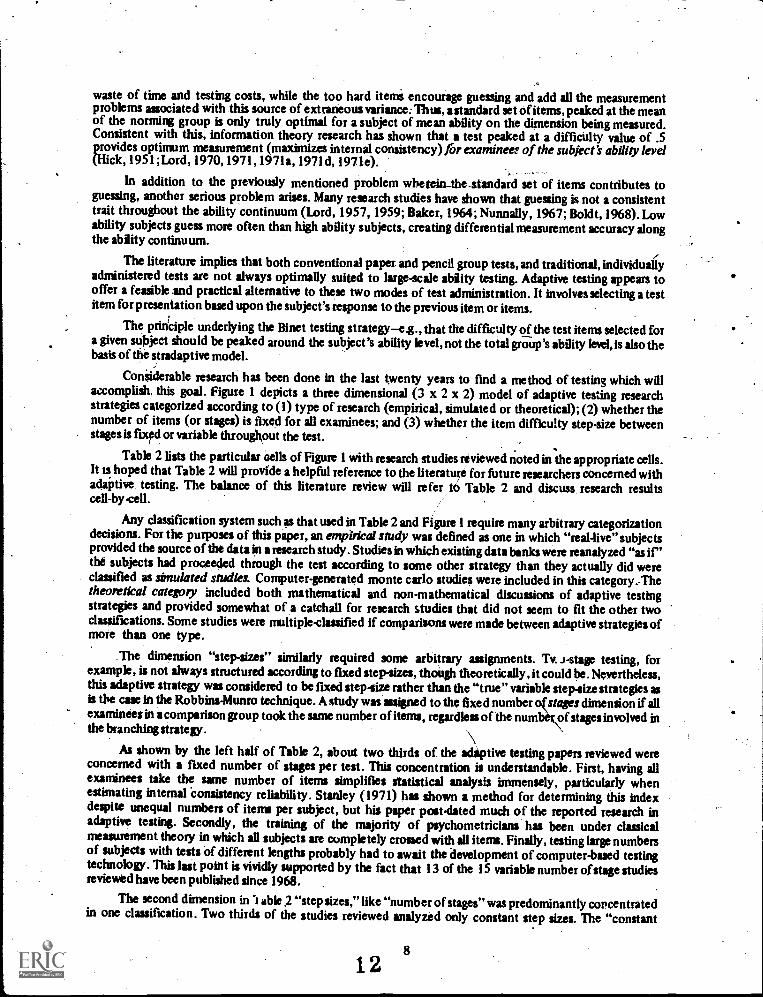
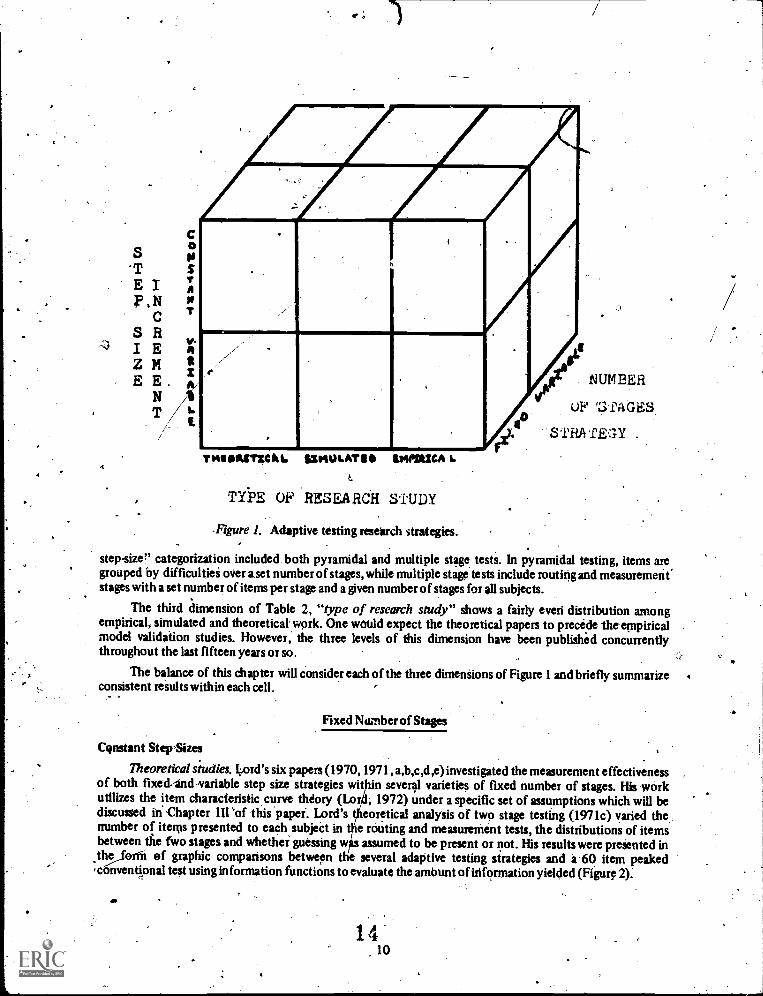
Considerable research has been done in the last twenty years to find a method of testing which willaccomplish, this goal. Figure 1 depicts a three dimensional (3 x 2 x 2) model of adaptive testing researchstrategies categorized according to (1) type of research (empirical, simulated or theoretical); (2) whether thenumber of items (or stages) is fixed for all examinees; and (3) whether the item difficulty step-size betweenstages is fixed or variable throughout the test.
Table 2 lists the particular oells of Figure 1 with research studies reviewed noted in the appropriate cells.It is hoped that Table 2 will provide a helpful reference to the literature for future researchers concerned withadaptive testing. The balance of this literature review will refer to Table 2 and discuss research resultscell-by .cell.
Any classification system such as that used in Table 2 and Figure 1 require many arbitrary categorizationdecisions. For the purposes of this paper, an empirical study was defined as one in which "real-live" subjectsprovided the source of the data in a research study. Studies in which existing data banks were reanalyzed "as if"the subjects had proceeded through the test according to some other strategy than they actually did wereclassified as simulated studies. Computer-generated monte carlo studies were included in this category.- Thetheoretical category included both mathematical and non-mathematical discussions of adaptive testingstrategies and provided somewhat of a catchall for research studies that did not seem to fit the other twoclassifications. Some studies were multiple-classified if comparisonswere made between adaptive strategies ofmore than one type.
The dimension "step-sizes" similarly required some arbitrary assignments. Tv. J-stage testing, forexample, is not always structured according to fixed step-sizes, though theoretically, it could be. Nevertheless,this adaptive strategy was considered to be fixed step-size rather than the "true" variablestep-size strategies asis the case in the Robbins-Munro technique. A study was assigned to the fixed number oJstages dimension if allexaminees in a comparison group took the same number of items, regardless of the numberof stages involved inthe branching strategy.
As shown by the left half of Table 2, about two thirds of the adaptive testingpapers reviewed wereconcerned with a fixed number of stages per test. This concentration is, understandable. First, having allexaminees take the same number of items simplifies statistical analysis immensely, particularly whenestimating internal consistency reliability. Stanley (1971) has shown a method for determining this indexdespite unequal numbers of items per subject, but his paper post-dated much of the reported research inadaptive testing. Secondly, the training of the majority of psychometricians has been under classicalmeasurement theory in which all subjects are completely crossed with all items. Finally, testing large numbersof subjects with tests of different lengths probably had to await the development of computer-based testingtechnology. This last point is vividly supported by the fact that 13 of the 15 variable number of stage studiesreviewed have been published since 1968.
The second dimension in able 2 "step sizes," like "number of stages" was predominantly concentratedin one classification. Two thirds of the studies reviewed analyzed only constant step sizes. The "constant
8
12

TP
0P
R
-
-EARC
S'
UDe,
Y
TABLE2
Classification of Research Studies on AdaptiveTesting by Type and Branching Strategy
BRANCHING STRATEGY
FIXED NUMBER OF STAGES,
VARIABLE NUMBER OP STAGES.
CONSTANTSTEP' SIZES .
VARIABLESTEP SIZES
CONSTANTSTEP SIZES
VARTAFILKSTEP ungs
SIMULATED
Cleary,Linn &Rock (1968a)Cleary,Linn &Rock (1968b)Linn,Rock &Cleary (1970)Waters & Bayroff(1971)
Bryson (1971)Paterson (1962)
Linn,Rock,& Cleary(1970) .
alisch (19741'Urry (1970)Urry (1971) -.
. .
.
T Lord (1970)H Lord (1971a)g Lord (1971b)0 Lord (1971c)R Lord (1971d)E Lo7d (1971e)TIC.AL _
Lord (1970)Lord (1971a)Lord (1971c)Stocking (1969)
Green (1970) ,
Kappauf (1969) .Cronbach leGleser(1965).Wald (1946)Weiss (1973)
NotAck J1969)Owen 11969)Owen (1970)
,
,
-
Angoff & Huddlestop (1958)Bayroff,(1964)
I
Bayroff & Seeley(1967):Betz & Weiss
' (1973)I Hansen (1969)f Larkin & Weiss
(1974)Krathwohl &
C Ruyser (1956)Olivier (1974)Wood (1971)
L
.
Bayrtiff, Thomas AAnderson (1960)Brysonf(1971)Seeley, Morton &Anderson (1962)
.
,
. .
Ferguson. (10491Ferguson (1971)Wood (1971)
.
.
,
.'.
9
4
S'TE
, NC
S RE
Z ML E .
NT
C0
a
R.
;
111040LATIIII IMPALICA 1.
TYPE OF RESEARCH STUDY
-Figure 1. Adaptive testing research .strategies.
0
NUMBER
OF '3 DiGES
S TRA fESY .
step-size" categorization included both pyramidal and multiple stage tests. In pyramidal testing, items aregrouped by difficultiei over a set number of stages, while multiple stage tests include routing and measurement'stages with a set number of items per stage and a given number of stages for all subjects.
The third dimension of Table 2, "type of research study" shows a fairly evert distribution amongempirical, simulated and theoreticatwprk. One would expect the theoretical papers to precede the empiricalmodel validation studies. However, the three levels of this dimension have been published concurrentlythroughout the last fifteen years or so.
The balance of this chapter will consider each of the three dimentions of Figure 1 and briefly summarize .consistent results within each cell.
Fixed Number of Stages
Constant Step-Sizes
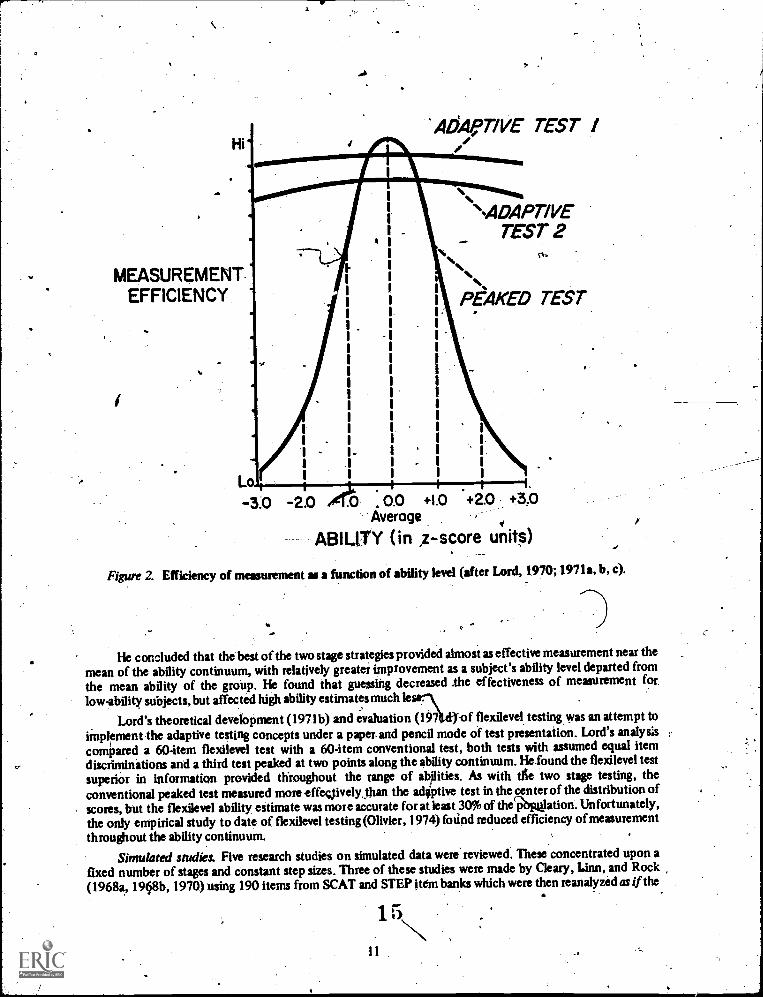
Theoretical studies. Lord's six papers (1970, 1971, a,b,c,d ,e) investigated the measurement effectivenessof both fixed --and- variable step size strategies wit n several varieties of fixed number of stages. His workutilizes the item characteristic curve thdory (Lor , 1972) under a specific set of assumptions which will bediscussed in Chapter III 'of this paper.. Lord's eoretical analysis of two stage testing (1971c) varied thenumber of items presented to each subject in e routing and measurement tests, the distributions of itemsbetween the fwo stages and whether guessing w s assumed to be present or not. His results were presented in
.th jorfn of graphic comparisons between the several adaptive testing strategies and a 60 item peakedconventional test using information functions to evaluate the amount of information yielded (Figure 2).
1410
I
Hi'
MEASUREMENT.EFFICIENCY '
ADAFITIVE TEST I
I.
S.
\ADAPTIVETEST 2
PEAKED TEST
-3.0 -2.0 eort .00 +10 .42.0 +3.0Average
ABILITY (in z-score units)..r
Figure 2. Efficiency of measurement as a function of ability level (afterLord, 1970; 1971a, b, c).
He concluded that the best of the two stage strategies provided almost as effective measurement near the
mean of the ability continuum, with relatively greater improvement as a subject's ability level departed fromthe mean ability of the group. He found that guessing decreased The effectiveness of measurement forlow-ability subjects, but affected high ability estimates much le
Lord's theoretical development (1971b) and evaluation (197 -of flexilevel testing was an attempt toimplement the adaptive testing concepts under a paper and pencil mode of test presentation. Lord'sanalysis
compared a 60-item flexilevel test with a 60-item conventional test, both tests with assumed equal itemdiscriminations and a third test peaked at two points along the ability continuum. Hefound the flexilevel testsuperior in information provided throughout the range of abilities. As with tile two stage testing, theconventional peaked test measured more effegivelythan the adaptive test in the center of the distribution ofscores, but the flexilevel ability, estimate was more accurate for at least 30% of therOiltalation. Unfortunately,the only empirical study to date of flexilevel testing (Olivier, 1974) fmind reduced efficiency of measurementthroughout the ability continuum.
Simulated studies. Five research studies on simulated data were reviewed. These concentrated upon afixed number of stages and constant step sizes. Three of these studies were made by Cleary, Linn, and Rock(1968a, 1908b, 1970) using 190 items from SCAT and STEP itdm banks which were then reanalyzed as lithe
.

subjects had proceeded through the item pool in an adaptive fashion. They compared seven strategies of-two-stage adaptive testing with 10, 20,30,40, and 50 item conventional tests from the same pool. They foundone of the adaptive procedures correlated highest with total score, followed by the conventional tests and thenthe rest of the adaptiye tests. The authors estimated an improvement of about 35% over the best shortconventional test on a comparable number of items by the best adaptive strategy. Validity coefficients in everycase but one showed higher correlations with external criteria for adapthre tests than the conventional tests ofequal length.
Waters and Bayroff (1971) used hypothetical 5, 10, and 15 limit conventional tests for comparison with5 and 10 item branching tests, varying item difficulty ranges and the item-biserial iudex. Their study showedthat adaptive tests yielded highr validities thanany of the conventional tests for tests made up of items with abiserial index at AO or .80 and equal validity coefficients at a .40 biserial.
The simulated results of the Cleary group and the Bayroffgroup were very similar and comparable fo theempirical results reporied in the following section of thispaper. --
Empirical studies. The eight empirical research studies reviewed by the author investigated adaptivetesting strategies having a fixed number of items or stages and constant step sizes. Two major varieties ofadaptive testing have been empirically evaluated; two-stage testing and multi-stage testing. Typically, in theformer strategy, a routing test with a wide range of difficulties is used to assign subjects to one of severalmeasurement tests with item difficultiei peaked around specific iSoints along the hypothesized, abilitycontinuum.
Figure 3 (front Bayroff, 1964) depicts an 8-item routing test coupled with a 6-item measurement test.
sY
II ITEMS WITN WIDE
RANGE Of DIFFICULTY
4D CI (iio 41;) 3:0
c iD 4;0 (60 0 40 CD 41i) its
iD et, CD
ZI CD CD CD 0 el EL)4;1 ID CD 4:14 g) ED ED
0 4;1 er 41:4 04EOM p value decimals omitted INN
ITEMS
`WITH
NADROW
RANGE OF
DIFFICULTY -/
-
Figure 3. Bayroff 's example two stage adaptive test (1964).
1612
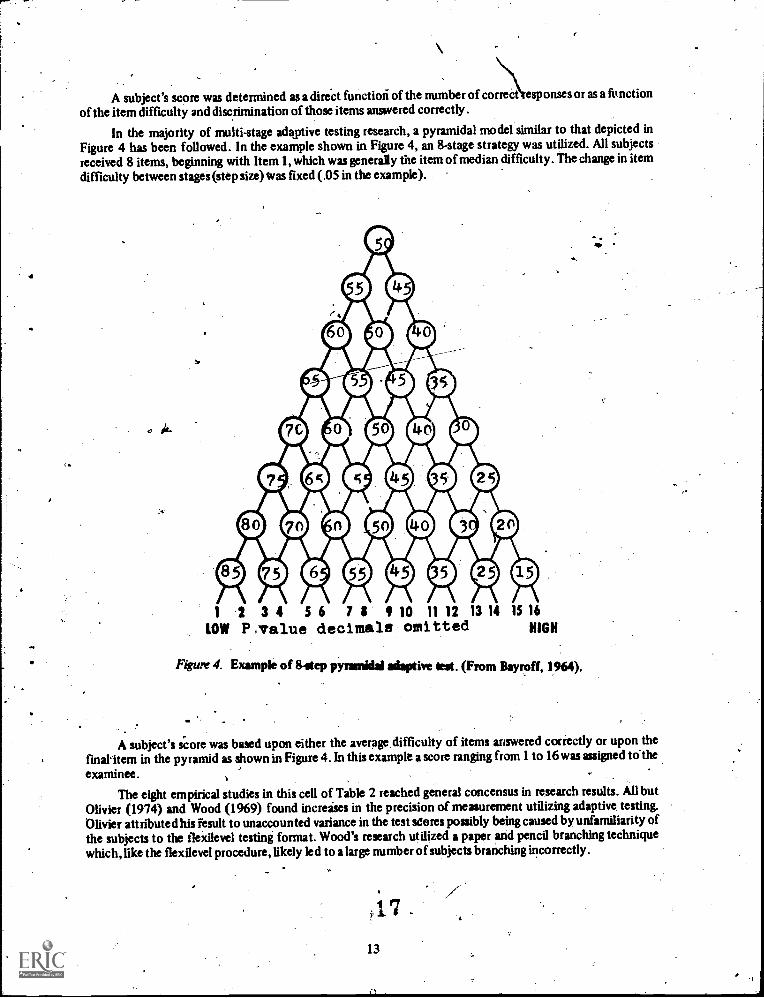
A subject's score was determined as a direct function of the number of correct esponses or as a functionof the item difficulty and discrimination of those items answered correctly.
In the majority of multi-stage adaptive testing research, a pyramidal model similar to that depicted inFigure 4 has been followed. In the example shown in Figure 4, an 8-stage strategy was utilized. All subjectsreceived 8 items, beginning with Item 1, which was generally the item of median difficulty. The change in itemdifficulty between stages (step size) was fixed (.05 in the example).
1 2 3 4 S 6 7 11 9 10 11 12 13 14 15 16
LOW P malue decimals omitted HIGH
Figure 4. Example of 8-step pyramidal adaptive Seat. (From Bayroff, 1964 ).
A subject's score was based upon either the average difficulty of items answered correctly or upon the
final in the pyramid as shown in Figure 4. In this example a score ranging from 1 to 16 was assigned to the
examinee.
The eight empirical studies in this cell of Table 2 reached general concensus in research results. All butOlivier (1974) and Wood (1969) found increases in the precision of measurement utilizing adaptive testing.Olivier attributed his result to unaccounted variance in the test scores possibly being caused by unfamiliarity ofthe subjects to the tleXilevel testing format. Wood's research utilized a paper and pencil branching techniquewhich, like the flexilevel procedure, likely led to a large number of subjects branching incorrectly.
)17
13

,
Of the eight studies in this cell, the correlation between the short adaptive test scores and the longerconventional scores were in the .78 to .86 range with the exceptiod of Wood's pooled results showing only a .51relationship. As a grodp, these studies tended to recernmend further -research in adaptivetesting be centered inmechanical or computer-based modes of presentation rather than the traditional paper and pencil method. Thefive papers utilizing such equipment all suggested further research in the area of adaptive testing.
Lord presents a discussion of tailored testing theory in general in Holtzman (1970). He provided a briefdescription of item characteristic curve theory., information function theory, several strategies of step sizevariation, several suggested scoring methods for tailored testing and varied number of items. He included in thefinal section of the paper the following caveat:
If, for example. SOO items are available for tailored testing, better measurement wit' often be obtained byselecting, for example, the N=60 most discriminating jtems (highest al) and administering these as a comentlonaltest, rather than using all 500 in a tailored testing procedure. This gay actually prove to bee fetal objection toany general use of mimed testing (EmphasitLord's). .
It is the judgment of the author of this paper that the Lord (1970) paper should be essential reading forany researcher interested in adaptive testing. Although the majority of adaptive testing research reported todate appears promising, Lord's warning should be kept in 'mind when evaluating the effectiveness of anyadaptive testing strategy.
N/(arisble Step Sizes
Theoretical studies. The majority of the theoretical rest arch into a fixed number of stages and variablestep sizes has been under the Robbins-Munro branching rule. Stocking (1969) and Lord (1970, 1971c, 1971d)have analyzed the Robbins-Munro technique in comparison with the more conventional up-and-down methoddescribed by Lord (1970). Essentially the Robbins-Munro, or sckalled shrinking step size method, presentsanitem of median difficulty (b1) to begin the test. If item b1 is correctly answered, item b2 is selected thusly:
bi+1 bi + di (ni (1)(From Lord, 1971c)
where: d1, a2 , d, , . . . is a decreasing sequence of positive numbers chosen in advance of testing.bl = difficulty of the ith item.
ui =1, if item i is answered correctly and
tie = 0, otherwise
a and d are positive numbers to be chosen prior to testing in order to produce good measurementproperties on the final test scores.
The fixed step size methods discussed earlier determine the difficulty of the (i + 1)th item by a constantincrement independent of i:
bi.p = bi + 2d (ui a) (2)Lord (1970, 1971c, 1971d) compared these two step size strategies and found that the shrinking-step
sizes provided better measurement than several varieties of up-and-down methods. A major deterrent to theshrinking-step sizes was reported. The up-and-down method requires an item pool of only n (n + 2)/2 items (fora 15 item test, for example, a 120-item pool is necessary) which is reasonable in most large scale testingsituations. To use the Robbins-Munro strategy, 2n 1 items should be available (32,767 items for a 15 itemtest) literally an impossibility in any situation. Since both empirical and theoretical research (Wood,-1971;Novick, 1969) have shovm with a remarkable degree of consistency that adaptive testing is most effectivebetween.' 5 and 20 items per test, the shrinking.step size methods as now conceptualized are not feasible in the
18
14
real world despite their theoretical superiority, in reality, Lord found this superiority to be relatively smallandrecommended use of the fixed step -size procedures rather than a Robbins-Munro whenever the number ofitems exceed six.
Lord (1970) and Stocking (1969) also investigated the persistent problem of how to score adaptive tests.Since different subjects may take different collections of test items in different orders, the conventional/practice of rights -only or rights.corrected-for-guessing is clearly inappropriate. Lord's theoretical researchshowed that scores based upon the iverage difficulty of items answered correctly was superior to scoringmethods based upon the difficulty of thermal item passed or of the next item that the examinee would havetaken. Conceptually, the latter two methods appear sound, since the estimate cf the subject's true abilityshould improve as more items near the subject's .50probability level are presented. If the subject's true score isfar from bi, the author would expect the early items faced by,the subject to adversely affect average difficultyscoring methods. Certainly this area of adaptive testing remains to be empirically evaluated beyond Lord andStocking's hypothetical investigations.
Simulated studies. Paterson's (1962) monte carlo study evolved from the sequential item test (SIT) ofKrathwohl and Huyser (1956). A six-item "conventional test and six-item pyramidal test were created with1500 "examinee" scores generated at 15 different ability levels (1 00 each level). Unlike all of the other studiesof adaptive testing reviewed, Paterson selected items based upon biserial correlation rather than ekrclusively byitem difficulty. He ordered the items in the pool by difficulty and by rb4 within difficulty levels. Step size wasthus a function of item discrimination, approximating a shrinkfng-step size model since larger steps were takenfor early items and shorter step sizes fbr later items. He scored his tests based upon the final difficulty method.His results showed the adaptive test to better reflect non - normal ability distributions and to better measureexaminees with abilities in the extremes of the distribution., As with Lord, Paterson found measure rentefficiency slightly inferior for the adaptive strategy near the mean of the score distribution. He recommendedthat adaptive item pools required a more flat distribution of item difficulties than the conventional test. \
The only other simulated study, of fixed number of stag 'able step size adaptive testing wasdone by Bryson (1972). She compared two 5- and 10-item a ptive measureswith two 5-item conventionaltests with a validity coefficient based upon a 100 item parent test serving as criterion. Her results did not favorthe adaptive procedure; however, several methodological errors involving branching, scoring and the tact thatthe control group tested via paper and pencil while the experimental group used a cathode ray tube (CRT),suggest the discounting of her results.
Bryson further compared her empirical results described Above, with'two groups of test scores of 100recruits which were rescored as if they had been taken sequentially as Cleary, Linn, and Rock (1968a, 1968b)had done earlier. The correlation of these four group scores to the parent test yielded one group with higheradaptive correlation and one with higher conventional correlation. Such a result leads one to question theprocedure of using "real data" from data banks for simulations of adaptive test results. Apparently, aninteraction effect exists between item order, item selection and/or examinee response which invalidates thistype of simulation design. , 4
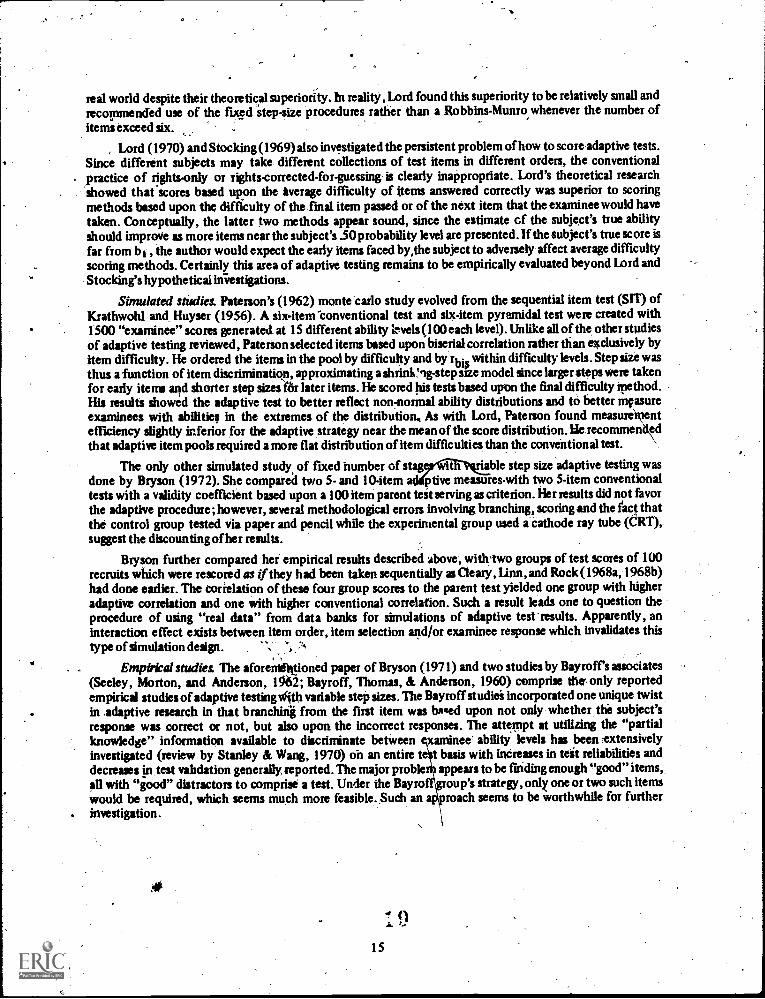
Empirical studies The aforemktioned paper of Bryson (1971) and two studies by Bayroffs associates(Seeley, Morton, and Anderson, 1%2; Bayroff, Thomas, & Anderson, 1960) comprise the only reportedempirical studies of adaptive testing viith variable step sizes. The Bayroff studiei incorporated one unique twistin -adaptive research in that bninchhik from the first item was b"ed upon not only whether the subject'sresponse was correct or not, but also upon the incorrect responses. The attempt at utilizing the "partialknowledge" information available to discriminate between xaminee' ability levels has been !extensivelyinvestigated (review by Stanley & Wang, 1970) on an entire tot basis with increases in teit reliabilities anddecreases in test validation generally, reported. The major probk appears to be finding enough "good" items,all with "good" distractors to comprise a test. Under the Bayro roup's strategy, only one or two such itemswould be required, which seems much more feasible. Such an roach seems to be worthwhile for further
. investigation.
915

Results from the Bayroff studies showed a .63 correlation for a 6-item adaptive test with a parent testwhile a 25-item conventional test correlated significantly higher with a parent test. The authors noted that thedistribution of item difficulties was badly skewed to the left with a resultant skewed score distribution. Inaddition, the adaptive tests involved longer construction, administration and scoring time and resulted inmoreunusuable answer sheets than the conventional tests. These results are consistent with the Wood (1969) andOlivier (1974) results using-paper and pencil adaptive tests. Apparently, a mechanized mode or presentationshould be used for any adaptive testing to avoid examinee branching errors.
Variable: Number of Stages
Research studies on adaptive testing involving variable numbers of stages fall under the category ofdecision theory. In these studies, testing was terminated when a preset criterion was reached. Commencingwith the work of Wald (1946) and the Statistical Research Group (SRG) and carried on by Cronbach andGleser (1965), sequential analysis-techniques entailed presenting an item or block of items to a subject, afterwhich a decision is made to (a) assign the subject to a "passing" group; (b) assign the subject to a "failing"group; or (c) continue testing. All of the. research done within the variable number of stages level essentiallyfollow the sequential analysis model in determininga stopping rule for testing. ,
Conceptually, varying the number of items presented between subjects makes sense. Setting a particularnumber of items for all subjects fails to account for individual differences between subjects and certainlymustbe wasteful for a percentage of the examinees.lhe catch, of course, is in determining when to cease testing foreach subject and handling the problems v4;tich arise whenexaminees do not take an equal nbmber of items.
Constant Step Size
Theoretical studies. About a decade after the previously cited work of Wald aria the SRG, Cronbach andGleser's (1965) book, Psychological Tests .and .Perspnnel Decision's; presented a complete theoreticalexposition of efficient testing procedures. They introduced the concept of cost effectiveness and concludedthat, theoretically, testing efficiency will be maximized by completely adapting the test to the individualtestee. Green (1970) reiterated the cost effective point in responding to Lord's (1970) caveat concerningadaptive testing. Kappauf (1969) described an application of the up-and-down method of branching using asequential analytic stopping rule for computer-based psychological testing, althoughno results were reported.No further theoretical research was found until Weiss (1973) presented his model he termed "stradaptivetesting," produced under a research grant from the U.S. Navy to investigate computer-based adaptive testingfor possible Navy implementation on a large scale. Weiss and his associates are in the process of comparingtwo-stage, Bayesian, pyramidal, flexilevel and stradaptive testing strategies with one another and withconventional testing. DeWitt and Weiss (1974) published a description ofian elaborate computer softwaresystem for making these comparisons and McBride and Weiss (1974) produced a description of the mechanicsof creating an item pool adaptive testing research. Since Weiss' stradaptive model is the target of this presentstudy, the description of the model will be held until Section III of this paper when a complete definition of theelements of the model will be made.
Simulated studies. The author found only one simulated study involving constant step 'sizes and avariable number of stages. Linn, Rock, and Cleary (1970) reanalyzed 1967 College Level Examination Program(CLEP) data from English composition, mathematics and natural sciences examinations. They simulated twoadaptive testing strateges, one in which three CLEP tests were analyzed separately and the other in which themathematics test score was used in the decision process for ths.English and science tests. Essentially, Linn etal., followed the sequential analytic procedures suggested.by Wahl, althoughthe specific model was developedby Armitage (1950). They also scored short conventional tests of the first 5,10, 15, 20,25.30, 35,40, 45, 50,55, and 60 items for comparisons with the adaptive tests.
Linn, etb/.;residts showed substantial improvement in assignment of subjects to one of two groups fordichotoinous decision making. They estimated that the short conventional tests required approximately twiceas many items to achieve a comparable level of accuracy as that achieved by the adaptive tests. To the author's
\ knowledge, no empirical study has been conducted to verify this impressive result. Sikh a study is warranted,since other "real data" simulation results have not replicated etnpirically.
2016
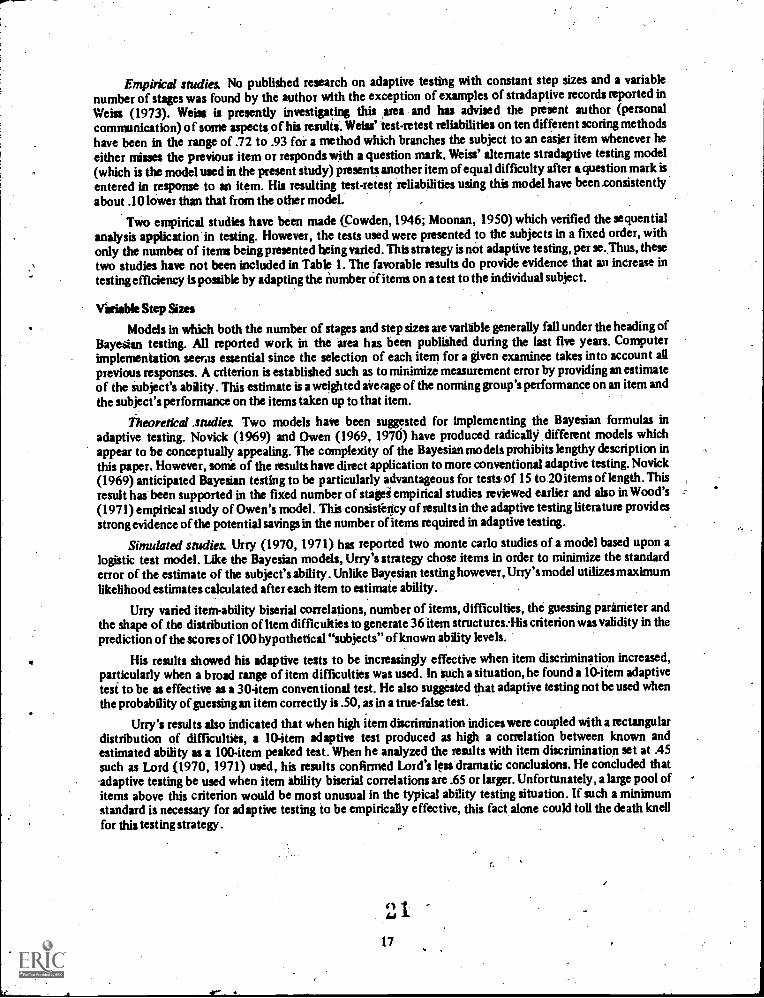
Empirical studies. No published research on adaptive testing with constant step sizes and a variablenumber of stages was found by the author with the exception of examples of stradaptive records reported inWeiss (1973). Weiss is presently investigating this area and has advised the present author (personalcommunication) of some aspects of his results. Weiss' test-retest reliabilities on ten different scoring methodshave been in the range of .72 to .93 for a method which branches the subject to an easier item whenever heeither misses the previous item or responds with a question mark, Weiss' alternate stradaptive testing model(which is the model used in the present study) presents another item of equal difficulty after *question mark is
entered in response to an item. His resulting test-retest reliabilities using this model have been. onsistentlyabout .10 lower than that from the other model. ,
Two empirical studies have been made (Cowden, 1946; Moonan, 1950) which verified the sequentialanalysis application' in testing. However, the tests used were presented to the subjects in a fixed order, withonly the number of items being presented being varied. This strategy is not adaptive testing, per se. Thus, thesetwo studies have not been included in Table 1. The favorable results do provide evidence that an increase intesting efficiency is possible by adapting the number of items on a test to the individual subject.
Variable Step Sizes
Models in which both the number of stages and step sizes are variable generally fall under the heading ofBayesian testing. All reported work in the area has been published during the last five years. Computerimplementation seems essential since the selection of each item for a given examinee takes into account allprevious responses. A criterion is established such as to minimize measurement error by providing an estimateof the subject's ability. This estimate is a weighted average of the norming group's performance on an item andthe subject's performance on the items taken up to that item.
Theoretical .studies. Two models have been suggested for implementing the Bayesian formulas inadaptive testing. Novick (1969) and Owen (1969, 1970) have produced radicallY different models whichappear to be conceptually appealing. The complexity of the Bayesian models prohibits lengthy description inthis paper. However, some of the results have direct application to more conventional adaptive testing. Novick(1969) anticipated Bayesian testing to be particularly advantageous for testsof 15 to 20 items of length. Thisresult has been supported in the fixed number of stagei empirical studies reviewed earlier and also in Wood's(1971) empirical study of Owen's model. This consistency of results in the adaptive testing literature providesstrong evidence of the potential savings in the number of items required in adaptive testing.
Simulated studies. Urry (1970, 1971) has reported two monte carlo studies of a model based upon alogistic test model. Lice the Bayesian models, Urry's strategy chose items in order to minimize the standarderror of the estimate of the subject's ability. Unlike Bayesian testing however, Urry's model utilizes maximumlikelihood estimates calculated after each item to estimate ability.
Urry varied item-ability biserial correlations, number of items, difficulties, the guessing parameter andthe shape of the distribution of Item difficulties to generate 36 item structures: His criterion was validity in theprediction of the scores of 100 hypothetical "subjects" of known ability levels.
His results showed his adaptive tests to be increasingly effective when item discrimination increased,particularly when a broad range of item difficulties was used. In such a situation, he found a 10-item adaptivetest to be as effective as a 30-item conventional test. He also suggested that adaptive testing not be used whenthe probability of guessing an item correctly is .50, as in a true-false test.
Urry's results also indicated that when high item discrimination indices were coupled with a rectangulardistribution of difficulties, a 104tem adaptive test produced as high a correlation between known andestimated ability as a 100-item peaked test. When he analyzed the results with item discrimination set at .45such as Lord (1970, 1971) used, his results confirmed Lord's less dramatic conclusions. He concluded thatadaptive testing be used when item ability biserial correlations are .65 or larger. Unfortunately, a large pool ofitems above this criterion would be most unusual in the typical ability testing situation. If such a minimumstandard is necessary for adaptive testing to be empirically effective, this fact alone could toll the death knellfor this testing strategy.

Urry's second study (1971) used the same model as his earlier dissertation. He generated three itembanks and fit the data to the model. He determined that Bayesian testing of the Verbal Scholastic AptitudeTest (VSAT) could save 65% of testing time for the average examinee.
Kalisch (1974) used the beta distribution and conditional item difficulties to predict. subject responseson items beyond those he actually took. A sequential decision rule was used to determine when to cease testingbased on an expected loss function to the subject between the three possible decisions (item response would becorrect, no assumption, or response would be incorrect). Results were reported as favorable to future researchinto this model.
Empirical studies. Four empirical studies of fully adaptive testing have been reported. Wood (1969)conducted an empirical validation (number of subjects only 28) of Owens' (1970) model along' with asimulated study as part of a dissertation. In the simulation portion of the study, he compared his Bayesianresults with a 60-item simulated two-stage test and a 60-item conventional test. The empirical data showed theBayesian ability estimates to converge arowid 20 items, remarkably similar to Novick's (1969) theoreticalprediction with a different' Bayesian testing model. In the simulation portion of the study, Wood found bothBayesian and two-stage testing to be superior to conventional testing, with the two-stage performing betterthan the Owen model in terms of measurement preciseness, although the Bayesian method was more costeffective. A saving of 2/3 of the num1:01 of items required for the conventional and two-stage tests wasevidenced in the results of the Bayesian strategy. This result also supported Owens' theoretical savings.
Ferguson's dissertation (1969) and a later paper (1971) report a model development and empiricalvalidation for a computer-assisted, criterion-referenced instructional system. The purpose of his researchwasto apply the sequential analytic techniques of Wald to the decision of mastery or non-mastery of instructionalobjectives within a hierarchially-structured domain of achievement. After c. .ch item response a decision wasmade to classify the student as having mastered the material, not mastered it, or no decision (present anotheritem). Testing continued until a decision was reached for all students. The computer then selected the nextobjective for each subject based upon previous performance.
Ferguson's results were very favorable to the adaptive approach. Both test-retest reliabilities andvalidities were higher than a conventional paper and pencil mode of presentation and a 50% time savingswasreported on the computer-based measurement system.
As Cieen suggested (1970) and Ferguson's research confirmed, the use of adaptive testing as a strategyfor instructional management rather than as a measurement tool may turn out to be the most effectiveapplication of the adaptive models. The instructional situation is immediately concerned with decisions abouta single subject and the oft-mentioned lack of efficient), of the adaptive strategies near the center of the abilitydistribution should not be entirely relevant in this context. Further research into instructional applications ofadaptive testing is warranted.
Summary of the Literature on Adaptive Testing
The following conclusions appear warranted based upon the studies in this review:
1. Item pool distributions of difficulty and discrimination values have ilarge effect on empirical resultsin adaptive testing studies. Well-nonmed item statistics with appropriate distributions are essential for empiricalstudies.
2. Average difficulty scoring methods are superior to final difficulty methods.
3. Within the fixed number of stages dimension, the .up-and-down method is superior to theRobbins-Munro method due to the number of items required in the item pool.
4. At least with the models developed to date, paper-and-pencil adaptive testing is npt likely to producefavorable results. Use of a computer greatly enhances this measurement strategy.
5. Although an efficient method for analyzing a model, "real data" simulation studies should befollowed up by empirical validation. The change of item sequencing, item content and test length in adaptive
2 218
testing apparently affects examinee performance. This change, at least m the studies reviewed, wasconsistentthe simulated studies were far more favorable to adaptive testing than the empirical validations ofthe same model.
6. Theoretical studies netd to consider item parameters more closely attuned to the reality ofmeasurement. Although assumptions of no guessing, all items having equal difficulty or discrimination indices,etc., simplify analysis, the results of this type study are not generalizable to the world of testing. Follow-upvalidations are essential.
7. Group indices such as reliability and validity may not be appropriate measures of the effectiveness ofadaptive testing. An information function as described by Lord seems preferable.
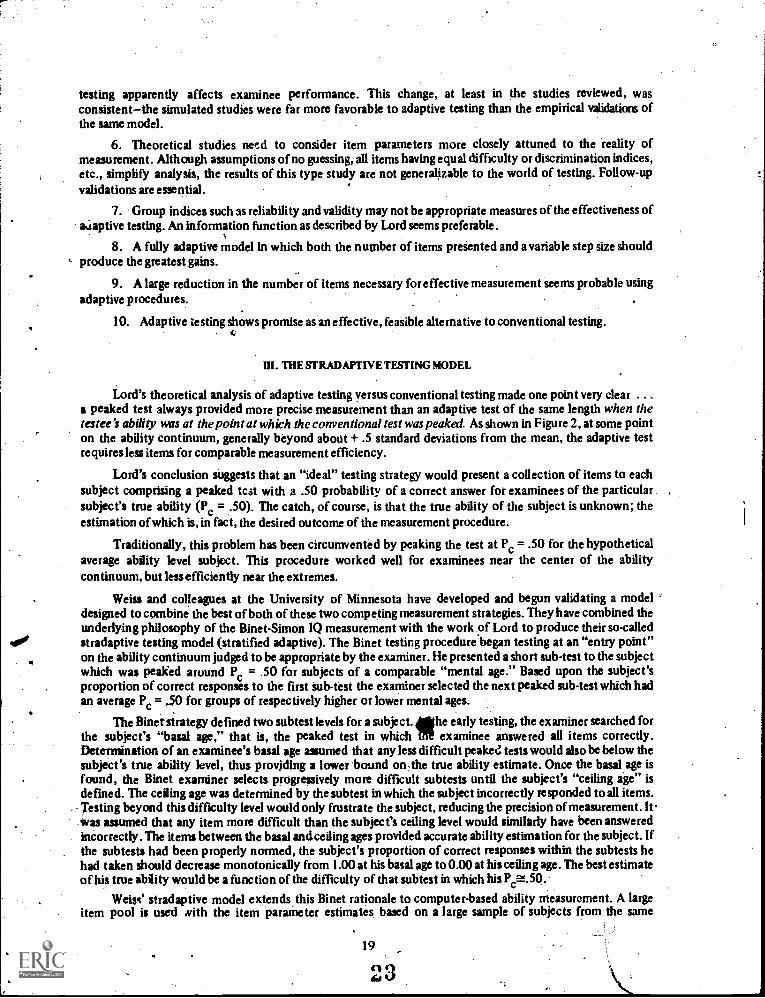
8. A fully adaptive model in which both the number of items presented and a variable step size shouldproduce the greatest gains.
9. A large reduction in the number of items necessary for effective measurement seems probable usingadaptive procedures.
10. Adaptive testing shows promise as an effective, feasible alternative to conventional testing.
HI. THE ST RADAPTIVE TESTING MODEL
Lord's theoretical analysis of adaptive testing versus conventional testing made one point very clear . . .
a peaked test always provided more precise measurement than an adaptive test of the same length when thetestee's ability was at the point at which the conventional test was peaked. As shown in Figure 2, at some pointon the ability continuum, generally beyond about + .5 standard deviations from the mean, the adaptive testrequires less items for comparable measurement efficiency.
Lord's conclusion suggests that an "ideal" testing strategy would present a collection of items to eachsubject comprising a peaked test with a .50 probability of a correct answer for examinees of the particularsubject's true ability (Pc = .50). The catch, of course, is that the true ability of the subject is unknown; theestimation of which is, in fact, the desired outcome of the measurement procedure.
Traditionally, this problem has been circumvented by peaking the test at Pc = .50 for the hypotheticalaverage ability level subject. This procedure worked well for examinees near the center of the abilitycontinuum, but less efficiently near the extremes.
Weiss and colleagues at the University of Minnesota have developed and begun validating a modeldesigned to combine the best of both of these two competing measurement strategies. They have combined theunderlying philosophy of the Binet-Simon IQ measurement with the work of Lord to produce their so-called
soof stradaptive testing model (stratified adaptive). The Binet testing procedure began testing at an "entry point"on the ability continuum judged to be appropriate by the examiner. He presented a short sub-test to the subjectwhich was peaked around Pc = .50 for subjects of a comparable "mental age." Based upon the subject'sproportion of correct responses to the first sub-test the examiner selected the next peaked sub-test which hadan average Pc = ,50 for groups of respectively higher or lower mental ages.
The Binetstrategy defined two subtest levels for a subject. he early testing, the examiner searched forthe subject's "basal age," that is, the peaked test in which examinee answered all items correctly.Determination of an examinee's basal age assumed that any less difficult peaked tests would also be below thesubject's true ability level, thus providing a lower bound onthe true ability estimate. Once the basal age isfound, the Binet examiner selects progressively more difficult subtests until the subject's "ceiling age" isdefined. The ceiling age was determined by the subtest in which the subject incorrectly responded to all items.Testing beyond this difficulty level would only frustrate the subject, reducing the precision of measurement. It -was assumed that any item more difficult than the subject's ceiling level would similarly have been answeredincorrectly. The items between the basal and ceiling ages provided accurate ability estimation for the subject. Ifthe subtests had been properly normed, the subject's proportion of correct responses within the subtests hehad taken should decrease monotonically from 1.00 at his basal age to 0.00 at his ceiling age. The best estimateof his true ability would be a function of the difficulty of that subtest in which his Pc-.50.
Weise stradaptive model extends this Binet rationale to computer-based ability measurement. A largeitem pool is used with the item parameter estimates based on a large sample of subjects from the same
19
23
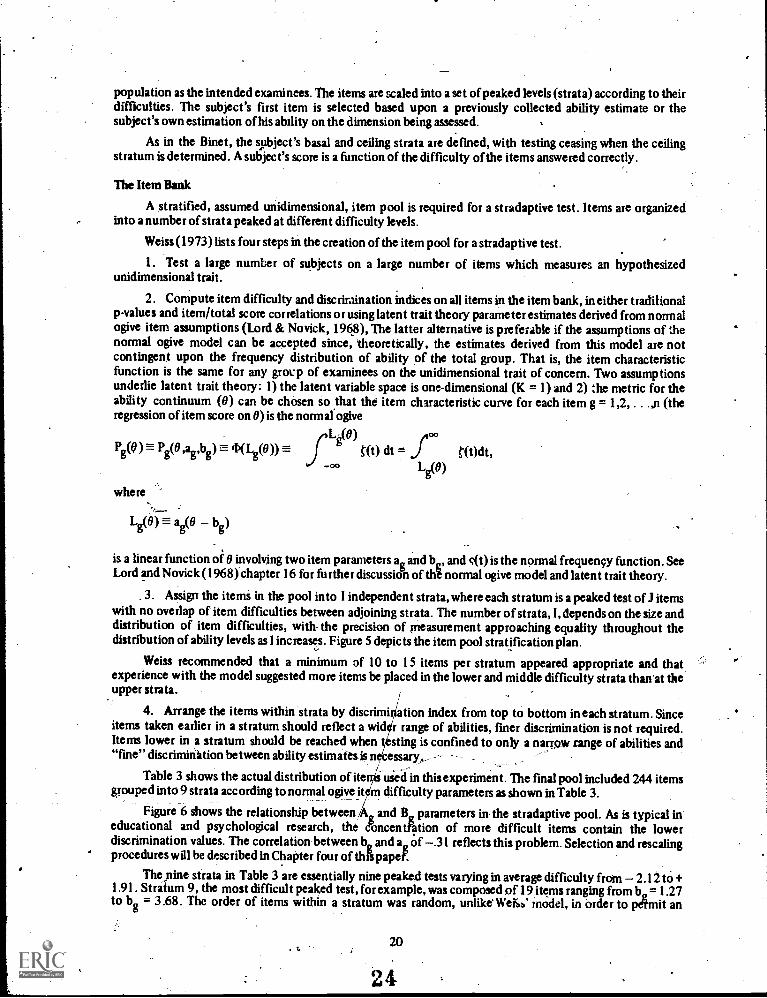
population as the intended examinees. The items are scaled into a set of peaked levels (strata) according to theirdifficulties. The subject's first item is selected based upon a previously collected ability estimate or thesubject's own estimation of his ability on the dimension being assessed.
As in the Binet, the subject's basal and ceiling strata are defined, with testing ceasing when the ceilingstratum is determined. A subject's score is a function of the difficulty of the items answered correctly.
The Item Bank
A stratified, assumed unidimensional, item pool is required for a stradaptive test. Items are organizedinto a number of strata peaked at different difficulty levels.
Weiss (1973) lists four steps in the creation of the item pool for a stradaptive test.
1. Test a large number of subjects on a large number of items which measures an hypothesizedunidimensional trait.
2. Compute item difficulty and discrimination indices on all items in the item bank, in either traditionalp-values and item/total score correlations or using latent trait theory parameter estimates derived from normalogive item assumptions (Lord & Novick, 1968), The latter alternative is preferable if the assumptions of thenormal ogive model can be accepted since, theoretically, the estimates derived from this model are notcontingent upon the frequency distribution of ability of the total group. That is, the item characteristicfunction is the same for any group of examinees on the unidimensional trait of concern. Two assumptionsunderlie latent trait theory: 1) the latent variable space is one-dimensional (K = 1) and 2) the metric for theability continuum (0) can be chosen so that the item characteristic curve for each item g = 1,2, . .,n (theregression of item score on 0) is the normal ogive
rLg- (0)dt = de.P P (0,a13 b ) -7= 43(Lg(0))g 9 g t(t)dt,
Lg(0)
where
L (0) -:=- a (8`` 0 b )
is a linear function of 0 involving two item parameters ag and b , and s(t) is the normal frequency function. SeeLord and Novick (1968) chapter 16 for further discussion of flit normal ogive model and latent trait theory.
3. Assign the items in the pool into I independent strata, where each stratum is a peaked test of J itemswith no overlap of item difficulties between adjoining strata. The number of strata, I, dependson the size anddistribution of item difficulties, with -the precision of measurement approaching equality throughout thedistribution of ability levels as I increases. Figure 5 depicts the item pool stratification plan.
Weiss recommended that a minimum of 10 to 15 items per stratum appeared appropriate and thatexperience with the model suggested more items be placed in the lower and middle difficulty strata than'at theupper strata.
4. Arrange the items within strata by discrimi ation index from top to bottom in each stratum. Sinceitems taken earlier in a stratum should reflect a wid r range of abilities, finer discrimination is not required.Items lower in a stratum should be reached when sting is confined to only a narrow range of abilities and"fine" discrimination between ability estirnatesis n essary.
Table 3 shows the actual distribution of ite used in this experiment. The final pool included 244 itemsgrouped into 9 strata according to normal ogive item difficulty parametersas shown in Table 3.
Figure 6 shows the relationship between it and B parameters in-the stradaptive pool. As is typical ineducational and psychological research, the ebncentfation of more difficult items contain the lowerdiscrimination values. The correlation between b and a of .31 reflects this problem. Selection and resealingprocedures will be described in Chapter four of this pape.
The_ nine strata in Table 3 are essentially nine peaked tests varying in average difficulty from 2.12 to +1.91. Stratum 9, the most difficult peaked test, for example, was composed of 19 items ranging from b.= 1.27to b = 3.68. The order of items within a stratum was random, unlikeWeiib' model, in order to 'Anil an
20
24

-9
7
2 6
I 5
3
Mr. MNI,Nrao
.........=mingE,M11111MINDINDIIIM11
or mows .......... 11.1111.0 el& Mio IOW
4.111411,141. 6114111.11400041,
1 1 .. ir I 4 1 I 1 l t 1- a u 1
p 1.00 .90 .80 .70 .60 .50' 40 .30 .20 .10 .00
Easy items DIFFICULTY Difficult items
(p =proportion correct )
4
Figure 5. Distribution of items, by difficulty level, in a stmdaptive test (front Weiss, 1973).
21
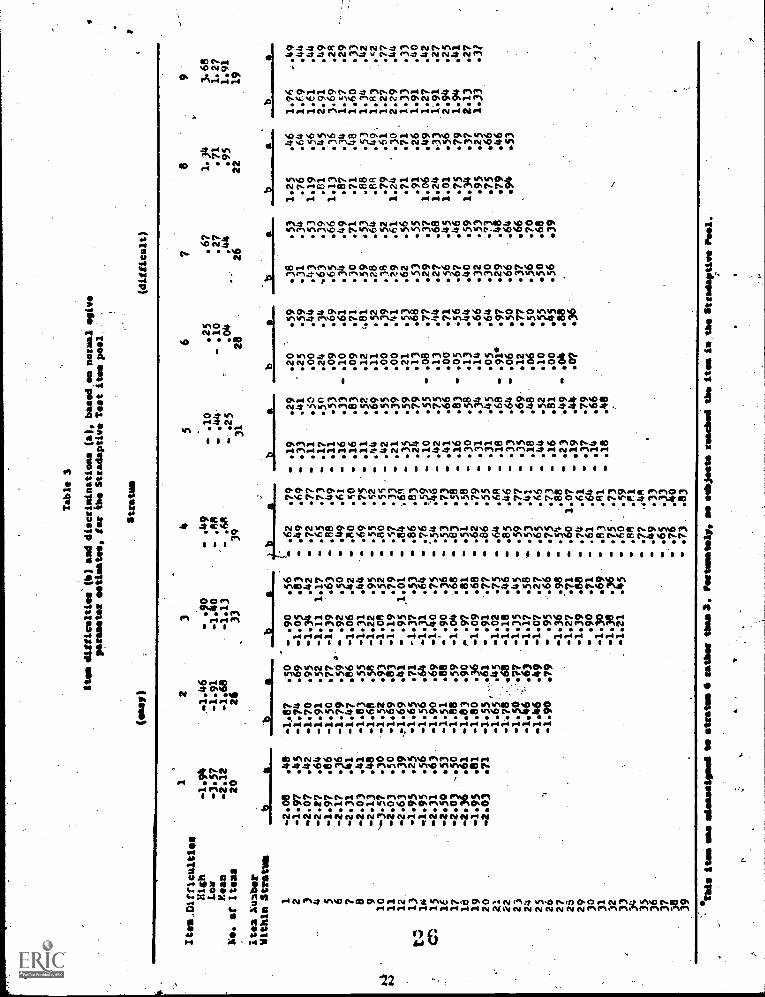
Table 3
Item difficulties (b) amd discriminations (a), based en normal .give
parameter estimates, foe the St:adaptive Test item pool,
(mei
)
12
3Item,DiffIculties
810
.94
4.46
- .90
Low
-3.57
-1.91
-1.40
Mean
-2.12
-1.68
-1.13
be. ef Items
20
26
33
Stratum
(difficult)
Item /Mabel'
Within Stratum
1 2 3 4 5 6 7 8 9
ba
MN
IMIIN
IMM
IME
milI
N
1.87
.50
1.74
.69
-1.70
.95
-1.91
.52
-1.50
.77
-1.79
.59'
-1.47
.86
.83
.55
-1.60
.58
4111
L111
111I
LN..
.90
.56
-1.05
.83
-1.34
.42
-1.11
1.17
-1.39
.63
.92
.50
-1.06
.42
-1.31
.44
-1.22
.95
-2.08
1.97
2.07
-2.27
-1.97
-2.17
-2.31
2.03
2.13
.48
.45
.42
.64
.86
.36
.41
.41
.48
14
10
N.-3.57
.30
-1.52
.93
-1.08
.52
1.4
112.
03.5
0.69
.83
1.19
.79
12
-2.63
.39
4.69
.41
.95
1.01
t:
13
Ii.
1.95
1.95
.25
.56
-1.65
1.56
.71
.64
-1.37
-1.31
.53
.6
Cet.
15
16
.4.31
-2.50
.63
.53
-1.90
-1.51
.69
.88
-1.40
-'.90
.75
.36
17
-2.03
...go
-1.88
.59
-1.04
.68
lis
-2.36
.61
-1.83
.90
,- .97
.81
19
-1.95
.81
-1.80
.36
-1.09
.68
20
4.03
.71
-1.55
a.91
.77
21
-1.65'
.45
-1.02
.75
22
-1.78
.68
-1.18
.46
23
-1.5o
.77
1.35
.45
24
-1.46
.63
-1.17
.58
2526
i
.4.46
.90
.49
.79
4.07
.95
.27
.66
271.36
.98
25
-1.27
.71
29
-1.39
.88
.71
31
1.30
.69
32
-1.38
33
-1.21
.4
3433
36
37
38 39
4 .49
- .88
- .68
39
.62
.49
.72
.88
.49
.80
.69
.55
.80
- .57
.84
.86
.76
.54
. .53
.83
- .51
. .62
.86
.64
.85
.59
.65
.75
- .54
.60
- .74
- .61
- .83
- .75
.60
.88
.77
.49
- .65
.76
.73
56
78
9
.10
.25
.67
1.34
3.68
.44
- .10
.27
.71
1.27
- .25
.04
.44
.95
1.91
31
28
26
22
19
bIlM
jitIM
INI1
1=11
111:
1.25
.46
.76
.64
1.19
.56
.81
.45
1.13
.36
.87
.34
.71
.48
.88
.53
.84
.49,
.79
.61
1.24
.30
.71
.71
.91
.26
1.06
.49.
1.24
.33
1.01
.56
.75
.79
1.34
.37
.95
.25
.75
.66
.79
.46
.94
.53
b
.79
.69
.77
.73
.49
.61
.450
.75
.52
.55
.33
.64
.83
.59
.46
.73
.58
.58
.79
.55
.6R
.46
.77
.66
.73
.88
1.07
.61
.64
.81
.73
.59
.11
,441
.33
.33
.40
.83
.19
- .33
- .11
- .17
.11
- .16
.16
.11
- .44
- .42
- .21
- .35
.24
- .10
- .42
.41
.16
- .30
- .31
.31
- .18
- .33
- .35
- .18
.44
- .16
.23
.19
.37
.14
- .18
.29
.41
.50
.50
.53
.33
.83
.52
.69
.55
.39
.59
.79
.55
.75
.66
.83
.58 34
.68
.64
.69
.48
.52
.81
.49
.44
.79
.66
.48
.20
.25
.00
.24
.09
.10
.09
.12
.11
.00
.00
.21
.13
.08
.13
.0
.05
.13
.14
.05
.91
- .06
.12
.06
.10
.00
. .04
.0?
.59
.59
.44
.34
.69
.61
.71.
481
.52
.39
.41
.53
.68
.77
.44
.71
.56
.44
.66
.64
.97
.50
.77
.50
.55
.45
.88
.36
.38
.31
.43
63
.65
.34
.30
.59
.28
.38
.29
.62
.53
.29
.27
.56
.67
.40
.32
.30
.29
.66
.37
.56
.50
.56
.53
.34
.53
.39
.66
.49
.71
.53
.64
.52
.61
.56
.55
.37
.68
.45
.46
.59
.53
73
.48
.64
.66
.70
.68
.39
1.76
1.f.9
1.61
2.91
3.69
1.57
1.60
1.34
1.83
1.27
2.29
1.33
1.91
1.27
1.91
2.94
1.94
2.13
1.33
-.49
.44
.44
.49
.28
.29
.33
.42
.C2
.77
.44
.33
.40
.42
.27
.25
.41
.27
.37
Ibis item sae misaselesed es et:whose retie( thes3. Ifeetsmaselp, se bjeste :seabed the ltee is, tie St:adaptive Feel.

DIFFICULTY (B).
-3.24 -2.52 -1:80 . -1.08 -.36 .36 1.08 1.80 2.52 3.24
DI
R.95I
A
I0
A
1.25
1.15
1.05
.85
.75
:65
.55
.45
.35
.25
$
ggg
.
g
I
1
1
t-3.60
I11.
I IS.
v,
.II *4 1.
auseaeo
S ..t . a
a. .I
OP
I-0
-2.88 -2.16 -1.44
.
.-.72 0
1.25
I 1.15
1.05
.95
.85 C..1
.75
.65
.55
A5
a
.35
aa
.72 1.44 2.16
Figure 6. Scatterplot of relationship between Ag and B .
2.88
.25
3.60
alternate-forms reliability coefficient to be calculated on stradaptive examinees. Personal discussion with Weissled to the conclusion that the randomized design utilized in this study would not jeopardize the feasibility ofthe stradaptive testing procedure. Theoretically, this design could have added a few items to some examinees'tests, although ability estimates should,have been similar to Weiss' procedure estimates. If a bias were caused bythis change, it would make the results from this study less impressive than they might be otherwise in acomparison between stradaptive and conventional testing.
Item Content and FormatAll items in the item pool were in the following form:
EXAMPLE: Calf: Cow:a. puppy: / dogb. nest: birdc. house: / builddi. shell: turtle
These test items were selected for this study for a number of reasons. First, the SCAT Series II provided asingle-format unidimensional test with extensively-normed item parameter estimates. The item format was
23

easily stc 7ed in the computer item file, being short and standard for all 244 items. SCAT II was well received inBuros' 7th Mental Measurements Yearbook (1971) with internal consistency reliabilities for the five 50-itemforms ranging from .86 to .88 and validities comparable to other leading measures of verbal aptitude.Administration was relatively short (20 minutes for e published test) and, finally, ETS consented to providethe items and item parameter estimates for this resear
Computer Program for Model Implementation
A computer program fully described by DeWitt and Weiss (1974) was adapted by James Sutherland ofFlorida State University to fit the FSU Control Data Corporation 6500 compute r.2
Instructional Sequence
The DeWitt and Weiss program was written so that it could be used, by subjects with no priorcathode-ray-tube experience and with no help from the examination proctor. The proctor simply typed asingle letter into the CRT to select stradaptive or conventional test, and the instructional sequence began. Thesubject was asked to type in his social security number and name and was instructed in the use of the CRT andin the nature of the research. A sample item was presented and responses to the questions in Figure 7 werereested.
Everybody is better at some things thanothers . . . Compared to other people yourage, how good do you think your vocabularyis?
Entry Stratum(not seenby examinee)
Better than: 1 out of 10 r 1
2 out of 10 23 out of 10
41Pik4 out of 105 out of 10 56 out °fit) 67 out of 10 78 out of 10 89 out Of 10 9
Type in the number from 1 to 9 that givesthe number of people you would guess youare better than (in vocabulary).
1Figure 7. Entry point question for determining subject ability estimate
(from: Weis, 1973).
After completing this task, the subject typed in the word "start" and the testing sequence began.
Testing Sequence
The response to the question in Figure 7 determined the subject's entry point (ability estimate) in thestradaptive item matrix. The first item the stradaptive. subject received was the first item in the stratumcommensurate with his ability estimate. The subject was then branched to the first item in the next higher orlower stratum depending upon whether the initial revonse was correct or incorrect. If the subject entered a
) question mark(?), the next item in the same stratum was then presented.
iThe,testmaterials from the SCAT Series II Verbal lAbility tests were adapted and used with the permission of
Educational Testing Service. The author of this paper gratefully acknowledges the help of ETS in the pursuit of thisresearch. v
2DeWitt's help in the conversion of his program from the University of Minnesota system to the Florida StateUniversity system is gratefully acknowledged. Under the time constraints in this study, program operation prior to datacollection would not have been possible without DeWitt's advice and efforts in our behalf.
24
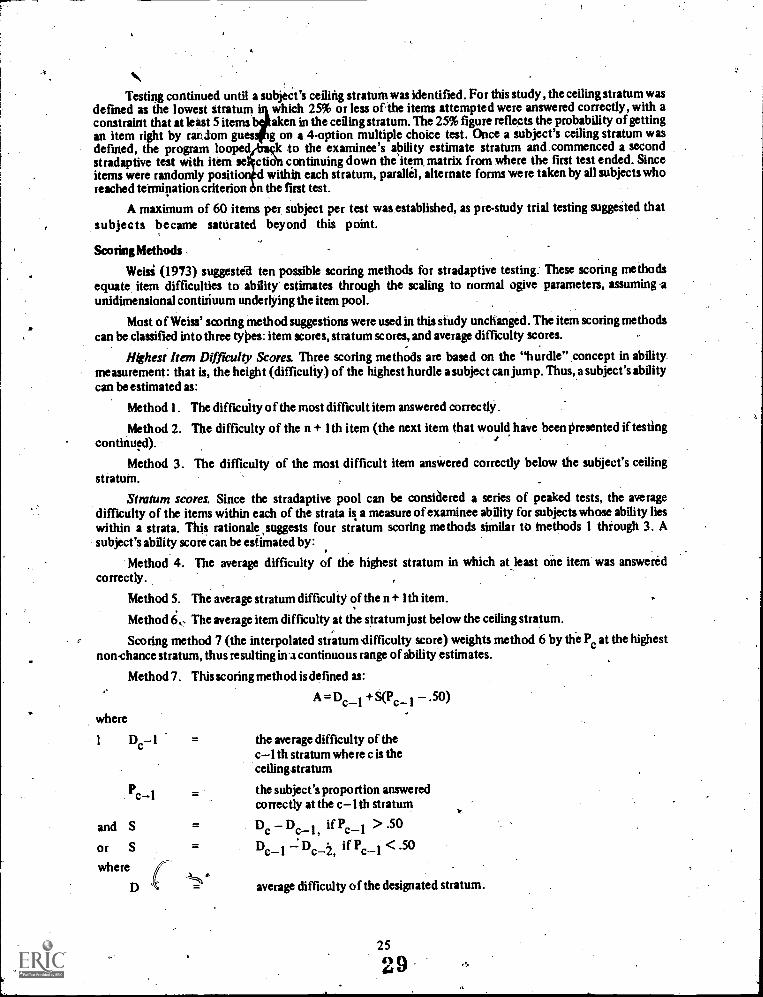
Testing continued until a subject's ceiling stratum was identified. For this study, the ceiling stratum wasdefined as the lowest Stratum which 25% or less of.the items attempted were answered correctly, with aconstraint that at least 5 items l4aken in the ceiling stratum. The 25% figure reflects the probability of gettingan item right by random gu g on a 4-option multiple choice test. Once a subject's ceiling stratum wasdefined, the program looped k to the examinee's ability estimate stratum and commenced a secondstradaptive test with item se dm continuing down the item, matrix from where the first test ended. Sinceitems were randomly positi within each stratum, parallel, alternate forms were taken by all subjects whoreached termination criterion n the first test.
A maximum of 60 items per subject per test was established, as pre-study trial testing suggested thatsubjects became saturated beyond this point.
Scoring Methods ,
Weisi (1973) suggested ten possible scoring methods for stradaptive testing. These scoring methodsequate item difficulties to ability estimates through the scaling to normal ogive parameters, assuming aunidimensional continuum underlying the item pool.
Most of Weiss' scoring method suggestions were used in this study unchanged. The item scoring methodscan be classified into three types: item scores, stratum scores, and average difficulty scores.
Highest Item Difficulty Scores. Three scoring methods are based on the "hurdle" concept in abilitymeasurement: that is, the height (difficulty) of the highest hurdle a subject can jump. Thus, a subject's abilitycan be estimated as:
Method 1. The difficulty of the most difficult item answered correctly.
Method 2. The difficulty of the n+ lth item (the next item that would have been presented if testingcontinued).
Method 3. The difficulty of the most difficult item answered correctly below the subject's ceilingstratum.
Stratum scores. Since the stradaptive pool can be considered a series of peaked tests, the averagedifficulty of the items within each of the strata is a measure of examinee ability for subjects whose ability lieswithin a strata. This rationale suggests four stratum scoring methods similar to methods 1 through 3. Asubject's ability score can be estimated by:
Method 4. The average difficulty of the highest stratum in which at least one item was answeredcorrectly.
Method 5. The average stratum difficulty of the n + lth item.
Method 6 The average item difficulty at the stratum just below the ceiling stratum.
Scoring method 7 (the interpolated stratum difficulty score) weights method 6 by the Pc at the highestnon-chance stratum, thus resulting in a continuous range of ability estimates.
Method 7. This scoring method is defined as:
A = Dc-1 S(Pc 1 .5°)where
I Dc-1 = the average difficulty of theclth stratum where c is theceilingstratum
Pc-1 = the subject's proportion answeredcorrectly at the c-1th stratum
and S = Dc Dc_ if Pc_ > .50
or S = De_ if Pc_i < .50
where
average difficulty of the designated stratum.
25
'29
This scoring method makes asu:nption that the subjects ability lies at the mean difficulty of:peaked test (strattim) if exactly 5,0% of tke items are answered correctly. Ability is estimated proportionallybetween the midpoint of his CI' and C strata.
Unlike the other 3 stratuin scoring methods, method 7 results in a hypothetical continuous range ofpossible scores along the entire continuum of ability.
Average difficulty scores. Three possible scoring methods are analogous to Lord's average difficultymethods. They estimate a subject's ability to be:
'Method 8. The average difficulty of all of the correctly answered items.
Method 9. The average difficulty of all items answered correctly between the basal stratum and theceiling stratum.
The scoring of method 9 was redefined in this study from Weiss' original definition. As specified by Weiss,method 9 was not usable when basal and ceiling strata were adjoining. When this result occurred in the presentstudy, score 9 was defined as:
A=Db+S(P0where Db = average difficulty of items answered correctly in basal stratum
and S =Dc Dc_
Method 10. The average difficulty of items correctly answered in the highest non-chance stratum.
Two other revisions were made by the author to Weiss' scoring suggestions. If no basal ceiling wasestablished (i.e., no stratum emerged with 100% correct responses), it was assumed that the subject's basalstratum lay immediately below the lowest stratum with a correct response in it. Similarly, if no ceiling stratumwas defined (i.e., the subject scored above 25% correct in all strata utilized), the subject's ceiling strata wasassumed to be immediately above the highest non-chance stratum.
The author made one other change in the Weiss model. Weiss had reported (1973) a problem whereinsubjects of extremely high ability, "topped out" his test and answered a high percentage of the presented itemsin stratum 9 correctly. Hence, an amendment to the 5 item/25% termination criterion was needed.
Since the probability of a subject of true ability less than the average difficulty of stratum 9 correctlyanswering a stratum 9 item is <.50, the joint probability of such an individual correctly answering 5 items instratum 9 in a row is <.05, the alpha level used throughout this research. Therefore, whenever 5 items in a rowwere correct in stratum 9, testing was ternunated. The subject's basal stratum was not affected by the earliertermination, but his ceiling stratum became "stratum 10," whose mean difficulty was:
' Di 0 +(Ds Ds)where Di = mean difficulty.of all items in stratum i
This change resulted in ability estimates for examinees in this category theoretically ranging from 2.27 to3.75 for scoring methods 9 and 10. Such ability estimates would seem to be appropriate for subjectsdemonstrating such a strong response pattern.
Termination Rules
As indicated earlier, Weiss had two versions of his stradaptive testing computer program. Version one,which was used in this study, presented another item lathe. same stratum when a subject skipped gn item.
. The ,author of this study was unaware of the existence of the second branching strategy program prior tocompletion of data collection. However Weiss' program procedure of ignoring skipped items in determiningtest termination was questioned. It appeared that valuable information was being lost when the Weissprocedure was followed.
It was reasonable to expect that a subject would omit an item only which he felt he had no realknowledge of the correct answer. Thus, investigation of the ten scoring methods with termination based uponomits counted as wrong answers was judged appropriate.
3026
Weiss had set 5 items in the ceiling stratum as the minimum constraint upon termination. A secondarygoal of the present study was to determine what effect the reduction of this constraint to 4 would have uponthe effectiveness of the 10 scoring methods in the stradaptive tests.
The two questions of the handlingof omits and the variation in the constraint on the termination oftesting created the following three methods for comparisons:
Termination Method 1: Omits ignored/constraint =5 items
Termination Method 2: Omits= wrong/constraint = 5 items
Termination Method 3: Omits ltwrong/constraint = 4 items
Data was collected using termination Method 1 and then rescored using Methods 2 and 3 for each of the10 scoring methods. This was possible since no indication of the termination of the first test was given to thesubject and since items were randomly ordered; within strata. Once test termination was reached usingtermination Method 2 or 3, the next item taken by the subject in his entry point stratum acted as the start of aparallel forms test under the termination rule used.
Of course, Method 2 required less item than Method I and Method 3 considerably leuthan Method 2.The thrust of Oa-investigation, then, was to determine the relative efficiency of the three methods incomparison with one another and with linear testing after equalizing test length using the Spearman-Brownprophecy formula.
Stradaptive Test Output
Figure 8 provides an example of a stradaptive test report from this experiment. A "+" next to an itemindicates ecorrect response; a "" an incorrect response, and "?" shows that the subject omitted the item.
The examinee in Figure 8 estimated her ability as "5." Hence, her first item was the first item in the fifthstratum. She correctly answered this question, but missed her second item, the first item stored in the 6thstratum. She skipped the next item, and after responding somewhat inconsistently for the first nine items,"settled down" with a very consistent pattern for items 10 through 19 when she reached stoppingrule criterionand her first test terminated.
At this point in her stradaptive testing, the testing algorithm selected the 6th item in stratum 5 (herability estimate) to commence her second test. (The subject was totally unaware of this occurrence, as nonoticeable time delay occurred between her 19th and 20th items).
At the, conclusion of her 31st item, thii subject reached termination criterion for her second test, wasthanked for her help in this research project, and given her score of 15 correct answers out of 31 questions witha percentage correct of 48.4%. ,
The scores for this subject are shown for both tests. The, interested reader may gain a more thoroughunderstanding of the scoring methods used in this model by tracing this subject's ability estimate scoresthrough Table 3.
N. PROCEDURES
Item Pool Construction
Item pool data received from Educational Testing Service entailed five SO-item verbal analogy tests,Forma 1A, 1B, IC, 2A and 2B of the SCAT Series U examinations. These tests had been nationally normed.on asample of 3133 twelfth grade students in October, 1966. The five tests were not of equal 'difficulty, as shownby Table 4, with test IC considerably more difficult thar. the other 4 tests.
P-values and Muriel correlations were provided by ETS on 249 of the 250 items on the five forms,excluding item number 150, statistics for which were not available. Upon inspection of these indices, itemnumber 169 was removed from the pool due to a biserial correlation of only .10, considered too low for anadaptive test.
Prior to resealing the item statistics to normal ogive parameters, item difficulties were adjusted by addingan arbitrary value of + .04 to all norm group P-values. This was done to compentate for maturation of subjectsbetween the age at norming and the age at the experimental testing. The SCAT Series I Technical Manual
270
.6
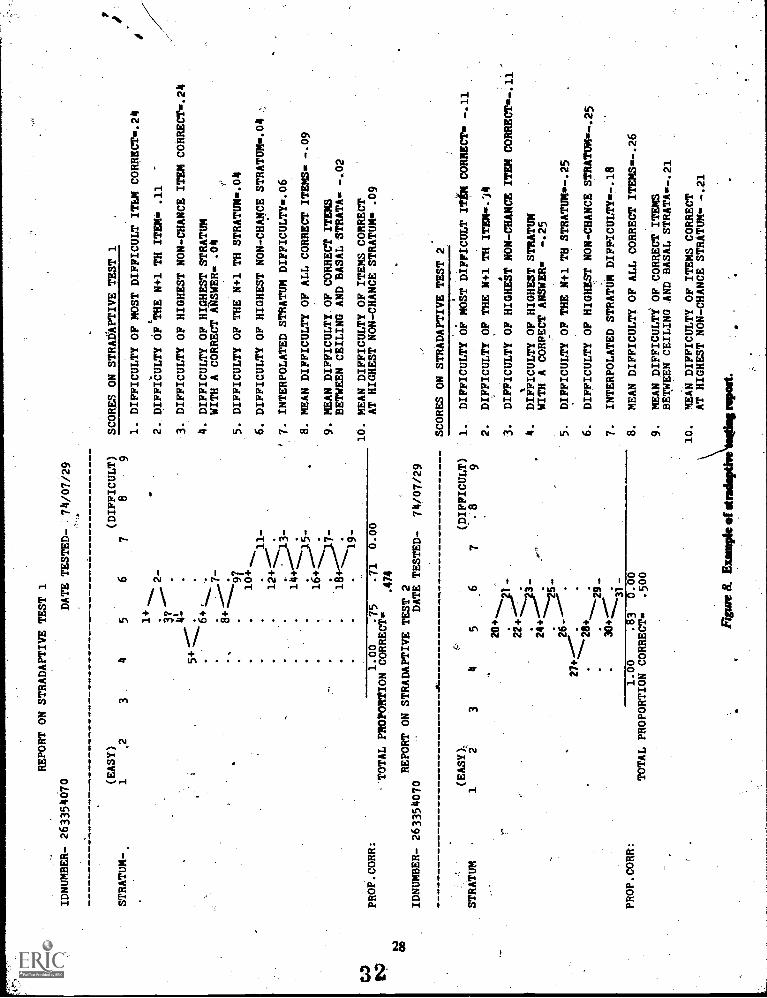
REPORT ON STRADAPTIVE TEST 1
IDNUMBER- 263354070
DATE TESTED-
74/07/29
STRATUM-.
(EASY)
(DIFFICULT)
SCORES ON STRADAPTIVE TEST 1
1,2
3.
45
67
89
1+
i?
2-
5+-
.6+.
97
10+
.11 -
12+-""
.
9. MEAN DIFFICULTY. OF CORRECT ITEMS
BETWEEN CEILING AND BASAL STRATA= -.02
1. DIFFICULTY OF MOST DIFFICULT ITEM CORRECT-.24
2. DIFFICULTY OF THE N+1 TH ITEM- .11
'
3. DIFFICULTY OF HIGHEST NON-CHANCE ITEM CORRECT=. 24
4. DIFFICULTY OF HIGHEST STRATUM
WITH A CORRECT ANSWER- .04
5. DIFFICULTY OF THE N+1 TH STRATUM=.04
6. DIFFICULTY OF HIGHEST NON-CHANCE STRATUM-.O4
7. INTERPOLATED STRATUM DIFFICULTY-.06
8. MEAN DIFFICULTY OF ALL CORRECT ITEMS= -.09
COD
10. MEAN DIFFICULTY OF ITEMS CORRECT
PROP.CORR:
1.00
.75
.71
0.00
AT HIGHEST NON-CHANCE STRATUM= .09
t.42
TOTAL PROPORTION CORRECT=
474
t..)
00
REPORT ON STRADAPTIVE TEST 2
IDNUMBER- 263354070
DATE TESTED-
74/07/29
SCORES ON STRADAPTIVE TEST 2
(EASY),
(DIFFICULT)
1.
DIFFICULTY OF MOST DIFFICULT IT( CORRECT= -.11
STRATUM
12
34
56
7.8
92.
DIFFICULTY OF THE N+1 TH ITEM=. ".14
20+,......
, -3.
DIFFICULTY OF HIGHEST NON-CHANCE ITEM CORRECT= -.11
22+... .
s23_
4.
DIFFICULTY OF HIGHEST STRATUM
24+-''''"P
WITH A CORRECT ANSWER=
-.25
-...."2i -
26--.
5.
DIFFICULTY OF THE N+1 TH STRATUM--.25
274.---''.
.
........
.28+
6.
DIFFICULTY OF HIGHEST NON-CHANCE STRATUM=-.25
.
'
7.
INTERPOLATED STRATUM DIFFICULTY--.18
--11-
PROP.CORR:
1.00
.83
0.00
8.
MEAN DIFFICULTY OF ALL CORRECT ITEMS= -.26
TOTAL PROPORTION CORRECT=
.500
9.
MEAN DIFFICULTY OF CORRECT ITEMS
BETWEEN CE/LING AND BASAL STRATA= -.21
10.
MEAN DIFFICULTY OF ITEMS CORRECT
AT HIGHEST NON-CHANCE STRATUM= -.21
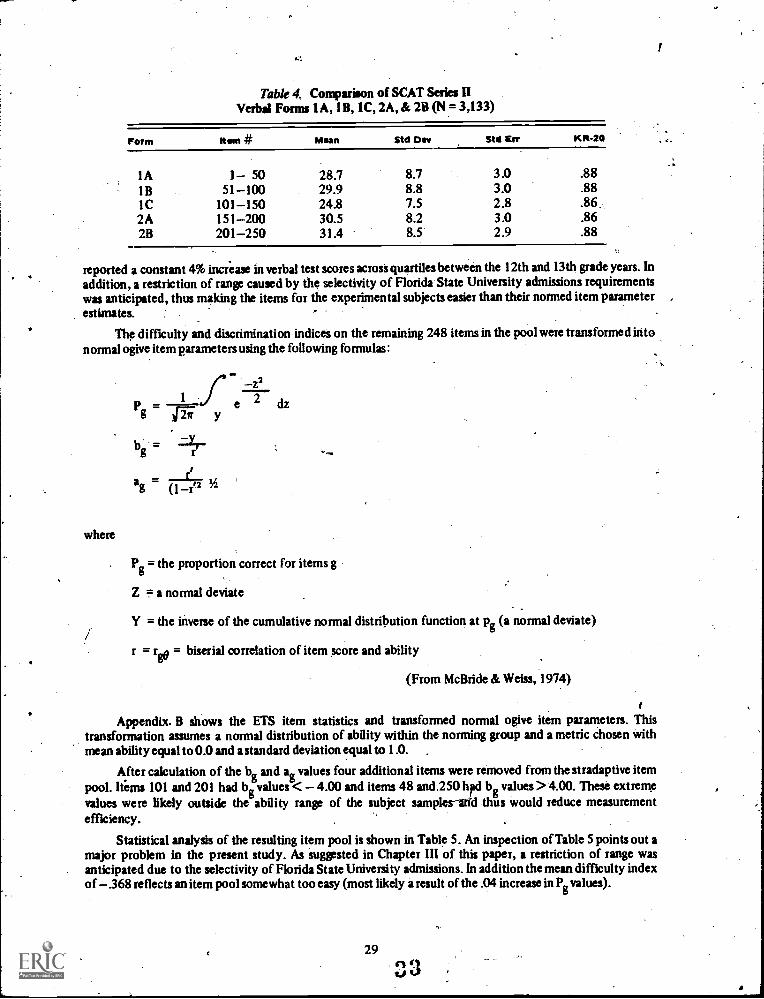
Table 4. Comparison of SCAT Series IIVerbal Forms 1A, 1B, 1C, 2A, & 2B (N = 3,133)
Form Kim # Moan Std Div Std Err KR-20
IA 1 50 28.7 8.7 3.0 .881B 51-100 29.9 8.8 3.0 .881C 101-150 24.8 7.5 2.8 .86.2A 151-200 30.5 8.2 3.0 .862B 201-250 31.4 8.5 2.9 .88
reported a constant 4% increase in verbal test scores across quartiles between the 12th and 13th grade years. Inaddition, a restriction of range caused by the selectivity of Florida State University admissions requirementswas anticipated, thus making the items for the experimental subjects easier than their normed item parameterestimates.
The difficulty and discrimination-indices on the remaining 248 items in the pool were transformed intonormal ogive item parameters using the following formulas:
where
Pg 421ff
e
b
ag
= (142
z22 dz
Pg = the proportion correct for items g
Z F a normal deviate
Y = the inverse of the cumulative normal distribution function at pg (a normal deviate)
r = rge = biserial correlation of item score and ability
(From McBride & Weiss, 1974)
Appendix. B shows the ETS item statistics and transformed normal ogive item parameters. Thistransformation assumes a normal distribution of ability within the norming group and a metric chosen withmean ability equal to 0.0 and a standard deviation equal to 1.0.
After calculation of the bg and ag values four additional items were removed from the stradaptive itempool. Items 101 and 201 had b valuesg< 4.00 and items 48 and .250 had bg values > 4.00. These extremevalues were likely outside the ability range of the subject samples--0`.--d thus would reduce measurementefficiency.
Statistical analysis of the resulting item pool is shown in Table 5. An inspection of Table 5 points out amajor problem in the present study. As suggested in Chapter III of this paper, a restriction of range wasanticipated due to the selectivity of Florida State University admissions. In addition the mean difficulty indexof .368 reflects an item pool somewhat too easy (most likely a result of the .04 increase in Pg values).
29
I

Table 5. Descriptive Statistics of Difficulty (be)and Discrimination (as) Normal Ogive Parameter
Normal OgiveParameter Mean Std Der Std Err Kusteds Skewness
Discrimination (as) .576 .175 .011 .19 .37Difficulty (bg) '348 1.132 .072 .33 .37
The distribution of a values was satisfactory, with only a slight skew and a mean as of .57, but thecombined effect of a relativIly easy item pool coupled with an expected high ability subject pool suggested thepossibility of lowered validity, and internal consistency reliability coefficients for the conventional (linear)test group.
Subject Pool
Each summer, approximately six weeks prior to the start of the academic school year, Florida StateUniversity conducts a three-day University orientation for incoming freshmen. In late July, 1974, thirteenhundred students attended the orientation program, 27% of the scheduled first year enrolees.
Each orientation participant received welcoming packages including a letter from the author of thispaper. Appendix C presents a copy of the letter,which requested voluntary participation in a computer-basedresearch project. The voluntary nature of the request was required by University orientation officials. Oneother source of subject recruitment was utilized. The CRT's used in this experiment were located in the FSUlibrary's listening and viewing center. The library held three library orientation tours each day of theorientation program to acquaint the new students with the library facilities. When these groups were broughtto the area of the listening and viewing center, the author of this paper made "a pitch" for volunteers for theproject.
Of the 103 subjects who participated in the research, 87 had previously taken the Florida 12th GradeVerbal Ability test (12V). Like the SCAT-V, items used idthe item pool, 12V items were verbal analogies,prepared by ETS for the State of Florida. Item format was identical to SCAT Series II Verbal item format.Reliability (KR-20) of the 12V was reported as .87 for 50 items with a 20 minute time limit. The 12V, thus,provided an ideal validity criterion for comparison with linear and stradaptive scores from this experiment. Inaddition, 12 of the subjects without 12V scores had taken either the American College Testing Program (ACT)or College Entrance Examination Board (CEEB) verbal tests which had equivalency tables to the 12V. Nocriterion scores were available for two of the stradaptive subjects and one of the linear/examinees. Validityindices were thus computed with N = 53 for the stradaptive group and 46 for the linear.
Table 6 shows the comparison between 12V nonrdng group statistics and the subjects sampled in thisexperiment. As can be readily seen in Table 6, the suspected restriction of range was certainly evident.
Table 6. Comparison of Florida 12th Grade Verbal Test Scares(1973 Statewide Administration Ts. Subject Sample)
Test Greekhilsso
re 12V Seer* nal Dew
Statewide Norming Group . 81000 26.15 8.26Experiment Participants 99 33.83 5.94
Pr (µstale P exp) = < .001Pr (e stale = cr2 exp) <.001
30
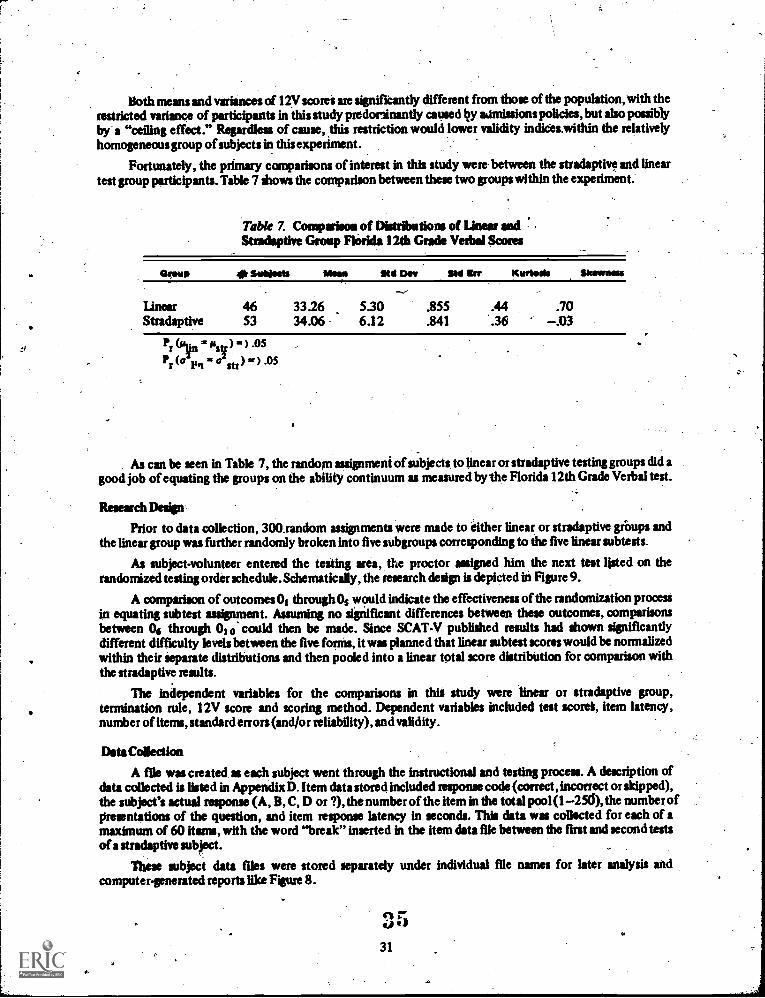
Both means and variances of 12V scores are significantly different from those of the population, with therestricted variance of participants in this study predominantly caused by admissions polities, but also possiblyby a "ceiling effect." Regardless of cause, this restriction would lower validity indiees.within the relativelyhomogeneous group of subjects in this experiment.
Fortunately, the primary comparisons of interest in this study were between the stradaptive and lineartest group participants. Table 7 shows the comparison between these two groups within the experiment:
Table 7. Comparison of Distributions of Linear andStradaptive Group Florida 12th Grade Verbal Scores
Grimm 0 Saddest. Mon Ind Dev lid Err Kurtosis Skowniss
Linear 46 33.26 5.30 .855 .44 .70Stradaptive 53 34.06 6.12 .841 '.36 .03
Pr 0Avn Pm) ) .05
Pr (a Fix estr) ) .05
As can be seen in Table 7, the random assignment of subjects to linear or stradaptive testing groups did agood job of equating the groups on the ability continuum as measured by the Florida 12th Grade Verbal test.
Research Design..
Prior to data collection, 300.random assignments were made to either linear or stradaptive grimps andthe linear group was further randomly broken into five subgroups corresponding to the five linear subtexts.
As subject-volunteer entered the testing area, the proctor assigned him the next test listed on therandomized testing order schedule. Schematically, the research design is depicted in Figure 9.
A comparison of outcomes 01 through 05 would indicate the effectiveness of the randomization processin equating subtest assignment. Assuming no significant differences between these outcomes, comparisonsbetween 06 through OH, could then be made. Since SCAT-V published results had shown significantlydifferent difficulty levels between the five forth:, it was planned that linear subtest scores would be normalizedwithin their Separate distributions and then pooled into a linear total score distribUtion for comparison withthe stradaptive results.
The independent variables for the comparisons in thit study were linear or stradaptive group,termination rule, 12V score and scoring method. Dependent variables included test :cord, item latency,number of items, standard errors (and /or reliability), and validity.
Data Collection
A file was created as each subject went through the instructional and testing process. A description ofdata collected is listed in Appendix D. Item data stored included response code (correct, incorrect or skipped),the subject's actual response (A, B, C, D or ?), the number of the item in the total pool (1-250, the number ofpresentations of the question, and item response latency in seconds. This data was collected for each of amaximum of 60 items, with the word "break" inserted in the Item data file between the first and second testsof a stradaptive subject.
These subject data files were stored separately under individual file names for later analysis andcomputer-generated reports like Figure 8.
It/
31
O
ff

SAMPLING STRATEGY
R
Linear. - R
Linear 1
/Linear 2
Linear 3
Linear 4
Linear 5
# Sub-sects
8
7
9
13
10
Linear Total 4?
12th Gr.' Verbal CRT Verbal
01 06
02 07
03 08
04 09
05 010
011 012
Stradaptive 55 013. 014 015Total
R = Randomization, 91= Measureme.e.t Outcome for Outcome i
Figure 9. Research design for linear versus stradaptive group assignment and comparison.
Data Analysis
The following analyses were planned:
1. Total linear vs. total stradaptive using 3 termination rules and 10 scoring methods.
(a) Standard errors of measurement
(b) Reliability (parallel forms and KR-20)
(c) Validity (correlation between 12V and test scores) number of items per terminated test
(d) Item latency
2. Correlation between the linear subject's ability estimate and his 12V score and linear test score.
3. Correlation between the linear subject's 12V scores and item latency.
4. Correlation between scores of any subjects who took both linear and stradaptive tests, (Thissituation was not part of the original design of this experiment, but a few subjects requested to "do it again"and were administered the "other" test). This correlation coefficient would be spuriously high due to commonitems between the linear test and approximately 1/5t" of the items on the stradaptive test.
Attitudinal Data
Consideration had been given to preparing a questionnaire to survey subject reaction to thecomputer-based mode of test, presentation used in this study. It was decided to forego a formal attitudinalstudy for the following reasons:
3G32

1. Considerable evidence already exists pertaining to subject reaction to computer-assisted testing andinstruction (Hansen, 1969). The computer mode of presentation evidently does not decrease subject testperformance.
2. The main thrust., of the current research was r validation of the stradaptive model, not ofcomputer-testing.
3. Subjects took only computer-based testing and therefore probably had no realistic basis ofcomparison.
Despite these considerations, the closing screen shown each subject before he left the CRT did requestany comments he might have about computer testing "to aid the =searchers in future studies." Thesecomments were jotted into a ledger for synopsizing in the conclusion section of this paper.
V. RESULTS AND DISCUSSION
Table 8 shows * comparison of the distribution of theive linear subtests and their respective 12V scoredistribution.
Table & Comparison of Distributions of S Linear Subtests
SmartestGroup N Mean Std Der re Std Dor Kurtosis Skewness
12th Grade Seen . Sulked Seers
1 8 36.1 7.43 .76 .11 -.69 .322 7 32.6 3.82 .68 .15 -.96 .523 9 30.5 3.62 .53 .08 -1.39. .244 13 33.4 6.65 .81 .08 -.61 -.565 10 32.4 4.67 .76 .10 -.47 -.56
Surprisingly, the mean 12V score of the group taking linear test 1 was significantly higher than the otherfour groups (p = C .05). In the comparison of the proportion of the items answered correctly (omits countedwrong) on the five subtests, linear 4 was significantly easier than linear 2 and is expected, linear 3 wassignificantly more difficult than the other four subtests. In addition, linear 3 produced a decidedly platykurticdistribution, while linear 4 and linear S evidenced a concentration of responses at the highei end of thedistribution.
Despite these differences in distribution shape, the five subtests were normalized and then pooled forgroup comparison with stradaptive test results. The resulting distribution of total linear scores is shown inTable 9. The distribution was essentially normal, though platykurtic.
Table 9. Distribution of Pooled Linear Test Scores
Std Div Std Err Kurtosis Skewness.
-.02 .946 .138 -.67 0.06
33
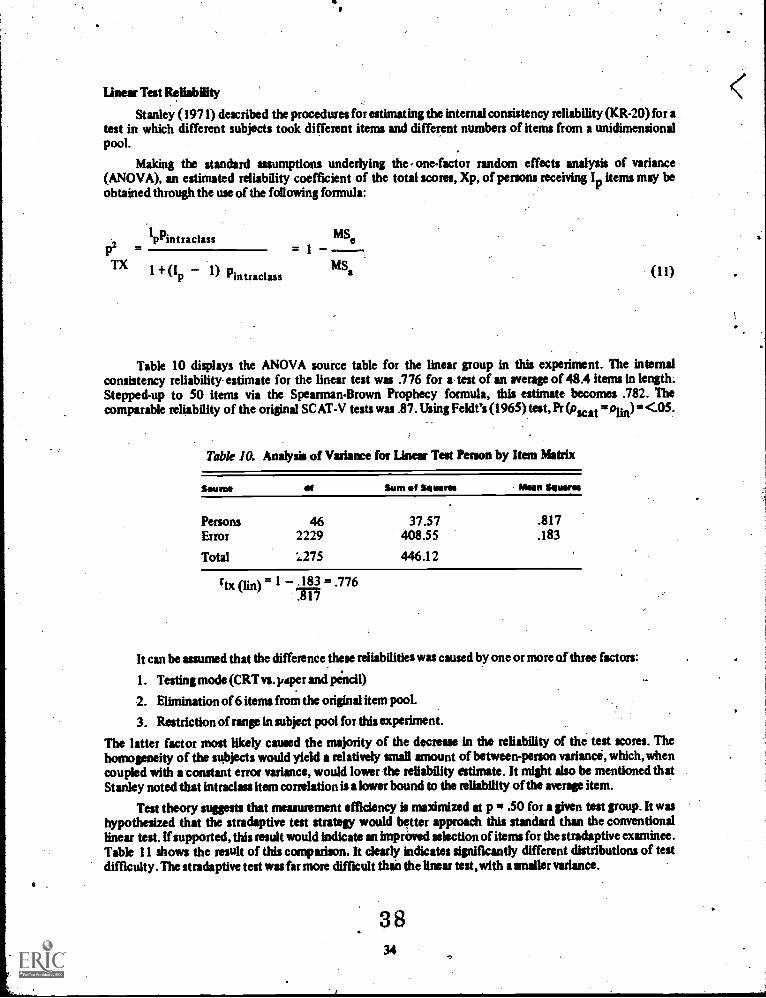
Linear Test Reliability
Stanley (1971) described the procedures for estimating the internal consistency reliability (KR-20) for atest in which different subjects took different items and different numbers of items from a unidimensionalpool.
Making the standard assumptions underlying the one-factor random effects analysis of variance(ANOVA), an estimated reliability coefficient of the total scores, Xp, of persons receiving 1p items may beobtained through the use of the following formula:
IpPintraclass
TX 1 + (I 1) Pintraclass
MSe= 1
MSa
Table 10 displays the ANOVA source table for the linear group in this experiment. The internalconsistency reliability estimate for the linear test was .776 for a test of an average of 48.4 items in length.Stepped-up to 50 items via the Spearman-Brown Prophecy formula, this estimate becomes .782. Thecomparable reliability of the original SC AT-V tests was .87. Using Feldt's (1965) test, Pr (plat <05.
Table 10. Analysis of Variance for Linear Teat Person by Item Matrix
SOU MO sec Sum of Smarm Mean &puma
PersonsError
Total
462229
'..275
37.57408.55
446.12
.817.183
rtx (lin). 1 144 = .776
It can be assumed that the difference these reliabilities was caused by one or more of three factors:
1. Testing mode (CRT vs. paper and pencil)
2. Elimination of 6 items from the original Item pool.
3. Restriction of range in subject pool for this experiment.
The latter factor most likely caused the majority of the decrease in the reliability of the test scores. Thehomogeneity of the subjects would yield a relatively small amount of between-person variance, which, whencoupled with a constant error variance, would lower the reliability estimate. It might also be mentioned thatStanley noted that intrados item correlation is a lower bound to the reliability of the average item.
Test theory suggests that measurement effidency is maximized at p = .50 for a given test group. It washypothesized that the stradaptive test strategy would better approach this standard than the conventionallinear test. If supported, this result would indicate an imprinted selection of items for the stradaptive examinee.Table II shows the result of this comparison. It clearly indicates significantly different distributions of testdifficulty. The stradaptive test was far more difficult than the linear test, with a mailer variance.
3834

Table 11. Comparison of Difficulty Distributions (Pc)for Linear and Stradaptive Groups
Group ardSubleets (Pe) Std Doe Std Err Kurtosis Skewness
Linear. 47 .752* .123** .018 .87 .39Stradaptive 55 .584 .084 .011 5.14 r.97
*Pr (Asti = uLin) = <.0001* *Pr (02str- = 02Lid <05
aQC XI) Ola PO=
(o2a/na) + (oPnb)
$2 largest**C
rS;
This test makes no assumptionabout the equality of populationvariances. (from: Winer, 1971)
Cochran's Test for Homogeneityof Variance (from: Winer, 1971)
Linear Test Validity'
The reported correlations of the SCAT-V Series II scores with several criteria are summarized in Table12. The correlation of obtained linear scores with the Florida 12th Grade scores was .477, which was lowerthan the published. SCAT-V:SAT-V correlation (p = <.01). As with the linear reliability, this differenceprobably resulted from the homogeneous distribution of subjects in this experiment.
Table 1Z Reported Correlations of SCAT-V Scores with External Criteria
Criterion N r12
High School English-Grades 244 .46Normalized Rank in Graduating Class 244 .49Rank in Graduating Class 518 .52SAT-V 244 .83
Stradaptive Pool Item Stratification
Table 13 summarizes the proportion of items in each stratum that were actually used in the stradaptivetesting.
Table 13. Proportion of Items in Each StratumActually used in CRT Stradaptive Testing
(N = 55)
Proportion 1 2 3 4Stratum
5 7 8
Number of Itemsin Stratum 20 26 33 39 31 28 26 22 19
Available ItemsUsed WithinStratum .10 .12 .18 .38 .68 .61 1.00 1.00 1.00
3935

The results depicted in Table 13 tend to contradict Weiss' suggestion that a larger proportion of itemsshould be assigned to lower and middle strata (Weiss, 1973). The present -author recommends that the decisionbe based. upon prior knowledge of the distribution of ability of the subject pool to be tested. Such priorknowledge includes school admissions requirements and any other information the decision-maker may haveavailableabout the target population ability level.
Stradaptive Total -Test Reliability
Using Stanley's (1971) procedure, it was possible to estimate the internal-consistency reliability of the 0person-by-item stradaptive test matrix using scoring method 8. Appendix A, columns 7-9, shoin the patternof item presentation across subjects. Of the 244 items in the stradaptive pool, only 133 items were actuallypresented to the subject pool in this experiment.
Scoring method 8 provided the only set of stradaptive test Scores wherein a person's total test score was alinear function Of his item scores. Hence, scoring method 8 was used to estimate internal-Consistency reliabilityusing Stanley's ANOVA procedure. Table 14 summarizes these results.
In addition to the internal-consistency reliability estimate shown in Table 14, parallel-forms correlationon the total stradaptive pool using the three termination rules with ten scoring methods were calculated. Table15 displays these results.
Table 14. Analysis of Variance of Scoring Method 8of Stradaptive Test Person-by-Item Matrix
TerminationRule Source If Sum of Stumm Mean Stilling
Persons 54 191.941 3.555Error 1675 588.253 . .351Total 1729 (r20 = .901)
Persons 54 178.870 3.312Error 1401 470.442 .336Tc,lal 1455 (r20 '899)
Persons 54 155.841 2.8863 Error 1001 366.447 .366
Total 1055 (r20 '873)
Table 15 shows the statistical analysis of the differences between parallel-forms reliability estimates onthe stradaptive test scores. Significance of the differences in reliability coefficients (rxx) was detErmined usingFerguson's (1971) formula.
Table 16 shows the parallel-forms and KR-20 reliability estimates for the three termination rules used inthis study. Direct comparisons can be made between the stradaptive KR-20 values and the .776 linear KR-20estimate. According to Feldt's (1%5) approximation of the distribution of KR-20, all of the estimates of thestradaptive test reliability are significantly (p = <.05) better than the linear KR-20 estimate prior to beingstepped-up by the Spearman-Brown formula Pr(.675 < P21) < .858) = .95. Thus, the 19, 26, and 31 itemstradaptive tests all proved more reliable than the 48 item linear test. This is the key finding in this study.
A comparison of the linear internal-consistency reliability coefficient (rtx) and the stradaptiveparallel-forms reliability estimate (r ) can be considered only tentatively sine they an a different kind ofestimate of the true reliability. T ie sampling distribution of ri is known and that of rty has beenapproximated by Feldt (1965). Cleary and Linn (1969) compared standard errors of both indices with
4036

4.
r.
TABLE 15
Comparison of Parallel-Forms, Rellabilities for 10 Stradaptive Test
Scoring Methods under Three .Termination Rules. Stepped -Up to 50 Items
SCORING METHOD
(fp a 31.45) rxx
Statistically Signi-*ficant differences
SCORING METHOD
TERMINATION RULE 1
(N =.12)
8 6 4 10 __a_
.929 '010 ..902 .879 .703 .620 .616*
--I- 5 --Z
.436 ---1ITERMINATION RULE 2
(N = 26)
8 6 10 1 4
= 26.47) rxx .806 .782 .750 .698 .682 .614 .432 .379
Statistically Significant differences I
2
SCORING METROD
(rp 19.2) rx:;Statistically Signi-*fioant differences
TERMINATION RULE 3
(N = 38)
-.12:2- -2-
.903 .821 .820 .791 .784 .689 .590 .587 .582 .513
*
1 2 4
1 ;negative parallel,,forms correlation - differences not calculated
r . mean number of items for ?his termination rule
P = < 05:, between
41
37

Table 16. Comparisorrof Scoring Method 8 Parallel Form Reliabilitywith KR-20 Reliability Over Three Termination Rules
Stepped Up to SO Mina
1
Termination Rule
2 3
= 12) (N = 28)Parallel r (raw) .892 .688Forms rxx(50) .929 .806
(N =38)-.732.903
(N =55) (N=55) (N =55)P2 0(raw) .901 .899 .A73
KR-20 P2 o (50) .935 .943 .947K1 . ".-'
131 45 K. = 26 Kt47 \= 2
Ki = average number of items under termination, rule i.
generated data of known p. They found the standard error of KR-20 to be somewhat smaller th that of theparallel-test correlation (approximately .05 vs..04 in the range of reliabilities, number of subjects, d numberof items involved in this experiment). Should these results generalize to this study, scoring methods 6, 7,8, and9 under termination rule 1, and scoring method 8 under termination rule 3 produced higher reliability than thelinear test.
The interpretation of the results shown in Table 15 was clear. In the comparison ofscoring methods,methods 6, 7, 8, and 10 were significantly (a = .05) more reliable than methods 1, 2,.and 5 within all threetermination rules. Scoring method 8 produced the highest reliability estimate undefall three termination rule's.In the comparison between the three termination rules, methods 1 and 3 are significantly better than method 2(p = <.05) using the Wilcoxon MatchedPairs-Signed-Ranks Test (Siegel, 1956).
Stradaptive Test Validity
The validity coefficients of the 10 stradaptive scoring methods under the three termination rules isshown in Table 17. Validity was estimated by the correlation between the test scores and 12V scores.
Table 17. Comparison of Validity Coefficients of 10Stradaptive Test Scoring Methods Under Three Termination Rules
Termination Rule 1(N=64)
Scoring Method 8 9 1 5 7 3 10 6 2 4rcl .526 .513 .477 .443 .437 .425 .395 .385 .380 .370
Termination Rule 2(N =80)
Scoring Method 8 9 7 3 5 1 10 6 2 4rc2 .536 .501 .471 .420 .403 .397 .393 .365 .350 .275
Termination Rule 3(N = 91)
Scoring Method 7 5 8 3 9 6 2 ,10 1 4rc3 .509' .500 .499 .492 .476 .467 .455 .442 .410 .240
rci correlation between criterion measure (12V) and scoring method i.
i238
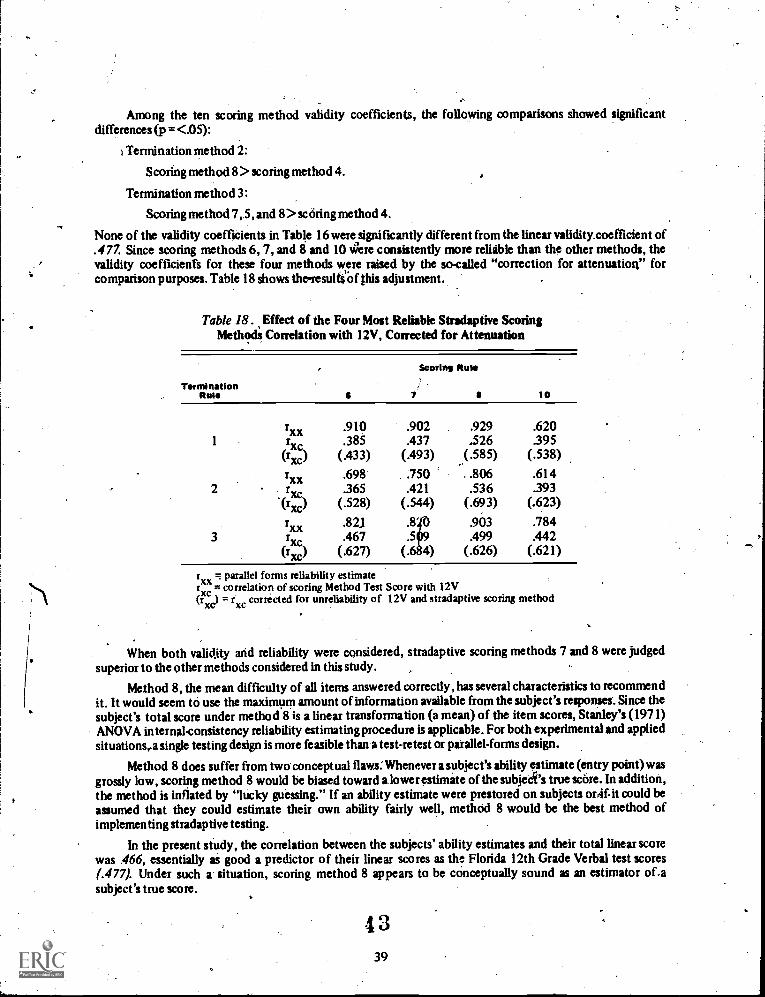
Among the ten scoring method validity coefficients, the following comparisons showed significantdifferences (p =<.05):
Termination method 2:
Scoring method 8> scoring method 4.
Termination method 3:
Scoring method 7,.5, and 8> scoring method 4.
None of the validity coefficients in Table 16 were significantly different from the linear validity.coefficient of.477. Since scoring methods 6, 7, and 8 and 10 were consistently more reliable than the other methods, thevalidity coefficients for these four methods were raised by the so-called "correction for attenuation" forcomparison purposes. Table 18 shows the-results of this adjustment.
Table 18 . Effect of the Four Most Reliabk SUradaptive ScoringMethods Correlation with 12V, Corrected for Attenuation
TerminationRule
Scoring Rule
10
1
2
rXXrxc
(rxc)
rXX
r(rxc)
rxxr
(rxc)
.910
.385(.433)
.698
.365(.528)
.82J
. 467(.627)
.902
.437(.493)
.750
.421(.544)
.8'
.5
4)
.929.526
(.585)
..806.536
(.693)
.903
. 499(.626)
.620
.395(.538)
.614
.393(.623)
.784
.442(.621)
r parallel forms reliability estimatexx = correlation of scoring Method Test Score with 12V(cc) = rxc corrected for unreliability of 12V and stradaptive scoring method
When both validity and reliability were considered, stradaptive scoring methods 7 and 8 were judgedsuperior to the other methods considered in this study.
Method 8, the mean difficulty of all items answered correctly, has several characteristics to recommendit. It would seem to use the maximum amount of information available from the subject's responses. Since thesubject's total score under method 8 is a linear transformation (a mean) of the item scores, Stanley's (1971)ANOVA internal -consistency reliability estimating procedure is applicable. For both experimental and appliedsituations,.a single testing design is more feasible than a test-retest or parallel-forms design.
Method 8 does suffer from two conceptual flaws:Whenever a subject's ability estimate (entry point) wasgrossly low, scoring method 8 would be biased toward a lower estimate of the subject's true score. In addition,the method is inflated by "lucky guessing." If an ability estimate were prestored on subjects °MI: it could beassumed that they could estimate their own ability fairly well, method 8 would be the best method ofimplementing stradaptive testing.
In the present study, the correlation between the subjects' ability estimates and their total linear scorewas .466, essentially as good a predictor of their linear scores as the Florida 12th Grade Verbal test scores(.477). Under such a situation, scoring method 8 appears to be conceptually sound as an estimator of.asubject's true score.
4339

In the case where no ability estimate was alallable for examinees, and it could not be assumed that theycould fairly accurately estimate their own ability (young children, for example) method '7 would be therecommended scoring method on ittradaptive test.
linear vs. Stradaptive Comparisons
Given the stradaptive -test scoring recommendations in the previous sec 6n, how do linear andstradaptive testing procedures compare overall? Table 19 shows the results of thee/ /threethree termination rules forscoring method 8 of the stradaptive test along with linear test statists.
Table 19. Comparison of Linear Test with /
Scoring Method 8 Under Three Termination Rulesof the Stradaptive Test
StradaptIve Test Termination Method
Linear Test 1 2 3
To tal Test Variance
.817 .403 .433 .433Standard Error of Measurement
.428 .162 .157 .157KR-20 Reliability
.776 .935 .943 .947Parallel Form Reliability
.929 .806 .903Validity
.477 .526 .536' .509Validity (Corrected for Attenuation)
.546 .585 .693 .626
*No linear parallel-forms reliability calculated.
Table 19 provides strong evidence that the measurement efficiency of the average item on the stradaptivetest is as good or better than the conventional test. Nevertheless, unless a reduction in the number of itemsrequired occurs, as well as a reduction in testing time, the theoretical gain in efficiency may not have real-worldvalue.
Table 20 shows the difference in number of items presented for the linear and the three terminationmethods of the stradaptive test. The consistency in average number of items presented per subject wassurprisingly constant over the two parallel tests of termination methods 1 and 3. Method 2 did show a
Table 20. Comparison of Average Number of Items for Linear Test andThree Termination Methods of Alternate Form Stradaptive Tests
Test *SubjectsAvg *Items
Std Div# Items
Avg *Items
Std Dew# Items
linear 47 48.43 .99
Stradaptive Test 1 Test 2
. Method 1 55 31.46 18.03 38 30.92 12.54Method 2 55 26.94 16.76 41 21.98 13.10Method 3 55 19.20 14:06 47 . 18.19 11.34
40
44
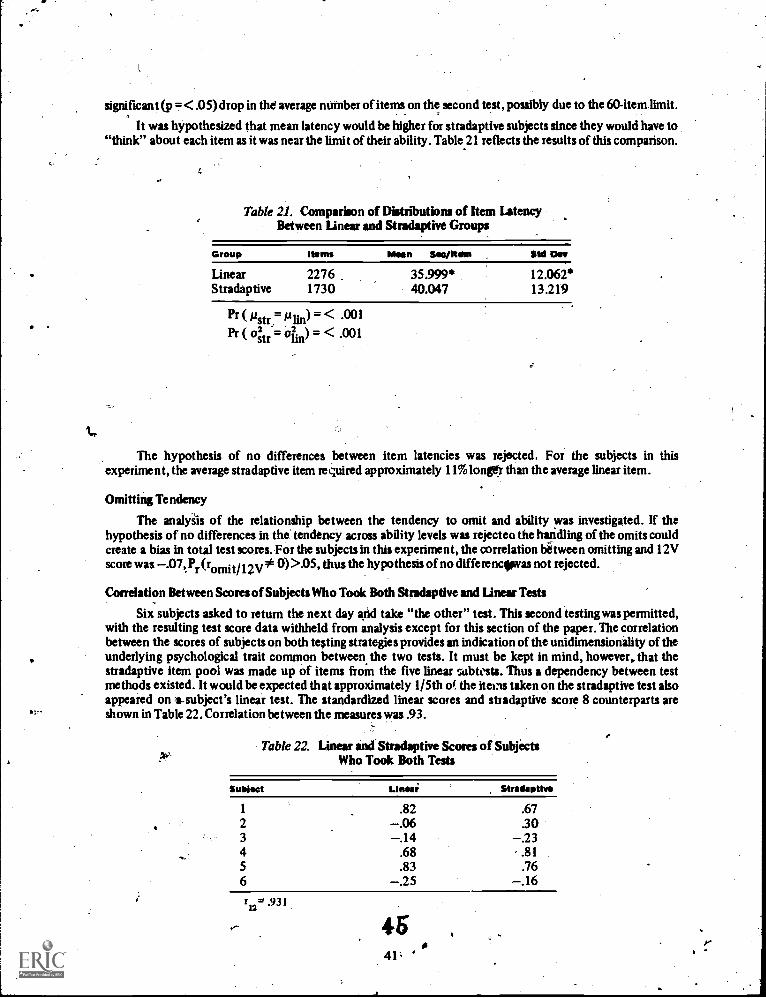
C.
significant (p =<.05) drop in tht average number of items on the second test, possibly due to the 60-item limit.
It was hypothesized that mean latency would be higher for stradaptive subjects since they would have to"think" about each item as it was near the limit of their ability. Table 21 reflects the results of this comparison.
Table 21. Comparison of Distributions of Item LatencyBetween Linear and Stradaptive Groups
Group Items Won Sac/Rim Std Div
Linear 2276. 35999 12.062Stradaptive 1730 40.047 13.219
Pr (rstr Alin) < .001( O:tr = °lin) < .001
The hypothesis of no differences between item latencies was rejected. For the subjects in thisexperiment, the average stradaptive item required approximately 11% loner than the average linear item.
Omitting Tendency
The analysis of the relationship between the tendency to omit and ability was investigated. If thehypothesis of no differences in the tendency across ability levels was rejected the haadling of the omits couldcreate a bias in total test scores. For the subjects in this experiment, the correlation bitween omitting and 12Vscore was .07, Pr (romi 012v* 0) >.05, thus the hypothesis of no difference mas not rejected.
Correlation Between Scores of Subjects Who Took Both Stradaptive and Linear Tests
Six subjects asked to return the next day and take "the other" test. This second testing was permitted,with the resulting test score data withheld from analysis except for this section of the paper. The correlationbetween the scores of subjects on both testing strategies provides an indication of the unidimensionality of theunderlying psychological trait common between the two tests. It must be kept in mind, however, that thestradaptive item pool was made up of items froin the five linear sabtesta. Thus a dependency between testmethods existed. It would be expected that approximately 1/5th of the items taken on the stradaptive test alsoappeared on vsubject's linear test. The standardized linear scores and stradaptive score 8 counterparts areshown in Table 22. Correlation between the measures was .93.
Table 22. Linear and Stradaptive Scores of SubjectsWho Took Both Tests
S u eel Unsai StradaPtly.
1 .82 .672 .06 303 .14 .234 .68 .815 .83 .766 .25 .16rn'l .931
4641' ,
Attitudinal Information
The overwhelming proportion of comments received after the testing was favorable to computer-basedtesting. Only one subject reported prior experience with CRT operation, yet no major problems arose in anystudents operating the equipment.
Stradaptive subjects tended to comment that the test was "very hard" and some expreised anxiety atonly getting about half of the items right. This problem suggests that perhaps adaptive testing subjects shouldbe led to anticipate "only" getting 50% of the items correct in order to keep.student niotivation up.
The general reaction of the linear subjects was that the test was "a snap," which was consistent with theover 75% correct response rate shown by the linear group.
Testing Costs
No full cost analysis was planned for this study. However, computer costs were available for thethree-day data A total of $89.00 was spent over the entire period. This total included core memory(CM), central proc r (CP), permanent file storage (MS), data transmittal between the CRT's and thecomputer, line printing (LP), and punch card output for 109 subjects. The author had data files punched-out asthey were created to assure that data would not be lost in case of a hardware malfunction.
' The cost of testing each individual came to less than 2 cents per subject for CM, CP, MS, and LP time onthe CDC 6500 computer. Excluding software preparation costs and hardware rental, etc., this is the expectedcomputer cost per subject in a large-scale testing program, once set up and operating. The Wary of proctors hasnot been included in this analysis, although this cost would certainly, be small when pro-rated over a largenumber of subjects.
In the present study, 6 CRT's were kept on and tied to.the computer continuously for 14 hours a day for3 days in order to be ready for subject-volunteers whenever they arrived. In any implementation ofcomputer-testing outside the experimental situation, exam time would be scheduled, thus minimizingtelephone line transmittal costs.
This cost approximation could be compared with testing costs from the reader's experience. Withouttrying to define conventional test cost per se, there is still little doubt that computer-based testing ccsts lessthan conventional testing with the paper and pencil mode for any large-scale testing program.
V. CONCLUSIONS AND IMPLICATIONS FOR FUIURE RESEARCH
The results of this study favor the further investigation of the stradaptive testing model. The modelproduced validity coefficients comparable to conventional testing with a reduction of the number of itemsfrom 48 to 31, 25 and 19 for the three stradaptive termination rules investigated in the study. The internalconsistency reliability for the best stradaptive scoring method was significantly higher than the conventionalKR-20 estimate, and the _stradaptive parallel-forms reliability estimates were consistently higher than theconventional KR-20 for the best of the scoring methods.
The author was not aware of any prior research showing a comparison of item latency data Betweenadaptive and conventional testing modes. Results in this study clearly indicate that subjects take significantlylonger to_answer items adapted to their ability level, about 11% longer in the present study. This is animportant result, as it indicates that future research into adaptive testing of any kind should take this variableinto consideration when evaluating an adaptive test strategy. The net gain of the adaptive model is really afunction of the testing time needed to adequately measure a subject's ability, not the number of itemspresented to the subject. All prior research reviewed tacitly assumed that item latency was consistent acrosstesting strategies. This study indicated this assumption is false.
The statistical power of the tests for significant difference between the experimental and controlgroupsin this study was too low. Nearly every researcher is forced to "settle" on a smaller "n" than desired due to theexternal constraints imposed on his research. This was certainly true in the present study. It is the author's
46
42

intent to make this study the first step in an on-going investigation of the stradaptive model, much as Weiss isdoing at the University of Minnesota. Where significant differences did not emerge, as in the validitycoefficients, the trend was consistently favorable to the best stradaptive models in comparison to the linearmodels. Should this trend be upheld as the number of subjects in the research grows, stronger statements aboutthe comparative validities of the two methods could be made. This possibility alone suggests that modelinvestigation be continued.
I Within the three termination rules investigated, KR-20 reliabilities were essentially equal for a test lengthof 50 items. Termination method 3, however, would have yielded an equivalent reliability estimate at 25 itemsto the "raw" K R-20 estimates of the other two methods at 26 and 31 items. This result supports Novick (1969)and Wood (1971) evidence that the efficiency of adaptive testing "levels off." Their result on Bayesian modelssuggested that from 15 to 20 items was optimal, as opposed to the 25-item "peak" shown in the present study.
The validity comparisons between the three termination strategies did not yield significant differences.The trend, however, consistently showed method 2, wherein omits were counted as wrong and 5, the minimumnumber of items in the ceiling stratum, as pioducing poorer measurement than the other two terminationmethods. This result is difficult to explain. Method 1 ignored omitted items and set the minimum number ofitems in the ceiling stratum to 5. Method 2 considered omits wrong, but used the same test termination rule forthe ceiling strata. Theoretically, the consistent difference betiveen these two methods should reflect that therust treatment of omits was better. Method 3, which used an identical treatment of omits to method 2, but setthe stopping minimum at 4 items in the ceiling stratum, was also better than method 2. This second resultsuggests that presenting less items yields higher reliability when omits are counted as incorrect answers.
The analysis of the termination rule is further complicated by the existence of Weiss' other branchingmodel. In the present author's judgment, the strategy of branching to a lower stratum after an omitted item isConceptually superior to the repetition of another item within the same stratum. Weiss' preliminary results(personal communication) support this hypothesis as he has consistently found the test-retest reliability of thefirst model to be about .10 higher than the model used in this present study. Given the model evaluated in thisexperiment, the author would recommend that 'termination method 3 be used in future stradaptive tentingsince its measurement effectiveness is comparable to the other 2 methods, but with less items.
In the comparisons of scoring methods, the mean difficulty of all items answered correctly isrecommended for any subject pool whom it could be assumed would adequately estimate their own ability.Scoring methods 6,7, and 10 yielded parallel-forms correlations that were statistically equivalent to method 8,but methods 6 and 10 consistently produced lower validity. These results are understandable for method 6, themean difficulty of all items in the highest non-chance stratum. The author would expect this estimate to befairly accurate, but unfortunately the number of possible scores using methods 4, 5, and 6 is limited to thenumber of strata in the item pool. Method 7, the interpolated stratum difficulty, corrects for this deficiency inmethod 6. Method 10, the average difficulty of the correct responses in the highest non-chwe stratum, isconceptually appealing to the present author. The ability estimate from scoring method 10 is ndeffected by apoor entry point ability estimate by the subject or by "lucky" guesses about a subject's ability stratum.
It is recommended therefore, that future stradaptive experimental studies concentrate upon scoringmethods 7, 8, and 10. These studies should also consider both stradaptive branChing models with a comparisonof results from variation in the minimum dumber of items in the ceiling stratum. A comparison between thesevariable number of stage strategies and several fixed number of stage strategies is desirable. The author planssuch an analysis on the present data in the near future. As suggested in prior research, adaptive testing mayreach "peak" efficiency at between 15 and 20 items. A comparison of stradaptive test statistics for examplewith k = 10, 15, 20, and 25 items with linear testing should investigate this hypothesis. Once the stradaptivedata is collected under the variable strategy, the fixed item statistics can be determined by grading thestradaptive test after" "K" items and then "starting" the subject's second test at the first item of the entry pointlevel.
4 7
43

One further suggestion for future stradaptive studies has occurred to the author. Following the samelogic which led to termination of a subject's testing when 5 items in a row in the highest stratum had beencorrectly answered, the missing of .5 items in a row in any stratum should provide an immediate ceiling stratumdefinition. The probability of the occurrence would be less than .05 for a properly nonmed item pool. In thecase of the present study, 13 of the 55 stradaptive subjects would have terminated in a stradaptive test anaverage of 12.1 items earlier than termination method 1, with no effect upon the other 42 subjects. Theresulting stradaptive test statistics obtained from the implementation of this suggestion have not beencalculated, except that the change would have reduced the average number of items presented undertemtination method 1 to 28.4 from 31.45. The author plans this test statistic analysis for the_near future.However, the suggestion was listed here for the consideration of any other stradaptive inv gitis.
Aside from the stradaptive model per se, further research into adaptive-testing in "ch both the number
211
of stages and step-size are variable is recommended. The Bayesian strategies and Urry'l model are exat)pples ofthis category of adaptive measurement, and further model development seems appropria4e.
Research is necessary with comparisons between stradaptive models rather than the traditional, lesign ofcomparing adaptive method with the conventional method of testing. Weiss' on-going research project isbeginning this type of work, but more is needed. The traditional comparison assumes that conventional teststatistics are the criterion that an experimental testing procedure should try to duplicate. Lord, Green, Weiss etal., have argued that improved measurement of the individual at all ability levels may be hidden by the use ofclassical test statistics such as validity and even reliability. Levine and Lord (1959) suggested an index ofdiscrimination which considered various levels of the test acme range and Lord's(1972) information functiontheory and item characteristic curve theory are an attempt to solve this problem. More theoretical research inthis area is needed.
The goal of this study included the attempt to estimate the degree to which the violation of the... assumptions of the one-factor ANOVA model affected KR,20 reliability estimates. The assumptiori tilat items
are independent of oneanother clearly is violated in any adaptive testing procedure. The degree of effect thisassumption violation causes is unknown, yet most prior research in adaptive testing which has consideredreliability at all, has only considered ANOVA KR-20 estimates.
-
Certainly the results from this study do not allow any definitive statements about this question.Nevertheless, the three KR -20 estimates were consistently higher than the 3 parallel-forms reliabilities. Clearyand Linn's (1960 monte carlo study indicated that r20 provided better parameter estimation thanparallel -forms reliability estimates, so one must question whether the higher p estin- ittts are not the result ofthe dependency between items. Perhaps the only way this question can be answereC through a monte carlostudy of adaptive testing with p known and the two methods compared, for estimating p.
Green (1970) concluded that the computer has only begun to enter the testing business, and that asexperience with computer-controlled testingtgrows, important changes in the technology of testifig will octiur.He predicted that "most of these changes lie in the future in the inevitable computer conquest oftesting. "3
The stradaptive testing model would appear to be one such important change.
3Green, B.F., Jr. In Holtzman (Ed.), 1970, p. 194.
.4 844
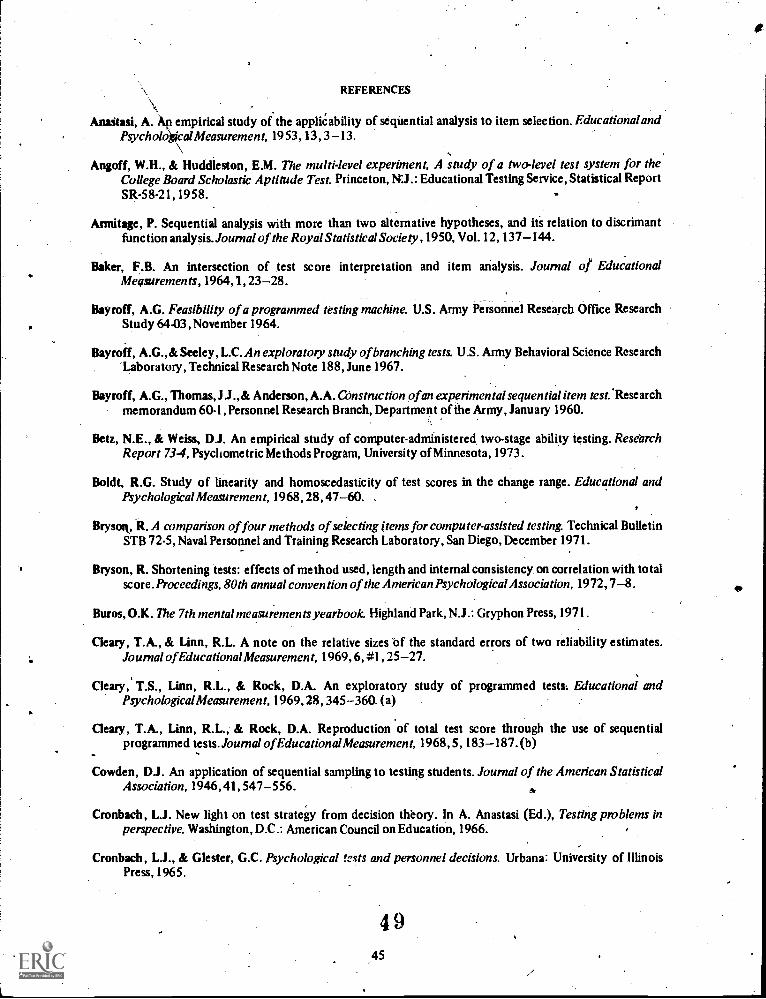
REFERENCES
Anastasi, A. An empirical study of the appliC ability of sequential analysis to item selection. Educational andPsychol4cal Measurement, 1953,13,3 -13.
Angoff, W.H., & Huddleston, E.M. The multi-level experiment, A study of a two-level test system for theCollege Board Scholastic Aptitude Test. Princeton, NJ.: Educational Testing Service, Statistical ReportSR-58-21,1958.
Armitage, P. Sequential analysis with more than two alternative hypotheses, and its relation to discrimantfunction analysis. Journal of the Royal Statistical Society ,1950, Vol. 12, 137-144.
Baker, F.B. An intersection of test score interpretation and item analysis. Journal o/ EducationalMeasurements, 1964, 1, 23-28.
Bayroff, A.G. Feasibility of a programmed testing machine. U.S. Army Personnel Research Office ResearchStudy 64-03,November 1964.
Bayroff, A.G., & Seeley, L.C. An exploratory study of branching tests. U.S. Army Behavioral Science ResearchLaboratory, Technical Research Note 188, June 1967.
Bayroff, A.G., Thomas, I J., & Anderson, A.A. Constriction of an experimental sequential item test. Researchmemorandum 60-1, Personnel Research Branch, Department of the Army, January 1960.
Betz, N.E., & Weiss, D.J. An empirical study of computer-administered two-stage ability testing. ResearchReport 73-4, Psychometric Methods Program, University of Minnesota, 1973.
Boldt, R.G. Study of linearity and homoscedasticity of test scores in the change range. Educational andPsychological Measurement, 1968,28,47-60. .
Bryson, R. A comparison of four methods of selecting items for computer-assisted testing. Technical BulletinSTB 72-5, Naval Personnel and Training Research Laboratory, San Diego, December 1971.
Bryson, R. Shortening tests: effects of method used, length and internal consistency on correlation with totalscore. Proceedings, 80th annual convention of the American Psychological Association, 1972,7-8.
Buros, O.K. The 7th mental measurements yearbook. Highland Park, N.J.: Gryphon Press, 1971.
Cleary, T.A., & Linn, R.L. A note on the relative sizes of the standard errors of two reliability estimates.Journal of Educational Measurement, 1969, 6, #1, 25-27.
Cleary, T.S., Linn, R.L., & Rock, D.A. An exploratory study of programmed tests: Educational andPsychological Measurement, 1969,28, 345-360. (a)
Cleary, T.A., Linn, R.L., & Rock, D.A. Reproduction of total test score through the use of sequentialprogrammed tests. Journal of Educational Measurement, 1968,5, 183-187. (b)
Cowden, D.J. An application of sequential sampling to testing students. Journal of the American StatisticalAssociation, 1946,41,547-556.
Cronbach, L.J. New light on test strategy from decision theory. In A. Anastasi (Ed.), Testing problems inperspective. Washington, D.C.: American Council on Education, 1966.
Cronbach, & Glester, C.C. Psychological tcvts and personnel decisions. Urbana: University of IllinoisPress, 1965.
4945

Cronberli, Li., Gleser, C.C., Nanda, H., &Rajaratnam, N. The dependability of behavioral measurements:Theory of generalizability for scores and profiles New York: John Wiley & Sons, Inc., 1972.
DeWitt, LI, & Weiss, D.J. A computer software system fo daptive ability measurement. Research Report,74-1, Psychometric Methods Program, University of Min esota, 1974.
Elwood, D.L. Automation of psychological testing. American Psy ologist, 1969,24,287-289.
Feldt, L.S. The approximate sampling distribution of Kuder-Ric ardson Reliability. Coefficient Testing.Psychometrika, 1965,30, #3, 357-370.
-Feldt, L.S. A (Kite on the use of confidence bands to evaluate the reliabili of a difference between two scores.American Educational Research Journal, 1967, 4, #2, 139-145.
Feldt, L.S. A test of the hypothesis that Cronbach's alpha or Kuder-Richardso coefficient twenty is the samefor two tests. Psychometrika, 1969,34, #3, 363-373.
Ferguson, G.A. Statistical analysis in psychology & education: 3rd edition. New Yo k: McGraw-Hill, 1971.
Ferguson, R.L. The development, implementation, and evaluation of a computer-a sted branched test for aprogram of individually prescribed instruction. (Doctoral dissertation, Unive ity of Pittsburgh), AnnArbor, Mich.: University Microfilms, 1969, No. 70-4530.
Ferguson, R.L. Computer assistance for individualizing measurement. Report 1971/8, University ofPittsburgh, Learning and Research Development Center, March 1971.
Fury, & Zimmerman, D.W. Effect of variation, in probability of guessing correctly on reliability ofmultiple-choice tests. Educational and Psychological Measurements, 1972, 9, 205-207.
Green, B.G., Jr. Comments on tailored testing. In W. H. Holtzman (Ed.), Computer-assisted instruction, testingand guidance. New York: Harper &Row, 1970.
Hansen, D.N. An investigation of computer-based science testing. In R. C. Atkinson and H. A. Wilson ( Eds.),amputer-assisted instruction, a book of readings. New York: Academic Press, 1969.
Haman, H.H., Helm, C.E., & Loye, D.E. (Eds.), Computer assisted testing. Princeton, NJ.: EducationalTesting Service, 1968.
Hick, W.E. Information theory and intelligence tests. British Journal of Psychology, Statistical Section, 1951,4,157-164.
Holtzman, W.H. Individually tailored testing: Discussion. In W. H. Holtzman (Ed.), Computer-assistedinstruction, testing, and guidance. New York: Harper & Row, 1970.
Hoyt, C. Test reliability estimated by analysis of variance. Psychometrika, 1941, 6, #3, 153-160.
Hubbard, :.P. Programmed testing in the examinations of the National Board of Medical Examiners. In A.Anastasi (Ed.), Testing problems in perspective. Washington, D.C.:- American Council in Education,1966.
Kalisch, Si. A tailored testing model employing the beta distribution. Unpublished paper. EducationalEvaluation and Research Design Program, Florida State University, 1974.
Kappauf, W.E. Use of an on-line computer for psychological testing with the up-and-down method. AmericanN Psychologist, 1969, 24, 207 211.
50-46

Krathwohl,D.R.4 Huyser, RJ. The sequential item test (SIT).Amaican Psychologist, 1956, 2, 419.
Larkin, K.C., & Weiss, DJ. An empirical investigation of computer-administered pyramidal ability testing.Research Report, 74-3, Psychometric Methods Program, University of Minnesota, 1974.
Levine, RD., & Lord, F.M. An index of the discriminating powers of a test at different parts of the score range.Educational and Psychological Measurement, 1959,19, 497-500. .
Linn, R.L., Rock, D.A., & Cleary, T.A. Sequential testing for dichotomous decisions. College entranceexamination board research and development report, RDR 69-70, No. 3,1970 (ETS, RB-70-31).
Linn, R.L., Rock, D.A., & Cleary, T.A. Sequential testing for dichotomous decisiOns. Educational andPsychological Measurement, 1972,32, 85-96.
Lord, F.M. Do tests of the same length have the same standard errors of measurement? Educational andPsychological Measurement, 1957,17, 510-521.
Lord, F.M. Tests of the same length do have the same standard errors of measurement. Educational andPsychological Measurement, 1959,19,233-239.
Lord, F.M. Some test theory for tailored testing. In W. H. Holtzman (Ed.), Computer-assisted instruction,testing, and guidance. New York: Harper & Row, 1970.
iLord, F.M. Robbins-Munro procedures for tailored testing. Educational and Psychological Measurement1971, 31. (a)
Lord, F.M. The self-scoring flexilevel test.Journal of Educational Measurement, 1971, 8, 147-151. (b)
Lord, F.M. Tailored testing, an application of stochastic approximation. Journal of the American StatisticalAssociation, 1971,66,707-711.(c) .
Lord, F.M. A theoretical study of the measurement effectiveness of flexilevel tests. Educational andPsychological Measurement, 1971, 31, 805-813. (d)
Lord, F.M. A theoretical study of two-stage testing. Psychometrika, 1971,36, 227-241. (e)
Lord, F.M. Individualized testing and item characteristic curve theory. Educational Testing Service,ETS-RB-72-50, Princeton, NJ., Novembvr, 1972.
Lord, F.M., & Novick, M.R. Statistical theories of mental test scores. Reading, Mass.: Addison-Wesley, 1968.
McBride, J.R., & Webs, DJ. A word knowledge item pool for adaptive ability measurement. Research Report74-2, Psychometric Methods Program, University of Minnesota, 1974.
Moonan, WJ. Some empirical aspects of the sequential analysis technique as applied to an achievementexamination.Journal of Experimental Education, 1950, 18, 195-207.
packageNie, N.H., Bent, D.H., & Hull, C.H. Statistical for the social sciences: SPSS. New York: McGraw-Hill,1970.
Nitko, AJ., & Feldt, L.S. A note on the effect of item difficulty distributions on the sampling distribution ofKR-20.A merit= Educational Research Journal, 1969, 6, 433--437, May 1969.
Novick, M.R. Bayesian Methods in Psychological Testing, Princeton, N.J.: Educational Testing Testing,RB-69-31, 1969.
'51
47

Nunn*, J.C. Psychometric theory. New York: Mc Graw-HM, 1967.
Olivier, P. An overview of tailored Testing. Unpublished paper. Florida State University Program ofEducational Evaluation and Research Design, July 1973.
Olivier, P. An evaluation of the self-scoring flexilevel tailored testing model. Unpublished doctoral dissertation,The Florida State University, 1974.
Owen, HJ. A Bayesian approach to tailored testing. Princeton, N.J.: Educational Testing Service, ResearchBulletin, RH-69-72,1969.
Owen, RJ. Bayesian sequential design and analysis of dichotomous experiments with special reference tomental testing. Unpublished paper, 1970.
Paterson, JJ. An evaluation of the sequential method of psychological testing. Unpublished doctoraldissertation, Michigan State University, 1962.
Payne, W.H., & Anderson, D.E. Significance levels for the Kuder-Richardson twenty: an automated samplingempirical approach. Educational and Psychological Measurement, 1962,28, 23-39.
SCAT Series H, Cooperative school and college ability tests, Princeton, NJ.: Educational Testing Service,1967.
Seeley, LC., Morton, M.A., & Anderson, A.A. Exploratory study of a sequential item test. U.S. ArmyPersonnel Research Office, Technical Research Note 129, 1962.
Siegel,S.Nonparametric statistics for the behavioral sciences. New York: McGraw-Hill, 1956.
Stinky, J.C. Reliability. In R. I. Thomdike (Ed.), Educational Measurement. Washington, D.C.: AmericanCouncil on Education, 1971.
Stanley, J.C., & Wang, M.D. Weighting test items and test item options: An overview of the Analytical andempirical literature, Educational and Psychological Measurement, 1970, 30, 21-35.
Stocking, M. Short tailored tests. Princeton, NJ.: Educational Testing Service, Research Bulletin RB-69-63,1969.
Terman, L.M., & Merril, M.A. Stanford-Binet intelligence scale: Manual for the third revision form L-M.Houghton-Mifflin, 1960.
Urry, V.W. A monte cub investigation of logistic test models. Unpublished doctoral dissertation, PurdueUniversity, 1970.
Urry, V.W. Individualized testinby Bayesian estimation. Washington University, Seattle, Bureau of TestingProject: 0171-177,3-29.
Wald, A. Sequential analysis. New York: Wiley, 1946.
Waters, CJ. Preliminary evaluation of simulated branching tests. U.S. Army Personnel Research Office,Technical Research Note 140,1964.
Waters, CJ., & Bayroff, A.G. A comparison of computer-simulated conventional and branching tests.Educational and Psychological Measurement, 1971, 31, 125-136.
Weiss, Di The stratified adaptive computerized ability test. Research Report 73-3. Psychometric MethodsProgram, Department of Psychology, University of Minnesota, September, 1973.
5248.

Weiss, 'DJ., be Betz, N.E. Ability Measurement: Conventional or adaptive? Research Report 73-1.Psycholometric Methods Program, University of Minnesota, 1973.
Winor; B.S. Statistical principles in experimental design: 2nd Ed. New York: McGraw-Hill, 1971.
wo4rdtg. The efficacy of tailored testing. Educational Research, 1969,11, 219-222.
Wood, R. Computerized adaptive sequential testing. Unpublished doctoral dissertation, University of Chicago,1971.
Wood, R. Response-contingent testing. Review of educational research, 1973, 43, #4, 529-544.
r
53
49

el
APPENDIX A: ITEM STATISTIC COMPARISON
5450
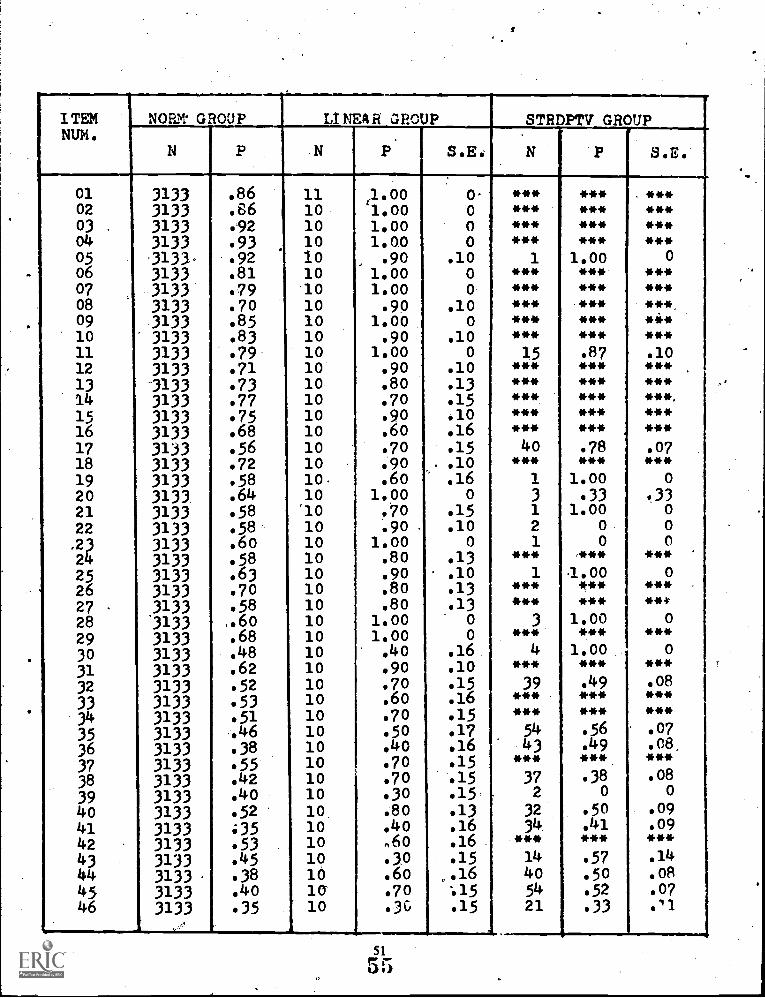
ITEMNUM.
NORM' GROUP LINEAR GROUP STR I PTV GROUP
N P N P S.E..
N P S.E.
01020304050607080910111213141516171819202122,232425262728293031323334353637383940414243444546
.
3133313331333133.3133-3133313331333133313331333133113331333133313331333133313331333133313331333133313331333133.3133313331333133313331333133313331333133313331333133313331333133313331333133
.86
.86
.92
.93
.92
.81
.79
.70
.85
.83
. 79
.71
.73
.77
.75
.68
.56
.72
.58
.64
.58
. 58
.60
.58
.63.70.58. 60.68.48.62.52.53.51.46.38.55.42.40.52:35.53.45.38.40.35
11101010101010101010101010101010101010.10'1010101010101010101010101010101010101010101010101010
.1.00'1.001.001.00
.901.001.00
.901.00
.901.00
.90
.80.70.90.60.70.90.60
1.00.70.90 .
1.00g 0
.90
.80
.801.001.00
.40
.90
.70
.60
.70.50.40.70.70.30.80.4060
.3,0.60.70.30
000
.1000
.100
.100
.10
.13
.15
.10
.16
.15. . 10
.160
.15
.100
1 3
.10
.13.13
00
.16
.10.15.16.15.17.16.15.15.15.13.16.16.15. 16.15.15
-.
************
1***************
15***************
40***
13121
***1
******
3***
4***
39******
5443
***37
23234
***14405421
************
1.00******
, *********.87***************.78***
1.00.33
1.0000
,***-1.00
It*****
1.00***
1.00***.49******.56.49***.38
0.50.41***.57.50.52.33
************
0*********.*.ii****.10***
.
******.******.07***
0.33
000
***0
*****.P
0***
0***.08******.07.08***.08
0.09.09***.14.o8.07.11
'
51
55
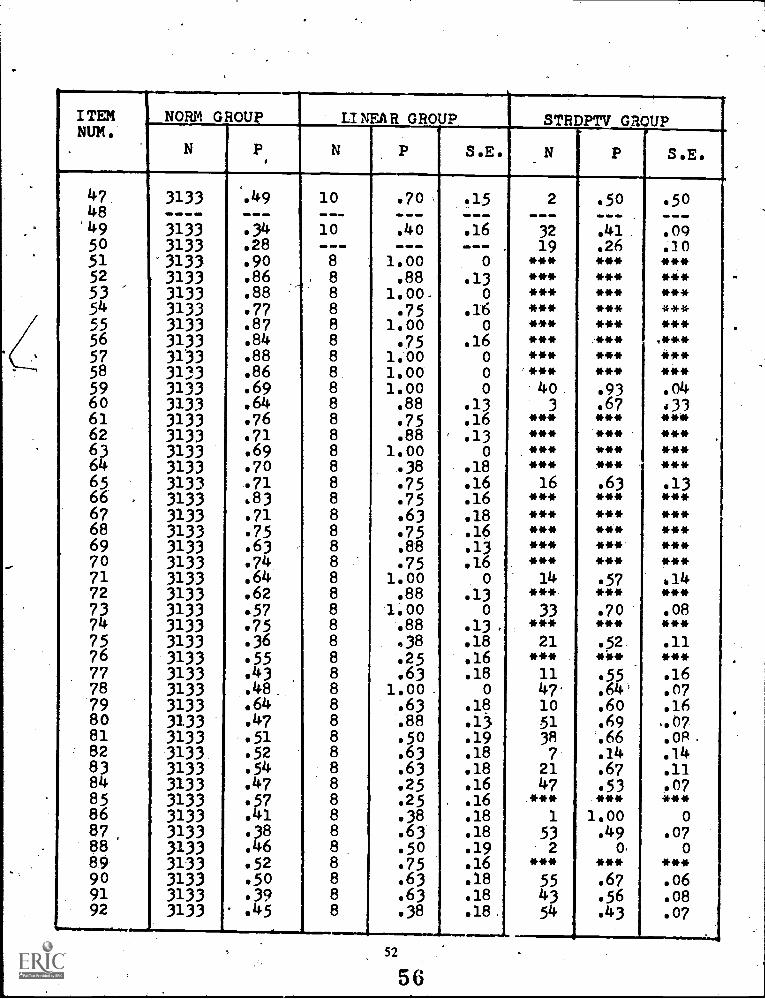
ITEM NORM GROUP LINEAR GROUP STRDPTV GROUPNUM.
N P N P S.E. N P 1 S.E.
47 3133 .449 10 .70 .15 2 .50 .5048 .= 4=1 WO
49 3133 .34 10 .40 .16 32 .41. .0950 3133 .28 - -- 1=11M1B1=I ...1 19 026 01051 3133 .90 8 1.00 0 *** *** ***52 3133 .86 8 .88 .13 *** *41* ***53 3133 .88 8 1.00. 0 *** *** ***54 3133 .77 8 75 .16 *** *** ***55 3133 .87 8 1.00 0 *** *** ***56 3133 .84 8 .75 .16 *** *** ,***57 3133 .88 8 1.00 0 *** *** 4**58 3133 .86 8 1.00 0 *** *** ***59 3133 .69 8 1.00 0 '40 .93 .046061
31333133
.64
.7688
.88
.75.13.16
3***
.67***
.133***62 3133 .71 8 .88 .13 *** *** ***63 3133 .69 8 1.00 0 *** *** ***64 3133 .70 8 .38 18 *** *** ***65 3133 .71 8 .75 .16 16 .63 .1366 3133 .83 8 .75 .16 *** *** ***67 3133 .71 8 .63 .18 *** *** ***68 3133 .75 8 75 .16 *** *** ***69 3133 .63 8 .88 .13 *** *** ***70 3133 .74 8 75 .16 *** *** ***71 3133 .64 8 1.00 0 14 .57 II 1472 3133 .62 8 .88 .13 *** *** ***73 3133 .57 8 1.00 074 3133 .75 8 .88 .13. *** *** *75 3133 .36 8 .38 .18 21 .52 .1176 3133 55 8 .25 .16 *** 41** ***77 3133 .43 8 .6.3 .18 11 .55 .1678 3133 . 48 8 1.00. 0 47, . 64 ' .0779 3133 .644 8 .63 .18 10 .60 .1680 3133 .47 8 .88 a j. 51 .69 ..0781 3133 .51 8 50 19 38 .66 , OP .82 3133 .52 8 .63 .18 7 111, .1483 3133 .54 8 .63 .18 21 .67 .1184 3133 .47 8 .25 .16 47 .53 .0785 3133 .57 8 .25 .16 *** *** ***86 3133 .41 8 .38 .18 1 1.00 087 3133 .38 8 .63 .18 53 .49 .0788 3133 .46 8 .50 .19 2 0 089' 3133 .52 8 .75 .16 *** *** ***90 3133 .50 8 .63 .18 55 .67 .0691 3133 39 8 .63 .18 43 .56 .0892 3133 .45 8 .38 .18. 54 .43 .07I..-- ._ -....-_....----, .
52
56
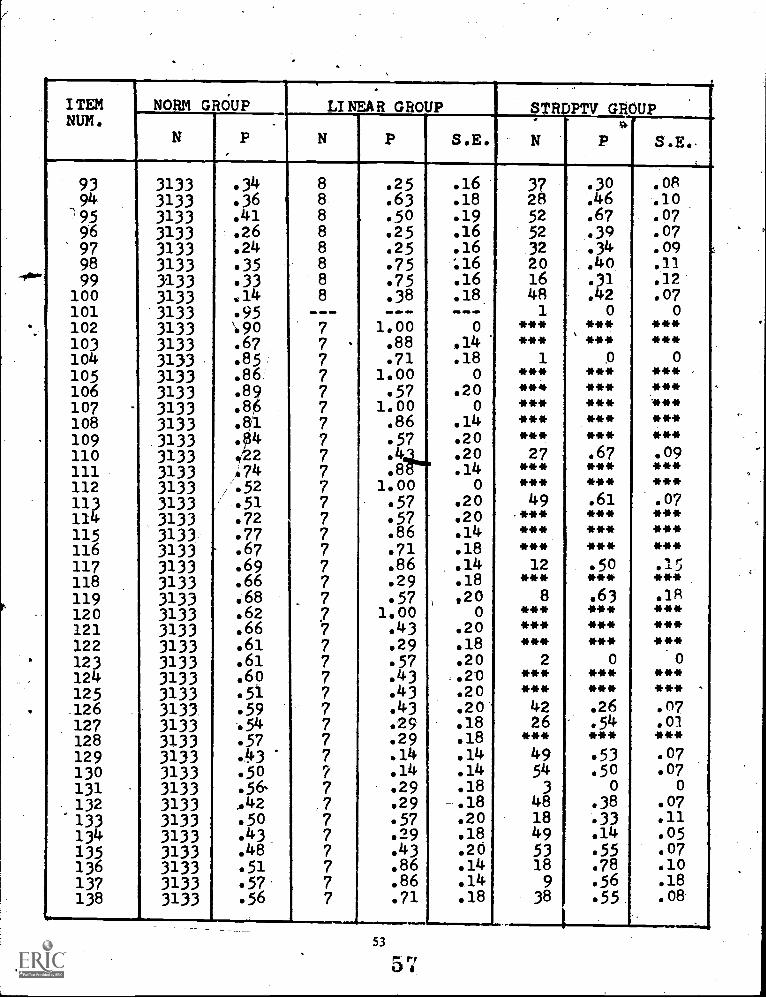
I TEMNUM .
NORM GROUP LI NEAR GROUP STRDPTV GROUP1--
S .E .N-
P N P S.E. N P
93 3133 .34 8 .25 .16 37 .30 .0894 3133 .36 8 .63 .18 28 .46 .10
'95 3133 .41 8 .50 .19 52 .67 .0796 3133 .26 8 .25 .16 52 .39 .0797 3133 .24 8 .25 .16 32 .34 .0998 3133 .35 8 .75 :16 20 .40 .1199 3133 .33 8 .75 .16 16 .51 .12
100 3133 .14 8 .38 .18 48 .42 .07101 3133 .95 --- - -- ...... 1 0 0102 3133 '690 7 1.00 0 *** *** ***103 3133 .67 7 .88 .14 *** *** ***104 3133 .85. 7 .71 .18 1 0 0105 3133 .86 7 1.00 0 *** *** *** p
106 3133 .89 7 57 .20 *** *** ***107 3133 .8 7 1.00 0 *** *** ***108 3133 . 1 7 .86 .14 *** *** ***109 .3133 .04 7 .57 .20 *** *** ***110 3133 2 7 .4.1_ .20 27 .67 .09
111 3133y.74 7 .8 .14 *** *** ***
112 3133 .52 7 1.00 0 *** *** ***113 3133 .51 7 57 .20 49 .61 .07114 3133 .72 7 .57 .20 *** *** ***115 3133. .77 7 .86 .14 *41* *** ***116 3133 .67 7 .71 .18 *** *** ***117 3133 .69 7 .86 .14 12 .50 .1
118 3133 .66 7 .29 .18 *** *** * **
119120
31333133
.68
.6277
.571.00
,200
8***
.63***
.18***
121 3133 .66 7 .43 .20 *** *** ***122 3133 .61 7 .29 .18 *** *** * **123 3133 .61 7 57 .20 2 0 0124 3133 .60 7 .43 .20 *** *** ***125 3133 .51 7 .43 .20 *** *** *** -
126 3133 .59 7 .43 .20 42 .26 .07127 3133 .54 7 .29 .18 26 .54 .01128 3133 .57 7 .29 .18 *** *** ***129 3133 .43 7 .14 .14 49 .53 .07130 3133 .50 7 .14 .14 54 .50 .07131 3133 .56. 7 .29 .18 3 0 0132 3133 .42 7 .29 .18 48 .38 .07
+133 3133 .50 7 57 .20 18 .33 .11134 3133 .43 7 29 .18 49 .14 .05135 3133 .48 7 .43 .20 53 .55 07136 3133 .51 7 .86 .14 18 .78 .10137 3133 .57 7 .86 .14 9 .56 .18138 3133 .56 7 .71 .18 38 .55 .08
53
5
f
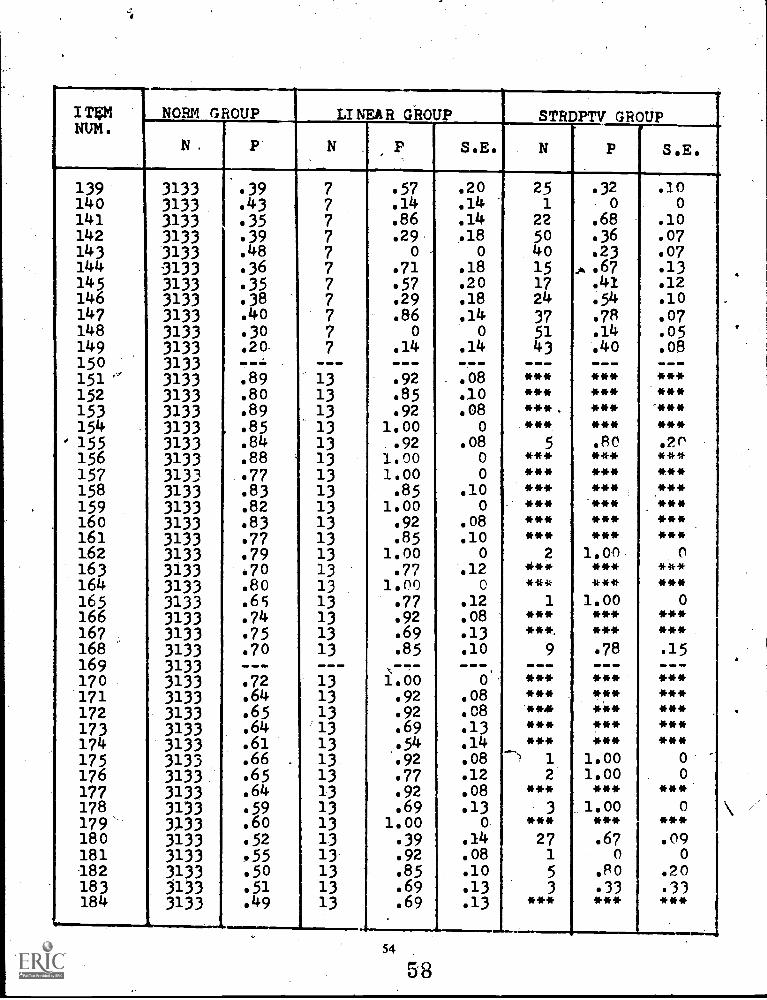
I TIMNUM .
NORM GROUP LI NEA R GROUP STRDPTV GROUP
N. P N P s .E . N P S.E.
139 3133 .39 7 .57 .20 25 .32 .10140 3133 .43 7 .14 .14 1 0 0141 3133 .35 7 .86 .14 22 .68 .10142 3133 39 7 .29 .18 50 .36 .07143 3133 .48 7 0 0 40 .23 .07144 3133 .36 7 .71 .18 15 x..67 .13145 3133 .35 7 .57 .20 17 .41 .12146 3133 .38 7 .29 .18 24 .54 .10147 3133 .40 7 .86 .14 37 .78 .07148 3133 .30 7 0 0 51 .14 .05149 3133 .20- 7 .14 .14 43 .40 .08150 3133 --=151 ' 3133 .89 13 .92 .08 *** *** ***152 3133 .80 13 .85 .10 *** *** ***153 3133 .89 13 .92 .08 *** . *** .***154 3133 .85 13 1.00 0 *** *** ***
. 155 3133 .84 13 .92 .08 5 .80 .2P156 3133 .88 13 1.00 0 *** *** ***157 3133 .77 13 1.00 0 *** *** ***158 3133 .83 13 .85 .10 *** *** ***159 3133 .82 13 1.00 0 *** *** ***160 3133 .83 13 .92 .08 *** *** ***161 3133 .77 13 .85 .10 *** *** ***162 3133 .79 13 1.00 0 2 1.00 0163 3133 .70 13 .77 .12 4** *** ***164 3133 .80 13 1.00 0 *** *** ***165 3133 .65 13 .77 .12 1 1.00 0166 3133 .74 13 .92 .08 *** *** ***167 3133 .75 13 .69 .13 ***, *** ***168 3133 .70 13 .85 .10 9 .78 .15169 3133 ---170 3133 .72 13 1.00 0 *** *** ***171 3133 .64 13 .92 .08 *** *** ***172 3133 .65 13 .92 .08 414141 *** ***173174
31333133
.64
.61=13
13.69.54
.13
.14******
******
******
175 3133 .66 13 .92 .08 *' 1 1.00 0176 3133 .65 13 .77 .12 2 1.00 0177 3133 .64 13 .92 .08 *** *** ***178 3133 .59 13 .69 .13 3 1.00 0179 31-33 .60 13 1.00 0. *** *** ***180 3133 .52 13 .39 .14 27 .67 .09181 3133 055 13 .92 .08 1 0 082 3133 .50 13 .85 .10 5 .R0 .20183 3133 .51 13 .69 .13 3 .33 .33184 3133 .49 13 .69 .13 *** *** ***
54
58
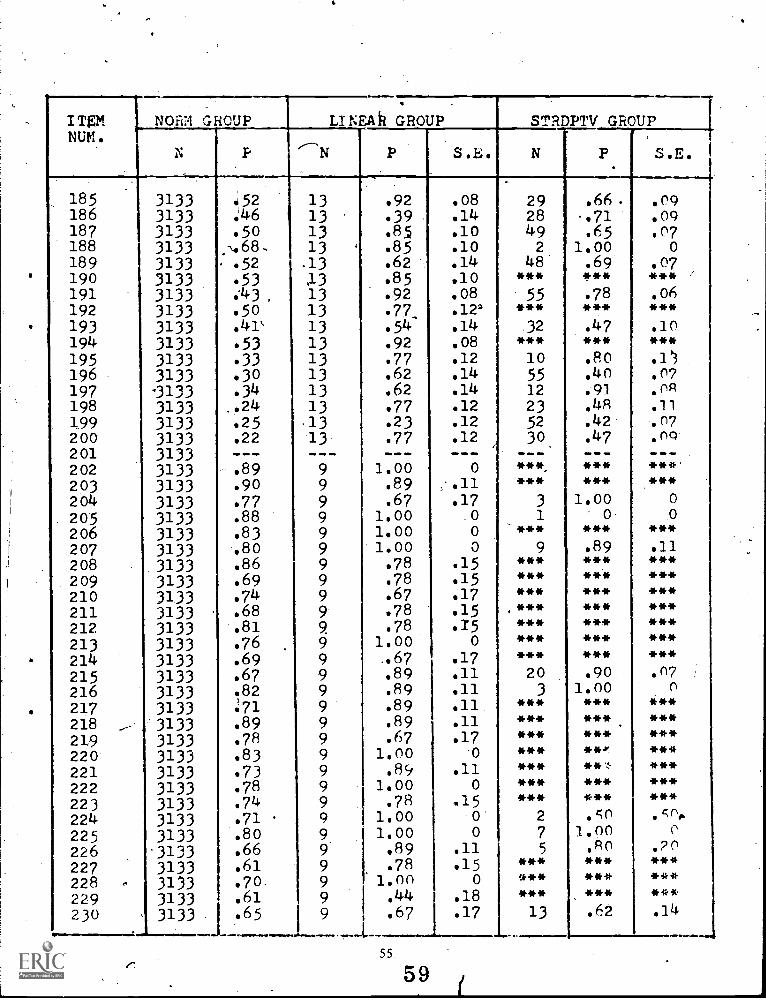
ITEM NOFM GROUP Li NEA h GROUP sTRDPTV GROUP
-.,
NUM.N P --sri P s .E. N P S.E. 1
185 3133 :52 13 .92 .08 29 .66 . .09186 3133 .46 13 .39 .14 28 - .71 .09187 3133 .5o 13 .85 .10 49 .65 .07188 3133 -.68. 13 F .85 .10 2 1.00 0189 3133 .52 .13 .62 .14 48 .69 .07190 3133 .53 .13 .85 .10 *** *** *** /191 3133 .43, 13 .92 .08 55 .78 .06192 3133 .50 13 .77 .122 *** *** ***193 3133 .41' 13 .54- .14 32 .47 .10194 3133 .53 13 .92 .08 *** *** ***195 3133 .33 13 .77 .12 10 .8o .1'3196 3133 .30 13 .62 .14 55 .40 .07197 3133 .34 13 .62 .14 12 .91 . np198 3133 ..24 13 .77 .12 23 .48 .11199 3133 .25 13 .23 .12 52 .42 .n7200 3133 .22 13 .77 .12 30 .47 .00201 3133 --- --- - --202 3133 .89 9 1.00 0 ***, *** ***203 3133 .90 9 .89 ;;.11 *** *** ***204 3133 .77 9 .67 .17 3 1.00 0205 3133 .88 9 1.00 0 1 o 0206 3133 .83 9 1.00 0 *** *** ***207 3133 .80 9 1.00 0 9 .89 .11208 3133 .86 9 .78 .15 *** *** ***209 3133 .69 9 .78 .15 *** *** ***210 3133 .74 9 .67 .17 *** *** ***211 3133 .68 9 .78 .15 *** *** ***212 3133 .81 9 .78 .15 *** *** ***213 3133 .76 9 1.00 0 *** *** ***
214 3133 .69 9 ..67 .17 *** *** ***215 3133 .67 9 .89 .11 20 .90 .n7216 3133 .82 9 .89 .11 3 1.00 0
217 3133 :71 9 .89 .11 *** *** 4**218 :3133 .89 9 .89 .11 *** *** ***
219 3133 .78 9 .67 .17 *** *** ***220 3133 .83 9 1.00 0 *** **.- ***
221 3133 .73 9 .89 .11 *** ** ***222 3133 .78 9 1.00 0 *** *** ***
223 3133 .74 9 .78 .15 *** *** ***
224 3133 .71 9 1.00 0 2 .50 . fl.,,
225 3133 .8o 9 1.00 0 7 1.00 0
226 3133 .66 9 .89 .11 5 .R0 .20227 3133 .61 9 .78 .15 *** *** ***228 -- 3133 .7o. 9 1,00 0 *** *** ***
229 3133 .61 9 .44 .18 *** *** ***230 3133 .65 9 .67 .17 13 .62 .14
......_.........., ..___ .............. ....._ ..........._
55
59

ITEM NOR: GROITP LINEAR GROUP.
STRDPTV GROUPI
NUM.N P N. P S.E. N P S.E.
231 3133 .58 9 .67 .17 9 .89 .11232 3133 .52 9. .78 .15 16 .50 .13233 3133 .41 9 .56 .18 -18 .50 .12234 3133 .57 9 .78 .15 5 .60 .25 I235 3133 .48 9 .78 .15 43 .86 .05236 3133 .58 9 .89 .11, *** *** ***237 3133 54 9 .78 .15 23 .91 .06238 3133. .43 9 .78 .15 4 1.00 0239 3133 .,52 9 .78 .15 15 .53 .1324o 3133 .42 9 .67 .17 7 .86 .14241 3133 .61 9 .67 .17 28 .82 .07242 3133 .44 9 .67 .17. 23 .57 .11,243 3133. .34 9 .67 .17 37 .70 .oP244 3133 .28 9 56 .18 53 .55 .07245 3133 .45 9 .67 .17 53 .72 .06246 .3133 .37 9 .33 .17 11 .73 .14247 3133 .4o 9 .56 .18 33 .58 .09248 '3133 .42 9 .56 .18 1 0 0249 3133 .23 --- --- 17 .35 .12250 3133 --- ___
*** This item not presented to stradaptive subject.--- This item removed from stradaptive pool.
\\
6056

APPENDIX B: TRANSFORMATION OF TRADITIONAL ITEMDIFFICULTY (Pg) AND BISERTAL CORRELATION (rp
TO NORMAL OGIVE PARAMETERS b AND ag
6157
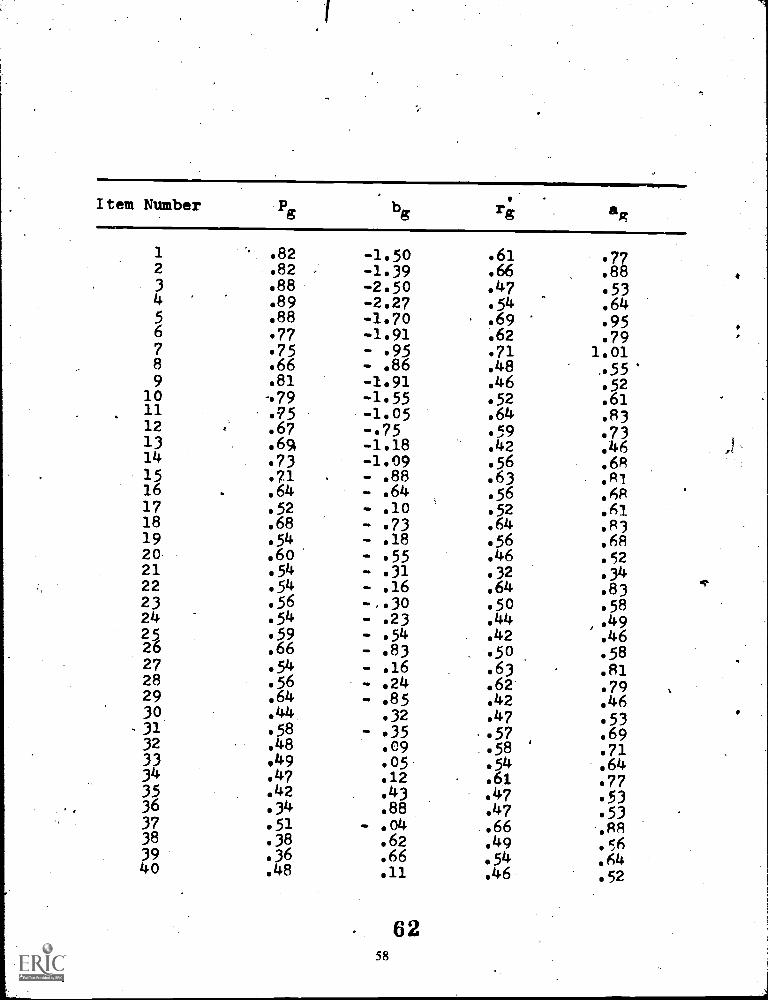
Item Number Pg bg rg a
12
.82
.82-1.50-1.39
.61
.66.77.88
3 .88 -2.50 .47 .534 .89 -2.27 .54 .645 .88 -1.70 .69 .956 .77 -1.91 .62 .797 .75 - .95 .71 1.018 .66 - .86 .48 ..559 .81 -1.91 .46 .52
10 79 -1.55 .52 .6111 .75 -1.05 .64 .8312 .
13.67.69
-.75-1.18
.59
.42.73.46
14 .73 -1.09 .56 .6815 .71 . - .88 .63 .P116 .64 - .64 .56 .6817 .52 - .10 .52 .6118 .68 - .73 .64 .8319 .54 - .18 .56 .6820 .60 - .55 .46 .5221 .54 - .31 .32 .3422 .54 - .16 .64 .8323 .56 -,.30 .50 .582425
.54
.59- .23- .54
.44
.42.49.46
26 .66 - .83 .50 .5827 .54 - .16 .63 .812829
.56
.64- .24- .85
.62
.42.79.46
30 .44. .32 .47 .5331 .58 - .35 .57 .6932 .48 .09 .58 .7133 .49 .05 .54 .6434 .47 .12 .61 .773536
.42
.34.43.88
.47
.47.53.53
37 .51 - .04 .66 .8838 .38 .62 .49 .5639 .36 .66 .54 .6440 .48 .11 .46 .52
6258

Item Number bg ag
41 .31 1.60 .31 .433
42 .49 .06 .4 .50
43 .41 .95 .24 .2544 .34 .79 .32 .6145 .36 .65 .55 .6646 .33. 1.27 "%"-- .39 .4247 .45 .29 .43 .4848 .14 4.71 .23 .2449 .30 1y34 .39 .42
5o .24 2.94 .24 .2551 .86 -1.69 .64 .R3
52 .82 -1.50 .63. .77
5354
.84
.73-1.51-1.02
.66
.6oJ18.75
5556
.83.8o
-1.36-1.4o
.7o
.6o.98.75
5758596o61
.84
.82.65.6o.72
-1.78-1.79- .62- .42-1.17
.56
.51
.62.6o.5o
.68
.59
.79.75.58
62 .67 - .75 .59 .7363 .65 - .62 .62 .7964 .66 -1.06 .39 .4265 .67 - .90 .49 .5666 .79 -2.07 39 .4267 .67 - .6o .73 1.0768 .71 - .91 .61 .97697o
.59 - .37.95
.62 .7966
71 .60 - .44 .57 .6972 .58 - .53 .38 .41
7374
.53
.71- ,t17-1.35
.45
.41. r0..45
7576
.32
.51.75
- .06.62.45
flp 79':50
7778
.39
.44.67.28
.42..54
.4A
.64798o
.60.43
- .49.30
.52
.58.61.71
81 .47 .12 .63 .R1
82 .48 .13 .40 .4483 .50 0.00 .38 .4184 .43 .38 .46 .5285 .53 - .18 .43 .48
6359

Item Number Pg bg rg ag
86 .37 .56 .59 .7387 .34 .76 .54 .6488 .42 .37 .55 .6689 .48 .10 .48 .5590 .46 .20 .51 .5991 .35 .88 .44 .4992 .41 .63 .36 .3993 .33 1.57 .28 .2994 .32 1.06 .44 .4995 .3 .81 .41 .4596 .22 1.76 .44 .4997 .20 1.83 .46 .5298 .31 1.91 .26 .2799 .29 2.13 .26 .27
100 .10 2.91 .44 .49101 .91 -5.16 .26 .27102 .86 -3.28 .33 .35103 .63 - .77 . .43 .48104 .81 -2.31 .38 .41105 .82 -2.03 .45 .50106 .85 -3.57 .29 .3o107 .82 -2.12 .43 .48108 .77 -2.17 .34 .36109 1 .80 -1.22 .69 .95110 .18 2.29 .40 .44111 .7o -1.31 .40 .44112 .48 .13 .40 .44113 .47 .24 .32 .34114 .68 -1.38 .34 .36115 .73 -1.80 .34 .36116 .63 - .61 .54 .64117 .65 - .88 .44 .49118 .62 - .60 .51 .59119 .64 - .80 .45 .50120 .58 - .65 .31 .33121 .62 - r90 .34 .36122 .'57 - .33 .54 .64123 .57 - .57 .31 .33124 .56 - .49 .31 .33125 .47 .14 .55 .66126 .55 - .33 .38 .41127 .5o 0,00 .36 .39128 .53 - .19 .40 .44129 r .39 .87 .32 .34130 .46 .31 .32 .34
60

Item Number Pg bg rg a
131 .52 .10 .48 .55132 .38 ..71 .43 .48
133 .46 .21 .47 .53134 .39 .59 .47 .53135 .44 .34 .44 .49136 .47 .13 .56 .681 .53 - .21 .36 .39138 .52 - .11 .45 .50
139 .35 1.24 .31 .33140 .39 .50 .56 .6P
141 .31 1.01 .49 .56142 .35 1.13 .34 .36143 .44 .29 .52 .61
144 02 1.34 .35 .37145 .31 1.03 .48 .55
146 .34 1.33 .31 .33147 .36 1.23 .29 .30148 .26 1.61 .40 .44
149 .16 3.68 .27 .28
150 INFORMATION NOT AVAILABLE -- NOT USED151 .89 -2.31 .53 .63
152 .80 -1.56 .54 .64153 .89 -1.83 .67 .90
154 .85 -1.52 .68 .93155 .84 -1.74 .57 .69156 .88 -2.03 .58 .71157 .77 -1.27 .58 .71158 .83 -1.87 .51 .59159 .82 -2,03 .45 .50160 .83 -1.65 .58 .71161 .77 -1.30 .57 .69162 .79 -1.97 .41 .45163 .70 - .90 .58 .71164 .80 -1.68 .50 .5P165 .65 - .76 .51 .59166 .74 -1.46 .44 .49167 .75 -1.65 .41 .45
168 .70 -1.34 .39 .42169 DISCRIMINATION INDEX TOO LOW -- NOT USED170 -1.04 .56 .68171 .64 - .65 55 .66172 .65 - .74 .52 .61173 .64 - .59 .61 .77174 .61 -1.07 .26 .27
175 .66 - .92 .45 .50
6561
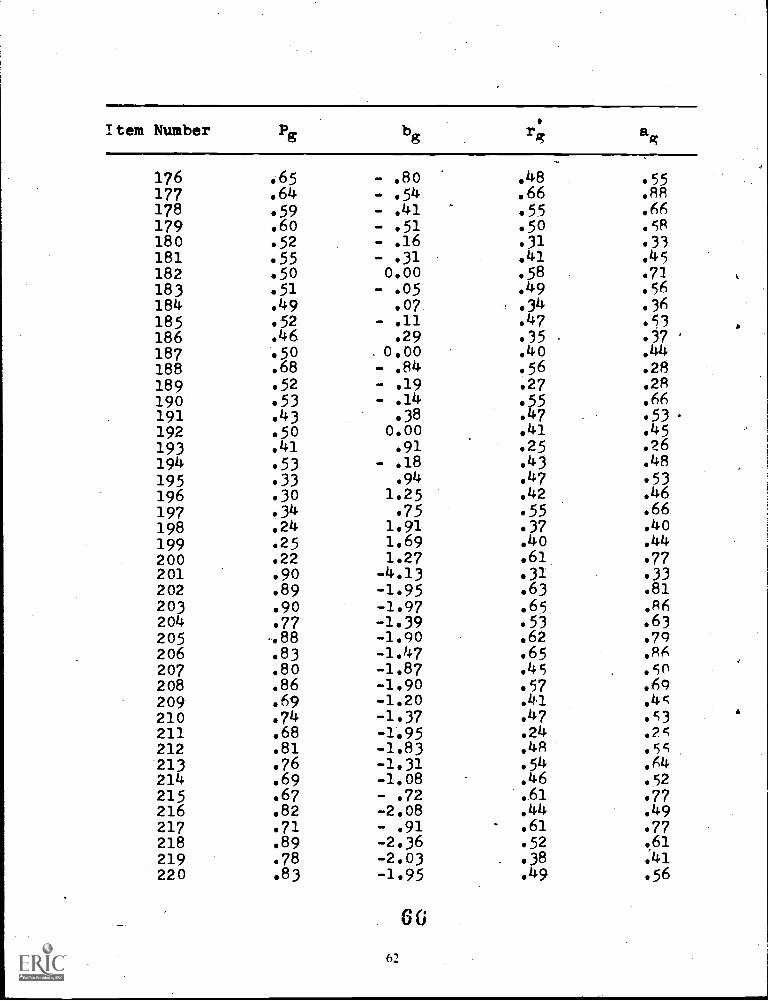
Item Number
176 .65 - .8o .48 55177 .64 - .54 .66 .88178 .59 - .41 .55 .66179 .6o - .51 .5o .58180 .52 - .16 .31 .33181 .55 - .31 .41 .45182 .50 0.00 .58 .71183 .51 - .05 .49 .56184 .49 .07 .34 .36185 .52 - .11 .47186 .46 .29 .35 .37187 .50 . 0.00 .40 .44188 .68 - .84 .56 .28189 .52 - .19 .27 .2R190 .53 - .14 .35 .66191 .43 .38 .47 .53192 .5o o.00 .41 .45193 .41 .91 .25 .26194 .53 - .18 .43 .48195 33 .94 .47 .53196 .30 1.25 .42 .46197 .34 .75 .55 .66198 .24 1.91 .37 .40199 .25 1.69 .40 .44200 .22 1.27 .61 77201 .90 -4.13 .31 33202 .89 -1.95 .63 .81203 .90 -1.97 .65 .86204 .77 -1.39 .53 .63205 .88 -1.90 .62 .79206 .83 -1.47 .65 RA207 .8o -1.87 .45 .50208 .86 -1.90 .57 .69209 .69 -1.20 .41 .4c210 .74 -1.37 .47 .c3211 .68 -1.95 .24 25212 .81 -1.83 .48 .55213 .76 -1.31 .54 .64214 .69 -1.08 .46 .52215 .67 - .72 .61 .77216 .82 -2.08 .44 .49217 .71 - .91 .61 .77218 .89 -2.36 .52 .61219 .78 -2.03 .38 .41220 .83 -1.95 .49 .56
60
62

)
a
Item Number Pg
221 .73222 .78223 .74224 .71225 .80226 .66227 ..61
228 .70229 .61.230 .65231 .58232 .52233 .43.
234 .57235 .48236 .58237 .54238 .43239 .52240 .42241 .61242 .44243 .34244 .28245 .45246 .3724, .40248 .43249 .23250 .14
-- 1.46-1.69- .86-1.11- .69-..76- .83- .53- .65- .42- .11
. 56- .35
.09- .44- .16
.3o- .08
.4o
.49
.27
. 71
1.19.25.79.53.56
1.94
r`c
4.71
r ag
.63 .81
.53 .63
.38 .41
.64 ,s3
.76 -4,17
.6o .75
.37 .4o
.63, .81
.53 .73
.59 .73
.48 .55
.46 .52
.41 45
.51 .59
.57 .69
.46 .52
.64 .83
.59 .73
.61 .77
.51 .59
.57 .69
.56 .68
.58 .71
.49 .56
.51 .59
.42 .46
.48 .55
.36 .39
.38 ..41
.23 .24
63
67
APPENDIX C: ,FORM LETTER
68-64
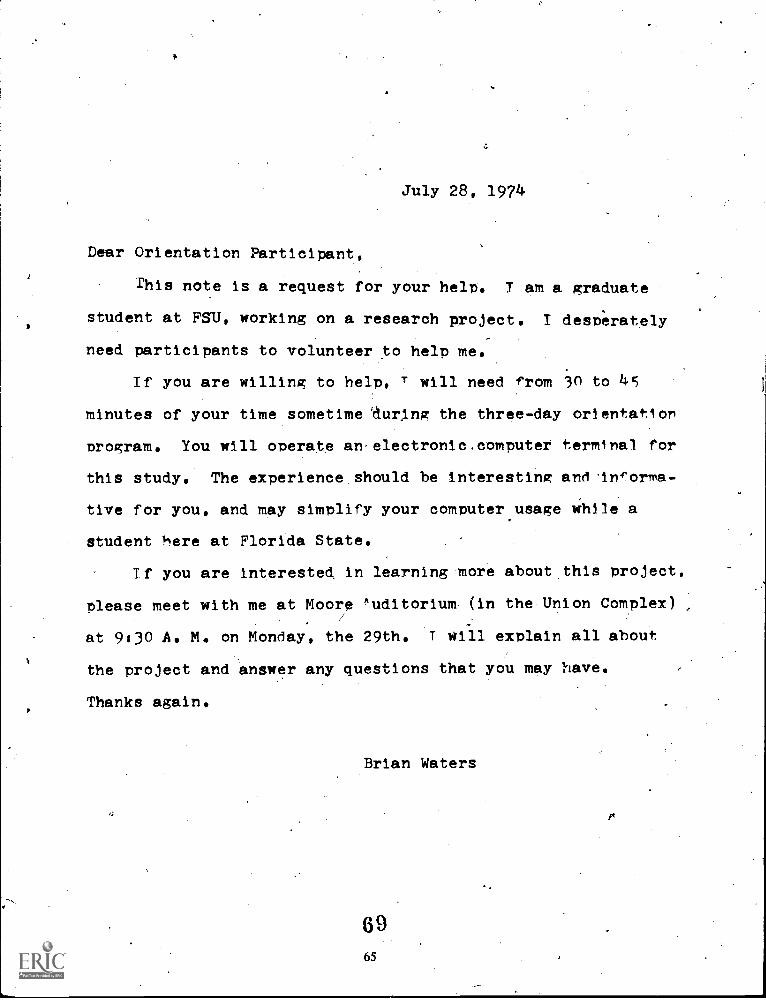
ti
July 28, 1974
Dear Orientation Participant,
This note is a request for your help. I am a graduate
student at FSU, working on a research project. I despitrately
need participants to volunteer to help me.
If you are willing to help, T will need from 30 to 45
minutes of your time sometime AurAng the three-day orientation
Program. You will operate anelectronic.computer terminal for
this study. The experience should be interesting and
for you, and may simplify your computer usage While a
student here at Florida State.
If you are interested in learning more about this project,
please meet with me at Moore ''uditorium (in the Union Complex)
at 9:30 A. M. on Monday, the 29th. T will explain all about
the project and answer any questions that you may have.
Thanks again.
Brian Waters
6965

APPENDIX D: DES&IPTION OF DATA
`.
66
70
r,
V
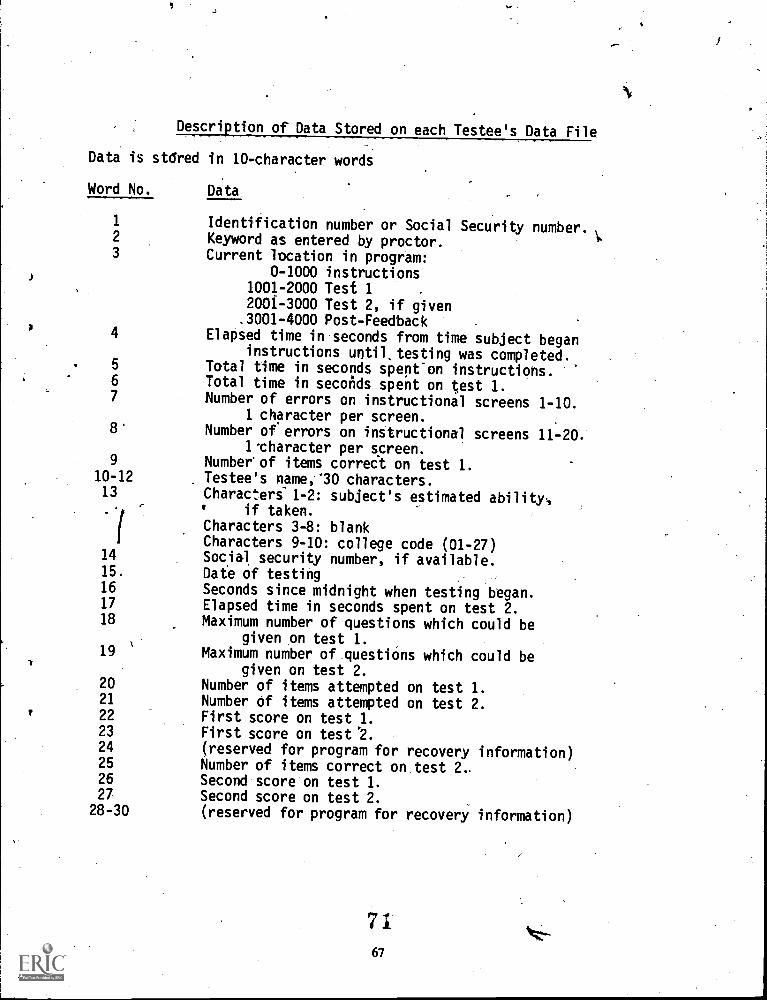
Description of Data Stored on each Testee's Data File
Data is stdred in 10-character words
Word No. Data
1 Identification number or Social Security number.2 Keyword as entered by proctor.3 Current location in program:
0-1000 instructions1001-2000 Test 12001-3000 Test 2, if given.3001-4000 Post-Feedback
4 Elapsed time in seconds from time subject beganinstructions until,testing was completed.
5 Total time in seconds spent-on instructions.6 Total time in seconds spent on test 1.7 Number of errors on instructional screens 1-10.
1 character per screen.8' Number of errors on instructional screens 11-20.
1'character per screen.9 Number'of items correct on test 1.
10-12 Testee's name,'30 characters.13 Characters 1-2: subject's estimated ability,
if taken.
Characters 3-8: blankCharacters 9-10: college code (01-27)
14 Social security number, if available.15. Date of testing16 Seconds since midnight when testing began.17 Elapsed time in seconds spent on test 2.18 Maximum number of questions which could be
given on test 1.19 Maximum number of questions which could be
given on test 2.20 Number of items attempted on test 1.21 Number Of items attempted on test 2.22 First score on test 1.23 First score on test "2.24 (reserved for program for recovery information)25 Number of items correct on test 2..26 Second score on test 1.27 Second score on test 2.
28-30 (reserved for program for recovery information)
7167
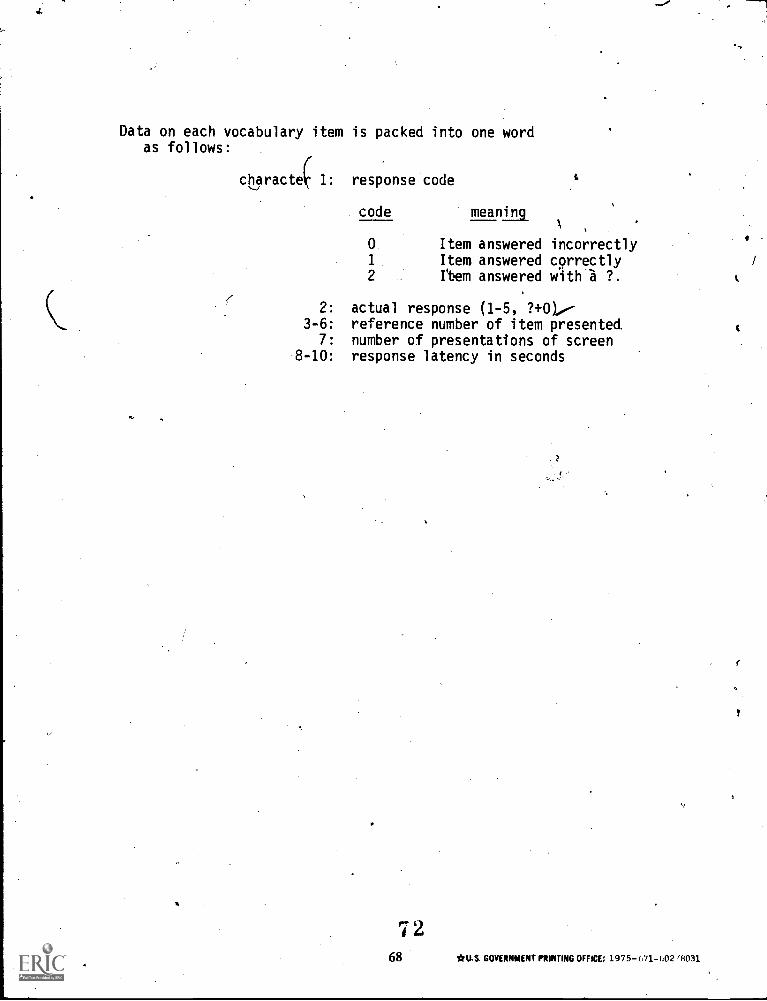
Data on each vocabulary item is packed into one wordas follows:
characte( 1: response code
code meaninga
0 Item answered incorrectly1 Item answered correctly2 'Item answered with a ?.
2: actual response (1-5, ?+0).--3-6: reference number of item presented
7: number of presentations of screen8-10: response latency in seconds
!268 *U.S. GOVERNMENT PRINTING OFFICE: 1975- 671-602 '8031