document of the world bankdocuments.worldbank.org/curated/en/... · document of the world bank. ......
TRANSCRIPT

Document of The World Bank
Report No: ICR00002474
IMPLEMENTATION COMPLETION AND RESULTS REPORT (TF-91695)
ON A
GRANT
IN THE AMOUNT OF AUD 39,451,025 (US$37,687,621 EQUIVALENT)
TO THE
REPUBLIC OF THE PHILIPPINES
FOR A
SUPPORT TO PHILIPPINE BASIC EDUCATION REFORMS PROJECT
May 30, 2014
East Asia and Pacific/Education EACPF East Asia and Pacific Region
Pub
lic D
iscl
osur
e A
utho
rized
Pub
lic D
iscl
osur
e A
utho
rized
Pub
lic D
iscl
osur
e A
utho
rized
Pub
lic D
iscl
osur
e A
utho
rized
Pub
lic D
iscl
osur
e A
utho
rized
Pub
lic D
iscl
osur
e A
utho
rized
Pub
lic D
iscl
osur
e A
utho
rized
Pub
lic D
iscl
osur
e A
utho
rized

CURRENCY EQUIVALENTS
(Exchange Rate Effective May 28, 2014)
Currency Unit = Philippine Peso PHP 1.00 = US$0.02 US$1.00 = 44.5 PHP AUD 1 = US$0.9258
FISCAL YEAR
ABBREVIATIONS AND ACRONYMS ALS Alternative Learning Systems BESRA Basic Education Sector Reform Agenda CAS/CPS Country Assistance Strategy/Country Partnership Strategy CCT Conditional Cash Transfer COA Commission on Audit DepEd Department of Education DBM Department of Budget and Management DLIs Disbursement Linked Indicators DPWH Department of Public Works and Housing e-BEIS Enhanced Basic Education Information System EFA Education for All ESC Education Sector Contracting FM Financial Management GAD Gender and Development GASTPE Government Assistance to Students and Teachers in Private Education GDP Gross Domestic Product GOP Government of The Philippines GMIS Government Management Information System IAS Internal Audit Service ICT Information and Communications Technology IP Indigenous People IPPD Individual Plan for Professional Development IPsEO Indigenous Peoples Education Office ISR Implementation Status Report KRTs Key Reform Thrusts LEAPS Learning, Equity, and Accountability Program Support Project LGU Local Government Unit LIS Learner Information System MOOE Maintenance and Other Operating Expenses MTB-MLE Mother-Tongue based Multilingual Education MTPDP Medium-Term Philippine Development Plan NAT National Achievement Test
ii

NCBTS National Competency-Based Teacher Standards NEDA National Economic and Development Authority NGO Non-government Organization NGAS National Government Accounting System NPSBE National Program Support for Basic Education PASBE Philippines Accreditation System for Basic Education PHRD Policy and Human Resource Development PPR Project Preparation Review PRIME Philippines Response to Indigenous Peoples’ and Muslim Education PTCA Parent-Teacher-Community Association QAAF Quality Assurance and Accountability Framework QER Quality at Entry SARO Special Allotment Release Order SBM School Based Management SIML Sector Investment and Maintenance Loan SPHERE Support to Philippine Basic Education Reforms TA Technical Assistance TDIS Training and Development Information System TIMSS Trends in International Mathematics and Science Studies TSNA Teachers’ Strengths and Needs Assessment TWGs Technical Working Groups
Vice President: Axel van Trotsenburg Country Director: Motoo Konishi Sector Manager: Luis Benveniste
Project Team Leader: Lynnette de la Cruz Perez ICR Team Leader: Lynnette de la Cruz Perez
iii


PHILIPPINES Support to Philippine Basic Education Reforms
CONTENTS
Data Sheet A. Basic Information B. Key Dates C. Ratings Summary D. Sector and Theme Codes E. Bank Staff F. Results Framework Analysis G. Ratings of Project Performance in ISRs H. Restructuring I. Disbursement Graph
1. Project Context, Development Objectives and Design ............................................... 1 2. Key Factors Affecting Implementation and Outcomes .............................................. 6 3. Assessment of Outcomes .......................................................................................... 17 4. Assessment of Risk to Development Outcome ......................................................... 23 5. Assessment of Bank and Borrower Performance ..................................................... 24 6. Lessons Learned ....................................................................................................... 27 7. Comments on Issues Raised by Grantee/Implementing Agencies/Donors .............. 28 Annex 1. Project Costs and Financing .......................................................................... 29 Annex 2. Outputs by Component ................................................................................. 30 Annex 3. Economic and Financial Analysis ................................................................. 37 Annex 4. Grant Preparation and Implementation Support/Supervision Processes ....... 49 Annex 5. Beneficiary Survey Results ........................................................................... 51 Annex 6. Stakeholder Workshop Report and Results ................................................... 52 Annex 7. Summary of Grantee's ICR and/or Comments on Draft ICR ........................ 53 Annex 8. Comments of Cofinanciers and Other Partners/Stakeholders ....................... 57 Annex 9. List of Supporting Documents ...................................................................... 58 MAP .............................................................................................................................. 60
iv

A. Basic Information
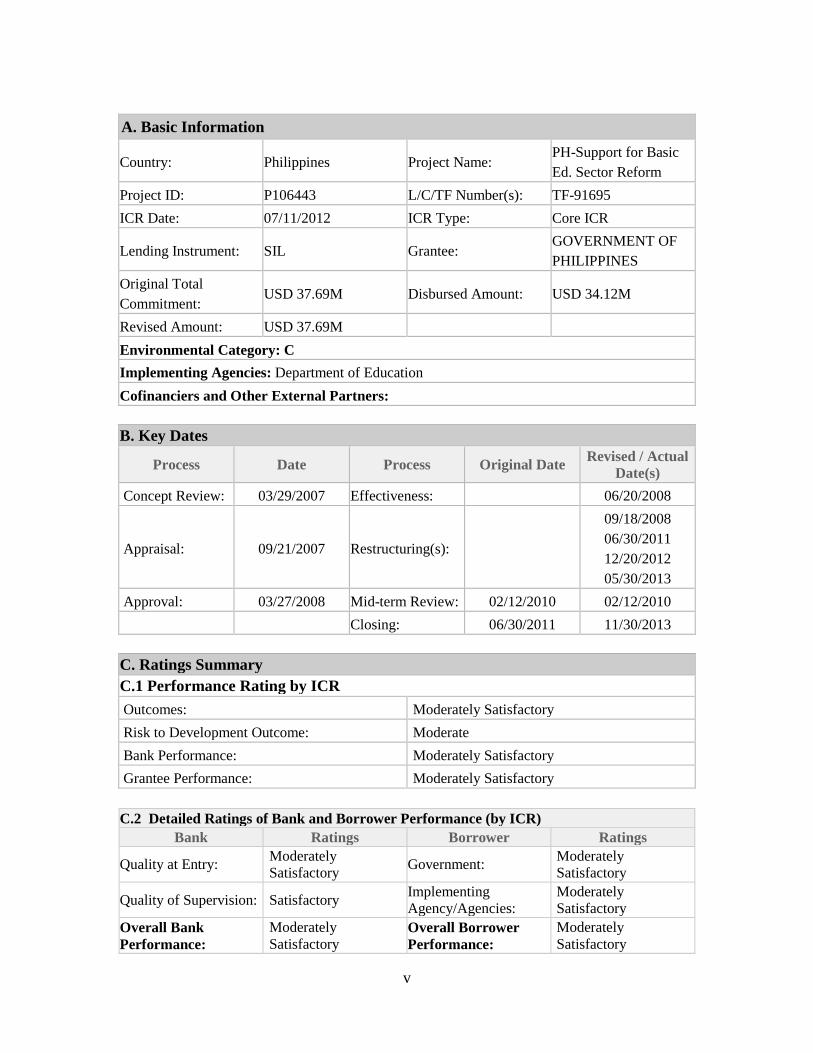
Country: Philippines Project Name: PH-Support for Basic Ed. Sector Reform
Project ID: P106443 L/C/TF Number(s): TF-91695 ICR Date: 07/11/2012 ICR Type: Core ICR
Lending Instrument: SIL Grantee: GOVERNMENT OF PHILIPPINES
Original Total Commitment:
USD 37.69M Disbursed Amount: USD 34.12M
Revised Amount: USD 37.69M Environmental Category: C Implementing Agencies: Department of Education Cofinanciers and Other External Partners: B. Key Dates
Process Date Process Original Date Revised / Actual Date(s)
Concept Review: 03/29/2007 Effectiveness: 06/20/2008
Appraisal: 09/21/2007 Restructuring(s):
09/18/2008 06/30/2011 12/20/2012 05/30/2013
Approval: 03/27/2008 Mid-term Review: 02/12/2010 02/12/2010 Closing: 06/30/2011 11/30/2013 C. Ratings Summary C.1 Performance Rating by ICR Outcomes: Moderately Satisfactory Risk to Development Outcome: Moderate Bank Performance: Moderately Satisfactory Grantee Performance: Moderately Satisfactory
C.2 Detailed Ratings of Bank and Borrower Performance (by ICR) Bank Ratings Borrower Ratings
Quality at Entry: Moderately Satisfactory Government: Moderately
Satisfactory
Quality of Supervision: Satisfactory Implementing Agency/Agencies:
Moderately Satisfactory
Overall Bank Performance:
Moderately Satisfactory
Overall Borrower Performance:
Moderately Satisfactory
v
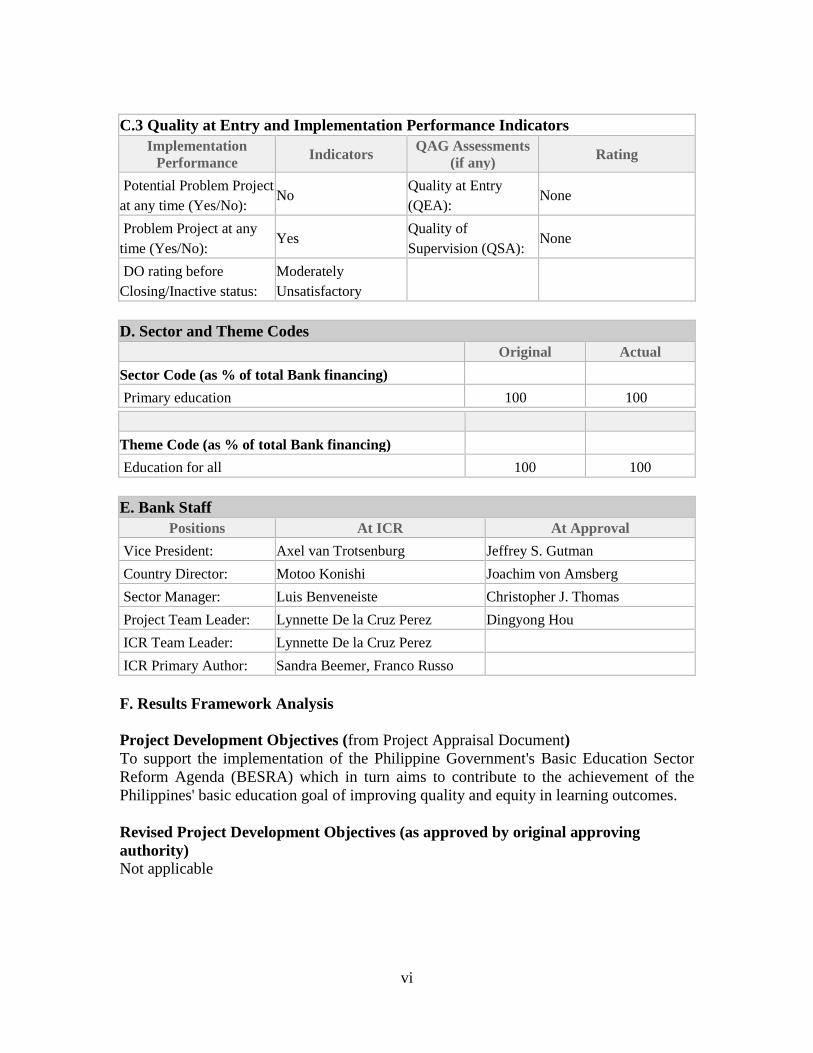
C.3 Quality at Entry and Implementation Performance Indicators
Implementation Performance Indicators QAG Assessments
(if any) Rating
Potential Problem Project at any time (Yes/No):
No Quality at Entry (QEA):
None
Problem Project at any time (Yes/No):
Yes Quality of Supervision (QSA):
None
DO rating before Closing/Inactive status:
Moderately Unsatisfactory
D. Sector and Theme Codes
Original Actual Sector Code (as % of total Bank financing) Primary education 100 100
Theme Code (as % of total Bank financing) Education for all 100 100 E. Bank Staff
Positions At ICR At Approval Vice President: Axel van Trotsenburg Jeffrey S. Gutman Country Director: Motoo Konishi Joachim von Amsberg Sector Manager: Luis Benveneiste Christopher J. Thomas Project Team Leader: Lynnette De la Cruz Perez Dingyong Hou ICR Team Leader: Lynnette De la Cruz Perez ICR Primary Author: Sandra Beemer, Franco Russo F. Results Framework Analysis Project Development Objectives (from Project Appraisal Document) To support the implementation of the Philippine Government's Basic Education Sector Reform Agenda (BESRA) which in turn aims to contribute to the achievement of the Philippines' basic education goal of improving quality and equity in learning outcomes. Revised Project Development Objectives (as approved by original approving authority) Not applicable
vi
(a) PDO Indicator(s)
Indicator Baseline Value
Original Target Values (from
approval documents)
Formally Revised Target Values
Actual Value Achieved at
Completion or Target Years
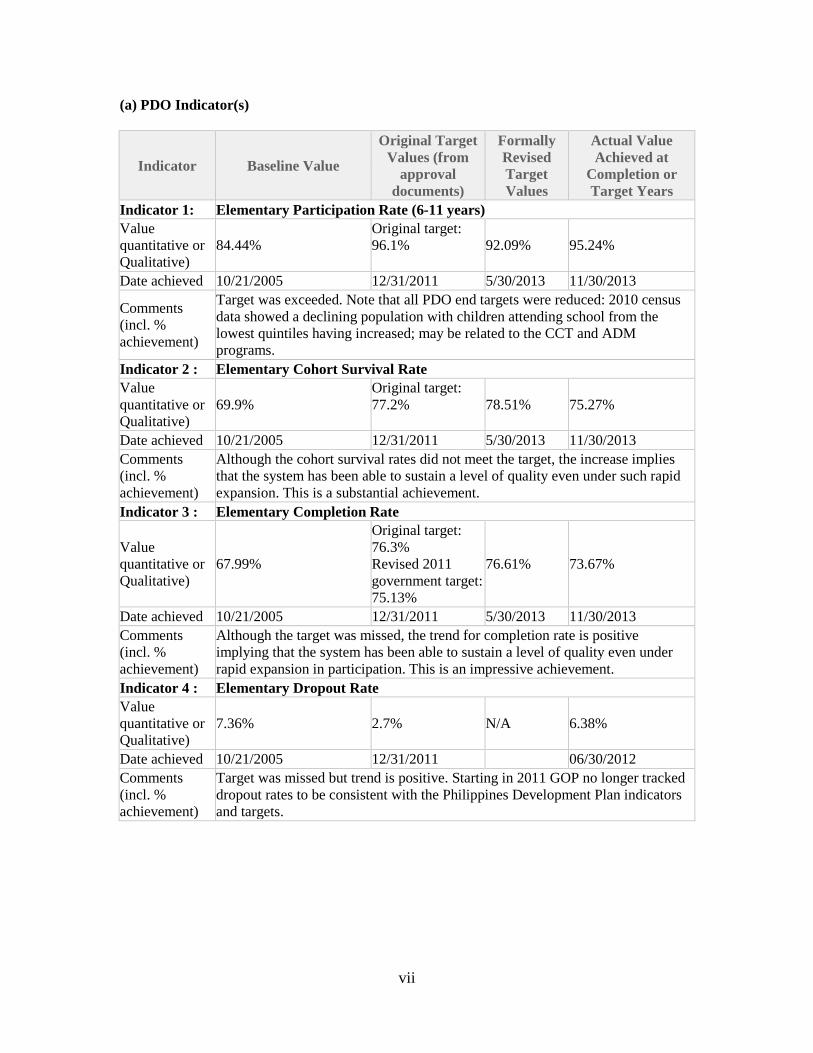
Indicator 1: Elementary Participation Rate (6-11 years) Value quantitative or Qualitative)
84.44% Original target: 96.1%
92.09% 95.24%
Date achieved 10/21/2005 12/31/2011 5/30/2013 11/30/2013
Comments (incl. % achievement)
Target was exceeded. Note that all PDO end targets were reduced: 2010 census data showed a declining population with children attending school from the lowest quintiles having increased; may be related to the CCT and ADM programs.
Indicator 2 : Elementary Cohort Survival Rate Value quantitative or Qualitative)
69.9% Original target: 77.2%
78.51% 75.27%
Date achieved 10/21/2005 12/31/2011 5/30/2013 11/30/2013 Comments (incl. % achievement)
Although the cohort survival rates did not meet the target, the increase implies that the system has been able to sustain a level of quality even under such rapid expansion. This is a substantial achievement.
Indicator 3 : Elementary Completion Rate
Value quantitative or Qualitative)
67.99%
Original target: 76.3% Revised 2011 government target: 75.13%
76.61% 73.67%
Date achieved 10/21/2005 12/31/2011 5/30/2013 11/30/2013 Comments (incl. % achievement)
Although the target was missed, the trend for completion rate is positive implying that the system has been able to sustain a level of quality even under rapid expansion in participation. This is an impressive achievement.
Indicator 4 : Elementary Dropout Rate Value quantitative or Qualitative)
7.36% 2.7% N/A 6.38%
Date achieved 10/21/2005 12/31/2011 06/30/2012 Comments (incl. % achievement)
Target was missed but trend is positive. Starting in 2011 GOP no longer tracked dropout rates to be consistent with the Philippines Development Plan indicators and targets.
vii
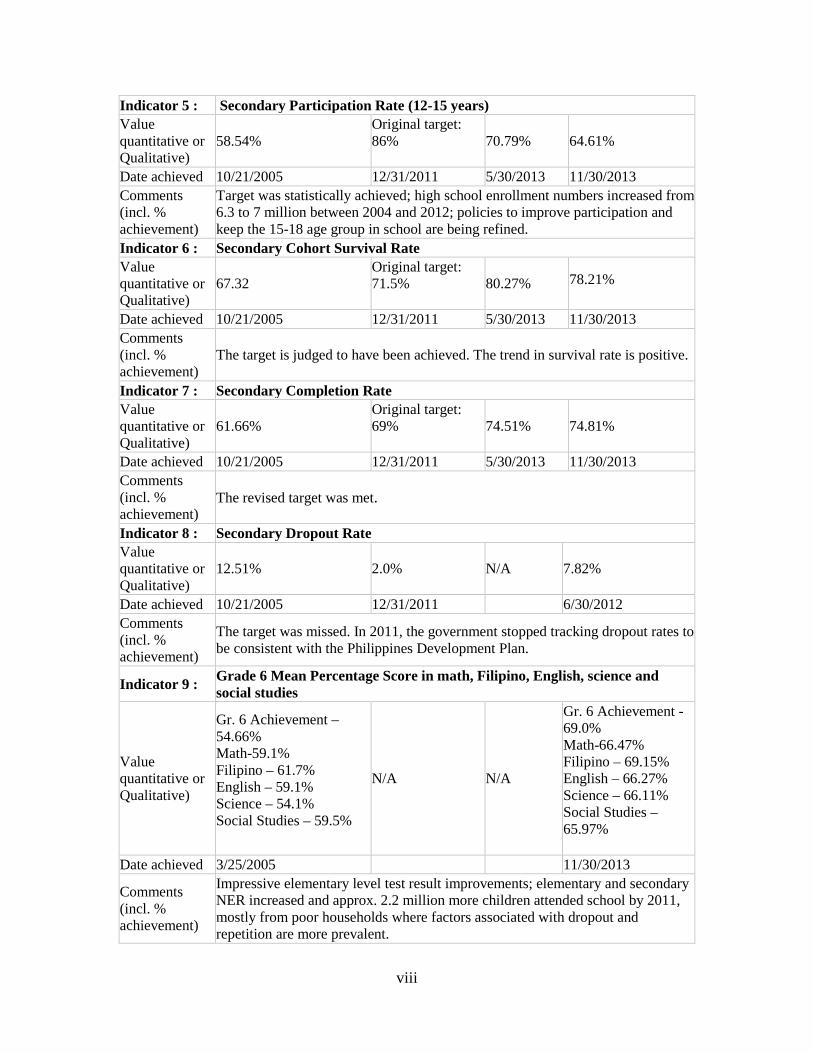
Indicator 5 : Secondary Participation Rate (12-15 years) Value quantitative or Qualitative)
58.54% Original target: 86%
70.79% 64.61%
Date achieved 10/21/2005 12/31/2011 5/30/2013 11/30/2013 Comments (incl. % achievement)
Target was statistically achieved; high school enrollment numbers increased from 6.3 to 7 million between 2004 and 2012; policies to improve participation and keep the 15-18 age group in school are being refined.
Indicator 6 : Secondary Cohort Survival Rate Value quantitative or Qualitative)
67.32 Original target: 71.5%
80.27% 78.21%
Date achieved 10/21/2005 12/31/2011 5/30/2013 11/30/2013 Comments (incl. % achievement)
The target is judged to have been achieved. The trend in survival rate is positive.
Indicator 7 : Secondary Completion Rate Value quantitative or Qualitative)
61.66% Original target: 69%
74.51% 74.81%
Date achieved 10/21/2005 12/31/2011 5/30/2013 11/30/2013 Comments (incl. % achievement)
The revised target was met.
Indicator 8 : Secondary Dropout Rate Value quantitative or Qualitative)
12.51% 2.0% N/A 7.82%
Date achieved 10/21/2005 12/31/2011 6/30/2012 Comments (incl. % achievement)
The target was missed. In 2011, the government stopped tracking dropout rates to be consistent with the Philippines Development Plan.
Indicator 9 : Grade 6 Mean Percentage Score in math, Filipino, English, science and social studies
Value quantitative or Qualitative)
Gr. 6 Achievement – 54.66% Math-59.1% Filipino – 61.7% English – 59.1% Science – 54.1% Social Studies – 59.5%
N/A N/A
Gr. 6 Achievement -69.0% Math-66.47% Filipino – 69.15% English – 66.27% Science – 66.11% Social Studies –65.97%
Date achieved 3/25/2005 11/30/2013
Comments (incl. % achievement)
Impressive elementary level test result improvements; elementary and secondary NER increased and approx. 2.2 million more children attended school by 2011, mostly from poor households where factors associated with dropout and repetition are more prevalent.
viii

Indicator 10: Year 2 Achievement (high school)
Value quantitative or Qualitative)
Yr. 2 Achievement–46.66% Math-39.06% Filipino – 48.91% English – 51.81% Science – 42.00% Social Studies – 51.51%
N/A N/A
Yr. 2 Achievement-47.93 Math-42.0% Filipino – 58.39% English – 46.45% Science – 39.35% Social Studies –52.3%
Date achieved 3/25/2005 11/30/2013
Comments (incl. % achievement)
SY2010-11: Improvements in math, Filipino, and social studies; some declines in English and science, yet impressive improvements given that elementary and secondary enrollment increased by approx. 2.2 million more children attending school in 2011 than in 2005.
(b) Intermediate Outcome Indicator(s)
Indicator Baseline Value
Original Target Values (from
approval documents)
Formally Revised
Target Values
Actual Value Achieved at
Completion or Target Years
Indicator 1 : Cost sharing between GOP and Local Government Unit (LGU) applied to classroom construction, including equity factors
Value quantitative or Qualitative)
There were cost-sharing arrangements in place at the time of project preparation and upon commencement of the project but very informal and done in a very informal bases
65% of classroom construction follows scheme
N/A
100% classroom construction involved a statement of interest between the DepEd and the Local Government Units (LGUs) before works commenced.
Date achieved 10/10/2007 12/31/2012 11/30/2013 Comments (incl. % achievement)
Target was met. Statements of interest signed to ensure LGUs involved and committed in sharing the burden of construction either through cash or in-kind contributions (i.e. local engineers, site preparation, extra LGU manpower).
Indicator 2 : Policy on the procurement/production of teaching and learning materials (including roles of central, regional, divisional and school levels adopted)
Value quantitative or Qualitative)
No policy Policy adpoted Policy adopted
Date achieved 10/10/2007 12/31/2012 11/30/2013 Comments (incl. % achievement)
Target was met.
ix
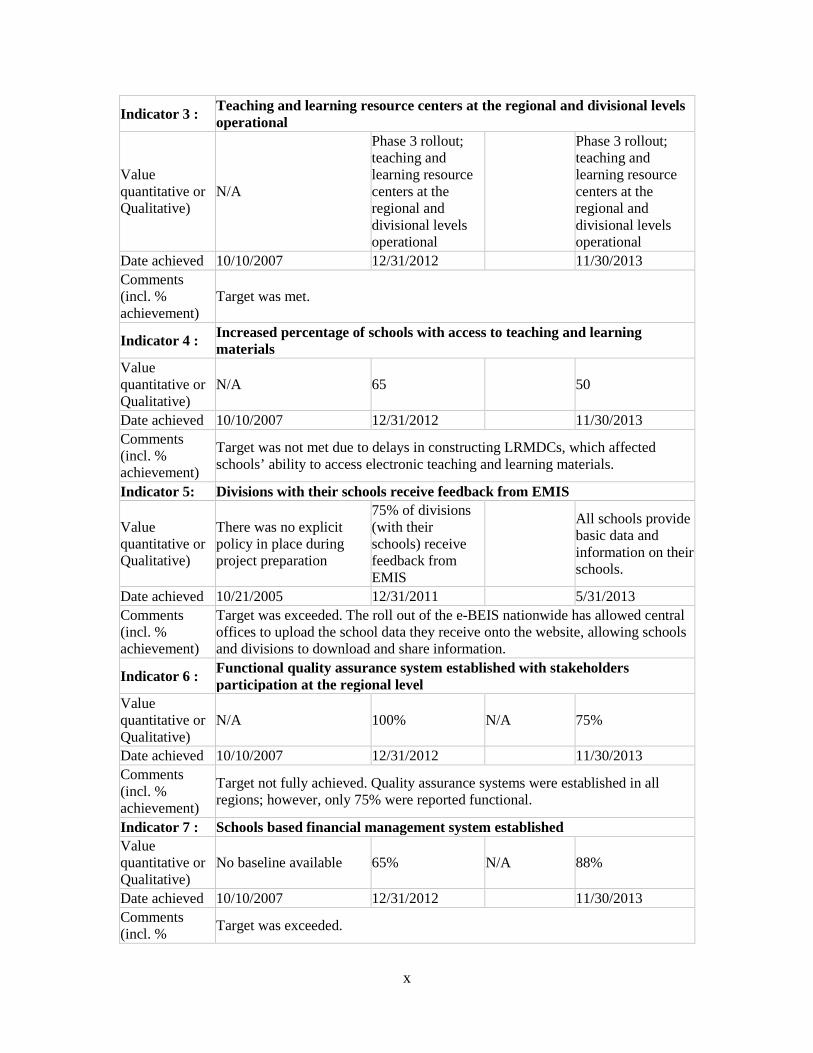
Indicator 3 : Teaching and learning resource centers at the regional and divisional levels operational
Value quantitative or Qualitative)
N/A
Phase 3 rollout; teaching and learning resource centers at the regional and divisional levels operational
Phase 3 rollout; teaching and learning resource centers at the regional and divisional levels operational
Date achieved 10/10/2007 12/31/2012 11/30/2013 Comments (incl. % achievement)
Target was met.
Indicator 4 : Increased percentage of schools with access to teaching and learning materials
Value quantitative or Qualitative)
N/A 65 50
Date achieved 10/10/2007 12/31/2012 11/30/2013 Comments (incl. % achievement)
Target was not met due to delays in constructing LRMDCs, which affected schools’ ability to access electronic teaching and learning materials.
Indicator 5: Divisions with their schools receive feedback from EMIS
Value quantitative or Qualitative)
There was no explicit policy in place during project preparation
75% of divisions (with their schools) receive feedback from EMIS
All schools provide basic data and information on their schools.
Date achieved 10/21/2005 12/31/2011 5/31/2013 Comments (incl. % achievement)
Target was exceeded. The roll out of the e-BEIS nationwide has allowed central offices to upload the school data they receive onto the website, allowing schools and divisions to download and share information.
Indicator 6 : Functional quality assurance system established with stakeholders participation at the regional level
Value quantitative or Qualitative)
N/A 100% N/A 75%
Date achieved 10/10/2007 12/31/2012 11/30/2013 Comments (incl. % achievement)
Target not fully achieved. Quality assurance systems were established in all regions; however, only 75% were reported functional.
Indicator 7 : Schools based financial management system established Value quantitative or Qualitative)
No baseline available 65% N/A 88%
Date achieved 10/10/2007 12/31/2012 11/30/2013 Comments (incl. % Target was exceeded.
x
achievement)
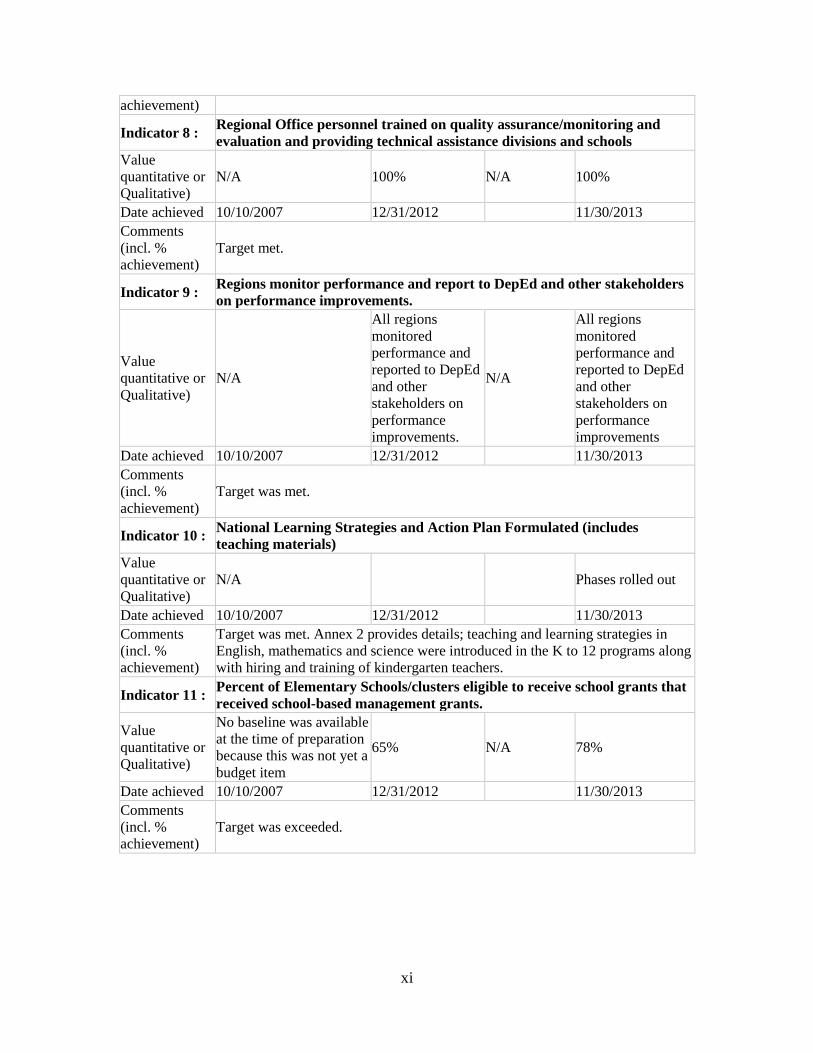
Indicator 8 : Regional Office personnel trained on quality assurance/monitoring and evaluation and providing technical assistance divisions and schools
Value quantitative or Qualitative)
N/A 100% N/A 100%
Date achieved 10/10/2007 12/31/2012 11/30/2013 Comments (incl. % achievement)
Target met.
Indicator 9 : Regions monitor performance and report to DepEd and other stakeholders on performance improvements.
Value quantitative or Qualitative)
N/A
All regions monitored performance and reported to DepEd and other stakeholders on performance improvements.
N/A
All regions monitored performance and reported to DepEd and other stakeholders on performance improvements
Date achieved 10/10/2007 12/31/2012 11/30/2013 Comments (incl. % achievement)
Target was met.
Indicator 10 : National Learning Strategies and Action Plan Formulated (includes teaching materials)
Value quantitative or Qualitative)
N/A Phases rolled out
Date achieved 10/10/2007 12/31/2012 11/30/2013 Comments (incl. % achievement)
Target was met. Annex 2 provides details; teaching and learning strategies in English, mathematics and science were introduced in the K to 12 programs along with hiring and training of kindergarten teachers.
Indicator 11 : Percent of Elementary Schools/clusters eligible to receive school grants that received school-based management grants.
Value quantitative or Qualitative)
No baseline was available at the time of preparation because this was not yet a budget item
65% N/A 78%
Date achieved 10/10/2007 12/31/2012 11/30/2013 Comments (incl. % achievement)
Target was exceeded.
xi

Indicator 12 : National Quality Assurance and Accountability Framework developed and adopted. (including standards for inputs, process, outputs and outcomes)
Value quantitative or Qualitative)
N/A Policy in Place by Year 1 of Project (2007
Policy in place by year 1 of project; standards for some inputs (classroom construction, curriculum, textbooks, student assessment revised within the life of the project)
Date achieved 10/10/2007 12/31/2012 11/30/2013 Comments (incl. % achievement)
Target was met. Standards were redefined for classrooms, textbooks, teachers, instructional materials etc. to integrate quality standards and also as part of the accreditation standards developed for elementary as well as high schools.
Indicator 13 : Basic Education Sector Reform Agenda Technical Coordinating Team and Technical Working Groups (TWG) are operational/functional.
Value quantitative or Qualitative)
Technical coordinating team and TWGs not yet operational, 15% of TWG action plans prepared
TWG action plans prepared and implemented with 100% implementation
Technical coordinating team and TWGs are operational/ functional. TWG action plans prepared and implemented with 100% accomplishment.
Date achieved 10/10/2007 12/31/2012 11/30/2013 Comments (incl. % achievement)
Target met.
Indicator 14 : Schools receive feedback from national assessment Value quantitative or Qualitative)
N/A 100% 100%
Date achieved 10/10/2007 12/31/2012 11/30/2013
Comments (incl. % achievement)
Target was met. Schools receive feedback through their division offices or can access the results of the National Achievement Test online; test results and assessment outcomes used to adjust in-service teacher training programs, adjust teachers’ TSNA etc.
xii
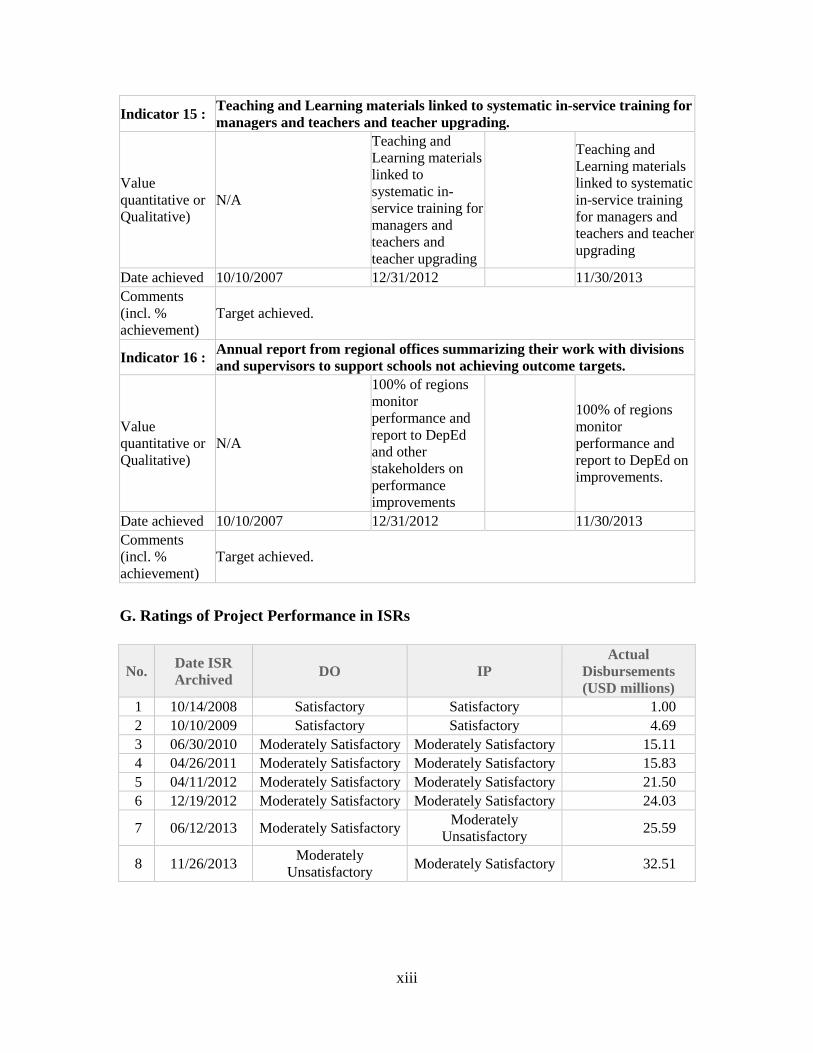
Indicator 15 : Teaching and Learning materials linked to systematic in-service training for managers and teachers and teacher upgrading.
Value quantitative or Qualitative)
N/A
Teaching and Learning materials linked to systematic in-service training for managers and teachers and teacher upgrading
Teaching and Learning materials linked to systematic in-service training for managers and teachers and teacher upgrading
Date achieved 10/10/2007 12/31/2012 11/30/2013 Comments (incl. % achievement)
Target achieved.
Indicator 16 : Annual report from regional offices summarizing their work with divisions and supervisors to support schools not achieving outcome targets.
Value quantitative or Qualitative)
N/A
100% of regions monitor performance and report to DepEd and other stakeholders on performance improvements
100% of regions monitor performance and report to DepEd on improvements.
Date achieved 10/10/2007 12/31/2012 11/30/2013 Comments (incl. % achievement)
Target achieved.
G. Ratings of Project Performance in ISRs
No. Date ISR Archived DO IP
Actual Disbursements (USD millions)
1 10/14/2008 Satisfactory Satisfactory 1.00 2 10/10/2009 Satisfactory Satisfactory 4.69 3 06/30/2010 Moderately Satisfactory Moderately Satisfactory 15.11 4 04/26/2011 Moderately Satisfactory Moderately Satisfactory 15.83 5 04/11/2012 Moderately Satisfactory Moderately Satisfactory 21.50 6 12/19/2012 Moderately Satisfactory Moderately Satisfactory 24.03
7 06/12/2013 Moderately Satisfactory Moderately Unsatisfactory 25.59
8 11/26/2013 Moderately Unsatisfactory Moderately Satisfactory 32.51
xiii
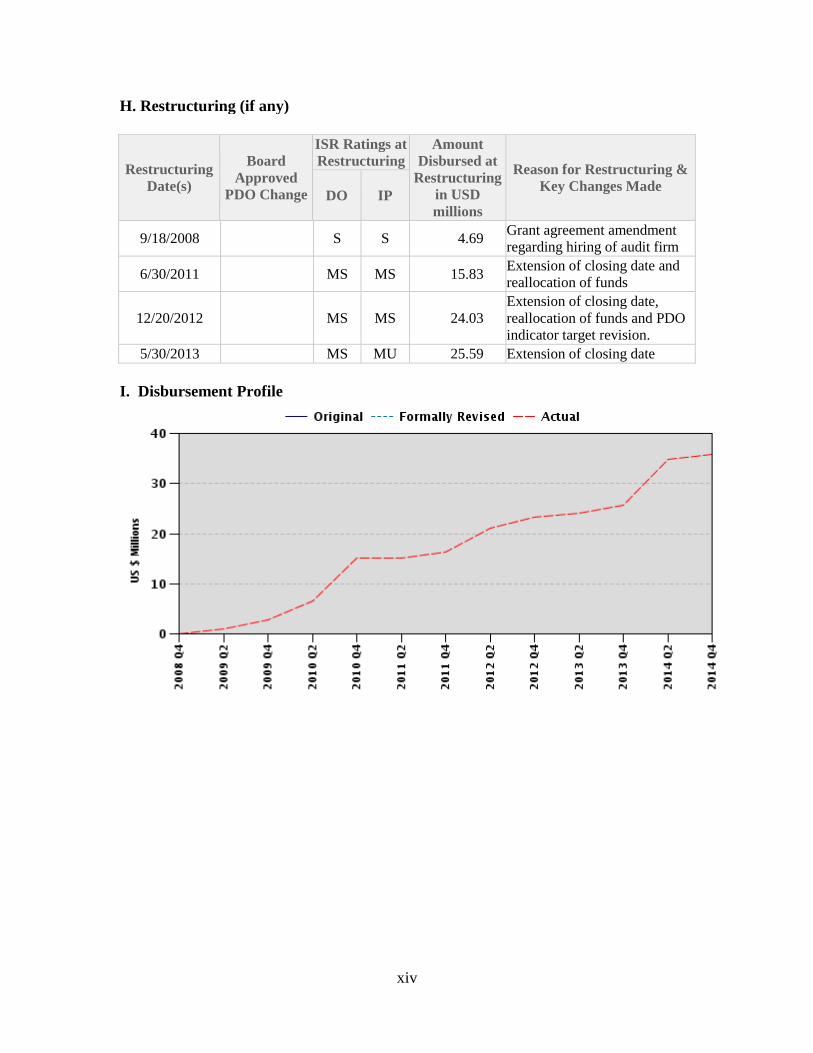
H. Restructuring (if any)
Restructuring Date(s)
Board Approved
PDO Change
ISR Ratings at Restructuring
Amount Disbursed at
Restructuring in USD millions
Reason for Restructuring & Key Changes Made DO IP
9/18/2008 S S 4.69 Grant agreement amendment regarding hiring of audit firm
6/30/2011 MS MS 15.83 Extension of closing date and reallocation of funds
12/20/2012 MS MS 24.03 Extension of closing date, reallocation of funds and PDO indicator target revision.
5/30/2013 MS MU 25.59 Extension of closing date I. Disbursement Profile
xiv
1. Project Context, Development Objectives and Design 1.1. Context at Appraisal 1. Country Context. Over the period 1961-2003, the Philippines had a high average annual population growth rate of 2.6 percent (compared to 1.7 percent in the region). Over the same period, the Philippines had had a correspondingly modest 1.4 percent average annual per capita gross domestic product (GDP) growth rate. This compared to an average increase of 5.4 percent in per capita GDP for other East Asian countries over the same period. In 2004, the GDP of the Philippines was estimated at US$84.6 billion up from 6.1 percent in 2003. The GDP per capita in 2004 was estimated at US$1,025. The major economic sectors included agriculture and industry, especially for processing, textiles, garments, electronics and automobile parts. The economy was dominated by the service sector, representing 54 percent of GDP and over 37 percent of workers were self-employed. The unemployment rate in April 2005 was 7.5 percent. Inflation was on the rise and in 2005 it was 7 percent, up from 5.5 percent in 2004. 2. There was a lack of social inclusion in the Philippines. Inequality was high and when coupled with low growth over the longer term, it translated into slow progress on poverty reduction. The richest five percent of households accounted for nearly one third of national income, while the poorest 20 percent accounted for only six percent. The poverty incidence, based on household consumption, had declined marginally from 27.6 percent in 2000 to 26.1 percent in 2003, after an increase of two percentage points between 1997 and 2000. Poverty severity remained about the same between 2000 and 2003 which meant that the living standards of those who remained poor had not improved. 3. Sector Context. In 2005, the total Department of Education (DepEd) budget represented approximately two percent of GDP and 18.5 percent of the total Government of the Philippines (GOP) budget net of debt service. Spending on teachers’ salaries and other personnel services made up 89 percent of the DepEd budget. An additional four percent was spent on educational infrastructure, which left seven percent of the DepEd budget to cover other recurrent costs such as operating expenses, teacher in-service training and the purchase of instructional aids. DepEd, with support from the World Bank, had prepared a spending plan that showed a worsening fiscal pressure over time, which would limit the country’s ability to achieve its 2015 Education for All (EFA) targets. The three factors influencing the fiscal pressures were: (i) the high fixed costs of salaries and personnel benefits; (ii) rapid growth of the school aged population, requiring the system to expand rapidly at the expense of quality improvements;; and (iii) the need to increase the number of public high schools to accommodate private high school students following the 1997 Asian financial crisis. 4. Education outcomes in the Philippines were low compared to the rest of the East Asia region. The 2003 Trends in International Mathematics and Science Studies (TIMSS) showed that the Philippines ranked 34th out of 38 countries in Grade 8 mathematics and
1
43rd out of 46 countries in Grade 8 science. For Grade 4, the Philippines ranked 23rd out of 25 participating countries in both mathematics and science. In addition, there was poor internal efficiency in the system. Participation rates in 2003 at the elementary level were higher than high school level, 94.02 percent and 63.88 percent respectively. However, the dropout rates were 7.34 percent for elementary and 13.1 percent for high school, which meant that approximately 50 percent of students beginning elementary school graduated from high school. The high population growth rates and the tight fiscal situation contributed to these outcomes. There were also several teacher related concerns: (i) teacher qualifications, particularly at the high school level, were low in mathematics and science; (ii) no performance-related pay structure which made it difficult to reward top teachers; (iii) quality pre-service teacher training was poor, and (iv) teacher deployment to hard- to-reach areas was difficult due to provisions in the 1967 Magna Carta for Public School Teachers, allowing teachers to refuse transfer. 5. To combat these problems, the GOP developed a poverty reduction strategy that was defined in the Government’s Medium-Term Philippines Development Plan (MTPDP) 2004-2020, which gave high priority to achieving universal basic education. The country’s education strategy was guided by the National Education for All (EFA) 2015 Plan and was intended to contribute to the achievement of the Millennium Development Goals (MDGs). While remaining committed to the overall development and poverty reduction strategies, the Government also acknowledged the particular challenges for basic education. Important initiatives on rationalization were introduced by DepEd following the passage of the Governance of Basic Education Act (Republic Act RA 9155) in 2001 with its emphasis on decentralization and its declaration that schools should be the heart of the formal education system. By 2005, consensus emerged on the need for urgent sector-wide strategies, placing schools first and empowering local communities to achieve school improvement. The strategies were articulated in a policy called the Schools First Initiative (SFI) and translated into policy actions under the Government’s Basic Education Sector Reform Agenda (BESRA).1 6. The overall objectives of BESRA encompassed universal access to basic education schooling and success for children in that age group, with community support enabling effective school-based management, and the provision of universal functional literacy for adults using alternative learning schemes. The policy actions of BESRA were collected under five key reform thrusts (KRTs): (i) continuous school improvement facilitated by active involvement of local stakeholders; (ii) better learning outcomes achieved by improved teacher standards; (iii) desired learning outcomes enhanced by national curriculum strategies, multi-sector coordination, and quality assurance; (iv) improved impact on outcomes resulting from complementary early childhood education, alternative learning systems and private sector participation; and (v) a change in DepEd culture from prescribing actions through orders and memoranda to facilitating school-based initiatives and assuring quality.
1 Basic education in the Philippines includes kindergarten, elementary and high school (K-12).
2
7. Project Context. Building on the lessons of the past and aligned to the Government’s MTPDP, the Country Assistance Strategy (CAS) 2006-2008 sought to achieve economic growth and promote social cohesion. While improving education in general would contribute to this overall objective, support for BESRA had a strategic focus since it tackled two key challenges: fiscal reform in the short-term and making public institutions more effective in the long-run. The strategy was designed to support the Government’s overall, coherent reform agenda and in particular to align Bank and other donor assistance to those strategic priorities in the existing national budget that address reforms to achieve fiscal stability and improved governance. In addition, the BESRA provided the government with the first opportunity to coordinate donor assistance in an effort to meet reform goals. The government worked with international partners to ensure that donor assistance did not overlap and that all aspects of the reform agenda could be covered based on government needs. 8. To support the BESRA the Bank provided funding for the National Program Support for Basic Education (NPSBE) 2 which was the first Bank operation in the Philippines that adopted a “National Program Support” approach. This approach required a shift from financing discrete projects towards support for coherent programs. The Bank assistance through the NPSBE facilitated implementation of reforms furthering decentralization and rationalization of the system of basic education in ways that improved equity, quality, governance and financing of basic education services. With its program approach, the NPSBE provided the impetus to launch system-wide reforms. It also sharpened the Government’s policy framework for coordination of donor assistance and provided a roadmap for subsequent additional financing from the donor community for implementation of the reform agenda. In order to support the BESRA, AusAID provided trust fund money to be administered by the Bank for the Support to Philippine Basic Education Reforms (SPHERE) 3 project, which mainly financed the needed technical assistance (TA) for critical areas of BESRA that were not supported under the NPSBE. SPHERE ran in parallel to the NPSBE and was instrumental in supporting necessary studies to assess governance issues as well as provide technical and knowledge support in critical areas of the reform agenda supported by the project. A SPHERE Bank-executed grant for supervision and analytical work was also mobilized to provide technical support to the government in various areas of the reform agenda (e.g., School
2 The NPSBE project closed December 31, 2012 and a separate Implementation Completion Report (ICR) was submitted June 30, 2013 for this project. Project financing represented approximately 1 percent of the yearly DepEd budget and 5 percent of the line item support for one year. While the project resources were a small portion of the overall government budget, it was viewed as important for leveraging additional resources for the government’s education policy reforms. 3 This ICR will report on the recipient executed trust fund. However, there were also two Bank-executed grants, one for incremental supervision costs and another provided demand driven analytical work, which includes: (i) Education Sector Contracting (ESC) program review; (ii) mobilization of technical assistance in various areas of the reform such as SBM, organizational development, Information and Communication Technology (ICT) in education, financial management, teacher development, etc; (iii) complementary resources for the development of the medium-term expenditure framework; (iv) development of the Special Education Fund budget manual; and (v) policy review of all DepEd policy issuances from 1970 to date with the end view of improving policy formulation, identifying policy gaps and eliminating policy overlaps.
3

Based Management - SBM, Quality Assurance, Organizational Development, Teacher Development, Public Financial Management, and Governance). These funds also provided analytical underpinning to enhance the effectiveness of allocation and utilization of government resources mobilized to support the BESRA (e.g., review of the Education Service Contracting Program, updating of the medium-term expenditure framework for basic education). 1.2 Original Project Development Objectives (PDO) and Key Indicators 9. The project development objective was to support the implementation of the BESRA which in turn aimed to contribute to the achievement of the Philippines' basic education goal of improving quality and equity in learning outcomes. The key indicators selected to measure progress toward the PDO were: Elementary Participation: (i) participation rate, 6-11 years; (ii) cohort survival; (iii) completion rate; and (iv) dropout rate. High School Participation: (i) participation rate 12-15 years; (ii) cohort survival; (iii) completion rate; and (iv) dropout rate. Quality and efficiency: (i) Grade 6 Achievement in mathematics, Filipino, English, science, and Hekasi (social studies); and (ii) Year 2 mean percentage score on the national achievement test. 1.3 Revised PDO (as approved by original approving authority) and Key Indicators, and reasons/justification 10. The PDO was not revised during project implementation, and the key development indicators remained the same throughout the life of the project. However, in 2011, GOP through NEDA and the DepEd adjusted the targets for the education outcome indicators in the Philippine Development Plan, which were the same indicators used for the BESRA and the SPHERE PDO. These adjustments were made based on the 2010 census data, which showed a decline in population growth and the recognition that the targets were too ambitious. The government only officially validated the new end targets in December 2012. The Bank team restructured the results framework and revised the targets. The adjusted targets will be used to assess system improvement and measure project achievement. In 2012 the GOP Interagency Committee on Education Statistics made the decision to no longer track dropout rates. This decision was after the 2012 restructuring of indicator targets therefore, the ICR reports on dropout rates for SY 2011-12. 1.4 Main Beneficiaries 11. The targeted beneficiaries in the project consisted of: (i) the schools and their communities, encompassing individual parents, the Parent-Teacher-Community Association (PTCA), local government, the private sector, and non-government organizations (NGOs); (ii) basic education teachers, principals, Division and Regional staff and officials; and (iii) basic education learners.
4

1.5 Original Components 12. Component 1: Translation of system-level policies into actions (AUD21.15 million). This component supported: (i) funding for short to medium term technical assistance (TA) to translate policy ideas on reform into action plans and to build capacity of key DepEd managers to implement and manage change in line with DepEd reforms; (ii) training programs for capacity building in regional offices by supporting them to undertake their quality assurance functions of monitoring progress in divisions and schools, delivering support as required, and enhancing feedback on their performance; (iii) funding for the construction and/or refurbishment of learning and resource and development centers (LRMDCs) which also included ICT support, managed by regions as part of their quality assurance work to enhance monitoring and to improve teaching, learning and assessment, as with satellite hubs constructed at the division level; and (iv) funding for the provision of teaching and learning materials (except textbooks) many of which had already been developed by other donor supported projects and in-service training programs. 13. Component 2: Support for school-based management (SBM) through grants for school improvement plan targeting disadvantaged elementary schools (AUD4.48 million). This component supported the provision of SBM grants which were to be used to accelerate SBM in the most difficult situations. The grants were to be provided over a five year period to eligible schools with year 3 funding allocated on the basis of demonstrated performance. 14. Component 3: Classroom construction in high need locations in Southern Philippines (AUD13.82 million) with extensive community partnership. These construction activities were thought to serve as a forerunner to inform policy reform on cost sharing between the national government and other partners (such as the private sector and local government units) and improved resource mobilization. 1.6 Revised Components 15. The components were not revised during the implementation period. 1.7 Other significant changes 16. On September 18, 2008, Section 2.03(c) for the grant agreement was amended as follows: “By November 30, 2008, the Recipient, through the Department of Education, will acquire through the Australia Philippines Partnership for Economic Governance Reforms the services of a qualified independent auditing firm under terms of reference acceptable to the Bank.” 17. On June 30, 2011, the Bank, at the request of the government, granted an 18-month extension of the original project closing date from June 30, 2011 to December 31, 2012 in order to complete project activities which had been delayed due to capacity constraints within DepEd, regions and divisions. At the time of this restructuring, there
5
was also a reallocation of project funds which decreased the amount of money to be used for the LRMDCs4 and to: (i) increase funds to build more classrooms in areas with acute shortage; (ii) procure more technical assistance on critical areas of the reform program; (iii) conduct trainings and/or capacity building activities at the regional, division and school level personnel; (iv) provide more school based management grants; and (v) provide more incremental operating cost for implementation of the project. 18. On December 20, 2012, the Bank, at the request of the government, granted a second extension of the project closing date from December 31, 2012 to May 31, 2013 in order to allow for the full implementation of project activities. There had been a delay in project implementation due to the late release of the spending authority (Special Allotment Release Order) by the Department of Budget and Management which in turn affected the procurement of additional classrooms, works and goods. At the time of this restructuring there was also a reallocation of funds from the printing and distribution of the K-12 learning materials due to non-availability of appropriate materials to classroom construction in areas with acute shortage. Furthermore, PDO indicator targets were revised downward to align these with the adjustment in the associated BESRA targets (which was a reflection of the 2010 census data which showed a declining population). 19. On May 30, 2013, the Bank, at the request of the government, granted a third and final extension of the project closing date from May 31, 2013 to November 30, 2013 in order to complete construction of the remaining classrooms and LRMDCs and the procurement of school furniture and ICT equipment. 2. Key Factors Affecting Implementation and Outcomes 2.1 Project Preparation, Design and Quality at Entry 20. Project Preparation. In 2005, the Government of the Philippines and the Bank decided to support the BESRA with the NPSBE project which aimed to bring sector expenditures, policies and performance in line with the BESRA. This decision was based on an agreement with the government on the 2005-2010 sector investment program that was predicated on the medium-term expenditure framework and sector policy reforms necessary for the program to succeed. In addition, it was based on the Country Assistance Strategy (CAS) 2006-2008 that called for a graduated response to policy reforms that enabled public institutions to be more effective. The Bank preparation and appraisal of the NPSBE took place in March 2006 and became effective in January 2007. The SPHERE project preparation was based largely on work done by the NPSBE team, which consisted of technical experts that were appropriate for the development of the project. In
4 DepEd was responding to the President’s policy pronouncement and commitment in his State of the Nation address to plug the classroom shortage within the first few years of the new administration and the realization that there were existing structures, e.g. Regional Education Training Centers that could also serve as LRMDCs/learning resource hubs.
6
addition, the preparation team conducted a thorough financial management and procurement assessment of DepEd to determine if the financial management and procurement capacity and systems were in place for implementation of the SPHERE. It was determined that the project risks for financial management were substantial while procurement risk was average. In each case mitigation measures were identified. The Bank preparation team also worked with AusAID to ensure that the SPHERE project activities were in-line with the priorities of AusAID which at the time had a strong focus on teacher up-grading, SBM and school access at the primary level. In support of NPSBE and SPHERE, the DepEd held meetings and workshops with donors, other government agencies and civil society to build consensus around the BESRA. DepEd also created technical working groups (TWGs) to focus on the implementation of the BESRA which was supported by the SPHERE and NPSBE projects. The project preparation process was thoughtful, collaborative, and technically sound and to the extent possible, based on lessons learned from previous operations supported by both AusAID and the Bank. 21. Project Design. The SPHERE project design fit squarely into the government’s BESRA (2006-2010), MTPDP and the Bank’s 2006-2008 CAS. They shared the common objectives of fostering economic growth and social inclusion through improved governance, together with fiscal reform. Again, since the SPHERE project supported the BESRA which was also the same reform program supported by the NPSBE project, it benefitted from the fact that the NPSBE project underwent a thorough quality at entry (QER) process which took into consideration comments from the November 2005 project preparation review (PPR)5, which included the need to provide: (i) more details on the level of government commitment; (ii) clearer terms on the budget items to be financed; (iii) an enhanced economic and financial analysis; (iv) a more in-depth financial management and procurement assessment; and (v) a review of the National Government Accounting System (NGAS). The NPSBE preparation team also incorporated lessons learned from past sector investment loans (SILs), such as: (i) for SBM to promote school effectiveness, schools require adequate and appropriate resources; (ii) clear delineation of roles and responsibilities within a decentralized environment is critical to the success of a reform strategy; and (iii) participation of local stakeholders in school improvement planning and implementation is critical to achieve desired learning outcomes and to mobilize needed resources. These lessons were also relevant to the SPHERE project.
22. The project was designed with a three year implementation period that was to be implemented in parallel with the NPSBE project with the same project closing dates. The design included the appropriate activities to assist the government in reaching their reform agenda goals of: (i) continuous school improvement facilitated by active involvement of local stakeholders; (ii) better learning outcomes achieved by improved teacher standards; and (iii) desired learning outcomes enhanced by national curriculum strategies, multi-sector coordination, and quality assurance. The PDO which aimed to contribute to the achievement of the Philippines basic education goal of improving quality and equity in learning outcomes was appropriate since this was the objective of
5The PPR was the equivalent of a Quality at Entry Review as indicated in project preparation documentation.
7

the BESRA. As mentioned previously, the government requested that the Bank adopt a National Program Support approach, which entailed a shift from financing discrete, ring-fenced projects toward a program-based approach. Just like the NPSBE, the SPHERE project focused on core mandates, functions, and service delivery improvements. The request for adoption of BESRA outcome and most output indicators was justified by the government as setting the stage for improved multi-partner collaboration and achievement of BESRA goals. However, it also meant that direct attribution of interventions may not be able to demonstrate direct impact on development results. The importance of this design approach was that it supported the government’s reform efforts through a comprehensive approach and was seen as having a higher chance of success than a stand-alone operation. This outweighed the possibility of not being able to draw causal links between inputs and development outcomes. Therefore, key indicators included in the results framework were national in scope and derived from the BESRA and, as stated above, were appropriate given the SPHERE’s direct link to the BESRA. The project design also included intermediate indicators that measured implementation of the project components. It should be noted that although there exist slight differences in intermediate indicators listed in the grant agreement and the appraisal document, progress was tracked for the full set of indicators and are being used for the purposes of the ICR evaluation. Again, the PDO indicator targets were the BESRA targets, which were adopted by the preparation team at the request of DepEd since the project design was supportive of the BESRA. Section 2.3 provides more detailed information regarding the decision to select national indicators. 23. The NPSBE project supported the DepEd budget items of: (i) classroom construction; (ii) SBM grants; (iii) textbooks; (iv) training, which included teacher and capacity development training; (v) Maintenance and Other Operating Expenses (MOOE) support; (vi) school feeding; (vii) and hardship pay. The SPHERE project provided additional support for the DepEd budget items of: (i) classroom construction in Southern Philippines; (ii) SBM grants; and (iii) policy development to ensure that the BESRA reforms related to decentralization, improved governance, and enhanced effectiveness of government resources in basic education received adequate and sustained support. To support the implementation of SPHERE and NPSBE, it was decided to mainstream implementation within the DepEd units that were ultimately responsible for meeting the objectives of the BESRA at the central, regional, division offices and schools as mandated in the Governance of Basic Education Act (RA 9155). This structure was appropriate to ensure continued ownership of the SPHERE and NPSBE projects and the BESRA. The preparation team conducted an in-depth institutional capacity assessment at all levels, giving the team confidence that DepEd had built the foundations required to implement the BESRA reforms, including the subset of reforms contained in the SPHERE project. Although the assessment indicated there was a foundation to implement the project, in retrospect, a three year implementation period proved to be too short for the SPHERE project design especially given the procurement activities included in the design.
8
2.2 Implementation 24. Implementation began with workshop sessions for theme groups responsible for implementing particular reforms, as well as for officers responsible for handling procurement, financial management, disbursement and monitoring and evaluation. The DepEd continued the TWGs with the mandate that they would be responsible for the implementation of the reform agenda and the SPHERE and NPSBE activities. While there were capacity concerns, the implementing units, through their daily work, were able to ultimately implement most project activities. Where there was a need for support, technical assistance was provided as well as capacity training. 25. The SPHERE project was to be implemented over a three year period. During the first 12 months of project implementation, disbursements were low due to limited financial management capacity at the regional, division and school levels. By June 30, 2010 disbursements had increased from US$4.69 million to US$15.11 or approximately 40 percent of the total project which was due to the acceleration of implementation. During this 24 month period the SPHERE project: (i) completed 98 percent of original targets for classroom construction under the principal led school building program; (ii) procured furniture for schools; (iii) provided SBM grants to 80 percent of schools supported by SPHERE; (iv) trained 66 percent of SPHERE supported schools in the simplified accounting procedures related to the SBM financial management system; (iv) implemented school improvement plans (SIPs) related to SBM in SPHERE-supported schools; and (iv) conducted a full assessment of SBM implementation related to development of a SBM policy framework and standards, MOOE allocations, guidelines for utilization of SBM grants, etc. In addition, progress was being achieved with regard to the LRMDCs: (i) construction had begun on six LRMDCs; (ii) procurement and distribution of National Competency-Based Teacher Standards - Teachers’ Strengths and Needs Assessment (NCBTS-TSNA) and Individual Plan for Professional Development (IPPD) primers and toolkits were underway; and (iii) resource materials were being uploaded onto the LRMDCs. The February 2010 joint Bank/AusAID mid-term review agreed that support for the BESRA, through SPHERE and NPSBE, continued to be the most promising intervention to assist the government to: (i) achieve its educational goal for all Filipinos to be functionally literate and meet its international commitments under the MDGs for universal primary education; and (ii) meet the Education for All (EFA) targets (see Annex 2 for more implementation highlights). 26. Despite these achievements, project disbursements were lagging behind. The project had one year remaining with 60 percent left to disburse and there were several challenges impeding implementation progress. The February 2010 mid-term review and March 2010 SPHERE independent progress review conducted by AusAID showed that: (i) financial management capacity remained weak at all levels which led to problems with submission of statements of expenditures (SOEs) as well as liquidation of funds; (ii) two of the Special Allotment Release Orders (SARO6) that needed to be obtained from the
6 SARO is a document that allows the project to commit or enter into contracts
9
Department of Budget and Management were not released quickly enough which prevented DepEd from making payments to contractors and delayed procurement of ICT equipment for the LRMDCs; (iii) the hiring of an internal audit (IA) firm was delayed; (iv) classroom constructions was slowed with the shift from the principal led school building scheme (through shopping) to national competitive bidding (NCB)7; and (v) SPHERE and NPSBE indicator targets needed to be reassessed and revised in light of the 2010 census data which showed a decline in population growth over the period 2000-2010. These implementation challenges led to the government requests for the three closing date extensions from June 30, 2011 to November 30, 2013. 27. During the two year extension period, the Bank and DepEd worked on eliminating implementation bottlenecks, which led to: (i) hiring an internal audit firm which did an assessment of FM, provided technical assistance to DepEd and performed the project’s internal audit functions; (ii) notifying regions and divisions of the appropriate construction methods and holding workshops on procurement procedures so that classroom construction could be completed; (iii) increasing the DA threshold three times to US$6 million to address administrative delays in the government transfer of funds to the DA to ensure there was enough cash to accelerate implementation of project activities and pay contractors and suppliers on time; (iv) modification of PDO indicator targets to align them with the new BESRA targets; and (v) continuous support to DepEd to ensure that the SAROs were issued on time. Ultimately, 99 percent of total planned classrooms and toilets were completed8 and accepted by the stakeholders; LRMDCs were completed and ICT equipment installed; most of the procurement of furniture for classrooms and LRMDCs was completed and delivered; and project funds have been liquidated, resulting in a 93.42 percent disbursement rate (i.e., US$34.12 million disbursed). These figures are based on information provided by DepEd (in collaboration with the Bank’s disbursement department) on May 28, 2014 which are not yet reflected in ClientConnection. Given the 2010 implementation constraints, however, this disbursement rate is a considerable achievement. 28. It should also be noted that BESRA, with support from SPHERE and NPSBE, also introduced the National Competency Based Teacher Standards (NCBTS) and a teacher self-assessment tool, which informed teacher hiring guidelines and in-service training programs respectively. These standards were also incorporated into teacher support materials, teacher professional development, and the national assessment. The government also: (i) universalized kindergarten, making it officially part of the basic education cycle, hiring and training kindergarten teachers 9 and the development of a
7 DepEd discontinued use of the principal led school construction scheme for the SPHERE-financed classrooms from mid-2011 based on recommendations from the independent procurement assessment mobilized by AusAID. 8 1,150 classrooms and 1,068 toilets were completed compared to a planned total of 1,160 classrooms and 1,124 toilets. However, the project did meet its initial target of 507 classrooms, which were completed under batches 1 – 3. 9 During FY 2011 and 2012, approximately 8,000 new Kindergarten teachers were hired, 42,880 trained as part of the Kindergarten Volunteer program, 13,962 as part of the 2011 summer program and 633 as part of the 40-week Kindergarten curriculum program. 471 teachers received scholarships to attend the summer,
10
kindergarten curriculum; (ii) revised the entire basic education curriculum content and framework to accommodate the new Kindergarten to Grade 12 program (“K – 12”); (iii) expanded Alternative Delivery Modes (ADM) programs; (iv) revised the grades 1–10 learning competencies; (v) developed an assessment framework; and (vi) piloted mother-tongue based-multilingual education (MTB-MLE) in 20 national languages in 921 schools nationwide, and developed supporting materials for teaching and learning in the 12 main languages.10 (See Annex 2 for more highlights of implementation) 29. There were ten joint Bank and AusAID review and implementation support missions from September 2007 through November 2013. In addition, the in-country Bank team had regular monthly meetings with DepEd and during the last extension period, there were weekly meetings with the government to ensure completion of the project targets. The make-up of the Bank’s teams was well balanced with financial management, procurement, and monitoring and evaluation specialists present on missions, as well as other technical specialists11 whenever necessary. As mentioned above, out of the original AUD 39,451,025 (US$37,687,621 equivalent) 93.42 percent was disbursed by May 28, 2014. 2.3 Monitoring and Evaluation (M&E) Design, Implementation and Utilization 30. Design. As stated previously, the results framework was appropriate for the project design and reflected the goals of the BESRA. The indicators were linked to the PDO and were adequate to measure achievement of the PDO. Moreover, DepEd agreed that the Bank would take the leadership role among development partners to support the reform agenda by adopting the BESRA outcome indicators as part of the project design. The premise of the agreement was that by supporting a sector program, accountabilities for development results between DepEd and its development partners would be shared and a multi-partner collaboration (under the umbrella of government's leadership) would be fostered. It was acknowledged that it would be difficult to show direct attribution for specific project inputs using national level indicators. However, the benefits of supporting the government’s BESRA goals and adopting its indicators outweighed the possible difficulties of clearly linking interventions to outcomes. The Bank team was willing to demonstrate that everyone could work together to achieve desired results, which in this case, were reflected in the government's basic education indicators and targets. Subsequently, after the NPSBE became effective, AusAID also agreed to adopt the same government targets and indicators through the SPHERE project. This same approach has since been adopted by UNICEF and other local and international
Institute-Based training for kindergarten teachers, and there was a 20-day training program offered by state universities and colleges for the equivalent of a 9-unit Master’s degree course in Early Childhood and Development. Although not financed by SPHERE or NPSBE, the projects served as a catalyst for mobilizing additional support to develop and roll out these reforms and activities. 10 The 12 languages include Tagalog, Ilokano, Pangasinense, Kapampangan, Bikol, Cebuano, Hiligaynon, Waray, Maranao, Maguindanao, Yakan and Chavacano. 11 The missions included SBM specialists, teacher development experts, quality assurance practitioners, and data management experts when appropriate for review of project activities.
11
development partners. The positive outcome generated by the multi-partner collaboration to support one set of targets and indicators through various interventions is reflected by the increasing trend in performance of the higher order education outcome indicators over the life of the project. 31. The targets for the PDO indicators were projections based on the 2000 census. The intermediate indicators were linked to the components and were appropriate to measure intermediate level achievements. The design also included collection of data using the web-based Enhanced Basic Education Information System (e-BEIS) to enable performance reporting in real-time as well as to inform planning, resource allocation, and performance reporting; and the Quality Assurance and Accountability Framework (QAAF) to lay the foundation for redefining school input standards, including textbooks, school infrastructure, teacher training materials, etc. 32. Implementation and Utilization of Monitoring and Evaluation. The roll out of the e-BEIS nationwide has allowed central offices to upload school data they received onto the government’s website, allowing schools to access the information directly or for divisions to download and share information with their respective schools. This has had the intended impact of being able to provide real-time information at all levels of the education system. In 2010, the government adopted the QAAF, along with the roll-out of the Philippines Accreditation System for Basic Education (PASBE). PASBE is a unified schools standards assessment tool that is applicable to both elementary and high schools, and facilitates measuring their level of compliance with service standards. The QAAF and PASBE laid the foundation for re-defining school input standards, and all schools are now using these standards. DepEd, with support from AusAID, developed a learner information system (LIS) that includes a learner reference number for each student irrespective of whether enrolled in the formal or non-formal education system. This system currently holds information on approximately 20 million learners and is providing DepEd with valuable information on each learner, allowing for informed planning and budgeting decision making. Under the BESRA as a whole, the M&E system includes: (i) a learning resources materials development system that is being used to upload learning materials; (ii) an asset management system, which is operational at the central level and will be expanded down to the regional and division levels; (iii) a Training and Development Information System (TDIS) being piloted in Regions 6, 7 and 8 and which includes an inventory of training, research and development activities conducted at the regional levels; (iv) the ongoing development of a project monitoring system being developed under the Philippines’ Response to Indigenous Peoples’ and Muslim Education (PRIME) program, which created a system of providing demand-driven grants to respond to indigenous people (IP) education needs; and (v) the ongoing development of a human resources information system, which has been put on hold pending the government’s plan to roll out a government human resources information system (GMIS). 33. The DepEd provided Bank missions with data and information that allowed the teams to make judgments on progress toward achieving the PDO and the project’s implementation progress. This information was regularly reported on by the Bank in aides-memoire and ISRs. As mentioned, the targets for the PDO level indicators were
12
adjusted in 2012 and are being used to measure project achievement. The intermediate indicators were also monitored and reported on over the life of the project. 2.4 Safeguard and Fiduciary Compliance 34. Safeguards. The environmental rating of the project was “C” based on the fact that no environmental risks were foreseen and construction would comply with national environmental laws for environmental impacts. Therefore, OP 4.01 Environmental Assessment was not triggered and no environmental assessment tools were developed as part of the project. The project did, however, conduct a review of the environmental safeguards at the time of project closing, which concluded that there was compliance with local regulations. There were minor issues pertaining to two school building locations that required DepEd to undertake remedial actions to safeguard the structures 12 from harming those using the schools. DepEd is in the process of addressing these issues. 35. The project did trigger OP 4.20 on Indigenous Peoples (IP) because the reform agenda was to address both quality and equity especially for the poor and disadvantaged groups, including indigenous peoples. The project was satisfactorily carried out in accordance with the Indigenous Peoples Planning Framework – IPPF and the government’s Philippines Indigenous People’s Rights Act – IPRA. Although encountering initial delays, the government approved and disseminated the National Indigenous Peoples Education Policy Framework in August 2011. The framework is to ensure that IP’s basic education concerns and needs are taken into consideration as part of BESRA implementation. DepEd supported several activities related to the promotion of indigenous peoples education, which were: (i) piloting MTB-MLE in 20 languages; (ii) disseminating the National Indigenous People’s Education Policy Framework; (iii) issuing guidelines on the use of PRIME grants, which created a system of providing demand-driven funding to respond to IP education needs; (iv) creating an indigenous peoples education office (IPsEO); and (v) with AusAID support, conducting a baseline survey on the educational situation in IP and Muslim households in PRIME priority divisions and regions. The other IP activities included: (i) review of standards for the recognition and accreditation of private schools for IPs; (ii) development of a national curriculum framework on IP education for kindergarten, elementary and high school levels; (iii) guidelines and standards for the development of indigenous learning materials; and (iv) an IP education training plan for teacher and education managers. School visits have shown that interventions through the school SIPs to support IP students are designed but are often separate rather than an integral part of the plans. The next steps are to fully integrate them into the SIPs. Safeguards compliance is therefore rated satisfactory.
12 Remedial actions proposed included: (i) appropriate reinforcement of the structure to prevent ground settlement from water intrusion into the foundation, a risk associated with construction in sloping areas; and (ii) slope-protection (i.e. retaining wall) for the Department of Public Works and Housing (DPWH)-led (i.e., not SPHERE supported) building to prevent run off of silt/soil into the building in the event of heavy rains.
13
36. Financial management. As discussed previously, the project was designed to use the government accounting system. In October 2001, the Commission on Audit (COA) introduced the new government accounting system (NGAS) that followed international public sector accounting procedures. The bookkeeping segment of NGAS was computerized and was referred to as eNGAS. This was viewed to be a milestone in terms of the government’s accounting procedures and processes. While the system was viewed as a significant step forward, its implementation proved to be problematic for project activities and financial management (FM) performance. The FM challenges were: (i) establishment of an Internal Audit Service (IAS), which only became fully operational in early 2011; (ii) DepEd central, regional and division offices had to be adequately staffed and trained to carry out the high volume of FM transactions, which took time; and (iii) the eventual roll-out of the eNGAS after it was suspended in December 2008 in an effort to harmonize the general accounting standards of The Philippines with the international public sector accounting standards. This led DepEd to consider developing its own web-based financial management information system (FMIS), which is being finalized with AusAID support. Since all the computerized systems were either put on hold or are still being finalized, the project FM activities were carried out manually. 37. Manual accounting for the central office staff was a challenge because they were understaffed for such a large task. Given the large volume of financial transactions, weak capacity and inadequate staff, the central office was unable to cope with the work load. This led to: (i) delays in meeting grant covenants (i.e., timely submission of financial reports, SBM validation reports or supporting documentation for auditing purposes); (ii) timely liquidation of cash advances; (iii) unreconciled “Property, Plant and Equipment” accounts; and (iv) subsidy account discrepancies amounting to PhP 6.7 million in CY2012. In addition, COA re-instituted a selective pre-audit of cash advances and school construction expenditures in 2009, which added to the transaction processing delays. Although the IAS has been established and is functioning, its staffing level is limited to 17 staff per Department of Budget and Management (DBM) circular 2008-5, even though that staffing number may not be sufficient to effectively handle the workload. 38. Despite these difficulties and a slow start, DepEd was able to: (i) significantly increase disbursement levels from 65 percent in September 2012 to 93.42 percent by May 2014, (ii) encode at least 90 percent of the 2004 – 2010 financial transactions in eNGAS once COA lifted its suspension in 2011 (remaining 10 percent relate to transactions at the Bureaus); (iii) partially mitigate the staffing issue by using FM staff from the division offices to assist with FM responsibilities; (iv) by 2013, significantly improve its compliance with time-bound financial statement submissions, 13 submitting all outstanding audit reports and school grant validation reports; and (v) reduce the outstanding cash advances from PhP 2.2 million in June 2013 to Php 57,445 in December 2013, mainly due to a strong stance taken by DepEd withholding salaries of central and division officers with outstanding cash advances. As of May 28, 2014, the outstanding cash advances amounted to PhP 21,283, which represents unliquidated cash advances of resigned and deceased employees. These unliquidated advances are already included in
13 Starting with the 2011 Q2 submission, all subsequent IFRs were received by the Bank on time.
14
the unutilized balance in the designated account being refunded to the Bank. DepEd is also working on the reconciliation of their “Property, Plant and Equipment” accounts, with initial reports having been submitted to COA on December 9, 2013. Efforts on DepEd’s part to address COA’s comments on the 2007 Agency financial statements led the COA to modify its opinion from “adverse” to “qualified” in 2010. Furthermore, DepEd was able to either fully or partially implement all outstanding 2007 COA recommendations by project closing. Unfortunately, the COA recommendation on FM staffing, which might have helped avoid some of the issues encountered by DepEd, could not be fully implemented. However, DepEd was proactive in rectifying a mistake it discovered when reviewing sub-ARO releases in three divisions, where the same project recipients received their allocation twice. This was efficiently resolved in close collaboration with the FMS-Budget Division. 39. The project also faced challenges due to delays in SARO releases, in that the FY11 SARO was only released in October 2011, eight months after the original target date. Given that SARO allowed the project to commit or enter into contracts, the delay in its release meant that DepEd could not start contracting until the SARO had been released. While this is beyond the control of the project, it nevertheless hampered timely implementation, especially of classroom construction. Bank management and the task team held several meetings with the concerned government oversight agencies 14 to remove bottlenecks as SARO release delays were a portfolio-wide issue. Since DepEd could not enter into contracts without the release of the SARO, cash flow was limited and replenishment of the DA delayed. An additional complication was that there was a DBM circular, stating that the amount that can be committed for disbursement and the maximum SARO amount that can be released was only up to the amount allocated for the Designated Account (DA). While the disbursements under the project in the early years were usually below the US$1 million DA ceiling, the bunching of activities as a result of the delay in the release of the previous SAROs necessitated larger SARO amounts. To overcome these constraints, the Bank team worked with DepEd to increase the DA ceiling three times from the original US$1 million to US$6 million by project closing15. Lastly, it should be noted that the grant was the first AusAID-financed project to use country systems, and was therefore a new approach for AusAID compared to their previous project funding experience. This learning experience resulted in the need to occasionally discuss and reconfirm with government and donor partners their respective functions in relation to this new implementation approach. However, this need for clarification also contributed to some of the previously-mentioned delays. Nevertheless, the project disbursed 93.42 percent with only 6.58 percent undisbursed mainly due to a combination of non-construction of classrooms and toilets, 16 and non-procurement of LRMDC-specific software for the DepEd central office and some school furniture.
14 i.e., Department of Finance, Department of Budget and Management, the treasury etc. 15 The DA ceiling increases were processed on June 16, 2009, January 29, 2010 and December 9, 2011. The DA was drawn down starting in 2011 due to the June 30, 2011 closing date but was replenished and its ceiling increased on December 9, 2011 after that original closing date was extended. 16 These include classrooms destroyed by the 2012 earthquake in Region VII. Other regions where classrooms were not completed in time are Regions, VI, VIII, IX, XI and CARAGA.
15
40. Procurement. Procurement performance also improved during the last six months of project implementation. As mentioned in Annex 2, the project was able to successfully procure supplementary teaching and learning materials, as well as primers and tool kits to support divisions in the roll out of the NCBTS. The project also helped organize and conduct workshops and trainings on various topics, including the new K-12 curriculum, mother-tongue based instruction, and the use of the learning management resource system, benefitting almost 24,000 DepEd staff at the central, division and school levels. This is an impressive coordinated effort. The project also successfully constructed 32 LRMDCs, of which one was destroyed as a result of the 2013 typhoon “Yolanda”, and procured the associated furniture and Information and Communication Technology (ICT) equipment. In addition, the project constructed 1,150 new classrooms, and built 1,068 toilets. Although missing the final planned numbers of classrooms and toilets by 10 and 56 respectively, the project did meet its initial target of building 507 classrooms under batches 1-3. However, these successes were not without their challenges: (i) LRMDC construction was delayed due to staffing constraints within the DepEd units in charge of monitoring civil works, and delays in approving the “Program of Works” necessary for contract award; (ii) changes to the classroom construction approach, 17 which also required the re-orientation of divisions in January 2013 on the use of harmonized 18 procurement guidelines; (iii) delays in procuring ICT equipment/software and office furniture for the LRMDCs due to lengthy equipment specification discussions and slow follow up by division offices after initial bids failed to attract sufficient responsive bidders; and (iii) delays in SARO release. These delays resulted in a cumulative extension period of one year. 2.5 Post-completion Operation/Next Phase 41. A new lending operation and a series of analytical works are currently under way. The Learning, Equity, and Accountability Program Support (LEAPS) project provides a US$300 million loan to continue supporting the gains made under BESRA, SPHERE and NPSBE. LEAPS aims to: (i) improve teaching and learning in early grade reading and math through teacher capacity building, and develop and use mother-tongue based reading and math assessment tools; (ii) strengthen accountability, which is a major part of the SBM approach, especially at the school level while also strengthening DepEd’s financial management capacity; and (iii) improve program designs targeting disadvantaged groups by expanding the knowledge base on selected programs targeting disadvantaged groups, such as the Alternative Learning System (ALS), and improve program design and implementation capabilities. Furthermore, LEAPS will be disbursed based on the achievement of disbursement-linked indicators, and incurring of eligible
17 This change in approach also led to confusion at the decentralized levels regarding the procurement documents to be used and steps to be followed, so that a number of classrooms having been completed were found to have used non-Bank approved documents. The Bank therefore conducted a retroactive assessment and determined that the overall principles of fair and open competition were followed and agreed to cover the cost of these classrooms. 18 “Harmonized procurement” refers to use of country systems and local bidding documents that have been reviewed and approved by the Bank for the procurement of goods and works with project funds.
16
expenditures using the Reimbursement disbursement method, documented by th Interim Financial Reports (the report-based documentation method), which will reduce the number of required financial transactions and documentation, helping with project implementation. 42. A proposed series of analytical works will support the CAS objective of improving access to quality education services. The analysis will be centered around the following strategic pillars: (i) Efficiency and Equity of Education Finance and School Funding, analyzing DepEd’s education finance policies for more equitable and better quality of service delivery; (ii) Quality of Service Delivery Analysis, which aims to take a comprehensive look at the determinants of effective education service delivery; (iii) School to Work Transition: Skills Demand and Supply in order to shed light on skills gaps/mismatches as well as the strengths and weaknesses of the basic education system; and (iv) Basic Education Reforms Dissemination and Communication. The results of these pieces of analysis are expected to provide DepEd with valuable information and facilitate their efforts to sustain and expand the BESRA goals. 3. Assessment of Outcomes 3.1 Relevance of Objectives, Design and Implementation 43. Relevance of Objectives. The project development objectives were highly relevant to the country’s sectoral needs when the project was developed. The objectives fit squarely into the government’s BESRA, MTPDP and the Bank’s 2006-2008 CAS. They shared the common objectives of fostering economic growth and promoting social cohesion. Like the 2006-08 CAS, the new CAS (2010-2012) also focuses achieving more inclusive growth by supporting The Philippines increase access to better public services for the poor. This is to be achieved by deepening the reform agendas in key public services sectors and expanding basic service delivery directly to the poor. Therefore, the project and BESRA continued to fit into the 2010-2012 CAS objectives. There is a new Country Partnership Strategy (CPS) currently under preparation that is expected to continue the focus on supporting the Philippines reform agendas in key public services sectors. In addition, it is expected that the government will continue its education reform agenda through the BESRA. 44. Relevance of Design. The relevance of the project design is high. The project was appropriately aligned with the BESRA PDO and PDO indicators, and it included appropriate activities to assist the government in reaching their reform agenda goals. The mainstreaming of project implementation was also appropriate to foster improved capacity within the system and decentralization of education services. The project risks were correctly identified and mitigation measures were appropriate given the government systems in place at the time of design. While the PDO level indicators were appropriate, the three year implementation period was too short to implement large civil works activities as well as to hire the necessary technical assistance to support new policy reforms of the BESRA within DepEd. To fully realize the completion of project
17

activities, it required three project closing date extensions, which was appropriate given the overall nature of the reform elements of the project and the extensive civil works. 45. Relevance of Implementation. The relevance of project implementation is judged to be modest. As indicated above, implementation of the majority of project activities was successful: (i) SBM has been institutionalized, system-wide monitoring systems are in place and will continue to be expanded; (ii) NCBTS and MOOE allocations have been institutionalized; (iii) classrooms and LRMDCs were constructed; and (iv) a substantial number of experts were hired to provide technical assistance for the implementation of DepEd policy reforms. The modest rating is mainly based on the persistent FM and procurement implementation issues that slowed implementation. While the project was able to disburse 93.42 percent of funds, and complete the majority of the project activities, the LMRDCs are just now providing the support to teachers as envisioned by the project, and some of the equipment is still in the process of being installed with government resources. In addition, DepEd still has to produce required FM documentation and reports manually. 3.2 Achievement of Project Development Objectives 46. The overall achievement of the project development objectives is moderately satisfactory. The project contributed to a number of positive outcomes for the Philippines education system. As indicated, the targets were revised downward during the December 2012 restructuring. Therefore, this section evaluates the outcomes against the results based on the new targets. The project development objective was to support the implementation of the BESRA, which in turn aimed to contribute to the achievement of the Philippines' basic education goal of improving quality and equity in learning outcomes. The PDO level indicators selected to monitor achievement of the PDO were as follows: 47. Elementary participation. The participation rate for 6-11 year olds increased from the baseline of 84.44 percent in 2004/05 to 95.24 in 2012/13 percent exceeding the revised target of 92.09 percent. The overall enrollment numbers have also increased from 13 million to 14.4 million from 2003/04 to 2011/12. These are both substantial increases for the system. Although the 2010 census reports a decline in population growth over the period 2000-2010, the increase in enrollments seems to be attributed to the fact that more children of elementary school age are going to school even though population growth has declined. Enrollment increases have also been larger for the poorest households. For example, between 2004 and 2011, attendance rates for 6 to 11 year old children increased by 7.5 percentage points for the poorest 10 percent of households compared to a less than 1 percentage point increase for children in the wealthiest 30 percent of households (Reyes, Tabuga, Mina and Asis, 2013). Increases in enrollment may be attributed to: (i) improvements in the alternative delivery modes, which allow children (particularly boys) to participate even though they have to work; and (ii) the conditional cash transfer (CCT) program that provides resources directly to poor households to enable their children to attend school and avail of health services. During project implementation, the CCT program covered children ages 6-14. Cohort survival rate increased from 69.9 percent in 2005 to 75.27 percent in 2012/13, missing the revised target of 78.51 percent. Although
18
the cohort survival rates did not meet the targets, the rates did improve, which implies that the system has been able to sustain a level of quality even under such rapid expansion. Completion rates increased from 67.99 percent in 2004/05 to 73.67 percent in 2012/13, missing the revised target of 76.61 percent. Again, although the completion rates did not meet the targets, improvements over time implies that the system has been able to sustain a level of quality even under rapid expansion.19 This is a substantial achievement. The dropout rate has declined from 8.9 percent in 2003/04 to 6.38 percent in 2011/12. While this is an appropriate trend, the original target of 4.3 percent was missed. It should also be noted that in 2013, DepEd decided that they would no longer measure dropout. Instead, DepEd now measures school leavers and therefore, there is no available data for dropout beyond the 2011/12 school year. 48. High school participation. The participation rate for 12-15 year olds increased from the baseline of 58.54 percent in 2004/05 to 64.61 percent in 2012/13, missing the revised target of 70.79 percent. The overall enrollment numbers for high school have increased from 6.3 million to 7 million between 2003/04 and 2011/12. While these numbers do not mirror the increases in elementary enrollments, there have been some improvements in equity in school attendance between poor and wealthy households. For example, between 2007 and 2011, school attendance among 12-14 (15-18) year olds increased by 5.5 (5.1) percentage points for the poorest 10 percent of households compared to only 1.1 (0.6) percentage points for the wealthiest 10 percent of households (Reyes, Tabuga, Mina and Asis, 2013). However, gaps between older children aged between 15 and 18 widened slightly over the same period. The government continues to develop policies to try and improve the enrollment numbers. Recently, the government extended the CCT program coverage to children up to age 18. This policy change was made in an effort to provide over-aged children entering the system with the means to continue their education through high school as well as to respond to the additional years of schooling in high school as a result of the implementation of the K-12 program. Cohort survival rate increased from 67.32 percent in 2004/2005 to 78.21 percent in 2012/13, slightly missing the revised target of 80.27 percent. Completion rate increased from 61.66 percent in 2004/05 to 74.81 percent in 2012/13 meeting the revised target of 74.51 percent. Drop-out decreased from 14.3 percent in 2003/04 to 7.82 percent in 2011/12. Again, this trend is positive but as stated above, this indicator is no longer being collected or monitored by DepEd. 49. Quality and efficiency. The measure of quality at the elementary level was measured based on the Grade 6 achievement test for mathematics, Filipino, English and science, for both elementary and high school.
19 The completion rate in The Philippines is measured by the percentage of first year entrants in a level of education who complete the level in accordance with the required number of years. However, the completion rate formula being used by the Bank and UNESCO, which measures the grade/year level of all completers, shows that elementary completion rates have already reached 91 percent at the elementary level. The achievement of this indicator is attributed to the improvements in the delivery system and the increase in the demand-side interventions to improve participation of children from poor households.
19
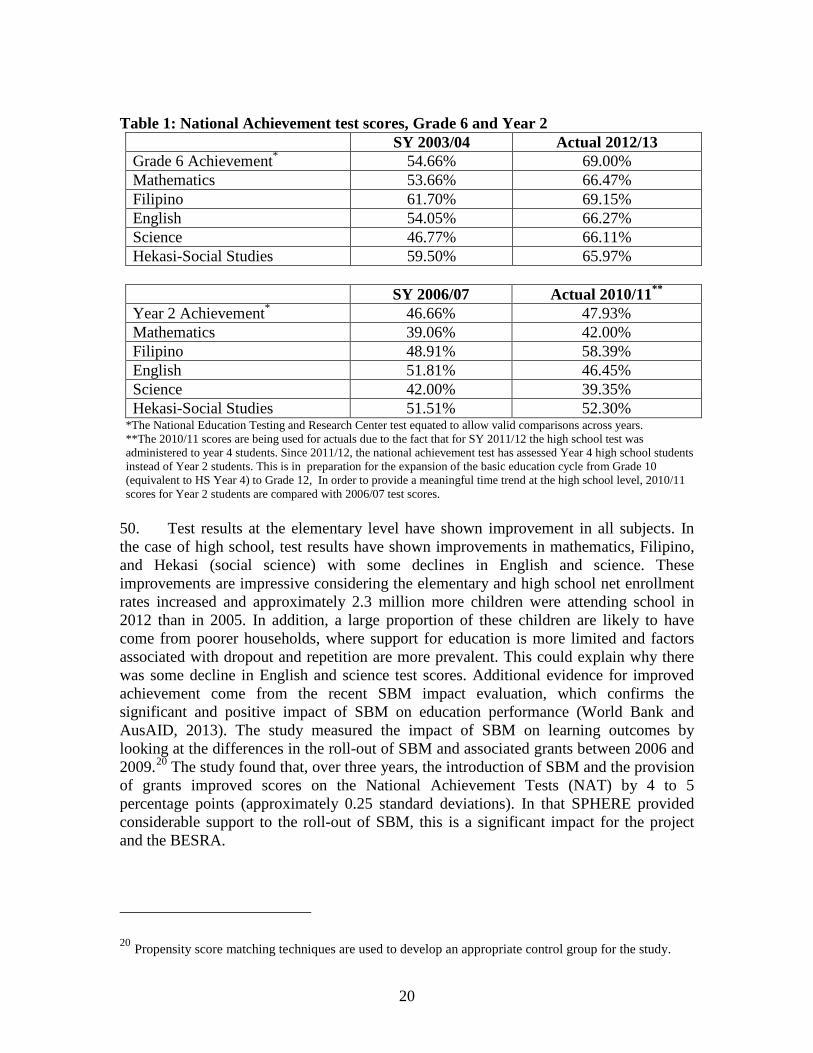
Table 1: National Achievement test scores, Grade 6 and Year 2
SY 2003/04 Actual 2012/13 Grade 6 Achievement* 54.66% 69.00% Mathematics 53.66% 66.47% Filipino 61.70% 69.15% English 54.05% 66.27% Science 46.77% 66.11% Hekasi-Social Studies 59.50% 65.97%
SY 2006/07 Actual 2010/11**
Year 2 Achievement* 46.66% 47.93% Mathematics 39.06% 42.00% Filipino 48.91% 58.39% English 51.81% 46.45% Science 42.00% 39.35% Hekasi-Social Studies 51.51% 52.30%
*The National Education Testing and Research Center test equated to allow valid comparisons across years. **The 2010/11 scores are being used for actuals due to the fact that for SY 2011/12 the high school test was administered to year 4 students. Since 2011/12, the national achievement test has assessed Year 4 high school students instead of Year 2 students. This is in preparation for the expansion of the basic education cycle from Grade 10 (equivalent to HS Year 4) to Grade 12, In order to provide a meaningful time trend at the high school level, 2010/11 scores for Year 2 students are compared with 2006/07 test scores.
50. Test results at the elementary level have shown improvement in all subjects. In the case of high school, test results have shown improvements in mathematics, Filipino, and Hekasi (social science) with some declines in English and science. These improvements are impressive considering the elementary and high school net enrollment rates increased and approximately 2.3 million more children were attending school in 2012 than in 2005. In addition, a large proportion of these children are likely to have come from poorer households, where support for education is more limited and factors associated with dropout and repetition are more prevalent. This could explain why there was some decline in English and science test scores. Additional evidence for improved achievement come from the recent SBM impact evaluation, which confirms the significant and positive impact of SBM on education performance (World Bank and AusAID, 2013). The study measured the impact of SBM on learning outcomes by looking at the differences in the roll-out of SBM and associated grants between 2006 and 2009.20 The study found that, over three years, the introduction of SBM and the provision of grants improved scores on the National Achievement Tests (NAT) by 4 to 5 percentage points (approximately 0.25 standard deviations). In that SPHERE provided considerable support to the roll-out of SBM, this is a significant impact for the project and the BESRA.
20 Propensity score matching techniques are used to develop an appropriate control group for the study.
20

3.3 Efficiency 51. The reform program introduced in 2006 was underpinned by significant increased public education spending. Prior to the introduction of BESRA in 2006, public education spending had been on a downward trend. In real terms, overall spending on education declined from PHP 155 billion in 2003 to PHP 140 billion in 2005 (constant 2011 prices). Over the same period, per student spending at the basic education level also fell by 10 percent in real terms (from PHP 7,998 (US$185) to PHP 7,285 (US$168)). However, in 2006, significant increases in public education investment began to reverse these declines. Between 2005 and 2013, public education spending almost tripled in real terms while spending per basic education student increased by around two-thirds. This increased investment had some positive effects on education outcomes: elementary and high school net enrollment rates increased and approximately 2.3 million more children were attending school in 2012 than in 2005. 52. SPHERE encouraged increased investment in areas that were important to the success of the reform agenda (e.g. the rolling out of school based management reforms, classroom construction and the strengthening of a learning resources and management development system). As intended, areas of the education budget supported to which SPHERE contributed (e.g. school construction and school based management grants) showed significant increases over the implementation period. For example, school construction spending increased fourfold between 2005 and 2012. Impact evaluation results reported in Annex 3 show that support provided to school-based management (e.g. SBM grants) raised learning outcomes significantly in a cost-effective way. Evidence also shows some improvement in internal efficiency indicators: information on reduction in the number of surplus teachers suggests that the efficiency of the education system is likely to have improved. School construction costs under the project were initially comparable with other government-led programs although the shift from the principal-led scheme to competitive bidding (National Competitive Bidding) during the project increased costs. 53. During SPHERE, there was a significant shift in project resources away from Component 1 and towards classroom construction (Component3). This was in response to the President’s policy pronouncement to immediately address the classroom shortage. While it is not possible to quantify the efficiency changes associated with this shift, evidence suggests that increased investment in classroom construction is likely to have improved learning. It is also important to remember that SPHERE was one source of support of the overall BESRA reform program. This means that investments in other areas continued to come in through programs, projects and other activities of several local and international development partners supporting the reform program. Based on the overall efficiency analysis in Annex 3, project efficiency is rated substantial.
21
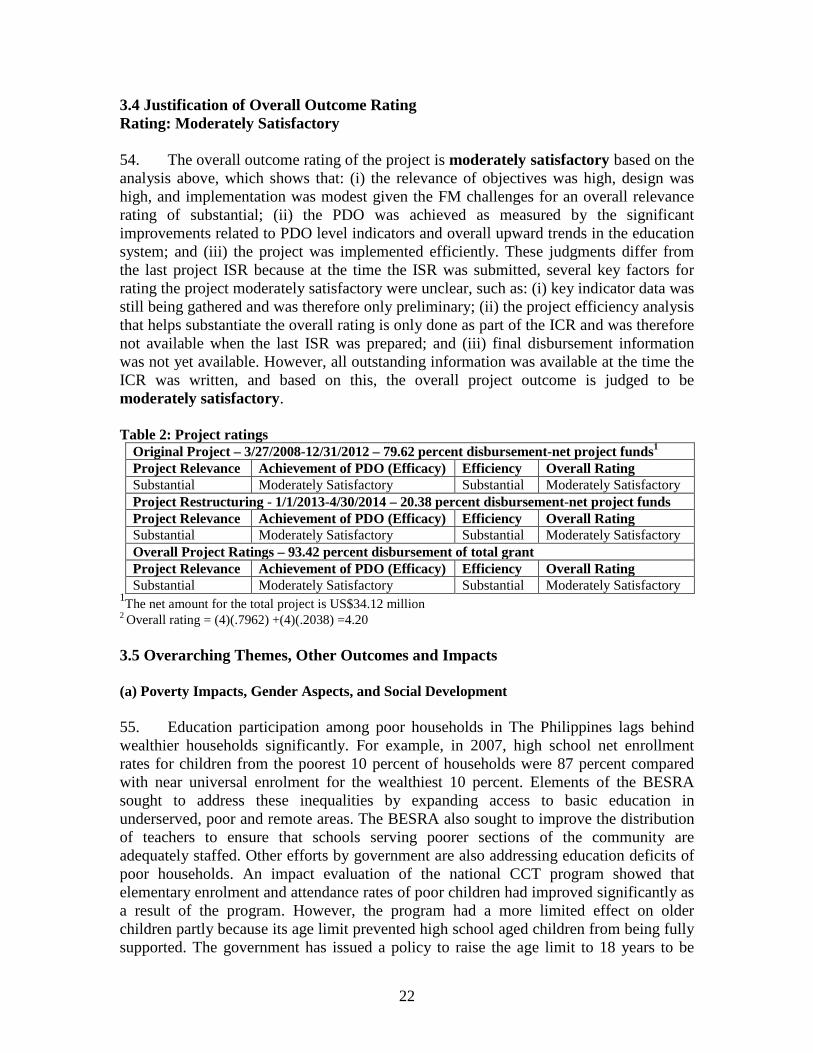
3.4 Justification of Overall Outcome Rating Rating: Moderately Satisfactory 54. The overall outcome rating of the project is moderately satisfactory based on the analysis above, which shows that: (i) the relevance of objectives was high, design was high, and implementation was modest given the FM challenges for an overall relevance rating of substantial; (ii) the PDO was achieved as measured by the significant improvements related to PDO level indicators and overall upward trends in the education system; and (iii) the project was implemented efficiently. These judgments differ from the last project ISR because at the time the ISR was submitted, several key factors for rating the project moderately satisfactory were unclear, such as: (i) key indicator data was still being gathered and was therefore only preliminary; (ii) the project efficiency analysis that helps substantiate the overall rating is only done as part of the ICR and was therefore not available when the last ISR was prepared; and (iii) final disbursement information was not yet available. However, all outstanding information was available at the time the ICR was written, and based on this, the overall project outcome is judged to be moderately satisfactory. Table 2: Project ratings
Original Project – 3/27/2008-12/31/2012 – 79.62 percent disbursement-net project funds1
Project Relevance Achievement of PDO (Efficacy) Efficiency Overall Rating Substantial Moderately Satisfactory Substantial Moderately Satisfactory
Project Restructuring - 1/1/2013-4/30/2014 – 20.38 percent disbursement-net project funds Project Relevance Achievement of PDO (Efficacy) Efficiency Overall Rating Substantial Moderately Satisfactory Substantial Moderately Satisfactory Overall Project Ratings – 93.42 percent disbursement of total grant Project Relevance Achievement of PDO (Efficacy) Efficiency Overall Rating Substantial Moderately Satisfactory Substantial Moderately Satisfactory
1The net amount for the total project is US$34.12 million 2 Overall rating = (4)(.7962) +(4)(.2038) =4.20 3.5 Overarching Themes, Other Outcomes and Impacts (a) Poverty Impacts, Gender Aspects, and Social Development 55. Education participation among poor households in The Philippines lags behind wealthier households significantly. For example, in 2007, high school net enrollment rates for children from the poorest 10 percent of households were 87 percent compared with near universal enrolment for the wealthiest 10 percent. Elements of the BESRA sought to address these inequalities by expanding access to basic education in underserved, poor and remote areas. The BESRA also sought to improve the distribution of teachers to ensure that schools serving poorer sections of the community are adequately staffed. Other efforts by government are also addressing education deficits of poor households. An impact evaluation of the national CCT program showed that elementary enrolment and attendance rates of poor children had improved significantly as a result of the program. However, the program had a more limited effect on older children partly because its age limit prevented high school aged children from being fully supported. The government has issued a policy to raise the age limit to 18 years to be
22

eligible for CCT grants to ensure a better fit with high school enrollment patterns. The overall outcome of these efforts has been a more rapid improvement in school attendance for the poorest. For example, between 2004 and 2011, attendance rates for 6 to 11 year old children increased by 7.5 percentage points for the poorest 10 percent of households compared to a less than 1 percentage point increase for children in the wealthiest 30 percent of households (Reyes, Tabuga, Mina and Asis, 2013). 56. As mentioned, an impact evaluation found that, over three years, the introduction of SBM and the provision of grants had a large impact on student learning. For example, the study showed that mathematics scores on the NAT increased by 4 to 5 percentage points (approximately 0.25 standard deviations)21. A separate analysis also showed that improvements in education quality (brought about through school based management and associated interventions) had significant pay-offs for women relative to men in terms of increased educational attainment, a greater chance of migration and higher earnings.22 Both SPHERE and NPSBE had a positive impact with their support for the institutionalization of SBM. (b) Institutional Change/Strengthening 57. The institutional changes have all been discussed within the document. (c) Other Unintended Outcomes and Impacts (positive or negative) Not applicable. 3.6 Summary of Findings of Beneficiary Survey and/or Stakeholder Workshops Not applicable.
4. Assessment of Risk to Development Outcome Rating: Moderate 58. There were seven issues identified as risks during project preparation with an overall rating of moderate. The ratings primarily were related to the reform process sustainability and commitment; capacity constraints in a decentralized environment and financial management. These risks remain pertinent. Positive developments to mitigate these risks include the following: (i) DepEd with support from various stakeholders was able to strengthen capacity, improve overall school-based management and institutionalize a decentralized system; (ii) government commitment has remained strong
21 Yamauchi, F. (2014). “An alternative estimate of school-based management impacts on students’ achievements: evidence from the Philippines.” Journal of Development Effectiveness 22 Yamauchi, F. and Y. Liu (2012). School Quality, Labor Markets and Human Capital Investment: Long-term Impacts of an Early Stage Education Intervention in the Philippines. Policy Research Working Paper Series Number 6247.
23
as evidenced by continued improvements to and expansion of the BESRA as well as increased budget allocations for basic education in support of the reforms; (iii) significant increases within the education budget for existing programs such as the MOOE, which are critical for supporting SBM and improved school functioning; and (iv) stakeholder, donor and private-sector participation in support of the BESRA continues, which is a clear indication of their support to the reform agenda. Financial management performance remains a challenge. While the government has initiated the development of the “Government Integrated Financial Management Information System”, capacity at the local level remains a challenge making it difficult to complete the liquidation of funds and delays are still encountered in terms of financial management reporting. The government remains committed to continuing the BESRA reforms through the consolidation of lessons learned and expansion of the system with the K to12 program. The Bank continues to support the BESRA, at the request of the government, through the LEAPS project, which builds on the successes of SPHERE and NPSBE by providing resources to further support the government’s efforts to improve reading and math skills with a focus on disadvantaged groups. The main risk for future operations remains the financial management system. While the government has made progress by re-instituting the eNGAS, the institutionalization of the program will take time. To mitigate the risk, the project will reimburse based on achievement of DLIs and not SOEs. Based on these factors, the risk to the development outcome is rated moderate. 5. Assessment of Bank and Borrower Performance 5.1 Bank Performance (a) Bank Performance in Ensuring Quality at Entry Rating: Moderately Satisfactory 59. The project preparation team ensured that the project design was closely aligned with the BESRA (2006-2010), MTPDP and the Bank’s 2006-2008 CAS. Project preparation started with a pre-identification mission in February 2005, followed by two additional missions prior to the project’s effectiveness in June 2006. During preparation, the Bank team also used a “Policy and Human Resources Development – PHRD” grant to conduct studies to inform project design which included: (i) a review of the SBM framework implemented in earlier projects, (ii) an assessment of FM, and (iii) a review of teacher competency standards. The PHRD grant was also used to inform the BESRA by supporting several analytical pieces including: (i) a Medium Term Spending Plan; (ii) four Education Policy Notes on improving quality, improving teacher development, SBM, and improving equity; and (iii) a retrospective on education reform – which looked at why education reforms failed in the past and which BESRA eventually incorporated as lessons learned. The design team organized a series of workshops for and with the government (including DepEd, DBM, National Economic and Development Authority – NEDA, and Department of Finance) to formulate the BESRA. Once BESRA was finalized, the NPSBE and subsequently SPHERE components were then selected based on the BESRA Key Reform thrusts, aligning the project with the BESRA components. The Bank team included the appropriate technical specialists to develop the project. The team also actively engaged the Technical Coordinating Team of DepED through
24

workshops and discussions on the design, content, and implementation arrangements of the project. Consultations were held with oversight agencies of the government as well as other donors, who expressed interest in re-aligning their projects with the BESRA and explore opportunities for co-financing and technical assistance. The development objectives, monitoring indicators and line items to be financed by the project were also discussed and agreed upon, and were in line with the overarching objectives of the BESRA. The Bank, working with the government, incorporated mainstreaming of project implementation into the daily responsibilities of DepEd’s central, regional and division staff. The project underwent a thorough QER process and the project team included the recommendations. The results framework was aligned with the BESRA but the initial targets established were too ambitious. (b) Quality of Supervision Rating: Satisfactory 60. As previously mentioned, there were ten Bank review and implementation support missions from the September 2007 through August 2013, with a final BESRA review mission in August 2013. The project team was actively engaged in supporting the government in its efforts to implement the project. The country-based team included the appropriate technical experts, and missions always included fiduciary and safeguards staff, as well as civil works, data management, teacher development and school-based management consultants when appropriate. Given that the project was financed by a trust fund provided by the Australian government, all subsequent missions were conducted jointly with AusAID representatives and technical experts. Other donors such as “Gesellschaft für Technische Zusammenarbeit – GTZ”, Asian Development Bank - ADB, Japan International Cooperation Agency - JICA, UNICEF and USAID also participated in select missions. This attests to the efforts made by the Bank supervision team to implement the project in a participatory and inclusive way, and which ultimately helped streamline donor interventions in the education sector in support of the BESRA. The team also used the Bank-executed SPHERE trust funds and the Bank’s programmatic budget to help the government address challenges in implementing the project components as well as the BESRA through just-in-time technical assistance and analytical work. Key to the project’s ultimate achievements is the task team’s presence on the ground, which allowed for a constant and open dialogue with government counterparts and donors. The access to the Bank’s expertise and technical assistance was repeatedly mentioned by the government as having had an important impact on their day-to-day work. The Bank team based in the country proved particularly crucial to resolving bottlenecks and accelerating implementation during project start-up and led to the project being 93.42 percent disbursed by the closing date. (c) Justification of Rating for Overall Bank Performance Rating: Moderately Satisfactory 61. Based on the Bank’s quality at entry, the supervision discussion, and project outcomes above, overall Bank performance is rated moderately satisfactory.
25
5.2 Borrower Performance (a) Government Performance Rating: Moderately Satisfactory 62. The government, through its various departments and commissions, provided the necessary technical and financial support to DepEd to ensure implementation, and showed its commitment to and comprehension of the project’s objectives. The DBM, through the General Appropriations Act, maintained the budget line items of SBM, the school accreditation program, hardship allowance, ALS, and policy formulation, program planning and standards development for elementary education. The COA reviewed DepEd’s financial statements regularly and provided its opinions in a transparent way. NEDA coordinated the preparation of the 2011-2016 Philippine Development Plan that included support for ALS and CCT. While the various government agencies supported SPHERE and BESRA, some decisions hampered project performance such as: (i) delays in implementing eNGAS after its development in 2001, culminating in a temporary suspension in 2008; (ii) re-institution of selective pre-audits of cash advances and school construction; and (iii) delays in approval and release of the SARO or Notice of Cash Allocation for some expenditure items covered under the project items. Based on this, the government’s performance is rated Moderately Satisfactory. (b) Implementing Agency or Agencies Performance Rating: Moderately Satisfactory 63. DepEd, through its various bureaus and technical working groups, continued its support for the implementation and operationalization of the project and the BESRA. As mentioned previously, DepEd was able to address bottlenecks that hampered implementation. As part of the BESRA, it was able to roll out and institutionalize school-based management, promote teacher quality and standards development, significantly increase the teacher workforce to deal with the influx of new students, and promote all-inclusive education for minorities (see Annex 2 for complete list of achievements). These are impressive accomplishments. However, throughout implementation, financial management and procurement issues slowed implementation, and adherence to reporting requirements was delayed during the first half of project implementation. Based on these implementation issues, DepEd’s performance is rated moderately satisfactory. (c) Justification of Rating for Overall Borrower Performance Rating: Moderately Satisfactory 64. Based on the implementation analysis above, overall Borrower performance is rated moderately satisfactory
26

6. Lessons Learned Lesson 1. The institutionalization of reforms requires a long-term commitment on the part of government and the donor community to support the reform agenda. DepEd has remained committed to BESRA for eight years. The sustained commitment has allowed for the key areas of decentralization, professional development, learning strategies, access to education and organizational development to move forward. In addition, it has allowed the government to coordinate donor support around the BESRA, which has also contributed to the continuation of the reform agenda. DepED has gathered lessons learned from implementation of the reform programs related to the five KRTs and is now integrating those lessons into the BESRA. These lessons are now paving the way for DepEd to take a more integrated approach to the reform agenda outlined within the BESRA. Lesson 2. SBM is an important tool for decentralizing an education system and improving learning outcomes. SBM has had a substantial impact on the improvements at the school level throughout The Philippines. Schools are now systematically preparing SIPs, have governing councils and school report cards, and have been oriented to simplified accounting procedures. There is solid evidence from the recent SBM impact evaluation that schools with SBM experience improved achievement. While SBM systems are in place, there is still some work to be done in terms of the strengthening the roles of the governing councils specifically as they relate to accountability as well as increasing community participation. Lesson 3. Public private partnerships are important for ensuring the long-term availability of adequate resources to support community schools. The introduction and institutionalization of school-level planning and decision making has had positive effect on their ability to raise funds from the private sector in support of their school needs. Especially in cases where government assistance is not sufficient to address all the needs of a school, securing additional funds to leverage government assistance can have a positive effect on school functioning and performance. Schools now have their SIPs to keep communities informed of school needs. Again, it will take more time for the private sector to become fully engaged but systems are now in place through the support of SHPERE and NPSBE. Lesson 4. Solid analytical studies on system reforms during the implementation period are essential for making appropriate decisions on the elimination of bottlenecks to the reform agenda. With support from the SPHERE, Bank, AusAID and other donors, there was an on-going attempt to provide real time evaluations and studies to inform the implementation of the BESRA. Joint supervision missions identified problems and then mobilized the resources to study the issues and provide recommendations to DepEd on needed policy changes to improve the system. In many instances DepEd made the needed changes that led to improved implementation. Lesson 5. Strong financial management systems are critical for ensuring the efficient use and accounting of resources. Lack of a fully functioning financial management
27
system led to reporting delays and audit problems for the BESRA and SPHERE. The full implementation of the Government-wide Financial Management Information System becomes critical, especially for the DepEd with so many operating and implementing units under its jurisdiction.
7. Comments on Issues Raised by Grantee/Implementing Agencies/Donors (a) Grantee/Implementing agencies See Annex 7 for an excerpt of the government’s report. (b) Cofinanciers/Donors No written comments were received. However, officials from the Department of Foreign Affairs and Trade (DFAT – previously AusAID) verbally communicated to the Bank’s team on May 29, 2014 their agreement with the overall content and assessment of the ICR. (c) Other partners and stakeholders
28

Annex 1. Project Costs and Financing (a) Project Cost by Component (in USD Million equivalent)
Components Appraisal Estimate (USD millions*)
Actual/Latest Estimate (USD
millions**)
Percentage of Appraisal
Component 1: Translation of system-level policies into action***
20.01 8.38 41.88
Component 2: Support for School-Based Management (SBM) through grants for school improvement plan targeting disadvantaged elementary schools
4.28 4.37 102.10
Component 3: Classroom construction in high need locations in Southern Philippines
13.20 21.18 160.45
Component 4: Operating Cost 0.19 0.19 100
Total Baseline Cost 37.68 0.00 Physical Contingencies 0.00 0.00 0.00 Price Contingencies 0.00 0.00 0.00
Total Project Costs 37.68 34.12 Project Preparation Costs 0.00 0.00 .00 0.00 0.00 .00
Total Financing Required 37.68 34.12
* Figures are based on calculated exchange rate of AUD 1 = US$0.955 at the time of project signing. ** Figures are based on May 28, 2014 exchange rate of AUD 1 = US$0.9258 *** Original component cost was inclusive of AUD 200,000 (US$191,000 equivalent) for operating costs. This amount is listed as a separate component for the purposes of the ICR analysis. (b) Financing
Source of Funds Type of Cofinancing
Appraisal Estimate
(USD millions)
Actual/Latest Estimate
(USD millions)
Percentage of Appraisal
Trust Funds 0.00 0.00 Philippines - Free-standing Trust Fund Program 37.68 34.12 90.55*
* The difference in percentage disbursed is due to the depreciation of the Australian Dollar. At the current exchange rate, the original amount converts to US$36.52 million, of which US$34.12 million were disbursed, i.e., 93.42 percent.
29

Annex 2. Outputs by Component 65. SPHERE supported a subset of activities and expenditures in the implementation of the BESRA through targeting of activities and expenditures that are not covered in the ongoing programs and/or areas with additional needs where the gaps are clearly identified to support the essential building blocks of the reform agenda. The components and associated outcome indicators to support this aim are listed below. 66. Component 1: Translation of system-level policies into actions (AUD 21.15 million) This component had four sub-components: (A1) funding of short- to medium-term technical assistance (TA) and capacity building of key DepEd managers (AUD 0.52 million); (A2) capacity building in regional offices to conduct quality assurance functions in divisions and schools and provide support to them, and enhance feedback provision on their performance (AUD 4.0 million); (A3) funding construction and/or refurbishment of teaching and learning resource centers across the country (AUD 8.33 million); and (A4) funding the provision of teaching and learning materials (except textbooks) and training programs (AUD 8.3 million). 67. The following indicators were used to measure progress: (i) BESRA TCT and TWGs are operational/functional; (ii) National Quality Assurance and Accountability Framework developed and adopted; (iii) Regional office personnel trained on quality assurance/monitoring and evaluation, and providing technical assistance to divisions and schools; (iv) functional quality assurance system established with stakeholder participation at the regional level; (v) all regions monitor performance and report to DepEd and other stakeholders on performance improvements; (vi) division (with their schools) received feedback from EMIS; (vii) schools receive feedback from national assessment; (viii) national learning strategies and action plan formulated and adopted; (ix) Teaching and Learning Resource centers at the regional and divisional levels operational; (x) policy on the procurement/production of teaching and learning materials adopted; and (xi) increased percentage of schools with access to teaching and learning materials.
(i) BESRA TCT and TWGs are operational/functional has been fully met: the project supported one TCT (i.e., the DepEd Executive Committee comprised of the Secretary, Undersecretaries and Assistant Secretaries) and 8 TWGs, which focused on SBM, alternative learning systems, Quality Assurance and Monitoring and Evaluation (M&E), resource mobilization, IP and Muslim Education, assessment and learning strategies (see point viii below for more information) and organizational development;
(ii) The project contributed to the successful development and roll out of the QAAF in 2010, which spells out guiding principles of quality assurance and assigned roles and responsibilities within the quality assurance process (see points (iv) and (v) for additional outputs. The QAAF, along with the roll-out of the Philippines Accreditation System for Basic Education, laid the foundation for re-defining school input standards;
30
(iii) The output “Regional office personnel trained on quality assurance/monitoring and evaluation, and providing technical assistance to divisions and schools” has also been met as 100 percent of regions have been trained in “Total Quality Management” by end-of-project. This came out of a pilot conducted in three regions (Region 6, 7 and 8) to put in place a system for the provision of technical assistance by regional offices to divisions and schools. Under the Australian-financed STRIVE project, a “Regional Monitoring, Evaluation and Adjustment – RMEA” technology was developed, which was subsequently used under this project and rolled-out nation-wide to track and improve “Regional Education Development Plans – REDPs”.
(iv) 100 percent of regions reported having a “functional quality assurance system established with stakeholder participation”, meeting the expected end-of-project target. All regions now use the RMEA technology as part of their M&E systems to help monitor their support for the delivery of basic education services and the regions’ overall performance. The RMEA technology also effectively operationalizes the utilization of M&E reports for decision making. Lastly, technical assistance was provided to all regions to raise the capacity of divisions to assist schools observe and capitalize on classroom practices that can improve the quality of learning. While the “Regional Improvement Support and Enhancement (RISE)” funds to institutionalize QMS were not implemented, DepEd instead provided funding from its own resources to ensure capacity building and technical assistance in quality assurance at the regional level.
(v) All regions monitor performance and report to DepEd and other stakeholders on performance improvements. As mentioned above, the roll-out of the RMEA technology to all regions has allowed them to efficiently track output progress at the division level and propose adjustments to their work plans. With the support of SPHERE, M&E findings are now being communicated to relevant offices at the regional as well as the central levels through the RMEA.
(vi) 100 percent of division (with their schools) received feedback from EMIS, exceeding the end target of 75 percent. The roll out of the Enhanced Basic Education Information System (e-BEIS) nationwide has allowed central offices to upload the information they received from schools on enrollment, dropouts, graduates etc., allowing schools to access the information directly or for divisions to download and share the information with their respective schools.
(vii) 100 percent of schools receive feedback from national assessment, meeting the end target. Feedback (i.e., the National Achievement Test – NAT results) is being provided by division offices or can be accessed by schools directly through the National Educational Testing and Research Center’s (NETRC) website. The different test results and assessment outcomes are also used to adjust DepEd’s annual in-service teacher training programs, adjust teachers’ strengths and needs assessment (TSNA) results as well as update/complement instructional materials. Furthermore, the project provided 191 division offices with primers and toolkits to support them with the roll out of the NCBTS
31
which, combined with the TSNA, informed teacher hiring guidelines and in-service training programs.
(viii) the third and final phase of the national learning strategy action plan has been implemented and included the development of teaching and learning strategies in English, mathematics and science as well as the introduction of the following three major strategies affecting basic education: (a) the universalization of Kindergarten through the introduction of the “Kindergarten to Grade 12 Program (K to 12)”, making it officially part of the basic education cycle, hiring and training teachers and the development of a Kindergarten curriculum; (b) the revision of the entire basic education curriculum content and framework to accommodate the K to12 and revised ALS programs, the grades 1 – 10 learning competencies, and the development of an assessment framework; and (c) the piloting of MTB-MLE in 20 national languages in 921 schools nationwide, accompanied by the development of supporting materials for teaching and learning in the 12 main languages, basic literacy materials for indigenous peoples as well as training programs for 2,557 Kindergarten and grade 1 teachers in MTB-MLE teaching methodology.
(ix) The indicator “Teaching and Learning Resource centers (LRMDCs) at the regional and divisional levels operational” has been partially met. All 32 LRMDCs 23 have been constructed, but one was destroyed by the 2013 typhoon. The respective ICT and office equipment was also procured and delivered to the remaining 31 centers24. However, given delays in procuring the technology office equipment, installation could not be completed for all centers. Therefore, operationalization of all centers is expected by June 2014. However, the government has been successful in establishing the system/website that supports the LRMDCs in improving access of teachers and administrators to quality-assured electronic teaching and learning materials (see (x) below). Furthermore, DepEd has already identified “Lead Schools”, which already have the necessary equipment and connectivity, to play the role of satellite centers and thus expand coverage to more remote areas.
(x) The expected output of “policy on the procurement/production of teaching and learning materials adopted” has been exceeded. Not only has the Learning Resources and Management Development System (LRMDS) been adopted, it is also being applied as part of the development and production of teaching and learning resources. As part of the LRMDS, DepEd has developed the “Image Bank” platform, which allows teachers to upload materials they have
23 The decision to reduce the number of LRMDCs from 150 to 32 was recorded in the June 2011 restructuring and was based on the pilot experience with LRMDCs in three regions and initial construction delays. Criteria used to identify the 16 regions and 16 divisions to benefit from an LRMDC were: (i) absence of a Regional Education Learning Center; and (ii) divisions with low-performing schools (see footnote 26 for more information). 24 The CARAGA regional center could not complete procurement in time due to non-responsive bids by project closing. DepEd is therefore supporting the CARAGA center acquire the necessary equipment with government funds. Furthermore, the LRMDC-specific software was not procured for the DepEd central office before project closing.
32
developed and submit for quality review. A team of technical experts (i.e., textbook evaluators, subject specialists, etc.) review teaching material that was submitted and publish it if found acceptable, giving credit to the authoring teacher. This quality assurance mechanism, however, is not limited to materials being produced by teachers but applies to all new digital teaching and learning materials. The LRMDS was also crucial in disseminating part of the new “Kindergarten to Grade 12 – K-12” teaching materials, facilitating the efficient distribution to all regions and divisions in time for the new school year25. There are currently 2,782 uploaded resources and 117,428 registered users, which is an impressive accomplishment. And because the LRMDS has been so successful, its portal is being strengthened/re-designed with Australian government funds to accommodate larger/heavier digital materials (i.e., videos, interactive materials etc.).
(xi) The percentage of schools with access to teaching and learning materials has increased to 50 percent but fell short of its 65 percent end-target. This is mainly due to the fact that this indicator measures access to digital resources, which has been impacted by the delays in operationalizing the LRMDCs. DepEd has, however, kept distributing hard copies of Kindergarten to Grade 2, Grade 7 and 8 materials to schools without access to the LRMDS. The project also supported the production of 518,000 supplementary teaching and learning materials for the 50 low-performing divisions 26 , covering 30 percent of poorest-performing schools in each division. DepEd plans to conduct an assessment during the 2014/15 school year of the possible impact of having provided these materials to inform future interventions aimed at supporting low-performing schools.
68. In addition to these outputs, component 1 directly supported or mobilized other resources to support a wide range of technical assistance and trainings/workshops. The main achievement is the operationalization of the policies and implementation and action plans of the various BESRA TWGs, which are in line with and supportive of the BESRA Key Reform Thrusts. As previously mentioned, the training and workshop activities benefitted approximately 24,000 DepEd staff at the central, division and school levels and covered, amongst others: (i) SBM grant utilization and reporting; (ii) procurement of printing and distribution, LRMDC-related equipment as well as harmonized procurement for classroom construction; (iii) quality assurance and M&E, impact evaluation, and strategic planning and budgeting; (iv) K-12 curriculum development and teacher training; and (v) LRMDS. Furthermore, SPHERE successfully supported technical assistance, which led to the following key accomplishments: (i) advocacy and communications plans BESRA, alternative learning systems and SBM utilization, as well as a revised SBM operations manual; (ii) a blue print for pre-service teacher education; (iii) the development of the National Assessment Framework and Grading System Framework;
25 DepEd is also in the process of developing new digital Grade 6 and 8, as well as MTB learning resources to support the K-12 policy and will use the LRMDS to disseminate the materials. 26 Low-performing schools are identified as schools that score low on the NAT and completion rate, and have high drop-out rates.
33
(iv) the development of K-12 teaching modules and resources, including their digitalization and upload into the LRMDS, and web-based social media advocacy materials on K-12; and (vi) the development of the eBEIS. 69. Component 2: Support for School-Based Management (SBM) through grants for school improvement plan targeting disadvantaged elementary schools (AUD 4.48 million). This component provided grants to public elementary schools, which have installed the basic elements27 of School-Based Management (SBM). 70. Progress was tracked through: (i) schools/clusters of schools received school grants; and (ii) school-based financial management system established, which were both exceeded. 78 percent of SPHERE-supported schools received SBM grants compared to the 65 percent target. A total of US$4.38 million28 were released over the life of the project, with only US$400,000 undisbursed due to late liquidation by one region. With only a few months before project closing, the concerned region would not have been able to fully utilize these SBM funds, leading DepEd to re-align the resources to support the 2013 typhoon victims. Furthermore, the project supported a more rigorous application of SBM eligibility criteria, where SPHERE schools had to have approved SIPs before receiving the funds. The project also supported the simplification of the SIP template to make it more flexible and adaptable to each school’s needs, which has been distributed/rolled-out to schools nationwide in 2013. Through the simplification, it is expected that all schools will be able to develop and approve SIPs irrespective of sources of funding. The project also supported the revision of the SBM framework to become an incentive-driven instrument and be able to better respond to the realities on the ground. The realization that even better performing schools should benefit from SBM grants is expected to address the perverse incentive for schools having to underperform in order to receive SBM funds. Lastly, the project support to school-based management through the provision of SBM grants contributed to laying the foundation for the adoption of multiyear policy guideline to enhance the effectiveness of the utilization of the SBM grant and improve the management of SBM resources.29. However, timely liquidation continued to be an issue and at times slowed-down SBM grant releases. DepEd is currently trying to address this issue by working with relevant departments. The 2012 independent SBM grant review concluded that overall, there was general compliance with the guidelines for SPHERE 2011 SBM grants in terms of identification of recipient divisions and schools. Evidence gathered during the review disclosed that the Central, Regional and Division Offices adhered to the set processes and conditions and that there was general compliance with procurement laws. These findings are an indication of the continued assistance provided by Division Offices to school heads in administering the grants.
27 i.e., with well-developed school improvement plans, established school community partnerships, transparent reporting and accountability mechanisms at the school level etc. 28 The SBM allocation was increased as a result of the decision to reduce the number of LRMDCs as recorded in the June 2011 restructuring. 29 This includes the continued practice of using multiyear guidelines for SBM utilization, improving schools’ ability to plan their interventions over a longer period.
34
71. In terms of school-based financial management system having been established, 88 percent of school heads have been trained in Simplified Accounting Procedures (SAP), and have adequate financial management systems in place, exceeding the 65 percent target. In additional to these achievements, DepEd received technical assistance and financial support from AusAID to develop a FMIS. This system had to be put on hold pending the development of the government wide FMIS, called the “Government Integrated Financial Management Information System - GIFMIS”. As a first step, the government has developed the “Unified Accounting Code Structure – UACS”, consolidating all accounting codes currently in use in the Philippines, which is expected to be rolled out in the latter part of CY2014. With project support, the government was able to conduct financial management training in “Strategic planning for budgeting and planning”, which has already shown some positive effects on DepEd’s FM performance as discussed under section 2.4. 72. Component 3: Classroom construction in high need locations in Southern Philippines (AUD 13.82 million). This component supported classroom construction in identified priority schools under the DepEd-managed School building Program in Southern Philippines and was to be done by DepEd with extensive community partnership. 73. Achievement of this component was measured through the percentage of cost-sharing between DepEd and LGUs for classroom construction, including equity factors, which was exceeded: 100 percent of classrooms constructed under the project followed the cost-sharing scheme, which required a signed Statement of Interest between DepEd and the LGU before construction could commence. Sharing the burden of construction took the form of either cash or in-kind contributions (i.e., local engineers, site preparation, extra LGU manpower etc.). As a result, the project was able to support 1,150 classrooms and 1,068 toilets30 compared to the final target of 1,160 classrooms and 1,124 toilets. The decision to build additional classrooms was made in November 2011 following the successful completion of the initial classroom construction targets of 507, which were completed under batches 1-3, and the foreign exchange gains vis-à-vis the Australian dollar. However, there were significant delays in finishing the additional classrooms due to a change in the implementation approach31 as discussed under Section 2.4, and which required weekly meetings between the Bank and DepEd teams to track progress in the last months, leading to 99 percent of classrooms having been completed. The quality of construction is generally good and most schools were provided with toilets. A post-review found that a small number of toilets was not connected to the water supply, which DepEd agreed to rectify. This LGU-DepEd partnership, however, goes even beyond
30 These include classrooms destroyed by the 2012 earthquake in Region VII. Other regions where classrooms were not completed in time are Regions, VI, VIII, IX, XI and CARAGA. 31 The Principal-Led School Building Program is an implementation approach using a decentralized mode of implementation of school building procurement and contract administration, which was subsequently replaced by a more centralized implementation mode using National Competitive Bidding.
35

classroom construction, where a large number of teachers teaching in public schools are funded by LGUs.
36

Annex 3. Economic and Financial Analysis 74. The economic rationale for the SPHERE project is based on the expected payoffs of support to BESRA reforms in terms of accelerated economic and social development, improved efficiency and reduced inequality. These payoffs will result from increased access to good quality basic education which has been shown to raise economic growth rates and improve other development outcomes. The SPHERE project contributes to the broader BESRA by supporting a number of measures to increase basic education access and quality as well as strategies aimed at making public education investments more cost-effective. 75. There was no economic and financial analysis in the appraisal document. Given the project’s aim of supporting the overall basic education reform program, the economic and financial analysis of the ICR focuses on assessing the extent to which public investment in education increased and how the efficiency of the system has changed. It also compares project costs with a number of alternatives and where possible assesses the cost-effectiveness of the reforms that were supported. 76. The reform program introduced in 2006 was underpinned by significant increased public education spending. This reversed a decline in public education investment in the early 2000s and supported a significant expansion in basic education enrolments. 77. The SPHERE project and the parallel NPSBE encouraged increased investment in areas that were important to the success of the reform agenda (e.g. the rolling out of school based management reforms, classroom construction and support to a learning resources and management development system). The analysis reported in this annex shows that support provided to school based management (e.g. SBM grants) raised learning outcomes in a cost-effective way. Evidence also shows that the efficiency of the education system is likely to have been improved through improved teacher deployment. In particular, the BESRA reform program and associated support from the NPSBE and SPHERE projects, was associated with a decline in the number of ‘excess’ teachers which reduced system costs. School construction costs under the project were initially comparable with other government-led programs although the shift from principal-led scheme (through shopping) to competitive bidding (National Competitive Bidding) during the project increased costs.
78. During the SPHERE project there was a significant shift in project resources away from (Component 1) and towards classroom construction (Component 3). It is not possible to quantify the changes in efficiency associated with this shift because information on the efficiency of different components is not available. However, the analysis shows that increased investments in classroom construction were likely to have benefits in terms of student learning. In addition, given that SPHERE was one component of the overall BESRA reform program it is possible that investments in these other areas continued through other activities.
37
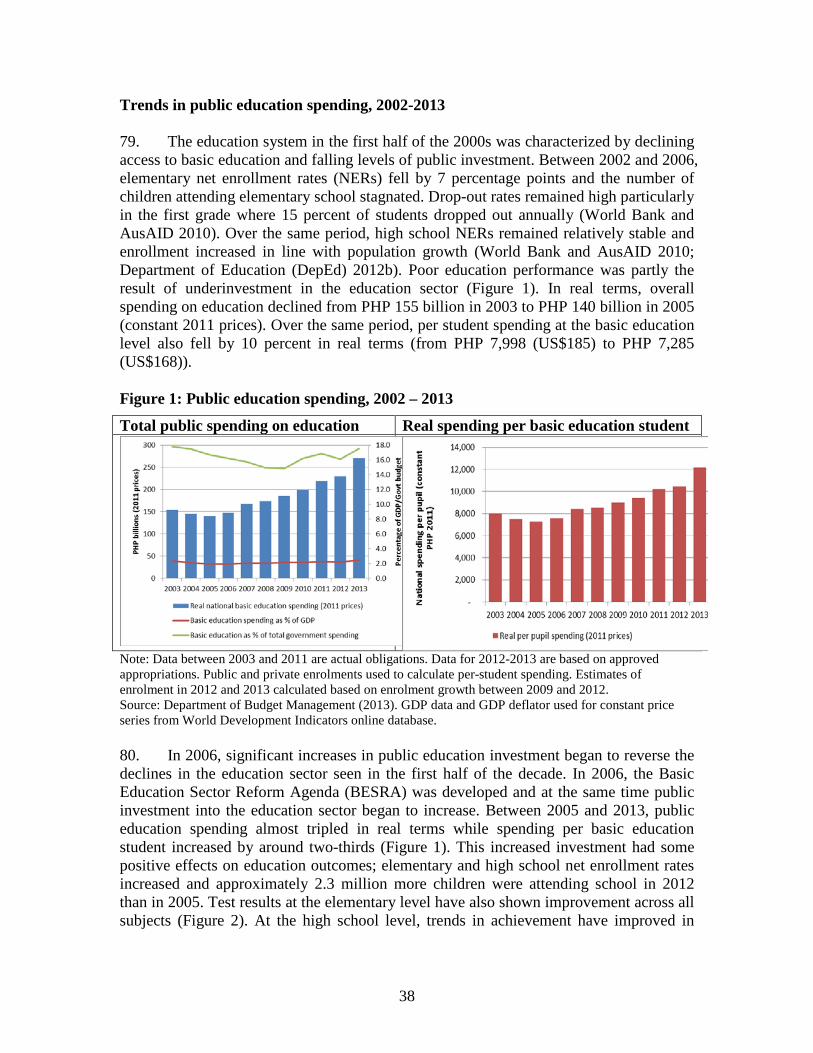
Trends in public education spending, 2002-2013 79. The education system in the first half of the 2000s was characterized by declining access to basic education and falling levels of public investment. Between 2002 and 2006, elementary net enrollment rates (NERs) fell by 7 percentage points and the number of children attending elementary school stagnated. Drop-out rates remained high particularly in the first grade where 15 percent of students dropped out annually (World Bank and AusAID 2010). Over the same period, high school NERs remained relatively stable and enrollment increased in line with population growth (World Bank and AusAID 2010; Department of Education (DepEd) 2012b). Poor education performance was partly the result of underinvestment in the education sector (Figure 1). In real terms, overall spending on education declined from PHP 155 billion in 2003 to PHP 140 billion in 2005 (constant 2011 prices). Over the same period, per student spending at the basic education level also fell by 10 percent in real terms (from PHP 7,998 (US$185) to PHP 7,285 (US$168)). Figure 1: Public education spending, 2002 – 2013
Total public spending on education Real spending per basic education student
Note: Data between 2003 and 2011 are actual obligations. Data for 2012-2013 are based on approved appropriations. Public and private enrolments used to calculate per-student spending. Estimates of enrolment in 2012 and 2013 calculated based on enrolment growth between 2009 and 2012. Source: Department of Budget Management (2013). GDP data and GDP deflator used for constant price series from World Development Indicators online database. 80. In 2006, significant increases in public education investment began to reverse the declines in the education sector seen in the first half of the decade. In 2006, the Basic Education Sector Reform Agenda (BESRA) was developed and at the same time public investment into the education sector began to increase. Between 2005 and 2013, public education spending almost tripled in real terms while spending per basic education student increased by around two-thirds (Figure 1). This increased investment had some positive effects on education outcomes; elementary and high school net enrollment rates increased and approximately 2.3 million more children were attending school in 2012 than in 2005. Test results at the elementary level have also shown improvement across all subjects (Figure 2). At the high school level, trends in achievement have improved in
38
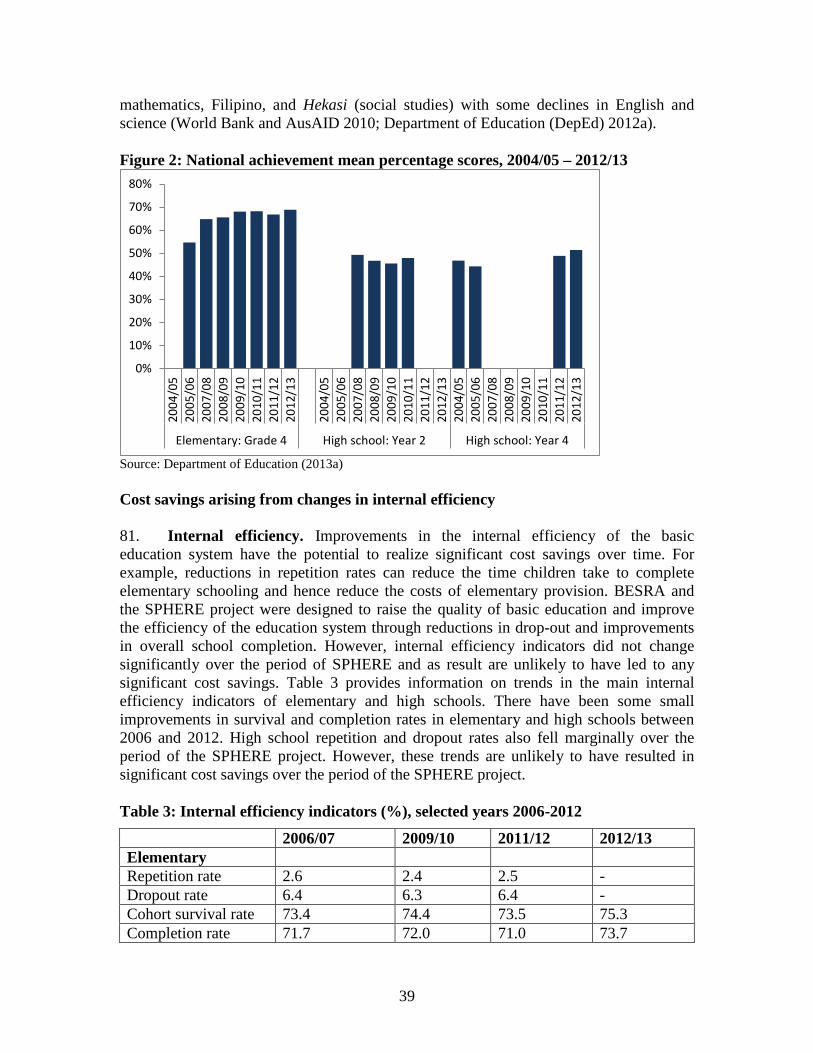
mathematics, Filipino, and Hekasi (social studies) with some declines in English and science (World Bank and AusAID 2010; Department of Education (DepEd) 2012a). Figure 2: National achievement mean percentage scores, 2004/05 – 2012/13
Source: Department of Education (2013a) Cost savings arising from changes in internal efficiency 81. Internal efficiency. Improvements in the internal efficiency of the basic education system have the potential to realize significant cost savings over time. For example, reductions in repetition rates can reduce the time children take to complete elementary schooling and hence reduce the costs of elementary provision. BESRA and the SPHERE project were designed to raise the quality of basic education and improve the efficiency of the education system through reductions in drop-out and improvements in overall school completion. However, internal efficiency indicators did not change significantly over the period of SPHERE and as result are unlikely to have led to any significant cost savings. Table 3 provides information on trends in the main internal efficiency indicators of elementary and high schools. There have been some small improvements in survival and completion rates in elementary and high schools between 2006 and 2012. High school repetition and dropout rates also fell marginally over the period of the SPHERE project. However, these trends are unlikely to have resulted in significant cost savings over the period of the SPHERE project. Table 3: Internal efficiency indicators (%), selected years 2006-2012
2006/07 2009/10 2011/12 2012/13 Elementary Repetition rate 2.6 2.4 2.5 - Dropout rate 6.4 6.3 6.4 - Cohort survival rate 73.4 74.4 73.5 75.3 Completion rate 71.7 72.0 71.0 73.7
0%
10%
20%
30%
40%
50%
60%
70%
80%20
04/0
520
05/0
620
07/0
820
08/0
920
09/1
020
10/1
120
11/1
220
12/1
3
2004
/05
2005
/06
2007
/08
2008
/09
2009
/10
2010
/11
2011
/12
2012
/13
2004
/05
2005
/06
2007
/08
2008
/09
2009
/10
2010
/11
2011
/12
2012
/13
Elementary: Grade 4 High school: Year 2 High school: Year 4
39
Table 3: Internal efficiency indicators (%), selected years 2006-2012 (cont’)
2006/07 2009/10 2011/12 2012/13 High school Repetition rate 3.5 3.2 3.3 - Drop-out rate 8.6 8.0 7.8 - Cohort survival rate 77.3 78.4 78.8 78.2 Completion rate 72.1 73.6 74.2 74.8
Note: The cohort survival rate is the percentage of a cohort of students in the first grade in a given school year that are expected to survive to the last grade. Completion rate is the percentage of first year entrants who complete/finish their full term. Repetition rates are for public schools only and along with drop-out rates are not available for the 2012/13 school year because DepEd no longer tracks these indicators. Source: Repetition rates calculated from BEIS-NT. All other data from Department of Education (2012a; 2013a). 82. These relatively minor efficiency improvements need to be seen in light of the SPHERE project objectives to increase access and narrow inequality. Approximately 2.3 million additional children have enrolled in basic education since 2005. A large proportion of these children are likely to have come from poorer households where support for education is more limited and the factors associated with dropout and repetition more prevalent. A survey conducted in 2004 showed that completion rates for the poorest household quintile were half those of the wealthiest quintile. This would suggest that as poorer children entered school for the first time the efficiency of the system would deteriorate. It is striking therefore that internal efficiency indicators remained relatively steady over this period. 83. Improvements in the efficiency of the system can also arise if excess teachers are redeployed to deficit schools or are used to accommodate increased student numbers in new schools/classrooms. In this way, classroom construction under the SPHERE project could have improved the efficiency of teacher distribution in areas with excess teachers. 84. Calculations based on reductions in the number of excess teachers point to large cost savings. In order to understand fully whether the distribution of teachers has improved, analysis of teacher surpluses and deficits at the school level is required. A study estimated that there were 83,000 excess public teachers in the basic education system (68,000 at elementary and 15,000 at high school) in 2003/04 (Department of Education (DepEd) 2005). A follow up study, using 2012/13 data and the same methodology, showed that the number of excess teachers had declined to around 28,505 basic education teachers (Department of Education (DepEd) 2013b). Assuming this had the effect of reducing the need for new teachers by an equivalent amount this would have reduced the overall salary bill by approximately 10 percent or PHP 14.2 billion.32 While these savings are likely to have been driven by a number of factors increases in the stock of classrooms is likely to have played a role.
32 This assumes the average teacher salary of PHP 261,376 reported in the latest medium term expenditure framework (Department of Education (DepEd) 2013b).
40
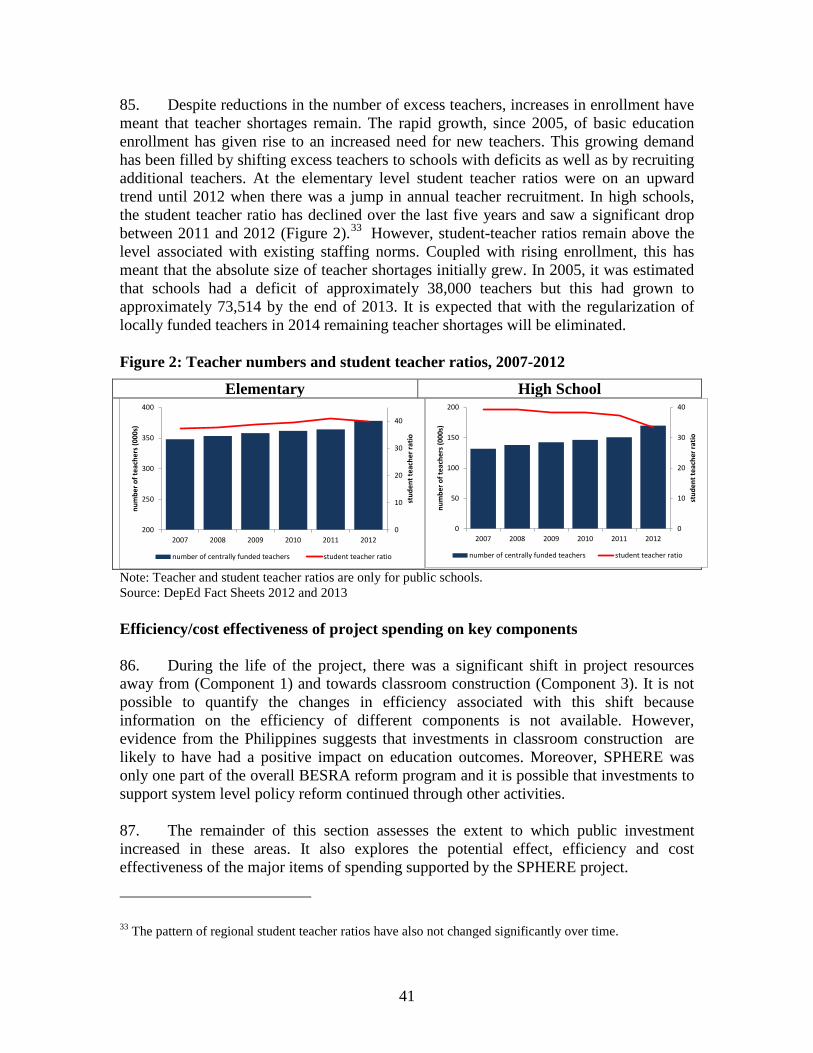
85. Despite reductions in the number of excess teachers, increases in enrollment have meant that teacher shortages remain. The rapid growth, since 2005, of basic education enrollment has given rise to an increased need for new teachers. This growing demand has been filled by shifting excess teachers to schools with deficits as well as by recruiting additional teachers. At the elementary level student teacher ratios were on an upward trend until 2012 when there was a jump in annual teacher recruitment. In high schools, the student teacher ratio has declined over the last five years and saw a significant drop between 2011 and 2012 (Figure 2).33 However, student-teacher ratios remain above the level associated with existing staffing norms. Coupled with rising enrollment, this has meant that the absolute size of teacher shortages initially grew. In 2005, it was estimated that schools had a deficit of approximately 38,000 teachers but this had grown to approximately 73,514 by the end of 2013. It is expected that with the regularization of locally funded teachers in 2014 remaining teacher shortages will be eliminated. Figure 2: Teacher numbers and student teacher ratios, 2007-2012
Elementary High School
Note: Teacher and student teacher ratios are only for public schools. Source: DepEd Fact Sheets 2012 and 2013 Efficiency/cost effectiveness of project spending on key components
86. During the life of the project, there was a significant shift in project resources away from (Component 1) and towards classroom construction (Component 3). It is not possible to quantify the changes in efficiency associated with this shift because information on the efficiency of different components is not available. However, evidence from the Philippines suggests that investments in classroom construction are likely to have had a positive impact on education outcomes. Moreover, SPHERE was only one part of the overall BESRA reform program and it is possible that investments to support system level policy reform continued through other activities. 87. The remainder of this section assesses the extent to which public investment increased in these areas. It also explores the potential effect, efficiency and cost effectiveness of the major items of spending supported by the SPHERE project.
33 The pattern of regional student teacher ratios have also not changed significantly over time.
200
250
300
350
400
2007 2008 2009 2010 2011 20120
10
20
30
40
num
ber o
f tea
cher
s (00
0s)
stud
ent t
each
er ra
tio
number of centrally funded teachers student teacher ratio
0
50
100
150
200
2007 2008 2009 2010 2011 20120
10
20
30
40
num
ber o
f tea
cher
s (00
0s)
stud
ent t
each
er ra
tio
number of centrally funded teachers student teacher ratio
41

3.1 Component 1: Translation of system-level policies into actions 88. The bulk of spending under this component went to strengthening the management capacity of the education system with a strong focus on quality. There were three main areas of support:
• Development of a quality assurance framework and the introduction of associated monitoring and evaluation systems.
• Roll out of enhanced education information system to improve planning • Feedback system from national assessments to identify teacher training needs
89. These systems are vital elements of a well-functioning education system and feedback systems introduced as part of the SPHERE project have the potential to match resources more closely to need. However, it is not possible to isolate the impact of these interventions on overall access and learning outcomes from the broader reform program. It is also likely that the introduction of systems of this kind will take time to translate into improved education outcomes. 90. The component also supported the implementation of school based management reforms through the revision of manuals and training on grant utilization. Evidence suggests (see below) that these efforts in conjunction with the school based management grants provided through the project will have raised learning outcomes in a cost-effective way. 91. Resources under this component were also devoted to the construction or expansion of 32 regional and divisional learning resource management development centers (LRMDC). These centers have provided the focal point for the nationwide Learning Resources and Management and Development System and are the repository for teaching and learning materials developed for elementary and high schools. 92. The average cost of constructing or expanding LRMDCs were approximately 3 times the cost of classrooms constructed under the project (Table 4). Given the size of LRMDCs the costs of construction are in line with the classroom construction costs under the project and other comparable projects (see Table 6). Furniture and equipment costs amounted to approximately US$96,000 per LRMDC with ICT equipment and structural cabling accounting for approximately 55 percent of these costs.
42
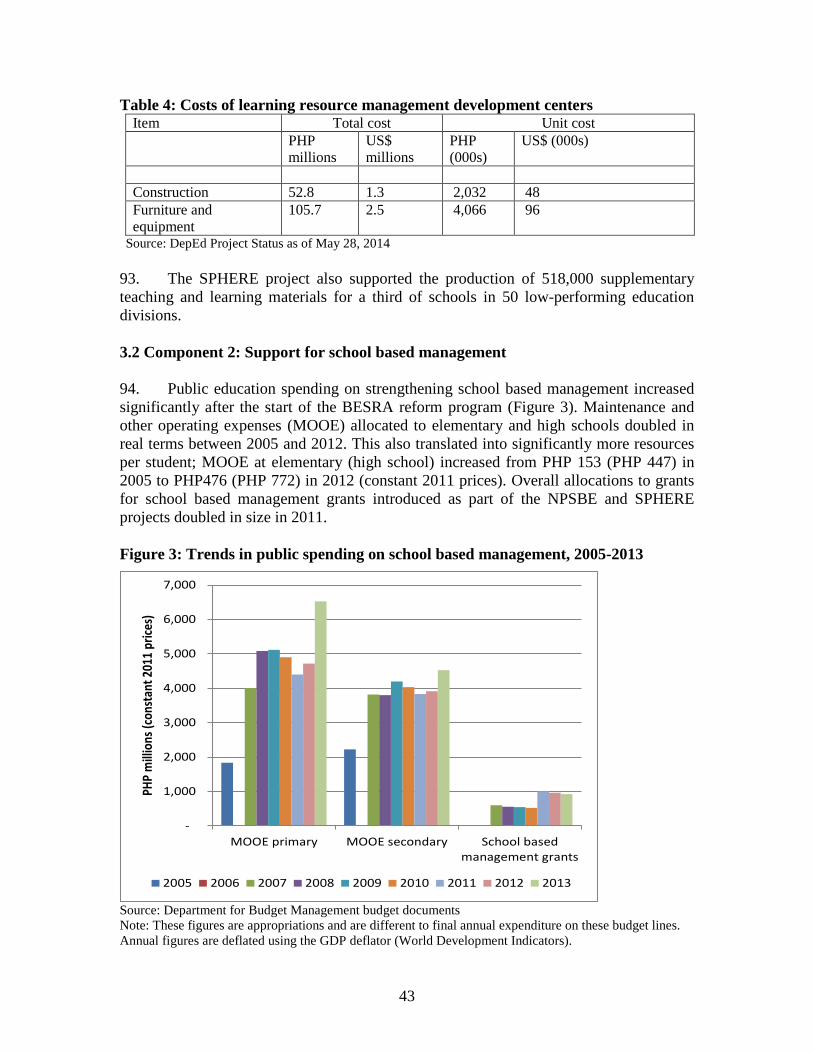
Table 4: Costs of learning resource management development centers Item Total cost Unit cost PHP
millions US$ millions
PHP (000s)
US$ (000s)
Construction 52.8 1.3 2,032 48 Furniture and equipment
105.7 2.5 4,066 96
Source: DepEd Project Status as of May 28, 2014 93. The SPHERE project also supported the production of 518,000 supplementary teaching and learning materials for a third of schools in 50 low-performing education divisions. 3.2 Component 2: Support for school based management 94. Public education spending on strengthening school based management increased significantly after the start of the BESRA reform program (Figure 3). Maintenance and other operating expenses (MOOE) allocated to elementary and high schools doubled in real terms between 2005 and 2012. This also translated into significantly more resources per student; MOOE at elementary (high school) increased from PHP 153 (PHP 447) in 2005 to PHP476 (PHP 772) in 2012 (constant 2011 prices). Overall allocations to grants for school based management grants introduced as part of the NPSBE and SPHERE projects doubled in size in 2011. Figure 3: Trends in public spending on school based management, 2005-2013
Source: Department for Budget Management budget documents Note: These figures are appropriations and are different to final annual expenditure on these budget lines. Annual figures are deflated using the GDP deflator (World Development Indicators).
-
1,000
2,000
3,000
4,000
5,000
6,000
7,000
MOOE primary MOOE secondary School basedmanagement grants
PHP
milli
ons (
cons
tant
2011
pric
es)
2005 2006 2007 2008 2009 2010 2011 2012 2013
43
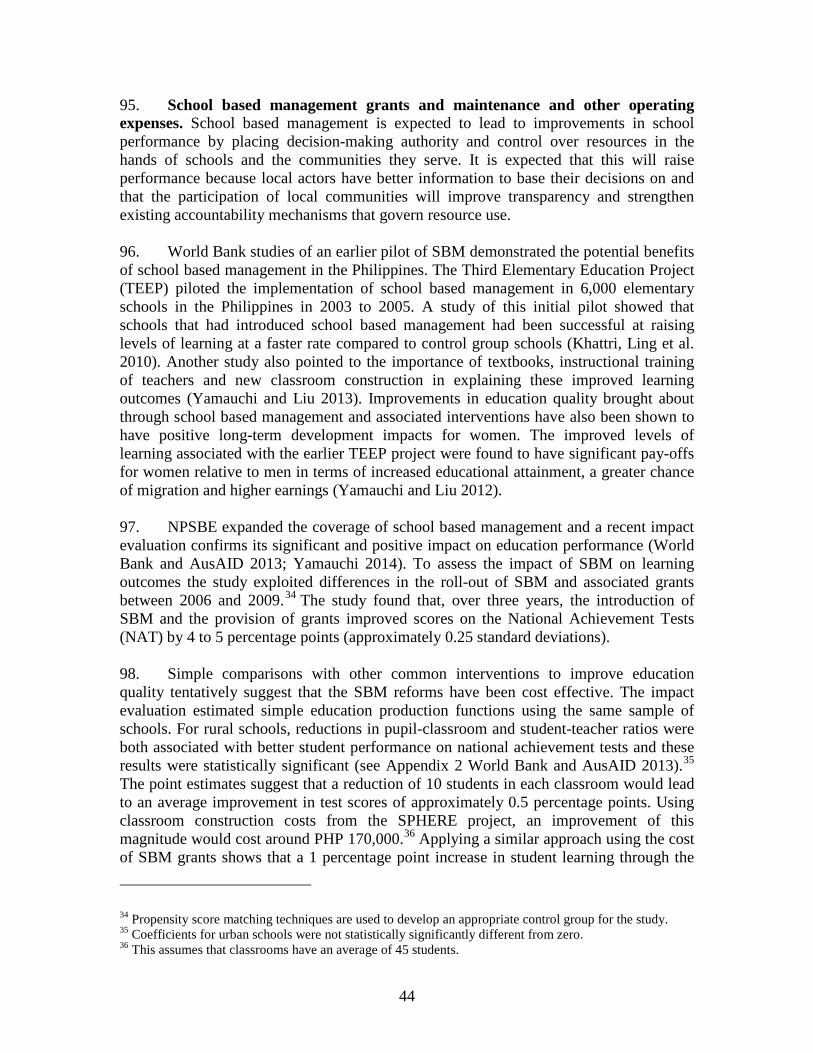
95. School based management grants and maintenance and other operating expenses. School based management is expected to lead to improvements in school performance by placing decision-making authority and control over resources in the hands of schools and the communities they serve. It is expected that this will raise performance because local actors have better information to base their decisions on and that the participation of local communities will improve transparency and strengthen existing accountability mechanisms that govern resource use. 96. World Bank studies of an earlier pilot of SBM demonstrated the potential benefits of school based management in the Philippines. The Third Elementary Education Project (TEEP) piloted the implementation of school based management in 6,000 elementary schools in the Philippines in 2003 to 2005. A study of this initial pilot showed that schools that had introduced school based management had been successful at raising levels of learning at a faster rate compared to control group schools (Khattri, Ling et al. 2010). Another study also pointed to the importance of textbooks, instructional training of teachers and new classroom construction in explaining these improved learning outcomes (Yamauchi and Liu 2013). Improvements in education quality brought about through school based management and associated interventions have also been shown to have positive long-term development impacts for women. The improved levels of learning associated with the earlier TEEP project were found to have significant pay-offs for women relative to men in terms of increased educational attainment, a greater chance of migration and higher earnings (Yamauchi and Liu 2012). 97. NPSBE expanded the coverage of school based management and a recent impact evaluation confirms its significant and positive impact on education performance (World Bank and AusAID 2013; Yamauchi 2014). To assess the impact of SBM on learning outcomes the study exploited differences in the roll-out of SBM and associated grants between 2006 and 2009.34 The study found that, over three years, the introduction of SBM and the provision of grants improved scores on the National Achievement Tests (NAT) by 4 to 5 percentage points (approximately 0.25 standard deviations). 98. Simple comparisons with other common interventions to improve education quality tentatively suggest that the SBM reforms have been cost effective. The impact evaluation estimated simple education production functions using the same sample of schools. For rural schools, reductions in pupil-classroom and student-teacher ratios were both associated with better student performance on national achievement tests and these results were statistically significant (see Appendix 2 World Bank and AusAID 2013).35 The point estimates suggest that a reduction of 10 students in each classroom would lead to an average improvement in test scores of approximately 0.5 percentage points. Using classroom construction costs from the SPHERE project, an improvement of this magnitude would cost around PHP 170,000.36 Applying a similar approach using the cost of SBM grants shows that a 1 percentage point increase in student learning through the
34 Propensity score matching techniques are used to develop an appropriate control group for the study. 35 Coefficients for urban schools were not statistically significantly different from zero. 36 This assumes that classrooms have an average of 45 students.
44
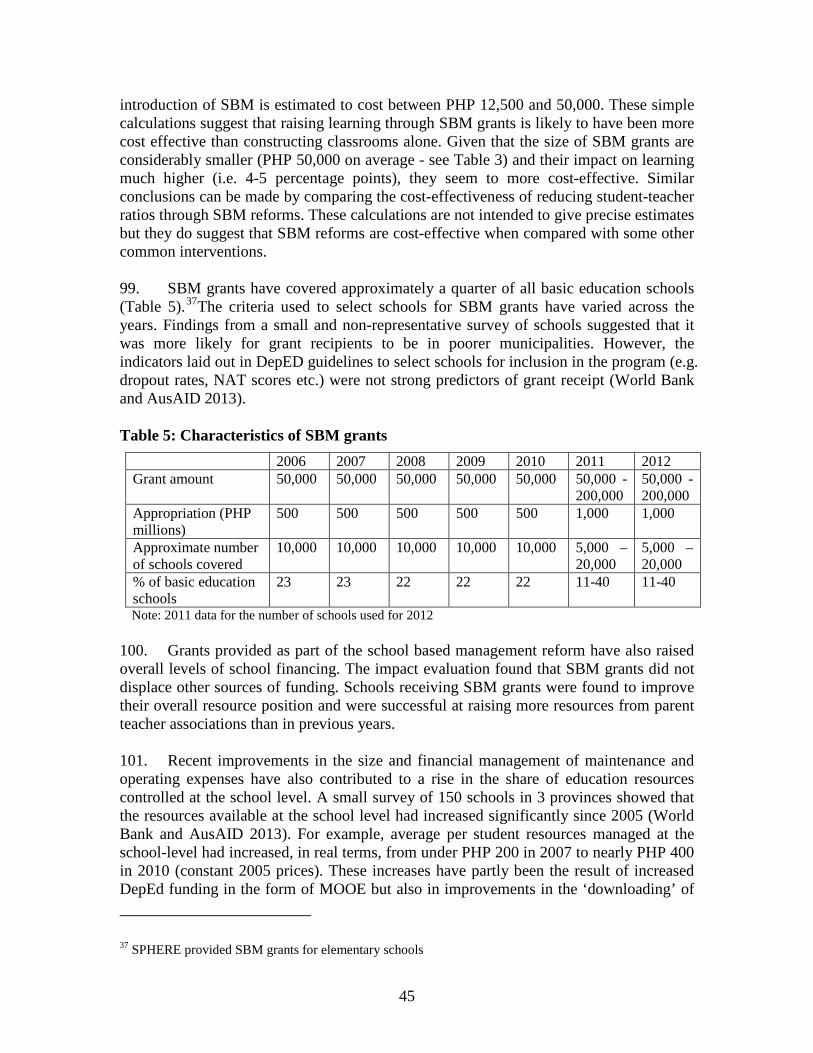
introduction of SBM is estimated to cost between PHP 12,500 and 50,000. These simple calculations suggest that raising learning through SBM grants is likely to have been more cost effective than constructing classrooms alone. Given that the size of SBM grants are considerably smaller (PHP 50,000 on average - see Table 3) and their impact on learning much higher (i.e. 4-5 percentage points), they seem to more cost-effective. Similar conclusions can be made by comparing the cost-effectiveness of reducing student-teacher ratios through SBM reforms. These calculations are not intended to give precise estimates but they do suggest that SBM reforms are cost-effective when compared with some other common interventions. 99. SBM grants have covered approximately a quarter of all basic education schools (Table 5).37The criteria used to select schools for SBM grants have varied across the years. Findings from a small and non-representative survey of schools suggested that it was more likely for grant recipients to be in poorer municipalities. However, the indicators laid out in DepED guidelines to select schools for inclusion in the program (e.g. dropout rates, NAT scores etc.) were not strong predictors of grant receipt (World Bank and AusAID 2013). Table 5: Characteristics of SBM grants
2006 2007 2008 2009 2010 2011 2012 Grant amount 50,000 50,000 50,000 50,000 50,000 50,000 -
200,000 50,000 -200,000
Appropriation (PHP millions)
500 500 500 500 500 1,000 1,000
Approximate number of schools covered
10,000 10,000 10,000 10,000 10,000 5,000 – 20,000
5,000 – 20,000
% of basic education schools
23 23 22 22 22 11-40 11-40
Note: 2011 data for the number of schools used for 2012 100. Grants provided as part of the school based management reform have also raised overall levels of school financing. The impact evaluation found that SBM grants did not displace other sources of funding. Schools receiving SBM grants were found to improve their overall resource position and were successful at raising more resources from parent teacher associations than in previous years. 101. Recent improvements in the size and financial management of maintenance and operating expenses have also contributed to a rise in the share of education resources controlled at the school level. A small survey of 150 schools in 3 provinces showed that the resources available at the school level had increased significantly since 2005 (World Bank and AusAID 2013). For example, average per student resources managed at the school-level had increased, in real terms, from under PHP 200 in 2007 to nearly PHP 400 in 2010 (constant 2005 prices). These increases have partly been the result of increased DepEd funding in the form of MOOE but also in improvements in the ‘downloading’ of
37 SPHERE provided SBM grants for elementary schools
45
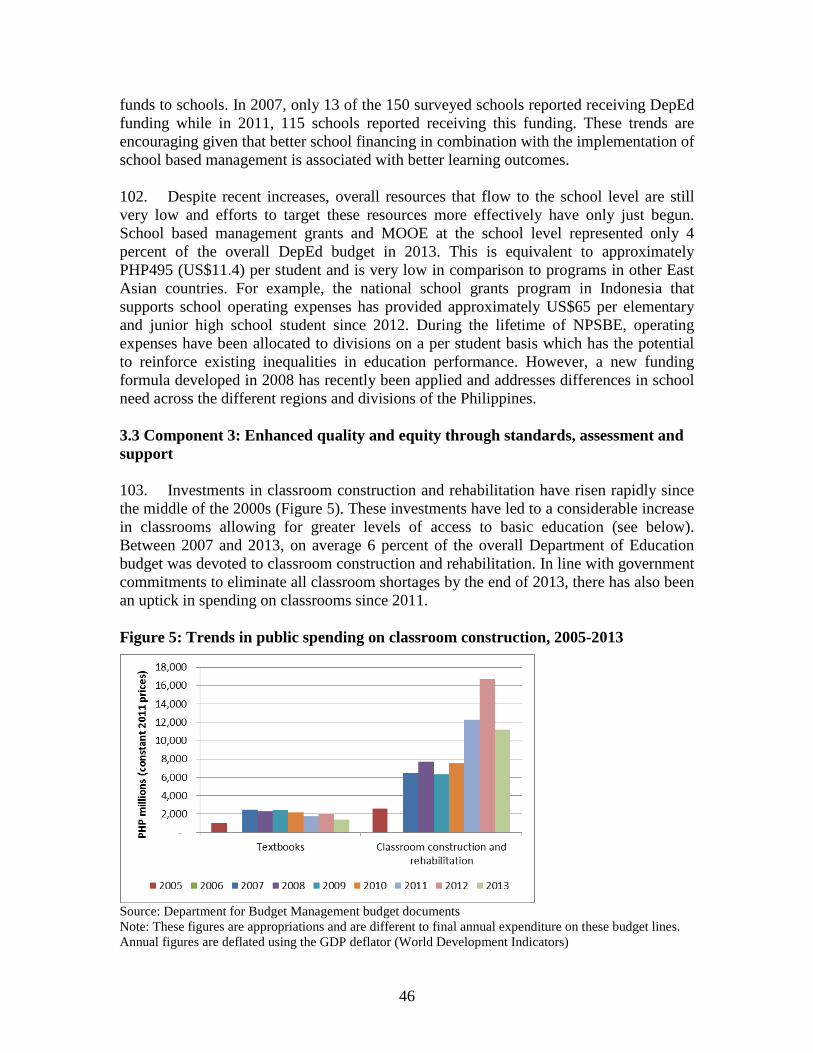
funds to schools. In 2007, only 13 of the 150 surveyed schools reported receiving DepEd funding while in 2011, 115 schools reported receiving this funding. These trends are encouraging given that better school financing in combination with the implementation of school based management is associated with better learning outcomes. 102. Despite recent increases, overall resources that flow to the school level are still very low and efforts to target these resources more effectively have only just begun. School based management grants and MOOE at the school level represented only 4 percent of the overall DepEd budget in 2013. This is equivalent to approximately PHP495 (US$11.4) per student and is very low in comparison to programs in other East Asian countries. For example, the national school grants program in Indonesia that supports school operating expenses has provided approximately US$65 per elementary and junior high school student since 2012. During the lifetime of NPSBE, operating expenses have been allocated to divisions on a per student basis which has the potential to reinforce existing inequalities in education performance. However, a new funding formula developed in 2008 has recently been applied and addresses differences in school need across the different regions and divisions of the Philippines. 3.3 Component 3: Enhanced quality and equity through standards, assessment and support 103. Investments in classroom construction and rehabilitation have risen rapidly since the middle of the 2000s (Figure 5). These investments have led to a considerable increase in classrooms allowing for greater levels of access to basic education (see below). Between 2007 and 2013, on average 6 percent of the overall Department of Education budget was devoted to classroom construction and rehabilitation. In line with government commitments to eliminate all classroom shortages by the end of 2013, there has also been an uptick in spending on classrooms since 2011. Figure 5: Trends in public spending on classroom construction, 2005-2013
Source: Department for Budget Management budget documents Note: These figures are appropriations and are different to final annual expenditure on these budget lines. Annual figures are deflated using the GDP deflator (World Development Indicators)
46
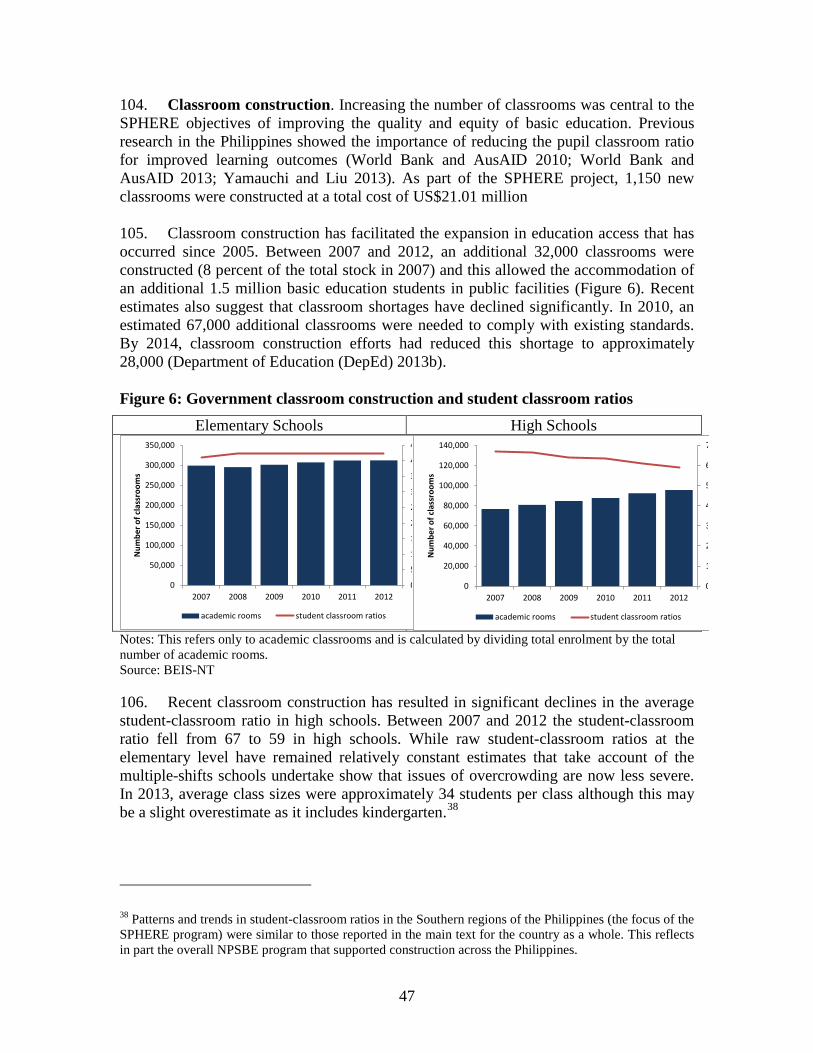
104. Classroom construction. Increasing the number of classrooms was central to the SPHERE objectives of improving the quality and equity of basic education. Previous research in the Philippines showed the importance of reducing the pupil classroom ratio for improved learning outcomes (World Bank and AusAID 2010; World Bank and AusAID 2013; Yamauchi and Liu 2013). As part of the SPHERE project, 1,150 new classrooms were constructed at a total cost of US$21.01 million 105. Classroom construction has facilitated the expansion in education access that has occurred since 2005. Between 2007 and 2012, an additional 32,000 classrooms were constructed (8 percent of the total stock in 2007) and this allowed the accommodation of an additional 1.5 million basic education students in public facilities (Figure 6). Recent estimates also suggest that classroom shortages have declined significantly. In 2010, an estimated 67,000 additional classrooms were needed to comply with existing standards. By 2014, classroom construction efforts had reduced this shortage to approximately 28,000 (Department of Education (DepEd) 2013b). Figure 6: Government classroom construction and student classroom ratios
Elementary Schools High Schools
Notes: This refers only to academic classrooms and is calculated by dividing total enrolment by the total number of academic rooms. Source: BEIS-NT 106. Recent classroom construction has resulted in significant declines in the average student-classroom ratio in high schools. Between 2007 and 2012 the student-classroom ratio fell from 67 to 59 in high schools. While raw student-classroom ratios at the elementary level have remained relatively constant estimates that take account of the multiple-shifts schools undertake show that issues of overcrowding are now less severe. In 2013, average class sizes were approximately 34 students per class although this may be a slight overestimate as it includes kindergarten.38
38 Patterns and trends in student-classroom ratios in the Southern regions of the Philippines (the focus of the SPHERE program) were similar to those reported in the main text for the country as a whole. This reflects in part the overall NPSBE program that supported construction across the Philippines.
0
50,000
100,000
150,000
200,000
250,000
300,000
350,000
2007 2008 2009 2010 2011 20120
5
1
1
2
2
3
3
4
4
Num
ber o
f cla
ssro
oms
academic rooms student classroom ratios
0
20,000
40,000
60,000
80,000
100,000
120,000
140,000
2007 2008 2009 2010 2011 20120
1
2
3
4
5
6
7
Num
ber o
f cla
ssro
oms
academic rooms student classroom ratios
47
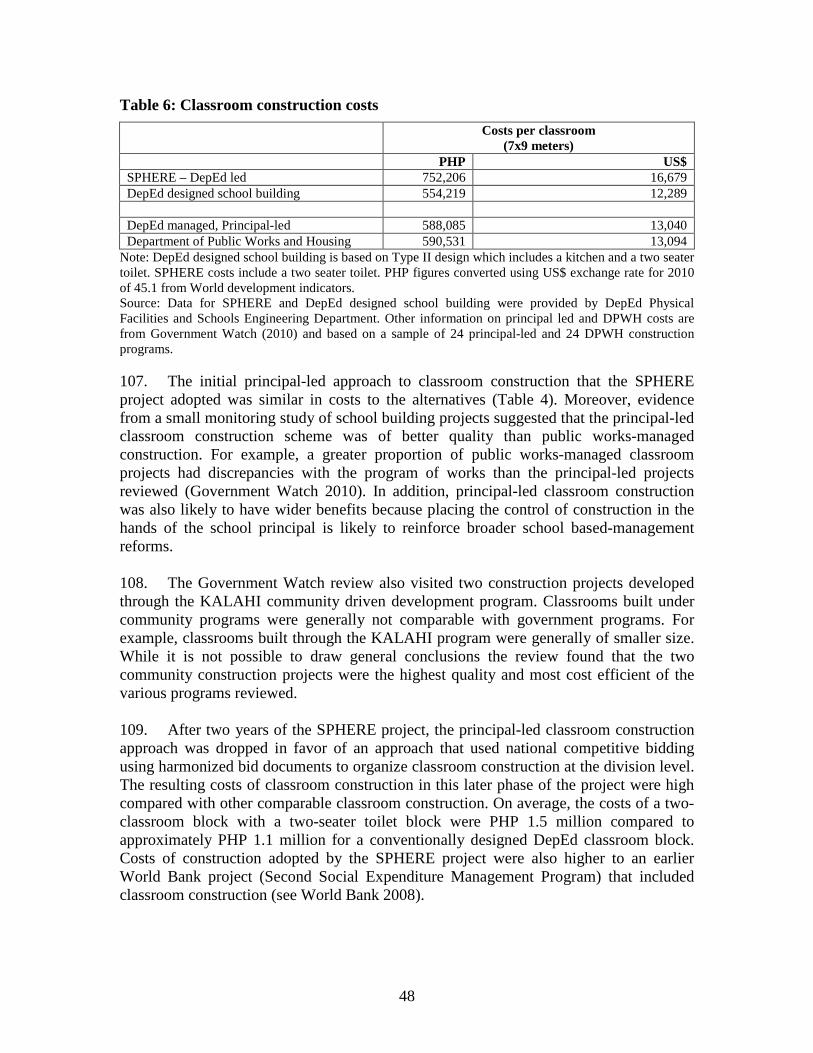
Table 6: Classroom construction costs
Costs per classroom (7x9 meters)
PHP US$ SPHERE – DepEd led 752,206 16,679 DepEd designed school building 554,219 12,289 DepEd managed, Principal-led 588,085 13,040 Department of Public Works and Housing 590,531 13,094
Note: DepEd designed school building is based on Type II design which includes a kitchen and a two seater toilet. SPHERE costs include a two seater toilet. PHP figures converted using US$ exchange rate for 2010 of 45.1 from World development indicators. Source: Data for SPHERE and DepEd designed school building were provided by DepEd Physical Facilities and Schools Engineering Department. Other information on principal led and DPWH costs are from Government Watch (2010) and based on a sample of 24 principal-led and 24 DPWH construction programs. 107. The initial principal-led approach to classroom construction that the SPHERE project adopted was similar in costs to the alternatives (Table 4). Moreover, evidence from a small monitoring study of school building projects suggested that the principal-led classroom construction scheme was of better quality than public works-managed construction. For example, a greater proportion of public works-managed classroom projects had discrepancies with the program of works than the principal-led projects reviewed (Government Watch 2010). In addition, principal-led classroom construction was also likely to have wider benefits because placing the control of construction in the hands of the school principal is likely to reinforce broader school based-management reforms. 108. The Government Watch review also visited two construction projects developed through the KALAHI community driven development program. Classrooms built under community programs were generally not comparable with government programs. For example, classrooms built through the KALAHI program were generally of smaller size. While it is not possible to draw general conclusions the review found that the two community construction projects were the highest quality and most cost efficient of the various programs reviewed. 109. After two years of the SPHERE project, the principal-led classroom construction approach was dropped in favor of an approach that used national competitive bidding using harmonized bid documents to organize classroom construction at the division level. The resulting costs of classroom construction in this later phase of the project were high compared with other comparable classroom construction. On average, the costs of a two-classroom block with a two-seater toilet block were PHP 1.5 million compared to approximately PHP 1.1 million for a conventionally designed DepEd classroom block. Costs of construction adopted by the SPHERE project were also higher to an earlier World Bank project (Second Social Expenditure Management Program) that included classroom construction (see World Bank 2008).
48
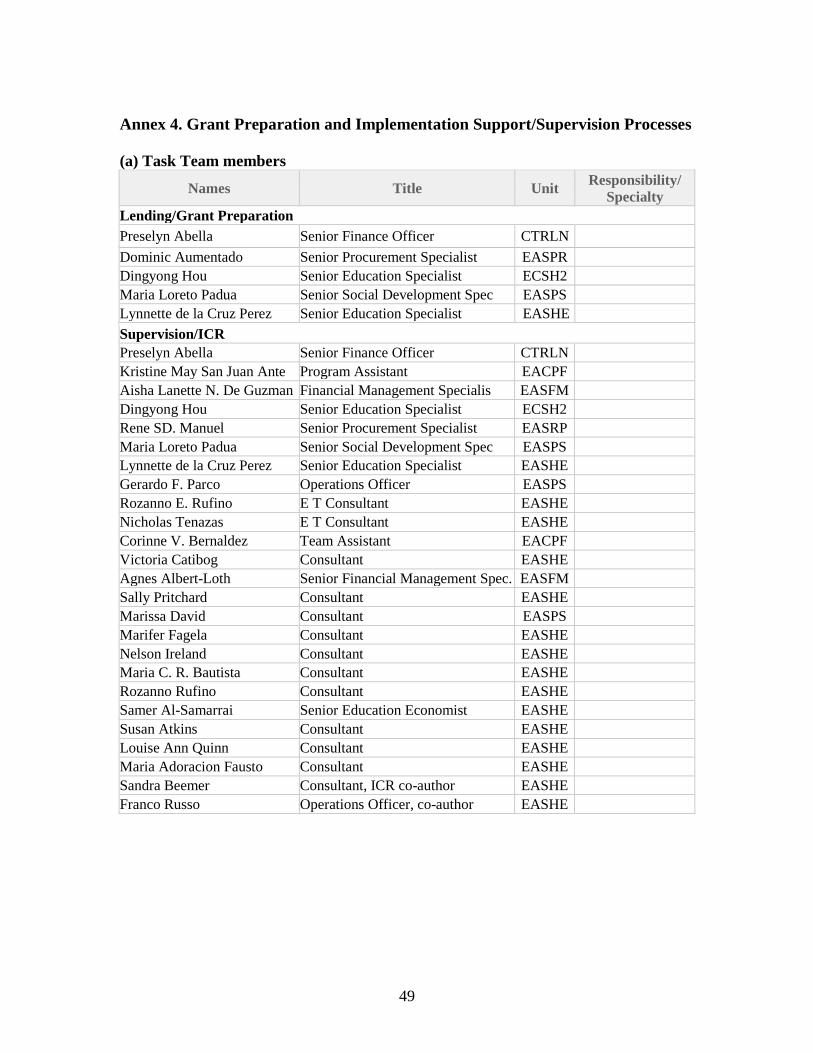
Annex 4. Grant Preparation and Implementation Support/Supervision Processes (a) Task Team members
Names Title Unit Responsibility/ Specialty
Lending/Grant Preparation Preselyn Abella Senior Finance Officer CTRLN Dominic Aumentado Senior Procurement Specialist EASPR Dingyong Hou Senior Education Specialist ECSH2 Maria Loreto Padua Senior Social Development Spec EASPS Lynnette de la Cruz Perez Senior Education Specialist EASHE
Supervision/ICR Preselyn Abella Senior Finance Officer CTRLN Kristine May San Juan Ante Program Assistant EACPF Aisha Lanette N. De Guzman Financial Management Specialis EASFM Dingyong Hou Senior Education Specialist ECSH2 Rene SD. Manuel Senior Procurement Specialist EASRP Maria Loreto Padua Senior Social Development Spec EASPS Lynnette de la Cruz Perez Senior Education Specialist EASHE Gerardo F. Parco Operations Officer EASPS Rozanno E. Rufino E T Consultant EASHE Nicholas Tenazas E T Consultant EASHE Corinne V. Bernaldez Team Assistant EACPF Victoria Catibog Consultant EASHE Agnes Albert-Loth Senior Financial Management Spec. EASFM Sally Pritchard Consultant EASHE Marissa David Consultant EASPS Marifer Fagela Consultant EASHE Nelson Ireland Consultant EASHE Maria C. R. Bautista Consultant EASHE Rozanno Rufino Consultant EASHE Samer Al-Samarrai Senior Education Economist EASHE Susan Atkins Consultant EASHE Louise Ann Quinn Consultant EASHE Maria Adoracion Fausto Consultant EASHE Sandra Beemer Consultant, ICR co-author EASHE Franco Russo Operations Officer, co-author EASHE
49

(b) Staff Time and Cost
Stage of Project Cycle
Staff Time and Cost* (Bank Budget Only)
No. of staff weeks USD Thousands
(including travel and consultant costs)
Lending FY08 13.53 14.65
FY09 2.99 3.46 Total: 16.52 18.11
Supervision/ICR
FY09 5.1 6.48 Total: 5.1 6.48
* A supervision trust fund was established to cover staff and consultant labor and travel expenditures. Over the period of FY09 – 14, staff labor amounted to 87.92 staff weeks, which is equivalent to US$177,300 in labor cost.
50

Annex 5. Beneficiary Survey Results Not applicable
51
Annex 6. Stakeholder Workshop Report and Results Not Applicable
52
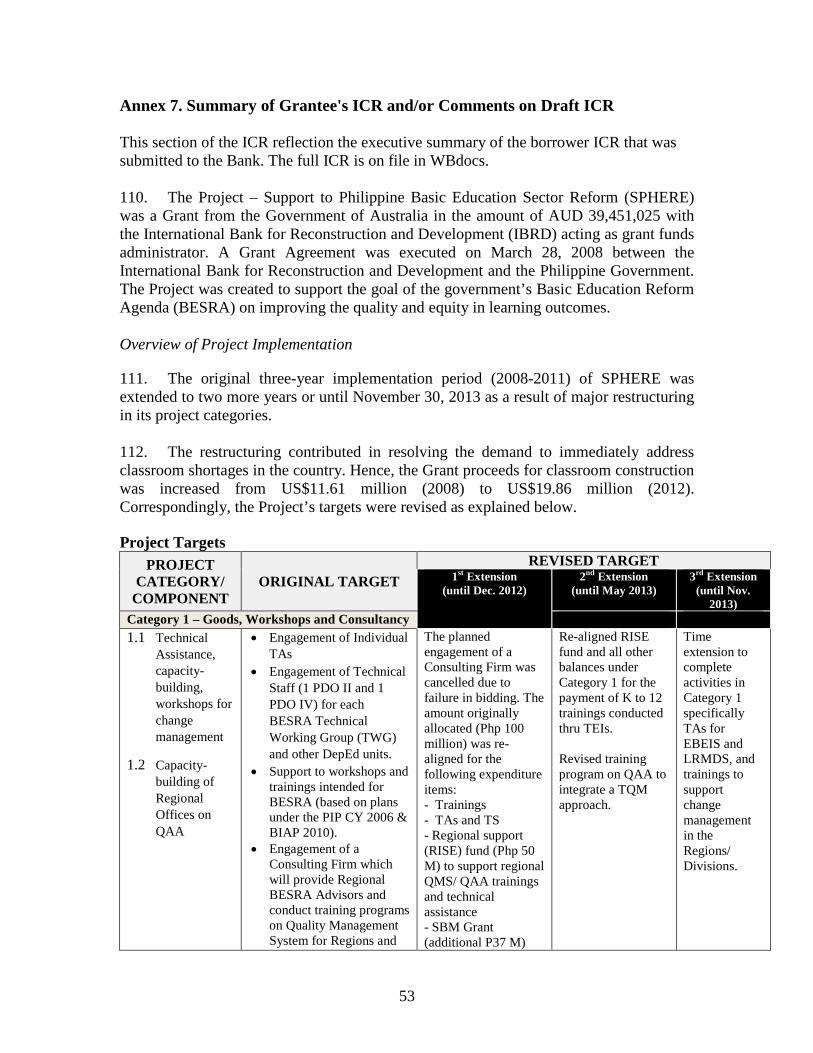
Annex 7. Summary of Grantee's ICR and/or Comments on Draft ICR This section of the ICR reflection the executive summary of the borrower ICR that was submitted to the Bank. The full ICR is on file in WBdocs. 110. The Project – Support to Philippine Basic Education Sector Reform (SPHERE) was a Grant from the Government of Australia in the amount of AUD 39,451,025 with the International Bank for Reconstruction and Development (IBRD) acting as grant funds administrator. A Grant Agreement was executed on March 28, 2008 between the International Bank for Reconstruction and Development and the Philippine Government. The Project was created to support the goal of the government’s Basic Education Reform Agenda (BESRA) on improving the quality and equity in learning outcomes. Overview of Project Implementation
111. The original three-year implementation period (2008-2011) of SPHERE was extended to two more years or until November 30, 2013 as a result of major restructuring in its project categories. 112. The restructuring contributed in resolving the demand to immediately address classroom shortages in the country. Hence, the Grant proceeds for classroom construction was increased from US$11.61 million (2008) to US$19.86 million (2012). Correspondingly, the Project’s targets were revised as explained below. Project Targets
PROJECT CATEGORY/
COMPONENT ORIGINAL TARGET
REVISED TARGET 1st Extension
(until Dec. 2012) 2nd Extension
(until May 2013) 3rd Extension
(until Nov. 2013)
Category 1 – Goods, Workshops and Consultancy 1.1 Technical
Assistance, capacity-building, workshops for change management
1.2 Capacity-building of Regional Offices on QAA
• Engagement of Individual TAs
• Engagement of Technical Staff (1 PDO II and 1 PDO IV) for each BESRA Technical Working Group (TWG) and other DepEd units.
• Support to workshops and trainings intended for BESRA (based on plans under the PIP CY 2006 & BIAP 2010).
• Engagement of a Consulting Firm which will provide Regional BESRA Advisors and conduct training programs on Quality Management System for Regions and
The planned engagement of a Consulting Firm was cancelled due to failure in bidding. The amount originally allocated (Php 100 million) was re-aligned for the following expenditure items: - Trainings - TAs and TS - Regional support (RISE) fund (Php 50 M) to support regional QMS/ QAA trainings and technical assistance - SBM Grant (additional P37 M)
Re-aligned RISE fund and all other balances under Category 1 for the payment of K to 12 trainings conducted thru TEIs. Revised training program on QAA to integrate a TQM approach.
Time extension to complete activities in Category 1 specifically TAs for EBEIS and LRMDS, and trainings to support change management in the Regions/ Divisions.
53
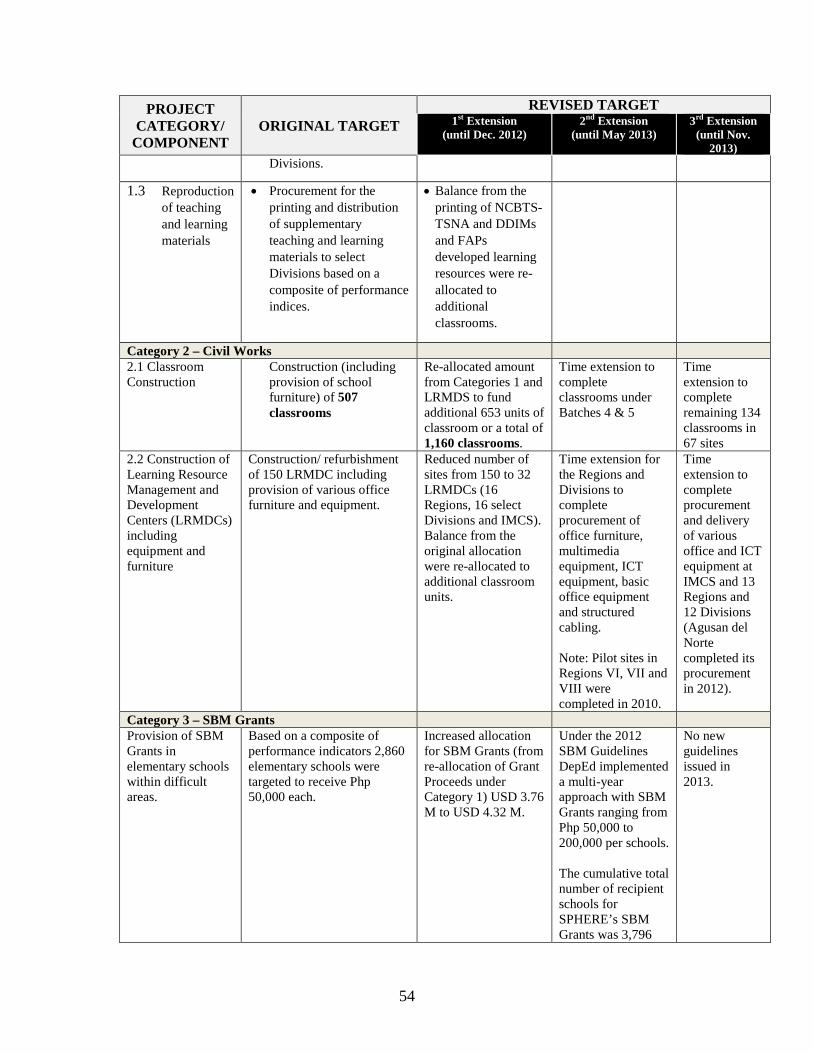
PROJECT CATEGORY/
COMPONENT ORIGINAL TARGET
REVISED TARGET 1st Extension
(until Dec. 2012) 2nd Extension
(until May 2013) 3rd Extension
(until Nov. 2013)
Divisions.
1.3 Reproduction of teaching and learning materials
• Procurement for the printing and distribution of supplementary teaching and learning materials to select Divisions based on a composite of performance indices.
• Balance from the printing of NCBTS-TSNA and DDIMs and FAPs developed learning resources were re-allocated to additional classrooms.
Category 2 – Civil Works 2.1 Classroom Construction
Construction (including provision of school furniture) of 507 classrooms
Re-allocated amount from Categories 1 and LRMDS to fund additional 653 units of classroom or a total of 1,160 classrooms.
Time extension to complete classrooms under Batches 4 & 5
Time extension to complete remaining 134 classrooms in 67 sites
2.2 Construction of Learning Resource Management and Development Centers (LRMDCs) including equipment and furniture
Construction/ refurbishment of 150 LRMDC including provision of various office furniture and equipment.
Reduced number of sites from 150 to 32 LRMDCs (16 Regions, 16 select Divisions and IMCS). Balance from the original allocation were re-allocated to additional classroom units.
Time extension for the Regions and Divisions to complete procurement of office furniture, multimedia equipment, ICT equipment, basic office equipment and structured cabling. Note: Pilot sites in Regions VI, VII and VIII were completed in 2010.
Time extension to complete procurement and delivery of various office and ICT equipment at IMCS and 13 Regions and 12 Divisions (Agusan del Norte completed its procurement in 2012).
Category 3 – SBM Grants Provision of SBM Grants in elementary schools within difficult areas.
Based on a composite of performance indicators 2,860 elementary schools were targeted to receive Php 50,000 each.
Increased allocation for SBM Grants (from re-allocation of Grant Proceeds under Category 1) USD 3.76 M to USD 4.32 M.
Under the 2012 SBM Guidelines DepEd implemented a multi-year approach with SBM Grants ranging from Php 50,000 to 200,000 per schools. The cumulative total number of recipient schools for SPHERE’s SBM Grants was 3,796
No new guidelines issued in 2013.
54
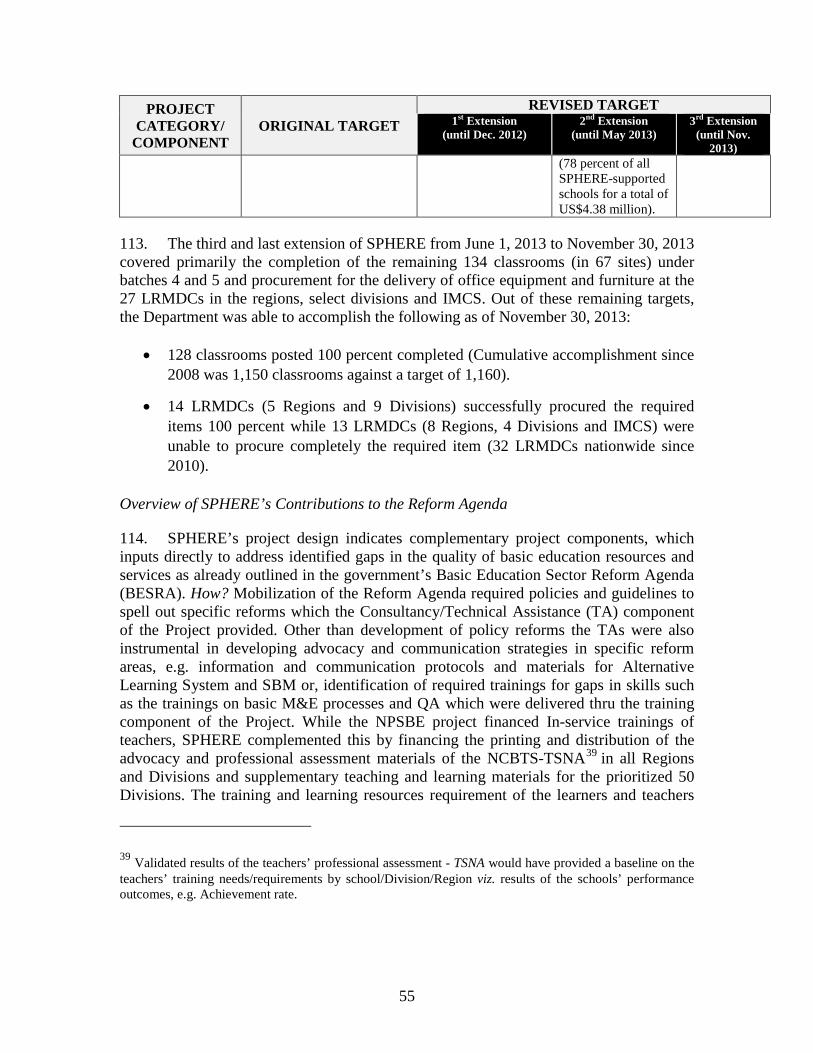
PROJECT CATEGORY/
COMPONENT ORIGINAL TARGET
REVISED TARGET 1st Extension
(until Dec. 2012) 2nd Extension
(until May 2013) 3rd Extension
(until Nov. 2013)
(78 percent of all SPHERE-supported schools for a total of US$4.38 million).
113. The third and last extension of SPHERE from June 1, 2013 to November 30, 2013 covered primarily the completion of the remaining 134 classrooms (in 67 sites) under batches 4 and 5 and procurement for the delivery of office equipment and furniture at the 27 LRMDCs in the regions, select divisions and IMCS. Out of these remaining targets, the Department was able to accomplish the following as of November 30, 2013:
• 128 classrooms posted 100 percent completed (Cumulative accomplishment since 2008 was 1,150 classrooms against a target of 1,160).
• 14 LRMDCs (5 Regions and 9 Divisions) successfully procured the required items 100 percent while 13 LRMDCs (8 Regions, 4 Divisions and IMCS) were unable to procure completely the required item (32 LRMDCs nationwide since 2010).
Overview of SPHERE’s Contributions to the Reform Agenda
114. SPHERE’s project design indicates complementary project components, which inputs directly to address identified gaps in the quality of basic education resources and services as already outlined in the government’s Basic Education Sector Reform Agenda (BESRA). How? Mobilization of the Reform Agenda required policies and guidelines to spell out specific reforms which the Consultancy/Technical Assistance (TA) component of the Project provided. Other than development of policy reforms the TAs were also instrumental in developing advocacy and communication strategies in specific reform areas, e.g. information and communication protocols and materials for Alternative Learning System and SBM or, identification of required trainings for gaps in skills such as the trainings on basic M&E processes and QA which were delivered thru the training component of the Project. While the NPSBE project financed In-service trainings of teachers, SPHERE complemented this by financing the printing and distribution of the advocacy and professional assessment materials of the NCBTS-TSNA39 in all Regions and Divisions and supplementary teaching and learning materials for the prioritized 50 Divisions. The training and learning resources requirement of the learners and teachers
39 Validated results of the teachers’ professional assessment - TSNA would have provided a baseline on the teachers’ training needs/requirements by school/Division/Region viz. results of the schools’ performance outcomes, e.g. Achievement rate.
55

were addressed through the establishment of Learning Resource Management and Development Centers in 16 Regions and 16 Divisions which are envisioned to immediately provide the following:
• access to quality supplementary teaching and learning materials in print or
thru the LRMDS portal or electronic copies;
• training facilities for teachers or curriculum specialists equipped with the necessary ICT and multimedia tools and,
• expertise and facilities in developing supplementary materials, e.g. e-books in MTB-MLE or K to 12 lesson guides in video format
115. The Project also funded about US$4.38 million worth of SBM Grants complementing the government-funded SBM grants by focusing on schools with approved School Improvement Plans (SIP) but are in difficult situations (conflict areas, high incidence of poverty and remotely located). Overall, SPHERE invested about 93.42 percent of its Grant proceeds to implement the Reform Agenda and the current priority goals of the Department more importantly on K to 12.
56

Annex 8. Comments of Cofinanciers and Other Partners/Stakeholders
57

Annex 9. List of Supporting Documents Department of Budget and Management (2013). 2013 People's Budget. Department of Education (DepEd) (2005). A Multi-Year Spending Plan for Philippine Education: Enrolment Projections and Cost Simulations under Alternative Growth and Reform Scenarios. Department of Education (DepEd) (2012a). Fact sheet. Department of Education (DepEd) (2012b). Medium term expenditure framework for basic education 2012-2017: enrollment projections and cost simulations under alternative scenarios. Department of Education (DepEd) (2013a). Fact sheet. Department of Education (DepEd) (2013b). Medium term expenditure framework for basic education 2014-2020: enrollment projections and cost simulations under alternative scenarios. Government Watch (2010). G-Watch monitoring of school building projects: consolidated report. Khattri, N., C. Ling, et al. (2010). The Effects of School-based Management in the Philippines: An Initial Assessment Using Administrative Data. Policy research working paper series. No. 5248, The World Bank. Theunynck, S. (2009). School Construction Strategies for Universal Primary Education in Africa: Should Communities Be Empowered to Build Their Schools? Washington D.C., The World Bank. World Bank (2008). Implementation and completion results report on the second social expenditure management project. World Bank and AusAID (2010). Philippines Basic Education Public Expenditure Review. World Bank and AusAID (2013). School Based Management in the Philippines: An Empirical Investigation. Yamauchi, F. (2014). "An alternative estimate of school-based management impacts on students' achievements: evidence from the Philippines." Journal of Development Effectiveness.
58
Yamauchi, F. and Y. Liu (2013). "Impacts of an Early Stage Education Intervention on Students' Learning Achievement: Evidence from the Philippines." Journal of Development Studies 49(2).
59

MAP
60