document of the world bank report no: icr2078...
TRANSCRIPT
Document of
The World Bank
Report No: ICR2078
IMPLEMENTATION COMPLETION AND RESULTS REPORT
(IDA-38670)
ON A
CREDIT
IN THE AMOUNT OF SDR 61.0 MILLION
(US$ 89.0 MILLION EQUIVALENT)
TO THE
REPUBLIC OF INDIA
FOR A
RAJASTHAN HEALTH SYSTEMS DEVELOPMENT PROJECT
March 28, 2012
Human Development Sector Unit
South Asia Region
Pub
lic D
iscl
osur
e A
utho
rized
Pub
lic D
iscl
osur
e A
utho
rized
Pub
lic D
iscl
osur
e A
utho
rized
Pub
lic D
iscl
osur
e A
utho
rized
Pub
lic D
iscl
osur
e A
utho
rized
Pub
lic D
iscl
osur
e A
utho
rized
Pub
lic D
iscl
osur
e A
utho
rized
Pub
lic D
iscl
osur
e A
utho
rized
ii
CURRENCY EQUIVALENTS
(Exchange Rate Effective 09/30/2011)
Currency Unit = Indian Rupee (INR)
US$ 1.00 = INR 49.06
FISCAL YEAR
April 1 – March 31
ABBREVIATIONS AND ACRONYMS
A-M Aide-Memoire
ANM Auxiliary Nurse-Midwife
ASHA Accredited Social Health Activist
BCC Behavior Change Communication
BPL Below Poverty Line
CAG Comptroller and Auditor-General
CAS Country Assistance Strategy
CHC Community Health Center
CTF Common Treatment Facility
DH District Hospital
DPC District Project Coordinator
EmOC Emergency Obstetric Care
FM Financial Management
GOI Government of India
GOR Government of Rajasthan
HAF Hospital Activity Format
HCWM Health Care Waste Management
HMIS Health Management Information System
HR Human Resources
HSIT Health System Improvement Team
ICR Implementation Completion Report
IDA International Development Association
IEC Information and Education Campaign
INR Indian Rupees
ISR Implementation Status Report
JSY Jonani Surakshi Yojana
M&E Monitoring and Evaluation
MoHFW Ministry of Health and Family Welfare
MCH Maternal and Child Health
MTR Mid-Term Review
NFHS National Family Health Survey
iii
NGO Non-Governmental Organization
NRHM National Rural Health Mission
PAD Project Appraisal Document
PDO Project Development Objective
PMU Project Management Unit
PPP Public-Private Partnership
PPR Procurement Post Review
PSA Procurement Support Agency
QAG Quality Assurance Group
QEA Quality-at-Entry Assessment
QER Quality Enhancement Review
RCH Reproductive and Child Health
RHSDP Rajasthan Health Systems Development
Project
Rs Rupees
SC Scheduled Caste
SIHFW State Institute of Health and Family Welfare
ST Scheduled Tribe
TOR Terms of Reference
TTL Task Team Leader
Vice President: Isabel M. Guerrero
Country Director: N. Roberto Zagha
Sector Director: Amit Dar (Acting)
Sector Manager: Julie McLaughlin
Project Team Leader: Patrick M. Mullen
ICR Team Leader & Author: Caryn Bredenkamp


iv
INDIA
Rajasthan Health Systems Development Project
TABLE OF CONTENTS
A. Basic Information ....................................................................................................... v B. Key Dates ................................................................................................................... v
C. Ratings Summary ....................................................................................................... v D. Sector and Theme Codes .......................................................................................... vi E. Bank Staff .................................................................................................................. vi F. Results Framework Analysis .................................................................................... vii
G. Ratings of Project Performance in ISRs .................................................................... x H. Restructuring (if any) ................................................................................................ xi
I. Disbursement Profile ................................................................................................. xi
1. Project Context, Development Objectives and Design ............................................................... 1
2. Key Factors Affecting Implementation and Outcomes ............................................................... 6
3. Assessment of Outcomes ........................................................................................................... 15
4. Assessment of Risk to Development Outcome ......................................................................... 23
5. Assessment of Bank and Borrower Performance ...................................................................... 24
6. Lessons Learned ........................................................................................................................ 27
7. Comments on Issues Raised by Borrower/Implementing Agencies/Partners ........................... 28
Annex 1. Project Costs and Financing .......................................................................................... 29
Annex 2. Outputs by Component .................................................................................................. 30
Annex 3. Economic and Financial Analysis .................................................................................. 34
Annex 4. Bank Lending and Implementation Support/Supervision Processes ............................. 36
Annex 5. Summary of Borrower's ICR and Comments on Draft ICR .......................................... 39
Annex 6. List of Supporting Documents ....................................................................................... 52
Annex 7. Additional Tables and Graphs ....................................................................................... 53
MAP .............................................................................................................................................. 56


v
A. Basic Information
Country: India Project Name:
India: Rajasthan Health
Systems Development
Project
Project ID: P050655 L/C/TF Number(s): IDA-38670
ICR Date: 03/28/2012 ICR Type: Core ICR
Lending Instrument: SIL Borrower: GOVERNMENT OF
INDIA
Original Total
Commitment: XDR 61.00M Disbursed Amount: XDR 52.40M
Revised Amount: XDR 54.13M
Environmental Category: B
Implementing Agencies:
Department of Medical, Health and Family Welfare, Government of Rajasthan
Cofinanciers and Other External Partners:
B. Key Dates
Process Date Process Original Date Revised / Actual
Date(s)
Concept Review: 11/16/2001 Effectiveness: 07/21/2004 07/21/2004
Appraisal: 04/16/2003 Restructuring(s):
09/04/2009
12/24/2009
09/11/2011
Approval: 03/11/2004 Mid-term Review: 07/21/2007 07/30/2007
Closing: 09/30/2009 09/30/2011
C. Ratings Summary
C.1 Performance Rating by ICR
Outcomes: Moderately Satisfactory
Risk to Development Outcome: Moderate
Bank Performance: Moderately Satisfactory
Borrower Performance: Moderately Satisfactory
C.2 Detailed Ratings of Bank and Borrower Performance (by ICR)
Bank Ratings Borrower Ratings
Quality at Entry: Moderately Satisfactory Government: Moderately Satisfactory
Quality of Supervision: Satisfactory Implementing
Agency/Agencies: Moderately Satisfactory
Overall Bank
Performance: Moderately Satisfactory
Overall Borrower
Performance: Moderately Satisfactory

vi
C.3 Quality at Entry and Implementation Performance Indicators
Implementation
Performance Indicators
QAG Assessments
(if any) Rating
Potential Problem Project
at any time (Yes/No): No
Quality at Entry
(QEA): Moderately Satisfactory
Problem Project at any
time (Yes/No): Yes
Quality of
Supervision (QSA): None
DO rating before
Closing/Inactive status:
Moderately
Satisfactory
D. Sector and Theme Codes
Original Actual
Sector Code (as % of total Bank financing)
Compulsory health finance 10 10
Health 60 60
Non-compulsory health finance 10 10
Other social services 10 10
Sub-national government administration 10 10
Theme Code (as % of total Bank financing)
Child health 20 20
Health system performance 40 40
Other communicable diseases 20 20
Population and reproductive health 20 20
E. Bank Staff
Positions At ICR At Approval
Vice President: Isabel M. Guerrero Praful C. Patel
Country Director: N. Roberto Zagha Michael F. Carter
Sector Manager: Julie McLaughlin Anabela Abreu
Project Team Leader: Patrick M. Mullen Sadia Afroze Chowdhury
ICR Team Leader: Caryn Bredenkamp
ICR Primary Author: Caryn Bredenkamp
vii
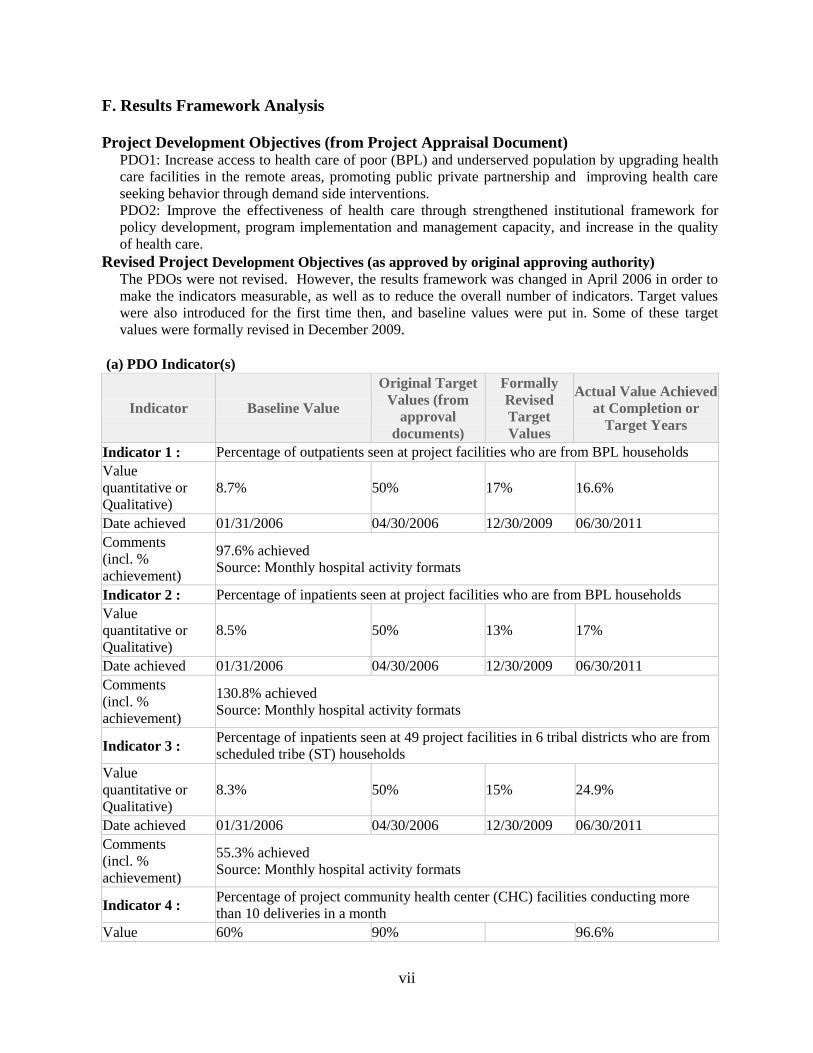
F. Results Framework Analysis
Project Development Objectives (from Project Appraisal Document) PDO1: Increase access to health care of poor (BPL) and underserved population by upgrading health
care facilities in the remote areas, promoting public private partnership and improving health care
seeking behavior through demand side interventions.
PDO2: Improve the effectiveness of health care through strengthened institutional framework for
policy development, program implementation and management capacity, and increase in the quality
of health care.
Revised Project Development Objectives (as approved by original approving authority)
The PDOs were not revised. However, the results framework was changed in April 2006 in order to
make the indicators measurable, as well as to reduce the overall number of indicators. Target values
were also introduced for the first time then, and baseline values were put in. Some of these target
values were formally revised in December 2009.
(a) PDO Indicator(s)
Indicator Baseline Value
Original Target
Values (from
approval
documents)
Formally
Revised
Target
Values
Actual Value Achieved
at Completion or
Target Years
Indicator 1 : Percentage of outpatients seen at project facilities who are from BPL households
Value
quantitative or
Qualitative)
8.7% 50% 17% 16.6%
Date achieved 01/31/2006 04/30/2006 12/30/2009 06/30/2011
Comments
(incl. %
achievement)
97.6% achieved
Source: Monthly hospital activity formats
Indicator 2 : Percentage of inpatients seen at project facilities who are from BPL households
Value
quantitative or
Qualitative)
8.5% 50% 13% 17%
Date achieved 01/31/2006 04/30/2006 12/30/2009 06/30/2011
Comments
(incl. %
achievement)
130.8% achieved
Source: Monthly hospital activity formats
Indicator 3 : Percentage of inpatients seen at 49 project facilities in 6 tribal districts who are from
scheduled tribe (ST) households
Value
quantitative or
Qualitative)
8.3% 50% 15% 24.9%
Date achieved 01/31/2006 04/30/2006 12/30/2009 06/30/2011
Comments
(incl. %
achievement)
55.3% achieved
Source: Monthly hospital activity formats
Indicator 4 : Percentage of project community health center (CHC) facilities conducting more
than 10 deliveries in a month
Value 60% 90% 96.6%

viii
quantitative or
Qualitative)
Date achieved 01/31/2006 04/30/2006 06/30/2011
Comments
(incl. %
achievement)
107.3% achieved
Source: CHC MIS
Data include both CHCs and upgraded PHCs
Indicator 5 : Percentage of upgraded First Referral Units (FRUs) offering 24 hour CEmOC
Value
quantitative or
Qualitative)
0 25%
Date achieved 04/11/2004 04/11/2004
Comments
(incl. %
achievement)
This indicator was not monitored by the project since activities taken over by
NRHM. However, it was not formally dropped as a PDO indicator, either.
Indicator 6 : Percentage of clients (patients and non-patients) satisfied with the services received
at project facilities
Value
quantitative or
Qualitative)
92% were satisfied with
doctors; 85% were
satisfied with nurses
"Increasing
satisfaction"
94% were satisfied with
doctors; 72% were
satisfied with nurses
Date achieved 09/30/2008 04/30/2006 09/30/2011
Comments
(incl. %
achievement)
100% achieved for doctors; not achieved for nurses.
Indicator 7 : Percentage of the following categories staffed in project facilities: (i) Doctors, (ii)
Nurses/ANMs, (iii) Lab Technicians
Value
quantitative or
Qualitative)
Doctors: 59.8%
Nurses/ANMs: 89.5%
Lab Technicians: 105.4%
90%
Doctors: 64.3%
Nurses/ANMs: 117%
Lab Technicians:
91.5%
Date achieved 05/31/2006 04/30/2006 06/30/2011
Comments
(incl. %
achievement)
Doctors: 71.4% achieved
Nurses/ANMs: 130% achieved
Lab Technicians: 101.7% achieved
(b) Intermediate Outcome Indicator(s)
Indicator Baseline Value
Original Target
Values (from
approval
documents)
Formally
Revised
Target Values
Actual Value
Achieved at
Completion or Target
Years
Indicator 1 : Percentage of project facilities reporting (paper-based) monthly HMIS reports
Value
(quantitative
or Qualitative)
20% 100% 90.3%
Date achieved 04/30/2006 04/30/2006 06/30/2011
Comments
(incl. %
achievement)
90.3% achieved
Indicator 2 : Percentage of clinical training completed according to plan

ix
Value
(quantitative
or Qualitative)
0% 80% 64%
Date achieved 04/30/2006 04/30/2006 09/30/2011
Comments
(incl. %
achievement)
80% achieved
Indicator 3 : Percentage of facilities upgraded/renovated of 238 project facilities
Value
(quantitative
or Qualitative)
0% 100% 100%
Date achieved 04/30/2006 04/30/2006 09/30/2011
Comments
(incl. %
achievement)
100% achieved
Indicator 4 : Percentage of health facilities: (i) initiating their health care waste management
(HCWM) plan, and (ii) completing the implementation of their HCWM plan
Value
(quantitative
or Qualitative)
(i) 0%
(ii) 0%
(i)100% project,
100% all
secondary;
(ii)100% project,
65% all secondary
(i)100% project, 82%
all secondary; (ii)100%
project, n/a all
secondary
Date achieved 04/30/2006 04/30/2006 09/30/2011
Comments
(incl. %
achievement)
(i) 100%, 82% achieved; (ii) 100% achieved, n.a. Data not available on HCWM
implementation in non-project facilities
Indicator 5 : Percentage of drugs that are in stock of the 15 vital/essential drugs across all project
facilities in a quarter
Value
(quantitative
or Qualitative)
69% 80% 86%
Date achieved 03/03/2008 04/30/2006 06/30/2011
Comments
(incl. %
achievement)
107.5% achieved. Source: stock register.
Target value precedes baseline because entire results framework revised in 2006
Indicator 6 : Percentage of facilities where health systems improvement teams (HSIT) have met
once a month
Value
(quantitative
or Qualitative)
0% 70% 85.3%
Date achieved 01/31/2006 04/30/2006 06/30/2006
Comments
(incl. %
achievement)
121.9% achieved
Source: DPC reports
Indicator 7 : Percentage change in inpatients in upgraded facilities with IEC interventions as
compared to inpatients in the same facilities in the same month in 2005
Value
(quantitative 0%

x
or Qualitative)
Date achieved 04/30/2006
Comments
(incl. %
achievement)
Targets never set
Data neither currently available nor ever monitored
Indicator 8 : Percentage of project facilities that have a social worker (counselor)
Value
(quantitative
or Qualitative)
0% 90% 100%
Date achieved 04/30/2006 04/30/2006 06/30/2011
Comments
(incl. %
achievement)
111% achieved
Source: MRS records
Indicator 9 : Percentage of project facilities (RMRSs) receiving payment of equity fund
Value
(quantitative
or Qualitative)
0% 90% 100%
Date achieved 04/30/2006 04/30/2006 03/31/2010
Comments
(incl. %
achievement)
111% achieved
Source: PMU
Equity funds were stopped after Mar 2010
Indicator 10 : Number of service delivery contracts with NGOs and private sector
Value
(quantitative
or Qualitative)
0
Date achieved 04/30/2006
Comments
(incl. %
achievement)
n/a. The project moved away from undertaking the execution of service delivery
contracts, but did not revise the results framework. No data collected.
Indicator 11 : Percentage of the following categories staffed in tribal areas: (i) Doctors, (ii)
Nurses/ANMs, (iii) Laboratory Technicians
Value
(quantitative
or Qualitative)
(i) 49.6%
(ii) 90%
(iii) 91%
(i) 90%
(ii) 90%
(iii) 90%
(i) 47.3%
(ii) 108%
(iii) 66.7%
Date achieved 05/31/2006 04/30/2006 06/30/2011
Comments
(incl. %
achievement)
(i) 52.6% achieved
(ii) 120% achieved
(iii) 74.1% achieved
G. Ratings of Project Performance in ISRs
No. Date ISR
Archived DO IP
Actual Disbursements
(USD millions)
1 06/18/2004 Satisfactory Satisfactory 0.00
2 12/19/2004 Satisfactory Satisfactory 4.00
3 06/27/2005 Moderately Satisfactory Moderately Satisfactory 4.45
4 12/23/2005 Moderately Satisfactory Moderately Unsatisfactory 5.83
5 06/26/2006 Moderately Satisfactory Moderately Satisfactory 12.73

xi
6 12/15/2006 Moderately Satisfactory Moderately Satisfactory 18.81
7 05/08/2007 Moderately Satisfactory Moderately Satisfactory 22.60
8 10/18/2007 Moderately Satisfactory Moderately Satisfactory 29.33
9 04/09/2008 Moderately Satisfactory Moderately Satisfactory 39.36
10 10/16/2008 Moderately Satisfactory Moderately Satisfactory 46.34
11 04/15/2009 Moderately Satisfactory Moderately Satisfactory 52.68
12 11/30/2009 Moderately Satisfactory Moderately Satisfactory 55.21
13 06/09/2010 Moderately Satisfactory Satisfactory 62.89
14 01/15/2011 Moderately Satisfactory Satisfactory 68.55
15 09/21/2011 Satisfactory Moderately Satisfactory 73.52
16 01/03/2012 Moderately Satisfactory Moderately Satisfactory 75.72
H. Restructuring (if any)
Restructuring
Date(s)
Board
Approved
PDO Change
ISR Ratings at
Restructuring
Amount
Disbursed at
Restructuring
in USD
millions
Reason for Restructuring & Key
Changes Made DO IP
09/04/2009 N MS MS 53.42 Extension of 24 months
12/24/2009 N MS MS 56.42 Revision of PDO 1 targets; deletion
of one covenant
09/11/2011 MS S 73.52 Credit cancellation of US$11 million
I. Disbursement Profile

1
1. Project Context, Development Objectives and Design
1.1 Context at Appraisal
1. The decade preceding project appraisal in 2003 was one of rapid economic growth in
India, with average annual growth of 6% between 1993 and 2002. Meanwhile, real per capita
GDP grew from US$336 to US$479 over the same period, suggestive of rising living standards
(World Development Indicators 2011). Rajasthan, the state on which this project focused had a
per capita GNI of around four-fifths of the India average and exhibited substantial regional
disparities.
2. According to official government data from the Directorate of Economics and Statistics
(2001), Rajasthan was one of India‟s more populous states (56.5 million), less than one quarter
(23.4%) households lived in urban areas and 40% lived in the remote, western desert areas that
were subject to seasonal migration and the nomadic movements. Scheduled Tribes (ST)
constituted 12.6 % and Scheduled Castes (SC) constituted 17.3% of the population, compared to
8.2% and 16.5% of the population respectively in all India. The Census of 2001 found that both
income inequality and gender inequality were major issues, with 15.3% of households living
below the poverty line and a sex ratio of 921 women per 1,000 men (Government of India 2001).
3. The epidemiological profile was one in which communicable diseases and perinatal and
maternal mortality accounted for about 50 percent of the deaths in the state (Government of India
2003). On most, if not all, critical measures of health status (such as an infant mortality and
under-nutrition) and of health care utilization (such as antenatal care utilization, institutional
delivery and immunization coverage), Rajasthan performed below the national average. Moreover,
within the state there were large inequalities in health outcomes and access to care: scheduled
castes and scheduled tribes were worse off than other castes, and the poor lagged far behind the
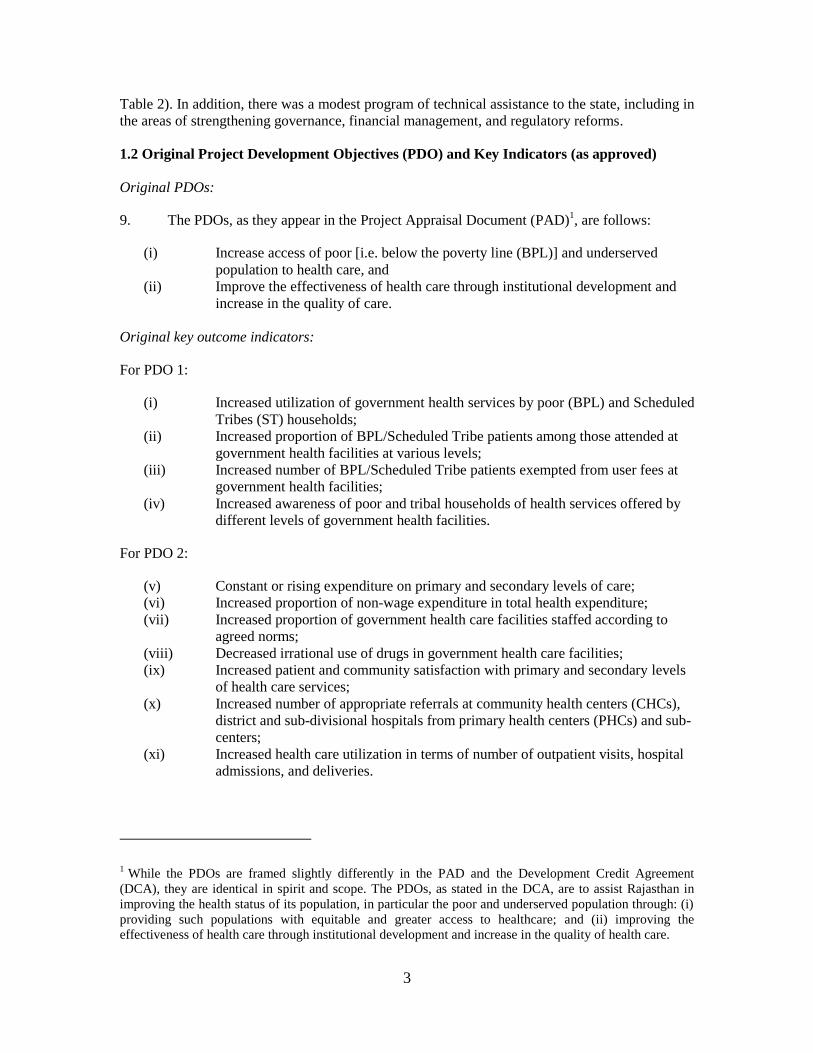
relatively well-off. Data are presented in Table 1.
Table 1: Health indicators, 1998/99 for India and Rajasthan, disaggregated by caste and by quintile
Rajasthan
Caste Wealth Index
Indicator India State
average
SC ST General
castes
Quintile 1 Quintile 5
Total fertility rate 2.9 3.8 3.6 3.7 2.8 4.5 2.1
Infant mortality rate 67.6 80.4 65.3 38.4 44.7 56.5 34.5
Three or more antenatal
visits
44% 23% 38.7% 28.6% 53.5% 19.9% 80.8%
Institutional delivery 33.6% 21.5% 19.6% 24.7% 44.1% 12.8% 75.6%
Full immunization
coverage
42% 35.8% 35.8% 3.3% 40% 13.1% 51.3%
Source: National Family Health Survey (NFHS) data, 1998/99.
4. Specific health system challenges at the time of appraisal included inadequate
institutional arrangements and weak program management; the low quality of services in both
public and private sectors; ineffective targeting of public funds to the poor; an inadequate
framework for engaging the private sector; low efficiency; and, limited financial resources.
Furthermore, the health system was characterized by insufficient integration of health, family
welfare and disease control programs, as well as inadequate coordination and integration at
2
different service delivery levels. Lack of adequate and trained manpower and weak management
of human resources was a statewide concern, especially in the tribal and hard-to-reach areas.
5. At the time of appraisal, the resources available to address the above-mentioned
challenges were constrained and investment in the health sector had been declining for decades.
The health share of the Rajasthan state budget fell from over 8% in 1980/81 to 6.6% in 1997/98
to 5.4% in 2000/01 to 4.5% in 2003/04 (Reserve Bank of India data). Even as a share of total
social expenditure, the health sector share had been declining (see Annex 7, Figure1).
Recipient’s policies, strategies, commitment and actions
6. The RHSDP was to be implemented in one of the Indian government‟s priority states. In
2001, the Ministry of Health and Family Welfare identified Rajasthan as one of the eight
“Empowered Action Group” (EAG) states that would benefit from targeted reforms and programs
(on the basis of its large population and its very poor health indicators). The state‟s “Health
Vision for Rajasthan 2025” articulated the following goals: reduce IMR to below 30 by 2025,
reduce MMR to below 100 by 2025, increase delivery by skilled attendants to 85% by 2010,
increase immunization coverage to 90% by 2010 and increase the tuberculosis treatment rate to
85% by 2010. The “Health Sector Policy Matrix”, prepared by the Government of Rajasthan to
more clearly articulate its health sector priorities and inform project preparation, emphasized
increasing financing and improving resource allocation in the health sector, strengthening
capacity for management, planning and coordination, enhancing participation of the private and
voluntary sectors, increasing access and equity of access to health care, cost-sharing and
sustainability, providing incentives to the workforce and redressing regional imbalances
(including disparities in tribal and remote districts). The government‟s commitment to these areas
is further evidenced by the reforms that were ongoing at the time of preparation, including
subsidies to BPL patients, contracting out specialized services, overcoming medical staff
shortages in rural areas, and creating an enabling environment for partnership with the private
sector.
Rationale for Bank involvement:
7. The 2002-2004 Country Assistance Strategy (CAS) provided the framework for project
design and engagement. The CAS supported the objective of developing more efficient and
effective health prevention and care systems at the state level that would better serve the needs of
the poor. Additional 2002 CAS objectives supported by the project included enhancing the role of
the private sector in achieving important public health goals, improving governance, and
enhancing community participation and empowerment.
Related projects
8. Within the health sector in India, there were a number of state-level “health systems
strengthening” projects under implementation when RHSDP was being prepared (see Annex 7
Table 1). The RHSDP was considered the first of the “second generation” of health system
strengthening projects, incorporating lessons learned from the preparation and implementation of
earlier projects in Andhra Pradesh, Maharashtra, Orissa and the multi-state project in Karnataka,
Punjab and Tamil Nadu that were approved in the late 1990s. Other state health projects followed
in Tamil Nadu, Karnataka and Uttar Pradesh. These health system strengthening projects were
complemented by support to the national programs and disease-specific initiatives. In other
sectors, the Bank portfolio in Rajasthan at the time of appraisal included primary education,
district poverty initiatives, water sector restructuring, and power sector restructuring (see Annex 7
3
Table 2). In addition, there was a modest program of technical assistance to the state, including in
the areas of strengthening governance, financial management, and regulatory reforms.
1.2 Original Project Development Objectives (PDO) and Key Indicators (as approved)
Original PDOs:
9. The PDOs, as they appear in the Project Appraisal Document (PAD)1, are follows:
(i) Increase access of poor [i.e. below the poverty line (BPL)] and underserved
population to health care, and
(ii) Improve the effectiveness of health care through institutional development and
increase in the quality of care.
Original key outcome indicators:
For PDO 1:
(i) Increased utilization of government health services by poor (BPL) and Scheduled
Tribes (ST) households;
(ii) Increased proportion of BPL/Scheduled Tribe patients among those attended at
government health facilities at various levels;
(iii) Increased number of BPL/Scheduled Tribe patients exempted from user fees at
government health facilities;
(iv) Increased awareness of poor and tribal households of health services offered by
different levels of government health facilities.
For PDO 2:
(v) Constant or rising expenditure on primary and secondary levels of care;
(vi) Increased proportion of non-wage expenditure in total health expenditure;
(vii) Increased proportion of government health care facilities staffed according to
agreed norms;
(viii) Decreased irrational use of drugs in government health care facilities;
(ix) Increased patient and community satisfaction with primary and secondary levels
of health care services;
(x) Increased number of appropriate referrals at community health centers (CHCs),
district and sub-divisional hospitals from primary health centers (PHCs) and sub-
centers;
(xi) Increased health care utilization in terms of number of outpatient visits, hospital
admissions, and deliveries.
1 While the PDOs are framed slightly differently in the PAD and the Development Credit Agreement
(DCA), they are identical in spirit and scope. The PDOs, as stated in the DCA, are to assist Rajasthan in
improving the health status of its population, in particular the poor and underserved population through: (i)
providing such populations with equitable and greater access to healthcare; and (ii) improving the
effectiveness of health care through institutional development and increase in the quality of health care.

4
1.3 Revised PDO (as approved by original approving authority) and Key Indicators, and
reasons/justification
10. The PDOs were not revised. However, the key results indicators were revised to a set of
seven PDO indicators and 11 intermediate outcome indicators in 2006 because the original
indicators were considered too numerous (11 outcome indicators, 32 intermediate outcome
indicators), many did not satisfy “SMART” measurement criteria2, and a number still lacked
baseline data (see section 2.3 for details) and targets. This was mutually agreed by the Bank and
Government and recorded in the Aide-Memoire of April 20063.
Revised indicators for PDO 1:
(i) Percentage of BPL populations among outpatients seen at all project facilities,
i.e. district (DH) and sub-divisional hospitals (SDH and CHC);
(ii) Percentage of BPL among inpatients seen at all project facilities;
(iii) Percentage of ST populations among inpatients seen at all 49 project facilities in
six tribal districts, i.e. at district (DH) and sub-divisional hospitals (SDH and
CHC) in six tribal districts.
Revised indicators for PDO 2:
(iv) Percentage of CHCs conducting >10 deliveries in a month;
(v) Percentage of upgraded first referral units (FRUs) offering 24 hr EmOC;
(vi) Percentage of clients (patient and non-patient) satisfied with the services received
at the project facilities;
(vii) Percentage of the following categories staffed in project facilities (a) Doctors, (b)
Nurses/ANMs and (c) Lab technicians.
11. These indicators remained in place for the remainder of the project. However, the targets
for the three PDO 1 indicators were subsequently revised downwards from their 2006 levels
during a November 2009 restructuring (see section 2.3 for details).
1.4 Main Beneficiaries
12. The beneficiaries included the entire state population that would access health care at
primary and, especially, secondary-level government health facilities, but with a special emphasis
on poor and tribal households. In fact, PDO 1 focused explicitly on the well-being of the “poor”
and “under-served” populations, concepts that the project operationalized as households below
the poverty line (BPL) or with scheduled tribe (ST) designation. 238 project facilities (including
at least one hospital or community health center per block) were identified for renovation and
refurbishment investments, but with additional facilities also benefiting from some of the “soft”
investments, such as training, health care waste management interventions and HMIS
improvement. Quantitatively, the project was expected to directly benefit an additional three
million outpatients and 34,000 in-patients annually through the expansion of services, as well as
an existing 10 million outpatients and 300,000 in-patients annually from improvements in the
2 A “SMART” indicator is Specific, Measurable, Achievable, Relevant and Time-bound.
3 At that time, a change in the outcome indicators did not require formal Board approval.

5
quality of services. Strengthening of government institutions involved in health policy and
planning was also envisaged.
1.5 Original Components (as approved)
13. Component One: Project management, policy development and capacity-building
(US$19.32 million appraised). This component was to support the establishment of a Strategic
Planning Cell to build institutional capacity for health policy development and planning. It was to
improve state capacity for public-private partnerships (PPPs), develop a regulatory framework for
the provision of quality health care in the private sector, build health management information
systems, and conduct clinical and managerial training. This component was to also support
overall project implementation through the establishment and operationalization of the following
bodies: a State Empowered Committee, Project Steering Committee and Project Management
Unit (PMU) at the state level, as well as Project Coordination and Monitoring Committees and
District Project Management Cells (DPMC) at the district level.
14. Component Two: Development of Primary and Secondary Health Care Services in the
Public Sector (US$50.41 million appraised). This component was to support the strengthening of
28 district hospitals, 23 sub-district hospitals, 185 community health centers, and 2 block-level
primary health centers. First, there were to be investments in infrastructure (including the
renovation of facilities and construction of specialized wards/units) and provision of equipment,
furniture, drugs, medical supplies, as well as HMIS and IEC materials. Second, there were to be
“soft” investments to improve the clinical quality of care through the development of clinical
protocols, strengthened drug prescribing practices, stronger M&E systems, and improved referral
mechanisms. This component was also to be responsible for the institutionalization of facility-
based health care waste management protocols and practices.
15. Component Three: Health Care Innovations for the Disadvantaged (US$31.92 million
appraised). This component was to improve the access (including geographical, financial and
social access) of disadvantaged populations (namely SC, ST and BPL populations) to secondary
health care. This was to be achieved through the targeted operationalization of an IEC strategy,
outreach camps, leveraging traditional systems of care for provision of essential medical services,
and piloting various initiatives designed to improve access to care.
1.6 Revised Components
16. The project components were not revised. However, existing activities were realigned at
Mid-Term Review in 2007 in order to respond to the changing health sector environment and,
during the two year extension phase, some new activities were added. This will be discussed in
section 2.2.
1.7 Other significant changes
17. The RHSDP was approved on March 11, 2004 (SDR 61 million, US$89 million) for five
years six months with an original closing date of Sept 30, 2009.
18. Extension and reallocation (Sept 2009): On September 4, 2009, the project was extended
by two years until September 30, 2011. The extension, which would utilize the US$29 million
unspent credit, was intended to continue funding for planned activities, but also support some
additional activities and inputs (see section 2.2). The large unspent credit was a result of several
factors, including a partial completion of planned activities (especially on Component 3),

6
strengthening of the dollar (from Rs 45.23/US$ in March 2004 to Rs 48.87/US$ in Sept 2009),
and savings on the procurement of goods, works and consultancies. Extension also involved a
reallocation of 13.8% of the credit across categories, towards civil works (mainly due to an
increase in the costs of steel, cement and other raw materials) and away from training and
workshops (since the government no longer wanted to support international training). See Table
for the change in expenditure across components and Table for the changes in allocations across
expenditure categories during implementation (Annex 1).
19. Level II restructuring – revision of PDO targets and deletion of covenant (Dec 2009): In
December 2009, the project was restructured in order to (i) revise the targets of the indicators of
PDO 1 to more realistic targets (see section 2.3) and (ii) delete the covenant on the “development
of a regulatory framework for the private sector” since the Clinical Establishment Act (eventually
passed in May 2010) was being drafted at the national level and would be reflected in state-level
legislation.
20. Level II restructuring – cancellation of credit (Sept 2011): Two weeks before project
closing, at 78.6% disbursement, the project underwent a Level II restructuring in order to cancel
SDR 6.875 million (US$11 million) from the credit, reducing the final credit amount to SDR
54.125 (US$84.5 million). The unspent credit mainly reflected partial completion of a number of
project activities planned for the extension phase, but also savings from exchange rate
fluctuations.
21. There were no other major changes to the project design, scope, scale, implementation
arrangements or schedule during the course of implementation that were not envisaged at project
design. Within the scope of the original PDO and design, however, there were some shifts in
emphasis during implementation that will be discussed in Section 2.
2. Key Factors Affecting Implementation and Outcomes
2.1 Project Preparation, Design and Quality at Entry
22. The scope for engagement was defined by the 2002 CAS and government priorities
(described in section 1.1) and the project was well-aligned with them. In particular, it dovetailed
well with the CAS‟s emphases on reaching the poor and engaging the private sector, as well as
the government‟s emphasis on addressing the needs of vulnerable groups (including BPL and
tribal populations), especially in Rajasthan which the national government considered a focus
state.
23. The development objectives were highly relevant and clearly-stated. The emphasis on
reaching the poor and reducing inequalities in access to care (PDO 1) was highly appropriate
given the high degree of inequality across castes and income groups (see Table 1) and the focus
on improving the quality of care (PDO 2) were essential due to years of underinvestment in health
care infrastructure and processes by the state, and the resultant health system challenges described
in section 1.1.
24. The design used to achieve these objectives was a combination of traditional input-based
investment (e,g. renovation, construction, provision of equipment, clinical training, PMU-
strengthening) and new generation health system strengthening interventions and innovations (e.g.
institutional capacity-building, health information systems, public-private partnerships,
managerial training, health care waste management, and innovations/ interventions to reach poor
and vulnerable households). The traditional inputs of the project were appropriate and sorely
7
needed, while the new generation activities served to maximize the returns to investment in these
inputs and strengthen health system institutions and processes, e.g. through Health System
Improvement Teams (HSITs), investment in health care waste management (HCWM) and
training. The project design was also appropriate to address the particular characteristics of
Rajasthan‟s health system (e.g. the large share of the private sector in health service delivery) and
its socioeconomic profile (e.g. the large share of ST households). On balance, the design was not
overly complex and could be feasibly implemented within the project period, given prevailing
capacity.
25. The project design also reflected lessons learned from the experience of previous
projects4, including the importance of improving sectoral planning and program management,
targeting the poor and vulnerable (including those living in remote areas), involving the private
sector, and enhancing the quality of care. To complement these lessons, many studies and
assessments were undertaken during project preparation in order to provide the analytical basis
for project design, as well as provide opportunities for participation in the design by the potential
beneficiaries5.
26. Good consideration was given in project design to both issues of sustainability and to risk
mitigation. Project expenditure was set at levels that were considered to be financially sustainable
(with the appropriate supporting calculations undertaken) and the design incorporated plans to
slowly internalize and institutionalize a number of the project activities, such as HCWM
processes and the Health Management Information System (HMIS) strengthening activities.
Attempts were made to mitigate the risk of slow procurement, and hence disbursement, by
extensive preparation of procurement plans and related documents6. Measures were also put in
place to help to ensure that there was no disruption in the flow of funds. One risk for which there
was no sound mitigation strategy, and about which the team should have been more concerned
given past project experience, was human resources – both at the facility level and in the PMU.
Indeed, staffing at PMU level was one of the major factors affecting project implementation (see
section 2.2).
4 A critical input was the findings of the 2002 Quality Enhancement Review (QER) of a number of
previous India state health systems development projects. It emphasized the importance of promoting
demand-side interventions, private sector engagement, institutional development, governance and policy
reforms, as well as adjusting state projects to fit state context and capacity. 5 These included a social assessment study (including a beneficiary needs assessment and an NGO
assessment), a tribal development plan based on consultations with communities and NGOs, a draft gender
strategy, a facility survey, an institutional assessment, a review of clinical service norms, an analysis of
community-based health insurance schemes elsewhere in India, a public-private partnership feasibility
study, a study of pilot programs for reaching the poor, and a study of existing larger-scale programs for
reaching the poor. 6 These included a revised draft of the health care waste management plan, a tribal development plan,
revised on the basis of consultations with community and NGOs, a draft gender strategy; a project
implementation plan for improved access for disadvantaged populations, a draft terms of reference
prepared for most studies and consultancies planned for the first year of the project, draft procurement
plans for the total project period, a draft TOR for external audit of the project by the Comptroller and
Auditor General of India (CAG), detailed drawings and the costing for 5 of the 27 works planned for Year
1, and a draft of the Health Sector Development Policy Matrix.

8
27. The preparation period was lengthy, even compared to other health projects in India, at
almost 27 months7. This was mainly due to the time needed to obtain government support for the
design (especially the “soft” health system strengthening interventions and Component 3) and to
set up implementation arrangements (including the detailed preparations for procurement
described above). A Quality Assurance Group (QAG) review, undertaken in 2005, rated overall
quality-at-entry as moderately satisfactory, highlighting as strong points the effort made to obtain
government buy-in, the targeting of the vulnerable, and the building of partnerships with
government, NGOs and the private sector. It also noted, as weak points, the quality of the results
framework and insufficient attention to the preparation of Component 3. This ICR concurs with
the first point, (see section 2.3), but considers analytical work undertaken to support Component
3 adequate, especially given the team‟s intention to move forward incrementally with those
interventions, many of which would operate on a small-scale and pilot basis. The project moved
from approval to effectiveness within four months.
2.2 Implementation
28. Overall implementation performance can be characterized as weak at the beginning,
strong in the middle period leading up to extension, and weak again during the extension phase.
Implementation performance mirrors performance on procurement and staffing/human resources
which were the chief factors affecting implementation. The project also made some explicit shifts
during implementation in order to be more complementary to new national programs, but
remained within the scope of the original PDOs and components. Factors affecting
implementation include:
29. Human resources: The project experienced five changes in leadership at the project
director level during its seven year period which was disruptive to project implementation,
especially during the extension phase when there was not only rapid turnover of management, but
the incumbent project directors held several other responsibilities in addition to RHSDP.
Vacancies were frequent, again especially during the extension phase when the project lost core
staff (in biomedical engineering, M&E, health care waste management, data analysis and IEC)
who were never replaced with the result that the responsibilities and workload of remaining staff
increased. The impact on project implementation was clear: processing time of the procurement
planned during extension increased and critical decision-making was delayed. By contrast, at the
district level, while it took a long time to fill the positions of District Project Coordinators (DPCs),
until April 2006, once filled, these positions had little turnover and implementation capacity
improved over time.
30. Procurement (civil works and equipment): Procurement barely moved during the first
few years of the project when procurement was managed by procurement support agencies
(PSAs)8 because of the low capacity of the PSAs (despite all the procurement materials that had
been prepared during project preparation) coupled with the non-availability in desert and tribal
areas of contractors who could fulfill the bid criteria. During this period, procurement was rated
as unsatisfactory twice, both in 2005 (due to the poor performance of the first PSA), but also,
since civil works and goods together constituted about half of the project funds, delayed
7 There was a project identification mission in Oct-Nov 2001, four intervening preparatory missions,
negotiations on Jan 20, 2004, Board approval on Mar 11, 2004 and effectiveness on July 21, 2004. 8 These were firms that were contracted to manage procurement for the project in the first few years so as to
avoid procurement difficulties, while simultaneously strengthening PMU capacity for procurement.

9
procurement was a major driver of slow disbursement, and also contributed to the less than
satisfactory performance on the second component in which most of the procurement was
concentrated. When the PMU and DPMUs took over responsibility for procurement (from 2006-
2008), most of the annual planned procurements were initiated within the year for which they
were planned, but typically with delay. During the extension phase, when procurement was the
sole responsibility of the PMU, procurement delays were primarily due to the PMU‟s difficulty in
managing large ICB procurements and a risk-averseness in making decisions related to the bids
for fear that there would be complaints that about the process. This was aggravated by turnover of
procurement staff and lengthy vacancy periods. Additional procurement issues are discussed in
section 2.4.
31. New government health programs and additional health financing: Subsequent to project
effectiveness, the Government of India (GOI) launched a number of large new health programs
which shared a number of the objectives of RHSDP and injected substantial additional resources
into the health system that were not anticipated during project preparation, necessitating a re-
alignment of RHSDP. The National Rural Health Mission (NRHM) was introduced in April 2005
as the Government‟s “flagship” health program, providing an overarching strategic direction and
umbrella structure to health system development. Moreover, Rajasthan was identified as a focus
state for NRHM, meaning that significant additional funding was made available to improve the
health outcomes of its population (especially the poor, vulnerable and rural groups). Subsequently,
in November 2006, the centrally sponsored Reproductive and Child Health II (RCH II) program
was launched under NRHM with the aim of strengthening health systems for improved maternal
and child health. It emphasized reaching the poor and vulnerable, continuity of care and evidence-
based programming. The Jonani Surakshi Yojana program (JSY), introduced in 2005 but with
implementation only gathering speed later, provided demand-side and supply-side financial
incentives to improve maternal health9. Partly as a result of, but also independent of, the programs
described above, both the state and central governments dramatically increased their spending on
health services in Rajasthan during project implementation. Government health expenditure grew
from approximately US$116 million in 2004-05 (US$1.91 or Rs 84 per capita) to US$443 million
in 2010-11 (US$6.46 or Rs 296 per capita) such that RHSDP eventually accounted for an annual
average of 3.5% of total government health spending rather than the 5% originally envisaged.
32. The project adapted well to this changing environment in the health sector. In particular,
at Mid-Term Review (July 2007), key decisions were taken to ensure that the project
appropriately aligned itself with the NRHM and that RHSDP resources were used in a
complementary fashion, inputs were synergized and there was no duplication in programming.
Specifically, this involved the realignment of Component 1 to focus on supporting NRHM
implementation, identifying where RHSDP and NRHM would respectively take the lead10
.
9 In Rajasthan, pregnant women who deliver in a government (and accredited private) institution are
rewarded with financial payments, with higher benefits paid in rural than in urban areas. Community health
workers – known as accredited social health activists (ASHA) – receive payments for institutional delivery,
postnatal visits and BCG vaccination. Private sector providers can be paid for performing emergency
caesarean sections. 10
RHSDP would (i) function as a management unit for training for NRHM, (ii) undertake the training and
monitoring related to HCWM, (iii) support the policy framework for outreach activities, working with RCH
II, (iv) support IEC for outreach and BCC for providers, (v) conduct feasibility studies and pilots for drug
logistics management and equipment repair and maintenance. NRHM would take the lead in (i) human
resources planning for the health sector, (ii) implementation of PPPs, (iii) integrated MIS for the health
sector, and (iv) strategic planning at the state level.
10
Project extension:
33. In light of the improved project performance subsequent to the Mid-Term Review (MTR),
combined with the fact that almost a quarter of the credit was still unspent, the project was
extended by two years in order to consolidate and maintain these gains by completing planned
activities, as well as in order to initiate new investments. However, most of the new investments
planned for the extension period were not initiated – including training programs and workshops,
a medical equipment management and maintenance workshop, drug logistics and supply chain
management system, special purpose fund for heavy duty repairs of infrastructure, pilots for
improving preventive care and health promotion among disadvantaged populations, and
strengthening of secondary level hospitals with equipment – while several other activities were
only partially completed – such as health care waste management training programs, introduction
of a hospital management information system, studies and evaluations, and social accountability
pilots. The issues with procurement and staffing/human resources that were the main causes of
these deficits were discussed earlier.
34. Altogether, over the seven years of implementation, most of the activities that were
envisaged during the initial project design were eventually completed, but only very few of the
activities planned for extension were completed. Annex 2 summarizes all project outputs by
component.
Disbursement delays
35. Due to the difficulties in procurement described above, actual and planned disbursement
deviated from each other early in the project. At MTR (July 2007), only 29.33% (US$27.5
million) of the credit was disbursed, triggering the disbursement delay flag which remained in
place for the duration of the second half of the original project period (from Oct 2007 through
April 2009). US$11 million was cancelled from the credit two weeks before closing and by the
end of the four month disbursement grace period the project had disbursed 81% of the original
and 92% of the revised credit allocation. The grace period was subsequently extended to March
31, 2012 because all utilization receipts had not yet been received by districts. At the time of
writing the project had disbursed 97% of the revised credit allocation.
Problem project status and other flags
36. RHSDP was flagged as problem project at the end of 2005 due to moderately
unsatisfactory implementation progress, driven by unsatisfactory procurement and the slow
implementation of Component 2. The country record flag was triggered for the period of May
2007 through April 2008 as a result of the Detailed Implementation Review (DIR) of five health
projects, conducted by the World Bank in 2006-2007, which found “significant indicators of
fraud and corruption in all five projects” (World Bank 2007, see Executive Summary). These
findings halted all projects under preparation and led to significant slow-downs in the
implementation of the centrally-sponsored schemes. The RHSDP, not being one of the five
projects examined by the DIR, and also a state-level project, was not as affected as many other
projects.
37. The team was proactive in responding to the DIR findings and recommendations. It held
in-depth discussions with government to assess whether the RHSDP was at risk of the
weaknesses that had been highlighted by the DIR and prepared a Joint Action Plan containing
mitigation measures. This plan was agreed to by the MoHFW and DEA and presented to the
Bank Board, and its implementation was monitored during subsequent missions.

11
2.3 Monitoring and Evaluation (M&E) Design, Implementation and Utilization
Design
38. The results framework and indicators, as approved, were poor. Weaknesses included: (i)
too many indicators to feasibly track over time – 11 PDO indicators and 32 intermediate
indicators; (ii) most of the PDO indicators and a number of intermediate indicators were framed
in a way that was difficult to measure with available data; (iii) 9 of the 11 PDO indicators and all
of the 32 intermediate indicators lacked baseline data at the time of approval (with the exception
of those for which the baseline was zero); (iv) for a number of indicators, it was not realistic to
use the data sources identified in the PAD because the data sources either did not contain the
information needed (as was sometimes the case with the HMIS) or were not available with the
frequency needed (as was the case with large household surveys); and (v) all 11 PDO indicators
and 21 of the 32 intermediate indicators lacked explicit targets, including well into
implementation.
39. The evaluation design was insufficient. There were no plans for a project-specific
baseline survey or follow-up survey with which to measure the impact of RHSDP. There were
also no plans to use the large household surveys that are regularly implemented in India and
representative at the state level as baseline and follow-up data sources. Instead, the evaluations
planned for the project are better classified as operational research and assessments of different
interventions within the project, rather than evaluations of the overall project effect or outcome.
Implementation
40. During the first few years of the project, no proactive steps were taken to improve the
results framework despite the continued absence of information on key project indicators.
41. Revision of entire results framework, including PDO indicators and targets (2006): In
2006, the results framework was assessed and revised to address a number of the earlier
weaknesses. The number of indicators was reduced to seven PDO indicators and 11 intermediate
outcome indicators; existing indicators were replaced by indicators that were more measurable;
baseline data were obtained; and targets were put in place. Since this was prior to the
implementation of the revised restructuring guidelines (July 2006) which would have required
Board approval of any change in project indicators, no formal restructuring was needed. Rather,
the change was recorded in the aide-memoire of April 2006.
42. Despite these improvements, considerable weaknesses remained. First, targets for the
three PDO 1 indicators were over-ambitious and others do not appear sufficiently thought through.
For example, it was probably unrealistic to set a target for BPL utilization as a share of total
patients at 50% when BPL households constituted only 31% of rural and 11% of urban
households. Second, the earliest date for which most baseline values for the new indicators were
available was late 2005-200611
. Third, on the whole, indicators chosen for PDO 2 were not
convincing indicators of improving the effectiveness and quality of health care. For example, the
11 On the one hand, as noted, 2006 is too many years into project implementation to establish a project
baseline. However, in the case of the RHSDP, since implementation was so slow in the early years, it is not
unreasonable to consider values from 2006 as de facto baseline values for implementation.
12
percentage of staff in place is an input indicator, and does not reflect whether effectiveness and
quality have improved. Also, the indicator on the percentage of facilities conducting 24/7 EMoC
should have been dropped since, as acknowledged by the task team, it was NRHM and not
RHSDP that was undertaking those investments, and it was never reported on in any aide-
memoires. Fourth, despite the extensive revision, the causal chain between the PDO and
intermediate indicators was not very clear (especially with respect to PDO 1), making using the
results framework for project monitoring, feedback and change rather difficult.
43. Revision of targets (2009): When the project was extended in September 2009, the 2006
original project targets became the targets for the end of the extension period. In December 2009,
the PDO targets of the three indicators of PDO 1 were revised downwards to levels that were
more realistic through a Level II restructuring (as per the November 2009 project restructuring
guidelines). In September 2010, an aide-memoire included mutually agreed upward revisions to
the targets of the PDO indicators, but these were not formalized through a formal restructuring.
Consequently, the targets that have standing for the purposes of this ICR are the December 2009
targets.
44. Data collection for monitoring purposes: In order to obtain information on the indicators
in the revised results framework, RHSDP developed a separate hospital activity format (HAF)
which was filled out by facilities and submitted to the PMU which reviewed it for completeness
and accuracy, giving feedback to facilities where necessary. Since the MoHFW‟s regular HMIS
system did not contain the information needed to track progress towards project development
objectives, and in particular did not disaggregate utilization figures by poor and vulnerable groups,
the development of the HAF was the only way that the project could monitor its results. By
October 2007, the HAF had shifted from paper-based reporting to electronic reporting, achieving
good standards for timely and completeness in reporting (>90% for project facilities). On the
downside, the net result was the development of a parallel system of results monitoring, rather
than a strengthening of the existing HMIS system, adding to the reporting burden at the facility
level. In 2009, the project attempted to integrate the HAF and the existing HMIS reporting
systems, but this did not succeed. Relying on the HAF also meant that the values for the PDO
indicators were first only available from late 2005. However, the HAF did provide the first-ever
state-level regular (monthly) information on inequalities in health care utilization.
45. Evaluation: It is laudable that a number of assessments were carried out towards the end
of the project, and some at mid-line, including surveys of patient satisfaction, an assessment of
the patient counselor intervention, the quality and maintenance of civil works, and equipment
audits, among others. The studies were useful for understanding implementation issues, but their
design was not robust enough to make inferences about intervention/project effect. The quality of
the data from the patient satisfaction surveys, which were supposed to serve as a key data source
for PDO 2, was poor. There were also some missed opportunities to evaluate more of the pro-
poor innovations.
Utilization
46. While the PMU gave feedback to facilities on the completeness of their reporting, very
seldom did the PMU have a results-oriented discussion with facilities or other parts of the
administration about what the data had to say about performance. At the facilities themselves,
however, Health System Improvement Teams (established with project support) reviewed the
HAF results during their monthly meetings and clearly used the results to inform decision-making.
Some DPCs were also very proactive in analyzing findings and using the results to communicate
problems and improve service delivery. However, by and large, the multiple reporting formats,
13
staff time limitations, and insufficient interest within the administration meant that the substantial
information that was generated by the HAFs was not used to its full potential.
47. The Bank team strongly encouraged the use of monitoring and evaluation information.
Indeed, some assessments were used to inform project implementation, but others were conducted
too late to do so. Nevertheless, the project's focus on indicators and assessments/evaluations has
had an impact within the administration. It provided a good start for further improvements in the
use of information for decision-making and started to cultivate a culture of monitoring and
evaluation.
2.4 Safeguard and Fiduciary Compliance
Health care waste management
48. The project was classified as category “B” (partial environmental assessment),
necessitating the development of a HCWM Action Plan (Feb 2003). The plan provided the
blueprint for the environmentally sound management of hospital waste from healthcare facilities
in compliance with national biomedical rules. The implementation of the action plan was
included as a covenant and was complied with by its due date of Sept 2010.
49. Overall, the RHSDP made a substantial contribution to institutionalizing the systems and
protocols for collection, segregation, disinfection, storage and disposal of biomedical waste
generated from public health facilities. With a national policy in place only since 1998, the
project supported Rajasthan in an emergent area of public health where there was not much
capacity or action. The RHSDP provided training and refresher training for all secondary health
care personnel; facilitated the development of IEC materials; provided equipment and
consumables and equipment; connected hospitals to private sector common treatment facilities
(CTF) for waste collection and disposal and provided deep burial pits wherever CTF connectivity
was not possible; negotiated, and paid, fees for CTF connectivity; helped all project-supported
facilities to register with the State Pollution Control Board; ensured the removal of waste from
outreach camps; made sure that health care waste management was an agenda item for facility
HSITs; conducted two evaluations and helped to share best practices with a national audience.
Taken together, these activities constituted a system-strengthening intervention that linked the
multiple stakeholders (namely the State Pollution Board, MoHFW, private sector CTFs,
municipalities and facilities) involved in the health care waste management chain to each other.
50. Health care waste management was only once rated unsatisfactory (May 2007) due to
slower than planned progress on CTF connectivity, but this was resolved within six months and
the environmental assessment rating was upgraded to MS, and subsequently S. At project close, it
was the opinion of the Bank environmental specialist that, in the sphere of health care waste
management, the RHSDP performed better than any other recent or current state health system
reform project in India.
Indigenous peoples (safeguard policy OP 4.10)
51. A Tribal Development Plan, dated February 7, 2003, was prepared by project appraisal. It
was designed to address the specific health-related needs of tribal people, including their
inclusion within the health care delivery system, their willingness to access seek care in a timely
manner and financial barriers to accessing care. The completion of the implementation of the
Tribal Development Plan was included as a covenant and was complied with by its due date of
September 2010. Increasing the utilization of secondary care by tribal populations was also an
14
explicit development objective and, from 2006, was monitored at the facility and PMU level
using the specially-designed HAFs.
Procurement
52. Procurement performance can be divided into three phases: a period of poor performance
during the first two years when procurement was managed by PSAs (until end-2005), a
subsequent period of better performance (corresponding to the latter part of the original project
period) when the PMU and DPMU took over responsibility for procurement from the PSA (2006-
2008/09) and the extension period which was also characterized by weaker performance when all
procurement was centralized in the PMU (2009-2011). The reasons for this, as well as their effect
on implementation, have already been discussed in section 2.2.
From a fiduciary standpoint, there were some additional weaknesses. These were not major
shortcomings, however, and included some small misprocurements (mostly due to
misunderstanding of allowable expenditures), a number of (frequently unjustified) procurement
complaints by competing bidders, slow responses to complaints, failure to complete timely
procurement post reviews (PPRs), and an occasional failure to satisfactorily address PPR
recommendations. By project close, however, the project was able to satisfactorily close all
procurement-related complaints and issues.
Financial management (FM)
In terms of internal controls, the PMU maintained good financial records and submitted all annual
financial statements to the CAG on-time. On two occasions, accountability issues were identified,
but these were satisfactorily resolved. At the time of project close, there were no outstanding FM
issues. There were no difficulties in the flow of funds from the Special Account to the state or
from the state to the districts. Careful analyses of performance in financial management were
undertaken by Bank FM specialists on each mission and clear follow-up actions identified. Based
on these findings, no separate comprehensive FM assessments were deemed necessary.
Compliance with covenants
53. With the exception of the covenant on the implementation of different models of public-
private partnerships (PPPs) which was complied with after 1.5 years delay, all covenants were
complied with on-time. As already notes in section 1.7, the covenant on the design of a quality
regulatory framework for the private sector was deleted because of the development of national
legislation in this area.
2.5 Post-completion Operation/Next Phase
54. No follow-on operations are envisaged. However, since the integration of project
investments with the NRHM environment had been planned since MTR, a number of project
activities will be continued by the state. These include earmarked funds in the budget to provide
the equipment and staff to the facilities that were renovated by RHSDP (where these could not be
provided by the project before closing); continued training by SIHFW, on behalf of NRHM, using
the training modules that were developed by RHSDP; and continuation of the outreach camps
started by the project by the RCH II program, even though resource constraints (money,
medicines, staff) mean that the camps will not take place with the same frequency and intensity as
under RHSDP. However, reaping the full benefits of RHSDP investments will require some
additional investments that have not been budgeted for. For example, while the law requires

15
compliance with appropriate HCWM processes and the project helped facilities to obtain their
authorizations for CTF disposal, it remains unclear whether sufficient budgetary provision has
been made for the continued payment of CTF connectivity fees beyond the project period.
55. While there are no projects planned for the foreseeable future, there appear to be a
number of areas where technical support from the Bank would be useful. One is in the
development of a human resource strategy for health care workers to improve the incentive
structure facing doctors, the working conditions of nurses and the managerial competencies of
administrators; another could be the introduction of some hospital autonomy in all aspects of
service delivery (possibly in combination with performance-related incentives); a third could be
assistance in the pharmaceutical supply chain which while very much improved, still suffers from
frequent stockouts; and, finally, support to monitoring and evaluation.
3. Assessment of Outcomes
3.1 Relevance of Objectives, Design and Implementation
56. Ten years after the start of project preparation, the development objectives remain very
relevant. Access to care remains an issue, with average preventive and curative utilization rates in
Rajasthan lagging behind the India average, especially among poor and tribal households (see
Annex 7 Table 6). As the data in section 3.2 will show, there also remain large disparities in the
utilization of inpatient and outpatient care, and the quality of care needs improving.
57. The PDOs and project activities also remain well-aligned with government priorities,
through the project‟s active adaptation to the new health policy environment which will continue
to be defined by the NRHM. The project objectives and design also remain in sync with the
Bank‟s current strategy for engagement. At project close, engagement in India, and Rajasthan,
was governed by the 2009-2012 CAS which pledges to devote more resources to engaging with
India‟s seven low-income states including Rajasthan where it will focus on poverty reduction and
reaching the Millennium Development Goals (MDGs). Achieving these goals will necessarily
include a focus on strengthening secondary care such as that found in this project. The CAS also
emphasizes focusing on increasing accountability to citizens, decentralizing responsibilities, and
enhancing private sector participation in the delivery of these services.
Rating: Substantial
3.2 Achievement of Project Development Objectives
58. The RHSDP was conceived as a contribution to overall health sector development and, in
its latter stages, was conceived as an explicit complement to the NRHM. Consequently, its
activities, like in other state health projects in India, were a combination of discrete investments
and contributions to overall health system strengthening. Moreover, its financial contributions
were dwarfed by domestic spending. Consequently, it is neither possible nor appropriate to
attempt to attribute the observed outcomes in the results framework to the RHSDP. Indeed, one of
the strengths of the project lay in how closely it worked with government to complement the
initiatives that the government was undertaking, adjusting its activities when needed. The
performance that is captured by the results framework and other data sources used below is, thus,
taken to reflect the contribution of the project.
59. To assess overall project efficacy, we start by looking at performance against the targets
of the PDO indicators. Then, we attempt to validate that assessment by looking at other data

16
sources, internal and external to the project. Finally, we examine performance on intermediate
outcomes and activities to see whether the findings are supported by the results chain.
For PDO 1: Increase access to health care of poor (BPL) and underserved
Were PDO 1 targets reached?
60. Based on data from 238 project facilities, all three PDO 1 indicators of access to
secondary care services by disadvantaged groups show steady progress over the project
implementation period and exceed the formally revised (2009) targets (see Figure 1). As a
proportion of total outpatients, BPL patients rose from 8.7% in 2006 to 16.6% in June 2011,
reaching the target of 17%, and as a proportion of total inpatients, BPL patients rose from 8.5% in
2006 to 17% in June 2011, exceeding the target of 13%. As a proportion of total in-patients in
the 49 project-supported facilities in six districts with large tribal populations, the ST population
rose from 8.3% in 2006 to 24.9% in June 2011 (see Figure 3), exceeding the target of 15%. Thus,
the formally revised targets for all PDOs related to access to care for the poor and vulnerable
were clearly attained.
Figure 1 Below poverty line (BPL) and scheduled tribal (ST) patients as % of all patients in project facilities
Below-poverty-line (BPL) patients as % of all patients in 283 project facilities, 2006-11
Scheduled Tribe (ST) in-patients as % of all in-patients in 49 project facilities in six tribal districts, 2006-11
0%
2%
4%
6%
8%
10%
12%
14%
16%
18%
20%
Jan
06
Ap
r 0
6
Jul 0
6
Oc
t 0
6
Jan
07
Ap
r 0
7
Jul 0
7
Oc
t 0
7
Jan
08
Ap
r 0
8
Jul 0
8
Oc
t 0
8
Jan
09
Ap
r 0
9
Jul 0
9
Oc
t 0
9
Jan
10
Ap
r 1
0
Jul 1
0
Oc
t 1
0
Jan
11
Ap
r 1
1
BP
L a
s %
of
all p
ati
en
ts i
n p
roje
ct
fac
ilit
ies
out-patients
in-patients
0%
5%
10%
15%
20%
25%
30%
35%Ja
n 0
6
Ma
y 0
6
Se
p 0
6
Jan
07
Ma
y 0
7
Se
p 0
7
Jan
08
Ma
y 0
8
Se
p 0
8
Jan
09
Ma
y 0
9
Se
p 0
9
Jan
10
Ma
y 1
0
Se
p 1
0
Jan
11
Ma
y 1
1
% o
f in
-pa
tie
nts
in
49
pro
jec
t fa
cilit
ies
in 6
tri
ba
l d
istr
icts
ST as % in-patients
Source: Aggregation of monthly hospital activity formats
61. While performance on PDO 1 would be rated satisfactory relative to the December 2009
targets, performance would be rated unsatisfactory relative to the April 2006 targets of 50%.
Weighting these ratings by disbursement at the time of the change of targets (according to the

17
formula in the ICR guidelines) would give an overall rating of moderately unsatisfactory12 for
PDO 1 (see Annex 7 Table 3). However, this ICR considers a rating of moderately satisfactory to
be a more appropriate assessment of performance on PDO 1. Why? First, as discussed in section
2.3, the 2006 targets of 50% utilization by the poor and scheduled tribe groups were not only
unrealistic, but demographically impossible: scheduled tribes constituted only 12.6% of
Rajasthan‟s population, and the BPL population constituted only 31% of the rural and 11% of the
urban population. Downgrading performance on this PDO to moderately unsatisfactory based on
a rigid calculation would be too heavy a penalty for what is essentially a failure to put in place a
realistic target. Second, measuring efficacy is not only about performance against project targets;
it is about achieving the overall project development objective, namely increasing access to health
care of the poor and underserved population. On that score, the data in Figure 1 make it clear that
the increase among these groups over the period of the project for which data are available was
quite tremendous, especially considering how difficult it is to bring secondary care within the
reach of these groups who live mainly in rural, often remote, areas.
Can the PDO 1 achievements be validated by other data sources or indicators?
62. External data sources, such as the National Family Health Survey (NFHS), District-Level
Household Survey (DLHS) and UNICEF household surveys, are informative, but in a limited
way. These limitations include timing, lack of information on key outcomes of interest such as
general care utilization (inpatient and outpatient), as well as lack of access to some of the original
data which (in some cases) is necessary to disaggregate results by economic status and caste. The
limitations are summarized in Annex 7, Table 4.
63. Because of the absence of indicators on general care utilization in these surveys, we rely
on trends in maternal and child health (MCH) indicators as a proxy. From 2002/03 to 2009 (see
Table 5, Annex 7), very large increases in immunization coverage, antenatal care utilization and
institutional delivery were observed. Also, when data are disaggregated by caste and
socioeconomic status (using the only original data to which we have access, namely the 1998/99
NFHS and the 2005/06 NFHS), we find improvements in most indicators for scheduled tribes and
for the populations in the lowest two quintiles (i.e. corresponding to BPL households) (see Table
6, Annex 7). In conclusion, patterns of MCH service utilization over time lend support to the
hypothesis that access to care among the poor and vulnerable has been increasing.
The logic of the causal chain for PDO 1
64. Further down the results chain of PDO 1, at the level of intermediate outcome indicators,
we find that targets for nursing in tribal areas were far exceeded but not for doctors or technicians,
100% of patient counselors were in place and 100% of payments from equity funds were made.
Unfortunately, there is no data relating IEC to increased utilization. Some of the activities
implemented under Component 3 (which focused on PDO 1) were very successful, while others
were less so (see Annex 2). For example, IEC activities were slow to start and a number of
activities were implemented on relatively small-scale; on the other hand, outreach camps were a
resounding success reaching tens of thousands of people in some of the most remote areas, and a
variety of innovative mechanisms to reach the poor were attempted. In addition, the improved
12 It is not possible to measure performance relative to objectives and targets for the period between
approval and March 2006 because those indicators lacked targets. However, since only 10% of the total
credit (including the US$4 million advance, or 6% excluding the US$4 million advanced) had been
disbursed by then, the effect on the overall efficacy rating would likely be inconsequential.

18
quality of service provision (see subsequent paragraphs) is likely to have contributed to improved
service utilization. While it cannot be conclusive, the logic of the results chain suggests a
moderately satisfactory rating.
Rating on PDO 1: Moderately satisfactory
For PDO 2: Improve effectiveness and quality of health care
Were PDO 2 targets reached?
65. There were strong achievements on some PDO 2 indicators and weaker results on others.
First, the proportion of the 185 project-supported Community Health Centers (CHC) that
undertook more than ten deliveries per month increased dramatically from a baseline of 60% in
2006 to 96.6% in June 2011, well exceeding the target of 90%. Second, the proportion of staff
positions filled in project facilities exceeded the 90% target for nurses/ANMs (at 117%), as well
as for lab technicians (91.5%), but not for doctors (64.3%). Third, surveys of patient perceptions
from 2008 and 2011 suggest relatively stable patient perceptions, with some deterioration in the
perception of nurses‟ performance, in contrast to the expectation that the project would improve
patient satisfaction13
. The fourth PDO indicator on the availability of 24/7 emergency obstetric
care was never tracked by the project because related activities were undertaken by NRHM and,
as discussed in section 2.3, should have been dropped. Taken together, then, one of the PDO 2
targets was exceeded, one was exceeded on two dimensions but not on a third, and one was not
met, suggesting that, based purely on the attainment of targets, the outcome rating for PDO 2
would probably lie on the line between moderately satisfactory and moderately unsatisfactory.
Data from other sources, which will provide more information on the performance on the overall
development objective, are thus employed to make the final decision.
Can the PDO 2 achievements be validated by other data sources or indicators?
66. The hospital activity formats (which were put in place by the project) contain additional
indicators that capture other elements of the effectiveness and quality of care. These include the
number of neonatal deaths, number of maternal deaths, referral from lower level facilities,
feedback to lower-level facilities, percentage of caesarean sections, number of laboratory tests,
number of radiological screens, and drug stockouts. While the merits of each individual indicator
as a measure of quality of care can be disputed, taken together they contribute to a more holistic
view of the trends in PDO 2 than are available in the results framework. In order to examine these
indicators, the ICR team manually reviewed individual facility monthly report data – for 238
facilities – between 2005 and 2011.
67. Between 2005 and 2011, the average number of maternal deaths per facility fell
dramatically, by about one third. This result is especially remarkable given the increases in
institutional delivery over the period, but could also reflect a declining share of high-risk
pregnancies in the overall institutional delivery numbers as institutional delivery became more
common. The average number of neonatal deaths reported increased, but this is likely due to the
13 In 2008, among approximately 1,000 patients at project-supported facilities, 92% were satisfied with the
behavior of doctors and 85% were satisfied with the behavior of nurses; in the 2011 survey, among 1,763
patients at project-supported facilities, 94% were satisfied with doctors‟ behavior but only 72% were
satisfied with nurses. As highlighted in section 2.3, there are also concerns with the quality of these surveys.
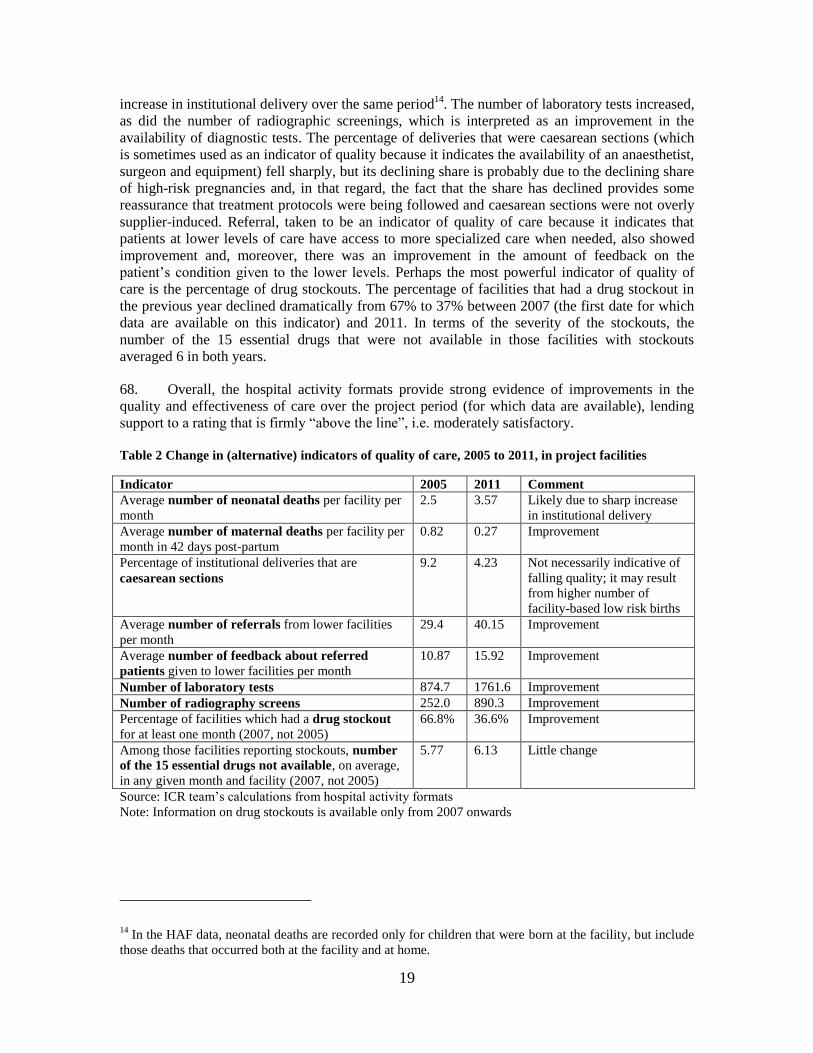
19
increase in institutional delivery over the same period14
. The number of laboratory tests increased,
as did the number of radiographic screenings, which is interpreted as an improvement in the
availability of diagnostic tests. The percentage of deliveries that were caesarean sections (which
is sometimes used as an indicator of quality because it indicates the availability of an anaesthetist,
surgeon and equipment) fell sharply, but its declining share is probably due to the declining share
of high-risk pregnancies and, in that regard, the fact that the share has declined provides some
reassurance that treatment protocols were being followed and caesarean sections were not overly
supplier-induced. Referral, taken to be an indicator of quality of care because it indicates that
patients at lower levels of care have access to more specialized care when needed, also showed
improvement and, moreover, there was an improvement in the amount of feedback on the
patient‟s condition given to the lower levels. Perhaps the most powerful indicator of quality of
care is the percentage of drug stockouts. The percentage of facilities that had a drug stockout in
the previous year declined dramatically from 67% to 37% between 2007 (the first date for which
data are available on this indicator) and 2011. In terms of the severity of the stockouts, the
number of the 15 essential drugs that were not available in those facilities with stockouts
averaged 6 in both years.
68. Overall, the hospital activity formats provide strong evidence of improvements in the
quality and effectiveness of care over the project period (for which data are available), lending
support to a rating that is firmly “above the line”, i.e. moderately satisfactory.
Table 2 Change in (alternative) indicators of quality of care, 2005 to 2011, in project facilities
Indicator 2005 2011 Comment
Average number of neonatal deaths per facility per
month
2.5 3.57 Likely due to sharp increase
in institutional delivery
Average number of maternal deaths per facility per
month in 42 days post-partum
0.82 0.27 Improvement
Percentage of institutional deliveries that are
caesarean sections
9.2 4.23 Not necessarily indicative of
falling quality; it may result
from higher number of
facility-based low risk births
Average number of referrals from lower facilities
per month
29.4 40.15 Improvement
Average number of feedback about referred
patients given to lower facilities per month
10.87 15.92 Improvement
Number of laboratory tests 874.7 1761.6 Improvement
Number of radiography screens 252.0 890.3 Improvement
Percentage of facilities which had a drug stockout
for at least one month (2007, not 2005)
66.8% 36.6% Improvement
Among those facilities reporting stockouts, number
of the 15 essential drugs not available, on average,
in any given month and facility (2007, not 2005)
5.77 6.13 Little change
Source: ICR team‟s calculations from hospital activity formats
Note: Information on drug stockouts is available only from 2007 onwards
14 In the HAF data, neonatal deaths are recorded only for children that were born at the facility, but include
those deaths that occurred both at the facility and at home.

20
The logic of the causal chain for PDO 2
69. At the level of the PDO outcome indicators, while patient satisfaction appears to be
unchanged, and the staffing of doctors remained below targets, staffing of nurses and technicians
exceeded targets, as did the improvement in institutional deliveries. Although the initial increased
demand for institutional deliveries could have been mainly attributable to the JSY program and
other health policy programs, sustained take-up would not be possible without significant supply-
side strengthening. Indeed, the intermediate project indicators confirm that the project improved
health system infrastructure and processes – targets on renovations, drug availability, health care
waste management and the functioning of health system improvement teams were all met. In
addition, most planned equipment was procured, quality-related guidelines were implemented and
much planned clinical training was undertaken (see activities included Annex 2). The good
performance on intermediate outcome indicators also likely explains why it is not only
institutional deliveries that improved, but also the alternative measures of health system quality
described in Table 2. The logic of the results chain confirms a rating of moderately satisfactory.
Rating on PDO 2: Moderately satisfactory
Overall efficacy
70. Overall efficacy is determined by a combination of performance on PDO 1 and PDO 2,
weighted by the resources allocated to each. Most of the activities related to PDO 1 were
concentrated in Component 3 which was worth US$29 million. Most of activities related to PDO
2 were concentrated in Component 2 which was worth US$48 million. Component 1 (worth
US$18 million) is assumed to contribute equally to both Components 2 and 3. Consequently, the
performance on PDO 2 should be weighted slightly more heavily than performance on PDO 1 in
the overall efficacy rating. Overall efficacy is, thus, rated as moderately satisfactory.
Rating: Moderately satisfactory
3.3 Efficiency
Increase in the efficiency of service delivery
71. Measuring the efficiency of service delivery is not easy, especially given the limited type
and quality of data available in Rajasthan. However, the HAFs developed under RHSDP contain
measures of average length of stay and the bed occupancy rate, both of which capture aspects of
the efficiency of service delivery15
. Average length of stay fell from 5.96 inpatient days in 2005
to 1.77 inpatient days in 2011; bed occupancy rate increased from 39.4% to 61%; and the
percentage of CHCs conducting at least 10 deliveries increased from 60% in 2006 to 97% in June
2011. These three indicators suggest better use of existing facilities (i.e. increased outputs per unit
input) and, thus, better efficiency in health care delivery. Another indicator of enhanced
efficiency is the increase in the number of referrals (since it is more efficient to treat illness at the
lowest level that it can be effectively treated, with referral for more complex cases), and as shown
in Table 2, the number of referrals increased.
15 Again, to obtain these data, the ICR team compiled and aggregated information from monthly reports
from 238 facilities to obtain the trends discussed. The quality of the reported data was not always good
(including a number of implausible values), but on the assumption that these errors were random and
uncorrelated with overall efficiency, the indicators provide a useful general picture of trends.
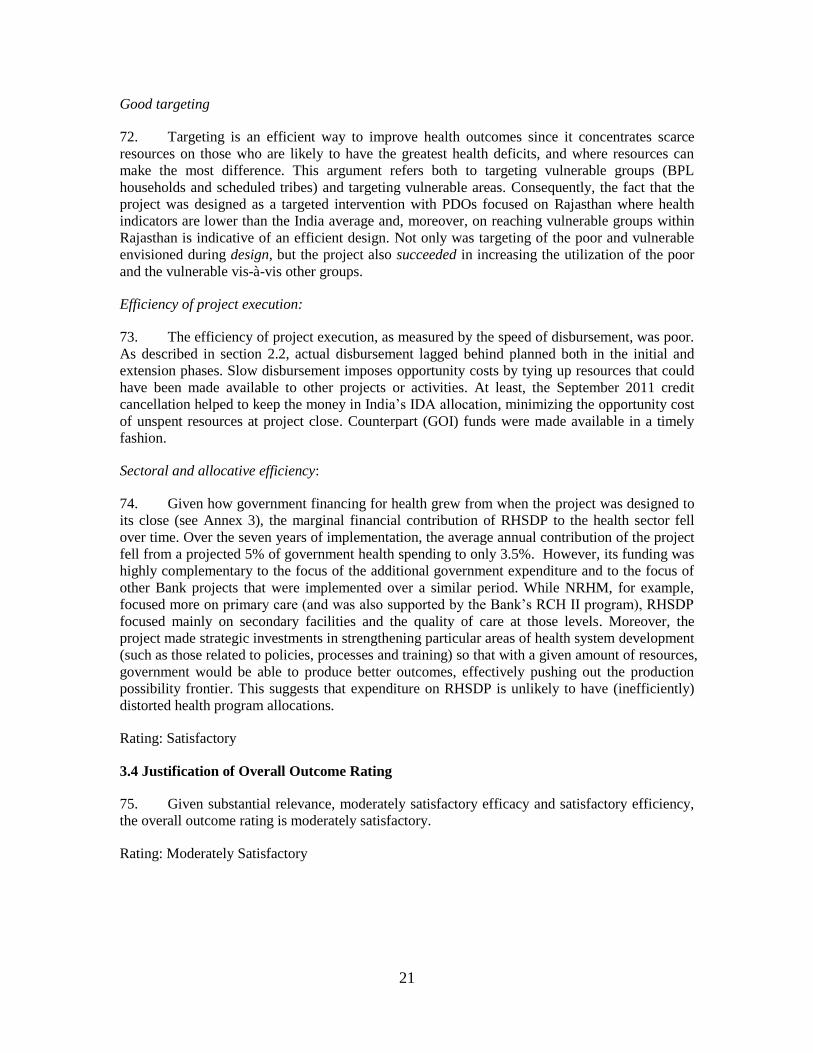
21
Good targeting
72. Targeting is an efficient way to improve health outcomes since it concentrates scarce
resources on those who are likely to have the greatest health deficits, and where resources can
make the most difference. This argument refers both to targeting vulnerable groups (BPL
households and scheduled tribes) and targeting vulnerable areas. Consequently, the fact that the
project was designed as a targeted intervention with PDOs focused on Rajasthan where health
indicators are lower than the India average and, moreover, on reaching vulnerable groups within
Rajasthan is indicative of an efficient design. Not only was targeting of the poor and vulnerable
envisioned during design, but the project also succeeded in increasing the utilization of the poor
and the vulnerable vis-à-vis other groups.
Efficiency of project execution:
73. The efficiency of project execution, as measured by the speed of disbursement, was poor.
As described in section 2.2, actual disbursement lagged behind planned both in the initial and
extension phases. Slow disbursement imposes opportunity costs by tying up resources that could
have been made available to other projects or activities. At least, the September 2011 credit
cancellation helped to keep the money in India‟s IDA allocation, minimizing the opportunity cost
of unspent resources at project close. Counterpart (GOI) funds were made available in a timely
fashion.
Sectoral and allocative efficiency:
74. Given how government financing for health grew from when the project was designed to
its close (see Annex 3), the marginal financial contribution of RHSDP to the health sector fell
over time. Over the seven years of implementation, the average annual contribution of the project
fell from a projected 5% of government health spending to only 3.5%. However, its funding was
highly complementary to the focus of the additional government expenditure and to the focus of
other Bank projects that were implemented over a similar period. While NRHM, for example,
focused more on primary care (and was also supported by the Bank‟s RCH II program), RHSDP
focused mainly on secondary facilities and the quality of care at those levels. Moreover, the
project made strategic investments in strengthening particular areas of health system development
(such as those related to policies, processes and training) so that with a given amount of resources,
government would be able to produce better outcomes, effectively pushing out the production
possibility frontier. This suggests that expenditure on RHSDP is unlikely to have (inefficiently)
distorted health program allocations.
Rating: Satisfactory
3.4 Justification of Overall Outcome Rating
75. Given substantial relevance, moderately satisfactory efficacy and satisfactory efficiency,
the overall outcome rating is moderately satisfactory.
Rating: Moderately Satisfactory

22
3.5 Overarching Themes, Other Outcomes and Impacts
(a) Poverty Impacts, Gender Aspects, and Social Development
76. This has been discussed considerably in the previous sections. To summarize:
Impact on poverty and social development
77. It is well-known that health shocks are a major cause of poverty. Loss of income (linked
to absence from work and farming) and the associated direct costs (consultations, medicines,
diagnostic care) and indirect costs (opportunity cost of family members spending time in care-
giving) push households into poverty and exacerbate poverty among the already-poor. By
focusing on improving the effectiveness and the quality of care (PDO 2) for all groups, but
especially the poor and vulnerable (PDO 1), the project‟s development objectives are focused on
reducing the poverty associated with illness shocks. However, this project went further than most
in a number of respects. First, it targeted a poor state and, within that state, some of the most
vulnerable groups. Second, it devoted an entire project component to innovations that work on
different dimension of access to care (e.g. geographic, financial and social) to enable health care
to better reach the poor and vulnerable (see Annex 2). Third, it revised the results framework and
set up a new data collection process specifically to enable outcomes among the poor and
vulnerable to be monitored – something that was not previously possible in the state and,
moreover, was not being done in many Bank projects – and succeeded in collecting the relevant
data. Finally, project indicators show that health care utilization among the poor and vulnerable
households improved both in absolute terms and relative to non-poor and non-tribal households.
Gender aspects
78. The health facilities targeted by the project were important for the quality of institutional
delivery in the state, especially those that function as referral hospitals for complex pregnancies,
with implications for maternal mortality. With the JSY program promoting institutional delivery
on the demand-side, the project was an important, and necessary, supply-side complement. Most
patient counselors were women, in part for purposes of gender representation and in part to help
ensure that female patients received the care that they needed.
(b) Institutional Change/Strengthening
Through its component on policy development and management, the project contributed to the
strengthening of institutional capacity at many levels. Most importantly, through working in such
an integrated fashion with NRHM, capacity-development within the project was simultaneously
strengthened within NRHM institutions and the Ministry of Health and Family Welfare. One
highlight was the development of documentation and models for public private partnership,
building MoHFW‟s capacity to contract with the private sector going forward; another was the
development and implementation of the hospital activity formats which will strengthen the
capacity of the MoHFW to monitor performance in the health sector; as well as extensive training
including in health administration, management, procurement of drugs/supplies. Many RHSDP
project staff will remain part of the MoHFW and the State Institute for Health and Family
Welfare (SIHFW) will take up all the training previously provided under RHSDP with the aid of
the RHSDP materials. The role of the project in institutional strengthening goes beyond the health
sector. For example, RHSDP worked with a variety of other public and private institutions, such
the State Pollution Board, private sector CTFs and municipalities to set up processes by which
they could work together for health care waste management.

23
(c) Other Unintended Outcomes and Impacts (positive or negative)
79. Unintended beneficiaries include the new state programs that were not envisaged when
the project was designed. NRHM, introduced in 2005, was an unintended beneficiary since it had
not come into being when the project was being prepared, but yet the project adjusted to support
it by sharing resources, capacities and defining complementary goals and activities. The SIFHW,
too, was an important beneficiary, since RHSDP was tasked with building its capacity and left it
with a mandate to undertake all training for the NRHM.
4. Assessment of Risk to Development Outcome
80. The project was designed to be financially and institutionally sustainable and, moreover,
when the external environment changed during implementation, the activities were modified
accordingly in an attempt to ensure continued convergence with government programs and, thus,
sustainability. At design, it was projected that the total recurrent cost of the project would be low
enough at project closing to be taken up by the government and, by the actual closing date, the
actual annual amount was even lower than originally planned. In addition, with an increasing
share of recurrent operational costs planned to be borne by the state as implementation proceeded,
the gradual adoption of certain on-going activities was planned from the start. Moreover, when
the environment changed with the launch of NRHM, there was careful discussion between the
task team and NRHM to re-align activities with NRHM priorities and in accordance with those
that could be taken up by NRHM post-project.
81. A number of project activities were, in fact, investments in future service delivery and,
thus, can be expected to contribute to the sustainability of development outcomes. These include,
among others, training in clinical and managerial skills, the development of HCWM protocols
and processes, public-private partnership development and HMIS-strengthening (see section
3.4b).
82. It is likely that the improvements in many of the project development outcomes will be
sustained, if not further enhanced, beyond the project period – even if actual project
activities/outputs are not taken up by the government to the extent that is hoped. This is largely
due to factors external to the project, including the increase in health financing in the state (see
Annex 3), the priority given to Rajasthan as a focus state in the NRHM, and the number of
demand-side interventions that remove financial barriers to accessing care. The JSY program
continues to provide free institutional delivery for all mothers, as well as additional demand-side
incentives to BPL women (to cover transport and opportunity cost) and the ASHAs who
encourage them to seek care; the Chief Minister‟s program provides free care for BPL patients;
and, from October 2011, a new program provides 400 essential medicines free to all BPL patients
in public facilities. In addition, the number of nurses/ANMs in tribal areas increased (although the
number of doctors fell) over the course of the project and the government has indicated its
intention to continue the outreach camps started by the project. While the system of patient
counselors has been discontinued, project studies shows that they were anyway not particularly
instrumental in improving the access of the poor. Taken together, these factors mean that the risk
to PDO 1 (i.e. access to care of poor and vulnerable populations) is low.
83. What is less clear is whether the increased utilization by these groups, and others, will
continue to be met by the appropriate supply-side investments in institutional strengthening and
capacity-building necessary to improve the quality and effectiveness of care (PDO 2). On the
positive side, resources are available and, with respect to project activities that will contribute to
sustained development outcomes, health care infrastructure has been improved by the renovations
24
to all project facilities (at least once), the SIHFW (which is tasked with all training under NRHM)
has taken over all training modules developed under RHSDP, HCWM processes have become
institutionalized (although this outcome is threatened by the fact that the state is unlikely to
commit funds to maintaining CTF connectivity), the HSITs use the project HAF to monitor and
improve service delivery and the government had promised to equip recently-renovated facilities.
However, more profound policy changes are still needed to improve service quality over the long-
term, e.g. better drug prescribing, and changes in the structure of incentives faced by doctors in
order to keep good doctors in remote areas and, possibly, more managerial autonomy at the
facility level to manage in a quality- and results-orientated fashion. Consequently, the outlook for
the sustainability of PDO 2 is less optimistic.
Rating: Moderate
5. Assessment of Bank and Borrower Performance
5.1 Bank Performance
(a) Bank Performance in Ensuring Quality at Entry
84. The Bank team performed quite well in delivering a project that was well-aligned with
government and Bank priorities, was informed by substantial analytical work and lessons learned
from previous Bank projects, could feasibly be implemented, carefully considered future
sustainability and took steps to mitigate the risk of slow procurement (see discussion in section
2.1 for details). The team is also to be commended for its tenacity in working with government to
obtain the buy-in needed to introduce “soft” elements into a state-level health system
strengthening project. Attention to safeguards was adequate and the project had numerous design
elements in place to better reach the poor.
85. The main weakness was the quality of results framework, as well as the monitoring and
evaluation plans (discussed at length in section 2.3). The team could also have given more
consideration to the implications of human resource (HR) constraints for project design and
implementation and whether related risk mitigation strategies were needed. The 2005 QAG
quality-at-entry review suggested that the implementation of Component 3 would have been
faster if more of the details of its interventions had been elaborated during preparation rather than
left for implementation. Finally, the PAD could have more substantially addressed the state‟s
socioeconomic situation and health sector challenges and it did not describe very well how all the
background analysis actually informed project design (something on which the QAG Panel also
commented).
86. The QAG panel rated overall quality at entry as moderately satisfactory (3 on scale of 1
to 6 where 1 is the highest rating), citing the overall project strengths as its partnership with
government and targeting, and its overall weaknesses as the monitoring and evaluation
arrangements, as well as the preparation of Component 3. This ICR concurs, but would like to
point out that more detailed elaboration of the Component 3 interventions beyond the analytical
work undertaken would have been difficult (and premature) while the team was still working on
getting government support for the inclusion of these types of activities.
Rating: Moderately satisfactory
25
(b) Quality of Supervision
87. The intensity of implementation support provided by the task team to the PMU was
exceptional and the staff of the PMU speak highly of the commitment of the task team that
supervised this project for most of this period. They cite, especially, the way that the task team
worked with the PMU to develop precise follow-up actions for each mission and weekly audio
calls during the difficult implementation period in 2008-09. The Bank was able to provide
relatively good continuity of staffing with only three changes of team leadership in ten years of
preparation and supervision, and the task team leader (TTL) who was in place for all but the last
few months of supervision was also part of the preparation team. However, the client was
discouraged by the fact that a new TTL joined just prior to project closing (when the existing
TTL left the unit) and that there was some uncertainty as to whether the project would again be
extended in 2011.
88. The task team did its due diligence in ensuring fiduciary compliance (financial
management and procurement) throughout the project, as well as monitoring safeguards.
Moreover, a special effort was made in the post-DIR period through the development and
implementation of an action plan to help to prevent fraud and corruption and address any
associated weaknesses. The task team assured the implementation of the tribal development plan
and performed well in bringing the HCWM plan to fruition.
89. The supervision period was marked by great proactivity and flexibility. Most notable was
the dynamic way in which the task team responded to the changing environment in the health
sector during implementation, modifying the design to one that was complementary to the new
programs (see section 2.1). The team also planned well for the post-project period when NRHM
and RHSDP activities would be converged and pushed hard to get the necessary transitional
arrangements in place. The team was also proactive in the just-in-time cancellation of the
remaining credit before project close to ensure these funds were returned to India‟s IDA pool.
90. Faced with a sharply declining supervision budget during the extension phase (with
annual expenditure on supervision during the extension phase less than half of that during the
original project period (see Annex 4), the team tried to maintain the intensity and breadth of
missions by reducing travel costs. The team also brought a fair amount of technical skills and
subject experts to meet the evolving needs of the project.
91. The team was less successful in working to improve the monitoring and evaluation in the
project. As has already been discussed, it did not revise the weak results framework early on
(despite this weakness being pointed out by a QER), realistic targets were available only fairly
late into implementation, and no overall project evaluation was planned. There also appear to
have been some missed opportunities to engage senior policymakers in larger health system
reform issues, as communication tended to focus mainly on lagging project implementation issues,
and less on broader policy dialogue. The final project aide-memoire is an exception in that regard;
it discusses at length the future of health system development in Rajasthan, implicitly also
highlighting possible areas of future engagement for the Bank. Finally, more could also have been
done to expose the client to international experience and practices, although (as already noted) the
government withdrew support for international training in the later years of the project.
Rating: Satisfactory
26
(c) Justification of Rating for Overall Bank Performance
The above discussion shows that the Bank delivered a well-designed project whose main
weakness was the quality of the monitoring and evaluation arrangements and, to a lesser extent,
adequate consideration of HR-related risks and preparation of the multiple small-scale pro-poor
interventions envisaged under the project. During supervision, while the team remained weak in
the area of M&E and also could have exploited more opportunities for policy dialogue, it was
remarkably committed, diligent and proactive in working with the government over a long (and
sometimes difficult) implementation period to overcome bottlenecks and flexibly adjust the
project to better contribute to health system development in a changed health sector environment.
With a rating of moderately satisfactory for preparation and a rating of satisfactory for
supervision, overall Bank performance is rated as moderately satisfactory.
Rating: Moderately satisfactory
5.2 Borrower Performance
(a) Government Performance
92. It took some time for the project to obtain government buy-in during preparation,
especially on the health system strengthening elements and Component 3, but overall government
commitment to the project during implementation was fairly good, especially in the middle years.
This is not surprising since the project‟s development objectives were closely aligned with those
of the government, as expressed through NRHM. Moreover, the government dedicated significant
resources to these goals and also hired more than 4,000 additional nurses/ANMs over the course
of the project in support of NRHM. At the same time, however, NRHM so much eclipsed
RHSDP in importance that the project sometimes suffered from a lack of attention.
93. Nevertheless, the appropriate enabling legislative and regulatory changes (e.g. the
legislative framework for PPPs and the regulations related to health care waste management)
were made in time to allow the project to proceed with related components. In addition, the
government clearly owned the results of RHSDP investments, (rightly) claiming credit for a
number of the accomplishments. Multiple arms of government have also worked together, where
needed, e.g. in implementation of HCWM processes. Fiduciary arrangements were adequate and
covenants were met. Finally, the government has shown some (limited) commitment to sustaining
project investments beyond RHSDP (e.g. through budgeting for equipment, planning for outreach
camps, and absorbing training materials).
94. The weakest area of government performance was its failure to effectively manage the
staffing needs of the project. Unfortunately, the effect of this failure on project performance was
profound. Key position remained vacant for extended periods and burdened staff with multiple
responsibilities (in addition to RHSDP). Consequently, current staff did not have sufficient time
to devote to implementation. This was especially problematic during the extension phase. There
was also frequent turnover of the project director on whose support and proactivity the
functioning of the rest of the PMU was highly dependent.
Rating: Moderately satisfactory
27
(b) Implementing Agency or Agencies Performance
95. The implementing agency was the Department of Medical, Health and Family Welfare of
Rajasthan. Within this department, there were a number of different actors responsible for project
implementation, including the state-empowered committee (overall policy guidance), project
steering committee (supervision of implementation and coordination), state project management
unit (implementation) and district project coordination and monitoring committees.
96. By and large, the core staff in the PMU were very committed to the implementation of
the project and, together were able to achieve much, especially in the latter part of the original
project period. During the extension phase, however, the performance of the PMU was
characterized by a high degree of risk-averseness, especially when it came to procurement, and
staff were over-burdened because of their multiple responsibilities. Moreover, the frequency of
monitoring of project implementation and site visits declined because key project staff did not
receive permission and resources to undertake supervision visits.
97. There were a number of highlights in the state PMU‟s performance, including the
execution of training activities, their successes in procurement when they first took over that
responsibility from PSAs, and their monitoring of the timeliness and completeness of HAF data.
Financial management was sound.
98. There was considerable variation in the performance of the district PMUs which was
reflected in quality of interventions supported by the projects in those districts. There was little
turn-over, however, capacity improved over time and, as seen on ICR field visits, in some cases
the additional interventions and project monitoring undertaken at the district level were quite
remarkable.
Rating: Moderately satisfactory
(c) Justification of Rating for Overall Borrower Performance
99. Overall, with a moderately satisfactory rating for government performance and a
moderately satisfactory rating for implementing agency performance, overall borrower
performance is rated as moderately satisfactory.
Rating: Moderately satisfactory
6. Lessons Learned
100. Capacity of procurement staff in PMUs and procurement support agencies needs to be
more rigorously assessed: Despite the fact that all procurement plans, bid documents, technical
drawings etc. needed for the first year of implementation were already prepared during project
preparation phase, and that procurement support agencies were contracted, the project still
experienced major procurement delays which resulted in slow disbursements. Teams need to
more carefully assess whether planned activities designed to overcome procurement bottlenecks
are likely to work, paying careful attention to the capacity of the project procurement staff and the
selection of the procurement support agencies.
101. The long-term payoffs of integration and harmonization with government programs need
to be balanced with the short-term needs of project implementation: Following government‟s
implementation of NRHM, RHSDP and government sought convergence and integration of the
28
two programs in order to promote complementarities and ensure sustainability of RHSDP
investments. While this process had the positive effect of having senior policy makers in charge
of both the program and the project, it did reduce the amount of time that the project director was
able to devote singularly to project implementation because he was also the head of NRHM.
102. Human resource constraints, both at project management and at facility level, need to be
explicitly considered in project preparation: The RHSDP did not give sufficient consideration to
the implications of human resource (HR) constraints for project design and whether alternative or
additional investments in HR were needed. While staffing decisions are typically beyond the
Bank‟s (and even the project‟s) influence, teams would do well to at least have a risk mitigation
strategy in place to deal with potential problems of vacancies and under-staffing. Complementary
analytical work, as well as policy dialogue on human resource issues, could also be considered. It
would be helpful if task teams working on other projects within the Bank‟s health, nutrition and
population sector portfolio were given more guidance in this regard.
103. Ensure that dealing with project implementation and processing does not crowd out
engagement in effective policy dialogue: Faced with implementation difficulties, teams tend to
focus on the project implementation issues that require resolution. However, they also need to
make a concerted effort to use the opportunities provided by an active project to engage in policy
dialogue with clients on overall health systems development which could potentially have a far
greater long term impact.
104. Monitoring and evaluation arrangements should receive more priority so that project
performance can be correctly measured: In particular, baselines should be in place early,
evaluations should be planned and changes to the results framework should be made as soon as
possible to reflect project restructuring and any changes to targets; waiting until late in project
implementation may negatively, and unnecessarily, affect project outcome ratings. This is an area
that may need greater management attention.
7. Comments on Issues Raised by Borrower/Implementing Agencies/Partners
(a) Borrower/implementing agencies
105. All issues raised in the Borrower‟s ICR (see Annex 5) were taken into consideration in
the drafting of the Bank‟s ICR. In addition, any factual inaccuracies in the Bank‟s draft ICR that
were pointed about by the Borrower in the Borrower‟s comments on the Bank‟s draft ICR (also
see Annex 5), received March 26, 2012, were corrected in this version of the ICR.
(b) Cofinanciers
106. There were no other cofinanciers.
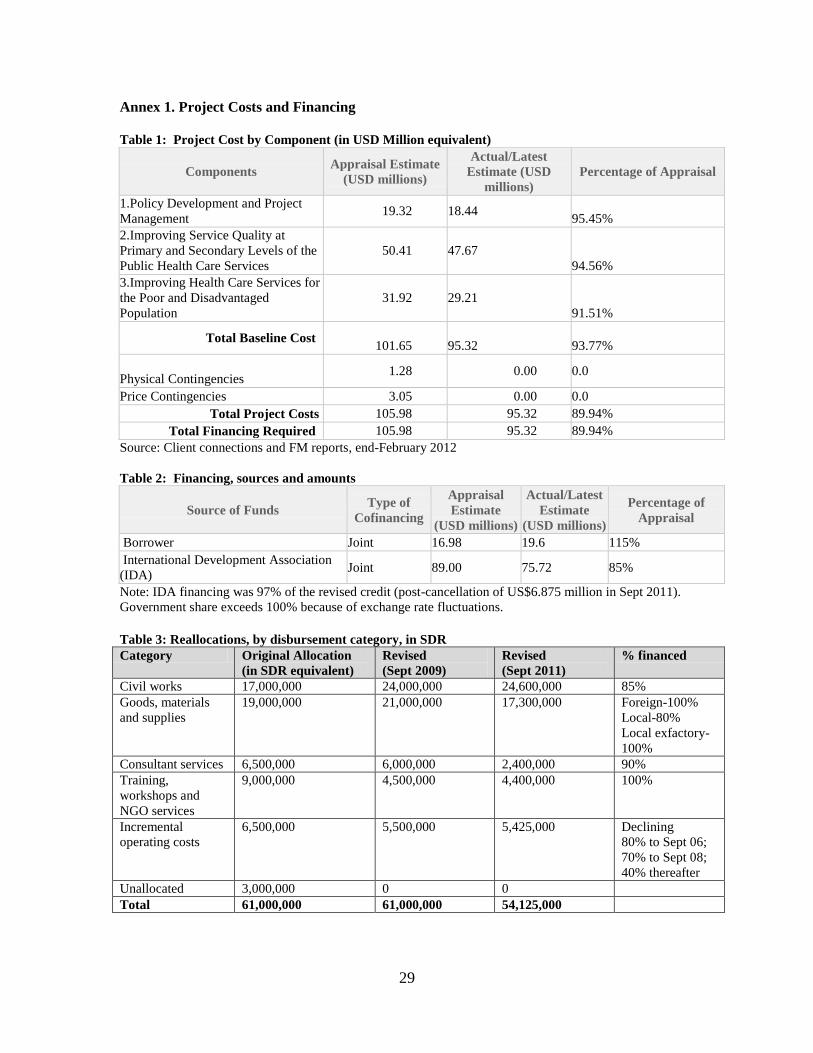
29
Annex 1. Project Costs and Financing Table 1: Project Cost by Component (in USD Million equivalent)
Components Appraisal Estimate
(USD millions)
Actual/Latest
Estimate (USD
millions)
Percentage of Appraisal
1.Policy Development and Project
Management 19.32 18.44
95.45%
2.Improving Service Quality at
Primary and Secondary Levels of the
Public Health Care Services
50.41 47.67
94.56%
3.Improving Health Care Services for
the Poor and Disadvantaged
Population
31.92 29.21
91.51%
Total Baseline Cost 101.65 95.32 93.77%
Physical Contingencies 1.28 0.00 0.0
Price Contingencies 3.05 0.00 0.0
Total Project Costs 105.98 95.32 89.94%
Total Financing Required 105.98 95.32 89.94%
Source: Client connections and FM reports, end-February 2012
Table 2: Financing, sources and amounts
Source of Funds Type of
Cofinancing
Appraisal
Estimate
(USD millions)
Actual/Latest
Estimate
(USD millions)
Percentage of
Appraisal
Borrower Joint 16.98 19.6 115%
International Development Association
(IDA) Joint 89.00 75.72 85%
Note: IDA financing was 97% of the revised credit (post-cancellation of US$6.875 million in Sept 2011).
Government share exceeds 100% because of exchange rate fluctuations.
Table 3: Reallocations, by disbursement category, in SDR
Category Original Allocation
(in SDR equivalent)
Revised
(Sept 2009)
Revised
(Sept 2011)
% financed
Civil works 17,000,000 24,000,000 24,600,000 85%
Goods, materials
and supplies
19,000,000 21,000,000 17,300,000 Foreign-100%
Local-80%
Local exfactory-
100%
Consultant services 6,500,000 6,000,000 2,400,000 90%
Training,
workshops and
NGO services
9,000,000 4,500,000 4,400,000 100%
Incremental
operating costs
6,500,000 5,500,000 5,425,000 Declining
80% to Sept 06;
70% to Sept 08;
40% thereafter
Unallocated 3,000,000 0 0
Total 61,000,000 61,000,000 54,125,000

30
Annex 2. Outputs by Component
Overall, RHSDP was fairly successful in completing its planned activities. The matrix below
summarizes the outputs delivered within the project period, by component:
P Component 1: Policy Development and Management
P.1
P.1.1 Establishment of a project management unit with key staff for project implementation
P.1.2 Establishment of District Project Management Units in 32 districts of the state for project
implementation
P.1.3 Strengthening strategic planning capacity through establishing and operationalizing the
strategic planning cell
P.2
P.2.1 Public Expenditure Review for state of Rajasthan completed for the health sector
P.3
P.3.1 Consultations on private public partnership with district level stakeholders, PRIs and NGOs
undertaken.
P.3.2 Orientation to national and international experiences on public private partnerships provided.
P.3.3 Diagnostics of private sector in health care
P.3.4 Model PPP contracts developed for contracting of the private sector for the provision of
ambulance services, mobile health services, operating PHCs and contracting in specialist
services
P.4
P.4.1 Established baseline data on selected health indicators
P.4.2 Designed and implement HMIS including formats and guidelines
P.4.3 Electronic reporting formats created for capture of performance data
P.4.4 Government orders issued for greater coordination between RSHDP, Directorate of Health and
NRHM for strengthening of institutional mechanisms at state and district levels.
P.4.5 Personnel Information System developed in collaboration with National Informatics Center
P.4.6 Electronic Hospital Information System developed to capture performance indicators from
hospital and for incorporation into the NRHM supported HEALING software
P.4.7 Web based Hospital Management System established in 9 district hospitals. Computer software
developed and hardware procured and deployed for operationalization of the HMS.
P.4.8 Performance indicators with baseline values and targets for achievement developed to track
performance of project against planned activities and its development objectives.
P.5
P.5.1 Establishment of hospital training complex at district hospitals
P.5.2 Completion of the following trainings
- 124 personnel trained as trainers
- 396 doctors for management training
- 175 nurses for management training
- 402 health personnel for administrative training through foundation course
- 3062 health personnel for clinical training (pediatricians in newborn care,
management of critically ill patients for physicians, management of polytrauma and
trauma for general surgeons, care of the new born and low birth weight babies for
SMO and MOs, pediatric nursing for staff nurses and ANMs, ICCU nursing care for
staff nurses and ANMs, nursing training for management of polytrauma and trauma
and orthopedic splints, biochemistry procedures for lab technicians, radiographic
techniques and radiodiagnosis for
- 284 health personnel for quality improvement training
- 1136 health personnel for referral training
- 820 doctors for rational use of drugs training
- 13233 personnel for health care waste management training

31
- 1296 personnel for equipment management and maintenance training
- 4814 health personnel for behavior change communication training
- Induction training provided to 131 counselors
- 133 personnel for computer training and data management
- 194 personnel for HSIT operationalization
P.5.3 A total of 255 sate and district level workshops and conferences completed, of which the
following are key:
- PPP in health sector
- Health Care Waste Management Sensitization workshops in 32 districts
- Gender workshop
- State Health Systems workshop
- Annual consultation with major stakeholders
- Workshop on policy related issues
- Workshop on finalizing health care waste management guidelines, protocols and
formats
- Workshop on standard treatment guidelines
- Workshop for disseminating strategy for HMIS
- Workshop for strengthening procurement of drugs/supplies
- Workshop to develop set of quality indicators
- Workshop for finalizing referral protocols, referral card and feedback cards
- Workshop for developing IEC materials
- Dissemination workshops to share the findings of govt. schemes and preparation of
guidelines
- District workshops for dissemination of referral protocols and cards
- Training in WB procurement procedures for PMU and DPMC
- Workshop for dissemination of HCWM guidelines
- Workshops for dissemination of STGs and EDLs
- Workshop to discuss the CBHI policy after deliberations over the prior activities
- National Health Care Waste Management workshop
P.5.4 Following studies undertaken:
- Study of IEC
- Study to developing the PPP contracts
- Baseline Patient Satisfaction Survey in secondary level government health facilities
- Private sector diagnostic study
- BPL medical card and OERT schemes
- Information Systems Strategy Planning Study
- Mapping study of private providers in districts of Udaipur, Tonk and Bikaner
- Baseline survey for community based health insurance in three district of the state
- Mid-line study for equipment use, maintenance and management
- Midline study for availability and usage of key project inputs
- Review of VCD and ANC campaigns
- Evaluation of quality of civil works
- Validation of HMIS data
- Evaluation of implementation of the Health Care Waste Management Program
- Evaluation of the activities within the tribal development plan
- Gap analysis study with respect to IPHS standards in selected project facilities
- Endline facility and household survey to assess improvement in access and equity of
services at project facilities
- Endline patient satisfaction survey
- Endline quality and utilization of civil works and equipment study
- Assessment of quality improvement initiatives fostered by project
- Evaluation of project supported trainings
- Audit of CTFs
Q Component 2: Health Service Quality

32
Q.1
Q.1.1 Renovation and upgradation of 28 district hospitals, 23 sub-divisional hospitals, 179 CHCs and
2 BPHCs
Q.1.2 Renovation, refurbishment and upgradation of 6 ICUs, 24 burns wards, 19 rehabilitation
centers and 14 trauma centers completed
Q.1.3 Goods of the following value procured for 238 project facilities:
- Drugs and medicines: USD 4.238 million
- Office and other equipment: USD 0.9775 million
- Hospital supplies: USD 3.297 million
- Office and hospital furniture: USD 2.672 million
- Hospital equipment: USD 4.413 million
Q.1.4 Goods (drugs and medicines; hospital supplies; office and other equipment and office and
hospital furniture) procured to strengthen 238 project supported facilities through 6 ICBs, 68
NCBs, 13 National Shopping and 2 Direct Contracts in extension phase
Q.1.5 One time each repair of all dysfunctional major equipment and furniture at 238 project facilities
undertaken in original and extension phase of the project.
Q.1.6 Development guideline and capacity in equipment use and maintenance
Q.2
Q.2.1 Development and implementation of quality improvement guidelines including dissemination
training
Q.2.2 Development and implementation of standard treatment guidelines, referral guidelines and
protocols
Q.2.3 Establishment of Hospital Systems Improvement Teams in 238 project facilities for monthly
review of quality of services and systematic addressing of problems hindering quality.
Q.3
Q.3.1 Establishment and implementation of health care management plan in 343 secondary health
facilities completed. This includes
- Training of 43428 health care personnel
- Civil works (construction of deep burial pits and storage sites) at 343 sites,
- Provision of equipment and consumables to 343 secondary level hospitals,
- Obtainment of authorization from State Pollution Control Board for 238 project
facilities
- Development of IEC materials for HCWM
Q.4
Q.4.1 Consumer feedback and complaint redressal pilot completed in 23 project facilities across 5
districts.
Q.4.2 Community score card pilot initiated in Baran district of the state
R Components 3: Health Services for the Poor
R.1
R.1.1 Design and implement IEC strategy including material development
R.1.2 Implementation of IEC strategy in community health facilities and mass media. This includes:
- Development and deployment of 10 audio jingles on HCWM, patient counselors,
health outreach camps, services in health facilities, referral card scheme etc
- Development and deployment of two audio spots on patient counselor and facility
based services in project supported hospitals
- Establishment of electronic scrollers in 37 district hospitals with 10 health messages
- Establishment of posters and signages in health facilities to improve information
access
- Placement of hoardings outside of health facilities highlighting services available in
hospital, referral card scheme and other key messages
- Placement of information on generic drugs with cost outside pharmacy
- Publishing and availability of citizens charter in all health facilities
R.1.3 Implementation of a village contact drive in 100 villages surrounding 4 newly renovated CHCs
of 4 districts to encourage uptake of health services amongst 25 families per village.

33
R.1.4 Implementation of ANC campaign six tribal districts of the project for improved ANC
registration and uptake of EmOC services.
R.1.5 Implementation of a health communicators pilot wherein 200 ASHAs trained to provide
promotive, preventive and curative information about basic diseases to villages in two pilot
blocks of two identified districts of the state. This entailed:
- Identification of interested ASHAS
- Development of training module
- Training of ASHAs
- Printing of flipchart
- Development of reporting formats
- Institutionalization of monitoring framework
- Data collection to monitor performance of
R.2
R.2.1 Sensitization workshop conducted in Udaipur tribal district for PRIs, NGOs and health care
providers for informing the tribal health plan.
R.2.2 Review of existing schemes for exemption to the poor and dissemination of findings
R.2.3 Implementation of pilot interventions for strengthening schemes on exemption to the poor
R.2.4 Analysis of coverage and utilization of the schemes and scaling up of interventions
R.2.5 Preparatory studies for community based health insurance schemes and review of national and
international CBHI schemes
R.2.6 Implementation of pilot CBHI scheme
R.2.7 Posted 131 counselors at equal number of 50 bedded and above facilities to improve access of
vulnerable groups to care in the hospital.
R.2.8 Conducted 1474 health camps in 9 priority districts with tribal and BPL population for basic
health care services.
R.2.9 Equity funds of Rs 8000 per month to CHCs and Rs 12000 per month to district hospital for
provision of drugs for BPL and poor populations provided.
R.2.10 Baseline survey in three districts to inform the governments Community Based Health
Insurance plan

34
Annex 3. Economic and Financial Analysis
1. The project was prepared in the early 2000s after decades of low and declining
government health spending. It was envisioned that project investments would account, on an
annual basis, for 7-9% of total state health spending during its first three years of implementation
and an average of 5% over the five year implementation period. Project investments, particularly
at the secondary level of care, were intended to significantly contribute to revitalizing government
health care services in the state.
2. However, as it turned out, during the project implementation period, both the state and
central governments dramatically increased their spending on health services in Rajasthan, from
approximately US$116 million in 2004-05 (US$1.91 or Rs 84 per capita) to US$443 million in
2010-11 (US$6.46 or Rs 296 per capita) (see Table 1). This reflected both the growing state
economy and the fact that government health spending increased as a proportion of total
expenditure, and of total GDP. In the five year period between 2004-05 and 2010-11, the per
capita net state domestic product grew by on average 11% annually, while per capita central and
state government health spending increased by on average 27% annually. The average annual
increase in health spending by the state government alone was 16%. Accounting for 0.5% of the
state net domestic product in 2004-05, government health spending increased to about 0.9% of
state net domestic product in 2009-10.
3. The increasing expenditure on health in Rajasthan was not only large in absolute terms,
but also relative to other states in India. Rajasthan exhibited the third highest increase in health
expenditure among all states in India (see Figure 1), after Gujarat and the extremely poor state of
Uttar Pradesh, reflecting the priority given to the state under NRHM and also economic growth.
4. The increase in government spending, coupled with the slower-than-planned
disbursement of RHSDP, means that the overall contribution of the project to total government
health spending fell significantly in the latter years of the project as government health
expenditure increased. Nevertheless, RHSDP still represented a significant proportion of public
spending on health services during its period of implementation: it accounted for on average 3.5%
of total government health spending over the period of implementation, reaching a high of 5.5%
in 2007-08 (see Table 1). By the project closing date, its contribution was only 2.3%.
5. Perhaps more importantly, given the weight of recurrent spending in government health
budgets, the project was an important source of investment spending. Most of the credit financed
civil works and equipment investment. It was also highly complementary to other investments,
many of which focused on primary health care services, under the National Rural Health Mission
(NRHM). In fact, RHSDP was the major source of capital investment for secondary-level
services. Thus, assuming (as is likely) that the state was under-investing in capital relative to what
is needed to produce the optimal amount of health services, RHDSP investments would push the
state health system closer to the production possibility frontier.
6. Finally, to the extent that they enhance the efficiency of a given quantity of capital and
labor (doctors, nurses, administration), the training activities of the project were important in
enhancing the productivity of health services, given a set of given inputs (capital and labor),
including into the future. While all planned training activities were completed in the main phase
of the project, training outputs and expenditure on training in the later periods was considerably
less than originally planned, with implications for the efficiency of the capital investments of the
project.

35
Table 1: Government health spending, Rajasthan (2004-05 to 2010-11)
2004-
05
2005-
06 2006-07 2007-08 2008-09 2009-10 2010-11
State government (Rs lakhs) 46,083 52,490 58,230 65,303 100,336 109,167 119,477
of which plan & non-plan state government
expenditure
46,083 52,490 58,198 60,171 88,315 98,123 104,800
State government contribution to NRHM 0 0 32 4,532 11,061 11,044 14,677
RHSDP 1,959 3,643 5,560 7,158 4,882 4,606 4,704
Other internationally-financed project 0 0 0 600 960 0 0
Central government (Rs lakhs) 5,115 28,814 49,614 65,512 79,883 74,678 83,940
Of which centrally-sponsored schemes 5,115 4,215 4,166 500 900 872 13
NRHM 0 24,599 45,448 65,012 78,983 73,806 83,927
Total (Rs lakhs) 51,197 81,304 107,844 130,814 180,219 183,845 203,417
Total (US$ million) (current) 116 185 238 325 392 388 443
State population (million) 61.07 62.27 63.49 64.73 66.00 67.30 68.62
Per capita government health spending (Rs) 84 131 170 202 273 273 296
Per capita government health spending
(US$)
1.91 2.97 3.75 5.02 5.94 5.76 6.46
Per capita net state domestic product (Rs) 16,874 18,008 21,203 23,986 27,001 28,885
Government health spending as % of net
state domestic product
0.5% 0.7% 0.8% 0.8% 1.0% 0.9%
RHSDP as % of total government health
spending
3.8% 4.5% 5.2% 5.5% 2.7% 2.5% 2.3%
Sources: Rajasthan Department of Medical, Health and Family Welfare, Reserve Bank of India, Census of
India.
Figure 1: Increase in percentage of government expenditure on health, by state, 2003/04 (actual) – 2010/11
(budgeted)
Note: Reserve Bank of India, sourced from Indiastat.com
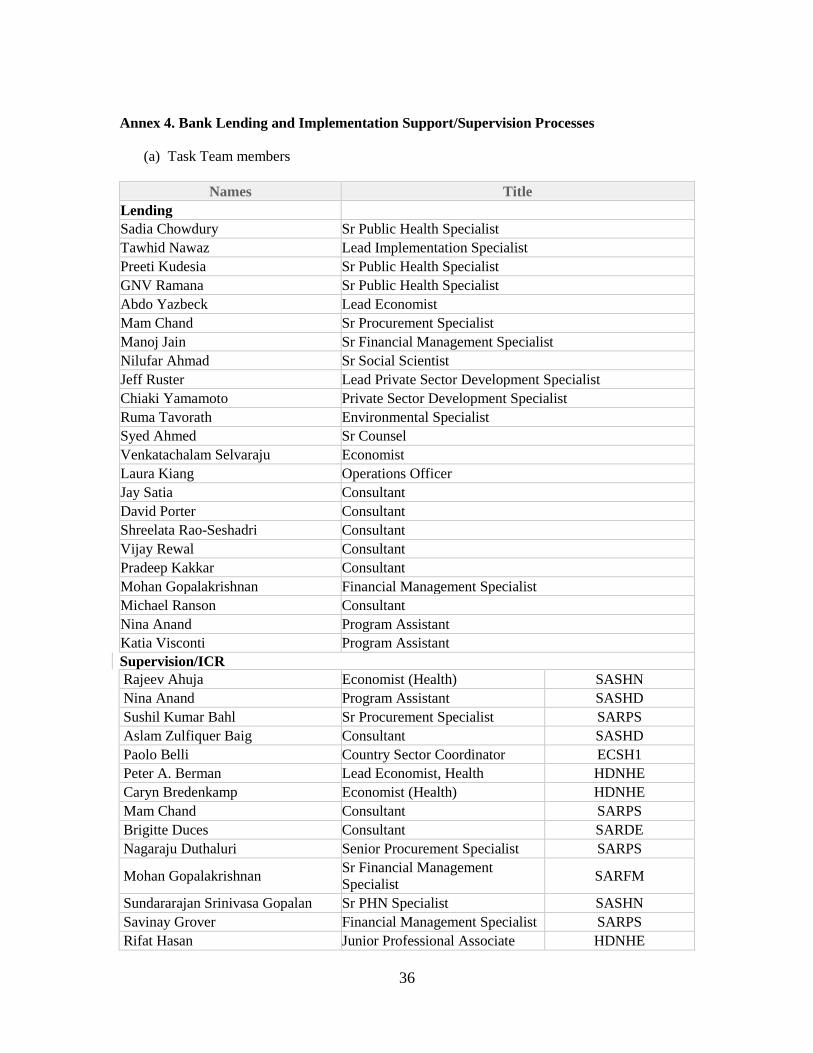
36
Annex 4. Bank Lending and Implementation Support/Supervision Processes
(a) Task Team members
Names Title
Lending
Sadia Chowdury Sr Public Health Specialist
Tawhid Nawaz Lead Implementation Specialist
Preeti Kudesia Sr Public Health Specialist
GNV Ramana Sr Public Health Specialist
Abdo Yazbeck Lead Economist
Mam Chand Sr Procurement Specialist
Manoj Jain Sr Financial Management Specialist
Nilufar Ahmad Sr Social Scientist
Jeff Ruster Lead Private Sector Development Specialist
Chiaki Yamamoto Private Sector Development Specialist
Ruma Tavorath Environmental Specialist
Syed Ahmed Sr Counsel
Venkatachalam Selvaraju Economist
Laura Kiang Operations Officer
Jay Satia Consultant
David Porter Consultant
Shreelata Rao-Seshadri Consultant
Vijay Rewal Consultant
Pradeep Kakkar Consultant
Mohan Gopalakrishnan Financial Management Specialist
Michael Ranson Consultant
Nina Anand Program Assistant
Katia Visconti Program Assistant
Supervision/ICR
Rajeev Ahuja Economist (Health) SASHN
Nina Anand Program Assistant SASHD
Sushil Kumar Bahl Sr Procurement Specialist SARPS
Aslam Zulfiquer Baig Consultant SASHD
Paolo Belli Country Sector Coordinator ECSH1
Peter A. Berman Lead Economist, Health HDNHE
Caryn Bredenkamp Economist (Health) HDNHE
Mam Chand Consultant SARPS
Brigitte Duces Consultant SARDE
Nagaraju Duthaluri Senior Procurement Specialist SARPS
Mohan Gopalakrishnan Sr Financial Management
Specialist SARFM
Sundararajan Srinivasa Gopalan Sr PHN Specialist SASHN
Savinay Grover Financial Management Specialist SARPS
Rifat Hasan Junior Professional Associate HDNHE

37
Pradeep Kakkar Consultant SASHD
Mohammad Khalid Khan Program Assistant SASHD
Asmeen M. Khan Lead Governance Specialist EAPVP
Arun Kumar Kolsur Procurement Specialist SARPS
Preeti Kudesia Sr Public Health Spec. SASHN
Shanker Lal Sr Procurement Specialist SARPS
Manvinder Mamak Sr Financial Management
Specialist SARFM
Arun Manuja Sr Financial Management
Specialist SARFM
Sara M. McKinley Junior Professional Associate SASHD
Swayamsiddha Mohanty Procurement Analyst SARPS
Patrick Mullen Sr Health Specialist SASHN
Shyama Nagarajan Health Specialist SASHN
Naoko Ohno Operations Officer SASHN
Aakanksha Pande Consultant YPP
Krishna Pidatala Sr Operations Officer TWICT
Sangeeta Carol Pinto Consultant SASHN
Om Prakash Consultant SASDT
Snehashish Rai Chowdhury Consultant SASDI
Vikram Sundara Rajan Sr Health Spec. SASHN
Shreelata Rao-Seshadri Consultant SASHN
Vijay Rewal Consultant SASHN
Jayantilal K. Satia Consultant SASHD
Venkatachalam Selvaraju Consultant SASHD
William Franklin Gayer Starbuck Sr Operations Officer SASHN
Ruma Tavorath Sr Environmental Specialist SASDI
Onika Vig Program Assistant SASHN
Elfreda Vincent Program Assistant SASHN
Chiaki Yamamoto Monitoring & Evaluation
Specialist C3PDR
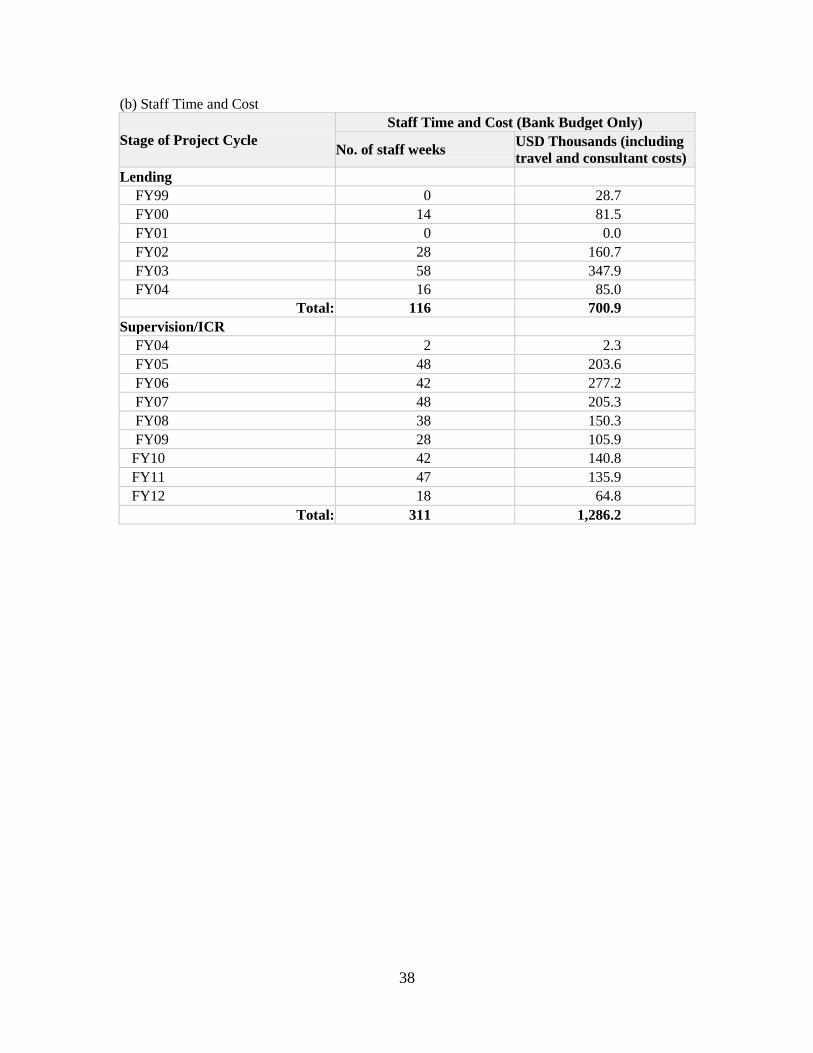
38
(b) Staff Time and Cost
Stage of Project Cycle
Staff Time and Cost (Bank Budget Only)
No. of staff weeks USD Thousands (including
travel and consultant costs)
Lending
FY99 0 28.7
FY00 14 81.5
FY01 0 0.0
FY02 28 160.7
FY03 58 347.9
FY04 16 85.0
Total: 116 700.9
Supervision/ICR
FY04 2 2.3
FY05 48 203.6
FY06 42 277.2
FY07 48 205.3
FY08 38 150.3
FY09 28 105.9
FY10 42 140.8
FY11 47 135.9
FY12 18 64.8
Total: 311 1,286.2

39
Annex 5. Summary of Borrower's ICR and Comments on Draft ICR
1. This annex contains both a summary of the Borrower‟s ICR and the Borrower‟s
comments on the Bank‟s draft ICR. The Borrower‟s ICR has been summarized, as per ICR
guidelines, because it exceeded the 10 page limit. The summary focuses on the Borrower‟s
assessment of implementation progress and results, and omits any information that repeats
information contained in Section 1, including basic project description, annexes, and tables. The
original contribution is available as a public document.
The Borrower’s ICR
Component 1: Policy development and Project Management
Sub component 1.1: Improving the Institutional Framework for policy development
2. Strategic Planning Cell was established in 2004 for strengthening strategic planning
capacity. Consultative workshop to initiate the government activities to design and implement
public-private contract mechanisms was conducted in the first year of the project. The Cell had to
carry out a “Private sector summary profile” study to fill in information gaps regarding private
providers‟, this was combined with „Diagnostics” to determine potential for PPP in the state of
Rajasthan‟ study. The dissemination workshop on the findings of these studies was done in the
first year. The major stakeholders were taken for a study tour to the different Health Systems
Development Projects of Southern India.
3. Vital to the project amongst all was the State Planning Cell (SPC) which has made
significant dent reflected in different operational research for the evidence based planning, and
implementation of interventions: Diagnostic assessment of role of private providers in health
sector, Quality and utilization of civil works, Patient Satisfaction survey – Baseline, Mid-term
and End-term, Baseline medical equipment management and maintenance system feasibility
study, Mid line equipment use, maintenance and management study, Impact Evaluation of
HCWM implementation, Impact Evaluation of tribal health care delivery strategy, Data
Validation study, Assessment of access and equity of healthcare services for vulnerable groups,
Training assessment, Assessment of Hospital Systems Improvement Program
4. As a sensitization tool, a total of 255 workshops covering diverse areas, were held under
the project at various levels (Annexure 1). Under the sub component, private sector was expected
to be roped in for delivery of services at secondary level. Somehow the efforts made under the
project and intent of private sector could not be effectively dovetailed for various reasons. The
only policy to promote private sector in Health care delivery adopted in 2006 could not attract
many big players but for few that too in Medical education and Tertiary care. The regulatory
framework for private sector also turned out to be a fiasco. SPC in an outrage subscribed to
certain areas which were beyond their capacity (e.g. standards and norms for staffing) control.
Sub component 1.2: Strengthening management and implementation capacity: Project
management structure.
5. To implement the proposed project strategy, a four tier Project Management Structure
was established in 2004. The work suffered due to vacant positions (consultant biomedical

40
engineer, consultant health care waste management, and consultants for studies/workshops and
quality improvement initiatives) for some duration.
Sub component 1.3: Strengthening Human Resource: Training & Capacity Building
6. HR cell did laudable work in the area of training and capacity building intended to
improve the quality and effectiveness of hospital services focused on updating the clinical,
managerial and behavioral skills of health staff.
- Training Institutions: Project opted for development and strengthening of trainings
institutions at different levels but the shuffled priorities had a marginal impact in this area
resulting in outsourcing. It was only after SIHFW asserted from June 2008 onwards that
majority of Managerial trainings had uniformity of content and quality barged in.
- Training modules were developed in consultation with various agencies at State /
National level for Clinical/ Managerial trainings, Referral System, Managerial, Quality
Improvement, Hospital Waste Management, Equipment Maintenance/Repair, Behavior
Change Communication, Rational Use of Drugs, Geriatric Care, Disaster Management
and Medical Jurisprudence (Annexure 2).
- Capacity building program: 21 types of trainings were designed for medical and
paramedical staff. A total of 57615 staff members from different cadres were addressed
during the entire project period. Four new types of trainings were also imparted –
Geriatric Care, Medical Jurisprudence, Disaster Management and Disability Management.
Besides, three distance learning courses were also financed under the project - Diploma
Course in Hospital Management at NIHFW, PG diploma Course in Health & Family
Welfare Management at NIHFW and Diploma in Health Care Waste Management in
collaboration with IGNOU.
- Monitoring and Evaluation of training programs: Benchmarks indicators for measuring
performance were developed to facilitate monitoring. This was carried out by periodic
evaluation/assessment of the quality and, impact evaluation of training programs was
undertaken for each of the training to assess the effectiveness of the training program. A
mid-term evaluation of training programs was to be done but somehow not taken up. The
end-term evaluation for various training program was conducted by SIHFW and report is
to be submitted by Sep.29, 2011. Though concerted efforts were made to ensure that
training plan is in sync with schedule, still it swerved at times for reasons beyond the
control of project. To put it straight, some of the reasons that asked for digression were-
Seasonal or unwarranted disease incidence, campaigns, Medical Colleges too busy,
reluctance on part of trainees to attend the training, and district authorities not reliving the
nominated staff for training programs on one or the other pretext.
7. To ensure that trainees after nomination attend, certain actions including recovery of unit
cost of trainings from absentees were initiated. Further, the training institutions were strengthened
and SIHFW was made the nodal agency for all the trainings across the state which led to
substantial improvement in content & quality of trainings. These were also monitored regularly
by RHSDP and involvement of Program officer as trainers was ensured.
Sub component 1.4: Strengthening health management information system.
8. Data translated into information, is an essential ingredient for planning so that
information can be translated to inference for making evidence based intelligence driven
decisions. Somehow, Information and Data are always ceded ritually by Health professionals.
The project strived hard to strengthen the existing HMIS at DM&HS and the information

41
generated at different levels of facilities was compiled through DPCs and sent to the PIU. The
QSI Cell was established at PIU in the first year. In view of the on the existing HMIS, and
proposed IT Strategy; Raj. Comp, was consulted to develop a strategic planning for the long term
information requirements of the sector, and recommend architectural corrections in the
technology, long-term system implementation, equipment required and capacity building plans.
- Hospital based Statistics: A base line statistical data base was created for the project
facilities in the year 2005 so that the subsequent progress and performance against select
indicators can be put to a scale through M&E component of the project. A dissemination
workshop was conducted to share the findings and formats. A new format (Hospital
Activity Format) was introduced, where information of existing three formats were
dovetailed (Hospital based statistics, Referral format and Vital Drugs format), besides
including monthly information generated on Vertical Health Programs. This along with
Personnel Information System was incorporated in State‟s HEALING Software.
- Training of personnel on reporting of Hospital Statistics: To ensure the accuracy,
completeness, and timeliness of data collected, Q.I cell of the project imparted trainings
to Data Entry Operators (48) of the six identified priority districts (Bharatpur, Chittorgarh,
Dungarpur, Jhalawar, Jodhpur and Tonk). Hardware related to the implementation of
HMIS was procured for facilities.
- Reporting on Availability of Essential Drugs: The Stock position of 15 essential drugs
for reporting across project facilities during the month was included and was incorporated
in the hospital activity format.
- Monitoring & Evaluation (M&E): DPCs share the hospital performance in the HSIC
meetings at the district level so that parameters requiring improvement are addressed
regularly on priority. With time these detailed and regular feedbacks lead to an increase
in reporting by institutions and the submissions of completed records as per the decided
timeline (15th
of each month). A study on validation of data was also conducted. The
often neglected feedback mechanism was strengthened, with feedback provided by the
end of each month to the Medical Officer-Incharge by the respective DPCs and sharing it
with all members of the HSIC (which includes respective MO I/Cs) during the monthly
meeting at the district level. Data compiled and analyzed were used for observing trends
in time and space for improvement in performance of institutions.
- Arogya Online HMIS Software: The software was initiated through DoIT and RajCOMP
to automate the Hospitals in the state to improve the patient care. The software is
presently implemented in 15 district hospitals. RHSDP has supported procurement of
hardware, server room readiness and LAN at 9 district hospitals. It is a unique
combination of a „patient centric and medical staff centric‟ paradigm. The software
provides - a unique ID number to each patient which would be valid across the State and
an accurate, electronically stored medical record of the patient. The application gathers
process, and retrieves patient care and administrative information on real time basis.
Through this software the investigation reports of the patients will be available on
internet.
Component 2: Improving service quality and effectiveness at primary and secondary levels.
9. This component enhanced the capacity of health facilities to provide quality health care
by refurbishing existing facilities, upgrading effectiveness of services, improving referral system
and strengthening community capacity to demand and use appropriate services.
Sub component 2.1: Extending/Renovating Facilities under the Project:
42
10. Under phase I 239 (Including creation of PIU) facilities were identified for up-gradation,
renovation, addition and alteration so that besides improving aesthetics the facilities are
functional. This included seepage correction, water proofing, flooring, painting of walls,
refurbishing of toilets, electricity, water supply & sewerage system, surface drainage, repair of
campus road, boundary wall, gates etc.
11. The quality testing of the civil works was done by MNIT, Jaipur. Apart from renovating,
the PIU building and five new CHC (Sahjahanpur, Kapasan, Malpura, Merta City, Sultanpur)
were constructed. The construction was completed in 233 facilities while at six of the facilities
(Navalgadh, Ravatbhata, Bengu, Piparali, Laxmangadh & Balesar) it was deferred for reasons
beyond control. The completed works have made the facilities a little more functional and have
been appreciated by Medical officers (documented in a separate study by SIHFW). Slow
disbursement of funds led slower pace of civil works.
12. In the extended phase, trauma centers, ICU, burn unit & rehabilitation centers were
constructed. Out of the targeted 63, fifty nine have been completed and work is in progress in
four facilities. The engineering cell had the responsibility to manage the contracting out of design
and construction of civil works to private sector architects/consultants and contractors and to
check, coordinate and supervise their work. A study on End term Quality and utilization of Civil
Works and Equipment provided by the project has been done.
- Equipment Management and Maintenance Workshop: Establishment of a Zonal level
medical equipment management and maintenance workshop was a key activity during the
extension phase. RHSDP had envisaged the establishment of Health Equipment and
Repair Unit in Jaipur zone on a pilot basis at Mini Swasthya Bhawan, Sethi Colony
Jaipur; building for the same has already been constructed. The medical equipment
management and maintenance workshop was proposed on an outsourced model;
subsequently deferred and now project would be taken up under the aegis of RMSC for
which fund of Rs 50 lacs have already been allocated in PIP for the year 2011-2012 in
NRHM.
- Establishment of Drug Logistics and Drug Warehouse: To ensure the availability of the
drugs with assured quantity at all levels the drugs and warehouse management system
was introduced in the state by RHSDP. RHSDP took up the procurement of hardware,
computers, racks and other handling equipment, while NRHM had taken over the aspects
of repair/ renovation of 24 existing drug warehouses, five New Drug ware house
construction, software development, recruitment of pharmacists & other personnel, Drug
warehouse maintenance etc. For implementation of the logistical drugs and warehouse
management system, one additional module for drug warehouse has been developed by
CDAC as part of AROGYA ONLINE HMIS Software. Orientation cum hands-on
computer training has been imparted by Government of India officials on “effective
implementation of Procurement Management Information System (PROMIS)” for all
GOI supplies.
Sub component 2.2: Improving Health Care Waste Management System
13. The hospital waste management activities were looked after by Quality and Systems
Improvement Cell. The District Hospital Waste Management Committees were formed and
Hospital Waste Management Committees and Hospital Waste Management Teams at facility
levels were also formed but these were later merged with HSIC at district level and HSIT at
facility level.
- Workshops were conducted at all the levels to generate awareness on the subject in the
first year of the project. Development of Standard Operating Procedures (SOP),

43
Guidelines, Protocols and Formats for HCWM practices was undertaken. A consultative
workshop was conducted at the State level for development and finalization of the same
in the second year. The forming of HCWM committees was undertaken by DPCs at the
facilities in second year.
- Trainings: HCWM trainings focused on hands-on training of the staff of facilities at their
door step was designed. A ToT to train two persons from each district including all DPCs
(32) under the project in the first year was conducted. In the second year trainings were
initiated in a phased manner. In phase I, 40 facilities (out of 343) with 100 bed strength
and above were selected for the hands-on training to complete staff. These trainings were
given by the agency “Parirakshana”. In phase II remaining facilities with bed compliment
of 30 & 50 were covered. Training programs were extended to all CHCs and also
included PHCs in the third year. Redesigning of on-site training package was taken up in
fourth year. Coordination with NRHM was done to monitor training activities. The
retraining at CHCs was completed and PKG 02 at PHCs were initiated in the sixth year
and in the seventh year initiation of PKG 03 was done. The PKG 02 & 03 trainings were
provided by Centre for Environment Education (CEE).
- Procurement: Detailed specifications for each item (bags, disposal bins & sharps
disinfection bins) were drawn by a team of experts. Accordingly, the procurement cell of
the project followed National Shopping method and completed procurement and supplied
to the facilities. A need based assessment of the procurement of hospital supplies was
done in the second year. Introduction of green bags and bins and PPTC for blue bins was
done in sixth year.
- Civil works: The design and drawings of civil works for storage and disposal of the Bio
Medical Waste / Health Care Waste was finalized by the Civil Cell of the project, and the
construction work was initiated by DPCs in the first year through PWD. The civil works
were completed in the second year. In the fourth year additional civil works were
undertaken. Design and cost estimates were done for PHCs.
- Monitoring: Short term consultant was appointed. The DPC in the districts carried regular
monitoring of the trainings and the HCWM procedures being followed at the facilities.
Fusion of HCWM meetings in the HSIP helped in regular monitoring of HCWM related
ongoing activities.
- Authorization: This process was initiated in the CHCs in the second year and decision on
getting Common Treatment Facility (CTF) services and payment of user charges was
done. CTF services extended to all 10 service providers in the third year. It was followed
by the services of CTF operators for one time cleaning of burial pits in the following year.
To review CTF operations a district level monitoring team was constituted. In the
extended phase of the project initiation of authorization process for all PHCs and
dispensaries and improvement in CTF connectivity and regularity of CTF services was
undertaken. Focus on intradepartmental coordination with the officials of DMHS and
other stakeholders were done for authorization process.
- IEC: The IEC developed by Centre for Environment Education (CEE) a GoI undertaking
were procured and supplied to all 343 facilities. Training kits were disseminated amongst
the user hospitals, 250 such kits including audio and audio visual presentations (in 2
CDs) were part of this training kit. A booklet covering related aspects of information was
published and disseminated in the Swasthya Sammelan held at Jaipur in Aug-2006. This
booklet is now being used as reference material. Strengthening of IEC was done in form
of developing Audio Visual film on HCWM practices, and color coded flexi sheets in the
second year by RHSDP itself.
- Mid-term evaluation was done by SIHFW in the fifth year, the finding and
recommendations were shared with all stakeholders. No end-term evaluation was done
but instead a report which documented good practices and lessons learnt over the 6 year

44
period of implementation was prepared. To share the progress made in the field, a State
level workshop was conducted in the third year and a National workshop of HCWM for
experience sharing in collaboration with SIHFW, Rajasthan was organized on May 12-13,
2011. End term Common Treatment facility Audit has also been undertaken.
Sub component 2.3: Upgrading quality and effectiveness of clinical, management and support
services
14. Service and STGs were developed indicating treatment of particular disease at different
levels of facilities. Equipment Procurement and Maintenance Cell looked after the procurement
of equipments and other goods and managed their maintenance in consultation with SPC. They
were also responsible for preparing procurement plans and finalization of bids. During the first
phase of the project (2004-2009) 238 health facilities were strengthened by providing medicines,
hospital supplies, equipments and furniture. Under „one time repair‟ work old equipment (major
and minor) and furniture items were repaired at the selected facilities which were put to use for
patient care. During first to third year of the project, procurement activities National Competitive
Bidding (NCB) and International Competitive Bidding (ICB) were outsourced to procurement
support agencies like Hindustan Latex Limited (HLL) and Hospital Services consultancy
Corporation (HSCC). In-house procurement was initiated, after capacity building of the
procurement cell, from third year onwards. Training related to the management and maintenance
of equipment was done. During second to fifth year of the project, the inspecting agency was
Central Scientific Instruments Organization (CSIO), a GOI undertaking, whereas during the
extension phase Rail India Technical and Economic Services Limited (RITES) was the inspecting
agency. Some types of equipments that were supplied during the project period were: Lab
equipments, Electro medical equipments, Imaging (X rays), Pneumatic equipments etc. A
baseline and mid-term evaluation of equipment use, management and maintenance was conducted.
The procurement process was held up for different reasons over the period as delays in bid
evaluation; signing of the awarded contract and non finalization of revised technical
specifications besides objections on projected value of the services. Another reason for delay was
lack of knowledge of and familiarity with Bank guidelines.
15. Medicines and hospital supplies: The Standard Treatment Guidelines (STG) for common
diseases was developed, printed and distributed as well as Essential Drugs List (EDL). Training
of RUD was given to doctors and nursing staff. Workshop on STG was conducted at the state
level while Workshop on revision of EDL based on STGs were conducted at the district level and
so was Dissemination Workshop for STGs. Workshop for developing procurement of
drugs/supplies systems was held at SIHFW. A single study included three studies on assessment
of availability and use of medicines, procurement systems of drugs and hospital supplies and
reviewing access to medicines and hospital supplies system. No mid-term and end term
evaluation was carried out.
16. Hospital Systems Improvement Process: With the aim of institutionalizing the
mechanism of performance and quality improvement, the Hospital Systems Improvement Teams
(HSIT) was constituted in all 238 secondary level project facilities initiating in 2006. Similarly,
HSICs at the district level (with CMHO as chairperson) and HSRT at the state level under
chairmanship of PHS were formed. DPCs were given one-time training to facilitate the process.
The Quality Improvement/HSIT trainings were imparted. The HSIT meetings were supposed to
be held once a month but after the initial enthusiasm the regularity has not been maintained by
some facilities. Consumer feedback and complaint re-dressal (CF&CR) was implemented in five
districts on pilot basis under Hospital Systems Improvement Process for quality improvement. An
assessment of HSIP and CF&CR is being conducted by SIHFW.

45
Sub component 2.4: Improving referral mechanisms and linkages with primary and tertiary levels
17. For services delivered in a comprehensive manner an effective referral system was
introduced with the belief that strengthening of secondary level hospitals would raise credibility
of the primary health care system. Referral at appropriate institution would reduce the gap
between illness and seeking treatment and out-of-pocket expenditure. The procedural activities
taken in the direction of strengthening of the “referral system” were: State level Workshop
conducted for finalizing referral protocols, referral and feedback cards, district level workshops
for sensitization of service providers to the proposed referral system, development and supply of
Referral Registers, Cards (Referral and Feedback) backed by the procedural directives to all
levels of institutions to implement referral system, dissemination of Referral Protocols and
Guidelines, the Referral Card developed has general as well as clinical information of the patient,
the District Referral Committees were established but later merged with HSIC, referral Trainings
to medical and para-medical personnel by SIHFW to sensitize them to the referral protocols and
norms. 1246 trainings have been completed as against proposed 1136, analysis of Referrals has
been done in 49 facilities of the 6 priority districts in the month of May 07 and also time to time,
for effective monitoring, DPCs / other project officials have been directed to monitor the referral
record maintenance and implementation at the facilities, dissemination of the information to the
community about the referral system through IEC (including hoardings at all 343 secondary level
institutions, bus panels, talk shows, documentary, IEC in the health camps in the desert and tribal
districts and in Swasthya Chetna Yatra.
Component 3: Enhancing health care access and equity for underserved populations.
18. The component contributed to the reduction of geographical and financial barriers to
health care through refurbishing selected facilities in underserved and tribal areas; fostering
public private partnership; developing and conducting pilot innovations on topics which enhanced
access to health care.
Sub component 3.1: Improving health seeking behavior in community
19. The third component was catered by Community Access and Equity Initiatives Cell
which had the aim of improving of health seeking behavior of community and improving access
to health care by poor and tribal population to government health facilities. The designing of IEC
material was outsourced and a dissemination workshop for IEC Strategy was conducted. A
workshop on developing IEC material was also held. Major IEC material developed (both in-
house and outsourced) included: print material – Posters and booklets (eg. Social Security
Scheme), Flip book (key health issues) have been printed and distributed to the districts, film
shows and TV spots – educational films produced and telecast on referral system and BPL card
scheme, documentary and short films on key interventions like HCWM, Civil, and Procurement
etc. have been made, animation on MMJRK, patient counselor and HCWM, jingles – Radio
jingles developed on priority issues. These were disseminated through - Hoardings and
signboards – Display various health messages and services available; scroller – placement at
various facilities under process; signage and symbols – installed in all 238 facilities; and local
Media Activities – Folk based media activities organized to spread awareness. A media agency
was contracted out for the task of mass dissemination of electronic materials. Workshop to
sensitize NGOs and PRIs were held on zonal and district level. Awareness campaigns included
Village Contact Drive piloted in tribal districts carrying out door to door campaign, in catchment
areas of CHCs; ANC campaign piloted in selected districts with an aim to ANC registration,
immunization and motivate the target group for institutional deliveries; to generate awareness
46
amongst the citizens regarding their rights and duties regarding services at health facilities,
Citizen Charter were printed and displayed on a board at all health facilities of the Project.
Sub component 3.2: Enhancing access to health care
20. The major interventions taken by CAEI Cell to enhance access to health care included
introduction of outreach camps in tribal regions with the aim of providing specialist services close
to the client, good and cost effective strategy for identification and treatment of chronic problems
and providing timely treatment and referral for emergencies.
- Health/ Outreach Camps: In order to increase the reach of services particularly amongst
Tribal and BPL population in six tribal and three desert districts covering all diseases,
Outreach camps were held between June 2006 to June 2011. A total of 1474 camps were
held with total beneficiaries 602643 (BPL: 240565; Tribal: 203643). For six months there
were no camps due to insufficient allocation of drug budget. These camps have been
instrumental in generating awareness besides offering services to marginalized groups,
and was documented through SIHFW in the 5th
year.
- Patient Counselors: RHSDP introduced the concept of Patient Counselors in different
health facilities to facilitate the access (within facility), utilization of services by
beneficiaries, especially BPL and marginalized group. Patient Counselors were appointed
in 50 bedded and above facilities, (131) in three phases starting from 2006. They were
oriented at the facility level at the time of their induction by the facility staff and further
trainings were done through DPMU. Regular monitoring of their work was done. Their
capacity again was enhanced by reorientation in 2010. The counselors justified their
presence and did contribute to patient satisfaction as documented in another study done
by SIHFW in Aug-Sep.2011.
- Financial support to facilities: RMRS are in existence in each tertiary and secondary level
health facilities since 1996 with autonomy and empowerment. RHSDP had a
complimentary role since its inception in 2005 and till March 2010 had financially
supported 100 facilities with reimbursement of expenses up to Rs. 12000/- per month and
138 facilities with Rs. 8000/- per month for telephone, stationery and other office
expenses.
- Community Based Health Insurance (CBHI): On the basis of the findings of a study
conducted by Research Development Institute (RDI), New Delhi in Ganganagar district
for RHSDP; CBHI was rolled on a pilot basis with the objective of providing protection
to the disadvantaged population against unexpected health expenditure, facilitating the
populace to seek timely and quality health care. Subsequently, a scheme on similar lines,
MMJRK, was launched on January 1, 2009 with added benefits for the BPL and poor
besides other identified categories. Presently the scheme is functional.
- Other initiatives: A few other initiatives under the project were: ASHA Health
Communicator Model (Pilot project), Capacity Building of Health Communicators.
- Studies: In order to plan and subsequently deliver effectively, a feel of what is happening
was had through operational research, field studies were undertaken focusing on: IEC
Strategy, PPP contract documents, Impact evaluation on VCD & ANC campaign, Impact
evaluation on Tribal development plan, Household Survey in 9 priority district to assess
equity and access of vulnerable group.
Sub component 3.3: Supporting Public Private Partnership
21. It was decided to encourage private sector participation in the delivery of health care.
Following a STRAIGHT approach (Identifying the Scope of partnership, Identifying the
47
appropriate Target Population, Selecting the Right Partners and Model, Ensuring Accountability,
Ensure active Involvement of the Govt., Generate Support of stakeholders through IEC, advocacy
and rapport building, Highlight achievements, Build Trust of all the partners and clients), to
facilitate the process of PPP procedural initiatives under the project were taken up, like: aA
module on PPP was developed and a dissemination workshop was organized through IIHMR,
Creation of PPP cell in DM&HS, Development of model concession agreements (contracts),
Rolling out of “108” emergency services under PPP mode through EMRI which later was
converged with NRHM and is now presently being run by Ziqitza Health Care Limited at SIHFW
campus. Much remains to be done on PPP front in the State and now the onus lies with NRHM to
build on the initiative.
22. Due to changes in the designing and additional work which was not anticipated during
inception of the project, the expenditure under the head of civil works got escalated. The details
of Procurement during project period are given in Annexure 3. Achievements include:
Computerized Financial Management System (CFMS) was incepted to consolidate financial data
of all districts in electronic form. Pilot CFMS of RHSDP is being replicated in State Finance
Department, Preparation of Annual Work Plan (AWP) with the concept of Component-Sub
component-Activity-Sub activity to facilitate benchmarking and performance appraisal on one to
one basis, Three tier audit reporting concept to facilitate audit trail, Exemption of Project from
Rajasthan Entry of Goods Act after the justification that the induction of Entry Tax will increase
the loan cost and additional burden on State Government and it would be difficult to recover such
cost from bidders retrospectively, Preparation of Accounting Manual based on RMRS Guidelines
to facilitate managerial decision based on accounting data made by non accounting persons as
facility in-charges, Project funds RMRS for project activities in reimbursement mode, Preparation
of Revolving Fund manual with inputs from RMRS to sustain civil works and maintain utilization
of medical equipments procured out of World Bank Fund. RMSCL plans to materialize the idea
in a convergence mode.
Evaluation of Borrower’s Performance
23. Government of Rajasthan (GOR) assisted the mission to undertake its planned tasks -
assess overall readiness of project preparation for appraisal, particularly in establishing
procurement and financial arrangements. The draft HCWMP was prepared by GOR in
compliance with GOI‟s Bio-Medical Rules. GOR showcases the activities of RHSDP on the
official website of DM&HS. GOR was responsible for obtaining all necessary clearances required
from state and central regulatory authorities. GOR contracted HLL for procurement of goods and
services. Adequate budget provision for the project from State Budget. Implementation of IEC
Strategy developed by RHSDP. A Committee was formed to review the quality of civil works
done for the up gradation of facilities. Issued an order to the facilities for constitution of HSITs.
Issued an order for integration of RHSDP and RCH outreach camps in 9 districts. A joint order
was issued for identifying different nodal persons for the various areas from RHSDP and NRHM
and DM&HS. NRHM took lead in developing the HMIS for the state relating to primary care
indicators on family welfare and disease control programs. GOR instituted the Rajasthan Rural
Medical Health Services to effectively address HR shortages in the rural areas. 4,370 nurses
recruited to fill up all vacant nursing positions in the state. Strengthened of IEC for health care
and appointed District level IEC Coordinators. Utilization of manpower trained in geriatric care
under the aegis of the project to operationalize geriatric centers. Independent monitoring
committees formed across the state to monitor CTF operations and provide feedback to
department.

48
24. State NRHM made provisions in its Project Implementation Plan (PIP) of 2011-12 for
capacity building; strengthening and scale up of quality improvement; strengthening of health
systems through improved drug warehouses; scale up of IT supported hospital management
systems; support the zonal medical equipment management and maintenance workshop in Jaipur
zone; uptake of patient counselors; continuation of RCH-RHSDP outreach camps in nine priority
districts; and the use of print and electronic IEC materials developed by project.
25. Rajasthan Medical Services Corporation Limited (RMSCL) constituted in the State with
the objective of establishing a centralized system for procurement of generic medicines, surgical
and diagnostic equipments. Essential drugs of maximum use are proposed to be made available
free to all patients at Government Hospitals.
Initiatives by RHSDP
26. For a prudent approach with pragmatism inbuilt, certain areas, that were hitherto
neglected, were also addressed in order to bring in uniformity in delivery besides objectively
addressing the punctuations. Some of them are: Standard Protocols of Clinical Care, Referrals,
HCWM Norms Developed-Space, Staffing, Equipments, Development & rationalization of
Hospital Activity Format, Development of Standard Treatment Guidelines(STG) /Essential
Medicine List (EML), Health Systems Performance Improvement Concept, Strengthening of
Referral & HCWM, Appointment of Hospital Administrator at District Hospitals, Pilot
Community Based Health Insurance & EMRI, Appointment of Patient Counselors, Strengthening
of Health Camps & Village Contact Drives, Training on Behavior Change & Communication,
Development of Contract Documents for PPP (Facility out sourcing, pharmacy, ambulance,
diagnostics & Mobile clinics), One time repair of hospital furniture & equipments, Trainings on
RUD and Geriatric Care.
27. Initiatives under the extension phase include: Strengthening of District Hospitals by
filling in the gaps pertaining to ICUs, Burn ward, Rehabilitation center and Trauma centre,
Strengthening Health Management Information System by having web based IT Systems,
Addressing the Human Resource Effectiveness through capacity building & skill development
programs, Strengthening Equipment Management and Maintenance System, Strengthening the
Drugs Logistics System, Special purpose fund (revolving fund )for medical equipment, hospital,
building repair and maintenance, Strengthening State Resource Center at SIHFW which supports
the training requirement of the State, Health communicator at village level in six tribal and three
desert districts, Concurrent Monitoring of Civil works by an independent agency, Gap Analysis at
all 100 bedded and above hospitals(44) in the State against the Indian Public Health Standards.
28. The continuation of ongoing project activities showing a positive impact, like HSIT,
HSIC, Health Camps, IEC, Health Care Waste Management, and Patient Counselors were
included in the extended phase also.
Learning from project
- Coordination is vital to achievement of objectives.
- Frequent transfers are deterrent to inputs and related outputs
- Data validation is crucial to planning: services, procurement, civil works and capacity
building.
- A balanced mix of infrastructure development and system intervention can produce
substantial improvement in efficiency and effectiveness.

49
- Total improvement in referral mechanism requires parallel improvement in the primary
health care services. To complete the referral loop needs major support of Tertiary care
institutions.
- Participation of private sector (for-profit and voluntary) is essential. To make partnership
effective clarity of purpose, Trust and defined deliverables besides coordination and
monitoring at the local level is extremely important.
- Consultants with experience in hospital constructions should be engaged for preparing
plans, drawings and designs and study the shortcomings of the existing infrastructure.
- The price variation clause in the tender for works with less than 18 months completion
time should be deleted in conformity with PWD procedure to restrain the agency from
delaying construction works.
- Concurrent quality evaluation of all the facilities should be done by independent agency
and end user should be involved in quality assurance of civil work.
- Involvement of subject experts (e.g. Bio-Medical Engineer) in finalization of
specification, costing, AMC/CMC and inspection of equipment.
- Phased Procurement of supplies and equipment linked to progress of civil works.
Midterm need assessment is suggested.
- Procurement agency, if hired should be stationed in the project office for capacity
building of project staff.
- Specifications should be generic to reduce complaints from suppliers
- Facilitation in the process of Authorization and CTF Connectivity
- Regular HCWM Supplies
- Periodic Trainings to all staff
- HCWM Officer for monitoring
- Replacement of Mercury based equipments in view of eco-friendliness nature of
substitutes.
- Prior Approval of specifically designed TOR
- Identification of Agency for trainings, if out sourced; based on experience, credibility and
capacity to handle volumes.
- Ensuring quality of training - Pretest, Post test and feedback and monitoring
- Timely Nomination and attendance along with Punishment for noncompliance be ensured.
Areas of Convergence with NRHM and sustainability of project inputs include training capacity
building, civil design, implementation and monitoring capacity, maintenance of project hardware,
Hospital Systems Improvement Process, Health Care Waste Management, Social Accountability
Mechanisms, Consumer Feedback and complaint redressal, Reporting formats, IEC (print,
electronic), Patient Counselors, Hospital Administrators.
The Borrower’s comments on the Bank’s draft ICR
The following comments on the Bank‟s draft ICR were received from the Borrower on March 26,
2012.
No ICR Page and Paragraph Borrower's Comments
1 Page 12 -Para 49 PMU was monitoring the data based performance through
monthly DPC meetings and further down this was being
done at facility level through HSITs and at district level
through HSICs. Concept of HSIP was incorporated to have
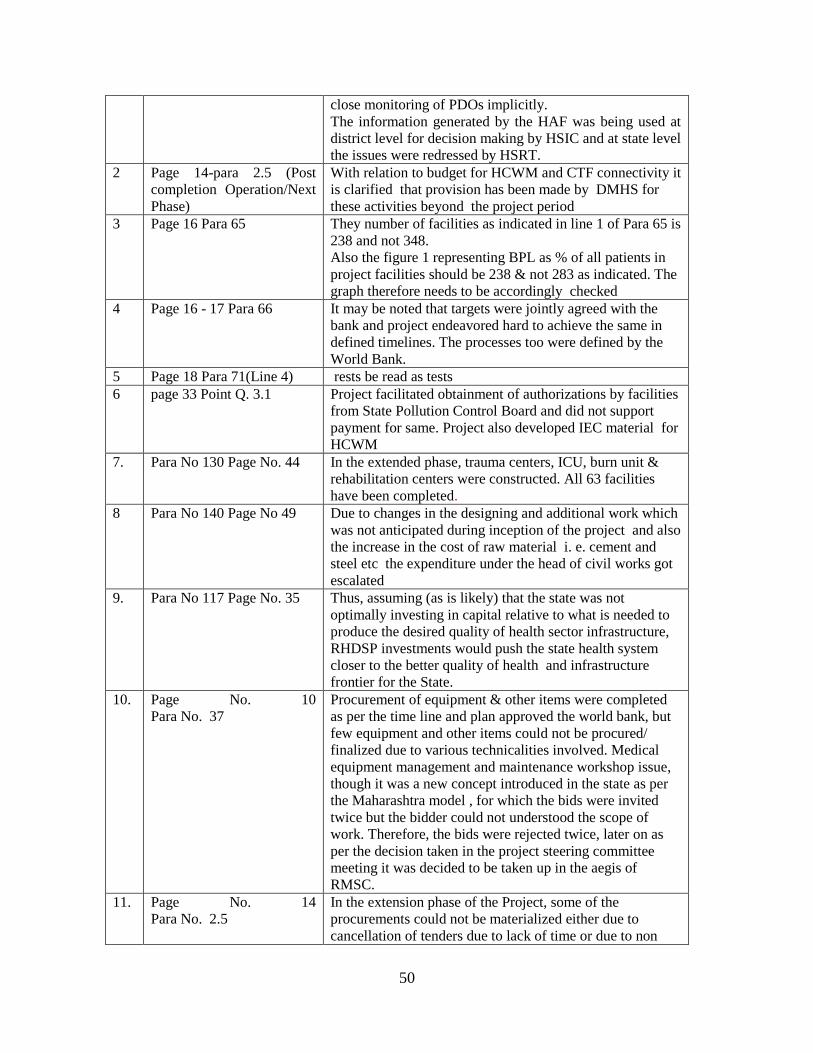
50
close monitoring of PDOs implicitly.
The information generated by the HAF was being used at
district level for decision making by HSIC and at state level
the issues were redressed by HSRT.
2 Page 14-para 2.5 (Post
completion Operation/Next
Phase)
With relation to budget for HCWM and CTF connectivity it
is clarified that provision has been made by DMHS for
these activities beyond the project period
3 Page 16 Para 65 They number of facilities as indicated in line 1 of Para 65 is
238 and not 348.
Also the figure 1 representing BPL as % of all patients in
project facilities should be 238 & not 283 as indicated. The
graph therefore needs to be accordingly checked
4 Page 16 - 17 Para 66 It may be noted that targets were jointly agreed with the
bank and project endeavored hard to achieve the same in
defined timelines. The processes too were defined by the
World Bank.
5 Page 18 Para 71(Line 4) rests be read as tests
6 page 33 Point Q. 3.1 Project facilitated obtainment of authorizations by facilities
from State Pollution Control Board and did not support
payment for same. Project also developed IEC material for
HCWM
7. Para No 130 Page No. 44 In the extended phase, trauma centers, ICU, burn unit &
rehabilitation centers were constructed. All 63 facilities
have been completed.
8 Para No 140 Page No 49 Due to changes in the designing and additional work which
was not anticipated during inception of the project and also
the increase in the cost of raw material i. e. cement and
steel etc the expenditure under the head of civil works got
escalated
9. Para No 117 Page No. 35 Thus, assuming (as is likely) that the state was not
optimally investing in capital relative to what is needed to
produce the desired quality of health sector infrastructure,
RHDSP investments would push the state health system
closer to the better quality of health and infrastructure
frontier for the State.
10. Page No. 10
Para No. 37
Procurement of equipment & other items were completed
as per the time line and plan approved the world bank, but
few equipment and other items could not be procured/
finalized due to various technicalities involved. Medical
equipment management and maintenance workshop issue,
though it was a new concept introduced in the state as per
the Maharashtra model , for which the bids were invited
twice but the bidder could not understood the scope of
work. Therefore, the bids were rejected twice, later on as
per the decision taken in the project steering committee
meeting it was decided to be taken up in the aegis of
RMSC.
11. Page No. 14
Para No. 2.5
In the extension phase of the Project, some of the
procurements could not be materialized either due to
cancellation of tenders due to lack of time or due to non

51
availability of bio medical engineers in the project, for
which project had asked for extension for two years, which
was turned down by the World Bank officers. Moreover in
every quarterly review meeting with the World Bank
mission these problems were discussed for more
appropriate decisions.
12. Page no.12 / Para no. 48 The camps were evaluated during the study of TDP (5th
year) and during the end term study of household survey in
9 districts. Apart from this, camps were evaluated quarterly
at PIU level on the basis of monthly reports and feedback
given by DPC, CM&HO, RCHO etc
13. Page no. 14/ Para no. 58 PPP contract document compiled after 1.5 year delay,
during this period the draft contract documents were shared
with various stakeholders (NGOs, Pvt. Hospitals, official of
Medical and Health department) and finalized after
incorporating the feedback of all concerned.
14. Page no. 17/ Para no. 69 IEC interventions were started in the early phase of
implementation of the project e.g. hoardings on various key
health issues installed at district and CHC level, task
specific IEC, local media activities at district level
awareness on various issues. Also, IEC activities were the
part of outreach health camps.
15. Page no. 23/ Para no. 88 The Patient Counselors were somehow useful in increasing
the access at health facilities as well at community level by
providing counseling and awareness to patients and their
attendees. Discontinuation of program does not mean that
they were not helpful
16. Page no. 32/Para 5.4 Study on- IEC Strategy and Developing the PPP contract
documents have not been mentioned
17. Page no. 34/Para 1.4 ANC campaign was organized only in three districts
instead of six.
52
Annex 6. List of Supporting Documents
List of major World Bank documents referred to in the ICR
World Bank. 2001. Country Assistance Strategy for India, 2002-2004.
World Bank. 2002. Assessment of the India State Health Systems Development projects
World Bank. 2004. Project Agreement, Rajasthan Health Systems Development project, June 3
2004. IDA Grant Number 3867- IN
World Bank. 2005. Quality-at-Entry Assessment of the Rajasthan Health Systems
Development project.
World Bank. 2004. Project Appraisal Document for the Rajasthan Health Systems Development
project, February 9 2004. Report No: 26823-IN
World Bank. 2005. Country Assistance Strategy for India, 2005-2008.
World Bank. 2007. Detailed Implementation Review, India Health Sector 2006-2007, Vol I-II.
World Bank. 2011. Project Paper on a proposed restructuring of the Rajasthan Health Systems
Development project, September X 2011. Report No: XXX-IN.
Aide-memoires from the preparation and implementation of the Rajasthan Health Systems
Development project, November 2001 – September 2011
Implementation Status Reviews of the Rajasthan Health Systems Development project, June 2004
– September 2011
List of Government of India and Government of Rajasthan documents referred to in the ICR
Government of India. 2001. Census of 2001.
Government of India. 2003. Survey of Cause of Death 2001-2003.
Department of Medical, Health and Family Welfare, Government of Rajasthan. 2000. Health
Vision-2025 Rajasthan.
Department of Medical, Health and Family Welfare, Government of Rajasthan. 2002. Tribal
Development Plan.
Department of Medical, Health and Family Welfare, Government of Rajasthan. 2002.
Institutional Assessment.
Department of Medical, Health and Family Welfare, Government of Rajasthan. 2002. Social
Assessment.
Directorate of Economics and Statistics, Government of Rajasthan. 2001. Some facts about
Rajasthan. Factsheet. www.indiastat.com
Presentations prepared by the various cells of the project management unit on overall project
implementation progress, from project closing mission
Various studies prepared under the project, e.g. patient satisfaction survey, civil works study etc.
List of data sources/databases from which information was drawn for the ICR
World Development Indicators 2011.
National Family Health Survey 2 (1998/99) and National Family Health Survey 3 (2005/2006)
District-Level Household Survey 2 (2002/04) and District-Level Household Survey 3 (2005/06)
UNICEF Coverage Survey 2009
Health Activity Formats, 2005-2009 (i.e. project-specific HMIS)
Reserve Bank of India data, via Indiastat.com
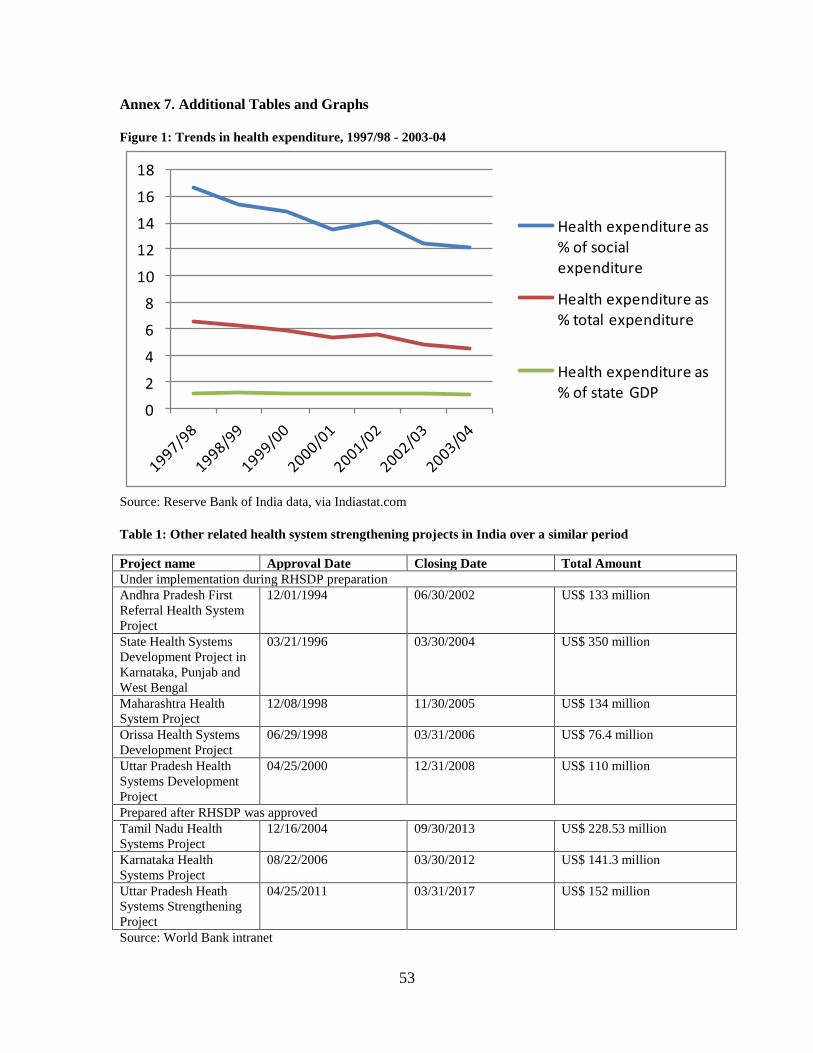
53
Annex 7. Additional Tables and Graphs
Figure 1: Trends in health expenditure, 1997/98 - 2003-04
0
2
4
6
8
10
12
14
16
18
Health expenditure as % of social expenditure
Health expenditure as % total expenditure
Health expenditure as % of state GDP
Source: Reserve Bank of India data, via Indiastat.com
Table 1: Other related health system strengthening projects in India over a similar period
Project name Approval Date Closing Date Total Amount
Under implementation during RHSDP preparation
Andhra Pradesh First
Referral Health System
Project
12/01/1994 06/30/2002 US$ 133 million
State Health Systems
Development Project in
Karnataka, Punjab and
West Bengal
03/21/1996 03/30/2004 US$ 350 million
Maharashtra Health
System Project
12/08/1998 11/30/2005 US$ 134 million
Orissa Health Systems
Development Project
06/29/1998 03/31/2006 US$ 76.4 million
Uttar Pradesh Health
Systems Development
Project
04/25/2000 12/31/2008 US$ 110 million
Prepared after RHSDP was approved
Tamil Nadu Health
Systems Project
12/16/2004 09/30/2013 US$ 228.53 million
Karnataka Health
Systems Project
08/22/2006 03/30/2012 US$ 141.3 million
Uttar Pradesh Heath
Systems Strengthening
Project
04/25/2011 03/31/2017 US$ 152 million
Source: World Bank intranet

54
Table 2: The Bank portfolio in Rajasthan over the project preparation and implementation period
Project name Approval Date Closing Date Total Amount
Rajasthan District
Poverty Initiatives
Project
04/25/2000 12/31/2007 US$ 100.48 million
Rajasthan Second
District Primary
Education Project
06/21/2001 03/31/2008 US$ 87.5 million
RajasthanWater Sector
Restructuring Project
02/19/2002 03/31/2013 US$ 140 million
Rajasthan Power Sector
Restructuring
01/18/2001 06/30/2006 US$ 180 million
Source: World Bank intranet
Table 3: Weighted calculation of ratings for PDO 1
March 2006 targets December 2009 targets Overall rating
Rating Unsatisfactory Satisfactory
Numerical rating 2 5
Percentage disbursed 72% 28% 100%
Weight (rating x
disbursement) value
1.4 1.4 2.8
Final rating Moderately unsatisfactory
Table 4: Limitations of available household surveys as a means to assessing project efficacy
Survey Date PDO 1 PDO 2 Disaggregation by caste
and wealth
Data access?
NFHS 2005/06 No info on
general care
utilization
No facility survey to
measure quality of
care
Yes Yes
RCH/
DLHS
2007/08 No info on
general care
utilization
No facility survey to
measure quality of
care
Yes, in original data No
UNICEF
Coverage
Survey
2009 No info on
general care
utilization
No facility survey to
measure quality of
care
Yes, in original data No
Table 5: Maternal and child health coverage indicators, Rajasthan, 2002-04 to 2009
DLHS2
(2002-04)
NFHS
(2005-06)
DLHS3
(2005-06)
UNICEF CES
(2009)
Full immunization (12-23 months) (%) 23.9 26.5 48.8 53.8
At least 3 antenatal care visits (%) 28.8 41.2 28.2 55.2
Delivery in a health facility (%) 30.3 32.2 45.5 70.5
Source: District-level Health Survey 2 and 3 2002/04 and 2005/06, National Family Health Survey 3
2005/06, UNICEF Coverage survey 2009

55
Table 6: Change in utilization of select maternal and child health services, Rajasthan, 1998/99 to
2005/06, disaggregated by caste and socioeconomic status
Child (12-23
months) received
BCG, measles, and
three doses of polio
& DPT (1/0)
Medical treatment
has been sought for
ARI (1/0)
Mother received
antenatal care
(skilled & 4 visits)
(1/0)
Skilled birth
attendance (1/0)
1998/99 2005/06 1998/99 2005/06 1998/99 2005/06 1998/99 2005/06
Area of residence
Urban 0.276 0.443 0.735 0.714 0.337 0.578 0.625 0.754
Rural 0.136 0.223 0.564 0.642 0.087 0.140 0.294 0.325
household's caste or tribe
scheduled
caste 0.133 0.350 0.562 0.505 0.089 0.174 0.273 0.349
scheduled
tribe 0.097 0.054 0.505 0.648 0.094 0.116 0.234 0.298
obc 0.143 0.244 0.611 0.758 0.113 0.226 0.376 0.429
other 0.215 0.407 0.647 0.603 0.188 0.434 0.434 0.554
Quintiles of wealth score
Lowest
quintile 0.048 0.140 0.408 0.537 0.037 0.075 0.155 0.189
2 0.114 0.178 0.524 0.618 0.053 0.107 0.229 0.290
3 0.090 0.315 0.631 0.688 0.088 0.146 0.328 0.407
4 0.245 0.300 0.697 0.740 0.143 0.346 0.444 0.545
Highest
quintile 0.460 0.509 0.817 0.721 0.480 0.665 0.787 0.875
Total 0.166 0.267 0.604 0.660 0.138 0.236 0.362 0.414
Source: Author‟s own calculations. National Family Health Survey (NFHS) 1998/99 and 2005/06

PhalodiPhalodi
ShahabadBijolia
Nimbahera
Shivpuri
Rajgarh
Sikandra
Indergarh
Mandar
Mertacity
Ratangharh
Talchhapur
Nokha
Pallu
Ratwatsar
Chhatargarh
Hanumangarh
Ganganagar
Bikaner
ChuruJhunjhunun
SikarAlwar
Dausa
Sawaimadhopur
Bharatpur
Dholpur
Tonk
Bundi
Kota Baran
Jhalawar
Chittaurgarh
Pratapgarh
Bhilwara
Ajmer
Nagaur
Jodhpur
Pali
Rajsamand
Dungarpur
Sirohi
Jalor
Barmer
Jaisalmer
Banswara
Jaipur
NEW DELHI
GANGANAGAR
BIKANER
JHUNJHUNUN
SIKAR
JAIPUR
ALWAR
SAW
AIM
ADHO
PUR
BHARATPUR
BUNDI
KOTA
CHITTA
URG
ARH
BHILWARA
AJMER
NAGAUR
JODHPUR
PALI
DUNGARPUR
SIROHI
JALOR
BARMER
JAISALMER
BANSWARA
CHURU
DAUSA
DHOLPUR
TONK
BARA
N
JHAL
AWAR
RAJSAMAND
R A J A S T H A N
U T T A RP R A D E S H
D E L H I
M A D H Y AP R A D E S H
H A R Y A N A
P U N J A B
G U J A R A T
PA
KI S
TA
N
15
15
15
11
11
12
1111A
814
8
8
2
2
3
NATIONAL HIGHWAYS
STATE HIGHWAYS AND SELECTEDMAJOR DISTRICT ROADS
RAILROADS
SELECTED CITIES
DISTRICT CAPITALS
STATE CAPITAL
NATIONAL CAPITAL
DISTRICT BOUNDARIES
STATE BOUNDARIES
NATIONAL BOUNDARY
1
INDIA
RAJASTHAN HEALTH SYSTEMSDEVELOPMENT PROJECT
0 50 100 150
KILOMETERS
IBRD 39214
APRIL 2012
This map was produced by the Map Design Unit of The World Bank. The boundaries, colors, denominations and any other informationshown on this map do not imply, on the part of The World BankGroup, any judgment on the legal status of any territory, or anyendorsement or acceptance of such boundaries.