document of the world bank · document of the world bank. ... (exchange rate effective april 30,...
TRANSCRIPT

Document of The World Bank
Report No: ICR00003137
IMPLEMENTATION COMPLETION AND RESULTS REPORT (IBRD-75650 IDA-44630 IDA-44640)
ON A
LOAN
IN THE AMOUNT OF US$ 135.85 MILLION AND
CREDITS
IN THE AMOUNT OF SDR 9.5 and 25.6 MILLION (US$ 58.95 MILLION EQUIVALENT)
TO THE
ISLAMIC REPUBLIC OF PAKISTAN
FOR AN
ELECTRICITY DISTRIBUTION AND TRANSMISSION IMPROVEMENT PROJECT
September 23, 2014
Energy & Extractives Global Practice South Asia Region
Pub
lic D
iscl
osur
e A
utho
rized
Pub
lic D
iscl
osur
e A
utho
rized
Pub
lic D
iscl
osur
e A
utho
rized
Pub
lic D
iscl
osur
e A
utho
rized
Pub
lic D
iscl
osur
e A
utho
rized
Pub
lic D
iscl
osur
e A
utho
rized
Pub
lic D
iscl
osur
e A
utho
rized
Pub
lic D
iscl
osur
e A
utho
rized

ii

CURRENCY EQUIVALENTS (Exchange Rate Effective April 30, 2014)
Currency Unit = Pakistan Rupees (PKR)
PKR 1.00 = US$ 0.01 US$ 1.00 = PKR 100
FISCAL YEAR July 1 – June 30
ABBREVIATIONS AND ACRONYMS
ABC Aerial Bundled Conductor ADB Asian Development Bank APL Adaptable Program Loan BER Bid Evaluation Report BOD Board of Directors CCP Competition Commission of Pakistan CPPA Central Power Purchasing Agency CPS Country Partnership Strategy DISCOs Distribution Companies DLI Disbursement Linked Indicator DM Distribution Margin DPC Development Policy Credit DSCR Debt Service Coverage Ratio DTrs Distribution Transformers EDTIP Electricity Distribution And Transmission Improvement Project ELR Energy Loss Reduction EPAs Environmental Protection Agencies ERP Enterprise Resource Planning ERR Economic Rate of Return ESA Environmental and Social Assessment ESMP Environmental and Social Management Plan FRR Financial Rate of Return FY Fiscal Year GDP Gross Domestic Product GIS Gas Insulated Substation GOP Government of Pakistan GWh Gigawatt hours HESCO Hyderabad Electric Supply Company IBRD International Bank for Reconstruction and Development ICB International Competitive Bidding ICR Implementation Completion and Results Report IDA International Development Association IEC International Electro-technical Commission IEs Implementing Entities IESCO Islamabad Electric Supply Company Limited IP Implementation Progress IPA International Procurement Advisor IPP Independent Power Producers IPR Independent Procurement Review
iii

IRR Internal Rate of Return ISR Implementation Status Report JICA Km
Japan International Cooperation Agency Kilometre
kV Kilo Volt kWh Kilowatt Hour LERB Lowest Evaluated Responsive Bidder LESCO Lahore Electric Supply Company M MEPCO
Million Multan Electric Power Company
MOWP Ministry of Water and Power MTR Mid Term Review MW Megawatt NCB National Competitive Bidding NEPRA National Electric Power Regulatory Authority NPV Net Present Value NTDC National Transmission and Despatch Company O&M Operations and Maintenance OLTC On Load Tap Changer PAD Project Appraisal Document PAP Procurement Action Plan PCD Project Closing Date of February 28, 2014 PD Project Director PDO Project Development Objective PEPCO Pakistan Electric Power Company PKR Pakistan Rupee PPAs Power Purchase Agreements PTrs Power Transformers QPR Quarterly Progress Report RAP Resettlement Action Plan SDR Special Drawing Right SECP Securities & Exchange Commission of Pakistan ST Secondary Transmission STG Secondary Transmission and Grid T&D Transmission and Distribution TA Technical Assistance TDS Tariff Differential Subsidies USAID United States Agency for International Development USD United States Dollars WAPDA Water and Power Development Authority
Vice President: Philippe H. Le Houerou
Country Director: Rachid Benmessaoud Senior Director: Anita Marangoly George
Practice Director: Charles Feinstein Practice Manager: Julia Bucknall
Project Team Leader: Mohammad Saqib ICR Team Leader: Mohammad Saqib
iv

PAKISTAN Electricity Distribution and Transmission Improvement Project
CONTENTS
Data Sheet A. Basic Information B. Key Dates C. Ratings Summary D. Sector and Theme Codes E. Bank Staff F. Results Framework Analysis G. Ratings of Project Performance in ISRs H. Restructuring I. Disbursement Graph
1. Project Context, Development Objectives and Design ............................................... 1 2. Key Factors Affecting Implementation and Outcomes .............................................. 4 3. Assessment of Outcomes .......................................................................................... 15 4. Assessment of Risk to Development Outcome ......................................................... 22 5. Assessment of Bank and Borrower Performance ..................................................... 22 6. Lessons Learned ....................................................................................................... 27 7. Comments on Issues Raised by Borrower/Implementing Agencies/Partners .......... 30 Annex 1. Project Costs and Financing .......................................................................... 31 Annex 2. Outputs by Component ................................................................................. 32 Annex 3. Economic and Financial Analysis ................................................................. 38 Annex 4. Bank Lending and Implementation Support/Supervision Processes ............ 46 Annex 5. Beneficiary Survey Results ........................................................................... 48 Annex 6. Stakeholder Workshop Report and Results ................................................... 49 Annex 7. Summary of Borrower's ICR and/or Comments on Draft ICR ..................... 50 Annex 8. Comments of Cofinanciers and Other Partners/Stakeholders ....................... 54 Annex 9. List of Supporting Documents ...................................................................... 55 Annex 10. Review of procurment and technical aspects ............................................. 56 Map of Pakistan ........................................................................................................... 60
v


A. Basic Information
Country: Pakistan Project Name: Electricity Distribution and Transmission Improvement Project
Project ID: P095982 L/C/TF Number(s): IBRD-75650,IDA-44630,IDA-44640
ICR Date: 09/22/2014 ICR Type: Core ICR
Lending Instrument: APL Borrower: GOVERNMENT OF PAKISTAN
Original Total Commitment:
USD 256.70M Disbursed Amount: USD 141.82M
Revised Amount: USD 194.80M Environmental Category: B Implementing Agencies: Islamabad Electric Supply Company (IESCO) Lahore Electric Supply Company (LESCO) Multan Electric Power Company (MEPCO) National Transmission and Despatch Company (NTDC) Pakistan Electric Power Company (PEPCO) Hyderabad Electric Supply Company (HESCO) Cofinanciers and Other External Partners: B. Key Dates
Process Date Process Original Date Revised / Actual Date(s)
Concept Review: 09/01/2005 Effectiveness: 12/05/2008 12/05/2008
Appraisal: 08/27/2007 Restructuring(s): 10/05/2012 02/28/2014
Approval: 06/17/2008 Mid-term Review: 12/31/2010 04/30/2011 Closing: 06/30/2012 02/28/2014 C. Ratings Summary C.1 Performance Rating by ICR Outcomes: Moderately Unsatisfactory Risk to Development Outcome: Substantial Bank Performance: Unsatisfactory Borrower Performance: Unsatisfactory
vi

C.2 Detailed Ratings of Bank and Borrower Performance (by ICR) Bank Ratings Borrower Ratings
Quality at Entry: Unsatisfactory Government: Unsatisfactory
Quality of Supervision: Unsatisfactory Implementing Agency/Agencies: Unsatisfactory
Overall Bank Performance: Unsatisfactory Overall Borrower
Performance: Unsatisfactory
C.3 Quality at Entry and Implementation Performance Indicators
Implementation Performance Indicators QAG Assessments
(if any) Rating
Potential Problem Project at any time (Yes/No):
Yes Quality at Entry (QEA):
None
Problem Project at any time (Yes/No):
Yes Quality of Supervision (QSA):
None
DO rating before Closing/Inactive status:
Moderately Unsatisfactory
D. Sector and Theme Codes
Original Actual Sector Code (as % of total Bank financing) Central government administration 2 2 Energy efficiency in Heat and Power 6 6 Transmission and Distribution of Electricity 92 92
Theme Code (as % of total Bank financing) Infrastructure services for private sector development 100 100 E. Bank Staff
Positions At ICR At Approval Vice President: Philippe H. Le Houerou Praful C. Patel Country Director: Rachid Benmessaoud Yusupha B. Crookes Practice Manager/Manager:
Julia Bucknall Salman Zaheer
Project Team Leader: Mohammad Saqib Vladislav Vucetic / Rashid Aziz ICR Team Leader: Mohammad Saqib ICR Primary Author: Mohammad Saqib Abdul Rahim Khan
vii

F. Results Framework Analysis Project Development Objectives (from Project Appraisal Document) The objectives of the APL1 project are to: (i) strengthen the capacity of the distribution and transmission networks to meet increasing electricity demand in the selected areas more efficiently and with better reliability and quality; and (ii) strengthen institutional capacity of the selected distribution companies and support other priority areas of the power sector reform. Revised Project Development Objectives (as approved by original approving authority) PDOs remained the same. (a) PDO Indicator(s)
Indicator Baseline Value
Original Target Values (from
approval documents)
Formally Revised Target Values
Actual Value Achieved at
Completion or Target Years
Indicator 1 : NTDC - Loading on Yousufwala Grid Station, percentage Value quantitative or Qualitative)
98 77 77 100
Date achieved 06/30/2007 06/30/2012 06/30/2013 02/28/2014 Comments (incl. % achievement)
Target was not met because Kassowal grid station (financed under the project) could not be completed by the project closing date. Loading will reduce after the commissioning of the Kassowal grid station.
Indicator 2 : NTDC - Loading on Vehari Grid Station, percentage Value quantitative or Qualitative)
92 74 74 100
Date achieved 06/30/2007 06/30/2012 06/30/2013 02/28/2014 Comments (incl. % achievement)
Grid station was changed from Piranghaib to Vehari through amendment to the legal documents. Baseline and target values remained the same. Target was not met because Kassowal grid station could not be completed by the PCD.
Indicator 3 : IESCO - Electricity Handled by the Network - Gigawatt-hours per year Value quantitative or Qualitative)
7,065 11,640 8,784 8,830
Date achieved 06/30/2007 06/30/2012 06/30/2013 02/28/2014 Comments (incl. % achievement)
The revised reduced target was met with a delay because in FY2013 corresponding to the target period only 8,561 GWh were procured.
Indicator 4 : IESCO - Annual T&D Losses, percentage Value quantitative or Qualitative)
12.2 11.4 9.55 8.6
Date achieved 06/30/2007 06/30/2012 06/30/2013 02/28/2014 Comments IESCO successfully met the original and revised target. 9.4% T&D losses for
viii

(incl. % achievement)
FY2013 were also less than the target.
Indicator 5 : IESCO - Collection as percentage of billing Value quantitative or Qualitative)
98.1 98.6 95.9 90.0
Date achieved 06/30/2007 06/30/2012 06/30/2013 02/28/2014
Comments (incl. % achievement)
Target was not achieved. Collection in FY13 was 94.4% and declined further mainly because of non-payment by public sector consumers; collection from private consumers was almost 100%. Indicator, however, is not related to the project intervention.
Indicator 6 : IESCO - TA: Completion of local and foreign training (cumulative total is in parenthesis)
Value quantitative or Qualitative)
20 186 120 272 (936)
Date achieved 06/30/2007 06/30/2012 06/30/2013 06/30/2013 Comments (incl. % achievement)
The figures present number of participants of various training courses during the year. The target was met on a cumulative basis as about 936 staff attended these courses between June 30, 2007 and June 30, 2013.
Indicator 7 : HESCO - Electricity handled by the network - Gigawatt-hours per year Value quantitative or Qualitative)
7,681 9,807 9,683 9,356
Date achieved 06/30/2007 06/30/2012 06/30/2013 06/30/2013
Comments (incl. % achievement)
Even the revised reduced target was not achieved because of the prevailing supply shortfall. Data for last 12 months before project closing was not provided. In FY2014, about 9,420 GWh were procured which was also less than the FY2013 target.
Indicator 8 : HESCO - Annual T&D Losses, percentage Value quantitative or Qualitative)
36.9 29.4 32.2 33.2
Date achieved 06/30/2007 06/30/2012 06/30/2013 06/30/2013 Comments (incl. % achievement)
There is some reduction in losses but neither the revised nor the actual target was met. In FY2014, losses declined to 32.2% but were still quite high than the NEPRA target of 24.9%.
Indicator 9 : HESCO - Collection as percentage of billing Value quantitative or Qualitative)
86 90 73.5 67.6
Date achieved 06/30/2007 06/30/2012 06/30/2013 06/30/2013 Comments (incl. % achievement)
Collection rate has deteriorated quite sharply in HESCO and even the revised target which was set significantly below the baseline was not met.
Indicator 10 : HESCO - TA: Completion of local and foreign training (cumulative total is in parenthesis)
Value 20 148 148 3 (320)
ix

quantitative or Qualitative) Date achieved 06/30/2007 06/30/2012 06/30/2013 06/30/2013 Comments (incl. % achievement)
The figures present number of participants of various training courses during the year. The target was met on a cumulative basis as about 320 staff attended these courses between June 30, 2007 and June 30, 2013.
Indicator 11 : LESCO - Electricity handled by the network - Gigawatt-hours per year Value quantitative or Qualitative)
15,999 22,153 18,126 16,458
Date achieved 06/30/2007 06/30/2012 06/30/2013 06/30/2013 Comments (incl. % achievement)
LESCO did not provide last 12 months data and therefore FY2013 figures are presented. Even the target which was revised downwards could not be achieved mainly because of the prevailing supply shortfall in the country.
Indicator 12 : LESCO - Annual T&D Losses, percentage Value quantitative or Qualitative)
12.8 11.7 12.1 13.2
Date achieved 06/30/2007 06/30/2012 06/30/2013 06/30/2013 Comments (incl. % achievement)
T&D losses in LESCO have increased compared to the baseline. The target was revised upwards but even that could not be met.
Indicator 13 : LESCO - Collection as percentage of billing Value quantitative or Qualitative)
99 99 97.5 97.9
Date achieved 06/30/2007 06/30/2012 06/30/2013 06/30/2013 Comments (incl. % achievement)
Met the revised target but performance has declined from base year. This indicator, however, is not directly related to project intervention.
Indicator 14 : LESCO - TA: Completion of local and foreign training (cumulative total is in parenthesis)
Value quantitative or Qualitative)
55 77 440 0 (667)
Date achieved 06/30/2007 06/30/2012 06/30/2013 06/30/2013 Comments (incl. % achievement)
The figures present number of participants of various training courses during the year. The target was met on a cumulative basis as about 667 trainees attended these courses between June 30, 2007 and June 30, 2013.
Indicator 15 : MEPCO - Electricity handled by the network - Gigawatt-hours per year Value quantitative or Qualitative)
11,767 14,398 12,830 13,274
Date achieved 06/30/2007 06/30/2012 06/30/2013 02/28/2014 Comments (incl. % achievement)
The revised reduced target was met by the project closing date but with a delay because in FY2013 corresponding to the target period only 11,951 GWh were procured compared to a revised target of 12,830 GWh.
Indicator 16 : MEPCO - Annual T&D Losses, percentage
x
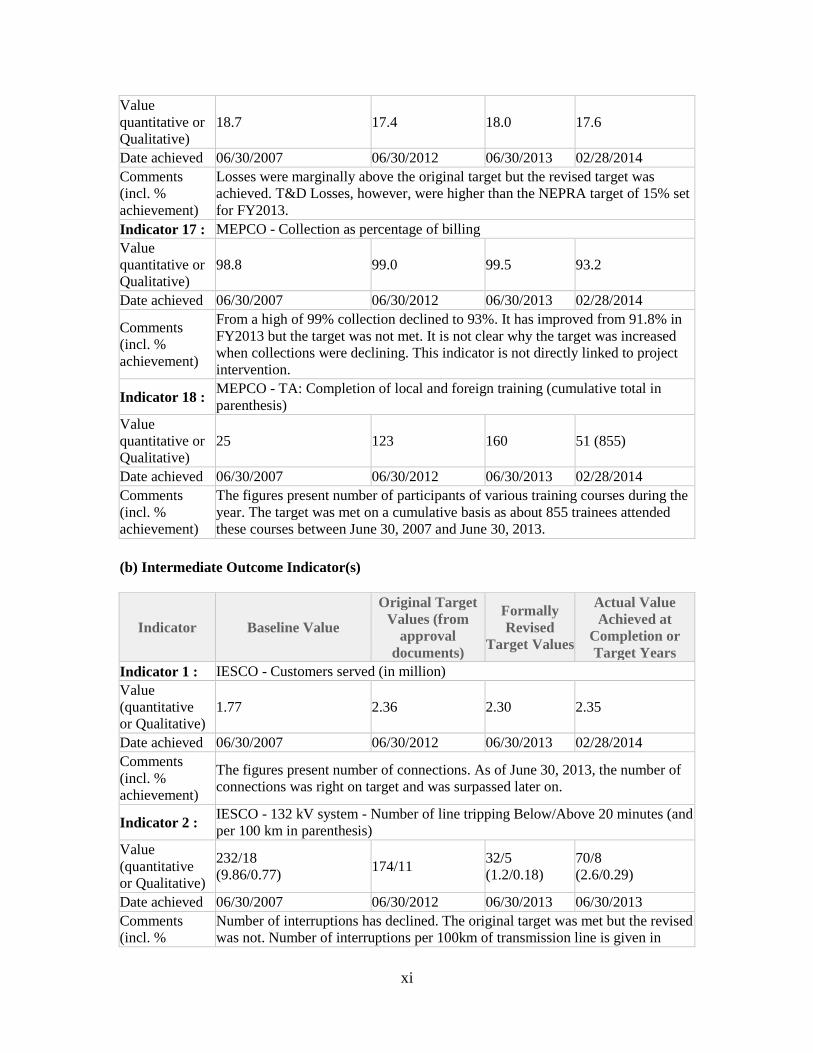
Value quantitative or Qualitative)
18.7 17.4 18.0 17.6
Date achieved 06/30/2007 06/30/2012 06/30/2013 02/28/2014 Comments (incl. % achievement)
Losses were marginally above the original target but the revised target was achieved. T&D Losses, however, were higher than the NEPRA target of 15% set for FY2013.
Indicator 17 : MEPCO - Collection as percentage of billing Value quantitative or Qualitative)
98.8 99.0 99.5 93.2
Date achieved 06/30/2007 06/30/2012 06/30/2013 02/28/2014
Comments (incl. % achievement)
From a high of 99% collection declined to 93%. It has improved from 91.8% in FY2013 but the target was not met. It is not clear why the target was increased when collections were declining. This indicator is not directly linked to project intervention.
Indicator 18 : MEPCO - TA: Completion of local and foreign training (cumulative total in parenthesis)
Value quantitative or Qualitative)
25 123 160 51 (855)
Date achieved 06/30/2007 06/30/2012 06/30/2013 02/28/2014 Comments (incl. % achievement)
The figures present number of participants of various training courses during the year. The target was met on a cumulative basis as about 855 trainees attended these courses between June 30, 2007 and June 30, 2013.
(b) Intermediate Outcome Indicator(s)
Indicator Baseline Value
Original Target Values (from
approval documents)
Formally Revised
Target Values
Actual Value Achieved at
Completion or Target Years
Indicator 1 : IESCO - Customers served (in million) Value (quantitative or Qualitative)
1.77 2.36 2.30 2.35
Date achieved 06/30/2007 06/30/2012 06/30/2013 02/28/2014 Comments (incl. % achievement)
The figures present number of connections. As of June 30, 2013, the number of connections was right on target and was surpassed later on.
Indicator 2 : IESCO - 132 kV system - Number of line tripping Below/Above 20 minutes (and per 100 km in parenthesis)
Value (quantitative or Qualitative)
232/18 (9.86/0.77) 174/11 32/5
(1.2/0.18) 70/8 (2.6/0.29)
Date achieved 06/30/2007 06/30/2012 06/30/2013 06/30/2013 Comments (incl. %
Number of interruptions has declined. The original target was met but the revised was not. Number of interruptions per 100km of transmission line is given in
xi

achievement) parenthesis for comparison over time and across companies.
Indicator 3 : IESCO - Average Voltage condition for 132 kV System (Max/Min in parenthesis)
Value (quantitative or Qualitative)
130.5 132 133.8 (137.8/129.8) 132.4 (137.5/127.4)
Date achieved 06/30/2007 06/30/2012 06/30/2013 06/30/2013 Comments (incl. % achievement)
The average is close to 132kV and therefore the target was met. Max and Min values are given in parenthesis to show the fluctuation which are also within the revised target limits.
Indicator 4 : IESCO - Cost not covered from consumer revenues, PKR Million Value (quantitative or Qualitative)
881 4,068 6,969 34,207
Date achieved 06/30/2007 06/30/2012 06/30/2013 06/30/2013 Comments (incl. % achievement)
Tariff differential subsidy (TDS) billed is used to measure cost not recovered from consumer revenue. TDS exceeded the target mainly because of rise in power purchase cost and not passing on the burden to end consumers.
Indicator 5 : IESCO - Training plan and effectiveness
Value (quantitative or Qualitative)
No plan Report of the effectiveness of training completed
Report of the effectiveness of training completed
Effectiveness of training is included in the client's completion report.
Date achieved 06/30/2007 06/30/2012 06/30/2013 02/28/2014 Comments (incl. % achievement)
Foreign and local training were held at good reputable institutes for a large number of staff. Training covered technical, financial management, project management, procurement and other relevant subjects.
Indicator 6 : HESCO - Customers served (in million) Value (quantitative or Qualitative)
1.41 1.80 1.61 1.61
Date achieved 06/30/2007 06/30/2012 06/30/2013 06/30/2013 Comments (incl. % achievement)
The figures present number of connections as of the given date. The target was revised downwards and was achieved by June 30, 2013.
Indicator 7 : HESCO - 132 kV system - Number of line tripping Below/Above 20 minutes (and per 100 km in parenthesis)
Value (quantitative or Qualitative)
132/352 (3.621/9.655)
78/208 (not available)
64/103 (1.2/0.18)
91/400 (2.38/10.46)
Date achieved 06/30/2007 06/30/2012 06/30/2013 06/30/2013 Comments (incl. % achievement)
Neither the original nor the revised target was met. Number of interruptions above 20 minutes has increased compared to baseline. Data per 100km is given in parenthesis for comparison over time and across companies.
Indicator 8 : HESCO - Average Voltage condition for 132 kV System (Max/Min in parenthesis)
Value (quantitative 100 117 117 (141/93) 120.5 (144/97)
xii
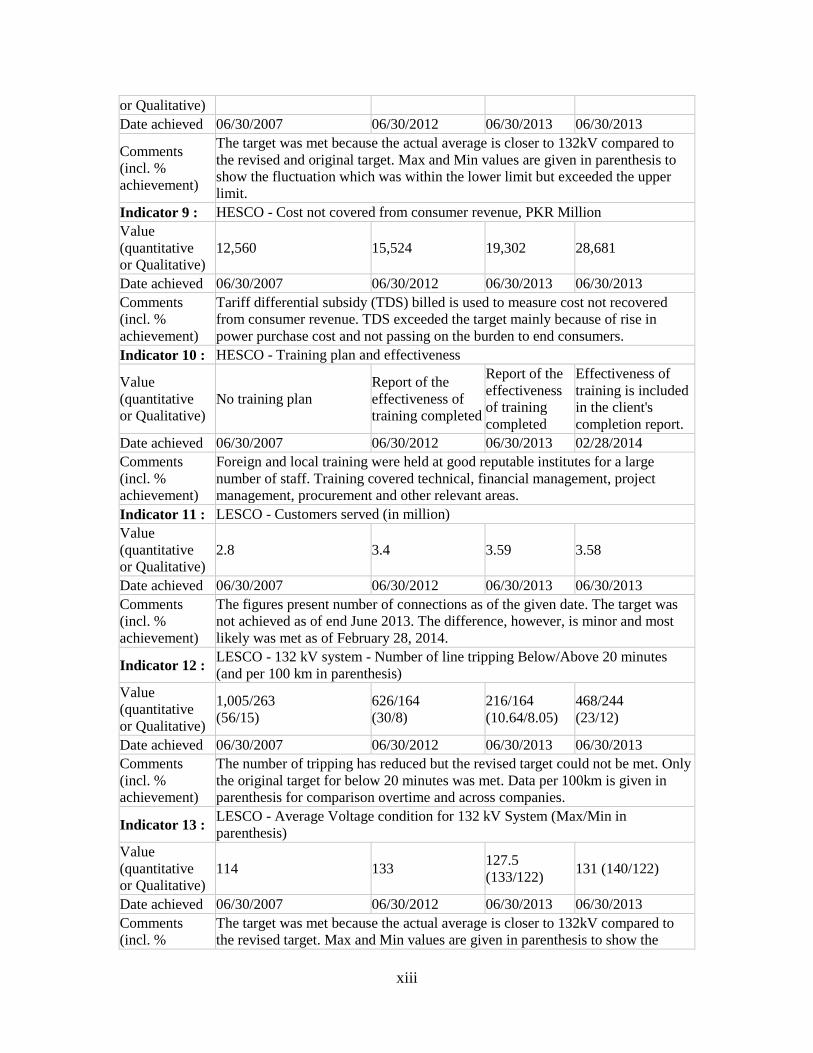
or Qualitative) Date achieved 06/30/2007 06/30/2012 06/30/2013 06/30/2013
Comments (incl. % achievement)
The target was met because the actual average is closer to 132kV compared to the revised and original target. Max and Min values are given in parenthesis to show the fluctuation which was within the lower limit but exceeded the upper limit.
Indicator 9 : HESCO - Cost not covered from consumer revenue, PKR Million Value (quantitative or Qualitative)
12,560 15,524 19,302 28,681
Date achieved 06/30/2007 06/30/2012 06/30/2013 06/30/2013 Comments (incl. % achievement)
Tariff differential subsidy (TDS) billed is used to measure cost not recovered from consumer revenue. TDS exceeded the target mainly because of rise in power purchase cost and not passing on the burden to end consumers.
Indicator 10 : HESCO - Training plan and effectiveness
Value (quantitative or Qualitative)
No training plan Report of the effectiveness of training completed
Report of the effectiveness of training completed
Effectiveness of training is included in the client's completion report.
Date achieved 06/30/2007 06/30/2012 06/30/2013 02/28/2014 Comments (incl. % achievement)
Foreign and local training were held at good reputable institutes for a large number of staff. Training covered technical, financial management, project management, procurement and other relevant areas.
Indicator 11 : LESCO - Customers served (in million) Value (quantitative or Qualitative)
2.8 3.4 3.59 3.58
Date achieved 06/30/2007 06/30/2012 06/30/2013 06/30/2013 Comments (incl. % achievement)
The figures present number of connections as of the given date. The target was not achieved as of end June 2013. The difference, however, is minor and most likely was met as of February 28, 2014.
Indicator 12 : LESCO - 132 kV system - Number of line tripping Below/Above 20 minutes (and per 100 km in parenthesis)
Value (quantitative or Qualitative)
1,005/263 (56/15)
626/164 (30/8)
216/164 (10.64/8.05)
468/244 (23/12)
Date achieved 06/30/2007 06/30/2012 06/30/2013 06/30/2013 Comments (incl. % achievement)
The number of tripping has reduced but the revised target could not be met. Only the original target for below 20 minutes was met. Data per 100km is given in parenthesis for comparison overtime and across companies.
Indicator 13 : LESCO - Average Voltage condition for 132 kV System (Max/Min in parenthesis)
Value (quantitative or Qualitative)
114 133 127.5 (133/122) 131 (140/122)
Date achieved 06/30/2007 06/30/2012 06/30/2013 06/30/2013 Comments (incl. %
The target was met because the actual average is closer to 132kV compared to the revised target. Max and Min values are given in parenthesis to show the
xiii

achievement) fluctuation which was within the lower limit but exceeded the upper revised limit.
Indicator 14 : LESCO - Cost not covered from consumer revenues, PKR Million Value (quantitative or Qualitative)
4,416 5,507 14,177 19,786
Date achieved 06/30/2007 06/30/2012 06/30/2013 06/30/2013 Comments (incl. % achievement)
Tariff differential subsidy (TDS) billed is used to measure cost not recovered from consumer revenue. TDS exceeds the target mainly because of rise in power purchase cost and not passing on the burden to end consumers.
Indicator 15 : LESCO - Training plan and effectiveness
Value (quantitative or Qualitative)
No training plan Report of the effectiveness of training completed
Report of the effectiveness of training completed
Effectiveness of training is included in the client's completion report.
Date achieved 06/30/2007 06/30/2012 06/30/2013 02/28/2014 Comments (incl. % achievement)
Foreign and local training were held at good reputable institutes for a large number of staff. Training covered technical, financial management, project management, procurement and other relevant areas.
Indicator 16 : MEPCO - Customers served (in million) Value (quantitative or Qualitative)
3.37 4.68 4.60 4.67
Date achieved 06/30/2007 06/30/2012 06/30/2013 06/30/2013 Comments (incl. % achievement)
The figures present number of connections as of the given date. The revised target was achieved.
Indicator 17 : MEPCO - 132 kV system - Number of line tripping Below/Above 20 minutes (and per 100 km in parenthesis)
Value (quantitative or Qualitative)
87/123 (2.97/4.2) 73/102 49/94
(1.64/3.14) 133/171 (4.44/5.73)
Date achieved 06/30/2007 06/30/2012 06/30/2013 06/30/2013
Comments (incl. % achievement)
Neither the original nor the revised target was met. Compared to baseline, number of interruptions both for above and below 20 minutes has increased. Data per 100km is given in parenthesis for comparison over time and across companies.
Indicator 18 : MEPCO - Average Voltage condition for 132 kV System (Max/Min in parenthesis)
Value (quantitative or Qualitative)
124 132.5 126 (138/114) 126 (138/114)
Date achieved 06/30/2007 06/30/2012 06/30/2013 06/30/2013 Comments (incl. % achievement)
Revised target was met but there is only marginal improvement compared to baseline.
Indicator 19 : MEPCO - Cost not covered from consumer revenue, PKR Million Value 6,280 5,983 34,952 31,780
xiv

(quantitative or Qualitative) Date achieved 06/30/2007 06/30/2012 06/30/2013 06/30/2013
Comments (incl. % achievement)
TDS billed is used to measure cost not recovered from consumer revenue. The revised target has been met but compared to baseline TDS increased by manifolds mainly because of rise in power purchase cost and not passing on the burden to end consumers.
Indicator 20 : MEPCO - Training plan and effectiveness
Value (quantitative or Qualitative)
No training plan
Report of the effectiveness of training completed.
Report of the effectiveness of training completed.
Effectiveness of training is included in the client's completion report.
Date achieved 06/30/2007 06/30/2012 06/30/2013 02/28/2014 Comments (incl. % achievement)
Foreign and local training were held at good reputable institutes for a large number of staff. Training covered technical, financial management, project management, procurement and other relevant areas.
G. Ratings of Project Performance in ISRs
No. Date ISR Archived DO IP
Actual Disbursements (USD millions)
1 12/17/2008 Satisfactory Satisfactory 0.00 2 05/28/2009 Moderately Satisfactory Satisfactory 3.30 3 11/27/2009 Moderately Satisfactory Moderately Satisfactory 23.95 4 05/28/2010 Moderately Satisfactory Moderately Satisfactory 39.24 5 12/20/2010 Moderately Satisfactory Moderately Satisfactory 54.81
6 06/27/2011 Moderately Unsatisfactory Unsatisfactory 65.05
7 01/12/2012 Moderately Unsatisfactory Unsatisfactory 85.85
8 07/11/2012 Moderately Satisfactory Moderately Satisfactory 96.72 9 01/27/2013 Moderately Satisfactory Moderately Satisfactory 114.03
10 06/18/2013 Moderately Unsatisfactory
Moderately Unsatisfactory 125.53
11 12/15/2013 Moderately Unsatisfactory Unsatisfactory 130.30
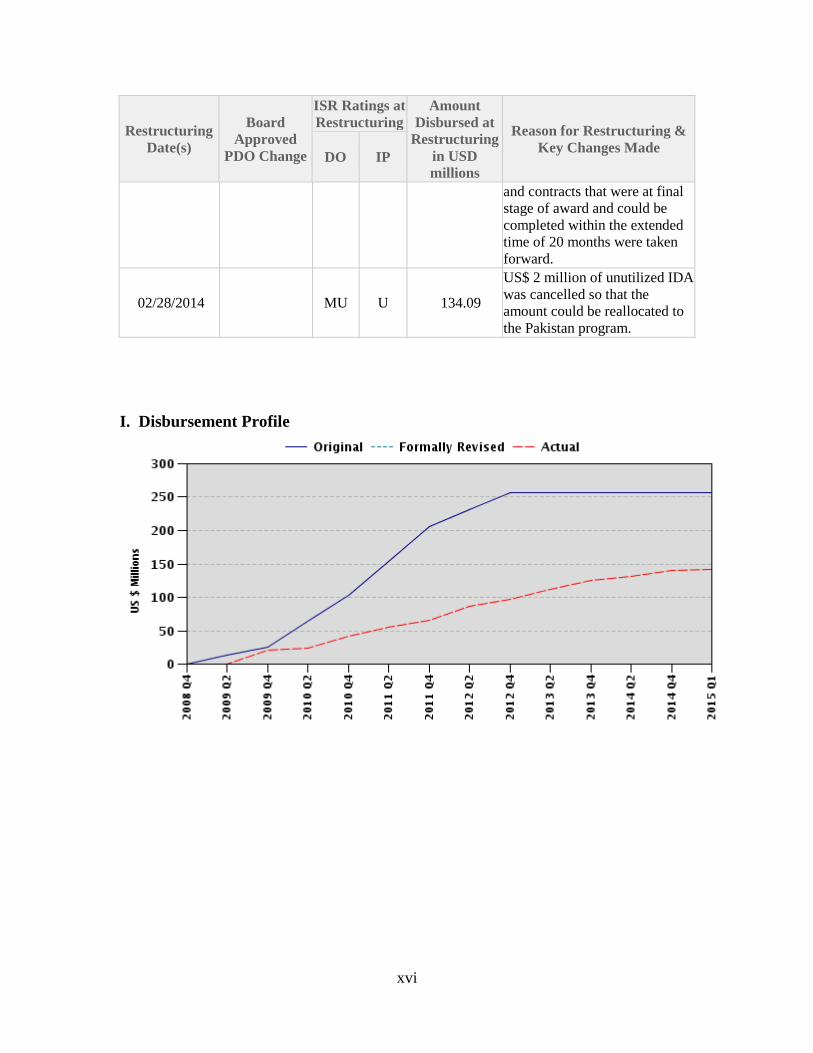
H. Restructuring (if any)
Restructuring Date(s)
Board Approved
PDO Change
ISR Ratings at Restructuring
Amount Disbursed at
Restructuring in USD millions
Reason for Restructuring & Key Changes Made DO IP
10/05/2012 MS MS 101.26 US$ 62 million were cancelled
xv
Restructuring Date(s)
Board Approved
PDO Change
ISR Ratings at Restructuring
Amount Disbursed at
Restructuring in USD millions
Reason for Restructuring & Key Changes Made DO IP
and contracts that were at final stage of award and could be completed within the extended time of 20 months were taken forward.
02/28/2014 MU U 134.09
US$ 2 million of unutilized IDA was cancelled so that the amount could be reallocated to the Pakistan program.
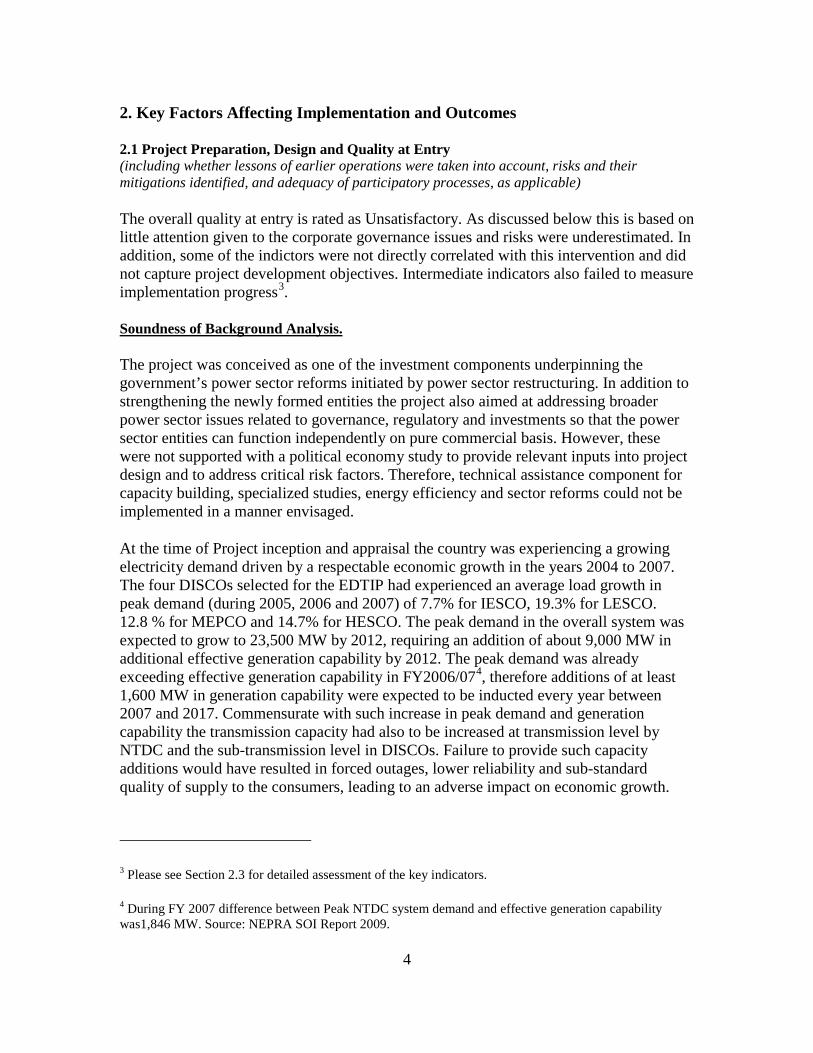
I. Disbursement Profile
xvi


1. Project Context, Development Objectives and Design (this section is descriptive, taken from other documents, e.g., PAD/ISR, not evaluative)
1.1 Context at Appraisal Country Background After a decade of political instability, macroeconomic crisis, and limited economic and social progress in the 1990s, Pakistan emerged as one of the fastest-growing economies in Asia, with rising per capita income and improved social indicators. Successive years of high growth (between FY04 and FY07 real GDP grew at more than 7% average) led to commensurate high growth in electricity demand. During FY08, when financial crisis hit world economies, Pakistan’s macro-economic performance deteriorated significantly with double digit inflation, widening fiscal deficit and falling GDP growth. Nevertheless, the electric utilities continued to experience a sharp increase in electricity demand. Sector Background At the time of appraisal, Pakistan power sector was in crisis because of stalled reforms, energy shortages and financial deficit. Electricity sales rose by 40% in the five years ending on June 30, 2007, period of high economic growth, while generation remained practically stagnant and the system was unable to cover 2,000MW of peak demand with acceptable reliability. With demand expected to grow at 7-8% per year in the medium-term, plans for capacity additions needed to be revised upward to eliminate shortages. The sector also needed significant fiscal support – approx. US$1.7 billion for FY08 (close to 20% of the projected operating revenues and 1% of GDP) – to cover the revenue deficit. Poor electricity service was identified as a major constraint to economic growth. Some of this deterioration in service was a result of Pakistan’s success at adding about one million new (mainly household) connections each year, without a commensurate expansion of generation capacity. Therefore, sector was in dire need of (a) substantial investment in new generation to secure supply of electricity, (b) strengthening of overloaded transmission and distribution system and improvements in energy efficiency, and (c) bringing sector into financial equilibrium through tariff and subsidy reforms. Power Sector Reforms The government’s strategy for the sector, built on the wide-ranging power sector reforms initiated in the early 1990s, aimed at improving sector performance and long term sustainability through institutional, regulatory, and structural reforms. As part of the reform, the Government opened up the sector to private investment, an independent National Electric Power Regulatory Agency (NEPRA) was established in 1998, and WAPDA Power Wing (a vertically integrated power sector utility) was unbundled into four generation, one transmission, and nine distribution companies. After a period of deteriorating financial performance in the late 1990s, the sector made some significant improvements, especially in terms of improved collections of bills. However, there was inadequate investment in low-cost base load generation capacity; from 2000-2008 there was almost no investment in generation and from 2009 to 2013 there was a net increase in capacity of just 3,000 MW. In addition, because of gas shortfall generation started to shift to expensive fuel oil; in FY05 gas accounted for 50% and in FY13 it was only 27%. As a result generation costs became significantly high and are difficult to control by the
1

DISCOs. The objectives of power sector reforms have not been fully achieved, as some important reform measures are yet to be implemented. Rationale for Bank Involvement Sustaining growth and improving competitiveness of the Pakistani economy was an important pillar of the Bank’s Country Partnership Strategy (CPS) FY06-09. Attaining this objective required significant investment in infrastructure, including power sector. The World Bank was engaged in policy advice and backed the power sector reform program through a series of budget-support operations. Improving electricity distribution and transmission services was considered a key element of the overall effort of reforming Pakistan’s power sector and strengthening its operating performance. The new companies established as a result of sector restructuring needed to invest in their physical networks to keep up with increasing demand, reduce losses, and improve services. They also needed to strengthen the capacity in various areas of corporate functions and establish a track record of performance and creditworthiness. Bank involvement in the project helped the companies finance important investments for which there were no alternative financiers. The Project was a first of a series of Adaptable Program Loan (APL). The indicative triggers for APL-2 were: (i) successful progress of APL-1; (ii) corporate autonomy of the DISCOs; and (iii) a fully functional wholesale market.
1.2 Original Project Development Objectives (PDO) and Key Indicators (as approved) The objectives were to: (i) strengthen the capacity of the distribution and transmission networks to meet increasing electricity demand in the selected areas more efficiently and with better reliability and quality; and (ii) strengthen institutional capacity of the selected distribution companies and support other priority areas of the power sector reform. The key performance indicators measured the effect of the project on the capacity of the distribution and transmission networks to deliver the amounts of electricity which consumers demand with improved reliability in terms of the overall annual electricity throughput and the total level of losses (which include both technical and commercial losses) to cover the efficiency aspect of the first objective. Selected intermediate indicators also measured increased access, reliability and quality of supply in terms of number of customers, interruptions and voltage conditions. The collection and number of trainings were used to measure entities financial performance and capacity building efforts and can be attributable to the second objective. While intermediate indicators related to decline in tariff differential subsidies could be linked to progress on reforms.
1.3 Revised PDO (as approved by original approving authority) and Key Indicators, and reasons/justification PDO and key indicators remained the same. However, at the time of restructuring in June 2012 target values were revised to reflect the reduced scope due to cancellation of about US$ 62 million (25% of the original loan amount). The component-wise break-up of cost before and after restructuring is given in Annex 1(a). Original and formally revised indicators are listed in the Data Sheet Section F.
2

1.4 Main Beneficiaries The immediate beneficiaries of the project were the national transmission and four distribution companies as the project would improve their revenues and profitability by reducing system losses, operation and maintenance costs, and the potential of accidents. The consumers in their service area would also benefit through safer, better and more reliable electric supply.
1.5 Original Components (as approved) The project included the following components:
A. physical strengthening of distribution networks (including sub transmission) operated by four distribution companies1;
B. removing some bottlenecks in the transmission grid, operated by NTDC2; C. technical assistance for capacity building, specialized studies, energy efficiency
and sector reform; and D. a pilot energy efficiency program, involving installation of energy saving
equipment at the customer level.
1.6 Revised Components Prior to original closing date the Project was restructured with the approval of the Regional Vice President to simplify the project design to focus on activities that were critical to the achievement of the PDO and could be completed within the extended time frame. As a result the following activities were dropped: (i) project activities under Part A, totaling an estimated US$ 38.28 million, that were not urgently required due to the recent power shortages caused by the lack of generation capacity; (ii) technical assistance activities under Part C, totaling an estimated US$ 8.72 million, that were being financed by other development partners, as well as those that were not ready for immediate financing; and (iii) all activities under Part D (Energy Efficiency Component), totaling an estimated US$ 15 million. In addition, US$ 4 million of the funds under the technical assistance component were reallocated to the Ministry of Water and Power (MOWP) from the four distribution companies to support the sector’s emerging urgent priorities, including power trade with neighboring countries. The Project was again restructured prior to the revised closing date to cancel the available IDA funds (about US$ 2 million) so that those can be reallocated to the Pakistan program.
1.7 Other significant changes (in design, scope and scale, implementation arrangements and schedule, and funding allocations) None
1 It included: (i) a 2 year time slice of the 5 year investment program in secondary transmission grid (STG) of the HESCO, IESCO, LESCO and MEPCO, (ii) a 2 year time slice of the investment in electricity loss reduction (ELR) program of IESCO, MEPCO and a pilot ELR program for HESCO.
2 A substation and transmission line for NTDC to relieve a bottleneck in serving MEPCO.
3
2. Key Factors Affecting Implementation and Outcomes
2.1 Project Preparation, Design and Quality at Entry (including whether lessons of earlier operations were taken into account, risks and their mitigations identified, and adequacy of participatory processes, as applicable)
The overall quality at entry is rated as Unsatisfactory. As discussed below this is based on little attention given to the corporate governance issues and risks were underestimated. In addition, some of the indictors were not directly correlated with this intervention and did not capture project development objectives. Intermediate indicators also failed to measure implementation progress3.
Soundness of Background Analysis.
The project was conceived as one of the investment components underpinning the government’s power sector reforms initiated by power sector restructuring. In addition to strengthening the newly formed entities the project also aimed at addressing broader power sector issues related to governance, regulatory and investments so that the power sector entities can function independently on pure commercial basis. However, these were not supported with a political economy study to provide relevant inputs into project design and to address critical risk factors. Therefore, technical assistance component for capacity building, specialized studies, energy efficiency and sector reforms could not be implemented in a manner envisaged.
At the time of Project inception and appraisal the country was experiencing a growing electricity demand driven by a respectable economic growth in the years 2004 to 2007. The four DISCOs selected for the EDTIP had experienced an average load growth in peak demand (during 2005, 2006 and 2007) of 7.7% for IESCO, 19.3% for LESCO. 12.8 % for MEPCO and 14.7% for HESCO. The peak demand in the overall system was expected to grow to 23,500 MW by 2012, requiring an addition of about 9,000 MW in additional effective generation capability by 2012. The peak demand was already exceeding effective generation capability in FY2006/074, therefore additions of at least 1,600 MW in generation capability were expected to be inducted every year between 2007 and 2017. Commensurate with such increase in peak demand and generation capability the transmission capacity had also to be increased at transmission level by NTDC and the sub-transmission level in DISCOs. Failure to provide such capacity additions would have resulted in forced outages, lower reliability and sub-standard quality of supply to the consumers, leading to an adverse impact on economic growth.
3 Please see Section 2.3 for detailed assessment of the key indicators.
4 During FY 2007 difference between Peak NTDC system demand and effective generation capability was1,846 MW. Source: NEPRA SOI Report 2009.
4

All DISCOs and NTDC had 5 year system expansion plans approved by the Planning Commission of the Government of Pakistan (GOP). The EDTIP project, however, covered only a small portion of the total investment needs of the transmission and distribution companies5. Initial discussions were held with all eight distribution companies but only four6 were selected based on the readiness of their projects, implementation capacity, need and government’s preferences. The selected entities were asked to prepare Project Description Documents focusing on two years of their investment program for possible Bank funding covering Secondary Transmission and Grid (STG) and Energy Loss Reduction (ELR) component which are at the core of the electricity distribution business. Individual project components were selected on the basis of technical and economic analysis of candidate projects in each entity. Several projects were also considered for APL-2. In parallel, some of the investment to implement the 5 year plans was expected from other sources, such as Asian Development Bank (ADB) or by IEs themselves.
Assessment of the project design.
NTDC was expected to cover most of its needs through other investment sources, so only a small unaddressed portion of capacity enhancement (220 kV Grid station at Kassowal and associated transmission line) in NTDC was included to address capacity restraint issues affecting delivery to MEPCO at 220 kV. A substantial portion of the project (more than 60 %) was designed to address the urgent need of DISCOs to satisfy the requirement of capacity enhancement at the sub-transmission level, for efficient delivery of service to consumers. The Project was thus appropriately designed to address the important and urgent need for investment in the transmission and distribution system. The design of the project, however, was overly complex covering both transmission and distribution with too many implementing entities and an energy efficiency pilot program. Therefore, project faced number of implementation challenges. Each of these components could have been a separate project prioritizing the development challenges of each company and appropriately addressing those.
After the unbundling, DISCOs were in the process of re-aligning their structures and processes to function as corporate entities. This is a major change management exercise and requires hand-holding support. Therefore, it would have been better to start with one or two utilities (one DISCO and NTDC), instead of 5 and help the entities develop a Business Plan and build their capacity. This would have helped prepare a robust project design and the project could have been expanded later with additional financing and bringing in more entities.
5 For example, in case of IESCO, the EDTIP STG and ELR component was about one-fourth of US$ 230 million, the total requirement for its five years approved development plan.
6 (1) Hyderabad Electric Supply Company– HESCO, (2) Islamabad Electric Supply Company– IESCO, (3) Lahore Electric Supply Company– LESCO, and (4) Multan Electric Power Company- MEPCO. In 2012, HESCO was bifurcated into two separate companies to form new Sukkur Electric Power Company-SEPCO.
5

Selection of DISCOs. The four DISCOs were identified by the Government and stated to be representative of companies in the sector ranging from top to bottom of the scale. The identification by Government also took into consideration other factors, such as law and order situation, ease of implementation and policy for privatization of some DISCOs. In all the four selected DISCO there was a need for Grid station capacity expansion and even though the Project has been closed, the need of Grid station capacity expansion remains insatiate even in the better performing DISCOs.
Design of sub projects for DISCOs within the categories of ST and 11kV. Within the DISCOs the segregation and ratio of subprojects between Sub-Transmission and Downstream Distribution at 11/0.4 kV (11kV), were based upon the operational demands of DISCOs as identified by them during need assessment, rather than being based on an optimization of benefits approach. For example in the case of LESCO, during FY2007 the ST Losses were less than1.0 % and 11kV losses were 12.7 % as compared to 3.6% and 8.9 % for IESCO, however project design did not include an ELR that LESCO decided to undertake from its own resources. Inclusion of ELR component could have given some flexibility to appropriately reallocate resources as LESCO’s STG component faced many difficulties and several contracts were not awarded. Project restructuring was done too late and left no choice other than cancellation. There was an emphasis on technical loss reduction but as explained below the project was missing a comprehensive revenue protection program including, disconnection of non-paying consumers, consumer classification for billing, computerized metering etc.
Were alternatives considered? ST capacity expansion is an essential need of DISCOs to carry out their business and service obligation and as such had no alternative7. However in the case of 11/0.4 kV distribution system, the alternative or sharing between technical energy loss reduction measures and pilferage reduction measures should have been considered for each DISCO to optimize project benefits8. Since no study was available to identify percentage of area wise pilferage in overall losses, the selection of projects was done under the constraint of assuming that the loading on line was arising out of a legitimate demand on the system. Alternately, it could have been based on a minimum revenue billing and collection requirement from the sub project area. This aspect has been taken into consideration on an overall basis while selecting HESCO for investing in Aerial Bundled conductor (ABC) installation as a measure of addressing the pilferage issue on a pilot basis. Other modes of addressing the pilferage issue could also have been considered in all DISCOs, such as (a) extending 11kV overhead line and installing smaller capacity distribution transformers
7 Although Captive power is stated as an alternative in PAD, but it cannot be made available in the exact same location where ST capacity constraint is being experienced; moreover it involves technical, regulatory and functional issues which restricts its availability as a feasible alternative to capacity expansion.
8 Distribution transformer and line capacity enhancement measures can become counterproductive if carried out in areas where large scale pilferage is evident. Sub-projects, aimed at pilferage reduction could have been included in all DISCOs, on the basis of grading of overall losses at the 11kV feeder level.
6

(Dtrs) to reduce or eliminate 0.4 kV overhead system, in areas where direct hooks are being applied for pilferage; and (b) installation of smart meters having over load circuit breaking and remote disconnection capability.
Overall, the project was missing a comprehensive revenue protection program and therefore the intended targets were not achieved. A component on automated metering and billing system implementation would have helped address this but as argued in this report project design was too complicated and inclusion of another component would have made it even more complex. Alternately, PDO could have been changed to bring it in line with the power sector attributes directly influenced through this intervention. Availability of reliable data is another consideration. The indicators therefore should either be based on the data which can be measured reliably or for which management information systems could be developed as part of the project.
Adequacy of government commitment.
Government commitment/ownership remained high during the preparation and design phase as it continued the power sector reform program articulated in early 1990s to transform the successor generation, transmission and distribution companies created from WAPDA, into commercially oriented and efficiently managed and operated companies. First annual consumer tariff determinations for DISCOs were completed in 2007 (an essential first step towards their financial autonomy) by NEPRA, almost six years after it became fully operational.
Unfortunately, the power sector reforms didn’t continue with the same vigor and the sector plunged deeper into energy and financial crisis and is unable to recover its costs from the current combination of tariffs and subsidies. This gave rise to inter corporate arrears (also referred as circular debt) that amounted to about 4% of GDP in FY2013 and the sector receives subsidies in the range of 1-2% of GDP. This also affected project implementation in several ways because of weak governance structure and governments interference in corporate decisions. The current government is trying to put things back on track. It has cleared the entire stock of circular debt in June/July 2013 and is now addressing underlying issues through policy measures, including the level of tariffs and inadequate management resulting in higher than acceptable level of losses and non-recovery of revenue. As part of government’s reform measures and its vision for the power sector delineated in National Power Policy 2013, the Board of Directors (BODs) of publically owned power sector entities have been strengthened, DISCOs have been put under the Companies Act and new performance contracts are being signed including revenue protection plans.
Assessment of Risks.
The risks were divided into two broad categories – (i) risks to project development objectives that largely dealt with the success of the power sector reforms; and (ii) risks to component results that depended upon selected DISCOs’ capacity to implement the project and administer procurement, environmental and social action plans. Some of
7

these risk factors particularly those related to tariffs and subsidies were translated into legal covenants so that financial viability of the sector and its entities can be ensured and IEs capacity to function independently can be built. These legal covenants were either not met or were met with significant delays.
The issues in the power sector were well laid out in the PAD, but the overall project risk was underestimated and should have been High rather than Substantial because of the issues related to corporate governance, lack of autonomy given to power sector entities and weak accountability structure, government’s unwillingness to implement tariff & subsidy policy and procurement related issues indicating collusion9.
In addition to the risks identified at the design stage, project faced several other risks that caused significant delays. Key ones are: (i) land acquisition became a major problem e.g. a grid station could not be built on already acquired piece of land and an alternate was suggested; (ii) other unforeseen risks such as markets volatility, floods/natural disasters e.g. bids were cancelled after a blip in commodity prices in 2008.
2.2 Implementation (including any project changes/restructuring, mid-term review, Project at Risk status, and actions taken, as applicable) Implementation of the project remained slower than planned since its approval on June 17, 2008 particularly during initial phase of the Project. Project’s effectiveness was unduly delayed because legal opinions and ratifications of the Project Agreement by respective Boards of the DISCOs took 6 months and opening of designated account took another 6 months after effectiveness. There were major delays in procurement cycle due to several iterations to procurement documents, multiple rebidding of activities due to all non-responsive bids or no bids received, and undue time taken from tendering/evaluation to contract award. These issues arose because project was not ready for implementation which points towards its poor quality at entry. The mid-term review was carried out one year before project closing and the ratings were downgraded from Moderately Satisfactory (MS) to Moderately Unsatisfactory (MU) and Unsatisfactory(U) for Development Objective (DO) and Implementation Progress (IP) respectively primarily because of slow pace of contract award, lag in disbursements, delay in implementing the Procurement Action Plan (PAP)10, and weak institutional capacity. Specific actions and timelines were agreed but even those were not adhered to and the project was restructured in June 2012 (few days prior to the original closing date). The project was again
9 INT was involved to address the issues of collusion and several actions were agreed under the procurement action plan including amendment to SRO827(1) (See Section 2.4 Procurement for details).
10 At the start of the project there were some instances of collusion and unethical practices in the sector for which the Bank had proposed a Procurement Action Plan. Despite of repeated efforts there was very little implementation. Lack of ownership and seriousness to implement PAP was a major reason for not meeting this legal covenant.
8

restructured prior to the revised closing date to reallocate the unutilized IDA portion to the Pakistan program. At first restructuring, recognizing the complexities involved in the nature of the project and the delays caused due to factors outside the control of the IEs’ management the project was extended for 20 months and only the contracts which were ongoing or at final stage of award were carried forward. This did not improve the project performance and the ratings for DO and IP in the last Implementation Status and Results Report (ISR) were still MU and U. The implementation performance varies widely among IEs but all have experienced significant delays and have contracts that go beyond the revised Project Closing Date of February 28, 2014 (PCD) or were not awarded. As of PCD only 75 sub-projects (i.e. 65%) were completed and about 72.5% were disbursed. Four large value contracts representing 23 sub-projects (amounting to about US$ 32 million, 16.5% by value) were not awarded even after an extension of 20 months. About 11.0% of the contractual commitment is going beyond the PCD and has to be funded by the IEs themselves. (See Annex 2 for entity-wise details). Based on a sample of 27 contracts from a total of 70 it was observed that procurement cycle took more than 400 days on average for ICB contracts, an estimated delay of more than 100 days on average. The average cycle time for NCB is in the range of 250 – 350 days which is also quite high. Similarly, for a selected sample of 63 contracts more than 75% of the contracts were not completed on time, experienced delays ranging from 1 to 18 months with an average delay of 3 months. Delays occurred almost at every stage of the project cycle. As of project closing only 75 out of 115 subprojects were completed. Majority about 23 were not awarded and 17 went beyond the PCD because of delay in implementation. Following factors contributed to the delay of project implementation: • IEs’ weak capacity in contract management and ineffective use of technical
assistance. The project had six implementing agencies most of which were established in 1998, after unbundling of the integrated utility. Secondly, it was the first Bank investment lending operation in Pakistan’s power sector since 1995. Therefore, the IEs didn’t have much experience in preparing or implementing Bank-funded projects. Also, frequent staff turnover eroded the capacity which was built in the interim. Figure 1 compares procurement cycle for similar NCB contracts funded by Bank versus own resources. For Bank funded projects a major gap was observed in bid evaluation for following reasons: (i) low clearing thresholds for DISCOs required multiple internal approvals, (ii) historical track record to assess quality and bidders’ past experience required for Bank funded activities was missing from the bids as bidders were only used to submit qualifications details as per the activities done through DISCOs own resources which
Figure 1: Procurement Cycle in Days
9

did not require such details. A logical rationale for delay in contract award and signing could not be ascertained. Generally the bid validity requested was 120 days, which is normally an adequate time period for doing evaluations and contract award. But there are instances where bid validity had expired and bidders were not willing to extend due to floating exchange rate and increasing prices of raw materials. Also, the TA funds were not utilized to build the capacity during the early phase of the project. For example:
a. Lack of skill to deal with procurement/contract management relating to the ST portion of the project, particularly turn key projects including entire package of a 132 kV Grid station, was already realized at the Project appraisal stage. When the DISCOs took over the ST part of Transmission from NTDC, the Grid system operation and construction staff was transferred to the respective DISCOs but Procurement and contract management staff with NTDC was not shared with DISCOs. Acquisition of skills in this area was therefore an ongoing process during the implementation of the project involving delays in sending back and forth Bidding Documents and Bid Evaluation reports between WB and the IEs before approvals could be obtained and contracts signed by IEs. Gearing the TA component to building capacity in this context right at the beginning of the Project could have avoided most of the protracted delays.
b. It was agreed that International Procurement Advisor (IPA) would be appointed by no later than December 31, 2008 but the consultant was engaged after the MTR and the procurement manual prepared by the IPA and reviewed by the IEs to strengthen procurement systems was never adopted by the IEs.
• Revision of Technical Specifications during project implementation was time consuming and could have been done at the design stage or immediately afterwards. The government agreed with the Bank in mid-2009 that the IEs and PEPCO will work with the Bank to update the specifications of key equipment and material to be procured under the Project. This was necessitated by a need to ensure that the specifications used by the IEs in the bidding documents are non-restrictive by bringing them in line with the latest international standards and norms and to address collusion but the process was time consuming and about six months were spent to update/revise the technical specifications of main equipment.
• Frequent complaints, contractual disputes and litigation issues held up project progress. Power equipment market was also not quite open, competitive and efficient. Manufacturers of distribution equipment and materials in Pakistan were not used to open and competitive bidding processes, based on WB guidelines and therefore there were several complaints and concerns raised by the potential bidders. Project received more than its share of complaints – 30% of the complaints received over the past 10 years were related to this project. A number of complaints also arose out of local manufacturers and vendors trying to resist competition from international firms. To highlight the issue one ICB can be quoted here which was the cause of substantial underutilization of the loan.
a. WB issued “No objection” for purchase of 27 number 31.5- 40 MVA Power Transformers (PTrs), relating to LESCO ICB 631-01. However, LESCO could
10

not sign the contract with the lowest evaluated bidder as the case remained under consideration of the LESCO Board for an indefinite period due to the issue of equivalency of On Load Tap Changer (OLTC, essentially required to change output voltage according to requirement during operation). The matter regarding OLTC also affected few other DISCOs/contracts not financed by the Bank and was investigated by the Competition Commission of Pakistan (CCP) on the complaint filed by an international manufacturer into the alleged monopoly created by specifying a particular make for OLTC in PTrs. The CCP concluded this to be a violation of the Competition Act 2010 based on imposing restrictive trading conditions. Later, NTDC filed a writ petition against CCP Decision and as a result the matter remained suspended.
• Lack of preparedness to deal with unforeseen risks resulting in ineffective use of project funds. For example:
a. Almost all bidding process in 2008 was cancelled due to sudden spike in commodity prices that didn’t seem like a valid trend and could have made these investments unfeasible. In retrospect, it seemed like a good decision because the spike disappeared within four months.
b. In 2010, floods damaged distribution equipment and assets. Procurement activities in some DISCOs (particularly LESCO) were halted for about 8 months so that the savings can be diverted for the restoration of distribution assets damaged by the floods. However, the government subsequently decided not to utilize the existing funds for such purposes and it appears that this was not communicated to the IEs in time and caused some delays.
2.3 Monitoring and Evaluation (M&E) Design, Implementation and Utilization Design. The PDO of EDTIP was generic, overambitious and mixed investments and reforms. Such wide ranging objectives made it extremely difficult to measure the project achievements. Moreover, the indicators selected for the project represented entity level data and captured the intended outcomes on an overall operational performance of the IEs in terms of units purchased, losses, collection, subsidies, interruptions, voltage profile etc. The indicators were not project specific and therefore performance of one sub-component could not be compared against the other for informed decision making and appropriate reallocation of resources. The indicators also did not capture the effect of similar concurrent activities by other lending agencies such as ADB or IEs’ own development resource. The intermediate indicators also did not capture other actions that had direct effect on IEs financial performance e.g. the timing and adequacy of tariffs adjustment approvals and receipt of subsidies. The lack of reporting on project results, therefore, posed lot of challenges for M&E. The intermediate indicators, therefore, should have included project specific indicators such as 132/11kV capacity added in the ST system and number of ELR projects completed out of total sub projects envisaged in the 11/0.4 kV system to measure project’s progress and benefits directly attributable to this project. Implementation/Utilization. The Quarterly Progress Reports (QPRs) submitted by the IEs included Key Performance Indicators. Most of these key indicators are widely reported and are included in the regulators’ industry reports, tariff petitions/determinations, etc.
11

The losses and collection figures are expected to be reliable as the amounts are audited by independent auditors and units purchased and billed is largely through metering. The data on quality and reliability of supply, however, show such a vast variation in numbers across DISCOs and across time that it cannot be relied upon as a credible indicator to judge progress of implementation or project’s effectiveness. No system was put in place either as part of the project or by utilities themselves to improve data collection for better monitoring and decision making purposes. The Technical Assistance (TA) component was not used effectively to directly support project implementation. An owner’s engineer for example would have helped identify and address the issues leading to significant capacity building on project implementation.
2.4 Safeguard and Fiduciary Compliance (focusing on issues and their resolution, as applicable)
Environmental Safeguards: The project triggered Bank’s safeguard policies OP4.01 and 4.12 and was assessed as Environment Category B based upon the fact that most of the anticipated/potential impacts were mild to moderate in significance and associated with the construction activities and hence temporary in nature. In accordance with the requirements detailed in the ESAs cleared by the Bank, the IAs established safeguard departments to implement ESAs and ESMPs but often faced reluctance and sometimes even resistance from within their respective organizations and from contractors. The key factor affecting the safeguard implementation and outcome included lack of relevant experience and awareness at the IE level. Similarly the contractors and consultants engaged by the IEs were also quite weak in terms of understanding and implementing environmental safeguard requirements. In addition, no monitoring was carried out by the regulatory agencies (EPAs) for the ESA compliance during the project implementation.
Initially during the project implementation, the safeguard compliance was not satisfactory primarily because the IEs and their contractors did not have any previous experience in terms of understanding and implementing environmental safeguard requirements. However the compliance improved gradually as a result of continued support and guidance provided by the task team and the final monitoring conducted at the end of the construction phase revealed that the project did not cause any significant, lasting and or irreversible environmental impacts.
Social Safeguards: The Project used two instruments to address social safeguards issues – Environment and Social Assessments, Resettlement Action Plans and one Abbreviated Resettlement Action Plan. While ESMPs were formed for all IEs (HESCO, IESCO, LESCO, MEPCO and NTDC), the RAPs were prepared and implemented only by entities that undertook land acquisition for grid stations. This included IESCO and MEPCO while LESCO prepared and implemented an Abbreviated Resettlement Action Plan. Mostly, the RAPs were implemented for small number of Project Affected People e.g. in Lahore, LESCO acquired land from 15 affected people. However, the major area of compensation remained that for crop and other losses that were incurred during the implementation of the Transmission Line components. These losses were assessed and addressed under the
12

existing practices used by the IEs. The procedure involves post-assessment of losses through the patwaris/land revenue officers and local staff. In the absence of standardized guidelines and procedures for assessment of losses, the common practice across all DISCOs is to undertake assessment after the damages. Further, there is no clarity on standardization of compensation payments. The result was that compensation payments were severely and consistently delayed in the Project. IESCO, LESCO and MEPCO reported pending/outstanding payments even at the end of the Project. In the case of IESCO, the payments were delayed for a year while MEPCO had only paid 19% of the compensation owed for crop losses by the end of the project.
The Project supported the creation of Social and Environment Cells in each IE to oversee the implementation of social safeguards. Over the life of the Project, these played a significant role in monitoring safeguards implementation in the field, raising awareness both within DISCOs and among contractors/implementing partners and conducting periodic public consultations. A Grievance Redress Mechanism was operational throughout the project. However, it had limited scope to address the major issue related to delays in loss assessment and award of compensation payments for losses due to Transmission Lines.
Financial Management In compliance with Corporate Governance Rules 2013 issued by the Securities & Exchange Commission of Pakistan (SECP), new Boards including independent directors of all DISCOs were appointed in August – October 2013. Oversight committees of the Boards on internal audit and finance have also been made effective to ensure effective controls and financial reporting. The Bank was informed, at the project appraisal stage that Enterprise Resource Planning (ERP)11 is underway in all implementing agencies, except MEPCO, which is expected to be completed during 2008 – only LESCO has successfully implemented accounting module. Further, it was agreed at time of appraisal that the fixed assets physical verification and tagging exercise would be initiated by DISCOs and is yet to be completed. Whereas, internal audit approach, to conduct the audit is based on transaction-audit, a weak audit approach, instead of Risk-Based audit approach as envisaged in the DISCOs Internal Audit Manuals. Implementing agencies arrangements for financial reporting are given in the ensuing paragraphs. Existing financial management arrangements in the six implementing agencies of this project were used. Adequate staffing was maintained during life of the project. Internal audit arrangements were also in place except for PEPCO where no internal audit was conducted despite regular follow up. Despite the above-mentioned drawbacks, the implementing agencies remained compliant with the financial covenants submitting acceptable interim quarterly financial reports and annual audited financial statements except NTDC in which case Bank had to take
11 ERP cover computerization of accounts, human resource, billing, inventory and fixed assets management.
13

remedial measures as audited financial statements were submitted after a delay of over four months after the due date. The delay was attributable to the board of directors not being in place. Auditors’ performance remained satisfactory.
2.5 Post-completion Operation/Next Phase (including transition arrangement to post-completion operation of investments financed by present operation, Operation & Maintenance arrangements, sustaining reforms and institutional capacity, and next phase/follow-up operation, if applicable) Completion of On-going Contracts and Operation & Maintenance (O&M) arrangements. No transition arrangements are required to be made by the Bank as DISCOs are liable for the completion of the on-going activities from their own resources. The annual distribution margins (DM) determined by NEPRA will cover O&M cost and provides return on assets and depreciation to cover the debt servicing. The tariff revenue also ensures that the DISCOs are able to contribute equity for new projects and therefore DISCOs/NTDC can finance the portion of the work (about US$ 20 million) that went beyond PCD from their own resources. Most DISCOs, however, are not meeting the efficiency targets set by NEPRA for system losses and bill collection which affect their cash flows and profitability. Even though these companies are in perpetual loss and require government support to remain financially viable retain their DM in full by delaying the payments to NTDC/CPPA (single buyer and seller) for the power procured. As part of the reform measures and action covered under Power Reform DPC, CPPA would become independent of NTDC and would sign PPAs with the power generators on behalf of DISCOs making them liable for their losses. This may also lead to reduced access to generating capacity if DISCOs are unable to pay for the power procured. Sustaining Reforms and Institutional Capacity. Further strengthening of technical capacity would require an active TA or a lending operation. Though the Bank will continue to remain engaged with the government and other entities as part of its policy dialogue other development partners particularly ADB and USAID are providing more direct support to power sector public entities. As mentioned in Section 1.1, prior conditions including those related to power reforms have not been met even today and APL-2 was never approved. One of those conditions relates to Power Sector Reforms which have been a long drawn process. The Bank, however, has remained engaged with the government in its reforms efforts. The National Power Policy 2013 of the Government of Pakistan (GOP) has given a fresh impetus to these reform efforts to develop an efficient and consumer centric electric power system. The GOP has also developed an implementation plan, which is supported by the development partners. The IMF approved in September 2013 a 36 month Extended Fund Facility in the amount of US$ 6.68 billion, which includes reforms to the power sector. The Bank’s power sector reform DPC series, first of which (US$ 600 million) was approved in May 2014, also supports these reforms and was developed in collaboration with ADB and JICA. These reforms efforts are expected to have positive results on the sector and will improve financial viability of generating companies, NTDC and the DISCOs.
14
Ensuring Financial Sustainability of the Sector. The largest financial risk in the sector is the under performance of the DISCOs against the targets for loss reduction and bill collection set by NEPRA. Addressing these issues through DPC would pave the way for much needed investments in the transmission and distribution sector. The Government as the current owner has instructed the DISCOs to implement revenue protection programs and through the performance contracts, MOWP is holding the DISCOs accountable. Implementing a revenue protection program, however, will require immediate investments. DISCOs also need to enhance transmission and distribution network capacity to disperse additional power from planned and ongoing generation projects without incurring major losses. Follow-up operation/plans. Considering the delays and problems faced during the implementation of the EDTIP project a disbursement linked indicator type operation (DLI)12 with some emphasis on procurement aspects along with other operational parameters could be considered for the design of any future project with electricity transmission and distribution companies. However, given how poor the indicators were this would require (a) investment in indicators to ensure availability of reliable information and (b) organizational changes to use that information for performance monitoring. In addition to key performance indicators a DLI could also include specific actions aimed to improve efficiency, transparency and accountability in management and operations. Power Reform DPC will set a stage for investments in the sector by (i) increasing transparency and data reliability; (ii) addressing chronic issues related to tariffs, subsidies and circular debt; and (iii) ensuring enhanced monitoring by NEPRA and the MOWP. However, most of the DISCOs are still not up to the mark to raise commercial financing on their own and therefore would need continued support of multi- and bi-laterals for some time.
3. Assessment of Outcomes
3.1 Relevance of Objectives, Design and Implementation (to current country and global priorities, and Bank assistance strategy) The project objectives remain highly relevant to the needs of the country in general and power sector in particular but as explained below were too ambitious. Similarly, project design was very complicated spreading across many dimensions and indicators failed to capture project progress. Therefore, relevance of objectives, design and implementation is rated as ‘Moderate’ on a 4 point scale13. Further explanation in support of this rating is provided in the following paras.
12 Use of DLIs, for some other projects in Pakistan, has demonstrated effectiveness in enhancing coordination with stakeholders and development partners and focusing greater attention on results as opposed to administrative implementation issues, which was a major cause of EDTIP’s poor performance.
13 4 Point Scale: Negligible to Low (N); Moderate (M); Significant/Substantial (S) and High (H).
15

Relevance of Objectives. The project remains highly relevant to the current Government strategy delineated in the National Power Policy 2013 which has highlighted the key weaknesses/challenges in the sector and 3 of 5 major targets set in the Policy relate to the distribution sector which this project was also capturing. These three policy targets are: reduce transmission and distribution losses from 23-25% to 16%, improve collection from 85% to 95% and shorten processing time to improve governance. The project is also relevant to key objectives of the FY10-14 Country Partnership Strategy (CPS) and will be even more strongly related to future CPS (FY15-19) that has underlined the increased importance of an efficient power sector for sustainable growth. In the last CPS (effective during the implementation period) it underpinned primarily pillar 3 (improving infrastructure to support growth) and in the current CPS a project like EDTIP would directly support two of the four result areas i.e. Energy and Service Delivery. Relevance of Design. A project addressing efficiency issues in distribution remains still highly relevant to the current power sector business environment as it can address some of the critical challenges that the sector is still facing i.e. financing and energy deficit. Project design encompassed reduction in losses, one of the major causes of financial deficit in the sector, and expansion of the network, needed to increase access to electricity and disperse the power from generation projects with better reliability and quality. Intermediate indicators, however, failed to measure the progress of the project and therefore remedial actions were missing till the mid-term review (MTR). Overall, the project design addressed a wide range of issues but was very complex and had an aggressive implementation plan given the risks associated with power sector reforms, weak implementation capacity of IEs and lack of project readiness to go into implementation.
3.2 Achievement of Project Development Objectives (including brief discussion of causal linkages between outputs and outcomes, with details on outputs in Annex 2) Performance of IEs against key indicators show mixed results and therefore it is difficult to measure the achievement of PDO when there are several IEs. Generally, the performance of the IEs improved over the implementation period of this project but the target values were mostly not achieved. As explained is Section 2.3, these indicators measured entity level performance in terms of reduction in losses, collection and amount of electricity handled by the network and therefore it is difficult to attribute the performance of the IEs (or its shortcomings) to this particular intervention. Moreover, the indicators did not consider the impact of other investments and exogenous factors e.g. supply deficit, which is not in control of the IEs and it is difficult to improve distribution efficiency without having adequate available generation capacity. The project specific analysis presented in Annex 3 shows that the performance in the project areas has improved in terms of reduction in losses and increased sales as envisaged. However, slow implementation of the project, a large number of incomplete sub projects and non-compliance with several actions agreed under the project resulted in reduced and delayed
16
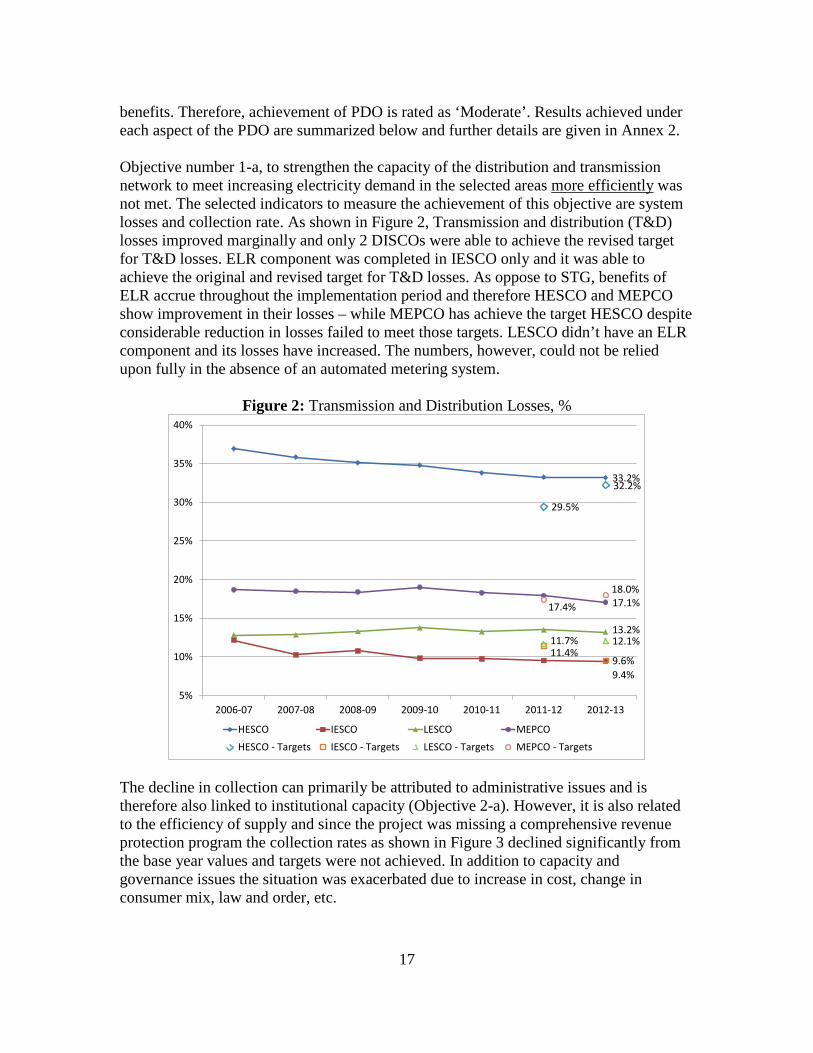
benefits. Therefore, achievement of PDO is rated as ‘Moderate’. Results achieved under each aspect of the PDO are summarized below and further details are given in Annex 2. Objective number 1-a, to strengthen the capacity of the distribution and transmission network to meet increasing electricity demand in the selected areas more efficiently was not met. The selected indicators to measure the achievement of this objective are system losses and collection rate. As shown in Figure 2, Transmission and distribution (T&D) losses improved marginally and only 2 DISCOs were able to achieve the revised target for T&D losses. ELR component was completed in IESCO only and it was able to achieve the original and revised target for T&D losses. As oppose to STG, benefits of ELR accrue throughout the implementation period and therefore HESCO and MEPCO show improvement in their losses – while MEPCO has achieve the target HESCO despite considerable reduction in losses failed to meet those targets. LESCO didn’t have an ELR component and its losses have increased. The numbers, however, could not be relied upon fully in the absence of an automated metering system.
Figure 2: Transmission and Distribution Losses, %
The decline in collection can primarily be attributed to administrative issues and is therefore also linked to institutional capacity (Objective 2-a). However, it is also related to the efficiency of supply and since the project was missing a comprehensive revenue protection program the collection rates as shown in Figure 3 declined significantly from the base year values and targets were not achieved. In addition to capacity and governance issues the situation was exacerbated due to increase in cost, change in consumer mix, law and order, etc.
33.2%
9.4%
13.2%
17.1%
29.5%
32.2%
11.4%9.6%
11.7% 12.1%
17.4%
18.0%
5%
10%
15%
20%
25%
30%
35%
40%
2006-07 2007-08 2008-09 2009-10 2010-11 2011-12 2012-13
HESCO IESCO LESCO MEPCO
HESCO - Targets IESCO - Targets LESCO - Targets MEPCO - Targets
17

Figure 3: Collection Ratio, %
Objective number 1-b, to strengthen the capacity of the distribution and transmission network to meet increasing electricity demand in the selected areas with better reliability and quality cannot be assessed because area-wise data was not available (at appraisal or at completion). However, based on the entity level indicator proposed in the PAD electricity demand has not been met as supply was not assured to the distribution companies. The amount of electricity handled was expected to grow at the rate of 5.9% originally (FY12 Target), was revised down to yield 2.2% growth (FY13 Target) and was able to achieve only 1.1% growth (FY13 Actual). Nevertheless, progress in enhancing network capacity was satisfactory as 53 of 59 STG sub-projects were completed and the remaining six are expected to be completed by September 201414. Number of electricity consumers also increased by 30% during this period but resulted in increased load shedding in a supply shortfall scenario. Objective number 2-a, strengthening of institutional capacity, also was not achieved as evident from slow implementation of several contracts, continued delay in complying with the agreed procurement action plan and slow disbursements. Weak institutional capacity was highlighted as a major risk and a mitigation plan was proposed in the PAD. These actions, however, were either not implemented or were implemented with significant delays. Nevertheless, capacity of the IEs has improved as evident from sharp increase in contract signing and disbursements observed after the MTR but it is still not up to the mark expected from commercially oriented entities.
14 Expenses going beyond the PCD will be funded by IEs themselves.
67.6%
94.4%97.9%
91.8%
0%
10%
20%
30%
40%
50%
60%
70%
80%
90%
100%
2006-07 2007-08 2008-09 2009-10 2010-11 2011-12 2012-13
HESCO IESCO LESCO MEPCO
18

Objective number 2-b, The TA component was not used effectively to support power sector reforms and therefore this objective was not achieved. Successful reforms would have meant a financially viable sector and therefore reliance on government subsidies could be used as an indicator to measure the achievement of this particular objective. As shown in Figure 5, since FY2007, the tariff differential subsidies have increased by manifolds15.
Figure 4: Tariff Differential Subsidies Billed, PKR Million
3.3 Efficiency (Net Present Value/Economic Rate of Return, cost effectiveness, e.g., unit rate norms, least cost, and comparisons; and Financial Rate of Return) As shown in the economic analysis (Annex 3), ELR projects in particular have very high economic returns and ERR exceeded the appraisal estimates as cost of generation has increased by manifolds since appraisal. STG project that substitutes non-grid electricity also show high economic returns if valued using consumer surplus approach. Even if benefits are measured taking distribution margin (DM) as a proxy for economic benefits (as in the PAD) the returns are modest. Therefore, the DISCOs that had major share of ELR in their portfolio have performed better in terms of ERR. However, implementation delays were common and all IEs have uncompleted projects in their portfolios and this has delayed project benefits or realization of its economic returns. US$64 million were
15 By FY16, the government plans to reduce its electricity subsidy bill from 1.5 percent of GDP to 0.3-0.4 percent and TDS is expected to have declined after FY13 as part of the agreement with the IMF and actions agreed under power reform DPC.
0
5,000
10,000
15,000
20,000
25,000
30,000
35,000
40,000
2006-07 2007-08 2008-09 2009-10 2010-11 2011-12 2012-13
HESCO IESCO LESCO MEPCO
19

cancelled through project restructuring, another US$ 32 million worth of contracts were not awarded and contracts amounting to US$ 56 million16 could not be completed by the PCD. IEs’ failure to utilize about 59% of the original loan amount despite that it was needed the most to deal with the challenges of the power sector resulted in what most likely are substantial foregone economic and financial benefits e.g. denied access, unreliable supply and increased energy and financial deficits in the sector. As shown in Table 1 the economic returns of the project except for LESCO exceeded the appraisal estimates even when valued using average distribution margin of PKR1.1/kWh which is much less than PKR 6.3 estimated to be the consumer surplus. The main benefits of the project were derived from increase in sales due to enhanced transformation and transmission capacity and lower power purchases due to reduction in losses. Though the additional sales because of STG components are less compared to appraisal (even after accounting for the reduced scope) the ERR has increased because of the ELR component. The power purchase cost used to value the benefits of ELR has increased by more than three times. Moreover, the actual reduction in power purchased is estimated to be more than the appraisal estimate. See Annex 3 for detailed analysis. The ERR for NTDC is expected to be less than the appraisal estimate because NTDC had only one project which could not be completed. According, to the appraisal document a two year delay would have reduced the ERR from 32.9 to 22.3 percent.
Table 1: Comparison of Economic Rate of Return (ERR) at Appraisal and Completion ERR at Appraisal ERR at Completion HESCO 45.08 65.80 IESCO 21.70 63.07 LESCO 36.94 4.01 MEPCO 17.24 18.94 NTDC 32.92 Expected to be much less
Despite huge variation in the number of units, delays in implementation, etc. the project has a very high economic rate of return of 47% (for all DISCOs combined), typical of a distribution project and is therefore rated as ‘Substantial’ in terms of efficiency. The delays in project implementation did not have a major impact on the ERR because both cost and benefit streams were delayed by the same time period. There were few instances in which line or the grid couldn’t be energized because of some litigation or other issues after most of the costs were incurred but its impact on the overall returns was negligible. Cancellation or no award would tend to reduce the NPV but did not have a major impact on the ERR because neither the cost nor the benefits were accounted.
16 STG-DISCOs: US$ 15 million, ELR-DISCOs: US$ 17 million, NTDC: US$ 24 million. Benefits of an ELR project will accrue throughout its implementation while benefits of STG will come after completion.
20

Since the investments are part of a multiyear system expansion plans, approved by Planning Commission of Pakistan, these are expected to be allowed by NEPRA, as prudent investment to form part of IEs regulatory asset base. Consequently, a corresponding return on assets, based on the prevailing weighted average cost of capital, will be included in the tariff determined by NEPRA for each IE as a whole. Therefore, a 17% financial rate of return (the applicable relending rate of the government for these entities in rupees at the time of project signing) in respect of the investment financed with the EDTIP loan is assured for through the regulatory dispensation provided DISCOs meet the regulatory targets for system losses and collection. Collectively DISCOs are not meeting these targets and are therefore in chronic loss and rely on government support and subsidies to remain financially viable. Delay in tariff determination/notification process also makes the returns erratic and unpredictable.
3.4 Justification of Overall Outcome Rating (combining relevance, achievement of PDOs, and efficiency) Rating: Moderately Unsatisfactory Despite significant shortcomings like implementation delays, missing 50% of the targets and several incomplete activities, the data collected for ICR show that the project made significant contributions in the geographical areas where it was implemented successfully. It has high economic returns based on the results achieved with the amount spent and is therefore rated as Substantial in terms of efficiency. Achievement of PDO, however, could not be measured reliably because of disconnect between the PDO and the indicators. PDO was too ambitious and the indicators were not relevant and reliable to capture project specific performance. Nevertheless, the project has helped IEs to enhance the transmission and distribution capacity and reduce losses to support additional consumers and increase revenue. Therefore, achievement of PDO is rated as Moderate instead of Low or Negligible. Lastly, the project was highly relevant to address the needs of the sector but was downgraded to moderate because of the design issues. Based on these three aspects relevance, achievement of PDOs and efficiency as discussed in the sections above the overall outcome is rated as Moderately Unsatisfactory.
3.5 Overarching Themes, Other Outcomes and Impacts (if any, where not previously covered or to amplify discussion above) (a) Poverty Impacts, Gender Aspects, and Social Development This aspect has not been documented for the EDTIP project. The project, however, is expected to have made significant positive contribution in terms of improved availability and reliability of power to general electricity consumers including the poor households. For example, installation of Aerial Bundled Conductor in HESCO not only eliminated the number of failure complaints lodged by the consumers but also show drastic reduction in number of fatalities17, which is why the project took off despite intense resistance at the beginning.
17 In FY13, HESCO reported zero public fatalities down from 18 and 11 in FY12 and FY11.
21

(b) Institutional Change/Strengthening (particularly with reference to impacts on longer-term capacity and institutional development) It was Bank’s first project with the newly formed distribution companies and there was lot of learning on both sides. The distribution companies are now more familiar with the Bank’s procedures and requirements. The procurement manual and associated SOPs developed under the project will further strengthen their institutional capacity if adopted by the IEs. The project also helped the entities to revise the technical specifications. The TA component on the other hand was not implemented. It covered wide ranging activities but focus remained mostly limited to training aspects. As a result, planning, design, operational and information systems at DISCOs are still very weak. (c) Other Unintended Outcomes and Impacts (positive or negative) None
3.6 Summary of Findings of Beneficiary Survey and/or Stakeholder Workshops (optional for Core ICR, required for ILI, details in annexes) Not applicable
4. Assessment of Risk to Development Outcome Rating: Substantial Outcome indicators that are strongly correlated to the project show positive trends. Government of Pakistan is also committed to the reforms to make power sector and its entities financially viable. However, given the past performance of public sector power companies, and uneven commitment of the government for reforms the risk to development outcome is rated as ‘Substantial’. Presently, country is facing power shortages and relies on expensive fuel oil for power generation. Meeting energy deficit and bringing low cost power generation would require huge investment. Simultaneously, transmission and distribution also needs strengthening for power evacuation and dispersal. Therefore, the situation is going to persist and it is difficult to have reliable transmission and distribution network when the system is facing severe power shortfalls. The Bank should also remain engaged with the IEs to draw upon the achievements, lessons learned and capacity enhanced made possible through many years of engagement under EDTIP.
5. Assessment of Bank and Borrower Performance (relating to design, implementation and outcome issues)
5.1 Bank Performance (a) Bank Performance in Ensuring Quality at Entry (i.e., performance through lending phase) Rating: Unsatisfactory Project objectives were well-defined and were consistent with national priorities and CPS objectives. Preparation of the project, however, spanned over 4 years (which was too long) and did more than required on the fiduciary side. The Bank team exercised due diligence in establishing the technical foundation of the project. Extensive review of
22

feasibility studies was done by the bank team. The Bank performance in ensuring quality at entry, however, is rated as Unsatisfactory because of following shortcomings:
• The risks to the project were adequately identified but were underestimated. • The indicators measured overall performance of the entity but failed to measure
interim progress of the project. The indicators were not directly linked to the project intervention and failed to measure the development objectives.
• The Bank team identified several control issues pertaining to financial management e.g. (i) no systematic coding system for tagging of fixed assets, (ii) lack of financial independence; and (iii) lack of controls in the billing system. Despite these issues the FM arrangements were rated as satisfactory and neither the risk matrix nor the legal covenants captured these major risk factors.
• Some of the bidding documents were prepared in advance but needed revision and lot of time was spent on iterations.
• Adequate operating procedures were not put in place for strict adherence to the Procurement Plan. During implementation, there were recurrent issues like iterations in documents, leakage of procurement related confidential information, delays in implementing PAP, unusual bidding patterns – possible indicators of collusion, irrational delays in processes, etc.
• The long time spent on preparation was counterproductive to some extent as other agencies completed the preparation and approval process while the Bank was still appraising and therefore EDTIP was competing for candidate investments.
• Four years given for implementation by the appraisal team was too ambitious for a distribution projects and did not account for the complexities involved and unexpected events.
(b) Quality of Supervision (including of fiduciary and safeguards policies) Rating: Unsatisfactory Comprehensive review missions were conducted annually during the first two years and every six months thereafter including field visits that covered wide area. Covering five separate IEs having project components spread over a large area of two provinces was a major issue affecting the quality of oversight. Despite these difficulties the Bank’s technical, safeguard and fiduciary teams provided regular support and made some positive contributions as described below:
• Technical support was extended from the Bank side in assisting the DISCOs to revise the specifications according to internationally accepted standards. In order to expedite the process different DISCOs were encouraged to lead in updating different specifications. 18 The revised specifications were adopted by all the
18 IESCO took the lead in updating the Technical specifications relating to ST grid station equipment and LESCO took the lead with respect to GIS equipment.
23

DISCOs for inclusion in the bidding documents. The exercise helped in reducing time taken for BD / BER approvals and contract implementation. The prominent concerns addressed were: (a) The specifications were revised and simplified in accordance with the latest “International Electro-technical Commission” specifications to facilitate large scale participation and competition, (b) a number of internationally accredited Testing facilities were required to be specified, from which manufacturers could present successful testing results carried out as per specification for the purpose of acceptance of the procured/installed item, and (c) where a specification required an equipment as manufactured by a particular manufacturer, (due to technical performance history or other valid reasons), the specification was revised to add the words “or equivalent”. This meant that if a prospective Bidder could provide the same or better quality equipment with respect to technical specification his entry into competition was not be restricted by a particular make. Main findings of the detailed technical review of four representative ICBs (one from each DISCO) are discussed in Annex 10.
• For procurement the Bank team closely interacted with all IEs and reported the issues and their mitigation measures in every aide memoire issued after a supervision mission. However despite the constant follow-up with IEs on mitigation measures it had only limited results due to absence of ownership, inadequate structure for knowledge/ learning retention and capacity building. The IPR report of the project however discussed the Bank’s team performance as satisfactory based on a sample of 27 contracts.
• During the implementation phase, the Bank’s safeguard team worked closely with the IEs for the effective safeguard implementation. The Bank’s safeguard team conducted trainings for the IAs’ safeguard personnel and also carried out extensive field visits during the implementation supervision missions. Guidance was also provided for effective field monitoring, comprehensive documentation, preparation of QPRs, and conducting third party validations.
• While initial orientation on social safeguards was delayed from the Bank’s side, regular support was provided during the subsequent stages. The Bank’s safeguard team conducted trainings for the IAs’ safeguard personnel and also carried out extensive field visits during the implementation supervision missions. Guidance was also provided for effective field monitoring, comprehensive documentation, preparation of QPRs, and conducting third party validations.
• The Bank also provided clear guidance on development of Standard Operating Procedures for compensation payments and organized workshops to create consensus and build awareness. However, the DISCOs were not able to reform their compensation assessment process and continue to implement the earlier procedures.
• Improvements were made on Bank’s advice in asset management especially in depreciation rates and charging of overheads to capital work in progress. This benefitted the IEs in financial terms as these costs are included by NEPRA in calculating the distribution margin.
24

Implementation support missions identified almost similar issues and raised those with the government as well for appropriate remedial action. Though IPR report of the Project has rated Bank performance during implementation as satisfactory the Bank did not take a stronger stance against mishandling of procurement, delay in finalizing the bidding documents, and repeated reneging of the remedial actions. Due to poor performance project restricting was inevitable but was done too late as a result underlying issues were not addressed in a timely manner. Consequently, the project performance did not improve and the Bank decided to close the project because of its unsatisfactory status despite several requests for extension from the IEs. Also, EDTIP experience compares very unfavorably with ADB that committed around US$ 800 million under the distribution multi-tranche financing facility (MFF) and the Bank could not commit US$ 250 million even with more time. One reason why Bank experience is not as good as ADB is because ADB had monitoring consultants for each DISCO, reporting to ADB – and also to the DISCOs – in place, with financing while the Bank did not and therefore its supervision was weak and inadequate. (c) Justification of Rating for Overall Bank Performance Rating: Unsatisfactory Given Unsatisfactory rating both for quality at entry and supervision, the overall Bank performance is also rated as Unsatisfactory.
5.2 Borrower Performance (a) Government Performance Rating: Unsatisfactory Although the government’s commitment to the PDO was high its support to continue with the reforms during implementation phase remained low. Despite the early successes with respect to the restructuring of the sector and establishment of a regulatory framework and attracting substantial private sector investment, efforts to improve the overall supply efficiency and commercialization of the WAPDA successor companies, GENCOs and DISCOs in particular, remained lethargic. The development of the competitive wholesale electricity market (an indicative trigger for APL2) still has a long way to go. Electricity supply has not kept up with demand and from a generation capacity surplus situation in 2002 shortages started to emerge by 2005 during peak periods and during the winter, when hydro generating capacity was low. By 2012, the supply demand gap in the NTDC power system reached a maximum of 6,000MW. The cost of generation increased rapidly because of the increasing proportion of thermal generation in the system combined with external factors such as increases in international fuel prices, a weakening of the Pakistan Rupee and decrease in domestic natural gas available to the power sector. Tariff revisions did not keep up with the rapidly increasing cost, leading to inadequate revenue for timely payments to IPPs and fuel suppliers (also referred as inter-corporate arrears or circular debt) and subsidy bill also increased constraining federal budget. The DISCOs never became creditworthy and private investment in the power sector started to dry up. All of the above factors contributed to the deep and enduring crisis the power sector in Pakistan is facing today. Based on preliminary estimates, the poorly performing electricity sector is thought to have reduced GDP growth by two percent a year for the past several years.
25

The problems and potential solutions to the recovery of the Pakistan energy sector are well understood but until recently the political will to undertake deep structural reforms has been wanting. Government is now trying to address these challenges by accelerating the power sector reforms19, albeit too late to save the project. Therefore, government performance in support of the project is rated as Unsatisfactory. (b) Implementing Agency or Agencies Performance Rating: Unsatisfactory Despite being largely in compliance with fiduciary and safeguard requirements (as shown in paras below) considering significant delays in project implementation and resolution of implementation issues which were in control of the DISCOs reflect poorly on their commitment to achieve development objectives. Though some IEs have performed better than the others even their performance is not up to the mark and therefore their collective performance is rated as ‘Unsatisfactory’. As explained in the sections above most of the delays are not directly attributable to IEs performance but deficiencies in capacity to monitor and address operational bottlenecks were major contributors to the unsatisfactory outcome of the project. Environmental Safeguards. The IEs established safeguard units within their respective organizations and engaged environmental and social safeguard specialists within these units. Environmental aspects were incorporated in the construction contracts and ESA/ESMP compliance was made a contractual obligation for the contractors. The safeguard units carried out regular field monitoring and on-going trainings for the IA personnel as well as for the consultants and contractors. They also produced quarterly progress reports on a regular basis. However, the ESA/ESMP compliance remained patchy and inconsistent primarily due to inadequate awareness of environmental safeguards at the management level within the IAs and also because of lack of experience at the consultant and contractor level. The entities also conducted third party validations but most of these assessments were ineffective and inconsequential. Social Assessment. At the start of the Project, there was no institutional mechanism in the DISCOs to implement social issues. Each entity created Environment and Social Implementation Cells which played a key role in raising awareness on social issues. They also played a key role in creating awareness at the field implementation level (among contractors). Each DISCO also hired a Third Party Monitoring Agent that provided feedback on implementation of social safeguards on the ground. Third Party Monitoring Reports indicated slow but gradually improving standards of compliance on social safeguards. An example was the regular maintenance of systems for complaint redressal at each site. The ESICs also gradually built a presence to perform several other key functions such as the maintenance of database on compensation payments. However, the Project continued its existing system of using the land revenue officers (Patwari) and
19 Early actions by the government have included settling PKR 4.8 billion circular debt in June 2013, adopting a National Power Policy in July 2013, and increasing tariffs by 32% in August and October 2013.
26

concerned SDO as the assessors of compensation payments for Transmission Line work. The ESIC was not part of this process and could not play a role in prompt assessment, public consultations and outreach on the assessment process and replying effectively to public grievances in this regard. This impacted on the efficacy of ESIC. Financial Management: The IEs remained compliant with the financial covenants albeit with some delay in submission of audited financial statements. NTDC submitted its audited financial statements for FY2012 and FY2013 after the due dates for which Bank had to invoke remedial measures. Procurement: As per the Independent Procurement Review conducted by the Bank through M/s Ernst and Young, which is based on a sample of 27 contracts, the compliance by IEs with Bank’s Guidelines and procedures was only 26%. (c) Justification of Rating for Overall Borrower Performance Rating: Unsatisfactory Performance of both the Government and the IEs is rated as unsatisfactory.
6. Lessons Learned (both project-specific and of wide general application) Mixing Reforms and Investments The project was designed as an APL that coupled investment and reforms. An important lesson relearned through this operation is that it is better not to load investment project with policy reforms. It is better to do an investment project and then complement it with broader sector reforms and governance reforms of the utility. Project Design. Design of the project should be flexible so that during implementation the Bank can agree as much change as possible with the implementing entity without requiring administrative approvals and formal amendments to the project legal agreements. This would make project restructuring e.g. dropping sub-projects and picking up others, shifting funds from one entity to another and from one category to another easy and simple for effective implementation. This flexibility would also allow to create competition among IEs by comparing their performance and success can be reinforced by routing more financing to the entities that are performing comparatively better than the others. The implementation delays could have been avoided if the key issues were identified and addressed during the design stage through either lending or non-lending technical assistance. For example, preparation of technical specifications should have been done at the design stage so that by the time the project is approved it is ready for implementation at least for the first year. At the design stage, careful consideration must be given to relationship between the articulation of the PDO and the information needed to be able to measure progress against that PDO. There are two distinct but related lessons that can be drawn:
27
• First is the importance of linking the PDO to indicators that are available to the project. The PDO for EDTIP was generic, overambitious and mixed investment and reforms. Comprehensive measurement of such a complex and wide ranging PDO would have required a broad range of indicators. The utilities, which were poorly performing, did not have access to reliable information with which to measure those parts of the PDO which they could influence. For those parts of the PDO over which they had no influence they did not have either the means or incentive to collect data. The lesson is that indicators should be limited to those that can be measured reliably based on existing information or that which can be reliably developed as a result of improvements in data collection that result from the project.
• Second, where it is clear that measurement of the PDO cannot be supported by the data available from the implementing agencies, and are unlikely to become available during the project, early action is needed. In the case of EDTIP, one option could have been to restructure the PDO to something simpler and which could have been reliably measured with the data available from the implementing entities. A second option could have been to provide funds to support improved data collection efforts (for example through the development of SCADA systems). It would probably not have been feasible to add implementing entities or other means by which both actions and measurement of their effects relevant to the reform aspects of the project, and hence this option should have been dropped.
Implementation. When new utilities are created after unbundling, they face the challenge to re-align their structures and processes to function as corporate entities. This is a huge change management exercise and most utilities require hand-holding support. In this case, therefore, it may have been better to start at a smaller scale with only one or two utilities (NTDC and one DISCO) instead of five, help them develop a Business Plan to identify priorities and provide them with Capacity Building and Institutional Strengthening support during the project preparation period. This experience in parallel to consultation workshops involving utility officials would have helped develop a robust project design and the project could have been expanded with additional financing.
Use of Consultants/Owner’s Engineer. In utilities facing governance problems, the use of consultants in all phases of the processes for implementation of investments in electricity infrastructure (preparation of technical specifications and bidding documents, participation in the evaluation of proposals, supervision of execution of works, etc.) should be mandatory. The consultants would constitute a small portion of the total budget and can serve a dual purpose. On the one hand, consultants will assist the client to properly carry out operations in all stages. On the other hand, will be the “eyes and ears” of the Bank’s project teams to monitor that the rules for procurement and supervision are actually applied and enforced. Timely preparation of ESAs strictly in accordance with the Bank’s requirements was the key towards achieving the overall safeguard compliance for the EDTIP. On the other hand, the Bank’s safeguard team did not consistently carry out follow-up of the actions
28

agreed during the ISMs. Use of consultants as mentioned in above point could have helped resolve these issues and to build the capacity of the IEs and their safeguards personnel.
Utility Management. It is unrealistic to design and implement a project that requires change in governance with an existing management team. Therefore, change in management should be a component of the project and if the management is not in favor of the needed reforms there are two options – either drop that utility (meaning Bank should have been tougher during implementation) or ring fence actions to fund capacity building in a systemic way. Adequate staffing and effective internal audit are critical for good financial management. Other Project Specific Lessons Learned A very similar project of Asian Development Bank (ADB), US$ 800 million multi-tranche power distribution enhancement investment program, is one of the better performers in its portfolio and has also performed better than the EDTIP. Comparing Bank experience with other financiers could help improve future operations not only in the electricity sector but in other sectors as well. Similarly, close donor coordination would also help address common issues faced during implementation. For example, the issue of On Load Tap Changer (OLTC) in particular also affected few other DISCOs/contracts not financed by the Bank. Also related to the issue of OLTC, the matter of equivalence of technical characteristics for OLTC created an ambiguity which was used by local manufacturers to effectively keep at bay competition from other manufacturers of main equipment from outside the country. A clear stance by the Bank not to use a ‘brand name or equivalent’ in the bidding documents particularly if standards to define technical characteristics were available could have avoided this controversy and delays. In case of ELR sub projects on the 11kV distribution side, pilferage prevention measures have shown to be more cost effective than technical energy loss reduction measures particularly if installation of capacitors is exhausted and high loss area is targeted. For example, the ABC sub project in HESCO, though the most costly pilferage prevention measure, has an average cost of US$ 0.141 invested per kWh saved annually recurring. The overall technical energy loss reduction measures in MEPCO cost US$ 1.233 invested per kWh saved annually recurring. For a comprehensive electricity distribution project pilferage reduction measures should therefore be given due consideration while deciding on allocation of resource. The key lesson learned was to link critical institutional reform on social and environmental safeguards with the Project’s progress. Institutional reform on social safeguards, particularly on compensation payments, remains critical to the DISCOs functioning as modern, efficient entities embodying good practices on social issues. There needs to be a greater upfront assessment of appetite for reform and a systematic system to implement and monitor them.
29

7. Comments on Issues Raised by Borrower/Implementing Agencies/Partners (a) Borrower/implementing agencies Except for NTDC all companies submitted their project completion reports. NTDC could not do so because it had only one project which is not complete. The ICR report is based on the data and information provided by the IEs and as such their issues and suggestions are reflected in this report. The summary of borrower ICR is given in Annex 7. (b) Co-financiers Not applicable (c) Other partners and stakeholders (e.g. NGOs/private sector/civil society) Not applicable
30

Annex 1. Project Costs and Financing
(a) Project Cost by Component (in USD Million equivalent except where indicated)
Appraisal Revised Secondary Transmission Grid 26.31 12.61 Energy Loss Reduction 25.00 13.85 HESCO – Subtotal 51.31 40.07 26.46 52% 66% Secondary Transmission Grid 40.48 38.20 Energy Loss Reduction 22.09 5.64 IESCO – Subtotal 62.57 50.59 43.84 70% 87% Secondary Transmission Grid 72.35 60.01 13.64 Energy Loss Reduction - - - LESCO – Subtotal 72.35 60.01 13.64 19% 23% Secondary Transmission Grid 52.15 30.25 Energy Loss Reduction 15.00 19.25 MEPCO – Subtotal 67.15 63.21 49.50 74% 78%
253.38 213.88 133.45 53% 62% 24.40 24.40 20.12 82% 82% 16.59 6.85 5.46 33% 80%
HESCO 0.65 IESCO 0.69 LESCO 0.84 MEPCO 1.06
PEPCO/MOWP/NTDC 2.21 15.00 - - 0% #DIV/0! 309.37 245.13 159.03 51% 65% 0.49 0.64 0.64 309.86 245.77 159.67 52% 65%Total Financing Required
B) NTDC – Transmission Network
Front End Fee
Percentage of
A) Strengthening Distribution Network
Project component AppraisalFormally Revised*
Latest Estimate**
D) Energy Efficiency Total Project Cost
C) Technical Assistance
* About US$ 62 million were cancelled in Jun 2012 and another US$ 2 million were cancelled in Feb 2014. ** Estimated expenditures incurred up to February 2014, reimbursable within 4 month grace period.
(b) Financing (in USD Million equivalent except where indicated)
Appraisal RevisedBorrower:
HESCO 11.39 11.39 3.33 IESCO 8.24 8.24 3.73 LESCO 14.70 14.70 1.92 MEPCO 12.96 12.96 8.00 NTDC 4.90 4.90 2.00 MOWP/PEPCO 0.97 0.97 -
Total Borrower 53.16 53.16 18.98 36% 36%IBRD 173.60 135.41 88.30 51% 65%IDA 83.10 57.20 52.30 63% 91%Total Loan 256.70 192.61 140.60
309.86 245.77 159.59 52% 65%Total Project Cost
Formally Revised*
Percentage ofSource of Funds Appraisal
Latest Estimate**
31

Annex 2. Outputs by Component The project funded Secondary Transmission and Grid (STG) system expansion and Energy Loss Reduction (ELR) program in four20 of the nine public sector distribution companies, one grid station and associated transmission line of National Transmission and Dispatch Company (NTDC) and provided technical assistance to the four DISCOs, NTDC and MOWP. There was also a component on Energy Efficiency but it was dropped in 2012 restructuring. The outputs and outcomes for each component are discussed below: Component A – Strengthening Distribution Network
As shown in Table 2.1, 75 sub-projects under this component were completed by the Project Closing Date (PCD). This represents 66% of the total number of sub-projects and 82% of the awarded. 23 number of sub projects valuing about US$ 32 million were not awarded and another 16 sub-projects again valuing US$ 32 million could not be completed by the PCD. It is estimated that expenditures of about US$ 15 million associated with these on-going subprojects went beyond the PCD and will be funded by IEs themselves21. In terms of value, DISCOs were able to complete about 61% of the subprojects that were awarded.
Table 2.1: Sub-projects completed under Component A
Total Projects
Awarded No. of Sub-projects
completed/Total
Completed as % of total
Completed as % of
Awarded HESCO 13 13 11 85 85 IESCO 31 31 25 81 81 LESCO 31 10 8 26 80 MEPCO 39 37 31 79 84 TOTAL 114 91 75 66 82
Secondary Transmission and Grid (STG): Number of grid Stations (new, augmentation, conversion and extensions) completed under the project is 53 out of 59 (awarded). Details are given in Table 2.2. All the augmentations, conversions and extensions barring couple with litigation issues have been completed and commissioned. There are few new grid stations that were under construction at the time of project closing and are likely to be
20 (1) Hyderabad Electric Supply Company–HESCO, (2) Islamabad Electric Supply Company–IESCO, (3) Lahore Electric Supply Company–LESCO & (4) Multan Electric Power Company. In 2012, HESCO was bifurcated into two separate distribution companies to form new Sukkur Electric Power Company (SEPCO).
21 All IEs were informed that the Bank will only finance the work completed, goods delivered or services rendered up to the PCD. Expenditures incurred after the PCD will be financed from IEs own resources.
32

completed by September 2014. These are Bahter More and Gangal in IESCO, Saggian and Mominpura in LESCO and DG Khan in MEPCO. In addition, there were four high value STG contracts that despite being at final stage of award when the project was restructured in June 2012 could not be awarded – these include two new grid stations (Askari X and Punjab University) and 40MVA power transformers in LESCO that were not awarded because of pending LESCO Board approval and were later scrapped by the LESCO Board and 200kVA distribution transformers contract in MEPCO that could not be awarded because of the stay order by the High Court.
Table 2.2: Outputs by Entity as of Project Closing Date Description Planned
(number) Awarded Completed Physical Progress (%) and
Expected/Actual Completion Date (ECD)
HESCO 13 All 11 85% sub-projects completed Grid Stations New Augmentation Conversion About 100km of associated transmission line
4 3 4
“ 3 3 4
Buxapur, 94%, Sep 2014 Kandiari Grid, 2 km of transmission line remaining
Transmission line (17 km) 1 “ 1 100% completed ELR - ABC (No. of job orders) 1 (1707) “ 0 (1282) 75% job orders completed IESCO 31 All 25 81% sub-projects completed Grid Stations New Augmentation Extension Conversion
4 2 5 7
“ 2 2 5 7
Remaining new grid stations: Gangal 80%, Jun 2014 Bahter Mor 45%, Sep 2014
Transmission lines (km) 12 (221) “ 8 (151) 4 lines are left. ECD: Sep 2014. ELR Meters, no. Capacitors, locations LV/HV, proposals
1 (50,500)
(40) (528/30)
“ 1 (50,500)
(40) (528/30)
100% completed
LESCO 31 10 8 80% sub-projects completed Grid Stations New Augmentation Extension
6 24 1
4 5 1
2 5 1
Saggian: 60%, Mominpura: 85% 21 sub-projects (2 grids & power transformers) were not awarded.
MEPCO 39 37 31 84% sub-projects completed Grid Stations: New Augmentation Extension Conversion
6 4 8 3
6 4 7 3
5 4 7 3
DG Khan, 90%, Jun 2014 One extension was not required
Transmission Lines 13 (182 km)
13 12 (160 km)
Remaining 1 line is 95% complete - delayed because of the court case.
ELR: HT LT
5 (50)
(665)
4 (50) (665)
0 (20) (124)
Physical progress is about 50%. ECD: Oct 2014. One sub-project could not be awarded because of the court case.
33

Electricity Loss Reduction (ELR): Supply and installation of Aerial Bundled Conductors (ABC) in HESCO could not be completed. The contract was awarded in June 2012 but pace of work remained slower than planned. This was because of the difficult work environment and during the initial period of implementation lot of time was spent on building consumer awareness regarding this project. As of PCD, 1282 job orders out of a total of 1707 were completed and the overall physical progress is estimated to be 60%. IESCO has completed the ELR component. MEPCO has procured all the material funded under the project and implementation is being done by MEPCO and is expected to be completed by October 2014. LESCO did not have any ELR component under this project.
Outcomes: The two key indicators to measure the outcome of the Component A were: (i) amount of electricity handled by the network, (ii) level of T&D losses (technical and non-technical) and (iii) non-collection.
(i) Amount of electricity handled by the network remained less than anticipated due to supply shortfall. Therefore, even the targets revised downwards in 2012 could not be achieved with an extended time frame. As shown in Table 2.3, the amount of electricity handled was expected to grow at the rate of 5.9% originally (FY12 Target), was revised down to yield 2.2% growth (FY13 Target) and was able to achieve only 1.1% growth (FY13 Actual). This is because the generation during FY07 to FY12 practically remained stagnant around 95 tera-watt-hours (TWh) and it is extremely difficult to improve distribution reliability without having adequate generation capacity. Number of consumers in the four DISCOs, however, grew at 4.5% from 9.4 million in FY07 to 12.2 million in FY13 and this indicator exceeded the target. The data provided indicates that there has been no improvement in reliability and quality of supply, mainly on account of being over taken by 6-8 hours of service interruption due to load-shedding in a day in peak summer and winter seasons. Increase in number of consumers and allowing load growth of existing consumers without corresponding increase in generation mainly contributed to increase in load shedding duration. Figure 2.1 shows that while demand has continued to grow and there is some addition in the installed generation capacity, the production has remained almost at the same level for the past several years.
Table 2.3: Amount of electricity handled (Actual Vs. Target), GWh and % (ACGR)
FY07 FY13 FY12 FY137,681 9,356 9,807 9,683
3.3% 5.0% 3.9%8,045 8,561 11,640 8,784
1.0% 7.7% 1.5%15,999 16,458 22,153 18,126
0.5% 6.7% 2.1%11,767 11,951 14,398 12,830
0.3% 4.1% 1.5%43,492 46,326 57,998 49,423
1.1% 5.9% 2.2%TOTAL
Actual Targets
HESCO
IESCO
LESCO
MEPCO
34

Figure 2.1: Demand has risen faster than Capacity
Note: Computations based on Pakistan Energy Yearbooks and NEPRA State of Industry Reports.
(ii) T&D losses show a declining trend and the entity-wise performance is mix as only IESCO and MEPCO were able to achieve the revised target losses. While, HESCO and LESCO have failed to meet the loss targets revised upwards in June 2012. Within the overall losses the ST or 132kV systems losses have generally shown improvement in most of the DISCOs due to capacity expansion under EDTIP, whereas the losses on 11kV side have either increased or reduced only marginally.
(iii) At the time of appraisal, DISCOs had very good collection rate22 – 98/99% in IESCO, LESCO and MEPCO and 86% in HESCO. The investments in STG and ELR were not directly related to improvement in collection particularly when there is no evidence that while selecting the ST expansion or 11kV ELR project any emphasis was given to the revenue losses. For example a new grid station (STG) in an area where collection is better will improve the average collection rate. Despite the missing link the project assumed that the collection ratio in HESCO will improve to 90% and for others it will remain close to 99%. On the contrary the collection ratios show a declining trend, which is steeper in case of HESCO. The decline in collection can primarily be attributed to administrative issues but the situation was exacerbated due to increase in cost, change in consumer mix, law and order, etc. The indicator relating to collection in a way could be linked to Component C (capacity building) and/or dropped Component D that involved smart metering. For example, capacity building could have included imparting training skills, providing equipment/transport facilities to disconnection/reconnection personnel and introducing better commercial accountability systems. Remote monitoring
22 Revenue collected as a percentage of revenue billed during the year.
35

and disconnection facility by means of installation of smart meters would have been even more effective in improving revenue collection.
In summary, the objectives of Component A have not been met fully even though some of the issues were not in direct control of the DISCOs’ management.
Component B – Transmission Network
This component involved construction of a new 220kV grid station at Kassowal and associated transmission lines to reduce the loading at Yousufwala and Vehari grid station and remove the bottleneck to supply power to MEPCO. Two separate contracts for transmission and grid station were awarded - transmission line is complete and physical progress of grid station is about 79%. The grid station component has passed the scheduled completion date by about 20 months and is now expected to be completed by December 2014. Portion of the expenditure going beyond the PCD to be met by NTDC is estimated to be about US$ 6 million. At completion, the component is expected to achieve its output in terms of reduced loading and providing capacity for load growth at adjacent grid stations of Vehari and Yousufwala where growth is still restricted due to overloading as at the time of appraisal.
Component C – Technical Assistance - TA
The objective of the TA component was to strengthen the capacity of the IEs through procurement of expertise, IT solutions, and specialized studies. The TA component was mainly used by the DISCOs for training purposes and therefore as part of 2012 restructuring a large portion of the TA component (US$ 4 million) unlikely to be utilized was reallocated to the MOWP TA, to support some urgent priorities, including the preparation of programs for power trade with neighboring countries. The scope of TA component, however, remained limited to hiring of few individuals to analyze tariffs and subsidies and provided general support/advice to the MOWP and therefore additional US$ 2 million were cancelled from the MOWP TA component in 2014 to be reallocated to the Pakistan program.
Besides hiring of individual and trainings the TA component was used to hire an international procurement advisor (IPA). This was to address the weaknesses highlighted in the procurement system identified during appraisal. The hiring of the IPA was delayed and the DISCOs have yet to adopt the procurement manual prepared by the IPA. In addition, some portion of the TA component was used to carry out pilot studies by Alternative Energy Development Board. The TA component should have been utilized during the initial phase of the project to overcome the issues and build the capacity so that the project could be implemented effectively and efficiently. On the contrary, trainings and other activities were carried out towards the end of the project and therefore
36

these activities also failed to derive the expected benefits of supporting the implementation of the Project. This component, therefore, has made very little contribution and only a small fraction of what was envisaged at the time of appraisal was achieved.
Other development partners, particularly USAID, are supporting the DISCOs in the areas indicated in the appraisal document e.g. corporate governance, financial management, inventory and asset management, demand management, corporate planning etc.
37

Annex 3. Economic and Financial Analysis (including assumptions in the analysis) The main benefits of the project are to be derived from the increase in sales due to enhanced transformation and transmission capacity and lower power purchases due to reduction in losses. Other benefits include improvement in the quality of supply e.g. reduction in breakdowns and outages, improved voltage profile, and loading but these could not be quantified because of absence of adequate and reliable data. For comparison, the results of economic and financial analysis, at appraisal, are presented in Table 3.1. Table 3.1: Financial and Economic Rate of Return at Appraisal (in percentages)
FRR at Appraisal ERR at Appraisal HESCO 18.79 45.08 IESCO 13.67 21.70 LESCO 24.11 36.94 MEPCO 26.42 17.24 NTDC 27.77 32.92
Financial Analysis/Return
The distribution margin (DM) determined by NEPRA allows the return on net assets equal to DISCO’s weighted average cost of capital23. The financial return of the project of 17% (on-lending rate in rupee terms) is thus assured provided DISCOs meet the target for collection and system losses. Regardless of their low collection rates DISCOs retain their DM in full while payments to NTDC/CPPA for the power procured are either not made or gets delayed. Over the last five years the trade debts have increased by manifolds even in good DISCOs like IESCO24 and their current ratios are also less than 1 making these companies financial unviable without the government support. While impact of non-collection does not appear directly in the income statements, DISCOs also accrue losses if they fail to meet NEPRA target for system losses. NEPRA has progressively reduced these targets overtime and most DISCOs are unable to meet these targets by wide margin and therefore DISCOs are unable to recover the actual costs and as shown in Table 3.2 are in perpetual loss. The results are erratic because DISCOs use cash system
23 The DM, determined by NEPRA for company as a whole, covers O&M cost, depreciation and provide a rate of return which is equal to the weighted average cost of capital. Similarly, project specific distribution margin will cover its O&M cost, depreciation and a rate of return equal to 17% which was the on-lending rate for the IEs for this loan and therefore project specific DM could be significantly different from the average. The DM for new investment would be higher compared to average which included fully depreciated assets.
24 Accounts payable turnover for IESCO has increased from 100 days in FY08 to more than 200 days in FY13. The performance of other three DISCOs is expected to be even worse.
38

of accounting and timing of notification of distribution tariffs could vary these margins significantly e.g. regulated losses in one accounting cycle are recovered during the next cycle and vice versa. The ELR component would tend to reduce these losses as the benefits from ELR arise out of reduced number of units to be purchased and consequent reduction in power purchase cost for meeting the same demand will increase the financial benefits or reduce the losses by reducing the implied penalty of not meeting the NEPRA target. The EDTIP was missing a comprehensive revenue protection program while the legal covenants to ensure financial viability of the entities were either not met or were met with significant delay. As a result the financial performance has deteriorated and sector needs broad reform measures for sustainable investment in transmission and distribution companies. Table 3.2: Earnings Before Taxes – Profit/(Loss), PKR million 2008 2009 2010 2011 2012 2013 HESCO (7,213) 2,273 (4,097) (9,789) (27,832) (17,960) IESCO (4,454) 2,057 4,854 531 (13,641) 9,030 LESCO (11,020) (151) 6,490 1,595 (27,174) 22,648 MEPCO (11,913) (3,301) (5,732) (9,052) (24,526) 11,239
Assumptions for Economic Analysis
The analysis is based on the actual/latest estimates provided by the IEs in respect of works completed or expected to be completed using IEs own resources. For few variables where actual data was not available PAD assumptions have been retained. The major assumptions are described below:
i. In the absence of actual data for taxes, duties and transfer payments capital costs were converted to economic values using the percentages derived from capital and economic costs estimated at appraisal. Entity-wise percentage of taxes, duties and transfer payments to estimate economic cost are: HESCO 23%, IESCO 8%, LESCO 11% and MEPCO 14%.
ii. The PAD estimated O&M costs as percentage of capital cost ranging from 2% to 4%. Same percentages were applied for the ex-post analysis, as these percentages are close to current averages.
iii. Valuing reduction in losses: The reduction in losses will displace the marginal fuel cost which is assumed to be Furnace Oil (FO) based generation being most expensive and last in the dispatch merit order. The average energy charge for FO based thermal generation in NEPRA tariff determination for FY14 is PKR 18.25/kWh and is taken to measure the economic benefits of energy saved through ELR sub-component. The benefits of ELR (in terms of annual units saved) would increase annually due to load growth; however this aspect has not been included for a conservative estimate.
39

iv. Valuing incremental sales: The PAD conservatively assumed average DM
ranging from Re 1 – 1.50/kWh as the proxy for the economic value of distribution services including the increase in sales. The same methodology is used for the ICR. However, consumer surplus is a relevant measure of benefits for non-grid electricity alternatives and a sensitivity analysis is done using the difference between willingness-to-pay and cost of supply as an estimate for consumer surplus:
a. Based on the WTP survey of 142 consumers in six districts in Punjab (2011) and updated in 2014 for Dasu Hydropower Project Stage 1 appraisal the weighted average WTP is estimated to be PKR 32.9/kWh. For a conservative estimate it is assumed that the grid electricity can be supplied through most expensive FO based thermal generation adjusted for 20% Transmission & Distribution losses, 10% non-collection and PKR 1.1/kwh DM. Based on this the consumer surplus is estimated to be PKR 6.3 (WTP: PKR 32.9 minus Cost of Supply: PKR 26.6).
v. Costs and benefits are projected over a 30 year period from 2009 to 2038. vi. A discount rate of 10% is used to calculate the net present value, same as in the
PAD. vii. Measuring Project Benefits. The project comprises of two distinct and separate
activities: (i) Provision of enhanced transformation capacity 132/11 kV at the Sub transmission (ST) Level along with any associated ELR benefit due to 132kV Transmission network and (ii) Energy Loss reduction at 11/0.4 kV Distribution level, downstream of 132 kV. The project appraisal and other documents did not provide adequate details regarding how the energy saved through ELR component and incremental sales derived from the STG component were estimated. However, for the ICR the methodology to calculate the benefits in terms of additional sales and units saved is explained below:
a. Capacity enhancement at 132 kV is targeted to provide additional capacity where existing capacity has been saturated and further load growth of existing consumers or access to new consumers cannot be technically accommodated. The main benefit of such projects is increase in sale revenue by regaining denied load growth and consumer addition. It is measured in terms of the additional units sold on account of Load growth now made possible by the additional capacity created through the project. In case of new grid stations it is assumed that 40% of the newly installed capacity will be taken over from the nearby overloaded grid stations and with a 7% Load growth, 7% of 40%= 2.8% of capacity utilization will result in the additional annual sales to the extent of additional capacity utilization made possible through the new capacity added.25
Similarly in case of enhancement of capacity of an existing Grid
25 Additional sales for a 20 MVA new Transformer capacity addition = 20*0.9*0.4*8760*0.6/1000 =37.84Million kWh, where 0.9 is the factor to convert MVA to MW, 0.4 is portion of capacity utilized in the first year after installation, 8760 is the number of hours in a year and 0.6 is the Load factor to obtain the units sold in the year out of 8760.
40

station, if the capacity is enhanced by 100%, which is generally the case, the enhanced capacity Transformer will be already loaded to 50% on installation and with a 7% Load growth, 7% of 50%= 3.5% of capacity utilization will result in the additional annual sales to the extent of additional capacity utilization made possible through the new capacity added. Data of actual year wise MVA capacity addition was obtained from the DISCOs. Moreover, new Grid stations can provide associated ELR benefits due to reduced length of transmission lines and reduced loading on existing transmission lines. Data regarding annual kWh loss reduction in units, calculated on the basis of applying standard ELR estimation methodology, was provided by DISCOs.
b. ELR Distribution subprojects are targeted to reduce technical losses in distribution lines at 11kv and 0.4 kV. The number of such completed sub-projects is large (603 in IESCO and 91 in MEPCO). Therefore, where data was available, kWh loss reduction in units, calculated on the basis of applying standard ELR estimation methodology, was provided by DISCOs. Where work wise detailed data was not available or too large to collect and compile, sample data of a few works was obtained. The average energy loss reduced per sub project was estimated and was applied to total works completed in that category in order to obtain total unit reduction on annual basis. Such ELR works also included other categories of ELR measures such as installation of capacitors or replacement of old/ defective meters with new digital meters. The annual units saved from all the sub-projects were combined to provide the annual units saved on account of ELR. In the case of HESCO, ELR sub projects were targeted to reduce only Pilferage Loss, by installing Aerial Bundled conductor and service cables (ABC) in selected areas where direct hooking to low voltage lines for pilferage was taking place. The ELR ABC project in HESCO also included installation of new digital meters and associated equipment required to replace defective meters of existing consumers or provide meters to consumers who were not being metered earlier. The cost of the project was therefore taken in totality as ABC along with associated equipment and meters. For calculating benefits from ABC, the difference between units sold in the project area, for a certain period after completion of the project was compared to the units sold for a similar period prior to the initiation of the project .The difference was considered as the reduction in energy Loss or units saved on account of the project. This assessment does not include the increase in sales due to genuine consumption replacing pilferage, and therefore provides a rather conservative estimate of units saved. Another benefit of the ABC project is reduced Load on Distribution transformers (DT), as a consequence of the project, resulting in lesser damage/ burn out of DTs. This benefit has been calculated on actual basis as cost of number of DTs saved from damage due to lower loading. It is assumed that without the project, damage to a certain percentage of
41
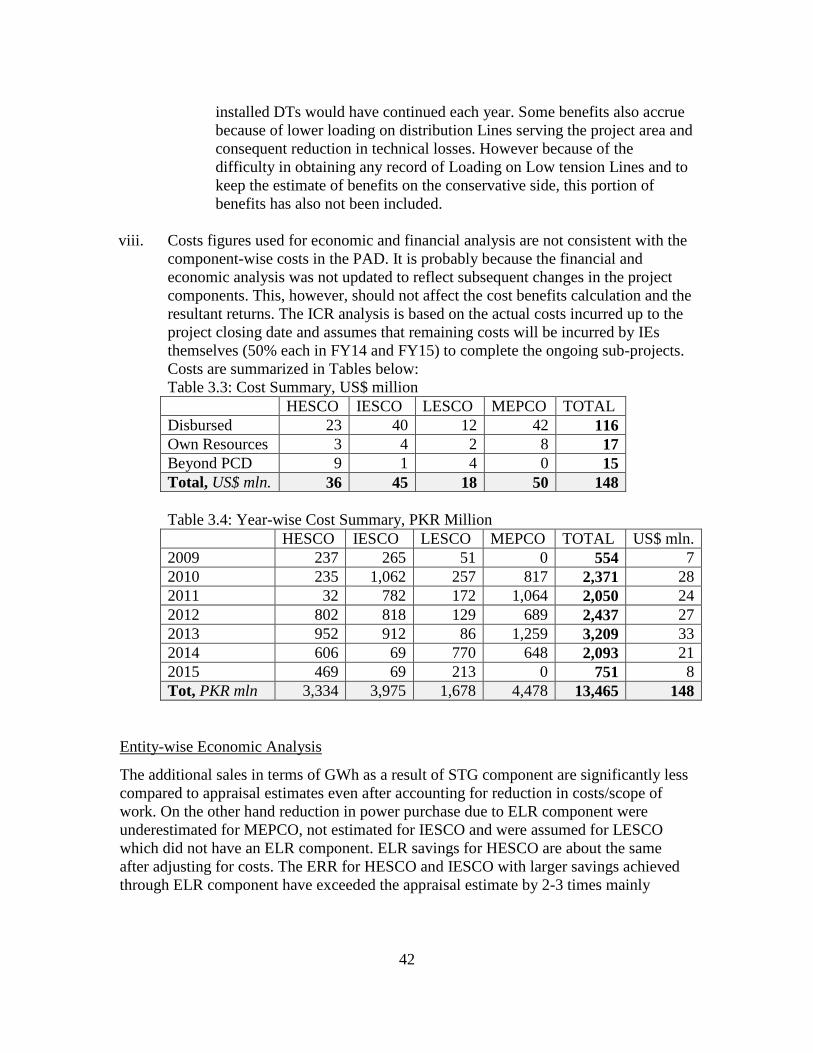
installed DTs would have continued each year. Some benefits also accrue because of lower loading on distribution Lines serving the project area and consequent reduction in technical losses. However because of the difficulty in obtaining any record of Loading on Low tension Lines and to keep the estimate of benefits on the conservative side, this portion of benefits has also not been included.
viii. Costs figures used for economic and financial analysis are not consistent with the
component-wise costs in the PAD. It is probably because the financial and economic analysis was not updated to reflect subsequent changes in the project components. This, however, should not affect the cost benefits calculation and the resultant returns. The ICR analysis is based on the actual costs incurred up to the project closing date and assumes that remaining costs will be incurred by IEs themselves (50% each in FY14 and FY15) to complete the ongoing sub-projects. Costs are summarized in Tables below: Table 3.3: Cost Summary, US$ million HESCO IESCO LESCO MEPCO TOTAL Disbursed 23 40 12 42 116 Own Resources 3 4 2 8 17 Beyond PCD 9 1 4 0 15 Total, US$ mln. 36 45 18 50 148 Table 3.4: Year-wise Cost Summary, PKR Million HESCO IESCO LESCO MEPCO TOTAL US$ mln. 2009 237 265 51 0 554 7 2010 235 1,062 257 817 2,371 28 2011 32 782 172 1,064 2,050 24 2012 802 818 129 689 2,437 27 2013 952 912 86 1,259 3,209 33 2014 606 69 770 648 2,093 21 2015 469 69 213 0 751 8 Tot, PKR mln 3,334 3,975 1,678 4,478 13,465 148
Entity-wise Economic Analysis
The additional sales in terms of GWh as a result of STG component are significantly less compared to appraisal estimates even after accounting for reduction in costs/scope of work. On the other hand reduction in power purchase due to ELR component were underestimated for MEPCO, not estimated for IESCO and were assumed for LESCO which did not have an ELR component. ELR savings for HESCO are about the same after adjusting for costs. The ERR for HESCO and IESCO with larger savings achieved through ELR component have exceeded the appraisal estimate by 2-3 times mainly
42
because of more than three times increase in its value26. MEPCO also had a larger share of ELR component and its ERR is significantly above the hurdle rate but it couldn’t achieve the same level of savings as in IESCO and HESCO. LESCO that had an STG component only has very low ERR particularly when valued at the average distribution margin. The returns become significant when the additional sales are valued at consumer surplus. If the benefits of additional sales are valued using consumer surplus approach (see assumption ‘iv’ above) the ERR for LESCO increases from 4% to 29% and for MEPCO from 19% to 32%. HESCO has the highest return among all DISCOs because of its ELR component entirely targeted to pilferage reduction measures. As the share of STG increase the return would tend to reduce e.g. ERR for LESCO is only 4% with only STG component which is entirely a capacity enhancement project. The consolidated performance of all four DISCOs is summarized in Table 3.2 and entity-wise results are summarized in Table 3.3 to 3.6. The NTDC component had only one 220/132kV new Grid station that has not been completed and therefore precise economic analysis was not possible. The project was awarded in March 2010 and was to be completed by Aug 2012 and is now expected to be completed and commence operation by December 31, 2014 after a delay of more than 2 years. These delays are expected to substantially reduce the economic benefits of this component e.g. at appraisal a delay of 2 years after incurring full project cost reduced the ERR by one-third from 33% to 22%. The delays in project implementation (except in the case of NTDC) did not have a major impact on the ERR because both cost and benefit streams were delayed by the same time period. There were few instances in which line or the grid could not be energized because of some litigation or other issues after most of the costs were incurred but its impact on the overall returns was negligible. Cancellation or no award reduced the NPV and didn’t impact the ERR because neither the cost nor the benefits were accounted.
26 The purchase price assumed in FY14 tariff determinations by NEPRA for the four DISCOs ranges from PKR 11.09 to 11.67 which is more than three times the purchase price of PKR 2.85 to PKR 3.60 assumed in the PAD.
43

Table 3.5: Consolidated Economic Analysis for all 4 DISCOs
YearCapital Cost
O&M Cost
Total Cost
Incremental
SalesDistribution Margin
Benefits - STG
Units Saved
Marginal Fuel Cost
Benefits - ELR
Total Benefits
Net Benefits IRR
GWh PKR/kWh PKR Mln. GWh PKR/kWhPKR Mln.2009 473 16 489 6 1.10 7 0 18.25 0 7 -4812010 2,093 71 2,165 28 1.10 31 3 18.25 46 76 -2,0882011 1,815 117 1,932 50 1.10 55 26 18.25 478 533 -1,3992012 2,077 185 2,262 82 1.10 91 87 18.25 1,581 1,672 -5902013 2,731 273 3,004 137 1.10 150 184 18.25 3,363 3,513 5092014 1,815 331 2,146 192 1.10 211 291 18.25 5,309 5,520 3,374 -5%2015 0 355 355 236 1.10 260 368 18.25 6,711 6,971 6,616 22%2016 0 355 355 262 1.10 288 396 18.25 7,234 7,522 7,167 33%2017 0 355 355 280 1.10 308 396 18.25 7,234 7,542 7,187 39%2018 0 355 355 300 1.10 330 396 18.25 7,234 7,564 7,209 42%2019 0 355 355 321 1.10 353 396 18.25 7,234 7,587 7,232 44%2020 0 355 355 343 1.10 378 396 18.25 7,234 7,612 7,257 45%2021 0 355 355 367 1.10 404 396 18.25 7,234 7,638 7,283 46%2022 0 355 355 393 1.10 433 396 18.25 7,234 7,666 7,312 46%2023 0 355 355 421 1.10 463 396 18.25 7,234 7,697 7,342 47%2024 0 355 355 450 1.10 495 396 18.25 7,234 7,729 7,374 47%2025 0 355 355 482 1.10 530 396 18.25 7,234 7,764 7,409 47%2026 0 355 355 482 1.10 530 396 18.25 7,234 7,764 7,409 47%2027 0 355 355 482 1.10 530 396 18.25 7,234 7,764 7,409 47%2028 0 355 355 482 1.10 530 396 18.25 7,234 7,764 7,409 47%2029 0 355 355 482 1.10 530 396 18.25 7,234 7,764 7,409 47%2030 0 355 355 482 1.10 530 396 18.25 7,234 7,764 7,409 47%2031 0 355 355 482 1.10 530 396 18.25 7,234 7,764 7,409 47%2032 0 355 355 482 1.10 530 396 18.25 7,234 7,764 7,409 47%2033 0 355 355 482 1.10 530 396 18.25 7,234 7,764 7,409 47%2034 0 355 355 482 1.10 530 396 18.25 7,234 7,764 7,409 47%2035 0 355 355 482 1.10 530 396 18.25 7,234 7,764 7,409 47%2036 0 355 355 482 1.10 530 396 18.25 7,234 7,764 7,409 47%2037 0 355 355 482 1.10 530 396 18.25 7,234 7,764 7,409 47%2038 0 355 355 482 1.10 530 396 18.25 7,234 7,764 7,409 47%
TOTAL 11,005 9,510 20,515 11,675 183,868 195,542 175,027 NPV 7,663 2,443 10,106 2,416 42,981 45,398 35,291 B/C Ratio 4.49
PKR Mln
44

Table 3.6: HESCO Comparison of Economic Analysis
PAD Actual/Latest Estimate
As % of PAD
Total Project Cost, PKR Million 8,930 3,334 37%Total Economic Cost, PKR Million 6,842 2,194 32%Additional Sales per annum at full implementation, GWh 401 36 9%Reduction in Power Purchases per annum, GWh 448 186 41%ERR Using DM 45.1% 66% 1.5x
Using Consumer Surplus 76%NPV Using DM 9,586 16,202 1.7x
Using Consumer Surplus 17,212
Table 3.7: IESCO Comparison of Economic Analysis
PAD Actual/Latest Estimate
As % of PAD
Total Project Cost, PKR Million 6,480 3,907 60%Total Economic Cost, PKR Million 5,994 3,614 60%Additional Sales per annum at full implementation, GWh 1,870 168 9%Reduction in Power Purchases per annum, GWh 0 165 n/aERR Using DM 21.7% 63% 2.9x
Using Consumer Surplus 70%NPV Using DM 3,748 17,218 4.6x
Using Consumer Surplus 21,096
Table 3.8: LESCO Comparison of Economic Analysis
PAD Actual/Latest Estimate
As % of PAD
Total Project Cost, PKR Million 9,626 1,678 17%Total Economic Cost, PKR Million 8,588 1,307 15%Additional Sales per annum at full implementation, GWh 1,300 114 9%Reduction in Power Purchases per annum, GWh 251 1 0%ERR Using DM 36.9% 4% 0.1x
Using Consumer Surplus 29%NPV Using DM 10,208 -430 0x
Using Consumer Surplus 2,131
Table 3.9: MEPCO Comparison of Economic Analysis
PAD Actual/Latest Estimate
As % of PAD
Total Project Cost, PKR Million 9,419 4,578 49%Total Economic Cost, PKR Million 8,090 3,890 48%Additional Sales per annum at full implementation, GWh 2,892 164 6%Reduction in Power Purchases per annum, GWh 17 45 265%ERR Using DM 17.2% 19% 1.1x
Using Consumer Surplus 32%NPV Using DM 7,286 2,301 0.3x
Using Consumer Surplus 6,274
45

Annex 4. Bank Lending and Implementation Support/Supervision Processes
(a) Task Team members
Names Title Unit Responsibility/ Specialty
Lending Javaid Afzal Senior Environmental Specialist SASDI Zia Al Jalaly Senior Social Development Spec SARDE Ian Alexander Senior Economist SASDE Asif Ali Senior Procurement Specialist SARPS Rashid Aziz Senior Energy Specialist SASDE Anwar Ali Bhatti Financial Analyst SACPK Faiza Arshad Chaudary Research Analyst SASDE Paramjit Singh Dhingra Senior Power Engineer SASDE Minerva S. Espinosa-Apurada Program Assistant SASDO Syed Waqar Haider Sector Leader AFTSN David C. Hanrahan Lead Environment Specialist SASDI Amali Rajapaksa Senior Infrastructure Specialist SASDT Pedro E. Sanchez Lead Energy Specialist AFTG2 Hasan Saqib Sr Financial Management Specialist SARFM Rajesh Sinha Principal Investment Officer CNGWM Robert P. Taylor Consultant EASCS Vladislav Vucetic Lead Energy Specialist AFTG1
Supervision/ICR Zia Al Jalaly Senior Social Development Spec SARDE Asif Ali Senior Procurement Specialist SARPS Khalid Bin Anjum Procurement Specialist SARPS Anwar Ali Bhatti Financial Analyst SACPK Abid Hussain Chaudhry Program Assistant SASDO Abdulaziz Faghi Senior Energy Specialist SASDE Samina M. Islam Consultant SASDS Mohammad Omar Khalid E T Consultant SASDI Abdul Rahim Khan E T Consultant SASDE Shahid Lutfi Consultant CESI3 Riaz Mahmood Financial Management Analyst SARFM Hasan Masood Mirza Consultant SARPS Salma Omar Sr. Social Development Specialist SASDS Khizra Pervez Program Assistant ECSSD Christopher L. Rytel Consultant SASDE Kazim M. Saeed Consultant SASDE Naveed Saeed Consultant SARFM Hasan Saqib Sr. Financial Management Specialist SARFM Mohammad Saqib Senior Energy Specialist SASDE Shazia Shahid Consultant SASDS Raghuveer Y. Sharma Chief Investment Officer CN1S5 Paul Welton Sr. Financial Management Specialist SARFM
46

(b) Staff Time and Cost
Stage of Project Cycle Staff Time and Cost (Bank Budget Only)
No. of staff weeks USD Thousands (including travel and consultant costs)
Lending FY06 120 344.60 FY07 123 257.35 FY08 51 416.30
Total: 294 1018.25 Supervision/ICR
FY09 30 150.39 FY10 33 143.89 FY11 56 137.49 FY12 45 166.23 FY13 39 105.18 FY14 30 88.97
Total: 233 792.15
47

Annex 5. Beneficiary Survey Results (if any) Not applicable
48

Annex 6. Stakeholder Workshop Report and Results (if any) Not applicable
49

Annex 7. Summary of Borrower's ICR and/or Comments on Draft ICR The ICR is based on the data and information provided by the Implementing Entities. HESCO, IESCO and LESCO also shared their experience of the project as part of their project completion reports, which is summarized below. The comments received from IEs on the Bank’s ICR have been incorporated in the report. HYDERABAD ELECTRIC SUPPLY COMPANY (HESCO) a) Following issues faced during the implementation of the project:
i. Right of Way. ii. Natural Climate impact such as flood, heavy rains etc. iii. The material of the project issued against another sub-projects. iv. Less participation of bidders in Turnkey projects. v. Un-availability of project vehicles for the monitoring of the project progress
activities. vi. Law and order situations in the project areas. vii. Inadequate expertise regarding procurement under World Bank guideline at
the start of project.
b) Lesson Learnt: • The project was successful in that it provided a substantial increase in physical
infrastructure and well below the budgeted cost. The projects' economic and social impacts will be significant.
• In the implementation of project activities under World Bank PMU was established. No project performance management system was established to handle such a large project scattered across the whole Province except Karachi. Many of the sanctioned positions in the Project Management Unit (PMU) remained unfilled for longer spells.
• There is a need to introduce some incentives for holding the manning on strength over the entire project period and to discourage the transferring of trained PMU staff to other units. Long term assignments should not be entrusted to staff close to retirement age and/or service. The Executing Agency should ensure that the proper logistic as well as good office conditions including the state –of-the-art working tools are provided to the PMU.
• However, following are improved: 1. Improved procurement skills as per guidelines of World Bank. 2. Environment and Social activities has been started in all the projects. 3. Engagement of consultants for Design and monitoring of projects has
enhanced the capability of HESCO Engineers for capacity buildings of Engineers.
4. Specific trainings provided by the World Bank. 5. Grooming of the engineers with the interaction of World Bank Missions. 6. Learned the best practices used all over the world.
50
c) Suggestions & Implementation of Similar Projects The overall Capacity of HESCO would need to be developed for enhancing their functional and managerial skills by imparting regular training on Project Management tools, Procurement processes, Contract management, Environment and Social safeguards implementation and Legal and Regulatory framework compliance. The aforesaid measures will resultantly, improve the functional role of HESCO to get on the projects of multifaceted nature and magnitude. ISLAMABAD ELECTRIC SUPPLY COMPANY (IESCO) a) Critical Issues As is inevitable in every project life cycle, procurement packages under APL-1 of EDTIP have had its share of bottlenecks and road bumps. Although each one contributed to the head wind and delayed the project tasks, yet through hard work, dedication and guidance of World Bank, things finally took shape and the project objectives are, slowly but surely, materialized. Lessons are learnt and utilized as guidance for the success of future endeavors with World Bank and other donor agencies projects. The experience gained has been put to an effective use and the previously committed mistakes have been minimized. Some of the critical issues, which had been a source of concern, are:
– Less or no participation by bidders. – Late finalization and submission of Bid Evaluation Report (BER) by the
Consultant due to his heavy workload. – Delay on part of World Bank in issuance of NOC for bidding documents. – Lesser prices quoted for the identical items in other DISCOs by the same or
different bidders. – Amendment in WAPDA/IESCO specifications for certain electrical
equipment by World Bank. – Delay in according approval of BER by World Bank. – Government policies. – Non-availability of vehicles for project monitoring. – Lack of incentive for PMU.
b) World Bank Performance The World Bank provided continued support and assistance for ensuring timely project implementation. The bank also closely and regularly monitored the project (APL-I) progress through review measures, Quarterly Progress Reports and provided useful advice in several areas including procurement. World Bank also ensured timely funds disbursements and promptly responded to the requests for procurement and contract approvals for the smooth execution of the project. The World Bank overall performance during the project period was remained satisfactory. c) Lesson Learnt As it is natural that every project has some bottlenecks which are faced during execution and caused for the delay of a project.
51

As far as the Electricity Distribution and Transmission Improvement Project (APL-I) is concerned, some difficulties during procurement and execution of sub-projects were experienced by PMU but due to hard work, dedication and guidance of World Bank, the project objectives were slowly but sure achieved. However, it was observed and experienced that proper planning, trained personals and effective monitoring mechanism play a vital role in implementation of any project. IESCO followed the same strategy and successfully completed almost all the sub projects without any failure. LAHORE ELECTRIC SUPPLY COMPANY (LESCO) a) Summary of issues faced during implementation
1- Availability of land was main issue which has alternately been resolved by selecting the alternate piece of land.
2- Right of way problems raised by the TEPA/LDA while the selection of feeding transmission lines route which was resolved after negotiations with the top management.
3- There was inordinate delay in the finalization of tender for procurement of power transformers because of controversy pertaining to the selection of OLTCs to be used in these power transformers which subsequently resulted in scraping the tender.
4- Price preference allowed to local manufacturers for World Bank loans being less than the GOP/PPRA rules applicable when using own resources was challenged in the court and remained pending even though PPRA rules require to follow donor guidelines for donor funded projects.
5- Late finalization and submission of Bid Evaluation Report (BER) by the Consultant including inconsistency in recommendations.
6- Delay in procurement approvals e.g. deferment of agenda points in BOD meetings and repeated dissolution and reconstitution of BOD.
7- HR issues: posts of deputy managers in PMU often remained vacant which may be because PMU engineers in LESCO did not get the allowance given in other DISCOs. In addition, Chief Engineer (Development) LESCO was reporting to the Technical Director whereas in other DISCOs he was directly reporting to CEO.
b) Achievement of project objectives
1- The objective of the project was to add additional MVA capacity in the system to reduce the overloading of existing Power transformers. By the implementation of 05 number 40 MVA Power transformers in the system 14x5 = 70 MVA capacity was added and overloading at the existing transformers removed.
2- Similarly additional consumers were added due to this enhanced capacity at grid stations. Similarly by the extension of 26 MVA power transformer at one location, overloading of existing transformers <' t that grid station was reduced and additional consumers were also accommodated.
3- By the installation of 02-No AIS Grid Stations along with feeding transmission lines (ready for commissioning), the overloading of nearby existing grid stations shall also be reduced.
52

c) Lessons learned and suggestions for future planning and implementation of
similar projects. 1- Land should be purchased well before the start/execution of projects and should
also be free from litigations. 2- The coordination of all government and semi government departments on the
level of top management should be maintained before the start of work. 3- The comprehensive specifications for power transformers especially on OLTCs
should be spelled out before the tendering process to avoid any complication at later stage.
MULTAN ELECTRIC POWER COMPANY (MEPCO) a) Lessons Learnt World Bank APL-I was the first project which MEPCO undertook with any international donor agency. MEPCO, therefore, learnt a lot regarding World Bank policies, rules, regulations regarding procurement, loan agreement requirements, social and safeguards, withdrawal and payments etc. As MEPCO now has clear understanding any further business engagement with World Bank will be smooth. Through the World Bank project, capacity building of MEPCO employees especially regarding ICB procurement, social and safeguard issues has been enhanced.
b) Conclusion MEPCO has gained heavily through World Bank (APL-I) financing. MEPCO network, (both distribution and transmission) has improved with this project and its capacity has enhanced. As, company has the largest network in Pakistan, therefore, investment proposed under APL-II would if done, can further enhance the system capacity, reduction in losses and provide better service to its customers. It is, therefore, requested that the W.B. may consider more investment in MEPCO in following projects:-
– Construction of new G/Stations. – Augmentation of Distribution Transformers. – 11KV Rehabilitation and new 11KV feeders. – Improved meter reading project.
53

Annex 8. Comments of Cofinanciers and Other Partners/Stakeholders Not applicable
54

Annex 9. List of Supporting Documents
1. Report on Independent Procurement Review of Electricity Distribution and Transmission Improvement Project in Pakistan, Ernst & Young, June 2012
2. Bidding documents and project files (correspondences) of selected contracts (HESCO: ELR-05, IESCO: ICB-18, LESCO: ICB-630-01, MEPCO: ICB-12)
3. Implementing Entities’ Project Description Documents, Quarterly Progress Reports and Completion Reports
4. Project Appraisal Document 5. Implementation Status Reports (ISRs) 6. Project Aide Memoires and Management Letters 7. Project Restructuring Paper, 2012 8. Project Restructuring Paper, 2014 9. Competition Commission of Pakistan Enquiry report and findings 10. NEPRA State of Industry Reports (various years) 11. Program Document First Power Sector Reform Development Policy Credit
(Report No. 86031-PK)
55

Annex 10. Review of procurement and technical aspects based on a sample of 4 ICBs (one each from IESCO, MEPCO, HESCO and two from LESCO) General. During the initial stages of the procurement process, the Bank, observed that the technical requirement/specification used by DISCOs for procurement, were, not updated in line with the latest International standards and the approval/testing process of the high voltage testing was restricted to Tests carried out in a particular Laboratory or in a testing Lab within the country. The specifications were reviewed by the Bank and with the input and participation of Technical staff of DISCOs, the specifications for main Electrical equipment and the items manufactured outside the country were revised in accordance with the latest International technical standards. The revised specifications were adopted by DISCOs for the purpose of procurement under WB EDTIP. The main objective of the exercise was to ensure that the Technical specifications are in no manner restrictive to competition or favorable to a particular vendor. The prominent concerns in this context that were addressed in the process were: (a) DISCOs had adopted the technical specifications for Sub Transmission part of their system from NTDC. The adopted specs needed to be reviewed to ensure their conformity to latest Internationally accepted specifications so that International manufacturing firms do not feel restricted in competition with respect to any outdated or specific requirement. (b) Test results accepted only from tests carried out in a particular testing Laboratory restricts international competition and (c) Certain equipment specified to be acceptable only if manufactured by a particular manufacturer restricts competition. Regarding (a) The specifications were revised and simplified in accordance with the latest “International Electro technical Commission” specifications to facilitate large scale participation and competition, with respect to (b) a number of internationally accredited Testing facilities were required to be specified, from which manufacturers could present successful testing results carried out as per specification for the purpose of acceptance of the procured/installed item, and for (c) where a specification required an equipment as manufactured by a particular manufacturer,( due to technical performance history or other valid reasons), the specification was revised, in accordance with the Bank guidelines, to add the words “ or equivalent”. This meant that if a prospective Bidder could provide the same or better quality equipment with respect to technical specification his entry into competition should not be restricted by a particular make. Causes of delay and other relevant points are discussed in detail for each of the ICBs as follows: IESCO, ICB-18. ICB-18 was a “Turnkey” project relating to “Design, construction and testing of a 132/11 kV Grid station complete with control building and associated Civil works and equipment”. The scope involved a number of Electrical equipment which were mostly manufactured outside the country. IESCO staff had sufficient experience in procuring individual items based on their standard specifications; however the technical design /specifications had to be reviewed and revised to bring them in line with International standards and conformity to the Bank guidelines. The qualification regarding experience and handling of turnkey projects and the requirement of the Grid stations being in successful operation for a certain period prior to Bid opening date was also considered.
56

As a trade-off between achieving wholesome competition and avoiding risk of non-performance by less experienced firms, the experience requirement was brought to a reasonable level. The process of consultation with the DISCOs and finalizing the revised specification, for the main equipment comprising the turnkey project of ICB, used a substantial part of the scheduled project initiation to completion time. The delay in submission of final “Bidding documents” by IESCO can be attributed to a large extent on such a capacity building exercise, but the process resulted in establishing a model set of Bid Documents for IESCO as well as other three DISCOs. The benefit of the exercise, apart from capacity building of the DISCOs, has been realized in the shape of facilitating adequate participation in bidding and timely completion of the contract after award. In the final context none of the technical requirement/specifications caused any restriction in the competitive process of bidding. Main delay occurred due to the time taken in (i) Initiation and finalization, issuance of “No objection” to the Bidding Document, (ii) Takeover/change of ownership of the Transmission and Distribution business of the Lowest Bidder, after the Bid submission date, which involved the scrutiny of a lot of documentation and consultation, seeking expert advice regarding Legal aspects and conformity to WB guidelines.(iii) Handing over of site by IESCO to Contractor said to be caused due to reasons beyond control of IESCO. Sample LESCO, ICB-630-01. ICB-630-01 was a “Turnkey” project relating to “Design, construction and testing of a 132/11 kV Gas insulated Sub-station (GIS) complete with control building and associated Civil works and equipment”. As in the case of IESCO, the technical design /specifications had to be reviewed and revised to bring them in line with International standards and conformity to the Bank guidelines. A lot of initial time was used in the process of consultation and finalizing the revised specification, for the main equipment comprising the GIS turnkey project, involving revisiting and revisions of the Bidding documents. The exercise, however, facilitated adequate participation in bidding and provided essential capacity building of concerned staff for expeditious finalization of Bid Documents for future such projects. None of the technical requirement/specifications in this case caused any restriction in the competitive process of bidding. Other reasons of delay in implementation process were (i) Approval of BoD of LESCO was awaited to finalize Letter of Award to lowest responsive bidder and (ii) Payment of 10% advance and handing over of site by LESCO to Contractor. Post award of contract, the delay in implementation has been on account problems, altercation between Main contractor and sub-contractors. Sample MEPCO, ICB-12. ICB-12 comprised of “Procurement of 11/0.4 kv, Distribution Transformers (DTr)” 25,50,100 and 200 kVa DTrs as Lots I,II,III and IV respectively. Main delay occurred due to the time taken in (i) Dealing with the issue of suspected collusion by Local manufacturers in the first Tender opening (ii) Expiry of Bid Validity period on account of time taken in clarification sought by WB and response by MEPCO in second Tender opening and (iii) Local firms entered into Litigation against MEPCO over price preference to foreign firms in third Tender opening.
57

The technical specifications for the items procured under ICB-12 were based on internationally accepted specifications (IEC, updated specs). These specs were not restrictive in any manner and did not contribute to the delay in the procurement process. This is evident from the fact that a number of foreign firms participated in the bidding process, even though retendered twice. None of the Local or foreign firms raised any worthwhile objection to the technical aspects of the specs. The only objection, relating to the technical aspects was made by the Local firms in the petition to court, that Stage inspection was not required for foreign firms but required in case of local firms. This aspect was clarified by MEPCO to the Court that the relevant IEC specs applicable in the case do not require stage inspection for both Local as well as foreign firms. This item of procurement was historically purchased from a few prequalified firms whose total production capacity hardly met the total requirement of all the DISCOs within the integrated Power company status. The demand for the product was thus shared with respect to the production capacity of the firms. Absence of price competition from International firms provided a comfortable working arrangement within the Local manufacturing industry. As International firms were allowed to participate in the competitive process based on internationally accepted technical specification standards, the comfortable hold of the Local firms over the sharing of demand was disturbed. Foreign firms were therefore considered strong competitors to take away some of the share of demand. The attempt at collusion to quote the same price by five local firms in the first tender and four local firms approaching the Courts to intervene in the matter of awarding contract to a foreign firm declared as the Lowest evaluated bidder for Lot IV, in the third tender in spite of price preference to Local firms, speaks of the threats perceived by local firms in the shape of competition by foreign firms. The matter of award of contract to LERB for Lot IV is still held up due to litigation. Local firms have thus successfully put on hold the award of contract to a foreign firm on the ground of anomaly between the Bank guidelines and statutory orders issued by the Government to promote the Local manufacturing industry. Any anomaly in this context is required to be resolved if future hindrance to International competition is to be avoided. Sample HESCO, ICB-ELR-05. ICB-ELR-05 comprised of “Supply, Installation and testing of Aerial Bundled conductor” (ABC) to replace bare overhead conductors in the 0.4 kV distribution network and installation of associated equipment/meters procured by HESCO through other ICBs. The purpose of the sub project was to eliminate direct hooking of the bare conductors and thereby prevent direct pilferage from overhead low tension Lines. The scope of work comprised of supply and installation of 800 km of ABC cables/ feeders and 2159 km of services and associated equipment and installation of 15,90027 number new meters/equipment associated with installation of ABC. Main delay occurred due to the time taken in (i) finalizing the mode of procurement, alternatives of turnkey project or own procurement, procurement and installation of meters and service, mode of storing procured/ inspected equipment and procedure for
27 12,013 and 3,893 meters were installed to existing and new applicants.
58

handing over of any equipment procured by HESCO to the contractor, (ii) procedure for installation /removal of network, safety measures, (iii) finalizing technical specifications for the equipment involved in line with internationally accepted standards and (iv) difficulty in implementation, resistance by interest groups/persons. The technical specifications for the items procured under ICB-ELR-05, were based on internationally accepted specifications. These specs were not restrictive in any manner and did not contribute to the delay in the procurement process. Local firms did not have adequate experience in the supply and installation of the insulated conductors, therefore competition was expected only among foreign firms/ manufacturers of the specific items and accessories required for its’ installation. The Bid documents were designed to facilitate adequate competition from the limited number of experienced firms available in the international market, who were willing to invest and work under the particular working conditions in the project area within HESCO. Though 8 number (2 foreign and 6 local) firms purchased the Bid documents only two foreign firms participated in the bidding, in spite of three extensions in Bid opening date. None of the firms raised any objection to the technical aspects of the specs. 60% of the project has been completed and the remaining is expected to be completed from HESCO’s own resource by end December 2014. This ICB was a pilot project, particularly targeted to reduce pilferage. The project completed so far has established the benefits as well as practicability of the project. Such projects therefore need to be replicated in HESCO as well as other DISCOs for improvement in financial sustainability as well as operational reliability.
59

60