document kzsume - files.eric.ed.gov · waivers on cost limitations that they requested, but few...
TRANSCRIPT

ED 264 329
TITLE
INSTITUTIONREPORT NOPUB DATENOTEAVAILABLE FROM
PUB TYPE
EDRS PRICEDZSCRIPTORS
DOCUMENT kZSUME
UD 024 594
The Job Training Partnership Act: An Analysis ofSupport Cost Limits and ParticipantCharacteristics.General Accounting Office, Washington, D.C.GAO-HRD-86-166 Nov 8571p.U.S. General Accounting Office, Document Handling andInformation Services Facility, P.O. Box 6015,Gaithersburg, MD 20877 (first five copies free ofcharge, additional copies $3.25 each).Reports - General (140)
MF01/PC03 Plus Postage.*Employment Programs; Federal Programs; *JobTraining; *Participant Characteristics; *ProgramCosts; Program Implementation; Resource Allocation;*Work Experience Programs
IDENTIFIERS *Comprehensive Employment and Training Act; *JobTraining Partnership Act 1982
ABSTRACTThis publication reports on a recent study that
compared the new Job Training Partnership Act (JTPA) with itspredecessor, the Comprehensive Employment and Training Act (CETA).The study was conducted to determine how the JTPA limit on money forprogram administration affected the type of individual served and thetraining provided in the transition year 1984. It was found that thecurrent training act served a better-educated clientele--more highschool graduates and students and fewer dropouts--than CETAparticipants. Participants in JTPA generally received less financialsupport and were more likely to be enrolled in on-the-job training.The number of participants enrolled in work experience programsdecreased. While the factors that caused these changes are unclear,the limitation on 'anticipant support costs under JTPA does notappear to be a factor. Service delivery areas generally received thewaivers on cost limitations that they requested, but few requestedsuch waivers. Thus, any changes that occurred may have been due moreto program implementation activities than to the legislativelyimposed limitation. (GC)
***********************************************************************
Reproductions supplied by EDRS are the best that can be madefrom the original document.
***********************************************************************

U.S. DEPARTMENT Of EDUCATIONNAT19NAL INSTITUTE OF EDUCATION
EDU TIONAi. RESOURCES iNFO 4MATiON
CENTER (ERIC)
Tha docurneni has fwd.- redt,tId asracsnroo horn the rumor ar oNanizatunoriginating it%no* honors ...iv* beer rnorwee
.'epfodut NY, otaiinv
P'w,v1 woe.. .0 40.00, V.11110men, If 404 MIA .4 We'lltIR.
positron or poky
'es
41
Ox Ai NO
PERMMATEP1A, HA BEEN
Ja 6,14 iW
NO- w IVA
'
ri
Request for copies of GAO reports should besent to:
U.S. General Accounting OfficeDocument Handling and Information
Services FacilityP.O. Box 6015Gaithersburg, Md. 20877
Telephone (202) 275-6241
The first five copies of individual reports arefree of charge. Additional copies of boundaudit reports are $3.25 each. Additionalcopies of unbound report (i.e., letter reports)and most other publications are $1.00 each.There will be a 25% discount on all orders for100 or more copies mailed to a single address.Sales orders must be prepaid on a cash, check,or money order basis. Check should be madeout to the "Superintendent of Documents".
3

HUMAN RESOURCESDIVISION
B-215774
UNITED STATES GENERAL ACCOUNTING OFFICE
WASHINGTON, D.C. 20548
The Honorable Augustus F. HawkinsChairman, Committee on Education
and LaborHouse of Representatives
The Honorable James M. JeffordsRanking Minority MemberCommittee on Education and LaborHouse of Representatives
This report was prepared in response to your joint requestthat we assess the impact of participant support costimitations on the individuals served and the training providedunder the Job Training Partnership Act. The report discusseschanges in participant characteristics and type of trainingprovided to enrollees in the Job Training Partnership Act andthe Comprehensive Employment and Training Act, which itreplaced.
We are sending copies of this report to the Secretary ofLabor; the Director, Office of Management and Budget; and otherinterested parties.
Richard L. FogelDirector
4

EXECUTIVE SUMMARY
The Job Training Partnership Act (JTPA) replacedthe Comprehensive Employment and Training Act(CETA) in October 1983. Under CETA's principaltraining program, about 80 percent of the fundswere spent on nontraining costs, includingadministration and participant support services,and about 20 percent on training. To ensure thatmost JTPA funds are spent on training, theCongress limited the vnount available foradministration to 15 percent of totalexpenditures and a combined limit of 30 percentfor administration and participant support,
Concerned that the limitation, as it pertains toparticipant support costs, might impact on thequality of training provided and the type ofindividual served, the former Chairman and theRanking Minority Member of the Subcommittee onEmployment Opportunities, House Committee onEducation and Labor, asked GAO to determine
--the differences in the characteristics of CETAand JTPA participants;
--how many service delivery areas requested andreceived waivers on support cost limitations;
--the number of service delivery areas providingneeds-based payments and the type of supportiveservices offered; and
--the differences in the type and length oftraining provided under CETA and JTPA.
GAO also sought the opinions of local programofficials on the program impact of the limitationon participant support costs.
BACKGROUND JTPA provides training and other assistance tounskilled and economically disadvantagedindividuals who need it to obtain employment.States administer the act and are divided intoservice delivery areas through which trainingservices are delivered.
Under both acts, program participants wereprovided with support services, such astransportation and child care, to enable them toparticipate in training. Under CETA, cash
Page i GAO/HRD-86-16 Limits of Support Costs
5

EXECUTIVE SUMMARY
payments to participants attending training wererequired; under JTPA, administrators can opt toprovide needs-based payments to participants tooffset the cost of attending training. JTPA's30-percent limitation includes costs of supportservices and needs-based payments. Servicedelivery areas can get a waiver to exceed thelimitation under certain conditions.
RESULTS IN BRIEF Some changes occurred in the type of individualserved under JTPA. However: it appears that thelimitation on participant support costs was notthe primary contributing factor.
The current training act is serving a clientelethat is better educated--more high schoolgraduates and students and fewer dropouts--thanCETA participants. Participants generallyreceive less financial support and are norelikely to be enrolled in on-the-job training.
While the factors that caused the above changesremain unclear, it appears that the limitation onparticipant support costs was not a factor.Service delivery areas generally received thewaivers on cost limitations they requested;however, few requested them. In addition,although service delivery areas had at least15 percent of their funds available for supportcosts, those responding to GAO's questionnairespent an average of 7 percent.
Service delivery area officials responding toGAO's questionnaire also said the limitation hadsome impact on the type of individual served andthe kind of training offered. But, because theareas spent less than half the minimum availableunder the act on support costs, GAO believes anychanges that occurred may have been due more tothe way the areas implemented their program thanto the legislatively imposed limitation.
GAO's ANALYSIS
Changes inCharacteristics
GAO compared the characteristics of JTPAparticipants in transition year 1984 with CETAparticipants in fiscal year 1982 at 148 servicedelivery areas having the same geographicboundaries. The comparison showed that thecurrent act served a hiTaer percentage of highschool graduates (62 to 60), students (15 to 12),
Page ii GAO/HRD-86-16e,1 Limits of Support Costs
6

EXECUTIVE SUMMARY
Few WaiversRequested
and unemployment compensation claimants (9 to 7)and a lower percentage of dropouts (23 to 29),unemployed (72 to 80), and nonwhites (48 to 50)than did CETA. (See pp. 8 to 13.)
Of the 544 service delivery areas responding toGAO's questionnaire, only 39 requested a waiverfor participant support costs; 37 receivedthem. Generally, those not requesting waiverscited one or more of the following reasons:about 63 percent were able to meet participantsupport needs within the limitations; 43 percentmade a policy decision to limit services orpayments to participants; and 34 percent believedthat using more funds for participant supportwould leave too little for training. (See pp. 15and 16.)
Types and Extent Over 80 percent oi respondents spent less thanof Assistance the minirum allowed for participant support.
Overall, they spent an average of 7 percent oftheir funds during the transition year. Thoserequesting waivers spent 12 percent on average.Of the service delivery areas, 95 percentprovided some type of assistance to participantseither directly or through agreements with otherstate and local agencies at no cost.Transportation and child care were the supportservices most commonly provided; 40 percent ofthe service delivery areas also providedneeds-based payments (on average, $34 weekly).GAO did not determine the extent to which thisassistance satisfied participants' needs. (Seepp. 16 tc 25.)
Changes in GAO noted a shift in training from that offeredTraining under CETA at 11 locations it visited. TheActivities participants enLolled in on-the-job training
increased by 214 percent when compared to on-the-job training enrollment in fiscal year 1982 underCETA. GAO also noted that the number ofparticipants enrolled in work experiencedecreased by 66 percent at the 10 locations thatoffered this training under CETA in fiscal year1982. (See pp. 34 to 36.)
Page iii GAO/HRD-86-16 Limits of Support Costs
7
EXECUTIVE SUMMARY
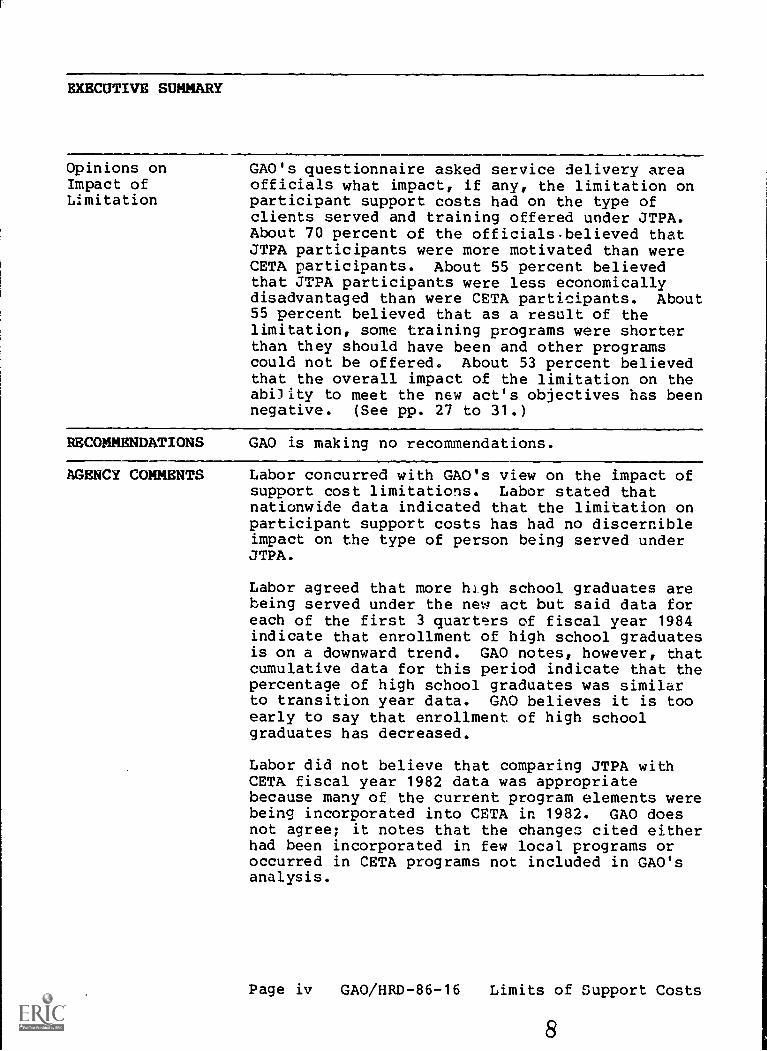
Opinions onImpact ofLimitation
GAO's questionnaire asked service delivery areaofficials what impact, if any, the limitation onparticipant support costs had on the type ofclients served and training offered under JTPA.About 70 percent of the officials believed thatJTPA participants were more motivated than wereCETA participants. About 55 percent believedthat JTPA participants were less economicallydisadvantaged than were CETA participants. About55 percent believed that as a result of thelimitation, some training programs were shorterthan they should have been and other programscould not be offered. About 53 percent believedthat the overall impact of the limitation on theability to meet the new act's objectives has beennegative. (See pp. 27 to 31.)
RECOMMENDATIONS GAO is making no recommendations.
AGENCY COMMENTS Labor concurred with GAO's view on the impact ofsupport cost limitations. Labor stated thatnationwide data indicated that the limitation onparticipant support costs has had no discernibleimpact on the type of person being served underJTPA.
Labor agreed that more tugh school graduates arebeing served under the new act but said data foreach of the first 3 quarters of fiscal year 1984indicate that enrollment of high school graduatesis on a downward trend. GAO notes, however, thatcumulative data for this period indicate that thepercentage of high school graduates was similarto transition year data. GAO believes it is tooearly to say that enrollment of high schoolgraduates has decreased.
Labor did not believe that comparing JTPA withCETA fiscal year 1982 data was appropriatebecause many of the current program elements werebeing incorporated into CETA in 1982. GAO doesnot agree; it notes that the changes cited eitherhad been incorporated in few local programs oroccurred in CETA programs not included in GAO'sanalysis.
Page iv GAO/HRD-86-16 Limits of Support Costs
8

ContentsPage
EXECUTIVE SUMMARY
CHAPTER
1 INTRODUCTION 1
State and local delivery system 1
Comparing CETA and JTPA 2
Objectives, scope, and methodology 4
2 COMPARING CHARACTERISTICS OF CETA AND JTPAPARTICIPANTS 8
Educational levels changed 10
Changes in employment status noted 11
Decline in youth served stopped under JTPA 12
For other characteristics compared, littlechange 12
3 LITTLE USE MADE OF WAIVERS FOR PARTICIPANTSUPPORT LIMITATIONS 14
Waivers on support limitations availableto SDAs 14
Few waivers requested, few denied 15
More participant support provided by SDAsreceiving waivers 16
4 MANY TYPES OF PARTICIPANT SUPPORT PROVIDEDWITHIN FUNDING LIMITATIONS 18
Participant support expenditures limitedby act 18
SDA spending fcr participant support lessthan act allows 19
Most SDAs providing participant support 20
SDAs providing participant support throughalternative soorces 25
5 IMPACT OF PARTICIPANT SUPPORT LIMITATIONS:VIEWS OF SDA ADMINISTRATORS AND PICREPRESENTATIVES 27
Use of alternative resources 27
Changes in participants being served 28
Changes in training programs 29Overall impact 30

Page
CHAPTER
6 CHANGES IN TRAINING BETWEEN CETA AND JTPA 32Training at SDAs varied 32Shifts in OJT and work experience under
JTPA 34Shorter training under JTPA 36Similar results in other studies 37
7 SUMMARY, CONCLUSION, AND AGENCY COMMENTS 38Summary 38Conclusion 39Agency comments 39
APPENDIX
I Methodology used in GAO's comparison ofcharacteristics 41
II Opinion questions asked of SDA officialsconcerning impact of support limitations,and responses 45
III States and SDAs visited by GAO 47
IV Advance comments from the Department of Laborand GAO's analysis 48
Table
2.1 Comparison of educational status 10
2.2 Comparison of employment status 11
2.3 Comparison of female and nonwhite characteristics 12
2.4 Comparison of welfare recipient, liandicapped, andsing:1e parent characteristics 13
3.1 Reasons for denial of waivers 15
3.2 Comparison of SDAs receiving waivers with SDAsnot requesting or receiving waivers 17
3.3 Support services offered by SDAs receivingwaivers and those not requesting or receivingwaivers 17
10
Page
Table
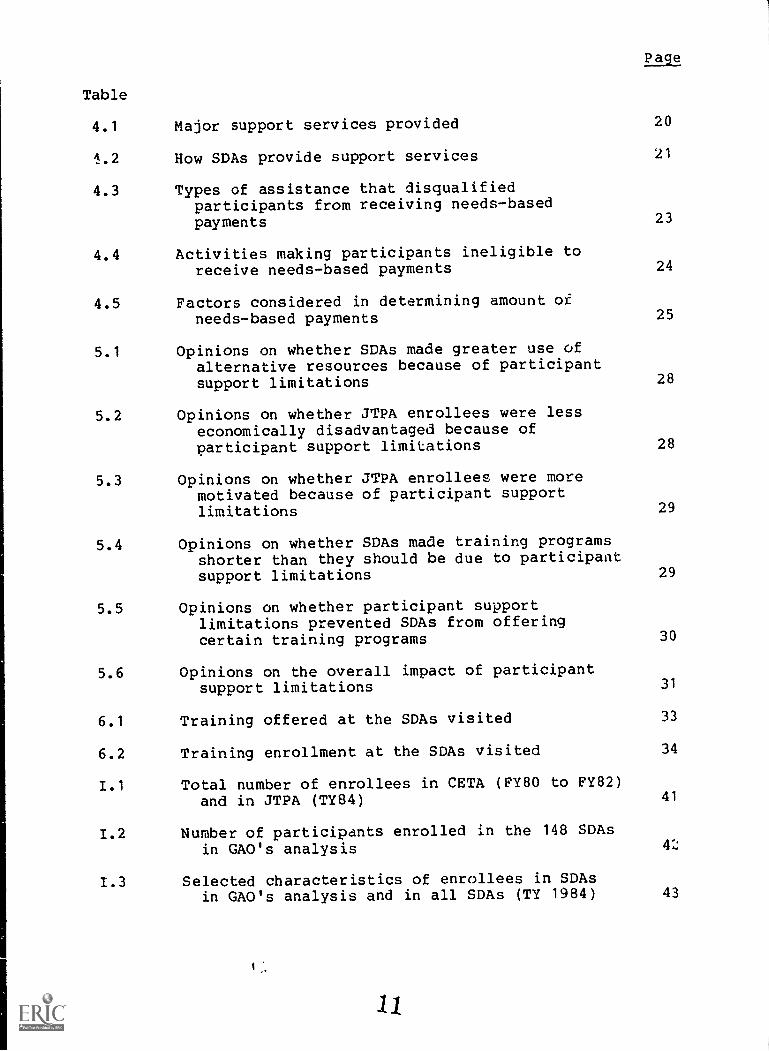
4.1 Major support services provided 20
4.2 How SDAs provide support services 21
4.3 Types of assistance that disqualifiedparticipants from receiving needs-basedpayments 23
4.4 Activities making participants ineligible toreceive needs-based payments 24
4.5 Factors considered in determining amount ofneeds-based payments 25
5.1 Opinions on whether SDAs made greater use ofalternative resources because of participantsupport limitations 28
5.2 Opinions on whether JTPA enrollees were lesseconomically disadvantaged because ofparticipant support limitations 28
5.3 Opinions on whether JTPA enrollees were moremotivated because of participant supportlimitations
5.4 Opinions on whether SDAs made training programsshorter than they should be due to participantsupport limitations
5.5 Opinions on whether participant supportlimitations prevented SDAs from offeringcertain training programs
5.6 Opinions on the overall impact of participantsupport limitations
6.1 Training offered at the SDAs visited
6.2 Training enrollment at the SDAs visited
1.1 Total number of enrollees in CETA (FY80 to FY82)and in JTPA (TY84)
1.2 Number of participants enrolled in the 148 SDAsin GAO's analysis
1.3 Selected characteristics of enrollees in SDAsin GAO's analysis and in all SDAs (TY 1984)
11
29
29
30
31
33
34
41
43

Figure
1.1 States represented by one or more SDAs in GAO's
Page
analysis of enrollee characteristics 5
2.1 Change in selected enrollee characteristicsCETA FY80 to CETA FY82 and from CETA FY82
fromto
JTPA TY84 9
4.1 Percent of funds for participant support 20
4.2 Percent of JTPA enrollees who received needs-basedpayments in TY84 22
4.3 Typical weekly needs-based payments to JTPAenrollees in TY84 24
6.1 Percent of OJT participants at 11 SDAs in CETAFY82 and JTPA TY84 35
6.2 Percent of work experience participants at 11 SDAsin CETA FY82 and JTPA TY84 36
ABBREVIATIONS
AFDC Aid to Families with Dependent Children
CETA Comprehensive Employment and Training Act
FY fiscal year
GAO General Accounting Office
JTLS Job Training Longitudinal Survey
JTPA Job Training Partnership Act
NAB National Alliance of Business
OJT on-the-job training
PIC private industry council
PY program year
SDA service delivery area
TY transition year
12

CHAPTER 1
INTRODUCTION
The Job Training Partnership Act (JTPA) was signed into lawon October 13, 1982. Following a 1-year period during which stateand local delivery systems were organized, JTPA replaced theComprehensive Employment and Trailing Act (CETA) as the nation'sprimary federally funded employment and training program onOctober 1, 1983. Administered by the Department of Labor, JTPAprovides job training to unskilled and economically disadvantagedindividuals who need training to obtain employment.
JTPA consists of five titles:
--Title I establishes the state and local service deliverysystem and addresses general program and administrativeissues,
--Title II provides for a year-round training program fordisadvantaged adults and youth (title II A) and a summeryouth program (title II B),
--Title III provides for a separate, state-administeredemployment and training program for dislocated workers(those who have lost their jobs because of plant closingsor major work force reductions and are unlikely to returnto their previous industry or occupation),
--Title IV establishes requirements for such federallyadministered activities as Job Corps and programs forNative Americans, and
--Title V contains miscellaneous provisions and changes totraining-related activities in other federal programs,including state employment service agencies and the WorkIncentive program.
STATE AND LOCAL DELIVERY SYSTEM
Each state's governor, sharing authority with a State JobTraining Coordinating Council that he or she appoints, isresponsible for administering the state's JTPA program. Thecouncil's overall functions are to plan, coordinate, and monitorstate employment and training programs. Based on recommendationsby the state council, the governor divides the state into servicedelivery areas (SDAs) through which job training services areprovided. SDAs may include the entire state or one or more unitsof local government.

r.ach SDA must have a private industry council (PIC) appointedby the chief elected officials. PICs consist of local businessleaders, who make up a majority of the membership, andrepresentatives of educational agencies, organized labor,rehabilitation agencies, community-based organizations, economicdevelopment agencies, and the public employment service. Aprimary responsibility of the PICs, in partnership with the localelected officials, is to provide overall policy guidance andoversight for the local employment and training program. Inaddition, the PICs, in agreement with the chief elected officials,determine procedures for developing a job training plan andselecting a grant recipient and an organization to administer theplan.
COMPARING CETA AND JTPA
JTPA is similar to CETA in that it provides job training andemployment assistance primarily through locally based deliverysystems. Both acts also provided support services, such astransportation and child care, to participants to enable them toattend training. The two programs differ in many ways, however.Unlike CETA, JTPA establishes a partnership between the privateand public sectors over all aspects of local policy-making,planning, administering, and programming operations. It allowsthese partnerships to decide how to administer JTPA funds and whattypes and combinations of services to provide. Under CETA, suchdecisions were generally made by the local administrativeagencies.
Other key differences between CETA and title II A of JTPAinclude the following:
--Many administrative and oversight functions have beenshifted from Labor to the states under JTPA. Consequently,such data as information on enrollees' characteristics ortraining provided are not available at the federal level,as they were under CETA.
--JTPA program pel:frmance must be measured by standardsbased on increases in participant earnings and reducedwelfare dependency. Under CETA, while performance measureswere introduced, they were not fully implemented orrequired.
2
14

--SDAs are not required to provide JTPA participants wi hcash payments for attending classroom training as underCETA. Rather, SDAs have the option of providing needs-based payments1 to participants to enable them toparticipate in training.
--Unless granted a waiver, an SDA must spend 70 percent ofits funds on training. CETA did not include a similarprovision, but in fiscal year 1982 program administratorsspent about 20 percent for training.
--JTPA sets a limit of 15 percent of total expenditures forSDA administrative costs compared to 20 percent under CETA,and a combined limit of 30 percent for administrativecosts, needs-based payments, supportive services, and othernontraining costs. Such a combined limit did not existunder CETA. In fiscal year 1982, however,, programadministrators spent 80 percent for administrative andother nontraining costs.
--Generally, an SDA must spend 40 percent of its JTPA fundson services to youth and also serve weliare recipients andschool dropouts in proportion to their incidence in theeligible population. These targeting provisions did notexist under CETA.
The JTPA program operates on a 2-year planning cycle. Eachstate and SDA must prepare a plan describing its JTPA programs andactivities over 2 program years (PYs).4 The act, however,initially allowed SDAs to plan only for the 9-month period,October 1, 1983, to June 30, 1984.J The first full 2-yearplanning cycle began on July 1, 1984. The first program year,July 1, 1984, to June 30, 1985, is referred to as PY 1984.
Funding for the initial 9-month period of JTPA totaled about$2.8 billion, including about $1.4 billion for title II A, theprincipal program for training economically disadvantaged adultsand youth. The administration's budget for the program year
1Needs-based payments are, generally speaking, given toeconomically disadvantaged participants to offset the costassociated with taking training.
2A program year begins on July 1 and ends on June 30 of thefollowing year.
3This initial 9-month period is referred to as the transitionyear (TY) .
3
15

ending June 30, 1985, is over $3.6 billion, of which about $1.8billion is for title II A. In comparison, CETA programexpenditures in fiscal year (FY) 1982 totaled about $4.1 billion,of which $1.8 billion was for title II B and C, covering CETA'sbasic training program.
OBJECTIVESL_SCOPE, AND METHODOLOGY
The former Chairman and the Ranking Minority Member,Subcommittee on Employment Opportunities, House Committee onEducation and Labor, were concerned that the limitations onparticipant support costs might affect the quality of trainingprovided and the type of individuals served under JTPA. Theyasked us to study the implementation of these provisions. Insubsequent meetings with subcommittee representatives, we agreedto determine
--the differences in the characteristics of participants whoenrolled in the CETA program and those enrolling in JTPA,
--the degree to which SDAs requested and received waivers ofthe limitations on allowances and support services,
--the type of supportive services offered and thL use ofnon-JTPA resources to provide these services,
--the proportion of SDAs establishing needs-based paymentsand the method for determining eligibility for and amountsof such payments, and
--the differences in the type and length of training providedunder CETA and under JTPA.
To determine if JTPA was serving a different clientele thanCETA, we compared the characteristics4 of enrollees undertitle II A of JTPA with those under title II B and C of CETA.This title authorized the basic CETA program of comprehensive workand training activities, including on-the-job training, workexperience, job search assistance, and supportive services. Toobtain a more complete picture of those individuals being servedby JTPA, we based our comparison on enrollees rather thanterminees. To minimize the possibility that any differences inchar,zteristics may have been due to changes in geographicalboundaries, we made our comparison for enrollees in 148 SDAs thathad maintained the same geographical boundaries as former CETA
4C'Iaracteristics include sex, age, educational level, race, laborforce status, family status, unemployment compensation status,welfare status, and handicapped status.
4
16

prime sponsors5 between 1980 and TY 1984. These SDAs came from29 states and Puerto Rico. (See figure 1.1.)
Figure 1.1: Stet's Represented by One or More SDAs in GAO's Analysis of Enrollee Characteristics
atiIN ANALYSIS
riNOT IN ANALYSIS
Because comparable CETA title II B and C data were notavailable for FY 1983, we did not include that year in ouranalysis. In 1983, as all programs could be combined forreporting purposes, the majority of the prime sponsors did thisrather than report separately by title. The results of ourcomparisons appear in chapter 2; a detailed description of ourmethodology in appendix I.
We obtained information about waivers, needs-based payments,and supportive services through a questionnaire sent to all 594SDAs between June and September 1984. A total of 544 SDAsresponded. Chapters 3 and 4 summarize information we obtained
5Prime sponsors were state or local authorities that administeredCETA's employment and training programs.
5
17

from this questionnaire, and chapter 5 contains the opinions ofSDA officials on the impact of the support cost limitations. Wealso visited 11 SDAs in 6 states to obtain information (presentedin ch. 6) about differences in the type and length of trainingbetween CETA and JTPA. The states (California, Florida, Georgia,Massachusetts, Michigan, and Ohio) were selected to obtain somemeasure of geographic coverage. We chose the SDAs from amongthose having the same geographical boundaries and administrator asunder CETA, selecting some that provided needs-based payments andsome that did not.
At each SDA, we interviewed JTPA program officials andreviewed documents and records for CETA FY 1982 and informationregarding JTPA for the transition year (October 1983 through June1984).
While we visited only 11 SDAs, we supplemented our data withinformation developed in studies conducted by the NationalAlliance of Business (NAB),6 Westat Incorporated,? and Grinker,Walker and Associates.8 NAB's study, a comprehensive survey ofSDAs and limited survey of private industry council chairs done inJuly, August, and September 1984, used structured telephoneinterviews. The Westat study observed 40 SDAs in 20 randomlyselected states from June through August 1984. It also comparedthe characteristics of JTPA participants to those of the eligiblepopulation using data from the Census Bureau's Current PopulationSurvey. The study by Grinker, Walker and Associates consisted of(1) structured field observations and interviews with JTPAofficials in a sample of 25 SDAs in 15 states, (2) structuredtelephone interviews with SDA officials in a separate sample of 32SDAs, and (3) structured telephone interviews with state JTPAofficials for all 50 states.
We also met with Labor program officials in Washington, D.C.,and reviewed pertinent legislation, including the legislativehistory of JTPA, and Labor regulations and bulletins.
6What's Happening With JTPA? A Complete Analysis of NABs 1984Survey Data (National Alliance of lusiness, 1985).
7Transition Year Implementation of the Job Training PartnershipAct (Westat Incorporated, January 1985).
8Gary Walker, Hilary Feldstein, and Katherine Solow. AnIndependent Sector Assessment of the Job Trainin Partnership ActPhase II: Initial Implementation (Grinker, Walker andAssociates, January 1985).
6
18

Our fieldwork was conducted between May and December 1984.Based on a preliminary analysis of the data collected, we briefedstaff of the Subcommittee on Employment Opportunities, HouseCommittee on Education and Labor, in February 1985. We completedour analysis and provided testimony before the same Subcommitteein May 1985. Our review was done in accordance with generallyaccepted government audit standards.
7
19

CHAPTER 2
COMPARING CHARACTERISTICS
OF CETA AND JTPA PARTICIPANTS
Both CET:. and JTPA were designed to serve economicallydisadvantaged youth and adults, and over 90 percent of theirparticipants met this criterion. But program differences betweenCETA and JTPA, such as the?. limitation on participant supportcosts, caused some congressional concern that the type ofparticipants served under JTPA would change.
To determine if changes had occurred, we compared thecharacteristics of JTPA title II A enrollees during the first9 months of that program with FY 1982 CETA title II B and Cparticipants at 148 SDAs that maintained the same geographicboundaries between 1980 and 1984. JTPA served somewhat higherpercentages of high school graduates, students, and unemploymentcompensatdon claimants than did CETA, we found, and somewhat lowerpercentages of school dropouts, the unemployed, and nonwhites.Other characteristics, including age, sex, and welfare status,remained unchanged.
To gain a broader perspective, we included CETA FY 1980 datain our comparisons. Adding this third dimension in time disclosedadditional changes. We noted that
--the percentage of high school graduates served, which hadbeen increasing under CETA, continued to increase underJTPA, but the significant decrease in the percentage ofdropouts and increase in the percentage of students beingserved under JTPA represented a change from what had beenoccurring under CETA;
--an increase in the percentage of unemployed being servedunder CETA was reversed under JTPA; and
--a decline in the percentage of youth and females beingserved under CETA did not continue under JTPA.
Figure 2.1 illustrates the changes that occurred from 1980 to1984.
8
20

Figure 2.1:Change In Selected Enrollee Characteristics From CETA FY80
To CETA FY82 And From CETA FY82 To JTPA TY84
Characteristics CETA MO to
%Decrease
CETA FY82
%Increase
Education High SchoolGraduate +7
Student 6
Dropout No Change
Unemployment
Age
Other
UnemploymentCompensationClaimant
Unemp'oyeO
YOuth -7
Female 2
Nonwhite
dNo Change
I
+1
46
CETA FY82 to JTPA TY84
2
No Change
No Change
LI
"No Change means there was no statistically significant change
Note. Based on a comparison of title IIB and C under CETA with title IIA under JTPA at 148 SDAs with the samegeographical boundaries between 1980 and 1984
9
21BEST COPY AVAILABLE

The remainder of the chapter provides greater detail on thechanges in participant characteristics. In each case, we providethe average nercentagel of enrollees across SDAs with thatcharacteristic. The differences cited are those in which thechange was statistically significant. Although definitions ofsome participant characteristics differed between CETA and JTPA,only one characteristic (unemployed) with a statisticallysignificant difference between them had a change in definitionthat Labor considered meaningful. The methodology we used inthese comparisons is described in appendix I.
EDUCATIONAL LEVELS CHANGED
All CETA and JTPA participants can be classified as eitherschool dropouts, students, or high school graduates. Theireducational level is shown in table 2.1.
Table 2.1
Comparison of Educational Status
Mean percent of participantsCETA CETA JTPAFY 1980 FY 1982 TY 1984
High school graduates 53 60 62Students 18 12 15
Dropouts 30 29 23
Within CETA as well as between CETA and JTPA, the educationalprofile of participants has changed across time. For example,while the percentage of dropouts remained fairly steady underCETA, it decreased during the first 9 months (or the transitionyear) of JTPA.
On the other hand, although JTPA served more graduates thandid CETA, we found that the percentage of graduates had alsoincreased in recent years under CETA. Under CETA, however, theincrease in the percentage of graduates was accompanied by adecrease in the percentage of students; under JTPA, the percentageof students also increased.
JTPA requires that school dropouts be served in proportion totheir incidence in the eligible population. Although determiningif this provision was met was not part of the scope of our work,we did examine the change in the proportion of dropouts served.
1This represents the mean across all SDAs of the percentage ofenrollees with each characteristic.
:22r..! ',.V: %. '.:"! ) `I .......ti
10
22

Although the proportion of dropouts increased in 30 of the SDAs westudied, the dominant trend, observed in 118 SDAs, was apercentage decrease. Overall, the proportion of school dropoutsbeing served decreased from 29 to 23 percent.
CHANGES IN EMPLOYMENT STATUS NOTED
We compared two characteristics--employment and receipt ofunemployment compensation--that define individuals' employmentstatus. Unemployed individuals were those who, at the time ofapplication for JTPA training, had not worked during the prior7 consecutive days, but had been available for work and had madespecific efforts to find a job within the past 4 weeks.2Unemployment compensation claimants were those who were eligiblefor benefit payments under one or more state or federalunemployment compensation programs and had not exhausted benefitrights.
The largest change occurred among the unemployed, whoconstituted on average 74 percent of CETA participants in FY 1980,increased to 80 percent in FY 1982, then decreased to 72 percentunder JTPA. While the percentage of unemployed under JTPArepresents a decline from the latest CETA data, it correspondsapproximately to the percentage served under CETA in FY 1980.
Of participants who were unemployed, the proportion receivingunemployment compensation at the time they applied for the programwas a small, but increasing percentage. For additional details,see table 2.2.
UnemployedUnemployment
compensationclaimant
Table 2.2
Comparison of Employment Status
Mean percent of participantsCETA CETA JTPAFY 1980 FY 1982 TY 1984
74
6
80 72
7 9
2Under CETA, Labor's definition of unemployed was more preciseand provided specific guidance as to who should be included inthis category. For example, a person in a hospital or prisonwas considered unemployed. Under JTPA, such a person would notbe considered unemployed.
11
23

DECLINE IN YOUTH SERVED STOPPED UNDER JTPA
Petween FYs 1980 and 1982, the average percentage of youthsserved by CETA decreased from 46 to 39 percent in the 148 SDP.s.Under JTPA, this decline stopped with youth representing anaverage of 40 percent of those served.
A separate employment and training program fo: disadvantagedyouth (age 14 through 21) was provided under title IV A of CETA,but not under JTPA (other than a summer youth program). JTPA did,however, provide that 40 percent of title II A funds be spent onyouth. Determining if this provision was met was not within thescope of our work; but according to Labor data, 38 percent ofTY 1984 expenditures were for youth.
The average of 40 percent youth served under JTPA comparesfavorably with the reported incidence of youth (19 percent) in thetotal title II A-eligible population, reported in a WestatCorporation study. A Labor internal report also concluded thatthe percentage of youth in CETA title II B and C in FY 1980 andFY 1981 was higher than the percentage of disadvantaged youth inthe eligible population.
FOR OTHER CHARACTERISTICS COMPARED, LITTLE CHANGE
Comparisons of the remaining characteristics (sex, race,welfare and single-parent status, and handicap) we consideredshowed relatively little change over the 3 time periods (seetables 2.3 and 2.4). Only changes in the mean percentage offemales and nonwhites were statistically significant (i.e.,observed changes had only a 5-percent probability of being duejust to chance variation from year tc; year), but these weresmall--2 percent or less.
FemaleNonwhite
Table 2.3
Comparison of Female andNonwhite Characteristics
Mean percent of_participantsCETA CETA JTPA
FY 1980 FY 1982 TY 1984
5349
51 51
50 48
Other changes in characteristics were not statisticallysignificant. The percentage of handicapped and single-parentenrollees in the programs remained fairly constant over time, asdid the percentage of welfare recipients. Concerning the latter,
12
24

we distinguished between recipients of Aid to Families withDependent Children (AFDC) and recipients of any public assistance,including but not limited to AFDC.
Table 2.4
Comparison of Welfare Recipient, Handicapped,and Sin le Parent Characteristics
Mean percent of participantsCETA CETA JTPA
Welfare recipient:
FY 1980 FY 1982 TY 1984
AFDC 23 22 23
Any public assistance 29 31 33
Handicapped 10 10 9
Single parent 20 22 22
JTPA emphasizes training to public assistance recipients.First, the act requires those receiving AFDC who are required toregister for employmentrelated services to be served inproportion to their incidence in the population. Second, the actstates that one measure of program performance is the reduction inwelfare dependency. In establishing performance standards, Labordesigned a separate standard for adult welfare recipients enteringemployment. Labor defined welfare to include other forms ofpublic assistance as well as AFDC, namely, state or locally fundedgeneral assistance and refugee assistance.
13
25

CHAPTER 3
LITTLE USE MADE OF WAIVERS FOR
PARTICIPANT SUPPORT LIMITATIONS
Although limited in the amount of title II A fundsavailable for participant support, SDAs may seek vdivers fromtheir governors to exceed such limitations. Few SDAs exercisedthis option during the transition year and first full programyear, however. SDAs that did receive waivers spent a higherpercentage of their title II A funds on participant support andprovided larger amounts of cash assistance to more participantsthan did SDAs that did not request or receive waivers. Bothcategories of SDAs, however, provided similar kinds of services.
WAIVERS ON SUPPORT LIMITATIONSAVAILABLE TO SDAs
SDAs may exceed the 30 percent combined limitation foradministrative costs anri participant support if (1) the PICinitiates a waiver request, (2) the need for and the amount ofexcess expenditures are stated in the SDA's job training plan,(3) the support services to be provided do not duplicateservices available without cost from any Aber source, (4) theneed for a waiver is not due to excess :Aninistrative costs, and(5) the excess costs are due to one or more of the following:
--The unemployment rate exceeds the national average by atleast 3 percentage points, and the ratio of currentprivate employment to population is less than thenational average,
--The SDA plans to serve a disproportionately high numberof participants from groups requiring exceptionalsupportive service costs (such as handicapped individualsand single heads of households with dependent children),
--The cost of providing necessary child care exceeds halfthe costs allowed for participant support,
--The cost of providing necessary transportation exceedsone-third of the costs allowed for participant support,or
--A substantial portion of the participants in the SDA'sprograms are in training programs lasting 9 months ormore.
If the SDA meets the above conditions, the governor mustwaive the limitation on participant support.
14
26

FEW WAIVERS REQUESTED, FEW DENIED
Of the 544 SDAs responding to our questionnaire, only 39(7 percent) requested a waiver of the support limitations forthe transition year; fewer, 32 (6 percent), requested a waiverfor PY 1984. All SDAs requesting waivers cited at least one ofthe reasons specified in the act as justification for theirrequests.
Only two waiver requests were denied for the transitionyear and two for PY 1984, all apparently for legitimatereasons. The basis for these SDA waiver requests and thereasons given by states for not approving them are outlined intable 3.1. (We designate the requesting SDAs as A, B, and C;two of the requests came from one SDA.)
Period of request
SDA TY 84 PY 84
Table 3.1
Reasons for Denial of Waivers
Basis of request
A X 1) High unemployment
B X
C
2) Substantial numberof enrollees inlong training
programs
3) To pay wages toin-school youth inwork experience
X High transportationcosts in one countywithin SDA
X Substantial number ofenrollees requiringexceptional supportservices
Reason for denial
State would not grantwaiver for paying wagesbecause this basis wasnot specified in theregulations.
SDA's transportationcosts, as a whole, didnot exceed one -thirdof SDA's support costsas required by the act.
SDA did not exceednational averages for asignificant segment ofthe groups specified.
Among the SDAs responding to our questionnaire, the mostcommon reasons for not seeking a waiver during the transitionyear and PY 1984 were:
15
27
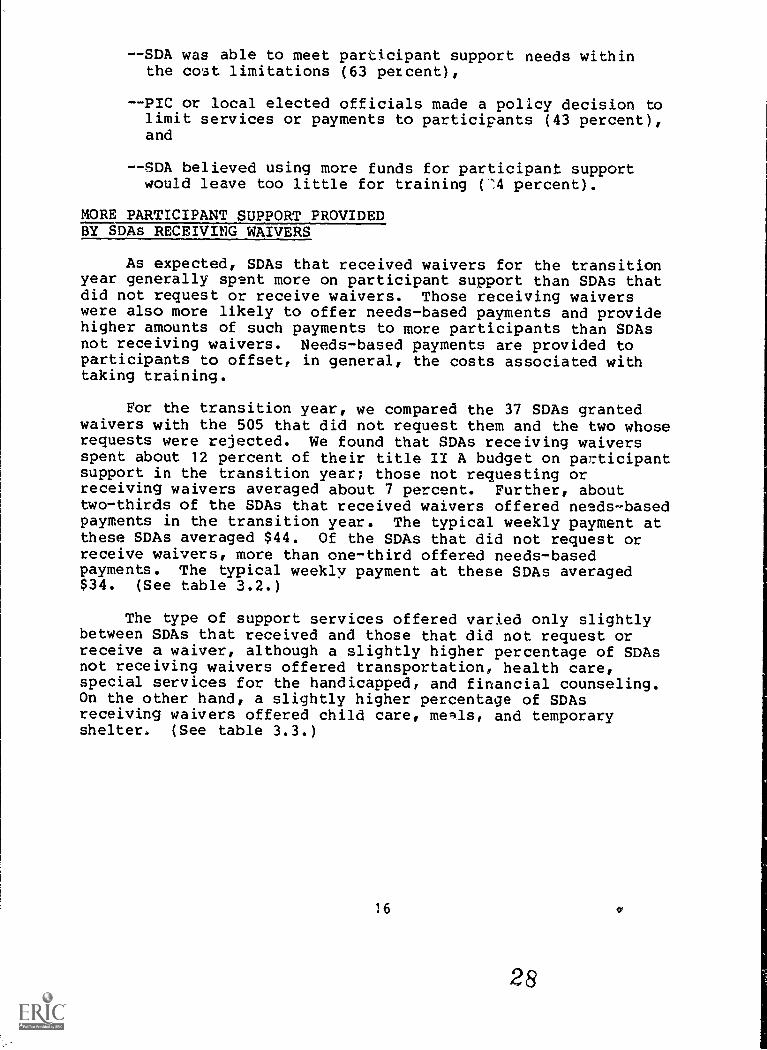
--SDA was able to meet participant support needs withinthe cost limitations (63 percent),
--PIC or local elected officials made a policy decision tolimit services or payments to participants (43 percent),and
--SDA believed using more funds for participant supportwould leave too little for training ("'4 percent).
MORE PARTICIPANT SUPPORT PROVIDEDBY SDAs RECEIVING WAIVERS
As expected, SDAs that received waivers for the transitionyear generally spent more on participant support than SDAs thatdid not request or receive waivers. Those receiving waiverswere also more likely to offer needs-based payments and providehigher amounts of such payments to more participants than SDAsnot receiving waivers. Needs-based payments are provided toparticipants to offset, in general, the costs associated withtaking training.
For the transition year, we compared the 37 SDAs grantedwaivers with the 505 that did not request them and the two whoserequests were rejected. We found that SDAs receiving waiversspent about 12 percent of their title II A budget on participantsupport in the transition year; those not requesting orreceiving waivers averaged about 7 percent. Further, abouttwo-thirds of the SDAs that received waivers offered needs-basedpayments in the transition year. The typical weekly payment atthese SDAs averaged $44. Of the SDAs that did not request orreceive waivers, more than one-third offered needs-basedpayments. The typical weekly payment at these SDAs averaged$34. (See table 3.2.)
The type of support services offered varied only slightlybetween SDAs that received and those that did not request orreceive a waiver, although a slightly higher percentage of SDAsnot receiving waivers offered transportation, health care,special services for the handicapped, and financial counseling.On the other hand, a slightly higher percentage of SDAsreceiving waivers offered child care, meals, and temporaryshelter. (See table 3.3.)
16
28

Table 3.2
Comparison of SDAs ReceivingWaivers With SDAs Not Requesting or
Receiving Waivers
Percent of title II Abudget spent on support
Percent of SDAs offeringneeds-based payments
Percent of enrolleesreceiving payments
Typical weekly payment
SDAs receiving SDAs not requestingwaivers or receiving waivers
12 7
62 39
25 13
$44 $34
Table 3.3
Support Services Offered by SDAs Receiving Waiversand Those Not Requesting or Receiving Waivers
SDAs offering support serviceaReceiving Not requesting orwaivers receiving waiversSupport service
(percent)
Transportation 78 81
Health care 38 40
Special services forthe handicapped 24 28
Financial counseling 27 30
Child care 59 58
Meals 38 32
Temporar _Iter 21 18
aIncludes only those support services offered using title II A
funds.
Although we determined the percentage of SDAs offeringvarious kinds of support services, we did not evaluate theadequacy of the services provided.
17
29

CHAPTER 4
MANY TYPES OF PARTICIPANT SUPPORT PROVIDED
WITHIN FUNDING LIMITATIONS
The Job Training Partnership Act emphasizes using mosttitle II A funds for training, as we have indicated, and limitsthe amount available for participant support. Nonetheless,working within this limitation, most (95 percent) of the SDAsthat answered our questionnaire provided some type of supportto participants to alleviate the expense of attending trainingprograms. The assistance included needs-based payments, childcare, and transportation. We did not determine the extent towhich it satisfied participants' needs for such support.
The amount of assistance provided varied among respondingSDAs, however; over 80 percent spent less than 15 percent oftheir title II A funds on participant support. On average, theresponding SDAs spent 7 percent in the transition year andplanned to spend an average of 8 percent in PY 1984.
SDAs also sought other ways of providing participantsupport. About 60 percent of the SDAs negotiated unfundedagreements with other state and local agencies to furnish suchservices at no cost. Some SDAs also received additional fundsfrom state and local agencies and private industry to provideparticipant support assistance.
PARTICIPANT SUPPORT EXPENDITURESLIMITED BY ACT
In FY 1982, about 80 percent of CETA title II B and C fundswas spent for nontraining costs, including participant supportand administrative costs, and about 20 percent on training. Toensure that most of JTPA's funds would be spent on training, theCongress limited the amount SDAs could spend on administrationand support. Under JTPA, an SDA can spend no more than 15percent of its title II A funds on administrative costs and nomore than 30 percent on a combination of administrative andparticipant support costs. Those SDAs requiring the full 15percent for administrative costs are, in effect, limited to 15percent for participant support costs.
Participant support is intended to enable an individual whootherwise could not afford to attend training to participate ina training program. According to the act, support costs caninclude
18
30

--100 percent of costs for such serv!cec as child care,transportation, health care, meals, temporary shelter,special handicapped services, financial counseling, andother services without which eligible persons could notparticipate;
--100 percent of all needs-based payments necessary forparticipation determined under locally developed formulasor procedures;
- -50 percent of the costs of work experience programsmeeting requirements specified by the act;1 and
- -100 percent of the costs of any other work experienceprograms. (None of these costs are considered trainingcosts and must be charged against the support costlimitation.)
SDA SPENDING FOR PARTICIPANTSUPPORT LESS THAN ACT ALLOWS
Of the 461 SDAs that provided information on the amountthey spent for participant support, 386 spent less than 15percent of their JTPA funds for such assistance during theinitial 9 months of the program. About two-thirds of the 461spent less than 10 percent. Overall, the responding SDAs spentan average of 7 percent of their funds on support assistanceduring this time; their expenditures ranged from 0 to 31percent. At the extreme ends of this range, 75 SDAs spent atleast 15 percent of their funds on participant support and35 SDAs spent none. Of the 35, however, 14 were providing somesupport assistance through unfunded agreements with state,local, or community-based agencies.
Questionnaire responses indicated that SDAs planned tochange their level of expenditures for participant supportduring PY 1984. Overall, 441 SDAs were planning to increasetheir expenditures to an average of 8 percent. For example,113 SDAs were planning to spend 15 percent or more onparticipant support, but 42 were budgeting no funds for it.Figure 4.1 shows the percent of funds SWAs spent and planned tospend for participant support.
1Such programs must last not more than 6 months, be combinedwith a classroom or other training program, specify thatparticipants cannot reenroll in work experience, specify thetraining component in a preemployment training contract or meetestablished academic standards, and pay wages not in excess ofthe prevailing entry-level wage for the same occupation in thesame labor market area.
19
31

Figure 4.1: Percent of Funds forParticipant Support
Percent of 11A Funds
15.0+% d
10.0-141%
5.040% L
0.044%
0 20 40 60 SO 100 120 140 140 110 200
Number of Respondents
Ty .84 060
PY 84 (439)
MOST SDAs PROVIDING PARTICIPANT SUPPORT
We found that over 95 percent of the 541 SDAs responding toa question on support services were providing specific supportservices, and some SDAs also were providing needs-based paymentsto participants. We did not attempt to determine the extent towhich participant support cervices were needed or thesufficiency of the support being provided at individual SDAs.
Various support services provided
SDAs responding to our questionnaire were providing avariety of support services including transportation, healthcare, special services for the handicapped, child care, meals,temporary shelter, and financial counseling. As table 4.1shows, the support services most commonly provided by the 541SDA respondents during the transition year were transportationand child care.
Table 4.1
Major Support Services Provided
Number PercentService of SDAs of SDAs
Transportation 462 65Child care 418 77Special services forhandicapped 310 57
Health care 289 53Financial counseling 231 43Meals 223 41
Temporary shelter 182 34
20
32

SDAs used various methods to provide support services, asshown in table 4.2. Of 541 SDAs responding to a question on howthey provided support services in the transition year, 64percent provided cash to participants to pay for a specificservice, 60 percent had entered into unfunded agreements withstate, local, or community-based organizations, and 55 percentpaid the service provider.
Table 4.2
How SDAs Provide Support Services
SDAsaTY 1984 PY 1984
Method Number Percent Number Percent
Provide cash to pay forservice 345 63.9 353 65.4
Perform service directly 162 30.0 160 29.7Pay vendor 298 55.2 305 56.6Award training contracts
that include service 145 26.9 150 27.8
Unfunded agreements 322 59.6 322 59.7
aBased on 541 SDAs in TY 1984 and 539 in PY 1984. Of theseSDAs, 221 in TY 1984 and 244 in PY 1984 also provided orplanned to provide needs-based payments to enrollees.
Needs -based paymentsgiven by some SDAs
Of 544 SDAs responding to our questionnaire, about 40percent provided needs-based payments to participants during thetransition year. These SDAs provided needs-based payments to anaverage of 37 percent of their participants. The percentage ofparticipants receiving needs-based payments at individual SDAsranged from 1 (one SDA) to 100 percent (two SDAs). Figure 4.2shows the percentage range of such participants for respondingSDAs.
In our questionnaire, we also asked for information on whowas eligible to receive these payments, the size of the paymentsprovided, and factors affecting the size of the payments, asdiscussed below.
21
33

Figure 4.2: Percent of JTPA Enrollees gansignmemairmisgassexasemor INEMMIENwho Received Needs-Based PaymentsIn TM to Number of Respondents
so
1.20% 21-40% 41.10% 5140% 51-100%
Note. Percentege based on 197 of the 220 SDAs that provided needsbased payments
Eligibility criteria for needs-based payments
According to our questionnaire responses, 92 SDAs2 (about43 percent) had no ^ligibility criteria for needs-based paymentsbeyond being eligible for JTPA training. Ninety-eight SDAs(about 45 percent) stipulated a monthly income limit that couldnot be exceeded by participants or their families in order toreceive needs-based payments. These limits rangedsignificantly. For example, an SDA in Pennsylvania would notprovide needs-based payments to a participant whose totalmonthly income exceeded $87, while an SDA in Wisconsin woulddeny such payments to a participant whose monthly incomeexceeded $312. Similarly, an SDA in Oregon set a limit on totalfamily income at $120 per month and an SDA in Ohio at $891 permonth.
2Our questionnaire was divided into four major sections coveringrespectively waivers, needs-basc.3 payments, support services,and the opinions of PIC and SDA officials about the impact ofthe JTPA legislation. Only SDAs providing needs-based paymentsresponded to the section dealing with such payments. Of the544 SDAs responding to the questionnaire, 220 completed thissection for the transition year.
22
34

Other SDAs considered one or more of several factors asneeds-based criteria. Some SDAs identified certain types offinancial assistance which, if received, would make theparticipant ineligible to receive needs-based payments. Forexample, more than a third denied needs-based payments toparticipants receiving unemployment compensation or AFDC. Asummary of other disqualifying assistance is shown in table 4.3.
Table 4.3
Types of Assistance ThatDisqualified Participants FromReceiving Needs-Based Payments
Percent ofType of assistance SDAsa
Unemployment compensation 36
Aid to Families with DependentChildren 35
State/local general assistance 27
Food stamps 3
Other (such as Pell grants,b socialsecurity payments, and veterans'payments) 22
aBased on 216 SDAs responding to this question for thetransition year.
bPell grants provide financial aid to needy undergraduatestudents. Grants range from $150 to $1,750, depending onschool costs and family income.
In addition, SDAs identified several JTPA program activities inwhich participants were ineligible to receive needs-basedpayments. As table 4.4 shows, most SDAs would not providepayments to participants enrolled in on-the-job training (OJT)or work experience programs. Conversely, no SDA prohibitedparticipants enrolled in classroom training for occupationalskills from receiving such payments.
23
35
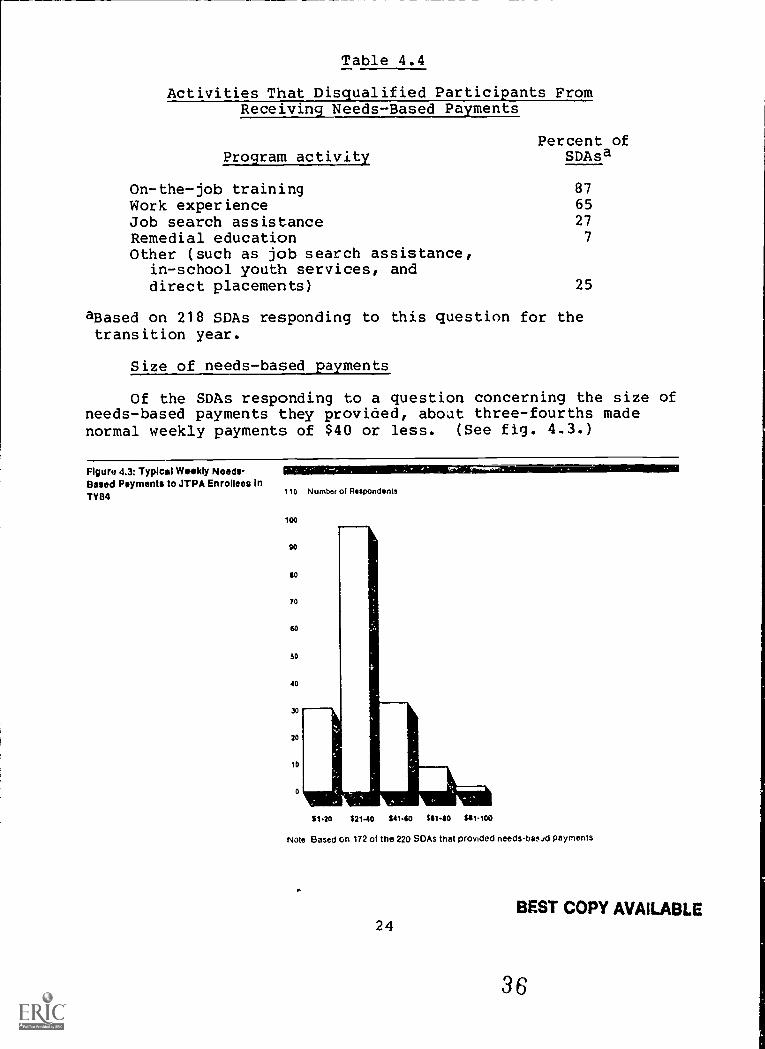
Table 4.4
Activities That Disqualified Participants FromReceiving Needs-Based Payments
Program activityPercent of
SDAsa
On-the-job training 87
Work experience 65Job search assistance 27
Remedial education 7
Other (such as job search assistance,in-school youth services, anddirect placements) 25
aBased on 218 SDAs responding to this question for thetransition year.
Size of needs-based payments
Of the SDAS responding to a question concerning the size ofneeds-based payments they provided, about three-fourths madenormal weekly payments of $40 or less. (See fig. 4.3.)
Figure 4.3: Typical Weekly Needs-Based Payments to JTPA Enrollees InTY84
110 Number of Respondents
100
90
so
70
ea
.50
40
91.20 92140 so-so see -so 111.1clo
Note Based on 172 of the 220 SDAs that provided needs-bas.sd payments
24BEST COPY AVAILABLE
36

In our questionnaire, we asked SDAs providing participantswith needs-based payments to indicate their largest, smallest,and typical weekly payments during the transicion year.Although the typical weekly payment reported averaged $34,weekly payments varied from $1 (two SDAs) to $300 (one SDA).Many factors were considered by SDAs in determining the size ofpayments paid to participants. The most common were the numberof dependents or household size and the number of hours spent intraining. For example, one SDA in Massachusetts paid eligibleparticipants $30 a week plus $5 for each dependent, regardlessof the time spent in training, while an SDA in Louisiana paideligible participants $.50 for each hour spent in training.Other factors considered when determining the amountparticipants receive for needs-based payments are shown intable 4.5.
Table 4.5
Factors Considered in DeterminingAmount of Needs-Based Payments
FactorPercent of
SDAsa
Number of hours in training 43Number of dependents or household size 43Distance from training location 28Total family/participant income 27Family/participant public assistancepayments 27
Type of program activity 22Child care costs 20Food stamps received by family/participant 15Other (e.g., Pell grants and scholarships,housing costs, and individual need) 27
aBased on 219 SDAs responding to this question for thetransition year. 4.
SDAs PROVIDING PARTICIPANTSUPPORT THROUGH ALTERNATIVE SOURCES
Some SDAs have provided participant support servicesthrough alternative means, supplementing their title II A fundsby entering into agreements with other agencies or seeking fundsfrom other sources.
Of the SDAs responding to our questionnaire, 60 percent(322) indicated that they entered into at least one unfundedagreement with another agency to provide participant support.
25
6
37

Such agreements--with goverent and community-based agencies(e.g., United Way of America)--were, for the most part, for aspecific service. For example, an SDA in Massachusetts hadunfunded agreements with the State Department of Public Welfareand the Department of Social Services to provide child careservices to JTPA participants.
Some SDAs also received non-JTPA funding for participantsupport. Of 538 SDAs responding to our question on additionalfunding, 25 (5 percent) said they received funds from othersources for participant support in the transition year, whiletwice as many received, or expected to receive, such additionalfunds in PY 1984. Sources of these funds included statedepartments of social services, public welfare, employment andtraining, health, and education; city and county governments;and private industry. The amounts varied greatly. For example:
--A California SDA received $5 million of county generalfunds for the transition year to provide such services astransportation, housing, and meals. The SDA received nomoney from the county to provide such services in PY1984.
--A New York SDA received $538,000 from the StateDepartment of Social Services to pay for transportationand meals for the transition year. The 3DA expected toreceive only $77,000 from this agency in PY 1984. Thesewere federal funds the state had received from theDepartment of Health and Human Services under title XX ofthe Social Security Act.
--A Virginia SDA received $449,000 for the transition yearand expected to receive $355,000 in PY 1984 from theState Department of Social Services to provide variousrefugee assistance services. These were federal fundsthe state had received from the Department of Health andHuman Services (Office of Refugee Resettlement, SocialSecurity Administration).
--A Hawaii SDA received $300 from the State Department ofSocial Services and Housing for PY 1984 to providephysical examinations.
Similarly, the state of Maryland passed legislation allocatingstate general funds to be distributed to the state's 10 SDAs tosupplement funds available for providing needs-based paym-mts toparticipants. Maryland SDAs received $2 million in PY 1984 andwill receive another $2 million in PY 1985.
26
38

CHAPTER 5
IMPACT OF PARTICIPANT SUPPORT LIMITATIONS:
VIEWS OF SDA ADMINISTRATORS AND PIC REPRESENTATIVES
In our questionnaire, we asked SDA officials their opinionsconcerning the impact of the participant support limitations onthe persons served and training provided under JTPA. Wecategorized the responses by SDA administrators and PICrepresentatives. Although the number of respondents to each ofour six questions (listed in app. II) varied slightly, about450 SDA administrators and 80 PIC representatives responded.Generally, there was little difference between the responses ofthe two groups. The respondents indicated that, because of theparticipant support limitations,
--they made greater use of alternative resources to providesupport services,
--they thought that individuals served under JTPA were likelyto be less disadvantaged than those served under CETA,
--they believed that individuals served under JTPA were moremotivated than those served under CETA,
--the training programs they offered were shorter than theSDA officials believed they should have been, and
--they could not offer some training programs.
About 55 percent of the SDA administrators and 45 percent ofthe PIC representatives indicated that, in their opinion, theparticipant support limitations had d negative impact on the SDAs'ability to meet the objectives of JTPA. On the other hand, about25 percent of the SDA administrators and 27 percent of the PICrepresentatives indicated the participant support limitations hada positive impact. The remaining respondents felt there wasneither a positive nor a negative impact, overall.
USE OF ALTERNATIVE RESOURCES
We asked SDA officials whether the participant supportlimitations prompted them to make greater use of alternativeresources for providing support services. As shown in table 5.1,slightly more than half of the SDA administrators and PICrepresentatives responding agreed that they did.
27
39
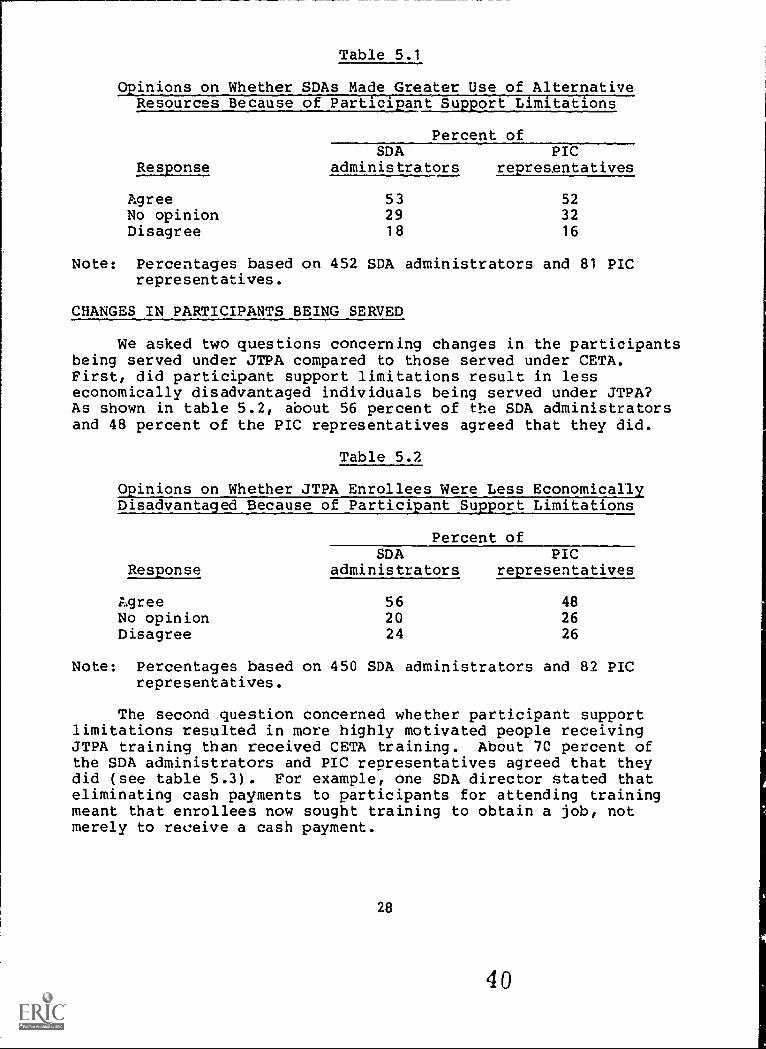
Table 5.1
Opinions on Whether SDAs Made Greater Use of AlternativeResources Because of Participant Support Limitations
Percent ofSDA PIC
Response administrators representatives
Agree 53 52No opinion 29 32Disagree 18 16
Note: Percentages based on 452 SDA administrators and 81 PICrepresentatives.
CHANGES IN PARTICIPANTS BEING SERVED
We asked two questions concerning changes in the participantsbeing served under JTPA compared to those served under CETA.First, did participant support limitations result in lesseconomically disadvantaged individuals being served under JTPA?As shown in table 5.2, about 56 percent of the SDA administratorsand 48 percent of the PIC representatives agreed that they did.
Table 5.2
Opinions on Whether JTPA Enrollees Were Less Economical)Disadvantaged Because of Participant Support Limitations
Response
Percent ofSDA PIC
administrators representatives
Agree 56 48No opinion 20 26Disagree 24 26
Note: Percentages based on 450 SDA administrators and 82 PICrepresentatives.
The second question concerned whether participant supportlimitations resulted in more highly motivated people receivingJTPA training than received CETA training. About 7C percent ofthe SDA administrators and PIC representatives agreed that theydid (see table 5.3). For example, one SDA director stated thateliminating cash payments to participants for attending trainingmeant that enrollees now sought training to obtain a job, notmerely to receive a cash payment.
28
40

Table 5.3
Opinions on Whether JTPA Enrollees Were More MotivatedBecause of Participant Support Limitations
Percent ofSDA PIC
Response administrators representatives
Agree 70 72No opinion 12 13
Disagree 18 15
Note: Percentages based on 454 SDA administrators and 82 PICrepresentatives.
CHANGES IN TRAINING PROGrAMS
We also asked two questions dealing with changes in trainingprograms. The first focused on whether SDAs had to offer trainingprograms that were shorter than they should be because of theparticipant support limitations. About 57 percent of the SDAadministrators and about 45 percent of the PIC representativesagreed that, as a result of the limitations, this was the case.For example, a California SDA official said that SDA reduced thelength of classroom training from 6 to 3 months because manyparticipants could not afford to attend for the longer period.
Table 5.4
Opinions on Whether SDAs Made Training Programs ShorterThan They Should Be Due to Participant Support Limitations
Percent ofSDA PIC
Response administrators representatives
Agree 55 48No opinion 21 20Disagree 24 32
Note: Percentages based on 451 SDA administrators and 82 PICrepresentatives.
Our second question asked if the participant supportlimitations prevented SDAs from offering certain trainingprograms. This question produced the greatest variance betweenSDA administrators and PIC representatives, and resulted in theonly difference that was statistically significant (i.e., lessthan a 5-percent probability that the difference was due to
29
41

chaace) . As shown in table 5.5, about 58 percent of the SDAadministrators and 39 percent of the PIC representatives believedthe support limitations prevented them from offering some trainingprograms they would have liked to offer. For example, aMassachusetts SDA official indicated that, because of thelimitations, the SDA could not offer a needed work experienceprogram. An Illinois SDA official, on the other hand, noted thatthe SDA had to curtail programs at community colleges becauseparticipants could not afford to attend yearlong trainingprograms.
Table 5.5
Opinions on Whether Participant Support LimitationsPrevented SDAs From Offering Certain Training Programs
Percent ofSDA PIC
Response administrators representatives
Agree 58 39No opinion 20 26Disagree 22 35
Note: Percentages based on 449 SDA administrators and 82 PICrepresentatives.
OVERALL IMPACT
Finally, we asked SDA officials to assess the overall impactof the limitations on the SDAs' ability to meet JTPA objectives(see table 5.6 for results). About 55 percent of the SDAadministrators and 45 percent of the PIC representatives believedthat the overall impact of the limitations had been negative. Onthe other hand, about 25 percent of the SDA administrators and 27percent of the PIC representatives believed the overall impact hadbeen positive. The remaining respondents, 20 percent of the SDAadministrators and 28 percent of the PIC representatives, believedthe limitations had no overall impact.
30
42
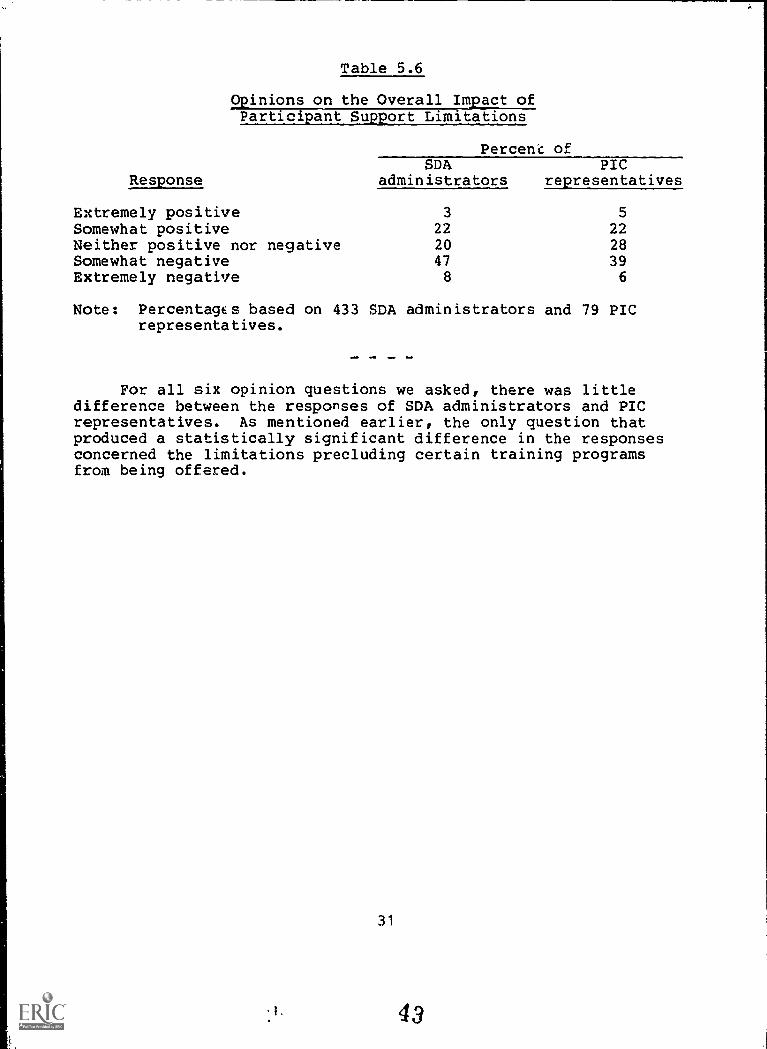
Table 5.6
Opinions on the Overall Impact ofParticipant Support Limitations
Percent of
ResponseSDA
administratorsPIC
representatives
Extremely positive 3 5
Somewhat positive 22 22Neither positive nor negative 20 28Somewhat negative 47 39Extremely negative 8 6
Note: Percentages based on 433 SDA administrators and 79 PICrepresentatives.
mow
For all six opinion questions we asked, there was littledifference between the responses of SDA administrators and PICrepresentatives. As mentioned earlier, the only question thatproduced a statistically significant difference in the responsesconcerned the limitations precluding certain training programsfrom being offered.
31
43

CHAPTER 6
CHANGES IN TRAINING
BETWEEN CETA AND JTPA
Both CETA and JTPA offered participants a variety oftraining, including classroom training, on-the-job training, andwork experience. The 11 SDAs we visited offered a variety ofthese types of training under CETA, with varying levels ofenrollee participation. Under JTPA, however, the trainingoffered and levels of enrollee participation generally changed.We noted that participation in OJT training increased underJTPA, whereas work experience participation decreased. Thereasons cited by SDA officials for the shifts varied.
The most common reason for using more OJT was that thistype of training was more likely to result in employment. Wealso noted a slight decrease in the length of training offeredunder JTPA. These results are based on a limited judgmentalsample of SDAs and are not in themselves representative of SDAsnationwide, yet they are similar to the finding of other studiesbased on a greater number of SDAs. We visited these SDAsbecause detailed information on differences in the type andlength of training between CETA and JTPA was available only atthe local level.
TRAINING AT SDAs VARIED
The SDAs we visited offered a variety of training withvarying levels of participation under both CETA and JTPA. Thistraining included:
--Occupational classroom training, which teaches technicalskills required for such specific jobs as clerk-typist,medical assistant, and food service worker.
--Other classroom training, which includes adult basiceducation, general education, and job-readiness orpreemployment training. Th.s method focuses on improvingbasic skills or teaching English as a second language.
--On-the-job training, which encompasses participants beinghired by an employer who provides training for suchparticular occupations as machine operator, securityguard, or welder. On-the-job training contractsgenerally subsidize as much as 50 percent of anemployer's training costs for program participants.
32
44

--Work experience, which provides short-term or part-timework assignments designed to develop good work habits andbasic work skills.
In addition, under JTPA, seven of the SDAs we visited offeredexemplary youth programs authorized by the act, includingeducation for employment, preemployment skills training, entryemployment experience, and school-to-work transition. Theseprograms include such activities as additional educationalinstruction, job readiness training, job search and placementassistance, and part- or full-time summer employment.
The mix of training provided at the 11 SDAs under JTPAchanged from that under CETA (see table 6.1). For example, someof the SDAs provided occupational and nonoccupational classroomtraining, OJT, and work experience under CETA and continued todo so under JTPA; other SDAs either dropped or added one or twotypes of training.
Table 6.1
Training Offered at the SDAs Visited
Number of SDAs offering trainingTraining CETA FY 19824 JTPA TY 1984
Occupational classroomtraining 11 11
Other classroom training 8 6OJT 8 11
Work experience 10 7Exemplary youth N/Ab 7
aIncludes training offered only under CETA title II B and C.
bNot offered under CETA.
As shown in table 6.2, during JTPA's transition year, thetotal number of participants enrolling in OJT at these SDAssignificantly increased from the number enrolled under CETA inFY 1982. On the other hand, the total number of JTPAparticipants enrolling in occupational classroom training, otherclassroom training, and work experience decreased.
33
45

Table 6.2
Trainin Enrollment at the SDAs Visited
TrainingNumber of_participants
Percentincrease(decrease)CETA FY 1982a JTPA TY 1084b
Occupational classroomtraining 5,210 4,390 (16)
Other classroomtraining 2,647 940 (64)
OJT 1,214 3,815 214
Work experience 3,820 1,312 (66)
Exemplary youth N/Ac 2,912 -
aIncludes only CETA title II B and .7 participants.
bEnrollment for the 9-month transition year has been projectedto a 12-month period for comparison purposes.
cExemplary youth programs were not offered under CETA.
SHIFTS IN OJT AND WORE EXPERIENCE UNDER JTPA
Our work showed that significant shifts occurred in theparticipant enrollment in OJT and work experience programs underJTPA when compared with CETA. For the most part, OJT increasedand work experience decreased. For occupational and otherclassroom training, there was no consistent pattern of changeamong the 11 SDAs.
At five SDAs, we found that few participants were enrolledin OJT under CETA, whereas OJT either started or increased underJTPA. The percentage of OJT participants under JTPA increasedat all 11 SDAs and the number of participants increased by 214percent. Figure 6.1 shows OJT enrollment under CETA and JTPA atthese SDAs.
34
46

Figure 8.1:Percent of OJT Participants at 11 SDAs In CETA FY82 and JTPA TY84
70 Percent of Participants
$0
50
40
30
20
10
A e C 0 E F a
Service Delivery Area
CETA
JTPA
On the other hand, six SDAs we visited had participants inwork experience programs under CETA, but few participantsreceived such training under JTPA. Three of these SDAscompletely discontinued work experience. Again, under JTPA, thepercentage of work experience participants decreased at all11 SDAs and the number of participants decreased by 66 percent.As noted earlier, the Congress emphasized that most of JTPA'sfunds should be spent on direct training activities and that alimitation should be placed on funds spent for nontrainingpurposes, including participant support costs. As part of thisemphasis, JTPA requires that 50 or 100 percent of the cost ofwork experience programs, depending on the type of program, becharged to participant support. However, SDAs requiring a full15 percent for administrative costs are, in effect, limited to15 percent for support costs. This may account, in part, forthe shift away from the use of work experience.
But the cost of exemplary youth programs may be chargedentirely to training. One of these programs, entry employmentexperience, provides work assignments similar to work experienceunder CETA. We noted that seven SDAs that reduced or eliminatedwork experience under JTPA provided exemplary youth programs.FigUre 6,2 shows work experience enrollment under CETA and JTPAat these SDAs.
35
BEST COPY AVAILABLE
4',

IMENIMMININIIIIMINIMENNE7Figure 6.2:Percont of Work Experience Participants at 11 SDAs In CETA FY82 and JTPA TY84
90 Percent of Partic.pants
$0
70
10
50
40
30
20
10
04.A
Service Delivery Area
1111111.I-1MA
JTPA
The reasons for the changes in training varied among theseSDAs. Directors at four SDAs increased OJT because they believeOJT is more likely to result in unsubsidized employment. OtherSDA directors cited various reasons for increasing the use ofOJT, such as its being more acceptable to area employers or morecost effective, or providing needed wages to participants. OneSDA director also noted that the limitation on participantsupport costs necessitated a shift away from work experience;another noted that long-term classroom training was not feasiblefor participants without a source of income.
SHORTER TRAINING UNDER JTPA
We compared the length of occupational training, both inthe classroom and on-the-job, during the first 9 months of JTPAwith CETA FY 1982 at all 11 SDAs. We found that bothoccupational training and OJT were on average slightly shorterunder JTPA than under CETA.
Occupational classroom training under JTPA averaged 22weeks at these SDAs, while during CETA FY 1982 at the same SDAsthis training averaged 23 weeks. Similarly, the average lengthof OJT under JTPA was 17 weeks compared to 19 weeks during CETAFY 1982.
36
48

SIMILAR RESULTS IN OTHER STUDIES
Other organizations, including Grinker, Walker andAssociates, NAB, and Westat Incorporated, have studied theimplementation of JTPA. Each included an analysis of trainingactivities in its studies. Generally, they found that OJT hasbeen used more and work experience less under JTPA than underCETA.
NAB estimated that 18 percent of the enrollees in JTPA werein OJT, compared to 13 percent under CETA during FY 1982, whileonly 6 percent were in work experience, compared to 30 percentunder CETA. Similarly, Westat estimated that slightly more than20 percent of enrollees in JTPA were in OJT compared to 15percent in FY 1979 and 19 percent in FY 1980 under CETA. TheGrinker, Walker and Associates study noted that OJT received amajor increase in its share of overall funding in 72 percent oftheir sample SDAs and some increase in 16 percent, with no sitedecreasing OJT. The study also noted that, although a few SDAskept work experience as a major training component, the generalpattern was either no work experience or a small work experiencecomponent for youth or other special groups.
All three studies noted that the length of training underJTPA was shorter than under CETA.
37
49

CHAPTER 7
SUMMARY, CONCLUSION, AND AGENCY COMMENTS
SUMMARY
Comparing the type of individuals served under JTPA withthose served under CETA and the type of training provided underboth programs, we found that some changes have occurred. JTPAis serving a clientele that is better educated than CETAparticipants and more likely to be enrolled in OJT. The causeof such changes is unclear. Nevertheless, we believe that thelimitation placed on participant support costs under JTPA wasnot the primary factor contributing to the changes in the typeof individual served during the first 9 months of the program.The shift away from work experience that we noted may have beencaused by the support cost limitations, since 50 or 100 percentof the cost of work experience programs, depending on the typeof program, must be charged to participant support, which islimited under title II A.
Changes in characteristics
We compared 12 characteristics of enrollees in title II Aof JTPA during the first 9 months of that program with those intitle II B and C of CETA in fiscal year 1982. We made ourcomparison for all enrollees in 148 SDAs that kept the samegeographic boundaries as former CETA prime sponsors between 1980and 1984. Compared to CETA, JTPA served higher percentages ofhigh school graduates (62 to 60), students (15 to 12), andunemployment compensation claimant., (9 to 7) and lowerpercentages of school dropouts (23 to 29), unemployed (72 to80), and nonwhite (48 to 50). While these are, for the mostpart, slight differences, they are statistically significant(i.e., there is less than a 5-percent probability that thedifference is due to chance). The data on characteristics ofJTPA participants in our analysis were similar to nationalestimates of characteristics developed in Labor's nationallongitudinal study.
Changes in training
Because detailed information on differences in the type andlength of training between CETA and JTPA was available only atthe local level, we visited a judgmental sample of 11 SDAs.Participation in OJT increased under JTPA at these locations, wenoted, and participation in work experience declined.Furthermore, we noted a slight decrease in the length oftraining offered under JTPA. While these findings are base' ona limited sample of SDAs, which is not representative of SDAs
38
50

nationwide, they are similar to the results of studies (based ongreater numbers of SDAs) by Grinker, Walker and Associates, theNational Alliance of Business, and Westat Incorporated.
CONCLUSION
While we noted the above changes between CETA and JTPAprograms, we were unable to determine their specific cause.Several significant differences exist between CETA and JTPA,including the limitation on support costs, which could havecontributed to the changes. It did not appear, however, thatthe limitation on support costs was a major factor.
First, SDAs that requested waivers to the limitationsgenerally received them, as we discussed in chapter 3. Few,however, requested them. Moreover, as discussed in chapter 4,SDAs responding to our questionnaire spent an average of7 percent of their funds for support costs, less than half ofthe 15 percent minim= available. In addition, SDA officialsstated that, for the most part, they increased OJT because itwas more costeffective and likely to result in employment thanother types of training (see ch. 6). While SDA officialsresponding to our questionnaire (see ch. 5) believed thelimitation on support costs had some impact on the type ofindividual served and the training provided, they did notprovide us with data to support this opinion.
Because SDAs chose to spend less than half of the fundsavailable on support costs and generally chose not to seekwaivers on the cost limitations, we believe the changes thathave occurred were due more to the way SDAs are implementingtheir program than to the act's limitation on support costs. Werecognize that our conclusion is based on the first 9 months ofoperation under JTPA. The extent to which the limitation maybecome a constraint in the future will depend in large part onthe type of programs SDAs develop as well as their willingnessto seek waivers, if needed.
AGENCY COMMENTS
In their September 4, 1985, comments on a draft copy ofthis report (see app. IV), the Department of Labor stated thatnational data indicate that support cost limitations had nodiscernible impact on the type of person served and type oftraining provided. We found that, although some changes hadoccurred, we could not determine the cause of the changes butthat, as stated above, the support cost limitation did notappear to be a primary factor.
39
51

We agree with Labor's view that, except for education andemployment status, participant characteristics under JTPA weresybstantially the same as under CETA. We disagree, however,that recent data indicate that enrollment of high schoolgraduates is on a downward trend. Labor data for the first 3quarters of program year 1984 indicate that cumulatively thepercentage of high school graduate enrollees (61 percent) issimilar to what we reported for the transition year (62percent). It is too early, we believe, to determine whether ornot there has been a decrease in high school graduate enrollees.
Because the CETA program was changing and many current JTPAelements were being incorporated into it, Labor did not believethat the comparison of JTPA with CETA FY 1982 data wasappropriate. Labor cited three examples of such changes:provision for payment of allowances were revised; PICs took onstronger roles; and public service employment programs underCETA were phased out. These changes, however, would have had nosignificant effect on our comparisons. The first affected only16 loca' programs, 11 of which were not included in ouranalysis. The second change would have minimized anydifferences in participant characteristics between CETA and JTPAbecause the role of PICs under CETA would have been similar tothat under JTPA. The third pertained to a program not includedin our analysis.
We used FY 1982 data in our analysis primarily because itwas the last fiscal year for which comparable CETA title II Band C data were available. In addition, we compared FY .1982 ofCETA with FY 1980 to provide a broader perspective on anychanges that coincided with the program change from CETA toJTPA.
40
52

APPENDIX I APPENDIX
METHODOLOGY USED IN GAO's
COMPARISON OF CHARACTERISTICS
The methodology we used to compare the characteristics ofCETA and JTPA enrollees involved three basic components: the CETAand JTPA programs compared, the locations selected, and thecomparisons made, as discussed below.
PROGFAMS COMPARED
Our analysis compared characteristics of participants in CETAtitle II B and C and JTPA title II A programs. CETA had includedsuch additional programs as demonstration projects targeted toyouths (title IV) and involving private sector participation(title VII), but we considered those to provide a less appropriatecomparison to JTPA activities. JTPA participants might alsoinclude those in summer youth programs (title II B) and programsfor displaced workers (title III), but they too were excluded fromour analysis.
The size of the CETA and JTPA title II A programs nationwideis shown in table I.1. For comparison purposes, data for the JTPAtransition year, which lasted 9 months, are projected to 12months. This annualized number of enrollees represents less thana 2-percent decrease from the number enrolled in CETA title II Band C in fiscal year 1982. Title II B and C, and CETA as a whole,however, had declined in size since FY 1980. The annualizednumber of title II A enrollees in the transition year represents a27-percent decrease from the number of enrollees in CETA title IIB and C in FY 1980.
Table I.1
Total Number of Enrollees in CETA(FY 1980 to FY 1982) an in JTPA TY 984)
YearCETA JTPA
All CETA Title II B and C Title II A
FY 1980 3,325,000 1,121,000 -FY 1981 2,871,000 1,040,000FY 1982 1,874,837 834,515 -TY 1984 - - 615,500TY 1984a - - 820,667a
aProjected to a 12-month period for comparison purposes.
41
53

APPENDIX I APPENDIX I
LOCATIONS SELECTED
In choosing the SDAs for our study, we sought to avoid twopotential problems with inferences we could make:
--To eliminate the possibility that any differences incharacteristics might be due to an SDA's serving adifferent geographic area than the CETA prime sponsor had,we included in our analysis only those SDAs (former primesponsors) that kept the same geographical boundariesbetween 1980 and 1984; and
--To give a more comprehensive picture of enrollees enteringthe programs, we included only SDAs that could provide datafor enrollees rather than just terminees.
Of the 594 SDAs, 197 had the same geographical boundariesfrom 1980 through TY 1984. We were able to obtain enrollee datafor 148 of the 194 that were relevant to this study.1 Table 1.2shows the number of participants enrolled in those SDAs.
Table 1.2
Number of Participants Enrolled inthe 148 SDAs in GAO's Analysis
CETAFY 1980
CETAFY 1982
JTPATY 1984a
Total number of enrollees 340,700 243,264 240,837Average number of enrollees in
an SDA 2,302 1,644 1,627Largest number of enrollees in
an SDA 16,570 17,104 18,152Smallest number of enrollees in
an SDA 304 160 152
aProjected to a 12-month period for comparison purposes.
Because SDAs were not required by Labor to collect data onenrollees, they differed in the data they had collected and couldreport to us. Some features, such as sex, were reported by all148 SDAs; others, such as the number of AFDC recipients, wereavailable from as few as 90 SDAs.
10f the 197, 3 were Rural Concentrated Employment Programs exemptfrom the participant support limitation.
42
54

APPENDIX I APPENDIX I
The characteristics of participants in the SDAs in ouranalysis are similar to national estimates of characteristicsprovided by the "quick turnaround" portion of Labor's Job TrainingLongitudinal Survey (JTLS)4 as shown in table 1.3.
Table 1.3
Selected Characteristics of Enrollees in SDAs inGAO's Analysis and in all SDAs (TY 1984)
Percent of Enrollees
CharacteristicsGAO
analysisaNationalprofileb
5039
FemaleYouth (under age 22)
51
40School dropout 23 24Student (high school or less) 15 14High school graduate 62 62Nonwhite 48 46Receiving AFDC 23 21
aThese percentages, used in our analysis, were calculated asfollows:
Pa = (Pal + Pa2 + Pan)/N
Where Pa = mean percent with a given characteristic,
Pa = percent with a given characteristic,
1 . . . n = each SDA reporting on this characteristic,and
N = number of SDAs reporting data on thischaracteristic.
bSource: JTLS; an estimated percent of all enrollees with thischaracteristic.
2The JTLS has three components. The "quick turnaround" componentcollects data from the administrative records of selected SDAs tosupplement the JTPA Annual Status Re ort. Other componentsprovide longitud nal and impact evaluation data.
43
55

APPENDIX I APPENDIX I
COMPARISONS MADE
Although our analysis included characteristics in FYs 1980,1981, 1982 and TY 1984, our report emphasizes two sets ofcomparisons: (1) JTPA -ersus the last nontransitional year ofCETA (FY 1982), and (2) the previous 2-year period within CETA(FY 1982 versus FY 1980). The within-CETA comparison is includedto provide a broader perspective on any changes in clientcharacteristics that coincided with the program change from CETAto JTPA.
In making the comparisons, we treated the enrollee data weobtained as a one-factor repeated-measures analysis of variancewith multiple comparisons of means. The unit of analysis was thepercentage of enrollees in an SDA with a specific characteristic;observations were repeated for each SDA across four time periods:CETA FYs 1980, 1981, and 1982 and JTPA TY 1984. Any SDA that didnot report data cn a character35tic at any time period waseliminated from the analysis of that characteristic:, Thecomparisons of means used a multiple-stage statistical techniquedeveloped by Ryan, Einot, Gabriel, and Welsch and available in thecomputer software from the SAS Institute, Inc. This procedure wasused to set a .05 confidence level for the total set ofcomparisons of means for a specific client characteristic.
44
56
'NI

APPENDIX II APPENDIX II
QUESIICW ASKED OF SEA OFFICIALS CCKEINING
IMPACT OF SUPECET LIKTATICNS, AND RESECNSES
A. In your opinion, latch, if any, of the following statements describes the changes that haveoccurred as a result of the JTPA restriction on stipends, needs-based payments, and funds forsupportive services? Indicate the extent to which you agree or disagree with each statement.(awric ONE BM FOR EACH MEMENTO
(1) (2) (3) (4) (5)Neither
Strongly Somewhat agree nor Someutet Stronglyagree agree disagree di snuee dt spgree
1. Buse of these restrictions, JTPA 111 143 89 63 44program participants are likely to be 12 27 22 10 11less economically disadvantaged thanwere CEIA participants.
2. As a result of these restrictions, 117 203 55 49 30JTPA serves clients who are more 18 41 11 9 3highly motivated to receive training.
3. The legislative restrictions have 75 166 130 55 26prompted us to make greater use of 21 21 26 8 5alternative resources for providingsupportive services.
4. As a result of these restrictions, 109 139 94 67 42we have had to make training programs 11 28 16 16 11Shorter than they should be.
5. As a result of these restrictions, we 133 128 89 58 41are not able to offer certain training 17 15 21 13 16programs we undid like to offer.
Note: For each entry, the upper number represents SDA administrators' responses and the low=amber, PIC representatives' responses.
45
BEST COPY AVAILABLE
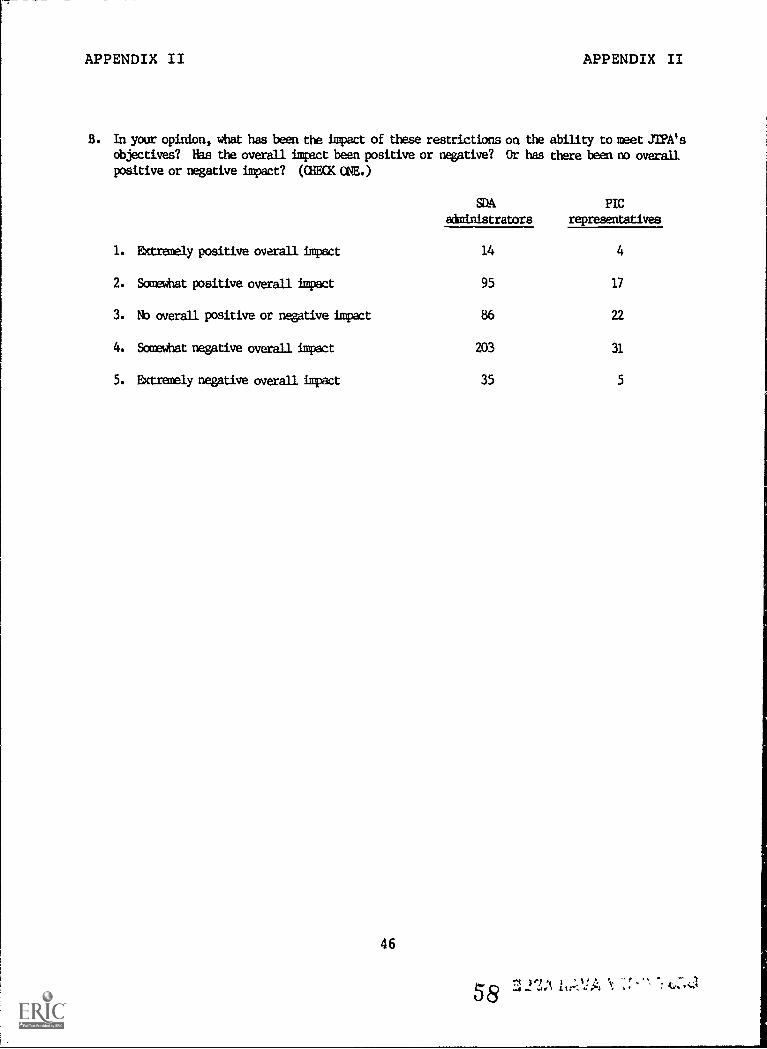
APPENDIX II APPENDIX II
B. In your opinion, what has been the impact of these restrictions on the ability to wet JTPA's
objectives? Has the overall impact been positive
positive or negative impact? (CHECK ME.)
or negative? Or has
9110,
aiministrators
there been no overall
PIC
representatives
1. Extremely positive overall impact 14 4
2. Somewhat positive overall impact 95 17
3. No overall positive or negative impact 86 22
4. Somewhat negative overall impact 203 31
5. Extremely negative overall impart 35 5
46
58

APPENDIX III APPENDIX III
State
California
Florida
Georgia
Massachusetts
Michigan
Ohio
STATES AND SDAS VISITED BY GAO
SDAName
Butte CountyMonterey CountyRichmond City
Lee County
Savannah/Chatham County
Boston CityNorthern Middlesex Consortium
Lansing Tri-CountyRegion II Consortium
Portage CountyToledo Area
47
59
Location
OrovilleSalinasRichmond
Fort Myers
Savannah
BostonLowell
Lansing I.Jackson
RavennaToledo

APPENDIX IV
U.S. Department of Labor
td0 4 1;,;i
ADVANCE COMMENTS FROM
THE DEPARTMENT OF LABOR
AND GAO'S ANALYSIS
Assistant Secretary forEmployment and TrainingWashington, D.C. 20210
Mr. Richard L. FogelDirectorHuman Resources DivisionU. S. General Accounting OfficeWashington, D. C. 20548
APPENDIX IV
Dear Mr. Fogel:
In reply to your letter to Secretary William E. Brock requestingcomments on the draft GAO report entitled "The Impacts of theSupport Cost Limitations Under the Job Training Partnership Act,"the Department's response is enclosed.
The Department appreciates the opportunity to comment on thisreport.
Sin srely,
T. JONESDeputy Assistant
e
\
ary of Labor
Enclosure
48
so

APPENDIX IV APPENDIX IV
GAO note: Presented below is the exact wording of theDepartment of Labor's comments on our draft of thisreport followed by our analysis.
LABOR COMMENTS
One of the subcommittee's expressed concerns was whether ornot the limitations on "support costs" would affect the qualityof training provided and the type of individuals served. Thenational data - -and information contained in the GAO surveyreportindicate that the limitation on participant supportcosts has had no discernible impact on the types of personsserved and the types of training provided. Therefore, the "lackof impact" should be the principal finding of the GAO report.
GAO ANALYSIS
We found that some changes occurred in the characteristicsof persons served and types of training provided under JTPA.Because several differences exist between CETA and JTPAprograms, we could not establish a direct cause-and-effectrelationship for these changes. Nonetheless, we agree that thelimitation on participant support costs does not appear to be amajor factor. This conclusion appears in the executive _ummaryand in chapter 7 of the report.
LABOR COMMENTS
There is a valid reason why GAO's survey findingJ maydiffer from the Department's analysis of the same clientcharacteristics. The methodological techniques employed by GAOand the Department were different in several instances.Chapter 2 should clearly state that GAO's analysis of JTPA datadoes not completely agree with the Department's analysis of theJTPA data obtained through JTLS because of the methodologicaldifferences employed as described at appendix I.
GAO ANALYSIS
We agree that GAO and Labor used different methodologies toanalyze JTPA participant characteristics. We believe, however,that our methodology enabled us to determine more accuratelywhether JTPA participant characteristics differ from CETAparticipants because our analysis (1) eliminated the possibilitythat any differences in characteristics may have been due to anSDA serving a different geographic area under JTPA than it didunder CETA and (2) was based on observed changes from FY 1980 toFY 1982 to TY 1984 at the 148 SDAs in our sample. This
49

APPENDIX IV APPENDIX IV
comparison gave us a broader perspective on any changes inclient characteristics. By analyzing data for individual SDAs,we were able to relate overall year-to-year differences to thedifferences among locations in each year. We were then able todetermine whether the changes from one year to the next exceededthe expected chance variation. ..,
On the other hand, Labor's conclusion that JTPA clientcharacteristics are substantially the same as CETA clients isbased on comparing national summary data for TY 1984 to nationaldata for a previous unspecified CETA year.
LABOR COMMENTS
GAO should also note in its report that there aredifferences between CETA and JTPA reporting definitions for mostof the selected client characteristics included in the report.The most significant difference concerns how "unemployed" wasdefined under CETA versus JTPA. Attachment 1 provides a side-by-side comparison of reporting definitions for selectedcharacteristics (CETA versus JTPA) used in the draft report.
GAO ANALYSIS
We have modified our report to point out that definitionsdiffered between CETA and JTPA characteristics. We haverecognized the differences for the one characteristic(unemployed) that had a statistically significant change betweenCETA and JTPA and a change in definition considered meaningful
by Labor. (See p. 11.)
LABOR COMMENTS
The GAO survey findings suggest shifts in clientcharacteristics from the Comprehensive Emplt,yment and TrainingAct (CETA) to the Job Training Partnership Act (JTPA). TheDepartment believes that with one exception--education statuscharacteristics--that the client characteristics under JTPA aresubstantially the same as they were under CETA.
The Department agrees that thy, education statuscharacteristics, and particularly the proportion of high schoolgraduates being served, differ from prior CETA experience. Eventhough the Department does not believe that serving more highschool graduates is necessarily inappropriate, it should benoted that recent data indicate that the enrollment of highschool graduates is on a downward trend. In the first quarterof program year 1984, 67 percent of the enrollees were high
50
62
APPENDIX IV APPENDIX IV
school graduates, while for the second and third quarters,enrollments for this group were 58 percent in each quarter.
GAO ANALYSIS
Although our comparison of participant characteristicsshowed that statistically significant changes occurred betweenseveral characteristics, we agree with Labor that participantcharacteristics under JTPA were substantially the same as underCETA. The exceptions were educational status and unemployedcharacteristics. A portion of the change in the unemployedcharacteristic may have been due to definitional differencesbetween CETA and JTPA, as noted previously.
While the high school graduate enrollment data cited byLabor could, if taken on a quarterly basis, be viewed asindicating a downward trend, such a trend is not as evident whenanalyzed cumulatively. In this regard, we noted in Labor'sreport on second-quarter data that, although 58 percent of theenrollees in that quarter were high school graduates, whencombined with data from the first quarter, the cumulativestatistics show an enrollment of high school graduates of 63percent. Third-quarter cumulative data showed 61 percent ofenrollees were high school graduates, similar to the 62 percentwe reported for the transition year. Thus, until cumulativedata are available for the entire program year, it is too earlyto determine whether enrollment of high school graduates hasdecreased.
LABOR COMMENTS
While a comparison of CETA versus JTPA is notinappropriate, the Department believes that CETA Fiscal Year(FY) 1982 data were inappropriate for this purpose. The reportindicates that FY 1982 was used in making the comparison to JTPAbecause it was the last "non-transitional" year of CETA. Thisis not correct. FY 1982 ended just after the passage of JTPA,when many of the current JTPA elements were being incorporatedinto CETA. Examples of these changes include: provisions forpayment of allowances were revised, the private industrycouncils took on stronger roles, and public service employmentprograms under CETA were phased out.
GAO ANALYSIS
We do not agrc. with Labor that CETA FY 1982 data wereinappropriate for our comparisons. We included FY 1982 data inour analysis primarily because it was the last fiscal year for
51
63

APPENDIX IV APPENDIX IV
which comparable CETA title II B and C data were available. Inaddition, we compar-d CETA FY 1982 with FY 1980 for a broaderperiod of time against which to obtain a better perspective onany changes that coincided with the program switch from CETA toJTPA.
Labor contends that many of the current JTPA elements werebeing incorporated into CETA during FY 1982 and cites threeexamples of changes. We believe that these changes would havehad no significant effect on the characteristics of individualsenrolled under titles II B and C of CETA for the followingreasons:
1. Although the provision for payment of allowances waschanged in FY 1982, only 5 of the 16 CETA primesponsors who requested a waiver to eliminate allowanceswere included in our analysis.
2. To the extent that private industry councils took onstronger roles in FY 1982, it is reasonable to assumethat this would have minimized any differences betweenCETA and JTPA enrollee characteristics, rather thancausing any distortion. This is because the role ofthe PIC under CETA would have been similar to thatunder JTPA. Moreover, any training the PICs may haveoffered would have been done under title VII, which wasnot included in our comparison.
3. Public service employment programs were undertitle II D and IV, which were not part of our analysisand were phased out during FY 1981.
LABOR COMMENTS
Unless one reads and analyzes the report very carefully, itappears to contain internal inconsistencies. The ExecutiveSummary and the subsequent chapters in the draft report presentfindings and opinions obtained via a variety of surveytechniques and methodologies. As presently written, this causesconfusion for the reader. To illustrate, consider thefollowing:
o Chapter 2 compares GAO's analysis of data which wereobtained from 148 SDAs which met a series ofpredetermined, necessary criteria;
52
64

APPENDIX IV APPENDIX IV
o Chapters 3 and 4 present information concerning pasx:experience and planned changes to JTPA as submitted by544 and 541 SDA's respectively, in response to GAO'squestionnaire;
o Chapter 5 presents the opinions of 450 SDAadministrators and 80 PIC representatives concerning theimpact of the participant support limitations. These,too, were in response to the GAO questionnairereferenced above; and
o Chapter 6 presents information obtained during on?.sitevisits to 11 SDAs plus supplemental informationdeveloped in studies conducted by several differentorganizations.
Perhaps the report would be easier to comprehend if thevarious methodologies used were deleted from Chapter 1 and werepresented at the beginning pf the chapter(s) applicable to them.If this is not feasible, an acceptable alternative would be forGAO to insert a brief footnote on the first page of each chapterwhich indicates their source of information (e.g.,questionnaire) and the number of respondents.
GAO ANALYSIS
We expanded the description of our methodology in chapter 1and have provided additional details on the methodology usedthroughout the report, where appropriate.
53
65

COMPARISON OF REPORTING DEFINITIONS FOR SELECTED PARTICIPANTCHARACTERISTICS - -CETA VS. JTPA
Charact-ristic
Unemployed
I
66
CETA
A person who is without a job for atleast 7 consecutive days prior toapplication is considered co beunemployed.
All persons shall be considered asbeing without a job if, during those7 consecutive days, such person:
worked no more than 10 hours;andearned no mores than $30.00;andwas seeking and available forwork.
Or fulfilled any one of the followingfour conditions:
- a client of a sheltered work-shop; or
- a person institutionalized ina hospital, prison or similarinstitution; or
- a person 18 years of age orolder, whose family receivespublic assistance or whosefamily would be eligible toreceive pu'qic assistance ifboth parents were not presentin the home; or
- a veteran who has not obtainedpermanent unsubsidized employ-ment since being released fromactive duty. Such veteran shallbe considered to meet "unemployed"eligibility requirements regard-less of the specific term ofunemployment required.
JTPA
An individual who did notwork during the 7 consecutivedays prior to application toa JTPA program, who madespecific efforts to find a jobwithin the past 4 weeks priorto application, and who wasavailable for work during the7 consecutive days prior toapplication (except fortemporary illness).
67

Characteristic' CETA
Welfare recipient,Any Public Assistance
School Dropout
Student
High School Graduateor Equivalent, NoPost High School(CETA Only)
Post High SchoolAttendee (CETA Only)
68
A participant who is or whose familyis receiving AFDC, SSI, or any otherState or local government cash publicassistance.
An individual who is not attending anyschool and has not received a highschool diploma or a GED Certificate.
An individual who is enrolled in anelementary or secondary school,(including elementary, junior andsenior high or equivalent) orbetween school terms and intends toreturn to school.
An individual who has received a highschool diploma or GED certificate butha3 not attended any post-secondaryvocational, technical, or academicschool.
An individual who is attending or hasattended a post-secondary vocational,technical, or academic school.
BEST C."""' A9LE
JTPA
A participant in Title II-Awho is a welfare recipient orwhose family is receivingcash payment under AFDC(SSA, Title IV), GeneralAssistance (State or localgovernment), or the RefugeeAssistance Act of 1980 (PL96-212) at the time of JTPAeligibility determination.For JASR reporting purposes,exclude recipients of SSI(SSA Title XVI).
An individual who is notattending any school and hasnot received a high schooldiploma or a GED Certificate.
An individual who is enrolledin an elementary or secondaryschool (including elementary,junior and senior high schoolor equivalent) or is betweenschool terms and intends toreturn to school.
69
H
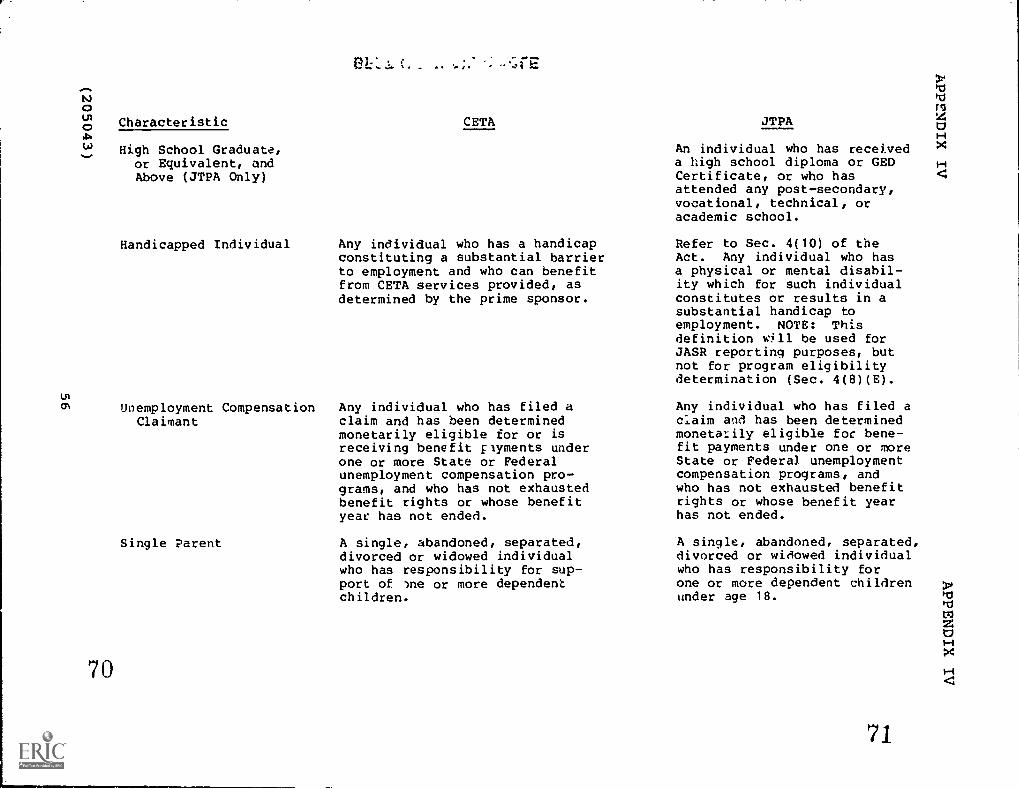
ts.)00)1).
70
Characteristic
High School Graduate,or Equivalent, andAbove (JTPA Only)
Handicapped Individual
Unemployment CompensationClaimant
Single Parent
CETA
Any individual who has a handicapconstituting a substantial barrierto employment and who can benefitfrom CETA services provided, asdetermined by the prime sponsor.
Any individual who has filed aclaim and has been determinedmonetarily eligible for or isreceiving benefit Flyments underone or more State or Federalunemployment compensation pro-grams, and who has not exhaustedbenefit rights or whose benefityear has not ended.
A single, abandoned, separated,divorced or widowed individualwho has responsibility for sup-port of -me or more dependentchildren.
JTPA
An individual who has receiveda high school diploma or GEDCertificate, or who hasattended any post-secondary,vocational, technical, oracademic school.
Refer to Sec. 4(10) of theAct. Any individual who hasa physical or mental disabil-ity which for such individualconstitutes or results in asubstantial handicap toemployment. NOTE: Thisdefinition will be used forJASR reporting purposes, butnot for program eligibilitydetermination (Sec. 4(8)(E).
Any individual who has filed aclaim and has been determinedmonetarily eligible for bene-fit payments under one or moreState or Federal unemploymentcompensation programs, andwho has not exhausted benefitrights or whose benefit yearhas not ended.
A single, abandoned, separated,divorced or widowed individualwho has responsibility forone or more dependent childrenunder age 18.
71