document ebsone biomedical science, unit ii: … · document ebsone. ed 174 446 se 028 510. title....
TRANSCRIPT

DOCUMENT EBSONE
ED 174 446 SE 028 510
TITLE Biomedical Science, Unit II: Nutrition in Health andMedicine. Digestion of Foods; Organic Chemistry ofNutrients; Energy and Cell Respiration; The OptimalDiet; Foodborne Diseases; Food Technology; DentalScience and Nutrition. Instructor's Manual. RevisedVersion. 1975.
INSTITUTION Biomedical Interdisciplinary Curriculum Project,Berkeley, Calif.
SECNS AGENCY National Science Foundation, Washington, D.C.PUB DATE 75NOTE 229p.; For related documents, see SE 027 978-999 and
SE 028 511-516; Not available in bard copy due tccopyright restrictions; Contains occasional lighttype
EDFS PRICEDESCRIPTORS
MF01 Plus Postage. PC Not Available from EDRS.Biology; Dental Health; *Dietetics; *Diseases; EatingHabits; *Food; Foods Instruction; *Health T1ducation;Interdisciplinary Approach; *Nutrition; OrganicChemistry; Science Education; *Secondary Education
ABSTRACTThis collection of lessons deals with nutrition in
health and medicine and specifically the digestive system and itsfunctions. The primary otjective of this collection of lessons is toprovide information on what constitutes good nutrition. Among theproblems treated in these lessons are heart disease, peptic ulcer,hepatitis, vitamin deficiency diseases, parasitism, and dentalproblems- Each lesson contains: (1) a rationale; (2) objectives; (3)
sequence; (4) suggestions; (5) teaching notes; (6) anticipatedresults; and (7) answers to questions presented in the student text.(Author/RE)
***********************************************************************ReprDduc+ions supplied by EDRS are the best that can be made
from the original document.***********************************************************************

BIOMEDICAL SCIENCE
UNIT II
NUTRITION IN HEALTH
AND MEDICINE
DIGESTION OF FOODS; ORGANIC CHEMISTRY OF
NUTRIENTS; ENERGY AND CELL RESPIRATION;
THE OPTIMAL DIET; FOODBORNE DISEASES; FOOD
TECHNOLOGY; DENTAL SCIENCE AND NUTRITION
INSTRUCTOR'S MANUAL
REVISED VERSION, 1975
THE BIOMEDICAL INTERDISCIPLINARY CURRICULUM PROJECT
SUPPORTED BY THE NATIONAL SCIENCE FOUNDATION
Any opinions, findings, conclusions or recommendations expressedherein are those of the author and do not necessarily reflect
the views of the National Science Foundation.
Copyright © California Committee on Regional Medical Programs, 1975

TABLE OF CONTENTS
LESSON Page
Introduction i.
1 (A) Introduction to Nutrition(B) Statistics and Heart Disease 1
2 (A) Heart Disease and Nutrition(B) Examples of Teenage 24-Hour Diets 6
3 (A) Introduction to Digestion(B) The Digestive System of an Earthworm 14
4 (A) Enzymes(B) Properties of the Enzyme Amylase 19
5 Higestion in the Mouth and Stomach 26
6 Peptic Ulcer 27
7 (A) Digestion in the Duodenum(B) Analysis of Gallstones for 31
8 (A) Digestion and Absorption in the Intestines(B) Quantitative Analysis of Gallstones for Bilirubin. 36
9 (A) Disorders of the Digestive Tract(B) Review 40
10 Water--An Unusual Nutrient 43
11 An Introduction to Organic Chemistry 46
12 (A) Carbohydrate Chemistry(B) Nutrient Analysis 51
1.3 Carbohydrates in the Diet 67
14 (A) Hypoglycemia(B) Homeostasis 68
15 Chemistry of Acids and Fats 70
16 Fats in the Diet 72
17 Proteins and Amino Acids 74
18 Protein Requirements and Protein Quality 77
19 Minerals as Nutrients 79
20 (A) Vitamins and Their Functions(B) Analysis of Vitamin C in Fruit Juice 80
21 (A) Vitamins and Minerals in the Diet(B) Determining the Riboflavin Contert cf Vitamin Pills(C) Review 85
12 (A) Energy(B) Evidence of Chemical Reactions 92
/- (A) Heat of Reaction(B) Measuring Calories in Foods 97
TABLE OF CONTENTS(continued)
LESSON Page
24 (A) Food, Energy and Metabolism(B) Calculating the Daily Energy Expenditure 104
25 Cell Respiration--An Introduction 107
26 Factors Related to Cell Respiration 126
27 Chemical Equilibrium 127
28 (A) Shifting the Position of an Equilibrium(B) The Equilibrium Constant 138
29 Daily Food Intake 150
30 (A) Recommended Daily Allowances(B) Overweight and Obese(C) Ideal Weight 154
31 The Optimal Diet 158
32 (A) Diabetes Mellitus(B) Glucose Tolerance Test 160
33 (A) Obesity(B) Review 167
34 (A) Introduction to Microbiology(B) Foodborne Disease 171
35 (A) Parasitic Diseases(B) Observation of Live Bacteria 179
36 Water Purification 180
37 (A) Food Processing(B) Nitrites in Foods 183
38 Food Additives and Health 188
39 Food Labels 189
40 (A) The Role of Teeth in Nutrition(B) The Anatomy of the Teeth 195
41 (A) The Development of the Teeth and Malocclusion(B) Dental Impressions 200
42 (A) Dental Disease(B) Plaque 203
43 (A) Vitamins and Fluorides in Dental Health(B) Unit Review 206

INTRODUCTION
Unit II deals with nutrition in health and medicine. Just as the central
theme of Unit I was the respiratory system and respiration, Unit II considers
the digestive system and its functions. The two systems are functionally re-
lated. The digestive system breaks foods down into substances such as glucose,
which the cells in turn break down to CO2 and H2O. The latter process is depen-
dent upon oxygen, which is obtained in breathing, and one of the major end-
products is CO?, which is expelled in breathing.
The subject of nutrition has a great deal of medical significance. The
primary objective of this unit is to provide information on what constitutes
good nutrition, so that each student may select a diet of high nutritional qual-
ity (his or her optimal diet). An inappropriate diet can contribute to countless
health problems, ranging from arteriosclerosis to obesity and caries. Among the
numerous important medical problems treated in this unit are heart disease, pep-
tic ulcer, hepatitis, appendicitis, diabetes, vitamin-deficiency diseases, food
poisoning, pinworms, dental malocclusion and periodontitis.
A. CONTENT OF THE UNIT:
This unit on nutrition considers the following topics in order: digestion
and the digestive system, the biology and chemistry of nutrients, energy and cell
respiration, the optimal diet, food microbiology, food technology and dental
health. The following paragraphs briefly describe the five major parts of the
unit.
PART I: DIGESTION (Lessons 1 to 9)
The first two lessons introduce the unit by describing the relation between
nutrition and one of our most serious and widespread health problems, heart dis-
ease. The next six lessons introduce the anatomy and physiology of the digestive
system- Diseases that affect the organs of the digestive tract are considered
where relevant. Laboratory activities in this sequence include dissection, a
study of enzymatic catalysis, analysis of blood in simulated stool specimens
and analysis of gallstones.
PART II: CHEAICAL AND BIOLOGICAL PROPERTIES OF NUTRIENTS (Lessons 10 to 21)
A knowledge of nutrition requires an understanding of the composition of
foods. Lessons 10 through 21 treat selected topics in nutritional chemistry.
These lessons introduce organic chemistry with specific reference to carbohydrates

and other nutrients. Health problems related to nutrition--e.g., glycemia,
rickets and goiter--are introduced at appropriate points in the sequence. The
major laboratory activity is a quantitative analysis of the fat, protein and
water content of foods. This analysis will occupy several periods. In other
activities students will work with molecular models, measure the heat capacity
of water, and analyze for vitamin C in fruit juice and riboflavin in vitamin pills.
PART III: ENERGY, METABOLISM AND THE DIET (Lessons 22 to 33)
Providing energy is one of the main functions of nutrition. This sequence
begins with three lessons on energy, particularly chemical energy. These lessons
are followed by a brief analysis of cell respiration, the process by which the
products of digestion release energy that the cells use for production of ATP.
Lessons 27 and 28 introduce chemical FNuilibria and show how ATP alters chemical
equilibria and thus increases the output of endothermic reactions. The final
lessons in this sequence return to a major theme of the unit, the optimal diet.
In LA-22 and LA-23 chemical reactions and heats of reaction are considered.
Following a simulation game on cell respiration, the activities return to chemi-
cal reactions and focus on Le Chatelier's pri 'pie. In addition, there is a
series of activities in which students analyze their energy requirements and their
diets. These activities lead to an evaluation of the quality of their diets and
to the designing of optimal diets for themselves.
PART IV: FOODBORNE DISEASE (Lessons 34 to 39)
This sequence considers health problems associated with food contaminants
and additives. The first three lessons consist of a study of food microbiology
and water pollution, including pertinent laboratory activities. Other lessons
deal with the effects of processing and additives on food quality. In the labora-
tory, the students analyze for nitrite in v,eats. The last lesson in this series
demonstrates how to derive useful information from food labels. An activity on
reading food labels is included.
PART V: DIET AND DENTAL DISEASE (Lessons 40 to 43)
The final four lessons provide a brief treatment of the teeth and dental dis-
ease. The rationale for including these lessons in a unit on nutrition is that
(1) the mouth and teeth play an important role in digestion and (2) nutrition, in
turn, plays a significant role in dental health. The activities in this section
involve the teeth, dentition and plaque.
7
ii

B. UNIT OBJECTIVES:
The student will
identify the organs of the digestive system and their functions.
list and describe.at least three diseases associated with the diges-
tive system.
-list and describe at least two clinical procedures used in diagnosing
disorders of the digestive tract.
describe the changes that occur in nutrients during digestion.
recognize several functional groups (i.e., -OH, -COOH, -NH2) and in-
dicate in which nutrients they are found.
list and describe the functions of the three classes of nutrients
that can provide energy (i.e., fats, proteins and carbohydrates).
-explain how to analyze for fats and proteins in foods.
list at least three minerals and at least three vitamins and describe
their functions
explain the relation between the energy stored in nutrients and the
synthesis of ATP.
explain the relation between pulmonary respiration and cell respiration.
-explain how changes in the concentrations of reactants and products
affect a reversible reaction
- explain how to use food tables to evaluate a diet.
describe the characteristics of diabetes mellitus and obesity and how
diet may be employed in the treatment of these conditions.
-list at least three microbial diseases and describe how these diseases
may be prevented.
- list advantages and disadvantages of food processing and food additives.
-list at least three dental health problems along with information on
prevention and treatment of each.
explain how diet is related to dental health.
This volume contains teacher materials for a total of 43 lessons on nutri-
tion. A Student Text and Laboratory Manual are available in separate volumes.
iii

C. INTERDISCIPLINARY TIES:
1. Biomedical Mathematics: As in Unit I, close contact with other Bio-
medical teachers is essential. Of particular importance in this unit is the
relationship and coordination between Mathematics and Science. The following
four ties between the two disciplines .deserve special consideration. Additional
ties are suggested in individual lessons.
a. Graphing is emphasized in Science Lessons 1 and 2. This ties with
Supplementary Mathematics Lesson X, which is found at the end of Mathematics
Unit II. Mathematics Lesson X should be taught immediately after Science Lesson 2,
You should discuss this tie with the Mathematics instructor.
h. The vitamin C laboratory activity (Science LA-20) is closely re-
lated to Mathematics Lessons Y and Z. Error analysis in Mathematics is applied
to this Science activity. You and the Mathematics instructor should coordinate
your schedules so that Mathematics Lesson Y is taught just before LA-20 and
Mathematics Lesson Z is taught immediately after LA-20.
These ties between Science and Mathematics can be more easily understood
from the following diagram.
LESSONS
MATHEMATICS
SCIENCE
X
2, 20
c. In order to take advantage of diet-analysis techniques developed
in Mathematics, Science instructors may benefit by reading the Mathematics lesson
"Introduction to Vectors" before beginning Science Unit II. Such vector treatment
may also be used in Science Lesson 31, on optimal diets.
d. Before teaching the section on "optimal diet," you may want to con-
fer with the Mathematics instructor to see the kinds of problems treated in
Mathematics lessons on linear programming (Matheinatics Sections 19-21).
2. Biomedical Social Science: The ties between Unit II of Social Science
and Science are of a more general nature. They can be best understood from the
following outline of Unit II Biomedical Social Science.
Lessons 1-16: The focus of these lessons is on culture and ways of
learning about culture, and the lessons give little attention to health or nutri-
tion. Materials provided for students illustrate concepts and methods with
9iv

reference to a variety of cultures. Some of the information about other cultures
is related to food production and distribution.
Lessons 17-37: During this sequence the class is divided into groups
and each group uses a different Student Text plus outside resources. The groups
base their investigation on ten question sets about various aspects of culture.
These question sets are in the Biomedical Social Science Student Text, Unit II,
Part One, pp. 141-145.
Half the question sets (sets six through ten) are about health. Their
topics are: ways of thinking and acting about health, disease and death; the
health status of the people being studied; nutrition and its effects on health;
the effects of ideas and social structure on health; and the effects of the en-
vironment on health. Each of these question sets requires, to one degree or
another, that students review materials from Biomedical Science Unit I or Unit II.
The other five question sets (one through filde) are not directly related
to nutrition and health, bLt some of them require collection of data that might
help to explain the nutritional and health status of the people being studied.
The topics of these question sets are: the influences of culture and environment
on each other; ways of making a living and division of labor; ritual and religion;
leadership, power and rules; and family life and child rearing.
Lessons 38-40: In these lessons groups of students attempt to design
Western-style health centers which are adaptable to all the cultures studied in
the preceding lessons, and which deal with the following four types of health
problems: environmental quality, respiratory diseases, gastrointestinal diseases
and nutrition. Students will need to review materials from Biomedical Science
Unit I in dealing with the first two types of problems, and materials from Bio-
medical Science Unit II in dealing with the other two. Evaluation will be based
eq.ally on the appropriateness of the health center plan to the various cultures
(a social - science problem) and on the appropriateness of the measures suggested
for solving the specific health problems (a science problem). The Instructor's
Manual for Biomedical Social Science suggests that both the Science and the Social
Science instructors participate in the evaluation of the health center plans and
of the students' analysis of other groups' plans.
D. CAREER INFORMATION:
Biomedical Science Unit II has many career implications, and field trips to
visit specialists could be a very worthwhile supplement. Conversely, you may
o

wish to invite specialists to visit your classroom. Either idea will take some
advance planning. To get the best use cut of outside speakers, you may find
the following table useful. It lists particular careers and the relevant les-
sons where each specialist might be useful. Specialists who work in a hospital
can often be contacted through a hospital administrator.
Specialist Relevant Lesson(s)
39
epidemiologist
statistician
anatomist or physiologist
biochemist
physician (internist)
medical technologist
X-ray technologist
surgeon
virologist
psychologist
chemist
organic chemist
food analyst
nutritionist
physicist
electron microscopist
dietitian
anthropologist
medical microbiologist
veterinarian
food technologist
food and drug inspector
dentist
orthodontist
dental hygienist
1, 2
1, 2
3, 5, 7, 8, 14
4, 12, 15, 17, 25, 26
6, 9, 14, 32, 33, 35
6-9, 32, 34
6, 9
6, 8
9
9
10, 22, 23, 27, 28
11, 12, 15
12, 20, 38
16, 18, 20, 21, 30-32,
22, 23
26
30-33
30, 42
34-36
35
37, 38
38
40-43
41
42
Information on the functions of different types of dietitians is appended
to this Introduction. Note that the information is aimed at students (rather
than teachers). You may wish to post this information at the appropriate time.
or to make copies for your class.
11vi

Field trips would be a convenient supplement to most of the lessons listed
above. Besides visits to the specialists mentioned, you may wish to consider
visItF to the following sites:
water-treatment plant (Lesson 36)
food-processing plant (i.esson 37)
dental college (Lessons 40-43)
E. LABORATORY ACTIVITIES REQUIRING ADVANCE PREPARATION:
1. Live earthworms are needed in LA-3. They should be ordered to arrive
about one day in advance of the activity.
2. Gallstones are required for LA-7 and LA-8. They should be requested
in advance as directed in the Teaching Notes for LA-7.
3. LA-30 requires a number of sets of special calipers ("fat-grabbers").
Directions for making the calipers may be found in the Teaching Notes for LA-30.
It will take some time to make these, so you may wish to get started well in
advance of LA-30, or assign students to make their own.
4. The Teaching Notes for LA-40 suggest the possibility of obtaining ma-
terials from a dentist. Doing so will require some advance planning and
communication.
One or two additional comments about the laboratory activities should be
made at this point.
A significant number of the activities in Unit II involve colorimetry, a
key tool in clinical medicine. It would be good to be sure early in the unit
that the BIP's are functioning well when programmed for colorimetry. In addition,
if you have not already done so, it would be a good idea to number the colorime-
try test wells so that eaLh student can use the same BIP and test well in activi-
ties that last longer than one day.
The activities are designed to permit increasing student input into both
the planning and analysis of investigations. For example, LA-4 allows students
to design an investigation of the effect of pH on amylase activity. Later ac-
tivities will provide greater challenges.
F. BIBLIOGRAPHY:
You can obtain numerous reference books on the subjects covered in Unit II.
A few references that were useful in the development of this unit are listed in
vii

this Bibliography. This is not a comprehensive list, and you may find other
references of more value to you.
C.H. Robinson, Normal and Therapeutic Nutrition, 14th ed. Macmillan Co., N.Y.,
1972.
E. Cheraskin, et al., Diet and Disease, Rodale Press, Emmaus, PA, 1 68
M. Lantner and G. Bender, Understanding Dentistry, Beacon Press, Boston, 1969.
W.T. Keeton, Biological Science, 2nd ed. Norton and Co., N.Y., 1972.
L.L. Langley, Physiology of Man, 4th ed. Van Nostrand Reinhold Co., N.Y., 1971.
B. Pansky, Dynamic Anatomy and Physiology, Macmillan Co., N.Y., 1975.
R.M. De Coursey, The Human Organism, 4th ed., McGraw-Hill Book Co., N.Y., 1974.
B.R. Landau, Essential Human Anatomy and Physiology, Scott, Foresman and Co.,
Glenview, Ill., 1976.
S.R. Williams, Nutrition and Diet Therapy, C.V. Mosby Co., St. Louis, 1970.
L.J. Bogert, G.M. Briggs and D.H. Calloway, Nutrition and Physical Fitness,
9th ed., W.B. Saunders Co., Philadelphia, 1973.
H.S. Mitchell, et.al., Cooper's Nutrition In Health and Disease, 15th ed.,
J.B. Lippincott Co., Philadelphia, 1968.
viii

ADDENDUM:
Nutritionists and Dietitians
Two professions involved in the field of nutrition are those of the nutri-
tionist and the dietitian.
A nutritionist is an educator who is concerned with teaching people how to
satisfy their normal nutritional needs. A nutritionist typically works for a
government-financed health organization. For example, a nutritionist may work
with a community health service. Work may include nutrition education in
schools and day-care centers, advising outpatients and being available for con-
sultation in family meal planning.
A dietitian has a college degree and obtains training as an intern in a
clinical situation, such as a hospital. The field in which a dietitian works
is called dietetics. Dietetics is the application of nutritional knowledge to
specific situations. The subject of dietetics includes a wide range of areas
of interest; a dietitian may specialize in any of a number of areas. A dieti-
tion may be concerned with the dietary treatment of illness or with the proper
diet for normal growth and health. He may also apply dietary knowledge to plan-
ning menus and administering the preparation of food for large groups of people.
A dietitian may work in a hospital, in a community or in an industry. We
will consider briefly the function of dietitians in each of these areas.
Hospital Dietitians
1. Clinical or therapeutic. A dietitian obtains a patient's diet history,
studies possible diet therapies and takes part in decisions concerning the pa-
tient's diet. The dietitian then plans a specific diet and discusses it with
the patient.
2. Ad. nistrative. The management of food services and personnel is in
the charge of a dietitian. He is in charge of food purchasing, meal planning
and preparation both for patients and employees. Smaller hospitals may have
only one or two dietitians who must both administer the hospital's food service
and consult with individual patients.
3. Research. Some hospitals conduct dietary research. The purpose is to
study the effect of diet on specific ailments. Dietitians help plan the diets
and monitor the quantities of foods actually eaten by patients.
ix

Community Dietitians
1. School food services. A dietitian manages school food services pro-
grams. One dietitian may manage the lunch programs of several elementary and
secondary schools. Dietitians working in colleges and uni ersities administer
the food services in dormitories, faculty dining clubs and snack bars.
2. Consultants. Many dietitians work as consultants to small institutions
such as retirement homes, convalescent homes and day-care centers.
Industrial Dietitians
1. The food industry. Dietitians are involved in research in the food in-
dustry. Experimentation is required to obtain information on new food products.
Dietitians are also involved in developing new products and marketing them. The
Dairy Council, for example, employs dietitians who conduct workshops in nutri-
tion edur7ation for teachers and other dietitians.
2. Food management companies. Special companies provide food service to
restaurant chains, airlines and large hospitals. The company provides equipment,
supplies and personnel. The personnel include an administrative dietitian to
supervise the selection, purchase and preparation of food.
3. Grocery stores. Some grocery stores employ dietitians. The dietitians
demonstrate products and provide information to consumers.
Dietetics and Therapy
Imagine that you are a dietitian in a hospital. You are a therapeutic
dietitian; you work with individual patients and are part of the team that pro-
vides the optimal diet for a patient. Your goal is to establish a diet that is
as nutritionally adequate as possible given the restrictions placed on it by the
patient's condition. At the same time the diet must be acceptable to the par-
ticular patient and must interfere with the patient's life as little as possible.
Imagine that a patient has been admitted to the hospital. He has been
examined and tested by his doctors, and a diagnosis has been made. The diagnosis
is that the patient is suffering from a disease in which diet is an important
part of the treatment. The patient's recovery requires that his diet be modific
The patient's doctor consults with you, as a therapeutic dietitian. He
explains the disease and its relation to diet. The doctor prescribes a diet;
it is then your job to see that his diet order is carried out.

You next talk with the patient. You find out the patient's eating habits:
his likes and dislikes, who prepares his meals, how much and how often he eats.
You also ascertain his financial status to see whether the cost of the new diet
must be taken into consideration. You must also determine his present diet, be-
cause the nutritional value of this diet provides important information.
During-this interview you must also try to judge how good the patient will
be at sticking to his diet. Your judgment i based in part on the importance
the patient attaches to his present diet. If the patient is careful in his
present dietary habits, you may expect that he will be careful in following the
modified diet. You and the patient then agree on a diet that is both satisfac-
tory to the patient and suitable to his medical requirements (and to the hos-
pital's budget).
Your next task as therapeutic dietitian is to inform the dietary department
of the hospital about the diet you and the patient have agreed upon. Many people
are involved in seeing that the dietary orders are carried out. Clerks compile
menus and keep files on each Tent. The preparation of the food in the kitchen
may need to be supervised. You may check the tray before it is sent to the pa-
tient to be sure no mistakes were made.
A therapeutic dietitian vists a patient frequently. Visits may be necessary
to explain any diet changes the doctor has ordered, or simply to see whether the
patient is eating his food. If the patient must continue the modified diet once
he has returned home, the dietitian will give him instructions, explaining the
specific foods to be eaten and procedures to be used in following the diet.
xi

LESSON 1: (A) INTRODUCTION TO NUTRITION
(B) STATISTICS AND HEART DISEASE
RATIONALE:
ST-1 provides an introduction to the entire unit. The first activity intro-
duces data that suggest a relation between nutrition and heart disease. It serves
to reinforce the earlier treatment of graphing in Biomedical Mathematics as well
as the previous treatment of population data in Biomedical Social Science. Finally,
this exercise leads into the discussion of nutrition and heart disease in ST-2.
OBJECTIVES:
The student will:
construct bar graphs from tabular data.
-write a concise statement summarizing the information in a table of
data or in a bar graph.
SEQUENCE: ST-1; Activity 1
SUGGESTIONS:
1. You may wish to expand on the brief introduction to the unit in ST-1.
A more detailed discussion of the organization of the unit is provided in the
Introduction to the Instructor's Manual.
2. A discussion of the careers related to Unit II would be appropriate.
Such a list of careers appears in the Introduction. Students have also investi-
gated a variety of health careers in Social Science Unit I, Lessons 12 to 15.
You might inquire about student interests in careers and discuss the possibility
of field trips. The students may have contacts who can help set up field trips,
or visit the class and speak about some aspect of nutrition.
3. Consider the possibility of having bulletin board space available for
students to post newspaper and magazine clippings related to nutrition. There is
much coverage of this topic and students could be assigned to collect clippings.
This project would emphasize the timeliness and newsworthiness of the subject
matter of this unit and may also provide you with information that can be used
in later periods.
4. It would be good to be in contact with both your Biomedical Mathematics
and Biomedical Social Science colleagues in regard to Activity 1. Interdisciplin-
ary ties with Science Unit II were discussed in the Introduction.
1
1 7
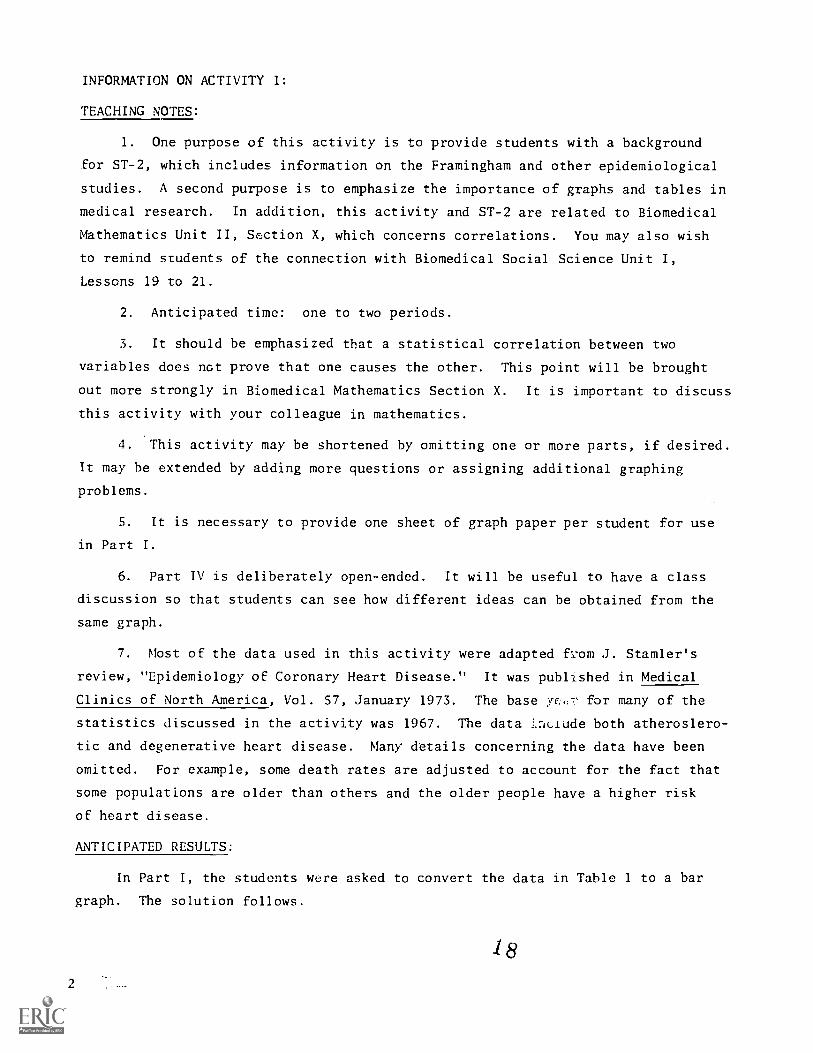
INFORMATION ON ACTIVITY 1:
TEACHING NOTES:
1. One purpose of this activity is to provide students with a background
for ST-2, which includes information on the Framingham and other epidemiological
studies. A second purpose is to emphasize the importance of graphs and tables in
medical research. In addition, this activity and ST-2 are related to Biomedical
Mathematics Unit II, Section X, which concerns correlations. You may also wish
to remind students of the connection with Biomedical Social Science Unit I,
Lessons 19 to 21.
2. Anticipated time: one to two periods.
3. It should be emphasized that a statistical correlation between two
variables does not prove that one causes the other. This point will be brought
out more strongly in Biomedical Mathematics Section X. It is important to discuss
this activity with your colleague in mathematics.
4. This activity may be shortened by omitting one or more parts, if desired.
It may be extended by adding more questions or assigning additional graphing
problems.
S. It is necessary to provide one sheet of graph paper per student for use
in Part I.
6. Part IV is deliberately open-ended. It will be useful to have a class
discussion so that students can see how different ideas can be obtained from the
same graph.
7. Most of the data used in this activity were adapted from J. Stamler's
review, "Epidemiology of Coronary Heart Disease." It was published in Medical
Clinics of North America, Vol. 57, January 1973. The base yr:,7:- for many of the
statistics discussed in the activity was 1967. The data .:.,ciude both atheroslero-
tic and degenerative heart disease. Many details concerning the data have been
omitted. For example, some death rates are adjusted to account for the fact that
some populations are older than others and the older people have a higher risk
of heart disease.
ANTICIPATED RESULTS:
In Part I, the students were asked to convert the data in Table 1 to a bar
graph. The solution follows.
182

ri
..u.uuu.s u..uu..uu.mm...m.u.....u..u..u.....uuui..iu.uuu....u..uuu.uuiaumuuuuuuI...
--
I
I...auu.u.u.u..u...u.u.....u...u.um.um u...........I
u.u. .u.uuu.ausu..m.amu ..uu..-
'U......
.. ...... .s...rn............u...S.....u..UWU.muuu.uuu.. .RUUUUUU
..............U.
.........U......UUUUUUUUUU - 1.1I......amu UUUUUUUUUUUUUUUUUIUUUU UUUUUUUUUUUUUU Y4Y44!4uuuuuuuiiauuuuuuu ................i...a. rjrjriU... UUUUUUUUUUUUUUiUU.UUU UUUUUU.0U... ...........uu.n.....m.u...............a...a.....u.....u...1
p -- p - - .. ... ..- -
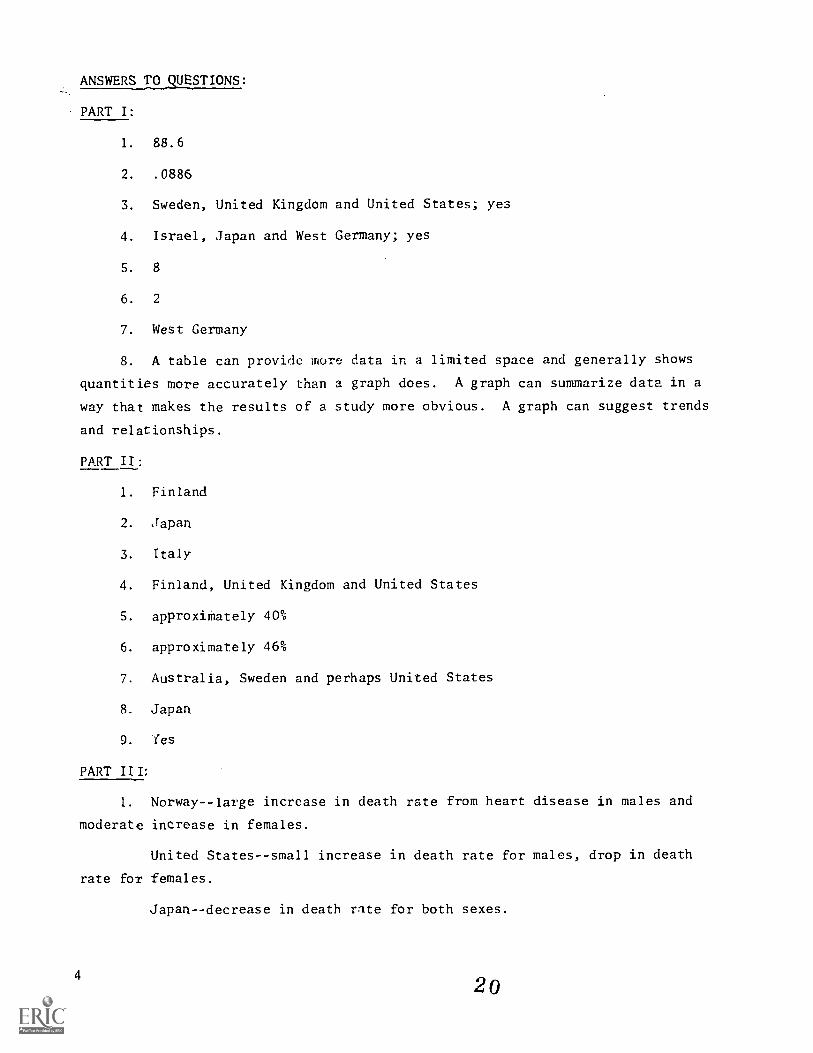
ANSWERS TO QUESTIONS:
PART I:
1. 88.6
2. .0886
3. Sweden, United Kingdom and United States; yea
4. Israel, Japan and West Germany; yes
S. 8
6. 2
7. West Germany
8. A table can provide more data in a limited space and generally shows
quantities more accurately than a graph does. A graph can summarize data in a
way that makes the results of a study more obvious. A graph can suggest trends
and relationships.
PART II:
1. Finland
2. Japan
3. Italy
4. Finland, United Kingdom and United States
5. approximately 40%
6. approximately 46%
7. Australia, Sweden and perhaps United States
8. Japan
9. Yes
PART III:
1. Norway--large increase in death rate from heart disease in males and
moderate increase in females.
United States--small increase in death rate for males, drop in death
rate for females.
4
Japan--decrease in death rate for both sexes.
20
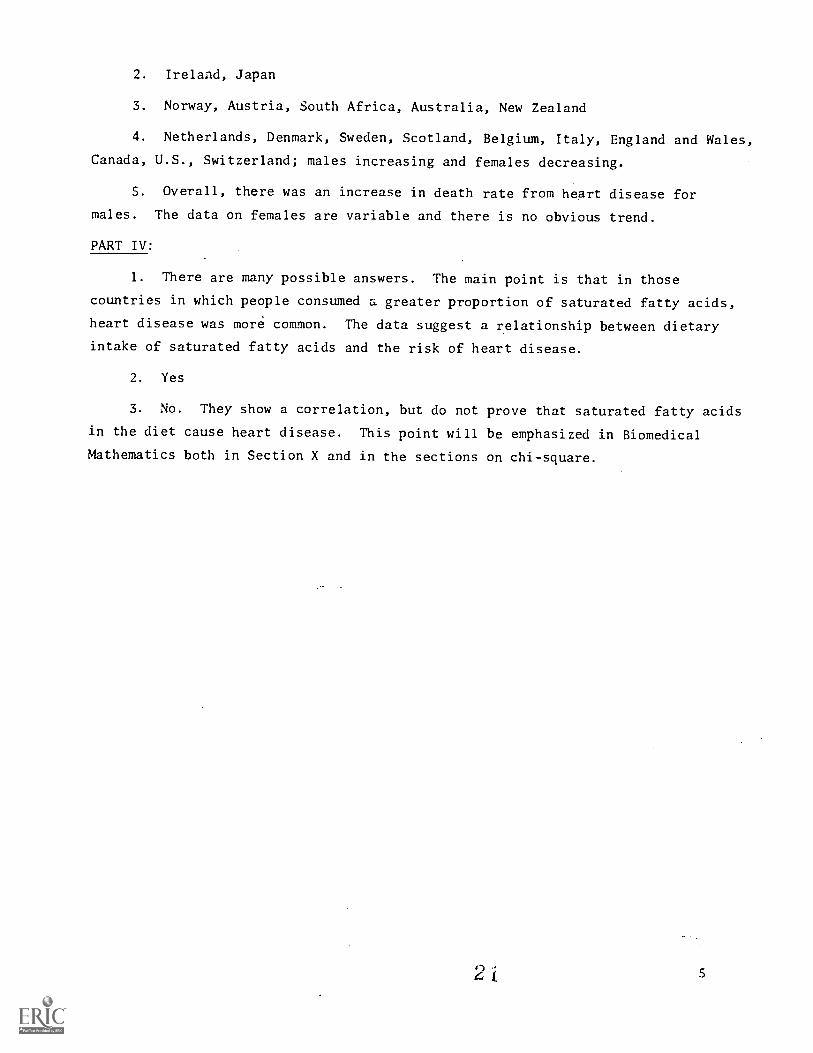
2. Irelaad, Japan
3. Norway, Austria, South Africa, Australia, New Zealand
4. Netherlands, Denmark, Sweden, Scotland, Belgium, Italy, England and Wales,
Canada, U.S., Switzerland; males increasing and females decreasing.
5. Overall, there was an increase in death rate from heart disease for
males. The data on females are variable and there is no obvious trend.
PART IV:
1. There are many possible answers. The main point is that in those
countries in which people consumed a greater proportion of saturated fatty acids,
heart disease was more common. The data suggest a relationship between dietary
intake of saturated fatty acids and the risk of heart disease.
2. Yes
3. No. They show a correlation, but do not prove that saturated fatty acids
in the diet cause heart disease. This point will be emphasized in Biomedical
Mathematics both in Section X and in the sections on chi-square.
5

6
LESSON 2: (A) HEART DISEASE AND NUTRITION
(B) EXAMPLES OF TEENAGE 24-HOUR DIETS
RATIONALE:
This is the second lesson in a sequence on food, health and the digestive
process. An understanding of the relationship between nutrition and health will
be of great long-range value to the students. This lesson relates nutrition to
coronary heart disease by means of data from the Framingham study. In a sense,
it is an extension of Activity 1.
The activity for this lesson is a study of the diets of two hypothetical
teenagers. It focuses attention on the diet and nutrients--one of the main topics
of the entire unit. This activity ties in closely with the kinds of calculations
the students perform in Biomedical Mathematics, Unit II. In later science lessons,
after a more thorough study of nutrition, the students will evaluate their own
diets and consider how they may be improved.
OBJECTIVES:
The student will:
-define and explain the importance of coronary heart disease.
- describe how the Framingham Study was done and the conclusions regarding
cholesterol.
- describe how the typical diet of North Kyrelians increases their risk
of heart attack.
- describe the relationship between blood cholesterol level and heart
disease.
- describe the trend in death rate from heart disease in the U.S.A.
during this century.
use a food table to determine the quantities of protein, fat and
carbohydrate in a diet.
SEQUENCE: ST-2; Activity 2
SUGGESTIONS:
1. You could use Activity 1 as a transition to Lesson 2. You might also
discuss some of the other aspects of the Framingham study described in the Back-
ground Information.
2G

2. The case history in Section 2-1 could be used to start a discussion of
the relation between nutrition and heart disease. Perhaps the students have
close relatives who have had heart attacks. Students might compare the diets
and other characteristics of such relatives with those of Fred Stone.
3. It is desirable for Biomedical Mathematics Lesson X on correlations to
be taught soon after this lesson.
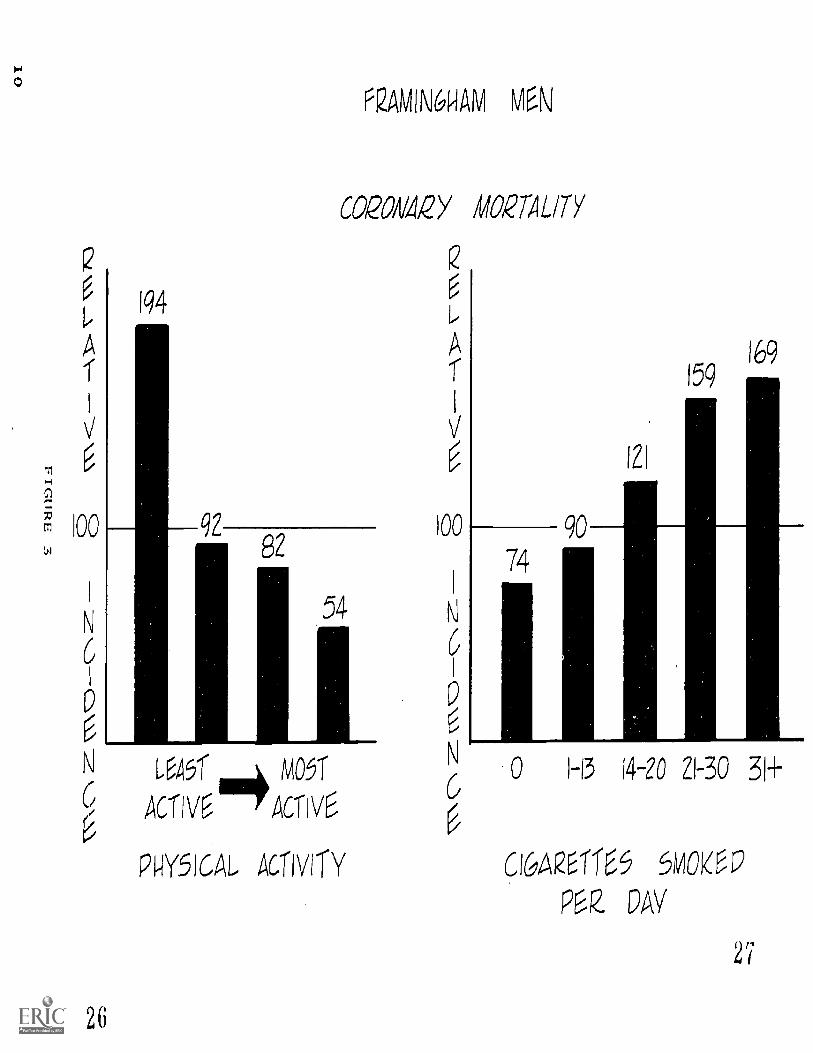
BACKGROUND INFORMATION ON THE FRAMINGHAM STUDY:
The Framingham Study is the largest, most prolonged and most carefully con-
ceived epidemiological study of cardiovascular disease ever undertaken in the U.S.
It was begun in 1949 in Framingham, Massachusetts, a retail and light industrial
center and residential area 21 miles west of Boston. At the beginning of the
study the subjects included about 5200 men and women aged 30 to 62 and free of
clinical evidence of heart or vascular disease. The results thus far indicate
that four characteristics in males are associated, at a statistically signifi-
cant level, with an excessive risk of developing heart and vascular diseases.
These four relationships are shown in Figures 1 through 3. These figures
might be converted to transparencies for overhead projection. The following
definitions apply to information on the graphs.
Angina pectoris--a form of coronary heart disease characterized by spasmodicattacks of intense pain originating in the heart muscle because of inadequatecoronary blood flow., ("Angina pectoris" is Latin for "pain in the chest.")
Relative weight--the ratio of the subject's weight to the median weight forall subjects of the same height and sex, times 100. A relative weight of 120indicates that the subject weighs 20% more than the median for his height and sex.
Relative incidence--100 times the ratio of the risk for a certain categoryof men to the risk for all men in the study. For example, Figure 1 shows that menwith a relative weight of 120 or more had a risk of sudden death from coronaryattack that was 365% or 3.65 times that of all Framingham men. One can alsocalculate that the risk of sudden death for men with a relative weight of 120 ormore was about 5 times (365 divided by 75) the risk for men with a relative weightof less than 120.
Blood cholesterol concentration--actually, milligrams of cholesterol per 100milliliters of serum. Serum is the clear fluid that remains after blood hasclotted. Note that the term "serum" was not introduced in the text.
All of the Framingham data displayed apply only to men. Associations between
coronary heart disease and the characteristics shown are less strong for women,
but similar trends exist for them. Although four men die for every woman who dies
of coronary heart disease, there are nevertheless some 80,000 female coronary
deaths in the U.S. each year.
7

E
A
1
V
1
N
r)1
100
P 2AM N&I-1AM M EN
75
365
<120 120-f-
SZ/Z7,0EN DEA 7-1-7/ E.20/1/C000/1/42 y ATT
ANGINA Pe CTOIZ
63
90
129
O
183
<90 90- HO- 120+109 119
RELATIVE
FIGURF 1

F2AMIN61-1AM MEN
COEON4,2Y I/Z.42T .0/3-E4.S.-
4156 .56
85
200 200
<180 180- 200- 220- 240- 260- 2E30- 300+199 219 239 259 279 299
BLOOD C1-101.--5-iROL, CONCENTRATIONmg/100m1
FIGURE 2
9
AVO
Q.71ONS
+12 02-IZ 0-1
NA AVII5NIAVN
AJ.IAVV
A1.13V
J.ON ;911
ZS Zb-11
bbl
97,
00J

INFORMATION ON ACTIVITY 2:
TEACHING NOTES:
1. The purposes of this activity are (1) to reinforce the nutritional
calculations in Biomedical Mathematics, Unit II, Sections 9 through 22, and
(2) to introduce the students to one of the main themes of the Science Unit-
analysis of the diet. We will return to this theme in later science activities
(Lessons 29 and 31) after the students have more background in nutrition.
2. Anticipated time: one to two periods.
3. It might be helpful to look up a few items with the class so students
get the knack of using food tables.
4. Our calculations are based on the food tables in USDA Home and Garden
Bulletin No. 72 (revised January 1971). If you use a different edition or a
different reference book, your values will often differ from those given here.
5. Access to calculators will be helpful in this activity.
6. The calculations can be assigned as homework.
7. The activity can be shortened by eliminating one of the two diets. It
can be extended by addition of additional 24-hour diets for analysis. In later
lessons, the students will analyze their own diets.
8. It is a good idea to discuss this activity with the mathematics instruc-
tor and, if possible, to read mathematics Sections 9 through 22 (Unit II). If you
don't have time to review the entire sequence, it is worthwhile at least to read
Section 9. The students could apply vector techniques in their calculations if
the math course has reached the appropriate point.
9. You may wish to emphasize that a nutritional analysis requires considera-
tion of sex, age, weight and other factors. Also, point out that a diet analysis
should be based on more than one day.
10. You may wish to point out that the two diets selected for analysis in
this activity are not representative of good diets.
11-40
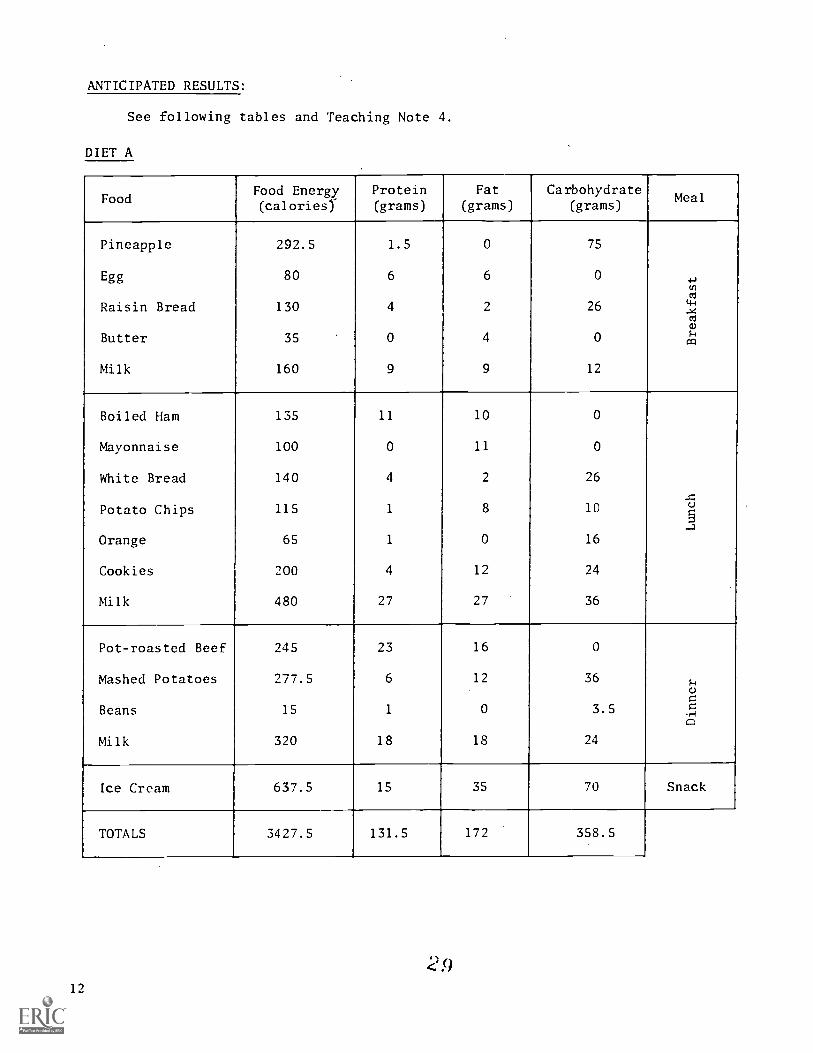
ANTICIPATED RESULTS:
See following tables and Teaching Note 4.
DIET A
FoodFood Energy(calories)-
Protein(grams)
Fat
(grams)Carbohydrate
(grams)Meal
Pineapple
Egg
Raisin Bread
Butter
Milk
292.5
80
130
35
160
1.5
6
4
0
9
0
6
2
4
9
75
0
26
0
12
4..)
tnm4-4
.-N4
m
Boiled Ham
Mayonnaise
White Bread
Potato Chips
Orange
Cookies
Milk
135
100
140
115
65
200
480
11
0
4
1
1
4
27
10
11
2
8
0
12
27
0
0
26
10
16
24
36
Pot-roasted Beef
Mashed Potatoes
Beans
Milk
245
277.5
15
320
23
6
1
18
16
12
0
18
0
36
3.5
24
s-,
gg
..-4
(=
Ice Cream 637.5 15 35 70 Snack
TOTALS 3427.5 131.5 172 358.5
<,912

DIET B
FoodFood Energy(calories)
Protein(grams)
Fat(grams)
Carbohydrate(grams)
Meal
Candy 110 0 0 28Snack(10:40 a.m.)
Cola
Candy
145
160
0
5
0
12
37
11
Snack(11:00 a.m.)
Candy 115 1 4 21Snack(1:00 p.m.)
Candy 145 2 9 16Snack(2:10 p.m.)
Chicken
White Bread
Mashed Potatoes
Corn
Butter
Peaches
90
140
277.5
140
70
75
12
4
6
6
0
1
4
2
12
2
8
0
0
26
36
32
0
20
coo=to==a)
>w
TOTALS 1467.5 37 53 227
ANSWERS TO DISCUSSION QUESTIONS:
1. A food may have different nutritional values based on how it is processed
or prepared. For example, white bread can be of the soft-crumb or hard-crumb
types, and it may be sliced thin or thick. These differences result in different
nutritional values.
2. The female diet (Diet A) included sufficient protein and more calories
than needed. The male diet (Diet B) was insufficient in regard to calories and
protein.
13

LESSON 3: (A) INTRODUCTION TO DIGESTION
(B) THE DIGESTIVE SYSTEM OF AN EARTHWORM
RATIONALE:
In this lesson the focus is shifted from the relation between diet and health
to an introduction to the digestive system. In Section 2 the process of digestion
and the anatomical structures involved are outlined. The basic concept of adapta-
tion is introduced. In the laboratory, the digestive system of a live earthworm
is examined.
OBJECTIVES:
The student will:
-list the principal nutrients (carbohydrates, fats, proteins).
-name and locate (e.g., on a drawing) at least three parts of the diges-
tive tract that play a role in digestion.
-describe how the digestive tract is adapted to its function.
-compare the anatomy of the digestive tracts of an earthworm and a
human.
SEQUENCE: ST-3; LA-3
SUGGESTIONS:
1. How did early investigators learn about the process of digestion? Two
anecdotes could serve to stimulate discussion.
a. In the eighteenth century, the French chemist Rgaumur experimented
with his pet hawk. Meat was placed in metal tubes with screened ends and fed to
the hawk. Rgaumur wanted to determine whether the changes that occur during diges-
tion are due to grinding or to some other process.
When the metal "cages" were regurgitated by his bird (a characteristic
of hawks; they feed on small animals and regurgitate the skin and bones after di-
gesting the "neat "), Rgaumur was able to observe that the meat was partly digested- -
changes had taken place in the meat. The metal tube was unchanged. He concluded
that the changes were not due to grinding.
b. In the nineteenth century, Dr. William Beaumont, an American military
surgeon, learned about a hunter who had accidentally shot himself in the stomach.
After healing, the wound had left a permanent opening through the abdominal wall
14 3

and into the stomach. For ten years Beaumont fed the hunter and sampled the
stomach contents through the "window." To Rgaumur and Beaumont, we owe much of
our early knowledge of the digestive process.
2. A tube or hose the approximate length of the digestive tract (25 feet)
could provide a useful model to begin a discussion of the digestive system. At
appropriate lengths, the various organs (in the form of paper mock-ups) could
be attached. Questions to consider: How does a tube of this length fit inside
our body? How does this crude model differ from a digestive tract?
3. A dissection of the fetal pig to show the digestive tract of a mammal
would be a worthwhile demonstration. Another option would be to obtain part of
the digestive tract of'a cow or sheep from a slaughter house; directions for doing
this are located in the Unit I Instructor's Manual, p. 33.
INFORMATION ON LABORATORY ACTIVITY 3:
TEACHING NOTES:
1. The primary purpose of this laboratory activity is to have the students
observe first hand the digestive and circulatory systems of the earthworm. A
secondary purpose is to give the students some experience in the art of
dissection.
a. You may wish to discuss why dissection is important and how it re-
lates to medicine. (See treatment in the introduction to the lab.) If you prefer,
a fetal pig or mammalian dissection could be performed. You may need to be con-
cerned about state laws regulating dissection.
b. Students who have qualms about or ethical objections to dissection
could be given an alternate activity, such as a library reading exercise. Once
students get going on a dissection (with some feeling for why they are doing it)
they generally find it a very exciting and illuminating experience.
2. Anticipated time: one period.
3. It should be emphasized that when the earthworms are submerged in the
alcohol solution they must be carefully observed to determine when they are suf-
ficiently anesthetized for the dissection. If they are allowed to remain in the
solution too long they will die. Also, if a worm is overly anesthetized, little
or no peristalsis will be observed in the digestive tract and the pumping of
blood through the aortic arches may be greatly diminished. If this happens, one
a:15
thing you can do is rinse the worm once or twice with saline solution. This will
usually remove sufficient alcohol to allow resumption of muscular contractions.
4. You may want to do a quick demonstration of how to open up an earthworm
if your students have never done a dissection before. A filmstrip might be
another good possibility.
5. The students are advised to put their worms back in the alcohol solution
when they finish the dissection to avoid the possibility of the worm "coming to."
This is a humane way of killing the worm and makes disposal easy for instructor
or assistant.
6. We suggest that the nightcrawler variety of earthworm be used lecause it
is large enough to make dissection and observation fairly simple. These worms
are readily available from biological supply companies. They should be ordered
to arrive a day or so before the activity takes place. They may be kept in a
container with moist earth and moss until needed. A few extra worms may be needed
to allow for a demonstration before the students begin the activity or for pos-
sible errors during the activity.
7. If you wish to read more about the earthworm before the activity, or if
any student is interested in obtaining more information, a suggested reference
is Chapter 20 in Ralph Buchsbaum's Animals Without Backbones, University of
Chicago Press, Chicago.
8. The directions call for a hand lens or a dissection microscope to aid
in observation. The hand lens (or even the naked eye) is adequate for this
activity, but good lighting is essential. A dissection microscope makes observa-
tion of the finished dissection very dramatic. If only one dissection microscope
is available in the classroom, it may be set up to demonstrate hearts beating or
the crop and gizzard contracting.
9. If there is sufficient time, students may wish to make a slide prepara-
tion of one of the segments, to observe the circular and longitudinal bands of
muscles. The procedure is outlined below.
Using the mid-portion of the worm, which has not been opened up, cut
off one segment using a sharp razor blade. Place the cross section on a slide
and cover with a coverslip. To make the cross-section thinner, gently push
down on the sides of the coverslip. Tape two sides of the coverslip down to
maintain the pressure. Examine the walls of the cross section under the micro-
scope. The students should be able to identify the circular and longitudinal
16

bands of muscles. The arrangement of these bands is similar to that which occurs
in the esophagus of man. You might ask the students to speculate on how these
two groups of muscles work to move food through the digestive tract. Peristalsis
will be treated in Section 5. The presence of small worms moving about within
the cross section may also be noted. These are likely to be round worms and are
very common inhabitants of soil, the earthworms' staple food. The students will
encounter round worms later in this unit when they study parasitic diseases.
INTESTINEANP
GONTZNTS
EPIDERMIS CS'S' t'a)
Lo NG iTUP I N AL.MUSCLES
serAeUSED IN 1-000NIOTION )
MATERIALS: (for 15 set-ups)
530 ml ethyl alcohol, denatured
32 , sodium chloride (NaCl)
20 live earthworms
15 dissection trays, waxbogy.
150 to 200 straight pins
15 fine-tip scissors(must be clean and sharp)
15 forceps
17

15 razor blades(must be clean and sharp)
15 dissection microscopes orhand lenses
paper towels
15 beakers, 250-ml
PREPARATION OF REAGENTS:
15 compound microscopes
15 light sources
tape
15 microscope slides withcoverslips (optional)
25% ethyl alcohol, 2 liters: To 530 ± 10 ml of denatured ethyl alcohol,
add 1470 ± 10 ml of water.
0.8% NaC1, 4 liters: Dissolve 32 ± 1 grams of NaC1 in 4000 ± 50 ml of water.
ANSWERS TO PROCEDURE QUESTIONS:
1. The gizzard contracts rhythmically.
2. The gizzard's function is the grinding up of food using sand particles.
3. The folds increase the surface area of the intestine, tl:as increasing
its absorptive capacity.
4. The movement resembles waves that sweep along the intestine. This is
peristalsis. The function is to move nutrients and waste through this organ. The
nutrients are absorbed through the intestinal walls and the waste is excreted upon
reaching the anus.
5. There are five arches. The students should be able to locate at least
four if they look carefully.
6. The arches contract rhythmically.
7. The arches contract and push blood out of the arches down the ventral
blood vessel. Their function is to maintain a steady circulation of blood through
the vascular system of the worm. They act as pumps analogous to the human heart.
8. The dorsal blood vessel also pulses with rhythmical contractions. These
contractions push the blood returning along the dorsal blood vessel onward to the
arches, where it is again pumped down into the ventral vessel.
ANSWER TO DISCUSSION QUESTION:
The digestive system of the worm is very similar to that of man, the primary
differences being that the worm's mouth does not contain teeth and that the worm
possesses a crop and a gizzard rather than a stomach. Also, the size of the worm's
intestine is fairly uniform throughout its entire length, while man's'intestine be-
comes wider in the last few feet (the large intestine or colon).
18
LESSON 4: (A) ENZYMES
(B) PROPERTIES OF THE ENZYME AMYLASE
RATIONALE:
Digestion consists of both mechanical and chemical processes. In this lesson
the concept is introduced that small pieces of food need to be further reduced bychemical changes. The role of enzymes in these chemical processes and the uniqueproperties of enzymes are described. In the following lessons, several different
enzymes will be considered in relation to digestion. In the laboratory activity,
the properties of amylase are investigated.
OBJECTIVES:
The student will:
-state the role of enzymes in digestion.
- describe the effects of catalysts on chemical reactions.
-contrast enzymes and non-biological catalysts.
- identify the suffix "-ase" as pertaining to enzymes.
-describe how an enzyme is affected by temperature and pH changes.
SEQUENCE: ST-4; LA-4
SUGGESTIONS:
1. A simple demonstration of catalysis might be used to start a discussion
on enzymes and catalysis. For example, the breakdown of hydrogen peroxide iscatalyzed by MnO,. Hydrogen peroxide decomposes ve-1-y slowly to water and oxygen.
2 H202
2 H2O + 02
But if manganese dioxide (Mn02) is added to the hydrogen peroxide, the reaction pro-ceeds at a much faster rate. The catalytic action of Mn02 can be demonstrated asfollows.
a. Into each of two test tubes, pour about 5 ml of 3% hydrogen pc:o:Ode.
h. Add a pinch of MnO,, to one test tube. The reaction 2 1120, 2 H2O +
will he greatly accelerated in this tube.
c. To demonstrate the increased amount of 02
being given off from the
tube to which Mn02has been added, place your thumb over the tube with the Mn0
2
19
3
in it to allow 02to build up. Then perform the glowing splint test for oxygen.
Repeat the procedure for the other tube.
2. The catalysis of hydrogen peroxide breakdown may also be demonstrated with
liver extract to emphasize enzymatic catalysis. Hydrogen peroxide is a by-product
of many chemical reactions that take place in our bodies. Because it is poisonous
to us, our cells must break it down immediately. Therefore, we are equipped with
an enzyme which performs the same function as MnO, did in the above reaction. This
enzyme is found in abundance in the liver. Therefore, a simple demonstration of
the biological catalysis of the above reaction may also be performed.
a. Place 2 ml of 3% H202
in'a test tube.
b. Add a small piece (size of a rice grain) of the liver to the test
tube and observe.
c. The procedure described above, using the glowing splint to demonstrate
the generation of 02, may also be used hre.
The enzymatic decomposition of H909 has clinical significance and will be
the basis of LA-6 (Detection of Blood in Simulated Stool).
3. LA-4 is designed to last at least two periods. You may wish to complete
Parts I and II of the activity, then discuss ST-4. The labs may suggest questions
for discussion. It may be best to defer Part III of the activity until after
Section 4 is covered.
4. Part III of LA-4 is open-ended, but relatively simple. The intent is to
encourage students to design their own investigation. Similar challenges of in-
creasing complexity will be provided in later activities.
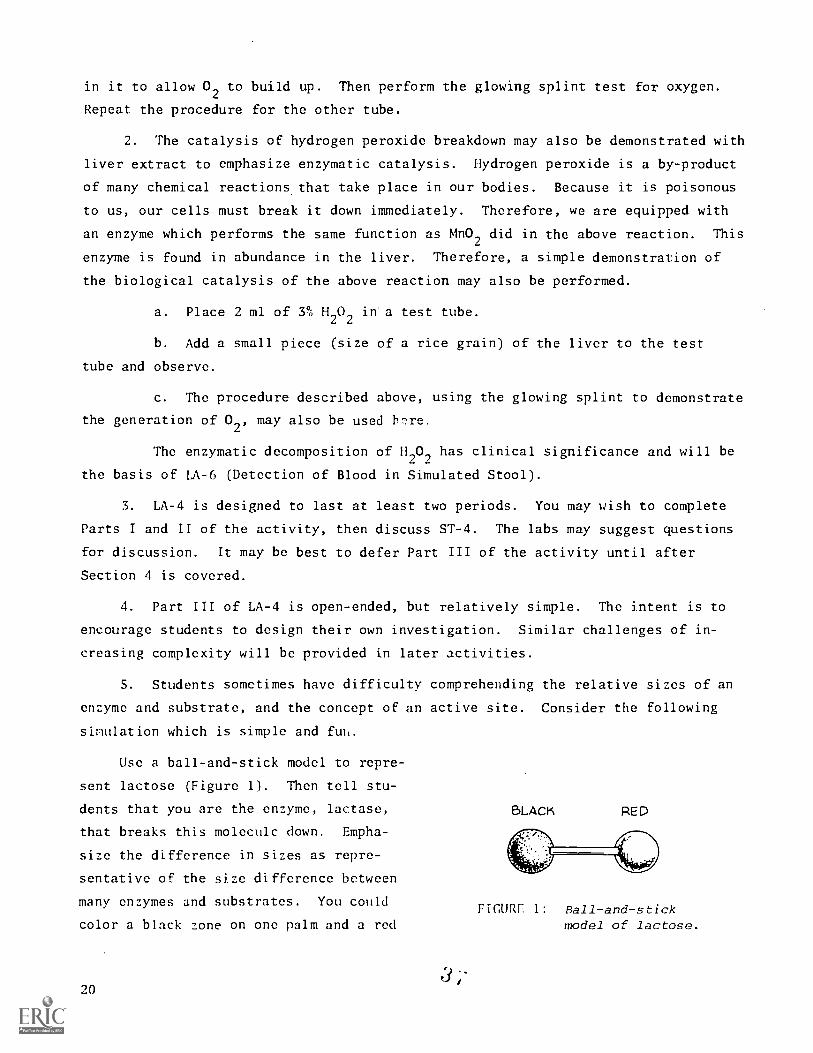
5. Students sometimes have difficulty comprehending the relative sizes of an
enzyme and substrate, and the concept of an active site. Consider the following
simulation which is simple and fuh.
Use a ball-and-stick model to repre-
sent lactose (Figure 1). Then tell stu-
dents that you are the enzyme, lactase,
that breaks this molecule down. Empha-
size the difference in sizes as repre-
sentative of the size difference between
many enzymes and substrates. You could
color a black zone on one palm and a red
20
BLACK RED
FIGURE 1: Ball-and-stickmodel of lactose.

zone on the other corresponding to the
model. Explain that these colored re-
gions are "active sites"--regions of
the enzyme that provide a surface com-
plementary to the substrate--and that
these active sites can fit the sub-
strate in only one way (Figure 2).
Any other position of you (the enzyme)
and the model (lactose) would not pro-
vide a fit between active site and
substrate and, therefore, would not
work.
INFORMATION ON LABORATORY ACTIVITY 4:
TEACHING NOTES:
FIGURE 2: Fit between active site andsubstrate.
1. The purpose of this activity is to give the students an opportunity to
verify some of the statements made about enzymatic activity that appear in ST-4,
namely, that the activity of an enzyme is affected by such variables as tempera-
ture and pH.
2. Anticipated time: two to three periods. (Each part of this activity takes
at least a half hour.) Plan enough lab time so that students will not be stopped
in the middle of any of the three parts.
3. The activity can be shortened by omitting one or more parts (e.g., Part II
on temperature effects might be eliminated). It can also be shortened by omitting
some of the variables. For example, in Part I, students could compare only two
proportions of the substrate:enzyme; and in Part II students could compare the
rate of starch breakdown at room temperature and only one other temperature.
4. The activity may be expanded by adding variables and assigning more open-
ended activities, as in Part III. In addition, students could be required to pre-
pare some of the reagents.
5. If you wish to save pH paper and time, the pH 5 and pH 9 solutions for
Part III could be prepared in advance for the students. This would also reduce
the amounts of 0.1 M HC1 and 0.1 M NaOH needed.
6. If desired, saliva can be used in this activity as a source of amylase.
However, the quantity necessary is not easily obtained. Also human saliva varies
greatly in biological activity and therefore is unpredictable in a laboratory
21

activity. For these reasons we recommend using a simulated saliva solution. If
you prefer to have the students use their own saliva, they will need to collect
about 30 ml per team. This is then mixed with a equal volume of water and filtered
through a double layer of cheese cloth. It should be stored in the refrigerator.
Chewing a piece of Parafilm or clean rubber bands will help to cut down on the time
necessary to collect the saliva.
7. Ideally each team should have access to two spot plates. If spot plates
are not available they can be constructed by drawing heavy lines on glass plates
with a glass-marking pencil. The pencil line will keep the solutions separate.
If this is done, the glass plates should be placed on white paper so that the
colors of the solutions can be seen easily.
8. The composition of the starch solution in this activity is of great impor-
tance. If you follow the directions given for its preparation, the amount of time
necessary to complete the spot tests should be fairly consistent. If a starch
solution of different composition is used, it may take more or less time to demon-
strate starch breakdown.
9. The iodine solution must be added to the spot plate at the time the spot
test is performed. If it is dropped onto the plates at the beginning of the check-
ing period, the concentration of iodine will change due to evaporation. This will
affect the results obtained when the test is finally run.
10. You may wish to point out to the students that the enzyme source is pig
pancreatic amylase, rather than human saliva. The pig enzyme is readily available
and is similar to the human enzyme in function.
11. In enzyme reactions, clean glassware is especially important. Traces
of dirt or detergent may inhibit an enzyme.
12. Distilled water is not required to make up the solutions unless the tap
water in your laboratory has a pH far from neutral.
13. Part III has been designed to encourage the students to solve problems.
Because of the similarity of the problem in Part III to those solved in the rest
of the activity, it is probable that the students can do all or much of the design
themselves. However, you are in the best position to judge the capabilities of
your class--you may wish to structure the activity differently. Possibilities
include the following.
3
a. Have the students design and test a procedure. Allow them to make
mistakes and then discuss the results. You might even have them redesign and
repeat the activity based on this discussion.
b. Have the students submit a written procedure or outline for your
evaluation before proceeding.
c. Have the students "brainstelm" on how they would design the procedure.
d. Provide the students with a procedure such as the one given. in
"Anticipated Results."
14. Since it requires time to transfer the solutions to the spot plates, the
students will not be able to perform each test precisely at one-minute intervals.
However, this will not significantly affect the results because the time lag in-
volved should be fairly uniform for each one-minute test.
MATERIALS: (for 15 set-ups)
21.5 g sodium -hloride (NaC1)
9.0 g potassium chloride (KC1)
1.8 g sodium bicarbonate (NaHCO3)
9.0 g alpha-amylase (Sigma, #A6880,Type VI-A from hog pancreas)
15.0 g potassium iodide (KI)
7.5 g iodine (12)
8.0 g souble starch (e.g., "Niagara"instant laundry starch)
2.1 ml hydrochloric acid (HC1), conc.
1.0 g sodium hydroxide (NaOH)
Part II Only:
30 beakers, 250-ml
15 thermometers
15 test-tube holders
10 lb ice
15 gas burners
Part III Only:
pH paper, range 1-11
90 test tubes, 16 x 125 mm
90 stoppers, cork #4
30 pipets, 10-ml
60 medicine droppers
15 test-tube racks
15 spot plates
15 glass-marking pencils
paper towels
clock with second hand
15 ring stands
15 ring-stand rings
15 wire gauzes
matches
23

PREPARATION OF REAGENTS:
Simulated Saliva, 900 ml: Add 21.5 ± 0.1 g NaC1, 9 ± 0.1 g KC1 and 1.8 ±
0.1 g of NaHCO3 to enough water to make up 900 ml. Adjust pH with 0.1 M HC1 or
0.1 M NaOH to 7.0. Add 9 ± 0.1 g of alpha-amylase and stir to dissolve. Store
in refrigerator. Will keep for 3 days.
Iodine Solution, 900 ml: Dissolve 15 ± 0.1 g KI and 7.5 ± 0.1 g 12 in
900 ml water. Store in brown bottle. Will keep for long periods.
Starch Solution, 800 ml: The preparation of starch is a critical part of
the activity. To 8 ± 0.1 g soluble starch (e.g., "Niagara" instant laundry starch)
add 800 ml boiling water. Stir to dissolve. Store in refrigerator. Will keep
for 5 days.
0.1 M [(Cl, 250 ml: Add 2.1 ± 0.1 ml concentrated HC1 to about 200 ml of
water. Add water to total 250 ml.
0.1 M NaOH, 250 ml: Dissolve 1 ± 0.1 g NaOH in enough water to make 250 ml.
ANTICIPATED RESULTS:
PART I: EFFECT OF PROPORTIONS OF ENZYME AND SUBSTRATE ON RATE OF REACTION
S4 + A4: brown-black at 1 minute, yellow-black at 2 minutes and yellow-
brown after 11 minutes.
S8 + A4: blue-black at 1 minute and yellow-black at 18 minutes. The reac-
tion is not completed within 20 minutes. (At 20 minutes the color
is still yellow-black.)
S4 + A8: blue at 1 minute and yellow-brown after 2 minutes.
Note: Although the above results indicate that the high proportion of enzyme
to substrate works best, it should be made clear to the students that this situation
does not normally exist within biological systems. In biological systems the pro-
portion of enzyme to substrate is small.
PART II: EFFECT OF TEMPERATURE ON ENZYME ACTIVITY
Cold: blue-black at 1 minute, blue at 8 minutes and yellow-brown after
25 minutes.
Room Temp: blue-black at 1 minute, blue at 3 minutes and yellow-brown
after 14 minutes.
Hot: blue-black at 1 minute and remains blue-black through the entire test.
4124

Note: The most effective temperature was room temperature. Eventually
starch was digested at S °C, but very slowly. This is the case because molecules
move more slowly at low temperatures and react more slowly. There was no reaction
in the "hot" solution because of enzyme denaturation.
PART III: EFFECT OF pH ON ENZYME ACTIVITY
SAMPLE PROCEDURE:
1. Label three test tubes "pH 5," "pH 7" and "pH 9." Label three more "A."
2. Add 4 ml of starch solution to the three tubes labeled with pH's.
3. Add 0.1 M HC1 one drop at a time to the tube marked pH 5 until the starch
solution gives a reading of pH 5 when tested with pH paper. Be sure to check the
pH after each drop of HC1 is added.
4. Add 0.1 M NaOH one drop at a time to the pH 9 tube until the starch solu-
tion gives a reading of pH 9.
5. Add 4 ml of simulated saliva (containing amylase) to all the tubes
labeled "A."
6. Adjust one of the saliva tubes to pH 5 and another to pH 9.
7. Prepare a data sheet similar to the one below.
Time Elapsed pH 5 pH 7 pH 9
1 minute
2 minutes _.
20 minutes
8. Organize your data sheet, spot plates, droppers, etc.
9. At "Zero Time," combine the contents of one tube of simulated saliva solu-
tion, with the appropriate tube of starch solution. Shake gently to mix and put a
clean dropper in each tube.
10. When one minute has passed, place 4 drops of each mixture on the spot plate
and add 1 drop of iodine solution. Mix by tapping or gently swirling the plate.
Record the colors.
11. Repeat Step 10 once every minute for each reaction until the color
changes to yellow-brown, or 20 minutes is up, whichever happens first.
2S
ANTICIPATED RESULTS: The results will vary depending upon the procedure devised.
When we performed the procedure given above the following results were obtained.
pH 5: remains blue-black throughout.
pH 7: same as Part II, room temperature.
pH 9: remains blue-black throughout.
ANSWERS TO DISCUSSION QUESTIONS:
1. Increasing the amount of substrate, while holding the amount of amylase
constant, significantly increases the time necessary for the complete digestion ofstarch. Increasing the proportion of enzyme reduces the digestion time drastically.
2. When amylase is in a cold environment its enzymatic activity is greatlydecreased.
3. A high-temperature environment destroys the catalytic activity of amylase.
When enzymes are exposed to high temperatures, their structures undergo denaturation
(a change which renders them inactive).
4. Salivary amylase is most active around pH 7.
5. One might expect the pH of the saliva under normal circumstances to bearound pH 7. This could be tested by testing a sample of saliva with pH paper.
LESSON 5: DIGESTION IN THE MOUTH AND STOMACH
RATIONALE:
ST-5 discusses in detail the aspects of digestion which occur in the mouth,
esophagus and stomach. ST-7 and ST-8 will complete the processes of digestion.
There is no LA-5 since LA-4 is intended to extend over 2 to 3 periods. The
activity on amylase (LA-4) was selected in part to coincide with the discussion
of salivary amylase.
OBJECTIVES:
The student will:
-describe t17 se processes of digestion which begin in the mouth.
-describe the functions of saliva in digestion.
-define peristalsis and explain its function.
426

-describe the most importan function of the stomach.
-describe the biological function of reverse peristalsis.
SEQUENCE: ST-5
SUGGESTIONS:
1. The laboratory activity on amylase, LA-4, can be used to open discussion
on digestion. One caution--the enzyme used in the activity was not salivary amy-
lase but was derived from pig pancreas. Consequently, the optimal pH and other
properties of that enzyme are not identical to those of the salivary enzyme.
2. A simple demonstration of the effect of amylase can be done by giving stu-
dents unsalted crackers to chew. The crackers should be bland in flavor and the stu-dents should be told to (1) chew the cracker but not swallow it until the end of thedemonstration, (2) record the initial taste and (3) record the taste after a minuteor two. As the starch in the crackers is digested to simpler sugars, the students
should be able to detect a change of flavor from bland to sweet.
S. You may wish to refer to a physiology textbook periodically as you presentthe lessons on digestion. Some useful references are listed in Lesson 1.
4. In discussing peristalsis, you may wish to refer back to LA-3, the earth-
worm dissection. Students probably saw peristalsis in the digestive tract.
LESSON 6: PEPTIC ULCER
RATIONALE:
SE-6 discusses the origin, nature, diagnosis and treatment of peptic ulcer,
using the case-history approach. Peptic ulcer is a common medical problem related
to the digestive process. It is the fourteenth most common cause of death in thiscountry. In LA-6, the students will analyze for blood in the digestive tract.
Such bleeding could be indicative of peptic ulcer as well as other conditions.
OBJECTIVES:
The student will:
- describe the symptoms of peptic ulcer.
state how the stomach is protected from digestion by hydrochloric acid.

-define a psychosomatic condition.
-explain how blood is detected in stools.
SEQUENCE: ST-6; LA-6 (or reverse)
SUGGESTIONS:
1. LA-6 and ST-6 are closely related. Either one may be used to motivate
the other.
2. The case history of Maria could be used to stimulate a discussion. It
could be used to answer such questions as:
What symptoms suggested an ulcer? Why?
How did Dr. Miller confirm the diagnosis?
What characteristics of Maria made her a good candidate for an ulcer?
3. Ulcers are so common that one or more of your students may have suffered
from this condition. If so, perhaps they could contribute some personal experience
to the discussion.
INFORMATION ON LABORATORY ACTIVITY 6:
TEACHING NOTES:
1. This activity introduces a procedure for the detection of blood in stool
specimens. This complements the peptic ulcer case history in ST-6. The procedure
is one used in many hospitals as part of the diagnosis of gastrointestinal bleeding.
A positive result indicates the presence of lesions somewhere in the digestive
tract. Other confirmative tests must be made before a specific diagnosis can be
reached.
2. Anticipated time: one period.
3. The quantities of blood added to the four simulated stool samples provide
results ranging from "negative" to "very heavy bleeding" so that adequate compari-
sons can be made by the students.
4. Fresh blood is preferred for this activity. It can be obtained from a
hospital medical laboratory. Request that the blood be citrated. Alternative
directions are included for the use of blood from raw beef.
S. o-tolidine carries a cautionary label. By law, the entire family of
aniline drugs must warn that they may be carcinogenic. In reality, casual brief
28

contact with this substance is relatively harmless. Spills on the skin should be
washed off with soap and water. Other spills should be carefully cleaned up with
absorbent material.
6. The tares used in Procedure Step 2 should be bond or other hard-surfaced
paper to minimize absorption of the stool samples.
MATERIALS: (for 15 set-ups)
20 g each of four simulatedstool samples
20 g cornstarch
20 g cornmeal
food coloring (red,green and yellow)
1.5 ml blood
60 ml acetic acid, glacial
0.8 g o-tolidine, reagentgrade, (MCB TX705)
400 ml ethyl alcohol,denatured
PREPARATION OF REAGENTS:
50 ml hydrogen peroxide solution, 3%
60 test tubes, 16 x 125 mm
15 graduated cylinders, 10-ml
15 medicine droppers
15 balances
15 test-tube racks
60 stoppers, cork, #4
15 glass-marking pencils
60 toothpicks
Simulated Stool Samples: Combine 20 g cornstarch with 20 g cornmeal. Mixby stirring. In a second container, combine 25 ml tap water, 24 drops (1.2 ml)
red food coloring, 8 drops yellow food coloring and 12 drops green food coloring.
Add the colored water to the mixture of cornmeal and cornstarch. Stir to mix
thoroughly. Divide into four equal parts (about 20 g each), and place in four
containers labeled A, B, C and D. Add whole blood as indicated.
Sample A: 1 drop
Sample B: 1 ml
Sample C: 6 drops
Sample D: no blood
Adjust the samples to the desired consistency by adding either water or cornstarch
in small amounts. Cover the samples and store under refrigeration for up to 3 days.
Alternative to whole blood: Snip, using scissors, 4 oz beef liver, and allow
to stand for 30 minutes. This should provide at least 3 ml of blood. Since the
beef blood has not been citrated while still fresh, its peroxidase activity should
4 I; 29

be somewhat less than that of fresh, citrated whole blood. For this reason, use
twice the volumes indicated for whole blood. In addition, it may be necessary to
instruct the students to allow their samples to stand for 10 to 20 minutes before
recording their results (Procedure Step 8).
Acetic Acid Solution: Add 60 ml glacial acetic acid to 240 ml of water.
This solution is stable indefinitely.
o-tolidine Solution: Dissolve 0.8 g reagent grade o-tolidine in 400 ml of
denatured ethyl alcohol. The solution is stable for 30 days if refrigerated.
(Please note: Inferior grades of o-tolidine produce less marked results.)
ANTICIPATED RESULTS:
COLOR GRADE
Sample A faint green 1
Sample B dark blue-green 4
Sample C light to medium blue-green 2-3
Sample D no color 0
ANSWERS TO DISCUSSION QUESTIONS:
1. Since the amounts of o-tolidine and hydrogen peroxide in each tube are
the same, the reaction in each test tube containing blood should proceed to the
same endpoint, i.e., the final result for each sample containing peroxidase should
be a dark green color. Peroxidase is not used up in the reaction since it is an
enzyme. Consequently, different amounts of peroxidase affect only the rate of
the reaction.
2. Meat contains blood and the blood contains peroxidase. The test might
give a positive result, even though no lesion is present.
3. To determine whether bleeding is intermittent or continuous. The results
of a single test may be misleading.
4
30

LESSON 7: (A) DIGESTION IN THE DUODENUM
(B) ANALYSIS OF GALLSTONES FOR BILIRUBIN
RATIONALE:
In this lesson we return to the digestive process, continuing from wh re we
left off in Lesson 5. This lesson focuses on the duodenum, the liver, the gall-
bladder and the pancreas--organs of critical importance to digestion. LA-7 gives
the students experience with a qualitative test for bilirubin in gallstones.
OBJECTIVES:
The student will:
- identify those nutrients that are digested in the duodenum.
-describe the roles of the liver, gallbladder and pancreas in digestion.
- explain the role of bile in digestion.
- define a hormone and give one example of how hormones aid in digestion.
-describe a qualitative test for bilirubin in gallstones.
SEQUENCE: ST-7; LA-7
SUGGESTIONS:
1. Step 6 of the procedure of LA-7 calls for a 30-minute waiting period.
You may wish to use that time for discussing Student Text or LA-8. At any rate,
it will be necessary to plan the activity so that there will be at least 30 minutes
time available after Step 6 is performed.
2. The students may be interested in the etymology of the term "duodenum."
The word "duodenum" is derived from a Latin word meaning "twelve fingers each,"
a reference to the fact that the length of the organ is about the same as the
width of twelve fingers.
3. You may wish to expand on the role of hormones in the body since they are
so important in human physiology. See Background Information.
4. You can refer to foods to illustrate the nature of an emulsion and an
emulsifying agent. Some examples of emulsions are mayonnaise and homogenized milk.
Oil and vinegar salad dressing is not an emulsion; after mixing it will separate
into layers. But you can demonstrate how to make an emulsion with oil and vinegar.
Mix about 20 ml of vinegar with about four times as much salad oil. They will
31
48

separate into two layers. Then beat an egg into the mixture. After beating, the
various components will not separate out into layers because the egg contains
emulsifying agents.
BACKGROUND INFORMATION ON HORMONES:
The term "hormone" comes from a Greek word meaning "to stir up" or to excite.
Hormones generally serve as messengers or regulators. The play important roles in
most homeostatic systems in the body.
Hormones vary in chemical structure. Many are polypeptides or small proteins.
Examples of such hormones are insulin, growth hormone and oxytocin (stimulates
milk production in females). Thyroxin is an example of a hormone that is an amino
acid. Steroid hormones are made from cholesterol. Examples of steroid hormones
are the sex hormones and cortisone. An interesting class of hormones that is under
scrutiny are the prostaglandins. These substances are complex polyunsaturated
fatty acids. The prostaglandins perform a variety of functions such as lowering
the blood pressure and stimulating the smooth muscles. Of particular interst in
the context of this unit on nutrition is that prostaglandins are made from arachi-
donic acid. Arachidonic acid is one of the essential fatty acids. In has been
suggested that prostaglandins may have clinical implication for treatment of
several diseases including heart disease and asthma.
An imbalance of hormones is associated with a number of diseases as shown
in the table on the following page.
Of special interest in the context of nutrition are the digestive hormones.
Gastrin, for example, is a polypeptide hormone produced in the stomach lining.
It causes secretion of pepsinogen and HC1. Secretin is another polypeptide,
hormone. It is produced in the duodenum, released to the blood stream, and
causes the pancreas to secrete water and bicarbonate into the duodenum, thus
neutralizing the acidic material entering the duodenum from the stomach. Cho-
lecystokinin is another digestive hormone produced in the upper intestinal mucosa.
It causes the gallbladder to contract and release bile.
4 .9
32

HORMONE DISEASE COMMENTS
thyroxin
-.
goiter insufficient iodide in the diet,low BMR (Section 19)
cretinism retarded growth, mental retarda-tion, genetic defect (Section 26)
hyperthyroidism activity of thyroid too high,high BMR (Section 26)
insulin diabetesmellitus
high blood sugar, high rate ofurine production (Sections 24 & 32)
adrenal cortexhormones
Addison'sdisease
insufficient hormone production;loss of weight, weakness, lowblood sugar
growth hormone hormonaldwarfism
insufficient hormone production;physical retardation
acromegaly excess hormone production; en-larged hands and feet, distortedfacial features
adrenocorticotropichormone (ACTH)
Cushing'sdisease
too much adrenal contex hormonedue to excessive ACTH production;muscle degeneration, brittle bones,high blood pressure
INFORMATION ON LABORATORY ACTIVITY 7:
TEACHING NOTES:
1. In this activity and the next one the students will perform a qualitative
and a quantitative test on gallstones for bilirubin. The purpose of these activi-
ties is three-fold:
a. to give the students a chance to work with a clinical specimen,
a gallstone;
b. to provide the students with an opportunity to perform an analytical
test that they might do if they worked in a clinical pathology laboratory; and
5.0 33

c. to stress the difference between quantitative and qualitative
tests in biomedicine.
2. Anticipated time: one
3. For both instructional and motivational reasons, it is desirable that the
students work with authentic gallstones. It should be possible to obtain gall-
stones through the clinical pathology laboratory of your local hospital. Operations
for gallbladder and stone removal are common, so that procuring 3 or 4 gallstones
for the activities should present no problem. You might request that if possible
you be supplied with a few stones of orange color, since this color is usually due
to the presence of bilirubin.
4. Two samples of ground-up gallstone are called for. One sample should be
derived from one of the gallstones. Pick a relatively large one since you will
need enough ground-up sample for use in this activity and the next, where the
quantitative analysis is performed. The second sample is simulated, and contains
only calcium carbonate. The reason for incorporating one simulated sample is to
add an element of discovery to the activity by insuring that there will be at
least one negative result in the testing. Since stones that do not contain any
bilirubin are very rare, this sample is simulated. Instructions on how to pre-
pare the sample are included below. If you are unable to obtain a real gallstone,
you could use two simulated samples. Relevant instructions are included below.
5. The 4 ml of bilirubin-detection reagent described in Procedure Step 4 is
sufficient for two students, each performing two tests.
MATERIALS: (for 30, s,et-ups)
3 to 4 gallstones
1.25 g sulfanilic acid
15 ml hydrochloric acid(HC1), conc.
10 g sodium nitrite (NaNO2)
100 mg bilirubin
10 to 20 g calcium carbonate
400 ml methyl alcohol
2 mortars and pestles
150 test tubes, 16 x 125 mm,Pyrex
34
30 scoopulas
15 graduated cylinders, 10-ml
30 small funnels
15 test-tube racks
60 rubber stoppers, #0
15 glass-marking pencils
30 pipets, 1-ml, and rubber bulbs
15 balances
60 filter papers, WhatmanNo 1, 11 cm
5

PREPARATION OF REAGENTS:
Bilirubin-detection reagent: (This reagent is also to be used in Activity 8).
Solution A: Dissolve 1.25 ± 0.01 g sulfanilic acid in 15 ± 1 ml of conc.
HC1 and dilute by adding to 235 "t 5 ml of water.
Solution B: Dissolve 10.0 ± 0.1 g of sodium nitrite in water and dilute
to 50 ± 1 ml. Store in refrigerator. Will keep up to 4 weeks.
Reagent: Take 1.0 ± 0.01 ml of Solution B and dilute to 10 ± 0.1 ml
with water. Add 100 ± 1 ml of Solution A to 3.0 ± 0.1 ml of dilute Solution B.
Mix. This reagent should be used within 30 minutes after preparation.
Gallstone mixture: The table that follows gives instructions on how to makeup the gallstone samples. If a real gallstone is used as Sample #1 in this activity
and is found to contain bilirubin, the remainder should be saved for use in LA-8.
If gallstones are not available, then both samples in LA-7 will have to be simulat-
ed. Calcium carbonate is used as a filler in the simulated samples. It may cause
bubbling when acidic reagents are added. However, this should not be a problem
since bubbling will not interfere with the color reaction.
TABLE: COMPOSITION OF GALLSTONE SAMPLE
SAMPLE REAL GALLSTONE CALCIUM CARBONATE BILIRUBIN
Sample #1
Sample #1,simulated
Sample #2,simulated
10 g
---
---
---
10 g
10 g
- --
.1 ± .01 g
___
SPECIAL NOTE: The simulated gallstone mixtues may be made up in advance
except for the one containing bilirubin. Bilirubin is unstable and is converted
to biliverdin which does not react with the color reagent used. Therefore, in
the case of Simulated Sample #1, bilirubin should be added to the mixture just
before it is to be used.
ANTICIPATED RESULTS:
The results for real gallstones should be positive since most stones contain
bilirubin. If Sample #1 is simulated, a positive test for bilirubin should result.
Simulated Sample #2 will give a negative result.
35
5

ANSWERS TO DISCUSSION QUESTIONS:
1. The test done for bilirubin is qualitative because it gives only a
positive or negative result indicating the presence or absence of bilirubin in
the sample. A quantitative test would give results indicating how much bilirubin
was present, if any.
2. This test could be converted to a quantitative one by measuring the
intensity of the color with a colorimeter and then determining the concentration
of bilirubin present from a standard calibration line made by testing samples of
known bilirubin concentration. (This, in effect, is what will be done in LA-8.)
LESSON 8: (A) DIGESTION AND ABSORPTION IN THE INTESTINES
(B) QUANTITATIVE ANALYSIS OF GALLSTONES FOR BILIRUBIN
RATIONALE:
In this lesson the digestive and absorptive processes which occur beyond
the duodenum are discussed. Most of digestion and absorption occurs in the
small intestine. In the laboratory, the students perform a quantitative analy-
sis for bilirubin. Since this activity follows a qualitative analysis of bili-
rubin, the two activities illustrate the distinction between qualitative and
quantitative analyses.
OBJECT IVES:
The student will:
-describe the digestive events that occur in the small intestine.
-explain the role of villi in absorption.
-state which nutrients are absorbed into the blood and which into the
the lymphatic system.
-define appendicitis and describe how it is treated.
-summarize the digestive processes, from the mouth to the large intestine.
-explain the difference between qualitative and quantitative analyses.
-describe how bilirubin is analyzed for by colorimetric techniques.
SEQUENCE: LA-8; ST-8
36

SUGGESTIONS:
1. Structurally, villi are well adapted to the function of absorption.
The structure-function relationship is a recurrent theme in this course and
merits emphasis. If you have slides of the intestinal wall, they should show
what villi look like. Also, if you have access to a fetal pig or other source
of small intestine, the students could observe villi through the microscope.
2. Appendicitis is a common medical problem, and one or more students may
have personal experiences to contribute. You may wish to amplify the brief dis-
cussion of appendicitis with reference to the following Background Information.
BACKGROUND INFORMATION ON APPENDICITIS:
Appendicitis should be of medical interest to high school students because
over 30% of all cases occur between the ages of 11 and 20 with the peak frequency
being about age 15. And appendicitis is fairly common. An average-sized commun-
ity hospital can be expected to care for about 100 cases annually.
Appendicitis is the acute inflammation of the appendix due to bacterial in-
fection. The cause is not always known but is often felt to be the retention of
something in the appendix. Whatever the precipitating cause, once started the
inflammation tends to progress. Without surgical or antibiotic intervention, the
appendix may rupture, and fatal peritonitis may result.
The first symptom is usually abdominal pain. Although the appendix is lo-
cated in the right abdominal region, the initial crampy pain need not be at the
same point. Fever, if present, is almost always low grade (under 38 °C).
Another early symptom is loss of'appetite, and in about half of the cases nausea
is present. After 2 to 24 hours the initial pain subsides, but a more persistent
and "heavier" pain localizes in the region of the appendix, usually at what is
known as McBurney's point, which is near the base of the appendix. A careful
examination will usually reveal the following early signs of peritoneal irritation.
1. Tapping over the tender area will be painful.
2. The abdominal muscles will be slightly more tense on the right side
than on the left--especially on gentle pressure.
3. Coughing may cause the pain to worsen momentarily.
If the examiner suspects appendicitis, usually the patient will be observed
very closely. The commonest laboratory study is a white blood cell and differ-
ential blood cell count. Most cases of appendicitis will show an increase in
37

total white blood cells and/or an increase in the proportion of polymorphonuclear
cells (PMN's or neutrophils).
If the probability of early appendicitis is high, surgical exploration is
recommended. Doubtful cases are medically observed. In women, the diagnosis
may be more difficult because right ovarian bleeding at ovulation and pelvic in-
flammatory disease may cause similar symptoms.
During the observation period, food must
or laxatives must not be given. Rupture with
in the 11- to 20-year age group but is common
not be consumed and pain killers
subsequent peritonitis is uncommon
in very young or old patients.
Mild appendicitis sometimes subsides spontaneously. Unfortunately, a recur-
rence (if it occurs) is likely to be more difficult to diagnose. For this reason
(and others) antibiotics should not be used until a definite diagnosis can be made.
INFORMATION ON LABORATORY ACTIVITY 8:
TEAMIN; NOTES:
1. In this activity the analysis of gallstones for bilirubin is continued.
This time a quantitative test is performed to determine the concentration of bill-
rubiu in zhe samples that gave a positive reaction for the qualitative test per-
formed in LA-7.
2. Anticipated time: one to two periods (including waiting time).
3. You may wish to review the procedure for setting up the BIP and test
well for colorimetry and standardize the instrument with the -blank while the
students wait for the bilirubin reaction to occur. The absorbance-transmittance
table appears on the inside rear cover of the Laboratory Manual.
4. The colorimetry reading is this activity should be made from 30 to 40
minutes after the reagent is added to provide time for the development of a
stable color.
S. If a real gallstone was used in LA-7 and found to contain bilirubin,
this same stone should be used for the quantitative analysis. If this was not
the case, a simulated sample will do. Such a sample can be prepared using the
instructions given for simulated sample ffl in the information on LA-7. The
sample should be prepared immediately before it is used.
MATERIALS:
gallstone used in LA-7 100 mg bilirubin
6 ml hydrochloric acid (HC1), conc. 10 g calcium carbonate (CaCO3)
5.,
38
(optional)t i ona 1 )

bilirubin-detection reagent (fromSolutions A and B prepared forLA-7)
750 ml methyl alcohol
2 mortars and pestles
120 cuvets, 16 x 125 mm, Pyrex
60 rubber stoppers, #0
30 scoopulas
15 graduated cylinders, 10-ml
PREPARATION OF REAGENTS:
30 small funnels
15 test-tube racks
15 glass-marking pencils
30 pipets, 1-ml, and rubber bulbs
15 balances
60 filter papers, Whatman No. 1, 11 cm
10 BIP colorimeters
Bilirubin blank: Dilute 6 ± 0.1 ml of conc. HC1 by adding it to 94 ml
of water.
ANTICIPATED RESULTS:
The results will vary depending upon the gallstone used. We obtained a re-
sult of 0.76 mg of bilirubin per 100 mg of gallstone analyzed. In a simulated
sample prepared as described in the information on LA-7, the amount of bilirubin
in 100 mg of sample should be about 1.0 mg.
ANSWERS TO DISCUSSION QUESTIONS:
1. The concentration of bilirubin is determined by dividing the value ob-
tained from the graph by 10, since the total volume of the sample solution was
10 ml rather than 100.
2, One of the principles employed when making up blanks for colorimetry is
that the blank should contain all the same components used to make up the reagent
tube, except for the active ingredient in the reagent. Thus the reaction between
the chemical being analyzed for and the reagent only occurs in the reagent tube
and the difference in transmittance readings can be directly attributed to this
chemical reaction.
3. To obtain a graph relating absorbance to standard known concentrations
of bilirubin one would prepare a series of solutions containing known concentra-
tions of bilirubin. Then a sample of each of these solutions would be tested
with the bilirubin-detection reagent and the % T measured with the colorimeter.
The % T readings are then converted to absorbance values and a graph is drawn
relating the absorbances to the bilirubin concentrations of the solutions tested.
4. If the color reaction is so intense that the transmittance reading is
too low for the colorimeter, then the solution must be diluted to bring it within
39

the desired range. The concentration of the original solution is found by multi-
plying the result obtained by the dilution factor used.
5. The sources of error in this analysis include:
a. error in all mass and volume measurements;
b. loss of some of the solution during filtration, making the actual
volume of the test solution on which the final calculations are based slightly
less than 10 ml;
c. error in the standard graph;
d. error caused by using a standard graph based on a single colorimeter
to interpret data obtained with other colorimeters;
e. incomplete extraction of the bilirubin so that some of it was not
dissolved and thus did not take part in the color reaction;
f. errors made in standardizing the colorimeter and in reading the
transmittance when testing the samples.
LESSON 9: (A) DISORDERS OF THE DIGESTIVE TRACT
(B) REVIEW
RATIONALE:
In this lesson some of the more common diseases and ailments of the diges-
tive tract are considered. The focus on medical problems serves, in part, to
review the sequence of lessons on digestion. There is no laboratory activity
scheduled, since a review of the digestion sequence is intended.
OBJECTIVES:
The student will:
-explain the difference between the two forms of viral hepatitis.
-define and list the symptoms of gallstones and pancreatitis.
-identify the most common cause of recurrent indigestion.
SEQUENCE: ST-9
SUGGESTIONS:
1. A brief reference is made to immunology in ST-9. You may wish to expand
on this topic. However, part of Unit III will be devoted to this subject.
40
2. The results of the two laboratory activities on gallstones may be re-
viewed in relation to Section 9-2 on gallstones.
3. It is likely that Section 9-4 will strike a familiar chord in most stu-
dents because minor gastrointestinal disorders are so common. The treatment in
the Student Text emphasizes the relation between psychology and disorders of
the digestive tract. You may wish to discuss this material with your colleague
in Biomedical Social Science.
You might suggest to the students the task of watching one or more
TV commercials on drugs and GI disorders. Students can report on what was said
and evaluate the commercials in the light of Section 9-4.
4. Between Lessons 9 and 10 would be an excellent time to review and give
the students a quiz.
KEY--REVIEW SET 9:
1. Whereas man once grew or gathered his own food, through time the produc-
tion (and even preparation) of food has been centered in fewer individuals. The
need for food preservation has created pioblems in such areas as loss of nutrients,
safety of Additives, etc.
2. The Framingham study indicated a relationship between high blood-
cholesterol level and heart disease. The blood-cholesterol level is, in turn,
related to diet.
In North Kyrelia, Finland, there is an unusually high rate of heart
disease. The prevalence of this disease, is associated with a diet rich in the
kind of fats that can be converted to cholesterol.
Other studies have shown that dietary salt is also related to heart
disease. Finally. obesity increases the risk of heart disease.
3. In the process of digestion, the proteins and carbohydrates in food are
changed to small and soluble substances which can pass into the bloodstream
through the walls of the intestines. This is accomplished by mechanical pro-
cesses (such as chewing) and chemical processes (through the action of enzymes
and other body chemicals). Fat digestion products are relatively insoluble in
water and are transported mainly by the lymphatic system.
4. Mouth, esophagus, stomach, duodenum, small intestine, large intestine.
S. An enzyme is a biological catalyst. Enzymes speed up the reactions of
digestion without being altered in the process.
41
5d

6. If the teeth were missing food would have to be cut up into small pieces
to make it possible to swallow it, and to increase the surface area available to
the digestive enzymes.
7. The stomach secretes a protective mucus. In addition, the cells that
line the stomach are repaired at a rapid rate. Finally, hydrochloric acid is
normally not secreted in quantity except when food is in the stomach.
3. The liver produces bile which breaks down fat. Bile is stored and re-
leased by the gallbladder. The pancreas secretes a digestive juice which con-
tains enzymes necessary for the breakdown of proteins, fats and carbohydrates.
9. The villi provide a great deal of surface area through which molecules
may be absorbed.
10. Epidemiological evidence is gathered from ''"tidies of the traits. and
habits of individuals in large population samples. Biological evidence is data
on the biological properties of the 1-iosystem being studied. BiologiCal studies
usually involve small populations and are carried out in more carefully controlled
environments, such as research laboratories.
11. This question was included inadvertently. The topic of excessive salt
intake and its relation to Ilealth is taken yip in a later section.
12. The stomach serves mainly as a storage depot for food, passing it on to
the duodenum as required. The HC1 secreted in the stomach also kills most bac-
teria that enter the digestive tract, dissolves some minerals and continues the
breakdown of large particles of food into smaller ones. A small amount of pro-
tein is digested by pepsin and a limited amount of carbohydrate digestion also
occurs in the stomach.
13. Sometimes. Gallstones may block the pancreatic duct causing a backup
of enzymes in the pancreas, where they become activated and cause inflammation.
Gallstones may also block the common bile duct. In this case, pancreatitis may
result from bile entering the pancreas.
14. The small intestine is more important since this is the region in which
most digestion occurs. The large intestine is primarily responsible for the ab-
sorption of water from the residue of the digestive process.
5;)
42

LESSON 10: WATER--AN UNUSUAL NUTRIENT
RATIONALE:
Water is one of the most crucial nutrients in life yet it is often taken for
granted. A great percentage of the mass of living organisms is water. Lesson 10
suggests some answers to the question, "Why water and not some other substance?"
Some important properties of water (such as heat capacity) are explained in terms
of hydrogen bonding.
OBJECTIVES:
The student will:
-list at least three unusual physical properties of water.
-explain how the distribution of charge in a water molecule leads to
hydrogen bonding.
-explain how hydrogen bonding is responsible for at least two unusual
physical properties of water.
-describe at least three sources of the body's water and at least three
ways in which water is removed from the body.
-explain the difference between inorganic and organic chemistry.
-describe how the heat capacity of a liquid can be determined in the
laboratory.
SEQUENCE: ST-i0; LA-10
SUGGESTIONS:
1. ST-10 is written in such a way as to encourage the students to recognize
water from a description of its unusual physical properties. The problem is not
difficult, but it may get the students to think about what they're reading.
2. It may be a good idea to discuss the importance of water in human history-
civilizations have almost always begun near major waterways or oceans; most of the
world's population is still either near an ocean or near a major waterway; wars
have been fought over access to water.
3. Another approach that may appeal is to point out that several popular
theories of the origin of life involve the primitive ocean (for examples refer to
Oparin's books on the origin of life). In the same vein, exohiologists often
assume water on a planetary body is a prerequisite to life.
43
fin

4. One unusual property of water that is critical to life and can be used
for a simple classroom demonstration is solubility. Nutrients must be dissolved
to enter the bloodstream in quantity. For a demonstration, you could add equal
amounts of a nutrient such as sugar, a soluble amino acid, sodium chloride or
vitamin C to test tubes containing equal molar quantities of solvents. For
example, compare solubility in water and ether or benzene.
5. In LA-11 the students construct molecular models of water. You may wish
to make use of models to help explain hydrogen bonding.
INFORMATION ON LABORATORY ACTIVITY 10:
TEACHING NOTES:
1. This activity introduces a simple method for the determination of the
heat capacity of a liquid. The heat capacity of water is compared to that of
two other common liquids, ethylene glycol (antifreeze) and cooking oil. The
activity reinforces ST-10, which discusses some of the unusual properties of
water. In addition, the activity provides the first exposure to calculations
involving energy (calories) in Biomedical Science.
2. Anticipated time: two periods. The activity may be shortened or
lengthened by omitting or adding other compounds. When selecting substances,
remember that many organic liquids are flammable or toxic and should be avoided.
3. It may be desirable to discuss the calculations before beginning the
activity. In particular, the students may have difficulty distinguishing between
the units for heat and temperature. As an example of the distinction between heat
and temperature, you might wish to explain that one gram of ice at 0 °C requires
80 calories in order to change into one gram of water at 0 °C. Although heat has
been added to the system, the temperature has not changed.
4. You can save time and work by having the students crush their own ice.
If an ice crusher is not available, the ice may De placed inside two or three
layers of plastic bags (or a cloth bag) and crushed with a mallet or hammer. If
an electric ice crusher is used, take care not to overheat the motor. In general,
the results are improved if the ice is rather finely crushed.
5. The quantities of ethylene glycol and cooking oil specified in the
materials list assume that half of the class tests the first liquid while the
other half tests the second. The liquids may then be re-used by other groups so
that each group has a chance to test all three liquids.
44

6. The students should be warned that the hot 125-ml flask used in Procedure
Step 4 should not be touched with their fingers.
cloth should be used to prevent burns.
MATERIALS: (for 15 set-ups)
900 ml ethylene glycol (1 qtof a commercial antifreezeis sufficient)
900 ml cooking oil (1 qtis sufficient)
30 Erlenmeyer flasks, 125-ml
15 stoppers, rubber, #5(or cork, #12)
15 gas burners
15 ring stands
15 ring-stand rings
15 wire gauzes
ANTICIPATED RESULTS:
Instead, a paper towel or a
30 styrofoam cups (15 of thesemust be 12-oz)
15 beakers, 250-m1
15 beakers, 150-m1
5 pounds crushed ice
15 thermometers
15 scoopulas
15 balances
containers suitable for storingused oil and ethylene glycol
SUBSTANCE MEASURED HEAT CAPACITYin (cal/g-deg)
water .85-.95
ethylene glycol .65-.75
cooking oil .60-.70
The actual value for the heat capacity of water is 1.00 ± .003 cal/g-deg
over the range of temperature used in the activity. The discrepancy betweenmeasured and actual values is attributable to the unsophisticated techniquesused in the procedure (see answer to Discussion Question #2).
The actual values for ethylene glycol (antifreeze) and cooking oil rangebetween .50 and .70 cal/g-deg. Precise values are difficult to establish forthe following reasons.
1. Both antifreeze and cooking oil are mixtures of a number of substances.
Consequently, the exact heat capacity depends partly upon the composition of thecommercial product.
45
2. The heat capacity of both of these substances tends to vary consider-
ably with temperature. For example, the heat capacity of cooking oil might be
.54 cal/g-deg at 20 °C and .65 cal/g-deg at 70 °C. Therefore, the students
actually measure the average heat capacity between two temperatures.
ANSWERS TO DISCUSSION QUESTIONS:
1. The stopper reduces the amount of heat lost to the atmosphere through
evaporation.
2. Aside from routine errors in weighing, there are several other sources
of error. Some ice is melted by heat from the atmosphere and from the glass.
The glass also absorbs heat from the liquid which tends to make the final tempera-
ture of the liquid lower than it should be. In addition, the amount of liquid
may be slightly less than 80 g, since some liquid adheres to the walls of the
beaker used for weighing. Also, some of the ice might start out at a tempera-
ture lower than 0 °C.
3. As explained in Sections 10-2 and 10-3, hydrogen-bonding substances
have relatively high heat capacities. If hydrogen bonding is considered to be
an important factor contributing to the heat capacity of a molecule, the oil and
the ethylene glycol would be expected to have little hydrogen bonding.
LESSON 11: AN INTRODUCTION TO ORGANIC CHEMISTRY
RATIONALE:
Since most nutrients are organic compounds, a knowledge of some basics of
organic chemistry is a prerequisite to an understanding of nutrition. Similarly,
most of the chemicals found in living organisms are organic compounds. In Lesson
11, the structures of hydrocarbons and alcohols are considered and the nomencla-
ture of organic chemistry is introduced.
OBJECTIVES:
The student will:
- define alcohol, functional group, hydrocarbon, isomer, saturated,
unsaturated.
- identify alcohols and hydrocarbons when shown a variety of structural
formulas.
46

explain in what way a structural formula is more descriptive than a
molecular formula.
- construct a three-dimensional model of a molecule when provided with
the structural formula.
write the structural formulas for all isomers of butane and pentane.
SEQUENCE: ST-11; Activity 11
SUGGESTIONS:
1. You may wish to begin a discussion of ST-11 and then have the students
work on Activity 11 before completing ST-11. The activity should make the material
on molecular structure more understandable.
2. ST-11 was written to include both hydrocarbons and alcohols so that thestudents would be exposed to the system of nomenclature used in organic chemistry.
It may be that more than one period will be required to teach this material.
3. The planar structure on the following page can be copied and used by stu-
dents or by you to demonstrate the nature of a tetrahedron. Cut along the solidlines and fold along the dotted lines so that the four sides shown by hatched
lines are on the outside. The structure that results is a tetrahedron and needsno tape or glue to be held in place.
4. You may wish to point out that ethylene glycol, which was used in
Laboratory Activity 10, is an alcohol. Its structural formula is
OH OHI IHCCHI I
H H
Students may wish to make a model of this compound. Molecular models can be usedto review nomenclature. Models of methane and methyl alcohol, and of ethane andethyl alcohol can be compared.
5. Models can be used by students in responding to Problem Set 11, especiallyQuestion 3. (If a sulfur atom is called for, use an oxygen ball.) If desired,
models can be used in conjunction with later Problem Sets as well.
6. You may wish to remind the students that models of various sorts are usedin all three biomedical courses. Check with the other instructors to learn what
models they are currently using, and use this information to hold a discussion com-
paring the nature and functions of the different kinds of models.
6 ; 47


KEY--PROBLEM SET 11:
1. a. inorganic; b. organic; c. organic; d. organic
2. a. hydrocarbon; b. neither; c. alcohol; d. neither
3. a. isomer; b. equivalent; c. equivalent; d. equivalent
4. Id. and 2c.
INFORMATION ON ACTIVITY 11:
TEACHING NOTES:
1. The purpose of this activity is to reinforce the basic organic chemistry
introduced in ST-11. By use of three-dimensional models, the students will obtain
a more accurate view of molecular structures than they can get from two-dimensional
structural formulas.
2. Anticipated time: one to two periods.
3. You may want to mention that while model building may look like playing
with toys, it is not "kids' stuff." For example, model building was instrumental
in determining the structure of DNA.
4. The format is a programmed text to allow the students to find answers by
themselves at their own rate. It may be necessary to explain the use of a pro-
grammed text. In particular, one point should be stressed--a programmed text
can work well only if the reader answers the questions as directed without peeking
at the answers. If a student "cheats," he may he deluding himself about his
mastery of the material.
S. The molecular models to be used here are the same as were recommended in
Unit I (Carolina Biological #56-2150). These models are fairly expensive, but
may be used over and over again in this and in other courses. In addition, sup-
plementary uses of these models are suggested in many places throughout the re-
mainder of the course.
If a number of models are needed, check several catalogs for price. Some
supply houses such as Sargent-Welch and Wards offer a quantity discount. In Wards
1974-1975 catalog, single model kits (82W1001) cost $6.95 and 12 kits can be ob-
tained for $69.00.
It is also possible to buy individual balls and pegs in large quantities,
and this may be the least expensive way to stock up for this activity. Other kits
6 ti49

may be used, but will require slight modifications of the programmed directions.
For example, hydrogen atoms may be a different color.
As an alternative, molecular models may be made from stained styrofoam
balls and toothpicks. Detailed instructions for preparation of balls and sticks
for models are given in "Guidebook to Constructing Inexpensive Science Teaching
Equipment. Vol. II: Chemistry," 1972. This source may be obtained (at a slight
cost) by writing to:
Inexpensive Science TeachingEquipment Project
Science Teaching CenterUniversity of MarylandCollege Park, Maryland 20740
6. Some pegs may be difficult to insert into the balls. It may be helpful
to have available some fine-grade sandpaper to sand the pegs slightly as needed.
7. It is desirable to have the students work in groups no larger than three.
If insufficient kits are available, some students could begin studying LA-12
while others work with models.
8. You may want to stress the fact that in organic compounds, all the holes
in the models should be filled. The one exception in the kit described is the
nitrogen ball which has five holes, but forms only three covalent bonds in the
structures with which we will be concerned. (In our kit, the two holes that are
not to be used are painted.)
9. Questions 9 and 10 deal with water and hydrogen bonding. You may want
to mention that the kits do not show the true bond angle for water. The angle
obtained with the kit is 90 °; the correct angle is 104.6 °.
10. Students may need some convincing that compounds may look different in
structural formulas, but are actually the same compound. For example, butane
may be shown as
fl H fl II H H II fl1111 I1 I 1H CCCCH or IIC CH or IIC C H1111 I
I1
II H H II fl II C H IICII!IC--fl1 1
1 H FlHCII
If this seems to he a problem, they can be referred to Section 11-2.
50

11. The springs may be damaged if students do not insert and remove them
with a clockwise twist (Question 20 of the activity). This may merit emphasis.
12. In Question 23, another possible answer is that ethylene cannot rotate
as freely as ethane. This is because of the double bond in ethylene. Most stu-
dents are unlikely to detect this subtle difference. so we left it out of theanswer. It is not crucial to their mastery of the oncepts.
13. Because of the programmed format, students will vary in the time it takesthem to perform this activity. It can be lengthened by suggesting other models tomake, or shortened by eliminating questions.
MATERIALS: (per 10 set-up-)
10 molecular model kits (see Teaching Note 5)
The components of a kit are given in Activity 11.
LESSON 12: (A) CARBOHYDRATE CHEMISTRY
(B) NUTRIENT ANALYSIS
RATIONALE:
Since carbohydrates are a major class of nutrients, ST-12 considers theirchemical structure. The differences between monosaccharides, disaccharides and
polysaccharides are emphasized as well as the differences between monosaccharideisomers. ST-12 also describes the process of hydrolysis, :.`rich occurs during
digestion of carbohydrates. In LA-12 the students begin if: analysis of the
nutrient content of several foods.
OBJECTIVES:
The student will:
explain how 5 monosaccharide, disaccharide and polysaccharide differ.
write the reaction for hydrolysis of a disaccharide, showing the
structural formulas of the products, when given the formulas for the
reactants.
explain that hydrolysis is important in digestion because it is the
process by which fats, proteins and carbohydrates are broken down into
smaller molecules.
51
Ge?

-outline a method for the quantitative analysis of fats, proteins and
water in a food.
SEQUENCE: ST-12; LA-12
SUGGESTIONS:
1. Molecular models would be very useful as a teaching device in this
lesson. The subtle differences between the isomers, glucose and galactose, can
be readily demonstrated with ball-and-stick models. However, it is necessary to
use springs instead of wooden pegs to construct the rings. Also, a comparison of
glucose ar,1 galactose will require two kits. The kits may be used in different
ways. For example, you could construct models prior to class for use in a class
discussion or assign problems to individual students or ask for volunteers to
prepare some complex organic structures.
Molecular models can also be used to demonstrate the dehydration syn-
thesis of a disaccharide from two monosaccharides and the reverse process, hy-
drolysis of a disaccharide.
2. Although optical isomers were not discussed in the Student Text, this
could be done with suitable models. With simple models such as
Br-- C Cl C1--C--Br
El H
(A) (B)
you can point out such things as the following. (a) Optical isomers are mirror
images of each other. (b) A carbon compound with four different atoms or
groups attached to one carbon (such as A and B in the figure) is said to be
optically active. This means that it rotates plane-polar light in a specific
direction. (c) Structures A and B are optical isomers_ i.d) Optical isomers ro-
tate plane-polarized light in opposite directions, and are designated D- or ',-
isomers depending upon which direction the light is rotatd. (e) Aside from the
fact that many chemists find optical isomers intrinsically interesting, this kind
of isomerism is important to life. For example, proteins in the human body are
composed exclw:ively of amino acids of one particular isomer, L-isomers. This
phenomenon is crucial to the functioning of the proteins.
There is a great deal more that can said about optical isom2rism and
You may wish to refer to a biochemis' textbook for a more thorough
di.3cussion.

3. The nutrient analysis activity is unlike any of the other activities that
the students have performed, since it is designed to require several periods and
is cumulative. Since much effort will be invested in this activity, it is espe-
cially desirable that the students understand the goals and know what they are
doing and why. Some time at the beginning of LA-12 could be dedicated to an out-
line of the entire activity. The general outline on p. 44 of the Laboratory
Manual would be a good starting point.
4. The students may be intersted to know that the antibiotic streptomycin
is an unusual carbohydrate derivative. The structure is shown below. Some
brave student(s) might attempt to make a molecular model of streptomycin.
N--H
FIN =C
N --Fl
HH I
IHCH
HN=CNHI
CH N HI I OH H
,""C 0 I
- OH H ,,H \/E{ / I HN H
II C=0 H C li
C CH OH
C----C\H
HI 1
H.7 0
CCI I
\ /H 0I-\°H
I I
0 I I
C C
C C
H'' \\\ 7// \\HOH H
OCI
H C OH1
H
KEY -- PROBLEM SET 12:
1. a. Carbon, hydrogen; b. Carbon, hydrogen, oxygen
2. Saturated: b, c
Unsaturated: a, d
3. a. Hydroxyl
b. 0-11
4. a, c, d
7rt53

5 and 6. H H H H H H H H H H H111111 1 1 1 I 1
H C C C C- -C C H HCCCCC--H1 1 1 1 1 1 I
I1 1 1
H H H H H H H H H HH-- C --H
I
HH H H H1 1 1 1HCC CCH
I I
HH H 1
F
HCHHCH HCH7 I I''H iH lHCCCCH
H H H HH1 1 1 1 1HCCCCCHI 1 1 1
H H I H HHCHH
7. OH OH1 1
H C H HCH1C-0 C ---0
HO \\\ H HN /1!1 \H// \\O1H H
\OH HO/ \OHI
H\ 1
C---C C---CI I
H OH
INFORMATION ON LABORATORY ACTIVITY 12:
TEACHING NOTES:
I I
H 01-1
4 IHCH
SOH
H
1. The purpose of this activity is to familiarize the student with some
of the procedures used in the nutrient analysis of a food.
2. Because the tests involved in the activity are quantitative, great
attention must be paid to the accurate acquisition and recording of data. There-
fore, the activity will also provide the students with an opportunity to improve
on many of the laboratory techniques they have learned earlier.
3. The specific foods chosen for this analysis contain little carbohydrate.
Carbohydrates interfere with the procedure used for the determination of protein
content--they result in a suspension that cannot be filtered out after digestion
with acid-pepsin. If you wish to let the students select other foods for analysis
we suggest a few guidelines: (a) limit the choices to foods that contain no
significant amount of carbohydrate, (b) these "trial" foods should only be used
547.1

4=7
grades of hamburger meat, all-beef hot dogs, butterfish (a white ocean fish) andSwiss cheese. (Medium-grade hamburger contains a lower percentage of fat than theregular grade.)
4. The procedure is written for certain parts to be performed by a team oftwo students. For example, when the biuret and the egg white standard solutions
ire prepared during Period I, it is assumed that both students will help prepareill these solutions. The solutions will then be shared in subsequent parts of thetctivity. For this reason the materials lists in the activity specify the quanti-:ies of equipment necessary for a team of two students. (This is true even for:hose parts in which the students are to work independently.) The following
:hart indicates which parts of the activity are team efforts and which may bePerformed by each student individually.
PERIOD I Make biuret solutionMake egg white acid-pepsin solutions Teams
PERIOD II Filter egg white solutions and storeMake food acid-pepsin solutions
TeamsIndividuals
PERIOD III Filter food solutions and storeDry food samples Individuals
PERIOD IV Weigh dried food samplesExtract fat with Freon and redry food Individuals
PERIOD V Perform colorimetry on agg white standardsolutions and construct calibration curve Teams
PERIOD VI Perform colorimetry on food solutionsCalculate protein, water and fat percentages Individuals
5. We suggest that lab partners choose different foods to discourage "dry-
abbing." It would also be useful for several students in the class to test each
ind of food so that at the end of the sequence students will be able to compare
asults with one another.
6. Reagents at the stock table should be divided into three or four con-
liners to avoid unnecessary congestion.
55
2. The subject of homenstr!,cic is nric. 1-11n* 1,411 ^^m^ 1_

7. Since this will be the most complex activity the students have performed,
you may wish to emphasize the imnortance of accurate labeling of solutions and
food saml,les, as well z..s carefLi recording of data.
8. The materials list was compiled with the assumption that each student
will analyze two foods. If you lack sufficient glassware you might consider
limiting the analysis to one food per student.
9. Although the procedure is written in terms of six lab periods, a total
of eight lessons have been set aside for it in the teaching sequence of the unit.
This was done to allow extra time for completion of the activity and for a dis-
cussion of the results.
10. If you wish to shorten the activity, you might provide the students with
the calibration curve for protein concentrations. This will significantly reduce
the total time required for the activity. Having each student analyze only one
food may reduce the time by 10 to 15 minutes in each period.
11. The activity can be expanded by having students perform an analysis of
more than two foods. However, this will require more equipment and supplies.
12. The six periods need not be on consecutive days, but once the egg white
standard solution or the food acid-pepsin solutions have been placed in the incu-
bator, they must be removed, filtered and stored the next day. If the activity
is performed in the sequence shown in TN #4, Periods I, II and III must occur on
three consecutive days (i.e., Period I may be scheduled for a Monday, Tuesday
or Wednesday).
13. If you wish to reduce the cost of the activity, this can be done by
having the students choose only one food.
14. Students should be cautioned to handle the reagents with care. Pipetting
should be accomplished with a bulb or syringe pipet.
15. Since at the time this activity is being performed organic chemistry is
being developed in the text, you might want to show the students the structural
formulas for some of the chemicals used in the lab such as Freon (trichloro-tri-
fluoroethane) and KNaC4H406
(potassium sodium tartrate).
Cl F 0 OH OH 0I I II I I IIFCC C 1 HO CC C COHI I
I I
Cl F K Na
trichloro-trifluoroethane potassium sodium tartrate(discuss following ST-15)
56
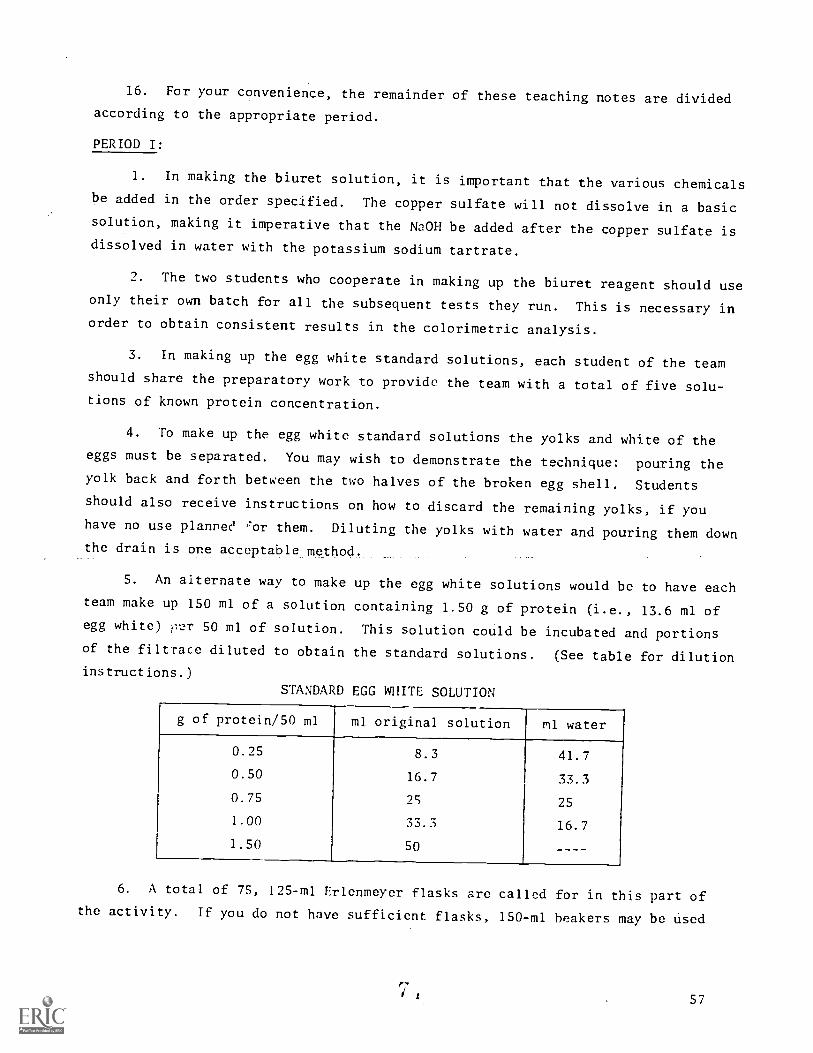
16. For your convenience, the remainder of these teaching notes are dividedaccording to the appropriate period.
PERIOD I:
1. In making the biuret solution, it is important that the various chemicalsbe added in the order specified. The copper sulfate will not dissolve in a basicsolution, making it imperative that the NaOH be added after the copper sulfate isdissolved in water with the potassium sodium tartrate.
2. The two students who cooperate in making up the biuret reagent should useonly their own batch for all the subsequent tests they run. This is necessary inorder to obtain consistent results in the colorimetric analysis.
3. In making up the egg white standard solutions, each student of the teamshould share the preparatory work to provide the team with a total of five solu-tions of known protein concentration.
4. To make up the egg white standard solutions the yolks and white of theeggs must be separated. You may wish to demonstrate the technique: pouring theyolk back and forth between the two halves of the broken egg shell. Students
should also receive instructions on how to discard the remaining yolks, if youhave no use planner' 'or them. Diluting the yolks with water and pouring them downthe drain is one acceptable method.
5. An alternate way to make up the egg white solutions would be to have each
team make up 150 ml of a solution containing 1.50 g of protein (i.e., 13.6 ml ofegg white) il:2r 50 ml of solution. This solution could be incubated and portionsof the filtrate diluted to obtain the standard solutions. (See table for dilutioninstructions.)
STANDARD EGG WHITE SOLUTION
g of protein/50 ml ml original solution ml water
0.25 8.3 41.7
0.50 16.7 33.3
0.75 25 25
1.00 33.3 16.7
1.50 50 ----
6. A total of 75, 125-m1 Erlenmeyer flasks are called for in this part ofthe activity. If you do not have sufficient flasks, 150-m1 beakers may be used
57

instead. However, if this is done care should be taken to seal the beakers with
Parafilm before the egg white solutions are incubated.
7. The procedure calls for the egg white standard solutions to be incubated
for 24 hours. If you don't have a commercial incubator with sufficient space,
you can made a suitable substitute. An easy way to do this is to set up a number
of cardboard cartons with 25-watt light bulbs as heat sources. The boxes sho _a
have dimensions of about 13 x 13 x 17 inches. (See figure below.) Each one of
these incubators will hold about 16 of the 125-ml flasks, so that you will probably
need to make three or four of them depending on your class size. Be sure that the
bulb doesn't touch the box, because of the potential fire hazard.
BOX FLAPS -
-i -1 ..--1 I
i .1 I
. \ 1
i1 2 5 w; 1
iI
1
I
17"
INCUBATOR
13"
13"
TO PLUG
8. The function of the acid-pepsin solution is to dissolve the protein.
Large food proteins tend not only to be insoluble in themselves, but also they
form insoluble complexes with fats and lipid membranes. The acid-pepsin functions
both to break off pieces of proteins, thus forming more soluble polypeptides, and
to free proteins bound to fats and other lipids. The mechanical grinding and
homogenizing process in this activity is even more effective in freeing bound
proteins.
PERIOD II:
1. All meats and fish will need to be homogenized in a blender. To do this
place chunks of the food in the blender and, starting with a slow speed, work up
to the highest one. You will not need to add water or any other fluid. The
blending time required is about one minute. When finished the meat should look
58

"whipped." It would be convenient to have one blender for each meat and fish.
Perhaps one or two students could bring one from home for a day. If not, one
blender will suffice.
2. The amount of each food necessary will depend on how many students
choose a given food. Each student will need 10 g of the foods he chooses (for
the entire activity).
PERIOD III:
1. Foods that we have listed should be easy to filter. If problems arise
in filtration there are two alternate techniques that may help.
a. If you have the facilities, vacuum filtration with a trap may be used.
b. You may centrifuge a suspension first to separate the particulate
matter from the solution. This will make filtration easier in a later step.
After centrifugation there will be solid matter at the bottom of the tube, fol-
lowed by a layer of solution, topped by a layer of fat. Most of the fat layer
can be removed with a scoopula. The remaining solution can then be decanted
through the funnel without disturbing the solid at the bottom of the tube.
2. When preparing the samples for drying, it is not necessary to start with
"blender-treated" meats and fish. Chopping the sample into very small pieces
is sufficient.
3. We have specified evaporating dishes for drying the food samples rather
thar f ior the following reasons.
a. Since flasks are required throughout the activity, it is likely
that there will not be enough flasks available for use in the drying step.
b. It is desirable to use a container into which the filter paper with
the food sample can be placed for drying during Period IV. This is important be-
cause some of the food may remain in the initial container. The containers,
filter paper and filtered food should all be dried again and reweighed together.
If you do not have sufficient evaporating dishes, 150-ml beakers should
serve just as well.
4. When labeling the evaporating dishes, or beakers, that are to be placed
in the oven, stick-on labels should be used because the wax from a glass-marking
pencil might melt and run in the oven. Labels should be added to the containers
before they are weighed.
59i)

5. The temperature at which the food should be dried is 70 to 80 °C
(approximately 155 to 180 °F). Temperatures in excess of 200 °C will char
the food.
6. We found that 24 hours was sufficient drying time. Drying for 48 hours
resulted in no appreciable change in the dry weight of the sample.
PERIOD IV:
1. When the cheese is heated during the drying process it tends to form a
hard layer in the bottom of the evaporating dish. It may be necessary to transfer
this crusty layer of cheese to a mortar and grind it up with the pestle before
adding Freon. After the cheese is ground up, the Freon is added and the mixture
is then returned to the evaporating dish. If this method is used the mortar
should be rinsed at least two or three times with small amounts of Freon to
minimize loss of food.
2. If your laboratory is equipped with good hoods, chloroform may be sub-
stituted for Freon. Chloroform is much less expensive.
PERIOD V:
1. You may wish to go over the principles involved in the construction of a
calibration line for the colorimeter to make sure the students understand what
they.are doing.
2. Only one team should use a BIP at a time. When that team has recorded
the data for all their egg white standard solutions, then another team may proceed.
This is necessary since the BIP is standardized with one team's blank, and this
standardization is valid only for their readings.
3. Each team should record the numbers of the BIP and test well that they
use in this portion of the activity so that they can use the same ones in
Period VI.
4. In order to avoid congestion at the BIP's, you might have half the class
perform the colorimetry on their egg white standard solutions during Period IV
while the remaining students do the fat-extraction step. The next day roles can
be exchanged. (The food samples may be left in the oven for another 24 hours
without any appreciale change in the dry weights.)
S. The solutions to be tested should be allowed to sit for at least
15 minutes after the biuret reagent is added. There should be no further develop-
ment of color from the biuret reaction after this time.
60

PERIOD VI:
1. The procedure for Period VI is essentially the same as that of Period V,
except that this time the students will analyze food solutions for concentrationsof protein. Again, it is desirable to avoid congestion at the BIP's. Some teams
might use the BIP's while others perform the calculations to determine the water
and fat contents of their food samples. Or if they did not finish constructing
the calibration line during Period V, they might use this time to do it.
2. Students should be reminded to use the same BIP and test well for this
part of the activity as they used for the analysis of the egg white standard
solutions in Period V.
MATERIALS: (for 15 set-ups, Periods I through VI)
10 g copper sulfate (CuSO4.5H20)
30 g potassium sodium tartrate(KNaC4H406-4H,70)
120 g sodium hydroxide (NaOH)
30 g potassium iodide (KI)
80 g sodium chloride (NaC1)
32 g potassium chloride (KC1)
40 g pepsin
3 liters Freon TF
83 ml hydrochloric acid(HC1), conc.
1 liter sand
3 dozen eggs, large
foods to be analyzed (seeTN #2, Period II)
blender (s)
2 to 3 cheese graters
3 to 4 incubators (seeTN #7, Period I)
oven
15 beakers, 250-m1
30 beakers, 150-ml
15 beakers, 600-ml
75 Erlenmeyer flasks, 125-m1(see TN #6, Period 1)
15 Erlenmeyer flasks, 250-ml
15 graduated cylinders, 100-ml
15 graduated cylinders, 10-ml
15 pipets, 1-ml
15 pipets, 10-ml
105 cuvets, 16 x 125 mm, Pyrex
135 test tubes, 10-ml capacityor greater
30 funnels, 2 oz, short-stemmed
60 evaporating dishes (or 150-ml beakers)
10 mortars and pestles
75 rubber stoppers, #5 (or cork, #12)(optional)
30 stirring rods, glass
15 scoopulas
15 knives
15 teaspoons
15 glass-marking pencils
15 balances
15 test-tube racks
filter paper, Whatman No. 1, 11-cm
labels
10 BIP colorimeters
Parafilm
paper tissues
assorted containers for chemicals andsolutions at stock table
large container for mixing S liters ofacid-pepsin solution
61

A breakdown of the Materials List by period is given below.
Period I:
10 g copper sulfate (CuSO4.5H20)
30 g potassium sodium tartrate(KNaC4H406.4H20)
sodium hydroxide solution
30 g potassium iodide (KI)
acid-pepsin solution
3 dozen eggs, large
30 beakers, 150-ml
15 beakers, 600-ml
15 Erlenmeyer flasks, 250-ml
75 Erlenmeyer flasks, 125-ml(see TN #6, Period I)
Period II:
acid-pepsin solution
food san.nles (TN #2,Period II)
1 liter sand
3 to 4 incubators
2 to 3 cheese graters
60 Erlenmeyer flasks, 125-ml
60 rubber stoppers, #5 (orcork #12) (optional)
10 mortars and pestles
15 beakers, 250-ml
75 test tubes, 10-ml capacityor greater
Period III:
food samples
2 to 3 cheese graters
15 knives
15 graduated cylinders, 10-ml
60 evaporating dishes(or 150-m1 beakers)
60 test tubes, 10-ml capacityor greater
15 test-tube racks
62
75 rubber stoppers,.#5 (or cork, #12)(optional)
15 scoopulas
15 stirring rods
15 graduated cylinders, 100-ml
15 graduated cylinders, 10-m1
15 glass-marking pencils
15 balances
3 to 4 incubators (see TN #7,Period I)
Parafilm
15 graduated cylinders, 100-ml
15 graduated cylinders, 10-ml
30 funnels, 2 oz, short-stemmed
15 glass stirring rods
15 glass-marking pencils
15 test-tube racks
15 balances
15 teaspoons
filter paper, Whatman No. 1,
11-cm
blender
Parafilm
30 funnels, 2 oz, short-stemmed
15 balances
15 glass-marking pencils
filter paper, Whatman No. 1,
11-cm
labels
oven
Parafilm

Period IV:
3 liters Freon TF
30 beakers, 150-ml
15 beakers, 600-ml
15 graduated cylinders, 100-ml
30 glass stirring rods
Period V:
acid-pepsin solution
biuret solutions
egg white standard solutions
105 cuvets, 16 x 125 mm, Pyrex
15 pipets, 1-ml
Period VI:
acid-pepsin solution
biuret solutions
filtered food sample solutions
90 cuvets, 16 x 125 mm, Pyrex
15 pipets, 1-ml
15 glass-marking pencils
30 funnels, 2 oz, short-stemmed
15 balances
filter paper, Whatman No. 1,11-cm
15 pipets, 10-m1
15 glass-marking pencils
10 BIP colorimeters
paper tissues
15 pipets, 10-m1
15 glass-marking pencils
10 BIP colorimeters
paper tissues
PREPARATION OF REAGENTS:
NaOH solution: Dissolve 120.0 ± 0.5 g of NaOH in 2 liters water.
1 M HC1: Add 83 ± 1 ml conc. HC1 to 800 ml water. Dilute to 1 liter.
Acid-pepsin solution: Dissolve 80 ± 0.1 g NaC1, 32 ± 0.1 g KC1 and 40 ± 0.1 gpepsin in 7200 ml water. Add 800 ml of 1 M HC1. Store in refrigerator. Will keepfor 3 weeks.
ANTICIPATED RESULTS:
1. Egg white standard solutions: The following values f T and absorbance
were obtained and used to construct the calibration line shown on the next page.
g protein/50 ml % T absorbance
0.25 80.0 .095
0.50 58.0 .235
0.75 43.5 .360
1.00 38.0 .420
1.50 27.0 .570
63

0.6
0.50
0.400
oz a X 0
0V)CO
0.200
0.100
CALIBRATION LINE, I , T , r , , .
,
,
.,.-i---
--t- .,---"777 ------;.rH. 4_1_1 1 14___
,
.--r-7-7-77
:-.777777
.....1, t--t--
7--r-T-!---..___,_ r-
, . t-7- ---T-1-
---:-...-, r- --T-r 7
--,----r--,,_,- ., ,
t
.. ; _ ....4...._.__, t"77 1 ! I ; --1-71- '-
---`.
. 11111111.1111-r- inasur1-r-r .
-7777 L 7 LI-: 71 i 1,
__4-__ _
-,--l-
-1,_
,--
-1,-...
. - . --... ._ .. . . ..
--. -.
- .. .T-4-
.
. . - ;-.-4- . . .-7-4- - ,__
'1-1-..7-:
-r-Li p_
_
1 .-.1_ _1_11 _r_T Hi._-4-1-4.-1-
'---177-' . ,{
'11
-- 7-
r_r_l_i_.'777-
-r-NEWBY -_1 ,-. _
r-r-7--
..14-__t_- I--
,
----t r---1-17"7' -------r--,- 7
_.. ... ,
i-._.....!
i .
.4 ......_.:. .
_L.. . :L,...L.. ...
r.
- !---,- ,---7-
,-,-- H-
-,-----._.41INSIN
..
3-f:r:--r--,-4 ;
----------1
- -,A
, - - - ----I-T*771-T--- i- i i
i, i -t
;- ,- :-.t--?1 ,
-'- 'i.
,-- 1- -r4 .
. ,,,,-
-1--ti+71 , 1-7r
r+
iirMBE I:,
7.,_; _r-t"--11
-4 4-
: ,.__:,
4-t-r-r-
Fr-t-,
1 i T-41t--t -r-
---', .-;--....1-1-
.
1.-..-;- , -:-,-.---
.
i-T'---!-1-1-
.----r-- -..---.._`-,- --,- ,
.
, i----n.- r- t-.. i- 7.- .
T , ;. -..-It t
.. i- -- -
-.-T-4-1f--:-71-4.-r. r7,--
--r-r -t-i--
-
r 1is. T---f-il1_4_
1---' ft 1t i
7 ' ---t-
---,-....1-t-t--
i.- r-.....-L.
-- iirl .ii---li. -- - -----4-. !
. - 41 r r L _
i---r-,- 1-r 74
, t r- ! a 171 h t : r. f 1 -ry-r , ,.
.
.7177
.-
--7-T---7-7-
7 -7'7-7
. -t.77177 '-7777
,-. 4.it,' ' '1 '-
"7171-7-
--T- T,.,t- T T T
7 7 ' 7
4 1-7 .-4-H-1--Li,.T-T T
,
: 1--rt---
-4-r-,t-
-i-L-L-'....r_i__T
r- -i-r--4-!--
1111111
Y1--t--77--
--1--. 7- i- t .--,_ ,_.,-_,._ ,--_ . --77-77 -4 1 4 4- '. 74
::- ---- 1-
___, -7-
7-7-I-'.
,
-, 71-7-" '7'7 7 ;.
i---, --j-i-, _iT-- --t t----t17 7 t17
r-,
i-i-:: t-rt --r---7-
, , --r-ray'77
-1 T I
I I 1 1
7-'1--
- - -,-1--77171-17 , , 1 /7
__I, 71-7-T--t--,--
: 1 r-F- r mmoMIRIIMILSIM' ', - r,
t t --t in Misammamonsommhr sintommonsi11111EM11111liamuninManall INIONIIIMI=...ro..
.
17177-7- 7 '7 -7-Fj-- - 7-7-, ,
,,i-i
_____h
r-,--,_ , .4-- s MILMINEMIIINNAIIINI IIIassmaismarosamm um= 1 a0 01 02 025 05 05 0.6 07 075 08 09
g prote.,, / 50 m II0 1.1 12 13 14 15
2. ()_protein in food samples: The following values were obtained for % T,
absorbance and g protein/50 ml. The % protein in the food samples, as calculated
from these values, is also shown.
food % T absorbance g protein/50 ml % protein
regular grade hamburger 47.0 .330 0.78 15.6
medium grade hamburger 46.5 .330 0.78 15.6
p I 1 beef hot dog 60.0 .220 0.52 10.4
butt 6i'f'i sh 65.0 .185 0.44 8.8
Swiss cheese 41.0 .390 0.92 18.4
64

3. % water in food sample: The following values were obtained.
food % water in sample
regular hamburger 56.0
medium hamburger 64.6
all beef hot dog 53.0
butterfish 81.0
Swiss cheese 38.2
4. % fat in food sample: The following values were obtained.
food % f - "- in sample
regular hamburger
medium hamburger
ail beef hot dog
butterfish
Swiss cheese
23.8
12.2
27.8
6.0
24.0
ANSWERS TO DISCUSSION QUESTIONS:
1. The water, fat and protein content of the foods analyzed, as etermined
by referring to tA)les of nutrient values, is as listed below.
food % water % fat % protein
regular hamburger 54.0 20.0 24.7
medium hamburger 57.3 1:'.0 25.6
all beef hot dog 57.0 26.7 12.3
butterfish 80.0-90.0 2.0-7.0 16.2
Swiss cheese 39.0 28.5 2S.5
For all the foods we tested the water and fat content values compared favorably
with those listed in the table above. The protein values were low by as much as
10.1. For example, the theoretical value for protein in regular grade hamburger
is 24.7% and the colorimetric analysis gave a value of 15.6%. The most probable
cause of this rather large error is the failure to get all of the proteins into
solution. It is very difficult to release all the proteins from the cell mem-
branes and other macromolecules they are attached to. -Presumably if equipment
C) 65

were available that would produce an even finer homogenate, the results would be
closer to those given in food tables.
2. One could presumably ( e the % protein in the food sample by
assuming that what is left of t d, after drying it and extracting the fat,
is almost totally protein. If the necessary calculations ale made, the follow-
ing result.
Food % Protein
regular hamburger 20.2
medium hamburger 23.2
all beef hot dog 19.2
butterfish 13.0
Swiss cheese 37.8
The values calculated in this manner are much closer to the values given in the
nutrient tables, except in the cases of hot dogs and Swiss cheese. The excep-
tions may be explained by the fact that these two foods contain a small percen-
tage of carbohydrate, which has been incorporated into the figure for protein
content because of the manner in which the calculations were performed.
3. The method is not applicable for foods containing carbohydrates because
the value calculated for protein will be too high because of the presence of
carbohydrate. This could be compensated for by first calculating the value for
carbohydrate and protein content and then subtracting the carbohydrate content
from this. The value for the carbohydrate content would have to be obtained
from a table on nutrient values of foods.
4. One can determine whether the 24-hour drying period is sufficient to re-
move all the water by drying the food sample for a much longer period of time,
say 72 hours, and weighing the sample periodically. If the masses are the same
after 24 hours, 48 hours and 72 hours, then one may assume that all the water
was removed in the initial 24-hour period. When the activity was performed in
our laboratory, this technique was used to determine that a drying period of 24
hours was sufficient.
S. Sources of error include the following:
a. weighing error, volume measurement error,
b. error due to loss of food sample in stirring and transfer procedures,
66

c. calculation error,
d. error in standardizing the colorimeter or reading the % T values,
e. error in construction of the calibration line,
f. error due to incomplete solubilization of protein in food sample,
g. error in mixing the biuret solution,
h. errors in recording data, etc.
LESSON 13: CARBOHYDRATES IN THE DIET
RATIONALE:
The chemistry of carbohydrates was the topic of ST-12. In ST-13 the
physiological role of carbohydrates is considered. The desirability of con-
suming carbohydrates in the form of starch, as opposed to sugar, is discussed
in relation to nutritional value, dental health and risk of atherosclerosis.
OBJECTIVES:
The student will:
-state that the main physiological function of carbohydrates in the
human body is to provide energy.
- list an advantage of using carbohydrates rather than fats or proteins
as an energy source.
- list at least two disadvantages of consuming carbohydrates in the form
of sugar rather than starch.
- define atherosclerosis.
- explain what happens when the liver's capacity to store glycogen is
exceeded.
-discuss the hypothesis that increased sugar consumption causes an in-
creased risk of atherosclerosis.
SEQUENCE: ST-13; LA -12 (or reverse)
FUGGESTIONS:
1. This might be a good time to consider inviting a guest speaker on
atherosclerosis and nutrition. A. nutritionist or dietitian or physician with
experience in this area might be a good choice.
67

2. Students may have parents or other relatives who have atherosclerosis
and who are on special djets. Comments of the students on such diets may be of
interest to the class.
LESSON 14: (A) HYPOGLYCEMIA
(B) HOMEOSTASIS
RATIONALE:
In ST-13 carbohydrates were discussed as the primary source of energy in
the diet. Polysaccharides are broken down to monosaccharides in t'!le
tract. Ultimately most of these monosaccharides are converted to ;41u
can be oxidized to provide energy for the body. In this lesson, home(, s, a
central theme of physiology, is introduced via a discussion of hyllcct;mia and
blood-sugar level.
OBJECTIVES:
The student will:
- state two reasons why consuming large quantities of sugar just before
an athletic event to provide "extra every" i3 not a procedure.
- discuss the roles of insulin and glucagon in :-gulating tie
glucose in the blood.
-define hypoglycemia and list at least tw) poss!',1e cau3es of this
condition.
- define and give at least one example of homeestass.
-define negative and positive feedback and give one example of t:r1.-11.
SEQUENCE: ST-14; LA-12 (or reverse)
SUGGESTIONS:
1. After reviewing the case history on hypoglycemia, some of the dents
who wiz: involved in competitive sports might ..ontribute examples fr,m personal
experience about what they eat what the coach tells them to eat) prior to
an athletic event. Such examples could then be evaluated using USDA Home and
Garden Bulletin #72 and the material presented in ST-14 as guideline:.. A guest
speatrr on the subject of nutrition for athletes is also a possibility.
68
2. The subject of homeostasis is one that will come up frequently in this
curriculum. You may wish to elai on this concept and to provide additional
examples, preferably those related. (o nutrion or to respiration. You may re-
fer to any recent physiology text for examples.
One popular textbook example of homeostasis is body temperature control.
The following three paragraphs illustrate how this example could be presented
to a class and are written on a student level.
A thermostat is a wonderful device. You set it for 68 °F. On a cold day,
the thermostat sends a signal to the furnace. The furnace goes on and produces
heat. The house or apartment arms up; but when the temperature around the
thermostat rises above 68 OF, the thermostat temporarily turns off the furnace
until the room cools below the set temperature. The furnace continues to go on
and off in response to signals from the thermostat.
We have a sort of thermostat within us. On a sweltering day or on a frigid
winter day, our body temperature remains very close to 37 °C, so our "internal
thermostat" must be very effective. How does our temperature regulation work?
Generally, we mai-,tain a body temperature above that of our environment, so our
internal thermostat triggers more heating than cooling. In large part, we pro-
duce body heat as a by-product of chemica ,lactions in the liver. In very cold
weather, besides insulating our bodies with lots of clothes, w sometimes shiver.
This intensive muscular activity stimulates increased body reactions and, there-
fore, more heat generation.
Although our temperature regulation system lacks a built-in air conditioner,
it does include a cooling device which involves sweating. The body sweats con-
tinuously; but as you know, whc:, you get overheated during exercise cr on a hot
you sweat more. What happens is that the blood becomes a little ;armer.
Thl.; triggers the hraia to signal the sweat glands in the skin to release more
sweat. As the sweat evaporates, the body is cooled.
3. The mechanisms involved in regulation of blood-glucose level are com-
plex and go .ell beyond those discussed in ST-14. You may find the background
infor.ation on blood-glucose regulation useful as a brief review or as a resource
for expansion of the lesson.
BACKGRoUND INFORMATION ON REGULATION OF BLOOD GLUCOSE LEVEL:
The normal blood-sugar level is SO to 100 mg per 100 ml of blood. When the
blood-sugar level exceeds the normal range, homeostatic mechanisms are triggered
that lower the level. These mechanisms include the following.
69

1. Glucose is transEered to liver and muscle cells where it is stored
as glycogen.
2. Glucose is removed from tissues via glycolysis or fat synthesis,
making it possible for more glucose to enter the tissues from the blood.
3. Glucosuri') 'excretion of glucose in the urine) occurs when the blood-
glucose level reaches excessively high values (greater than 160 to 180 mg per
100 ml of blood).
There are actually more hormones involved in regulation of blood-sugar
level than are mentioned in ST-14. 'Six hormones play a major role in homeostatic
control of blood-sugar level. Only one of these hormones, insulin, is hypogly-
cemic (removes glucose from the blood). The others (growth hormone, adrenal
cortical hormo c, epinephrine, glucagon and thyroxin) all have hyperglycemic
effects.
LESSON 15: CHEMISTRY OF ACIDS AND FATS
RATIONALE:
The chemistry of organic acids is considered in ST-15. Organic acids re
especially relevant to nutrition because they are a constituent of fats,
acids and other nutrients. An introduction to chemistry of organi ac:
is followed by a discussion of the chemistry of fats and fatty acids. 1:!-
chemistry of amino acids will be treated in ST-17.
OBJECTIVES:
The stuclr: t will:
- write the structural formula of the carboxyl group.
-write an equation for the dissociation of an organic acid when given
the z",ructural formula c the acid.
- define an ester.
-write an equation for the dehydration synthesis of nr ester from an
alcohol and an acil, when given the structural formula (J, the ester.
-identify saturated, monounsaturated and polyunsaturated fatty acids
when presented with a variety of structural formulas.
- write the equation for the hydrolysis of a fat, given the structural
formula of the fat.
70

SEQUENCE: ST-15; LA-12 (or reverse)
SUGGESTIONS:
1. Molecular models of carboxylic acids can be made. You may wish to use
a model to demonstrate how an organic acid dissociates. Models may be used to
demonstrate both the dehydration synthesis of an ester from an acid and an al-
cohol, and the hydrolysis of an ester. It would be a good project for a group
of ambitious students to construct a model of a triglyceride with long-chain
fatty acids. To make a model of triolein, for example, students would need ap-
proximately six kits. Models may also be used with Problem Set 15.
2. To dcionstrate the abundance of organic acids in foods, students could
make a list o' such compounds on food labels. Many acids listed on labels are
organic acids. These compounds often end with the suffix "ate," which means
the salt of an acid (e.g., calcium propionate). If this option is used, it
will be necessary for students to check reference books to determine whether
compounds suspected of being organic acids are indeed organic acids. Any col-
lege organic chemistry textbook or even a good dictionary is likely to be us,:u1
for this purpose.
S. You may find it useful in discussing ST-.15 and ST-16 to remind students
about those operations in LA-12 that involve fats. The nutrient analysis activ-
ities can add soriiething to a discussion the Student Text. Conversely, the
treatment of organic chemistry in the Student Text should help to make the pro-
cedure of [A-I2 more understandable.
KEYPROBLEM SET 15:
I. b,d
C -(1-11
3. alcohols: a,c,e
organic acids:
H 0 Fl
0
1. H-C-C-OH H-C-OH
5. a. mon, msaturated
b. polyunsaturated
c. saturated
71

H-C-0-C-C-C=C-C-C-H
_ H-C-0-C-C=C-C=C-C-11
H-C-O-C-C-C-C-C-C-H
H OHHHHH1 1111111
I I I
H H HOHHHHH011111
1
O H H H H H1111111
7. a.
b.
c.
d.
e.
f.
g.
ester
acid
hydrocarbon
alcohol
ester
alcohol
hydrocarbon
11111HHHHH
H HHH1111
6. a. H-C-C-C-C-O-H1111H HHH
H HHHH
8. esters (monoglycerides) and fatty acids
9. a and d
saturated: a,c
monounsaturated: b,d
polyunsaturated: e
b.
c.
d.
e.
11111H-C-C-C-C-C-H11111OHHHH
normal-pentanoic acid
normal-hexyl alcohol
HHHHHO1111111
H-C-C-C-C-C-C-O-H
10. H
H-
H-C-OH
1!
OHHHHH011111-0-C-C=C-C=C-C-H
I
+
H II H 011111
2HCCCC OHI 1 1
H H H
11111H H H H H
ussm 16: FATS IN THE nIFT
RATIONALE:
ii
The chemistry of fats was considered in ST-15. ST-16 treats the nutritional
values Jf' fats. The relationship of saturated fatty acids to atherosclerosis '!"(1
hear; attacks is also considered.
OBJECT IVES:
The student wiil:
-explain why polyunsaturated fatty ac:cjs,are considered more desirable
in the diet than monounsaturated and saturated fatty acids.
-list at least two way:, to reduce the level of saturated fatty acids
in a diet.
-define essential fatty acid.
72
L
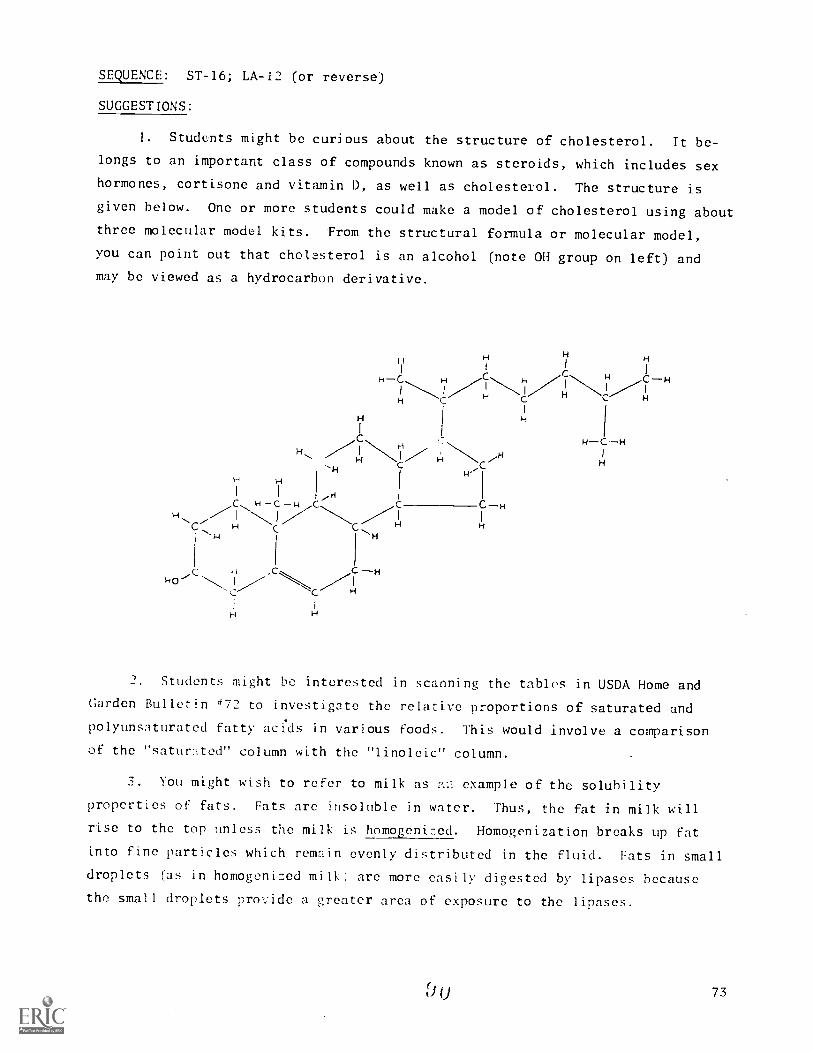
SEQUENCE: ST-16; LA-12 (or reverse)
SUGGESTIONS:
1. Students might be curious about the structure of cholesterol. It be-
longs to an important class of compounds known as steroids, which includes sex
hormones, cortisone and vitamin D, as well as cholesterol. The structure is
given below. One or more students could make a model of cholesterol using about
three molecular model kits. From the structural formula or molecular model,
you can point out that cholesterol is an alcohol (note OH group on left) and
may be viewed as a hydrocarbon derivative.
H HI I
H C HC H
H
HCH
H
/8C
C
k0 "-'c
H
H H
C H
C H
H
H
cI
H
H
H C- -H
2. Students might be interested in scanning the tables in USDA Home and
Garden Bulletin 472 to investigate the relative proportions of saturated and
polyunsaturated fatty acids in various foods. This would involve a comparison
of the "saturated" column with the "linoleic" column.
3. You might wish to refer to milk as 1-Y; example of the solubility
properties of fats. Fats are insoluble in water. Thus, the fat in milk will
rise to the top unless the milk is homogenized. Homogenization breaks up fat
into fine particles which remain evenly distributed in the fluid. Fats in small
droplets (as in homogenized milk) are more easily digested by lipases because
the small droplets provide a greater area of exposure to the lipases.
73

4. The following bar graph shows the percentage of fats in some common
foods. You may wish to post or reproduce this chart.
00
/5
LL
W 50
LUL.) 25
o_
100%
80%
32%10-25%
M-16%
But I F- MAYONNAISE WALNUTS 0-10cocATE PEANUT PORK AMER, ICE PIES,
LARD, BUTTER SAUSAGE f:liEE-SE CREAM rAKES,MARGARINE, (Coo KEC, COOKIES,
VEG OILS & DONUTSCOOKING FATS
FAT -RICH FOODS
5. Students may be interested in learning about research aimed at pro-
ducing milk and beef with more pllyunsaturated fal-ty acids. This approach to
improving the nutritional quality of beef and dairy products is sometimes re-
ferred to as "fooling the cow." The research is based on the observation that
bacteria in the first of the cow's four stomachs reduce polyunsaturated fatty
acids to saturated fatty acids. To avoid this conversion to saturated fatty
acids, experiments are heinc' done with grain that is coated to prevent it from
being broken down in the first stomach. If the process works, the fatty acids
that are unsaturated in the grain would still be unsaturated when they are ab-
sorbed into the cow's body.
LESSON 17: PROTEINS AND AMINO ACIDS
RATIONALE:
Proteins are one of the major classes of nutrients. They are digested to
amino acids, which are absorbed and transported to cells. Cellular amino acios
are used to build new proteins which then serve essential functions in the body
as hormones, enzymes and antibodies and iso contribute to the structure of
sk ,, hair and hones. In ST-17, the structure and chemitry of pro-
tein H, dered in terms of their building blocks, the amino acids. The
relati: oen three-dimensional structure and biological activity of proteins
is also .1sider.7'cl.
74

OBJECTIVES:
The student will:
identify amines and amino acids when presented with a variety of
structural formulas.
-define denaturation and explain how denaturation asters the biologi-
cal activity of a protein.
explain that the three-dimensional structure of a protein is necessary
for i.ts biological function.
-state that dehydration synthesis leads to the production of peptides
from amino acids.
state that hydrolysis leads to breakdown of proteins to amino acids.
SEQUENCE: ST-17; LA-12 (or reverse)
SUGGESTIONS:
1. Molecular model kits may be used to construct models of some of the
amino acids. In addition, students can demonstrate formation of a peptide from
amino acids by dehydration synthesis. Likewise, hydrolysis of a peptide can be
simulated with models.
If several students or groups of students each make one amino acid, the
amino acids can be joined together to make a polypeptide. With such a model, de-
naturation can be demonstrated by shifting an orderly structure such as a helix
to a more random structure. A polypeptide model can show that various three-
dimensional structures are possible by twisting the model into different shapes.
This can 1e -,:elated to the fact that one particular sh:Ipe is thought to corres-
pond to the functional form of an enzyme (ST-4 and ST-17).
2. In Section 17-1, the fact that proteins of all forms of life are com-
posed of approximately 20 different amino acids is stated and not elaborated on.
There are many implications of this statement of possible interest to your stu-
dents. A fev relevant points are listed below for your consideration. More in-
formation may be obtained from a college biochemistry textbook.
In spite of the vast difference in the appearance of different or-ganism , N'. living creatures have essentially the same amino acid components
in their proteins. For example, bacteria and green plants have the same amino
acids in their proteins: .s we do. This has evolutionary implications--one
75

inference is that the amino acid composition of proteins has been conserved in
evolution. (In turn, it is likely that the DNA code has changed little or not
at all during the course of evolution. Howelder, the DNA code will not be treated
in the Student Text until a later unit.)
b. The similarity of amino acid composition is part of what the biolo-
gist, Van Neil, had in mind when he first wrote about the "unity of nature."
The fact is that organisms are strikingly similar on the biochemical and cell
physiological levels. is this generalization that permits research involving
mice and microorganisms to be applicable to human health. The unity of nature
helps us to appreciate how insulin derived from a cow or pig may he useful in
treatment of human diabetes.
c. Both students and scientists are sometimes curious about the fact
that there are only about 20 amino acids in proteins. For example, alanine and
valine are found in proteins, but there is n.' evidence for amino acids in pro-
teins having an ethyl R-group. The reasons why this is so is not known, but it
is possible that the amino acids that are found in proteins reflect the amino
acids present at the time of the origin of life on earth a few billion years ago.
Research on this subject has revealed that some amino acids form more easily in
simulated prebiological conditions. Refer, fir example, to Fox and Dose, Molecu-
lar Evolution and the Origin of Life, W. H. Freeman Co., San Francisco, 1972.
11
I 11
C C OH
N
GENERAL F0RULA
I
lhr
/-, -,
H 0 rr1\1', 0 H II \ 11 0
, I II
11C tCC-011'
Fl I I +I II
Cl C C OH IICC C 01111
I I / II
11/ N-11 1/ \--11 H N-11I \11C
1'11
I
11I
H
ALANINE VALINE NOT FOUND INAMINO AC.D PROTEINS
KFY--PROBLEM SET 17:
1. carboxyl group: h,c
aminc, groOp: a,b
primary amine: a,b
amino acid: h
2. monosaccharide: f
disaccharide: c
76
ester: b
saturated fatty acid: a
unsaturated fatty acid: d
amino acid: c
3. a. c and f
b.
C. a, b zrld d
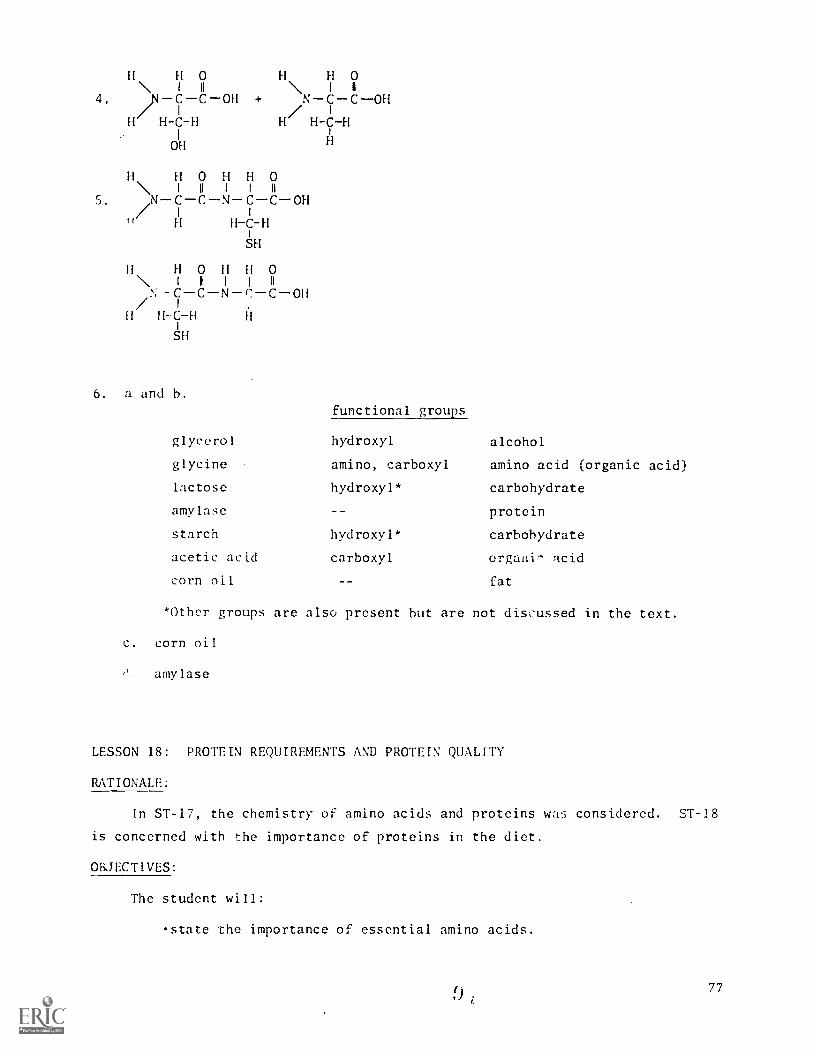
H H 0 H Fl 0\ 1 II \ I 1
4. /)NCCOH + NCCOH/
H H-C-H H H-y-H
OH H
H H 0 H H 0\ I II I I II
S. NCCN CC OH/
H-C-H
SH
FI H 0 H H 0\N -CCNCCOH/ I
H H-C-H
SH
6. a and h.
functional groups
glycerol hydroxyl alcohol
glycine amino, carboxyl amino acid (organic acid)
lactose hydroxyl* carbohydrate
amylase protein
starch hydroxyl* carbohydrate
acetic acid carboxyl organic acid
corn oil fat
*Other groups are also present but are not discussed in the text.
c. corn oil
amylase
LESSON 18: PROTEIN REQUIREMENTS AND PROTEIN QUALITY
RATIONALE:
In ST-17, the chemistry of amino acids and proteins was considered. ST-18
is concerned with the importance of proteins in the diet.
OBJECTIVES:
The student will:
state the importance of essential amino acids.
77

-define "complet. e protein" in terms of essential amino acids.
-state that proteins are necessary for replacing cells.
-determine the protein RDA for an individual, given age, body weight and
a graph similar to the one in Section 18-1.
-describe the effect of age on the protein RDA.
SEQUENCE: ST-18; LA-12 (or reverse)
SUCGEST10':
1. emphasizes the role of dietary amino acids as a source of body
protei:. . may wish to mention that amino acids are used in prnduction of other
nitrc,;e1101,- body compounds. For example, the synthesis. of the purines in DNA
and rT7i-,7s the amino acids glycine, glutamine and aspartic acid.
Students may wish to know what happens to excess dietary protein. Unlike
fa'. ,nd carbohydrates, proteins are not stored by the body in quantity. Excess
amino acids are degraded. The nitrogen splits off and is excreted as urea, while
the leftover organic acids (minus nitrogen) are converted to fat or carbohydrate
or utilized as a source of energy.
3. The protein RDA is increased during pregnancy and lactation. Also, severe
infections or surgery can result in a substantial loss of protein thus increasing
the protein RDA.
To be rigorous, the protein RDA should consider how much a person should
weigh rather than his actual weight. For example, suppose a person whose ideal
weight is 75 kg begins to gain weight and reaches 150 kg. This person does not
need twice a much protein daily as he did when he weighed 75 kg.
4. A possible optional project for students would be to "rate" their vegetable
sources of proteins. This kind of activity might be useful for students who are
vegetarians. If this option is taken, such students might design their own
rating systems and report the results to the class.
5. The answer to the last italicized question on p. 102 is as follows.
315 lb21.2
kg (lb kg day
115 g/day
78

LESSON 19: MINERALS AS NUTRIENTS
RATIONALE:
The need for carbohydrates, fats and proteins in the diet has been considered
in ST-13 through ST-18. In ST-19, minerals are discussed as a fourth class of
nutrients. This lesson describes the functions of minerals in the body with
reference to the clinical effects of mineral deficiencies.
OBJECTIVES:
The student will:
- define "mineral" in the nutritional sense.
- list and state the main function for at least four minerals required in
quantities of over 100 mg per day.
- state that nutritional anemia results from a dietary deficiency of iron.
- explain the relation between dietary iodine and goiter.
- define and list at least two "trace" minerals.
SEQUENCE: ST-19; LA-12 (or reverse)
SUGGESTIONS:
1. Some background information on minerals in nutrition is included below.
More information on this subject is given in Section 21 end should be reviewed
prior to teaching Lesson 19.
2. The nutrient analysis activity (LA-12) should be nearing completion
about the time that this lesson is taught. When you have a general class dis-
cussion of LA-12, it would be a good idea to include as much of the relevant text
material on the chemistry of proteins, fats and carbohydrates as possible.
INFORMATION ON MINERALS IN NUTRITION:
There are over 100 known elements. Eleven account for the bulk of living
matter, while many of the remaining elements are found in plants and animals. The
amounts range from trace concentrations that are barely detectable to up to several
hundred mg per g body weight. Biological functions in animals have been established
for about a dozen trace elements, such as fluorine, manganese, cobalt and copper.
Conceivably, all naturally occurring elements may evantually be shown to have a
significant influence in human nutrition.
79

The increased consumption of highly refined or "fabricated" foods, and human
exposure to environmental contaminants such as mercury and lead have changed
trace element nutrition in humans--the former often results in reductions in
essential trace nutrients, while the latter increases our intake of trace
minerals.
LESSON 20: (A) VITAMINS AND THEIR FUNCTIONS
(B) ANALYSIS OF VITAMIN C IN FRUIT JUICE
RATIONALE:
Vitamins compose the final major class of nutrients. ST-20 describes the
functions of most of the vitamins and the clinical conditions that can result
from vitamin deficiencies. In LA-20, the students analyze for vitamin C in fruit
juice. This activity provides a vehicle for a quantitative error analysis based
on concepts developed in Biomedical Mathematics. In addition, it reinforces the
technique of titration.
OBJECTIVES:
The student will
define "vitamin."
-summarize the steps that led to the discovery of at least one vitamin.
list at least four vitamins and the symptoms of a deficiency of each
of these vitamins.
list at least four sources of error in the vitamin C analysis.
SEQUENCE: ST-20; LA-20 (or reverse)
SUMMARY:
1. Two points about vitamins A and D deserve to be added. First, these
vitamins are measured in "International Units." These are not units of mass
but are based on the biological activity of the vitamins in a laboratory animal,
usually a rat. Secondly, these vitamins are not ingested per se; we ingest
substances that are converted to these vitamins in the body.
2. Students might be interested in seeing the structural formulas and/or
constructing models of some of the vitamins. Some of the chemically simple
vitamins are shown on the following page.
80

II
Vitamf
1H.G .-14 /4"//-1 H H-C-H
,,C.N.,c.,///Cft.,,CA//4''-'''`. .7.-1-1
I:H it4
H--.......1-`-,.....H-1\i e. .'",14 VI
H
1 '117H 7 H- 4
,"',. -f-,. ,--N .***C H N
L \ j\\\II
H-C" '''lk, ''''H CI NH H
5-5LIPOIC A
0II
4 /41
.,C
11
I
"V \te7f/SN/IN
H
H- -HC
GI
C iY\4 61-)
PANITOTri \) ih44
H C -01-4I
1 I H7 ;- 7H--c. I%) c'H
1 I I
H HC C- 14 H
H
Coen
can berlide with
ose spbIngsfor
Note hyrztoxyigroup.
two kits.
Can be N.de withtwo kits.
cose oxygenball for sulfur.)
Note hYdoxylgroup.
Can be made with one kit. Notecarboxyl
group This vitamin isrequired
for one reaction in thebreakdowlAof glucose to provideenergy.
Note carboxylgroup,
Note hY4pxyl groups, peptideinky car
l:1,-xyi group, The partdottedcircle is contributed
by an anillo acid'
N oalcchol
group
81
3. The primates, including man, and guinea pigs have something in common.
They are unable to manufacture vitamin C within their own bodies. When deprived
of vitamin C from dietary sources for a sufficient length of time, these animals
will develop scurvy.
At the present time, scurvy is uncommon in the United States. It occurs
chiefly in infants fed diets essentially limited to milk (a poor source of vita-
min C). Adults with scurvy are generally starving, alcoholic, or nutritionally
ignorant.
INFORMATION ON LABORATORY ACTIVITY 20:
TEACHING NOTES:
1. The purpose of this activity is twofold. First, the students measure
the amount of ascorbic acid in fruit juices using a simple titrimetric procedure.
Secondly, the uncertainties associated with each measurement are compiled so
that the limits of error may be formally calculated in the mathematics class.
The activity serves to reinforce the titration techniques introduced in Unit I,
as well as nutritional concepts in the Science Text and error analysis in the
Mathematics Text.
2. It is recommended that you read Supplementary Sections Y and Z of the
Mathematics Text before beginning the activity.
3. Science and Mathematics schedules should be coordinated. Section Y of
the Mathematics Text should be taught just before this activity. The Mathematics
instructor should be informed if the activity takes two days, since Section Z
cannot be taught until the activity has been completed.
4. The activity may be implemented in a variety of ways. The students may
bring in their own fruits and compare different juices. It is advisable to avoid
red-colored juices, since they might interfere with the red color of the dye.
Fresh juice may be compared to bottled, frozen or synthetic products (such as
"Hi-C," "Tang" and "Start"). Juice from the rinds of citrus fruits could be
tested for ascorbic acid. A sample of fresh juice may, be left out for two to
three days (either at room temperature or re.Crigerated) to demonstrate that sig-
nificant amounts of ascorbic acid may be lost due to oxidation.
5. The metaphosphoric acetic acid solution has the following composition.
metaphosphoric acid (HP03)n 1%
sodium metaphosphate (NaP03)n 2%
acetic acid CH3COOH4(, 6%
82

None of these ingredients are harmful at these concentrations, and therefore
the solution may be safely mouth-pipetted. If you have general reservations con-
cerning the mouth-pipetting of acids, the students may use a pipetting bulb,
syringe or 10-m1 graduated cylinder for measuring this solution.
6. The students may doubt that it is possible to read a buret volume to
within ± .01 ml. It may be desirable to point out that this degree of precision
allows for a total range of .02 ml within which the reading must fall.
MATERIALS: (for 10 set-ups)
0.3 g sodium 2,6-dichloroindophenol
151 ml acetic acid, glacial
80 g metaphosphoric acid (NaPO3,-62%; HPO3, -36%)
1 g ascorbic acid powder
samples of fruit juices
10 burets, 50-ml
10 pipets, 1-ml
10 pipets, 10-m1
10 beakers, 50-ml
20 beakers, 250-m1
10 beakers, 150-ml
10 funnels
10 ring stands
10 ring-stand clamps
PREPARATION OF REAGENTS:
Indophenol dye solution: Dissolve 0.30 ± .02 g of sodium 2,6-dichloroin-
dophenol in 500 ml of hot tap water. Filter and dilute the filtrate to 3000 ml.
Add a small quantity (approximately 1 ml) of glacial acetic acid so that the
solution takes on a red color. (The dye can serve as an acid-base indicator
as well as an oxidation-reduction indicator.) The solution may be stored up
to 5 days without refrigeration.
Metaphosphoric acetic acid solution: Dissolve 80 ± 1 g of metaphosphoric
acid in approximately 800 ml of water. Add 150 ± 2 ml of glacial acetic acid
and dilute with water to a final volume of 2400 ml. The solution may be stored
under refrigeration up to 12 days.
Ascorbic acid standard solution: Dissolve 1.00 g of ascorbic acid powder
in water and dilute to a total volume of 1000 ml. The use of a 1000-ml volu-
metric flask is recommended to reduce uncertainty as much as possible. If a
volumetric flask is not available, a 1000-ml graduated cylinder may be used.
Typical uncertainty values associated with the preparation of the standard solu-
tion are listed on the following page. These values should be provided for
the students' data sheets.
1 00 83

UNCERTAINTIES ASSOCIATED WITH THE PREPARATION
OF THE ASCORBIC ACID STANDARD SOLUTION
BALANCE
accuracy ± .010 g
scale-reading imprecision, initial ± .001 g
scale-reading imprecision, final ± .001 g
total absolute uncertainty ± .001 g
VOLUMETRIC FLASK, 1000-ml
accuracy ± .60 ml
total absolute uncertainty ± .60 ml
GRADUATED CYLINDER, 1000-ml
accuracy ± 5.00 ml
scale-reading imprecision ± 1.00 ml
total absolute uncertainty ± 6.00 ml
ANTICIPATED RESULTS:
A table is provided that lists the ascorbic acid content in a 6-oz serving
of some common juices. The values have been compiled from Bowes and Church,
Food Values of Portions Commonly Used, 11th edition, 1970. In all cases, the
juices are unsweetened.
JUICE FRESH*FROZEN,DILUTED
CANNED orBOTTLED
apple trace trace trace
grapefruit 68 68 53
grape (white) trace -- trace
guava -- -- 150
lemon 82 78 75
lemonade 12
lime 57 -- 39
orange 89 80 71
pineapple -- 21 17
tangerine 55 48 39
*Values subject to seasonal variation.
84

The uncertainty associated with the endpoint of the titration is expected to
be between ± 0.10 ml and ± 0.40 ml, depending upon the juice tested.
ANSWERS TO DISCUSSION QUESTIONS:
1. Since the metaphosphoric acetic acid does not affect the amount of
ascorbic acid in the sample, the exact amount of solution is not critical to the
procedure.
2. Many uncontrollable errors are possible. For example, the ascorbic acid
in the reagent bottle may be stale and, consequently, impure. Or, the indophenol
dye may react with other substances present in the sample. The concentration of
the dye may change slightly from day to day due to oxidation.
LESSON 21: (A) VITAMINS AND MINERALS IN THE DIET
(B) DETERMINING THE RIBOFLAVIN CONTENT OF VITAMIN PILLS
(C) REVIEW
RATIONALE:
In ST-19 and ST-20 the functions of vitamins and minerals were considered.
ST-21 focuses on several nutritional problems (i.e., vitamin deficiencies, the
excess sodium-hypertension hypothesis, dietary sources of vitamins, hypervitamino-
sis). In LA-21 students analyze vitamin pills for riboflavin content. Th-1!;
activity illustrates the importance of fluorescence as an analytical tool.
OBJECTIVES:
The student will:
- list the two minerals most likely to be deficient in American diets
and will suggest good food sources of each of these minerals.
-describe at least two pieces of evidence in support of the hypothesis
that a high-sodium diet increases the risk of hypertension.
- list at least two good food sources for at least three vitamins.
- define and give an example of "hypervitaminosis."
- describe how fluorescence can be used to estimate the concentration of
riboflavin in a solution.
SEQUENCE: ST-21; LA-21 (or reverse)
85

SUGGESTIONS:
1. This would be a good time for a review and quiz. Lesson 21 is the last
of the nutritional chemistry lessons (Lessons 10 through 21). Lesson 22 begins
a sequence of lessons on energy, metabolism and the diet.
2. You might give students a research problem involving one or more hypo-
thetical diets. Their task would be to evaluate the diet(s) for any vitamin
deficiencieF.. USDA Home and Garden Bulletin No. 72 would be useful for this
purpose. It would not be a good idea to have students analyze their own diets
for deficiencies because they will do this in Activity 29.
3. Students might be given case histories or descriptions of patients with
severe vitamin or mineral deficiencies. They could be asked to determine the
nature of the deficiency and also how to modify the diet to cure the patient.
It is4. Urea is used in LA-21. Students may be curious about its structure.
H 0 HI IlHNCNH
5. You may find an occasional discrepancy between food values listed in
USDA Bulletin 72 and the Student Text. This occurs because we have sometimes
used a different reference for our values.
6. There is a high school-level game available that may be useful in
reviewing the properties of vitamins. It is called "Vitamins." For more informa-
tion write to The Lawhead Press, Inc., 900 East State Street, Athens, Ohio 45701.
INFORMATION ON VITAMIN B12
:
Vitamin B12
is a cobalt-containing vitamin present in human cells. It is
essnetial for normal functioning and acts as a coenzyme in metabolism.
Neither animals nor higher plants manufacture this important vitamin. It is
made by lower organisms, mainly bacteria and fungi. (In fact, microbes are the
commercial source of vitamin B12.) Cows obtain vitamin B12 from bacteria in their
rumen while chickens get this vitamin by pecking at the soil. This explains why
their flesh is so rich in the vitamin.
Since vitamin B12
is found chiefly in animal products, vegetarians may suffer
a deficiency. A good way for vegetarians to obtain vitamin B12 is by eating
fermented products, especially soy products popular in Asia such as tofu. Kelp
is another good food source of vitamin B12. Although cheese is a fermented
1(
86

product it is not a good source of vitamin B12. When the whey is removed in the
cheese-making process, this essential vitamin is lost.
KEY--REVIEW SET 21:
1. Organic compounds contain carbon; inorganic compounds (with a few
exceptions) do not. Organic: a, c, e; inorganic: b, d, f.
2. The attraction between a hydrogen atom of one molecule and a negatively
charged atom of another molecule. Water, proteins.
3. a and c
4. a and b
5. Identical: d; saturated: c; unsaturated: a, b, d
6. a. -0-H b. 0 c. HII
IC 0 H N1
7. a. alcohol (hydroxyl group)
b. ester
c. amine (amino group)
8. a
9. a, b, c
10. 0 H H H H H H H11 1 I 1 I I I I110CCCCCCCCH
1 1 I 1 I I 1HHHHHHH0 H HII I I
IHOCCCC=CC=CCH111
d. acid (carboxyl group)
e. hydrocarbon
C H H H H HII I I I I IHOCCCCCCCC----H
I I I I I I 1HHHHHHH
The third fatty acid shown above is preferable because it is polyunsatu-rated. It will tend to reduce the cholesterol concentration in the blood.
11. a. an amino acid that must be supplied by the diet.
b. a protein source that provides sufficient quantities of all essentialamino acids.
12. a. true--hydrolysis
b. false
10;87

c. false
d. true--dehydration synthesis
13. OH
H C HC-0
H H
2
OH"\OH H/ "OH
I I
C CI I
H Off
c. (carbohydrase); in the mouth
stomach and intestines; they also
occur elsewhere but this has not
been discussed in the text.
14. Glucose is digested more rapidly than starch. This can cause hypogly-
cemia and may be associated with atherosclerosis.
1S. c; f; citrus fruits, green peppers, onions, tomatoes
16. a, b, c, e, f, g
017. a. OH, N , and II
\HC--OH
(Iodine may also be counted as a functional group.)
b. amino acid
c. iodine
INFORMATION ON LABORATORY ACTIVITY 21:
TEACHING NOTES:
1. The purpose of this activity is twofold: (1) to introduce the students
to a laboratory method involving fluorescence under ultraviolet light, and
(2) to have the students apply this technique to analyze for riboflavin in
vitamin pills.
2. Anticipated time: two periods. Part I should take approximately
20 minutes and could be done during Lesson 18 or 19. Part II should take about
30 to 4S minutes. It is not absolutely essential that Part II be performed one
day after Part I. The urea-vitamin solutions will keep for as long as 48 hours.
3. Most of the absorption peaks of riboflavin fall in the short-wavelength
range of the UV spectrum, and lamps which produce these wavelengths are expensive.
The lamps that we have specified are inexpensive, but they emit UV light of
1U:588

longer wavelengths. In this wavelength range, small quantities of riboflavin
will not fluoresce. Should you have access to a lamp that emits shorter UV
wavelengths, you might attempt an analysis of foods for riboflavin. The proce-
dure would be the same, except that standards with lower riboflavin concentrations
would be needed.
4. A UV spectrophotometer, such as a Beckman DB, or a fluorometer could be
used to make the method quantitative.
5. Students may be curious about the nature of fluorescence. Fluorescent
light is electromagnetic radiation in the visible range emitted from some sub-
stances when they absorb radiation of certain specific wavelengths from another
source. Typically, some of the energy from the absorbed radiation is converted
to heat. Consequently, the light emitted is less energetic and is of longer
wavelength. In this activity UV light (shorter wavelengths) is absorbed and
visible light (longer wavelengths) is emitted.
6. The activity can be shortened by preparing the standard solutions your-
self and limiting the number of different vitamin pills tested. It can be ex-
tended by having students test several different vitamin preparations.
7. In order to avoid the expense of purchasing a number of different
brands of vitamin pills, the students could be asked to bring in pills from home.
They should each bring about 10 identical pills and a note listing the concentra-
tion of riboflavin in the pills. This information appears on the label. Plan to
collect the vitamins in advance of the time scheduled for the activity, since you
will need to set them out in containers labeled with appropriate code letters.
8. The directions call for students to make up the standard solutions. The
number of students needed will depend on the number of testing stations you set up.
9. Each UV station will require the following materials: a cardboard box;
a UV lamp with socket, cord and plug; black tape or construction paper; and one
set of the four standards. The quantities given in the materials list assume
four stations.
10. To prepare the viewing boxes, cut the flaps off of a cardboard carton.
Turn the box upside down and reinforce the lengthwise seam on the bottom with
masking tape. Cut a circular hole in the center of the bottom of the box just
large enough to accept the threaded portion of the base of the UV lamp. On one
long side of the box cut a viewing slit about 3/4" x 3". You may have to put
89 lot;

black tape or construction paper around the bottom of the box to keep the light
,:hat enters the box from outside at a minimum. The UV lamps should be 75-watt
"blacklites." They may be obtained at most hardware stores.
0- -- BOTTOM OF BOX
UV LAMP
VIEWING SLIT
BLACK TAPE
11. The vitamin pills that are used for the standard solutions should all
be the same. These pills should have a high riboflavin content so that the four
standards that are made will have riboflavin concentrations ranging from about
2 to 16 mg/40 ml.
12. Vitamin pills that have a lot of red in their outer coating are not
suitable for this activity. Too much red interferes with perception of the
fluorescence. Also, vitamins with an outer gelatin capsule are not recommended
since the capsule cannot be ground up.
13. While the UV lamps are on, check periodically so see that the cardboard
is not being overheated. In our testing, however, we have found no evidence of
burning or charring during lengthy periods of use.
14. It is probably a good idea to remind the students not to look directly
at the UV lamps while they are on.
MATERIALS: (for 30 set-ups)
viewing boxes (see TN #9 and #10)
vitamin pills
400 g urea (Mallinckrodt #8642)
46 beakers, 50-ml
30 beakers, 150-ml
15 graduated cylinders, 100-ml
30 stirring rods
15 glass-marking pencils
90
10 mortars and pestles
15 balances
30 scoopulas
30 funnels
filter paper, Whatman No. 1,11 cm
aluminum foil
paper towels
I 7

PREPARATION OF REAGENT:
3.3 M urea solution, 2 liters: To 396 ± 5 g of urea ?dd sufficient water
to make 2 liters of solution.
ANTICIPATED RESULTS:
The results will vary according to the type of vitamin x.11 used for the
standard solutions and the types of vitamin pills analyzed. We obtained the
following data in our laboratory.
Solutions Riboflavin Content
Standard #1
Standard #2
Standard #3
Standard #4
Unknown #1*
Unknown #2**
17.4 mg
8.7 mg
4.4 mg
2.2 mg
3.3 mg (midway between 4.4 and 2.2)
6.6 mg (midway between 4.4 and 8.7)
The estimated riboflavin content for Unknown #1 was 2.3 mg/pill. The value
listed on the label was 2.0 mg/pill.
The estimated riboflavin content for Unknown #2 was 6.6 mg/pill. The value
listed on the label was 6.0 mg/pill.
ANSWERS TO DISCUSSION QUESTIONS:
1. A qualitative test is used to determine whether or not a specific sub-
stance is present in a sample. It gives no information on the quantity of the
substance. A semi-quantitative test gives a rough estimate of the quantity of
the substance. Quantitative tests give more precise information.
2. Vitamin pills were used to provide samples with a high enough riboflavin
content to be detectable.
3. The urea solution was used because riboflavin is more soluble in a urea
solution than in water.
4. Our results compared quite favorably with the information given on thevitamin labels. If the directions are followed carefully, students should ob-
tain a good estimate of the riboflavin content of a pill. Differences may beattributable to the semi-quantitative nature of the procedure.
*BEVITRIN, Formula No. 21, Vitamin Specialists Co., 5521-25 Wayne Ave.,Philadelphia, Pennsylvania, 19144.
**HI-BEE-GEE, Formula No. 11 (same manufacturer).
!OF 91

LESSON 22: (A) ENERGY
(B) EVIDENCE OF CHEMICAL REACTIONS
RATIONALE:
So far the Nutrition Unit has explored essential nutrients in the diet, and
the foods that contain them. Since the food we digest is utilized for energy to
heat the body, move muscles and build molecules, it is appropriate now to consider
energy. In addition, to prepare for the study of metabolism, which is to be pre-
sented shortly, students should be acquainted with the role of energy in chemical
reactions. This lesson presents the concept of energy in general terms and also
introduces its role in chemical reactions. The next two lessons deal with the
measurement of energy released or absorbed in chemical reactions and the role of
energy in nutrition. LA-22 considers how to detect whether or not a chemical
change has occurred. It is designed to prepare the students for a study of heats
of reaction.
OBJECTIVES:
The student will:
-list five forms of energy.
-distinguish between kinetic energy and potential energy.
-distinguish between heat and temperature.
-define calorie and kilocalorie, and use the definitions to calculate the
amount of heat required to raise or lower the temperature of a given
mass of water by a given number of degrees Celsius.
-define chemical energy.
-describe the role of energy in the formation and breaking of chemical
bonds.
state whether a chemical reaction has occurred, through observations
of the effects of mixing substances.
SEQUENCE: ST-22; LA-22
SUGGESTIONS:
1. It is possible to demonstrate the difference between kinetic energy (the
energy of motion) and potential energy (stored energy), by performing the follow-
ing seemingly unrelated demonstrations, which all involve conversion from
92

potential to kinetic energy. Have the students name the form of potential and
kinetic energy in each case.
Potential Energy Kinetic Energy
1. release a stretched rubber band elastic (just be-fore release)
motion
2. light a match chemical (in match) heat
3. push a book or pencil off edgeof desk
gravitational motion
4. release a compressed spring elastic motion
5. lift a hand chemical (sub-stances in muscletissue)
motion
5. let an iron object movetoward a magnet
magnetic motion
7. pick up a tissue with a combafter running the combthrough hair
electric motion(of tissue)
In addition, one form of kinetic energy can be changed into another:
First Form Second Form
1. heat hands by rubbing them motion heat
2. clap hands motion sound (mo-tion of airmolecules)
Some of the above activities actually involve multiple energy changes. For
example, in striking a match, motion of the match is converted to heat of friction,
which ignites the match. During burning the chemical potential energy is converted
to heat (kinetic energy) and light (radiant energy). Similarly, energy of motion
in rubbing a comb is converted to electric potential energy in the comb, which is
converted to motion of the tissue.
2. You may wish to lead a discussion of the different ways in which heat is
generated. Have the students identify which ones involve a change from potential
energy into heat, such as frog chemical potential energy in burning, nuclear po-
tential energy in the sun. Other ways to generate heat involve a change from
1 1 0 93

another form of kinetic energy into heat, such as from motion in friction-produced
heat or electric current into heat.
3. You could present a diagram of the electromagnetic spectrum and discuss
light and other forms of radiant energy. Point out that X-rays, IR (infrared) rays
and UV (ultraviolet) rays all have some clinical applications, such as skin-
disease treatment, heat lamps, X-ray treatment of cancer, etc. [Light energy was
not emphasized in this lesson because it will be treated in some depth in later
lessons on vision (Unit IV).]
4. To clarify the distinction between heat and temperature, you could ask,
"Which has more heat, a bathtub of water at 50 °C or a cup of water at 50 °C?"
(Answer: the bathtub.) "Which has a greater temperature?" (Answer: they are
the same.) Heat is the total kinetic energy in a mass. Temperature is a measure
of the average kinetic energy of the individual molecules, atoms or ions in
the mass.
5. Students will nr-, "rood samples to test in LA-23. The activity is
designed so that students H .ng in food samples from home. The types uf foods
required are listed in LA-23, Part II, Step 1 (p. 78).
INFORMATION ON LABORATORY ACTIVITY 22:
TEACHING NOTES:
1. The purpose of this activity is to provide the students with guidelines
for identifying evidence of chemical change. The experience with exothermic and
endothermic reactions serves as a prelude to both ST-23 and LA-23.
2. Anticipated time: one period.
3. The activity may be shortened by decreasing the number of tests performed.
4. The activity may be lengthened by allowing students to test combinations
of other available reagents. Tests based on any of the earlier laboratory activi-
ties are possibilities. Having the class judge the outcome of demonstrations is
another option. For example, adding conc. H2SO4 to a beaker containing a small
amount of sugar causes the formation of foamy black carbon. Another possibility
is to dip a glass rod in ammonium hydroxide solution and hold the rod over conc.
HC1. Invisible HC1 and NH3vapors will react to form dense white fumes of NH
4C1
A final dramatic possibility is to add a small volume of ammonium hydroxide solu-
tion to a dilute solution of CuSO4. A pale blue precipitate of Cu(OH)2 will form.
In addition a very dark solution forms due to production of Cu(NH3)4+2
.
94

5. A brief revie
6. Any grade of '
qualitative.
cv matter may 13
g( sllital9le'
ok
ft ilitt\:ate
z introducedh
7. The notation Y
Vikte 01101:f :: hic or gstates of iron at this p
textbook for more backi61 vchemistry
two state
general
the react ions are
thout comment in thisactivity. You may wishdtrk\
e, betweeil' dlr." - the two °Xidationtt \ A
MATERIALS: (for 15 set-
0.2 g phenolphthal
35 ml HC1, conc. t
2.8 g acidified iriAsulfate (FeSO4.711
0.32 g potassium pi(KMn04)
/0.18g sodium chlo
0.36 g potassium bN
35 g ammonium chlo41A
50 pellets sodium d(NaOH)
35 g sodium acetatO
25 g sodium bicarb#1.75 g manganese dih
35 g potassium chlo
PREPARATION OF REAGENTS:
6 M HC1 solution,4. /I
3. HC1 to\ 1 %tifficient
make 70 ml. 1Y/
Take 0.5 ± .05 )11 A.; 4tIOn arid dilute 0 ml with
Water to
. pl
e
0.1 M acidified irolP / Nf
Water.(This provides the 0.1 M \ V,0d tlAe nekt
C to 501Uti%0/ A DeS°11-'71-, --N1,1, 119,9__TI) 2.8 ± .1 g
0,1 M i-iFeSO4.7H20 + sufficient %./\)/ 0
Vii,(tk Q 011' AO 1 a drop at a timeuntil an acid reaction ii,
i
, 4 suff0.1 M NaCl solution,' 1\ vr ' ,01 k ?19C. i.ent water toii8 4-
0'
burnek,s
test tube,
30 test-tube12S Pyrex
15test -tube
holders15
st%Dpers,rubber15r
#00pipets, 1....m1
15 Deal(er' It0-ml a ny5011 size)
5cooPulas
medicine droppers
ass-mark15 g/ .ng penClis
Matelleswooden spl
'kntstares
make 30 ml.
0.1 M [(Br solution, ,6 '01 g kfty * sufficiNt water to make 30 ml.
.....,
SAL
95

9.1 M K nO4
solution, 20 ml: .32 ± .01 g KMn04 + sufficient water to
make 20 ml.
phenolphthalein solution, 20 ml: Dissolve 0.2 ± .01 g phenolphthalein in
10 ml of ethyl alcohol. Dilute to 20 ml with water.
Add about 1.75 g of Mn02 to 35 ± .01 g of KC103 and mix thoroughly.
The Mn02catalyzes the reaction in Procedure Step 14.
ANTICIPATED RESULTS:
StepNumber
Reactants Involved ObservationsChemical Reaction?
(yes or no)
3water + 6 Mhydrochloric acid
none no
4
hydrochloric acidsolution + phenol-phthalein solution
cloudiness no
6
water + sodiumhydroxide
NaOH dissolves; tubegets warmer
NaOH ± Nat. + OH
yes
7
sodium hydroxidesolution + phenol-phth) halein solution
(HP
Solution turns pink
HPh + Na+ + OH ±H2O + Na+ + Ph-
yes
9
ammonium chloride+ water
NH C1 dissolves; tubegets cooler
NH4C1 -+ NH4 + + Cl-
yes
10
sodium acetate+ water
Sodium acetate (NaAc)dissolves; tube getscooler
NaAc -+ Nat. + Ac-.
yes
11
sodium bicarbonate+ hydrochloric acid
Bubbles vigorously;gas given off
NaHCO3
+ H+ --+
+ + H2O + CO2
yes
12
acidified iron (II)sulfate + potassiumpermanganate
Color changes toyellowish
++ -3 Fe + Mn0
4+ 4 H
+-4-
+++3 Fe + 2 H2O + Mn0
2
yes
(continued)
96

13potassium bromide+ sodivn chloride none no
14
potassium chlorate+ heat
Oxygen given off;glowing splint burstsinto flame
2 KC1O3 + 2 KC1 + 3 02
yes
ANSWERS TO DISCUSSION QUESTIONS:
1. Step 6.
2. Steps 9, 10. (In Step 14, heat was absorbed from the flame.)
3. Steps 11, 14.
4. Steps 7, 12, 14.
S. Change in temperature, change in color, formation of precipitate or gas.
It is a moot question whether a change of state occurs when a solid dissolves
or precipitates out. If students answer Reactions 4, 6, 9 and 10 under Question 3,
this should not be considered incorrect. They should, however, be consistent.
For example, if they gave the above answers, their sample data sheet should record
"chemical reaction" for each of these numbers.
LESSON 23: (A) HEAT OF REACTION
(B) MEASURING CALORIES IN FOODS
RATIONALE:
ST-22 presented the concept of energy and explained its role in the formation
and breaking of chemical bonds in reactions. This lesson extends that concept to
include the net amount of energy released or absorbed during a chemical reaction,
called the heat of reaction. Heats of reaction permit an understanding of how
different foods release different amounts of energy in chemical reactions in the
body. The Law of Conservation of Energy, which is basic to an understanding of
energy, is presented. In LA-23 breaking down food by combustion illustrates the
release of energy from food.
97

OBJECTIVES:
The student will:
-define the terms "exothermic" and "endothermic."
-define the term "heat of reaction" and incorporate it in a balanced
chemical equation.
-determine the heat of reaction per quantity of reactant when given a
balanced chemical equation that includes the heat of reaction.
-state the Law of Com.ervation of Energy.
-outline the general pr.3cedures used to determine the heat of reaction
experimentally.
SEQUENCE: ST-23; LA-23
SUGGESTIONS:
1. You may wish to show the students how to solve a "calorimetry" problem
that parallels the calculations required in LA-23. For example, in a calorimetric
investigation it is found that 12 grams of reactant raise the temperature or
100 ml of water by 18 °C. How much heat is generated, in calories, per gram of
reactant?
Answer: 100 ml of water has a mass of 100 grams. The total energy re-
leased is 100 x 18 = 1800 cal, or 1.8 kcal. The energy released per gram is1800
= 150 cal per gram, or 0.15 kcal per gram.12
2. Students will perform calorimetry on different foods in the laboratory.
You may wish to present a short demonstration first. You might burn a candle or
alcohol lamp for a minute or two under a beaker with a known amount of water.
Measure the rise in water temperature. The fuel should be weighed before and
after burning to find how much has burned. The heat generated, in calories, is
calculated from the data as follows. If the burning of x grams of fuel changes
the temperature of m ml of water by AT °C the amount of heat given off is mAT
calories. The heat generated per gram of fuel ismAT
calories per gram.
It is possible to compare the quantity of heat given off per gram of candle
wax with that of a gram of alcohol. The heat released by a gram of paraffin is
almost twice that released by a gram of alcohol.
3. Since the text material for this lesson is complex, a synopsis is
provided on the following page.
198
t.1
a. All substances that have chemical bonds contain stored energy in
the bonds. In a chemical reaction, rearranging bonds results in products con-
taining a different amount of energy (either more or less) than the reactants.
There is thus either a net gain or a net loss of energy during a reaction.
b. The energy lost or gained in a chemical reaction is generally
treated as heat. If heat is lost, products end up with less energy than the
reactants and the reaction is called exothermic. Conversely, if heat is absorbed,
the products end up with more energy than the reactants and the reaction is
called endothermic.
c. The quantity of heat released or absorbed is called the heat of
reaction, H. OH is the difference between the energy of products and reactants.
-DH Hproducts
Hreactants
. When heat is absorbed, AH is positive because the=
products have more energy than did the reactants. Conversely, when heat is lost,
AH is negative because the reactants containe4. more energy than the products.
d. OH is usually written as AHr
. The units for AHr
arekcal
. Formole
example, consider the equation
C6H12
06
+ 6 02
6 CO2+ 6 H2O + 673.0 kcal
AHr is negative because heat is lost from the molecules during the reaction.
(See answer lb, Problem Set 23.) AHr
is -673.0mole
kcalsugar
and-673 kcal
6 mole 02'
CO2or H
20'
e. The Law of Conservation of Energy states that energy can neither
be created nor destroyed. Examples are given in the student Text.
f. Heats of reaction are additive. When products form in a single
reaction, the heat of reaction is the same as when the process occurs in two or
more steps with intermediate products. The example of the oxidation of maltose
either in one or in two steps is given in the text.
4. It is suggested that Problem Set 23 be worked with the entire class in
a stepwise fashion approximately as follows. This is recommended because of the
complexity of the material.
KEY--PROBLEM SET 23:
1. a. Since AHr
is negative, Hproducts
Hreactants
is negative, so the-
products have less energy than the reactants. This indicates a net loss of
heat in the reaction. The reaction is thus exothermic.
b. When AHr
is negative, the number is written as nositive on the right
side of the equation. This indicates that heat is generated.
1-14- + HCO H2CO
3+ 1.82 kcal
2. a. CH4
+ 2 02
CO2
+ 2 H2O
b. Since heat is released, the reaction is exothermic. Combustion
reactions are exothermic.
c. AHr
= -210.8 kcal/mole of methane. It is negative because the heat
is energy lost by the molecules.
d. CH4
+ 2 02
CO2+ 2 H2O + 210.8 kcal
The heat of reaction is written as positive and on the right side to show it is
generated in the reaction.
e. The heat generated is energy lost during the reaction. Therefore
the products have less energy in their bonds than reactants.
3. a. Since the product, water, contains fewer kcal than the reactants,
energy is lost in the reaction. The reaction is exothermic.
b. The heat of reaction is -13.36 kcal. It is negative because the
molecules lose energy in the reaction.
4. a. Since AHr
is positive, the molecules gain energy during the reaction.
The reaction is endothermic.
b. When galactose is first changed to glucose, 2.3 kcal/mole are absorbed.
Then 673.0 kcal/mole are released in the oxidation of glucose, so a net of
670.7 kcal are released. Since heats of reaction are additive, -2.3 + 673.0 =
670.7 kcal/mole are released if the reaction occurs directly in one step.
c. 1 mole galactose = 180 g galactose
670.7 kcal 670.7 kcal3.73
kcal1 mole 180 g g
5. a. 2 C8H18
+ 25 02
16 CO2
+ 18 H2O
b. 2 C8H18
+ 25 02
-4 16 CO2+ 18 H2O + 2606 kcal
The energy released is 2 x 1303 kcal because there are 2 moles of octane in the
balanced equation. It is written with a positive sign on the right side of the
equation to show that heat is generated in the reaction.
1,_
100

c. Since heat is released, the reaction is exothermic.
d. If 900 kcal/mole of octane are converted to heat, the remaining
energy available is 1303 900 = 403 kcal/mole of octane.
e. The Law of Conservation of Energy.
INFORMATION ON LABORATORY ACTIVITY 23:
TEACHING NOTES:
1. The purpose of this activity is to illustrate the use of a calorimeter
for comparison of the energy content of different foods. The heat of a neutraliza-
tion reaction similar to one that occurs in the body is also demonstrated.
2. Anticipated time: one to two periods (may be extended).
3. For Part I, it is important to prepare the HC1 and Na2CO3 solutions in
advance so that they will be at the same temperature when the activity begins.
When Na2CO
3is dissolved, the temperature falls. Leaving the two reagents at room
temperature for a few hours assures that their temperatures will be the same.
4. Have some extra 16-oz paper cups on hand to allow for mistakes. The cups
should be large enough so that when shortened by students to a height of 10 cm by
cutting their lower ends, they will slip easily over a 50-ml beaker. I.e., after
being shorted to a height of 10 cm, their bottom diameters should be 4.8 cm or
larger. If necessary, cups may be shortened to 9 cm to achieve this diameter.
5. The caloric values of food determined in the activity range from 20 to
80 per cent of values in printed tables. The values are low primarily because the
calorimeters designed for this activity are crude and don't trap all the heat from
burning food. Nevertheless, comparisons between different kinds of food can
be made.
6. The activity may be broken off at any point and resumed later. Part I
may be eliminated to provide more time for food measurement or to shorten the
activity.
7. Each group should test and compare two foods: fat or oil, plus one other
food type, for caloric energy. Different groups' values for the same food may not
be the same because of variations in the set-ups, such as the size of the holes in
the calorimeter cups and the heights of the cups. It may be of interest to discuss
sources of variation in team results on the same food.
101
8. The likelihood of a paper calorimeter cup catching fire is small. How-
ever, you may want to "be prepared." The work can be done near sinks or large
containers, of water kept handy.
9. Styrofoam cups may be used instead of paper cups, but can only be used
with small flames, such as from fat and oil candles. With the large flames pro-
duced by peanuts and other solid foods, styrofoam tends to catch fire. The same
precaution applies to small paper cups instead of the recommended large ones.
10. It is not recommended that thermistors be used in Part I, because they may
be damaged by the acid. (You may wish to caution the students to be gentle with
mercury thermometers when they stir with them in Part I.) A BIP thermistor may
be used in Part II by suspending it in the center of the water in the flask.
11. Optional activities include the following.
a. A small alcohol lamp may be used with the calorimeter to measure the
caloric value of alcohol.
b. Heat given off from the oxidation of iron may be demonstrated by
placing wet steel wool in a thermos bottle and stopping it with a one-hole
stopper that has a thermometer through it. The same set-up with wet lawn clippings
or plant matter may be used to show the heat produced during the decay of plants.
In either case, a control thermos with a stopper and thermometer but no iron or
plants should be set up.
c. Results of Part I can be compared with the heats of neutralization
of HC1 with .6 M NaHCO3and .6 M NaOH. The heat released in the first case would
be so small as to be undetectable with the apparatus used, while the reaction
between HC1 and NaOH releases a great deal of heat.
MATERIALS: (for 15 set-ups)
Part I:
83 ml hydrocholoric acid,conc. (HC1)
137 g sodium carbonate(Na2CO3-10H20)
15 graduated cylinders, 100-ml
30 beakers, 50-m1
102
15 beakers, 250-ml
15 thermometers
15 small styrofoam cups
15 glass-marking pencils
Part II:
30 food samples
15 beakers, 50-m1
15 Erlenmeyer flasks, 250-m1
15 graduated cylinders, 100-m1
15 thermometers
15 to 20 large (16-oz) paper cups
15 razor blades
15 pieces of bare wire,3 cm long
aluminum foil
PREPARATION OF REAGENTS:
string
clay
15 spoons or scoopulas
15 stirring rods
15 balances
matches, 15 books
3 to 5 scissors
paper towels
1 M hydrochloric acid, 1 liter: Add 83 ± 2 ml conc. HC1 to sufficient
water to make 1 liter.
0.6 M sodium carbonate solution, 800 ml: 137 ± 2 g Na2CO3.10H20 + sufficient
water to make 800 ± 5 ml.
ANTICIPATED RESULTS:
PART I:
An increase of 0.9 to 1.3 °C was observed. For an increase of 1.3 °C,
H = (1.3)(90) = 117 calories.
calcalories per mole of Na_z CO3 0.04 liter x
1170.6cal
- 4875,
mole/liter mole
or 4.875 kcal/mole. AHr = -4.875 kcal/mole Na2CO3.
PART II:
Anticipated results vary from 20 to 80 per cent of the values given in food
tables (see Teaching Note 2). The following sample data illustrate this. Bear
in mind that food tables often don't list values in calories per gram, and also
that they list in Calories (capital C) which are kilocalories.
12o103
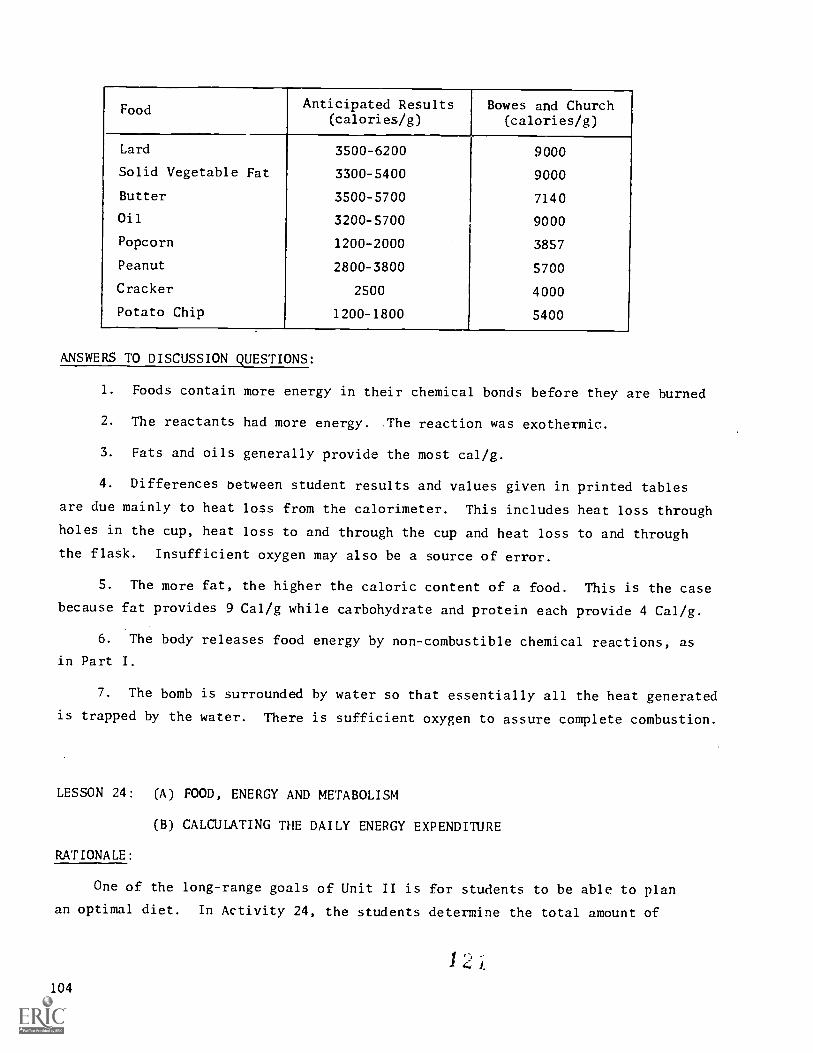
Food Anticipated Results(calories/g)
Bowes and Church(calories/g)
Lard 3500-6200 9000
Solid Vegetable Fat 3300-5400 9000
Butter 3500-5700 7140
Oil 3200-5700 9000
Popcorn 1200-2000 3857
Peanut 2800-3800 5700
Cracker 2500 4000
Potato Chip 1200-1800 5400
ANSWERS TO DISCUSSION QUESTIONS:
1. Foods contain more energy in their chemical bonds before they are burned
2. The reactants had more energy. The reaction was exothermic.
3. Fats and oils generally provide the most cal/g.
4. Differences between student results and values given in printed tables
are due mainly to heat loss from the calorimeter. This includes heat loss through
holes in the cup, heat loss to and through the cup and heat loss to and through
the flask. Insufficient oxygen may also be a source of error.
5. The more fat, the higher the caloric content of a food. This is the case
because fat provides 9 Cal/g while carbohydrate and protein each provide 4 Cal/g.
6. The body releases food energy by non-combustible chemical reactions, as
in Part I.
7. The bomb is surrounded by water so that essentially all the heat generated
is trapped by the water. There is sufficient oxygen to assure complete combustion.
LESSON 24: (A) FOOD, ENERGY AND METABOLISM
(B) CALCULATING THE DAILY ENERGY EXPENDITURE
RATIONALE:
One of the long-range goals of Unit II is for students to be able to plan
an optimal diet. In Activity 24, the students determine the total amount of
104

energy they expend in a given day. The data are needed for planning the optimal
diet in Activity 31.
In ST-24 the discussion of chemical energy begun in ST-22 is extended to con-
sider the energy content of several nutrients (fats, proteins and carbohydrates).
The concepts of metabolism and basal metabolic rate (BMR) are then introduced and
related to medicine in preparation for a more detailed treatment of the release
of energy from glucose during cell respiration.
OBJECTIVES:
The student will:
' calculate the energy per gram released by complete oxidation of either
a fat or sugar when given a chemical equation including the heat of
reaction.
' calculate his or her energy expenditure for a typical day.
define the terms metabolism, metabolic rate and basal metabolic rate.
-give an example of a medical condition that may be detected by per-
forming a BMR test.
SEQUENCE: ST-24; Activity 24
SUGGESTIONS:
1. Different usages of the word "calorie" may be a source of confusion.
One nutritionist's calorie = 1 Cal = 1 kilocalorie = 1000 calories. Food tables
commonly use nutritionist's calories, written as Cal, or sometimes even written
as calorie.
2. You may wish to try out the following two questions on your class.
a. How can the number of calories a person expends while performing a
specific activity be determined in a laboratory? (Answer: (1) measure oxygen
consumption, (2) correct it to STP (0 °C and 1 atm) using the gas laws, and
(3) multiply by 5 Cal/liter )2'
the value for an average diet.)
b. Use the equation for the oxidation of a fat in Section 24-1 to find7657 Cal 1 mole 02
the Cal/liter of oxygen for fat oxidation. (Answer:72.5 moles 0
222.4 liters 0
2= 4.7 Cal/liter 02.)
This might be a good opportunity to reinforce the earlier treatment ofV V'
the gas laws. According to Charles' Law, T = TT
105

For T' = 25 °C:
22.4 liters V'
273 °K -2T8-81
(22.4)(298)273
= 24.45 liters
Thus a more rigorous solution of b would utilize the value of 24.45 1
rather than 22.4 1.
7657 Cal 1 mole 02= 4 32
Cal
72.5 moles 02
24.45 liter 02
.
liter 02
KEY--PROBLEM SET 24:
1. a. 44 amu
b. 31 amu
c. 121 amu
INFORMATION ON ACTIVITY 24:
TEACHING NOTES:
2. a. exothermic
b. 342 amu
c. approximately 3.95 Cal; yes
1. In this activity, the students have an opportunity to calculate the
amount of energy expended during their daily activities. The results will be
compared to their daily caloric intake in Activity 29. This worksheet is the
first of a group of activities (see also Activities 29, 30 and 31) dealing with
ideal weight and optimal diet.
2. Anticipated time: one to two periods.
3. "Active exercies" and "Very strenuous exercise" may be distinguished as
follows. A moderate game of tennis or similar activities should be considered
as active exercise. Very strenuous exercise refers to the kind of sustained
activity that is engaged in when one is training as a runner or a swimmer. It
should be emphasized that the energy expended during more active forms of exercise
depends upon the degree of exertion. For example, a game of volleyball might
involve a rate of expenditure of as little as 4 or more than 7 Cal/kg-hr, depending
upon how it is played.
4. Students who experience- difficulty with the calculations may be referred
to Mathematics Problem Set 13, Unit II, for problems of a sin.ilar nature.
1 '4,, -;
106
LESSON 25: CELL RESPIRATION--AN INTRODUCTION
RATIONALE:
In Sections 22 to 24, the concept of energy and especially chemical energy is
developed. In ST-24 the relation between energy and the body is introduced. St-25
probes into the metabolic pathways by which the chemical energy in nutrients is
released and used to produce ATP. The importance of ATP is suggested here and will
be emphasized in ST-28 after the concept of equilibrium is considered. Activity
25 uses a board game to simulate and review cell respiration. This activity is
designed to extend over several periods and Part III of the game covers material
treated in ST-26.
OBJECTIVES:
The student will:
- distinguish between pulmonary respiration and cell respiration.
- write a balanced equation for the complete oxidation of glucose and
explain how the oxygen and carbon dioxide shown in the equation are
related to cell respiration.
- define metabolic pathway.
- state the structural difference between ATP and ADP and the significance
of the extra phosphate group in ATP.
SEQUENCE: ST-25; Activity 25
SUGGESTEONS:
1. Students may wisi, to construct molecular models of ADP and ATP. You can
point out that the five-membered ring with carbons and oxygen is the monosaccharide
ribose. The two fused nitrogen-containing rings together with ribose constitute
adenosine (the "A" in ATP). The phosphate groups are often shown as on p. 151 of
the Student Text.. However, it would be.more correct to visualize these groups as
ionized. (See figure on following page.)
2. The, process of glycolysis can be easily demonstrated by adding some
Brewer's yeast to a dilute (1 to 20) glucose solution. In about a day bubbles
will be visible. You can show that these bubbles are CO1 by passing them through
a limewater solution; a white CaCO3precipitate forms.
107
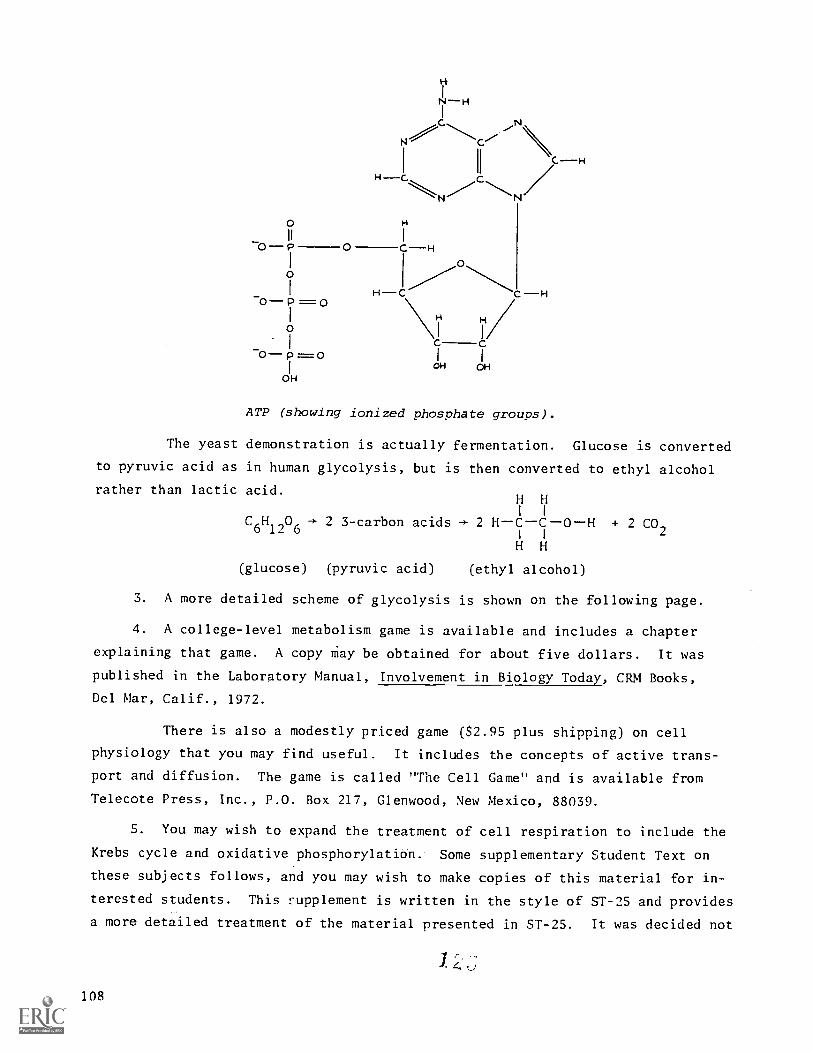
0
-0 P
0
0 p = 0
0
p) 0
OH
Pt
HC N
11
H
0 C H
O
HC \CH
CCI I
OH OH
CH
ATP (showing ionized phosphate groups).
The yeast demonstration is actually fermentation. Glucose is converted
to pyruvic acid as in human glycolysis, but is then converted to ethyl alcohol
rather than lactic acid.H HI I
C6H1206.+2 3-carbon acids 2 H--C--C--0--H + 2 CO2
I I
H H
(glucose) (pyruvic acid) (ethyl alcohol)
3. A more detailed scheme of glycolysis is shown on the following page.
4. A college-level metabolism game is available and includes a chapter
explaining that game. A copy May be obtained for about five dollars. It was
published in the Laboratory Manual, Involvement in Biology Today, CRM Books,
Del Mar, Calif., 1972.
There is also a modestly priced game ($2.95 plus shipping) on cell
physiology that you may find useful. It includes the concepts of active trans-
port and diffusion. The game is called "The Cell Game" and is available from
Telecote Press, Inc., P.O. Box 217, Glenwood, New Mexico, 88039.
5. You may wish to expand the treatment of cell respiration to include the
Krebs cycle and oxidative phosphorylation. Some supplementary Student Text on
these subjects follows, and you may wish to make copies of this material for in-
terested students. This supplement is written in the style of ST-25 and provides
a more detailed treatment of the material presented in ST-25. It was decided not
108

to include this supplement in the Student Text because it contains more detail
than is necessary for the purposes of this course.
Top OF THE ENERGY HILL
two rnolaCulesPHOSPHOGLYCERALDEHYDE
(3-carbon)
H 0\ 1H C OH
H C 0 0
/N -bDNV
0
Add morephosphate &energy (ona ATP)
OH
70 0 C HS.) cD O Sp.
L
0 "/Add phosphate& energy(ATP)
START GLYCOLYS LS
H
off
OH
OH
H
HO --H
S'
Si
electron,;energyidati
0
C-014
HCOHH C-0
H
(:)\COHC=0
H C H
Releasephosphate& energy(2 ATPs)
Releasephosphate&energy(2ATPs)
END GLYCOINS IS
109

SUPPLEMENT TO ST-25:
25-6 Once Around the Krebs Cycle
What is accomplished by the Krebs cycle?
You may recall that the molecular process of respiration can be summarized
in one equation.
C6H1206 + 6 02 .4- 6 CO2 + 6 Hp + energy (5)
(glucose)
Thus far, we have seen how glycolysis leads to a partial breakdown of glucose into
3-carbon compounds and to the storage of energy as ATP. Yet we have not brought
02
and CO into the picture and there is much useful energy left in pyruvic acid.
In the reactions to follow more energy will be released and "captured," and 02
and CO2will be brought into the action. Most of the energy in glucose is re-
leased after pyruvic acid is formed.
The breakdown or degradation of pyruvic acid involves a metabolic pathway
named the Krebs cycle after the biochemist who discovered it. The main steps of
the cycle are shown in Figure 4.
NAD
NADH
FUNIARIC ACID(4-CARBDN-A0D)
FAOHL
110
FAO
SUCCIN IC ACID(4- CARBON - ACID)
PYRUVIC ACID
INAo
-NADH
2-CARBON -COMPOUND
OXALOACET IC ACID(4- CARBON ACID)
CITRIC ACID(6- CARBON -ACID)
5- CARBON - Act!)
NADH ATP
FIGURE 4: Kre
NAD+ ADP
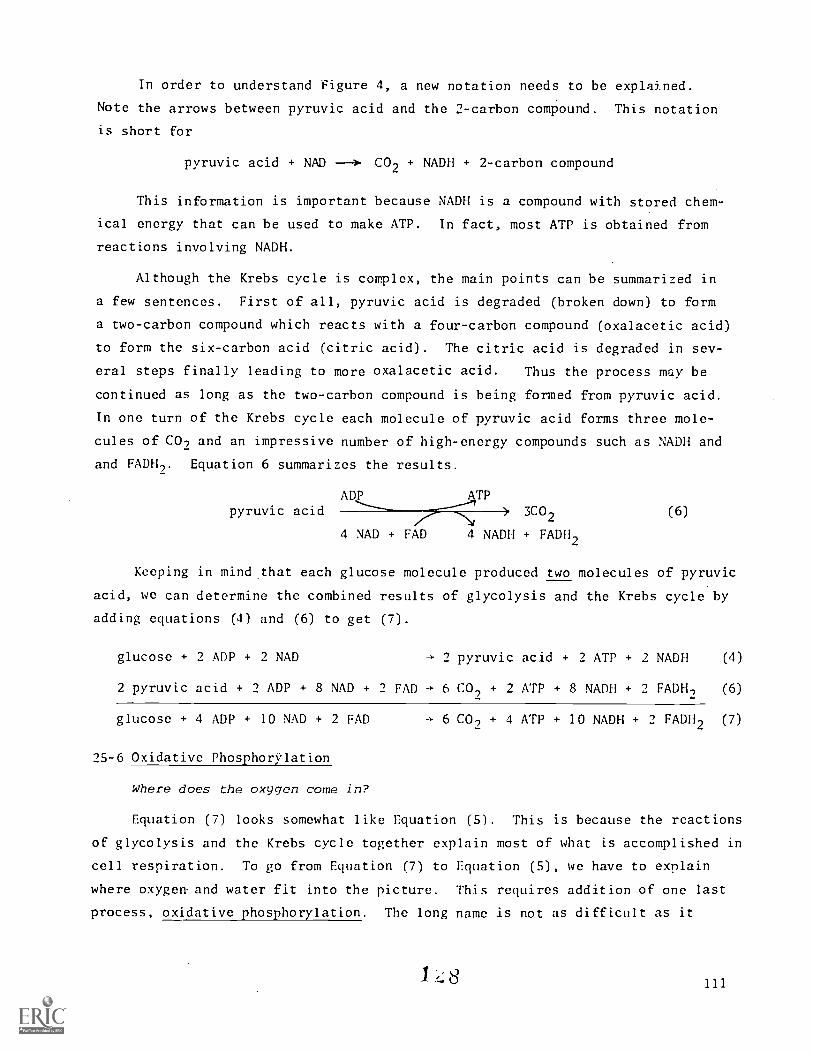
In order to understand Figure 4, a new notation needs to be explained.
Note the arrows between pyruvic acid and the 2-carbon compound. This notation
is short for
pyruvic acid + NAD CO2 + NADH + 2-carbon compound
This information is important because NADH is a compound with stored chem-
ical energy that can be used to make ATP. In fact, most ATP is obtained from
reactions involving NADH.
Although the Krebs cycle is complex, the main points can be summarized in
a few sentences. First of all, pyruvic acid is degraded (broken down) to form
a two-carbon compound which reacts with a four-carbon compound (oxalacetic acid)
to form the six-carbon acid (citric acid). The citric acid is degraded in sev-
eral steps finally leading to more oxalacetic acid. Thus the process may be
continued as long as the two-carbon compound is being formed from pyruvic acid.
In one turn of the Krebs cycle each molecule of pyruvic acid forms three mole-
cules of CO, and an impressive number of high-energy compounds such as NADH and
and FADH,. Equation 6 summarizes the results.
pyruvic acidADP
4 NAD + FAD
ATP3C0
2
4 NADH + FADH,
(6)
Keeping in mind that each glucose molecule produced two molecules of pyruvic
acid, we can determine the combined results of glycolysis and the Krebs cycle by
adding equations (4) and (6) to get (7).
glucose + 2 ADP + 2 NAD 2 pyruvic acid + 2 ATP + 2 NADH (4)
2 pyruvic acid + 2 ADP + 8 NAD + 2 FAD 6 CO, + 2 ATP + 8 NADH + 2 FADH2 (6)
glucose + 4 ADP + 10 NAD + 2 FAD 6 CO, + 4 ATP + 10 NADH + 2 FADH2 (7)
25-6 Oxidative Phosphorylation
Where does the oxygen come in?
Equation (7) looks somewhat like Equation (5). This is because the reactions
of glycolysis and the Krebs cycle together explain most of what is accomplished in
cell respiration. To go from Equation (7) to Equation (5), we have to explain
where oxygen and water fit into the picture. This requires addition of one last
process, oxidative phosphorylation. The long name is not as difficult as it
1 8111

sounds. The process involves two actions--oxidation, and the addition of phos-
phate groups to ADP to make ATP (phosphorylation).
In oxidative phosphorylation, NADH and FADH2 react with 02 to form NAD or
FAD, and H20. Most important, energy is released in this reaction permitting
ADP and phosphates to form ATP molecules. The details of this process are in-
tricate, but the summation of glycolysis, the Krebs cycle and oxidativ.,.. phos-
phorylation gives Equation (5). All of the useful energy formed is con'nined in
ATP. A total of 36 ATP molecules are formed in cellular respiration from each
molecule of glucose.
INFORMATION ON ACTIVITY 25:
TEACHING NOTES:
1. The purpose of this activity is to review some of the fighlights of
cell respiration as they relate to nutrition. The simulation game should help
to make an abstract subject a little bit easier to relate to the human organism.
2. Anticipated time: two to four periods.
3. If you wish to shorten the activity, you should provide the student
with most or all materials for the game and then eliminate Part I. For example,
students could be provided with play money such as Monopoly money and given a
color code to relate the play money to energy currency. Colored toothpicks
could be used for energy currency. If desirable, Part II could be eliminated.
However, this would result in the initial game being rather complicqted. [Ver-
sion 1 of the game (Part II) is deliberately much simpler than Version II of the
game (Part 111).]
4. The activity can he extended by allowing the students to try to improve
the simulation (sec Discussion Question 3). Also, another version of the game
could he added in which the winner is the one who is first to complete the path-
way an agreed number of times.
5. It would probably be a good idea to stress at the beginning of the game
that the intent of the activity is NOT TO MEMORIZE ALL THE NAMES OR STRUCTURES ON
THE-BOARD.
6. Part II should not be started until students have read Section 25; Part
III should not be started until students have read Section 26.
7. If your students tend to be argumentative, you might have each group
elect a "judge" to settle disputes, or have each group agree to settle disputes
by majority vote.
112

8. It is convenient to play in groups of four to six students per game
board. They can gather around small tables if available or sit on the floor.
9. Some aspects of the simulation may be subtle and merit an announcement
or a discussion.
a. The game calls for two turns of the Krebs cycle because each glu-
cose molecule yields two pyruvic acid molecules and each of those molecules
accounts for one turn of the Krebs cycle.
b. Part III suggests some of the varieties of pathways of metabolism
that can occur.
c. The "Alternate Pathway" that starts near glucose phosphate is called
the hexose monophosphate shunt. It provides a means for synthesis of ribose and
other substances.
d. "Synthesis" cards show organelles of the cell that are important in
synthesis of molecules. It takes energy to make these organelles so they cost
15 ATP's in the game.
e. When NADU is oxidized in a cell, 3 ATP's are obtained. The corres-
ponding oxidation of FADH, yields only 2 ATP's.
10. It may be worthwhile to remind students that they may purchase "Synthe-
sis" cards in Part This adds excitement to the game.
11. A more permanent-type game can be made by gluing the playing board to
poster board or cardboard. The same is true for the various kinds of cards.
12. It would be a good idea to have some rubber bands on hand to assort the
different kinds of currency and cards.
For oxygens, you may use buttons or checkers or poker chips or paper
clips. For moving pieces, students could use coins or rings or small pieces of
paper with their initials.
14. A sheet headed "Synthesis Cards" follows the Materials list. Prepare
one copy of this sheet for every group. (The Materials list is based on 6 groups
of 5 students each.) "Double bonus" on the mitochondrion card means "receive
twice as many ATP's or NADH's, etc., as indicated on the playing board or in
an 'Energy and Currency' card."
15. Following the sheet headed "Synthesis Cards," the playing board is
given on sheets. Each group will need one copy of each sheet.
I f)113

16. Following the game board are 4 sheets of "Energy and Catalysis" cards.
Each group will need one copy of each of these sheets.
17. Following the sheets of "Energy and Catalysis" cards, there is one
sheet of "Enzyme" cards and one sheet headed "SELECT A PATHWAY." Each group
will need one copy of each of these sheets.
118. For energy currency, students can make bills from an 8-
fx 11 sheet.
Thus each group will need 9 sheets. Typing paper can be used. Colored paper
would be preferred so the different kinds of currency can be distinguished from
each other. (Six different colors would be needed.) Crayons or felt pens could
be used to distinguish the different kinds of currency.
MATERIALS: (for 6 set-ups)
6 game boards (Teaching Note 15)
6 rolls transparent tape
12-18 scissors
6 sheets "SYNTHESIS CARDS"
54 sheets, 8-4 x 11 inches(Teaching N5te 18)
crayons or felt pens (optional,see Teaching Note 18)
114
6-12 millimeter rulers
24 sheets "ENERGY AND CATALYSIS CARDS"(Teaching Note 16)
12 dice
6 moving pieces (Teaching Note 13)
500-600 "oxygens" (Teaching Note 13)
60 rubber bands

RIBOSOME
(ENZYME SYNTHESIS)
LOSE \O TURNS
( two circuits of hoard )
MITOCHONDRION
(ATP SYNTHESIS)
DOUBLE BONUSES
( two circuits of hoard )
NUCLEUS
(GENE LOCATION)
4 EXTRA TURNS
( two circuits of hoard )
RIBOSOME
(ENZYME SYNTHESIS)
LOSE NO TURNS
( two circuits of hoard )
MITOCHONDRION
(ATP SY\THESIS)
DOUBLE BONUSES
( two circuits of hoard )
NUCLEUS
(GENE LOCATION)
4 EXTRA TURNS
( two circuits of hoard )
RIBOSOME
( ENZYVE SYNTHESIS)
LOSE NO TURNS
( two circuits of hoard )
MITOCHONDRION
(ATP SYNTHESIS)
DOUBLE BONUSES
( two circuits of board )
NUCLEUS
(GENE LOCATION)
4 EXTRA TURNS
( two circuits of board )
HIm0)
O)
C)

GLYCO
FRUCTOSEPHOSPHATE
COP
oI\ /1co
ENERGY
CATALYSIS
LOSE
1
ATP
FRUCTOSEDI PHOSPHATE
COP COP
1\1 /1cc.
COW
C:40
COP
ENTERHMPSHUNT E>
RECEIVE
1
NADW
GLUCOSEPHOSPHATE
COP
\ /1
FA 'MI r/41/11
ENERGY it& OF
CATALYSIS°ImArv--
LOSE1.
ATP
116
COP
Coc\ /dcrCOOH
C -OH
HO- C
C -OH
C -OH
&DP
IRECEIVE
i.
NADH
ENERGY
CATALYSIS
NO
R I BoPHOS
ALTERNATE PATHWAY
ENERGY& CATALYSIS
CARDS
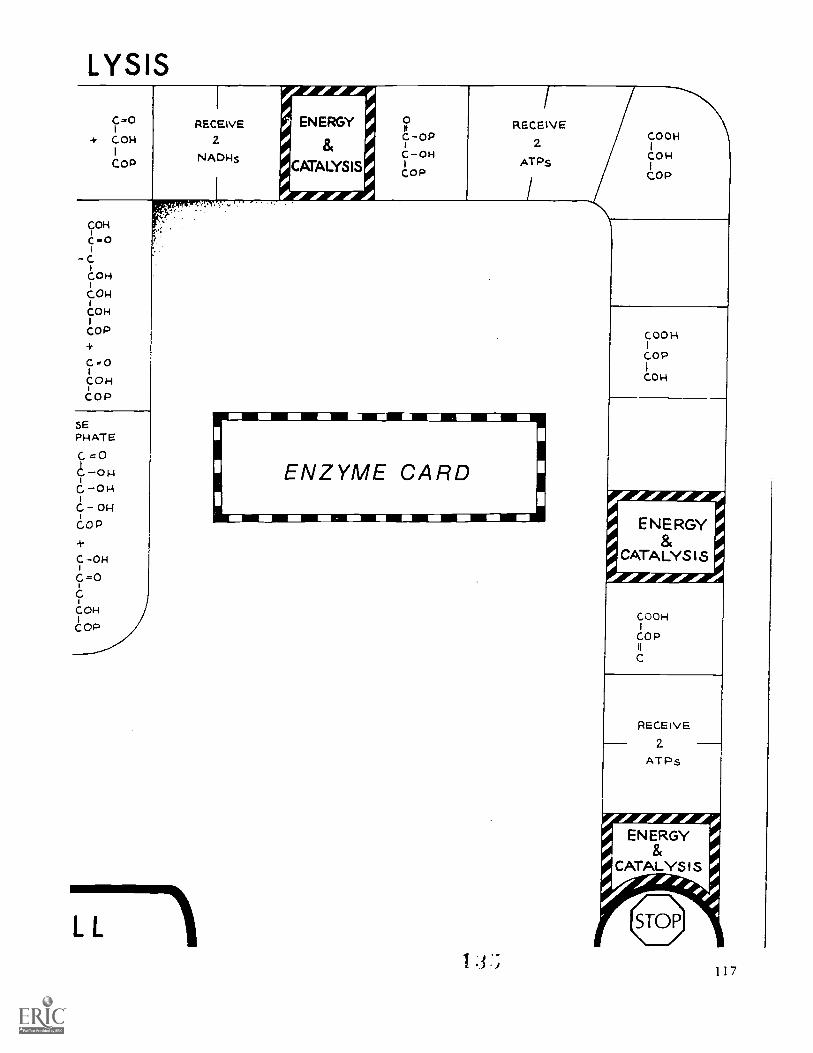
LYSIS
C-0CON
COP
RECEIVE2.
NADHs
RECEIVE
2
ATP
COON
CON1
COP
COH
c -0C
COH
CON
CON
COP
C -01
COHCOP
SEP1-4 AT E
C
C-OHC -ON
C OHCOP
C.-01-1
G=0
COHCOP
1
L L
NM NM =IMMO MTh
ENZYME CARD
MI MB MN . IN NI NM MN MO MI
3 -;
RECEIVE
2.
ATP$
#4/././//r
1 I 7

REcasys6 OWYGE
.EivE1
'AO 1--lz ---
FUMAR ICACID
C-COOHU
HOOC -C
0#1, ACID/ MALI C/ ENERGY ,r & HO -C -COON
8- COOHd CATALYSIS /., 0°
RE
SUCCINICACID
C-00oHC -C OOH
RECEIVE1
ATP
SUCC I N YL CoA
C COOH
0 - C -S -CoA COz
0
RECEIVE
1
NADH [iray.rAdrAdri
ENERGY&
CATALYSISA,ArArA
118
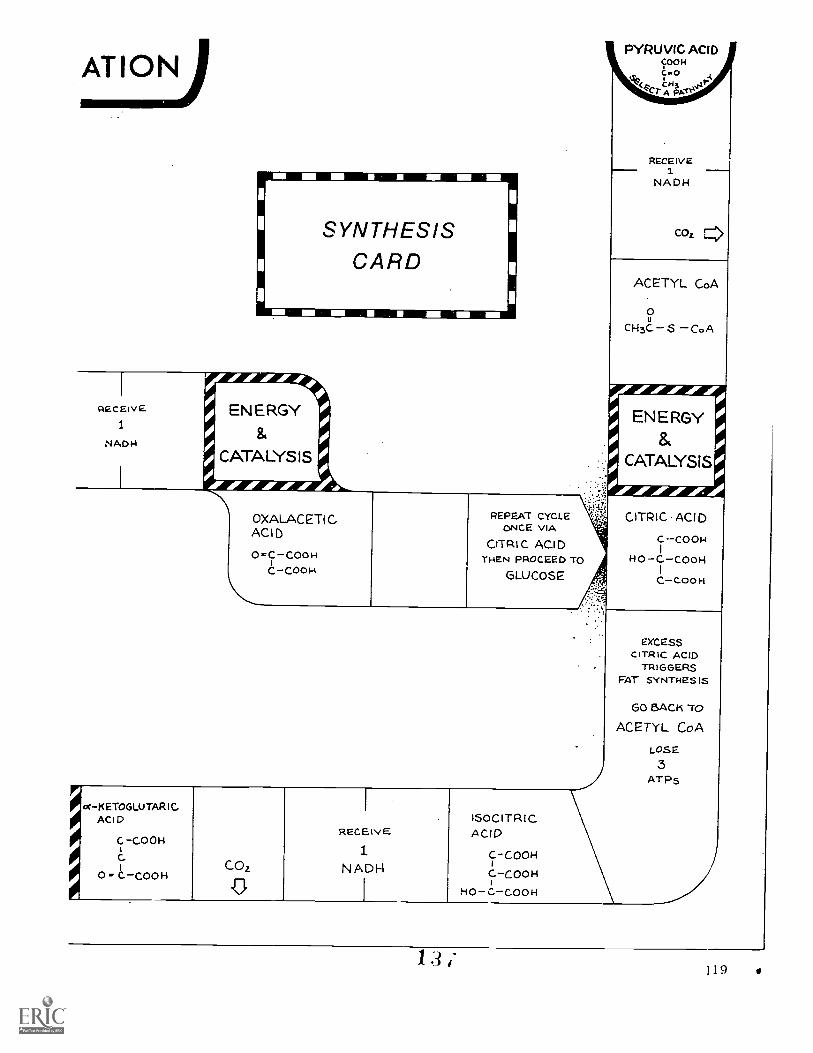
I
I
IN
SYNTHESISCARD
RECEtvE1
NADH
ENERGY
CATALYSIS
OXALACETICACID
O =C COOH
C-0001-4
REPEAT CYCLEONCE VIA
CITRIC ACIDTHEN PROCEED TO
GLUCOSE
oc-KETOGLUTAR ICACID
C -COOHiCi
0 - C -00014COz
0
RECEIVE
NADH
ISOCITRICACID
C- COON
C.-COO H
HO- C- COON
PYRUVIC ACIDPOOHi..o
4"C r ;4-4144.1
RECEIVE1
NADH
COLE
ACETYL CoA
O
CH3C S CoA
ndrArAnird0 0
ENERGY 00
8` ACATALYSIS
CITRIC ACID
C 00014
HO-C-COOH
C -COON
EXCESSCITRIC ACID
TRIGGERSFAT SYNTHESIS
GO BACK TO
ACETYL CoA
LOSE3
ATP
1.3,-119

ENERGY AND CATALYSIS CARDS
Good Work! The pepsinogen in yourstomach has been changed to pepsinwhich is hydrolyzing proteins toamino acids and peptides. Some ofthe amino acids are being convertedto pyruvic acid. Advance to pyruvicacid and "Select a Pathway."
An enzyme denatured by heat hasjust been replaced by freshly-made enzyme. Take an extra turn.
The coach made you drink somehoney before the race. Honey isrich in glucose and fructose.Advance to glucose or fructosephosphate. Receive from metabolicpool 6 oxygen molecules.
A molecule of NADH is oxidized.,In this exothermic reaction, 3
ATP molecules form. Receivesame from metabolic pool.
You just lifted up your arm andcontracted muscles when you shotthe dice. This requires energyand will cost you 4 ATP's. Paymetabolic pool.
You have just finished a chopped-liver sandwich. Since liver isa good source of essential aminoacids, you can now make moreenzymes (proteins). Take twoextra turns.
You stopped smoking and fewer ofyour hemoglobin molecules are tiedup with carbon monoxide. Now youcan transport more oxygen to yourcells. Receive 6 oxygen molecules.
You have just eaten a slice ofwhole-wheat bread, a good sourceof thiamin. Thiamin helps con-vert pyruvic acid to acetylco-enzyme A. Advance to acetylco-enzyme A and take another turn.
Bad news. Your drinking water iscontaminated by mercury. Thiselement inhibits some enzymes. ff
you have an enzyme card, return itto the metabolic pool. Otherwise,lose a turn.
You weren't supposed to swallowthe fluoridated toothpaste.Fluoride inhibits certain meta-bolic steps early in glycolysis.Go back to glucose and lose oneturn.
1,.')
,(
120
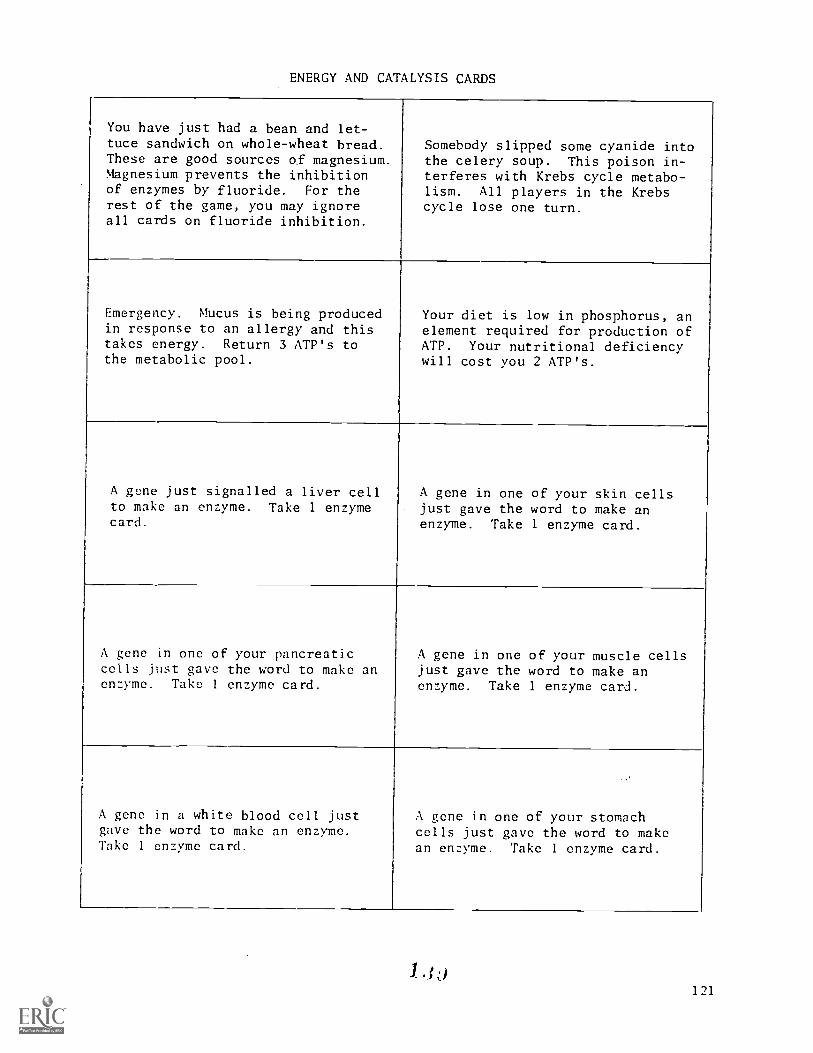
ENERGY AND CATALYSIS CARDS
You have just had a bean and let-tuce sandwich on whole-wheat bread.These are good sources of magnesium.Magnesium prevents the inhibitionof enzymes by fluoride. For therest of the game, you may ignoreall cards on fluoride inhibition.
Somebody slipped some cyanide intothe celery soup. This poison in-terferes with Krebs cycle metabo-lism. All players in the Krebscycle lose one turn.
Emergency. Mucus is being producedin response to an allergy and thistakes energy. Return 3 ATP's tothe metabolic pool.
Your diet is low in phosphorus, anelement required for production ofATP. Your nutritional deficiencywill cost you 2 ATP's.
A gene just signalled a liver cellto make an enzyme. Take 1 enzymecard.
A gene in one of your skin cellsjust gave the word to make anenzyme. Take 1 enzyme card.
A gene in one of your pancreaticcells just gave the word to make anenzyme. Take I enzyme card.
A gene in one of your muscle cellsjust gave the word to make anenzyme. Take 1 enzyme card.
A gene in a white blood cell justgave the word to make an enzyme.Take 1 enzyme card.
A gene in one of your stomachcells just gave the word to makean enzyme. Take 1 enzyme card.
121

EN!" '3Y AND CATALYSIS CARDS
A gene in one of your bone cellsjust gave the word to make anenzyme. Take 1 enzyme card.
Your mitochondria (cell organelles)are in great shape and, as a re-sult, Krebs cycle metabolism isprogressing rapidly. If you arein the Krebs cycle, take an extraturn.
ATTENTION. Ribose is urgentlyneeded to make a substance thatcarries genetic messages. Go backto glucose phosphate. On your nextturn, proceed through the "Alter-nate Pathway."
Your salivary glands have justsecreted amylase (in saliva), andthe starch in a pizza you're eatingis being digested. Advance to glu-cose and receive 6 oxygen molecules.
Ahoy! The food is coming down theesophagus with peristaltic waves.Energy will soon be released. Re-ceive 5 ATP's.
The pyloric valve has just openedand chyme is passing from the sto-mach to the duodenum. Take anextra turn.
You got an A in a Biomedical Sciencetest, got excited and started tohyperventilate. The blood pH haschanged and the pH is now unfavor-able to most enzymes. Lose oneturn while you breathe into a paperbag.
Your gallbladder has just releaseda pile of bile causing emulsifi-cation of fats in the duodenum.This will make possible digestionand absorption of fats. Receive5 ATP's.
You just absorbed some sugar mole-cules in the villi of the smallintestines. The sugars will soonbe available for energy. Receive5 ATP's.
Good News. You have recoveredfrom hepatitis and your liver isnow doing a better job of cellrespiration. Receive 5 ATP's.
14 1)
122

ENERGY AND CATALYSIS CARDS
You have just taken up jogging andare releasing more energy than youare consuming from foods. That willcost you 3 ATP's.
Something is wrong with your ho-meostatic controls. Lose oneturn, then take two turns insuccession.
You have a slight case of anemia.Your serum hemoglobin concentrationis below normal. That will cost you4 oxygen molecules.
Your BMR shows an increased meta-bolic rate. Receive 5 ATP's.
"Lactose Intolerance" is intolerable.Because of your inability to digestlactose, you are low in glucose. Goback to glucose and lose a turn whileyou switch to a low-lactose diet.
Your diet is rich in meat andwhole grain products so you areobtaining lots of niacin. Nia-cin is the raw material for pro-duction of NADH. Receive 3 NADH's.
The diagnosis is diabetes. Yourpancreas is not making enough insu-lin. As a result, glucose moleculesare not getting into your cells.That will cost you 4 ATP's.
Some liver glycogen has just hydro-lyzed to glucose. This will soonprovide lots of energy. Receive5 ATP's.
Your thyroid gland just secreted somethyroxin and your BMR has increased.Take two extra turns.
You have just had a pot roast andpeanut butter sandwich on whole-wheat bread. These are goodsources of pantothenic acid. Thisvitamin is needed for productionof acetyl CoA. Advance to thismolecule and take another turn.
14 123
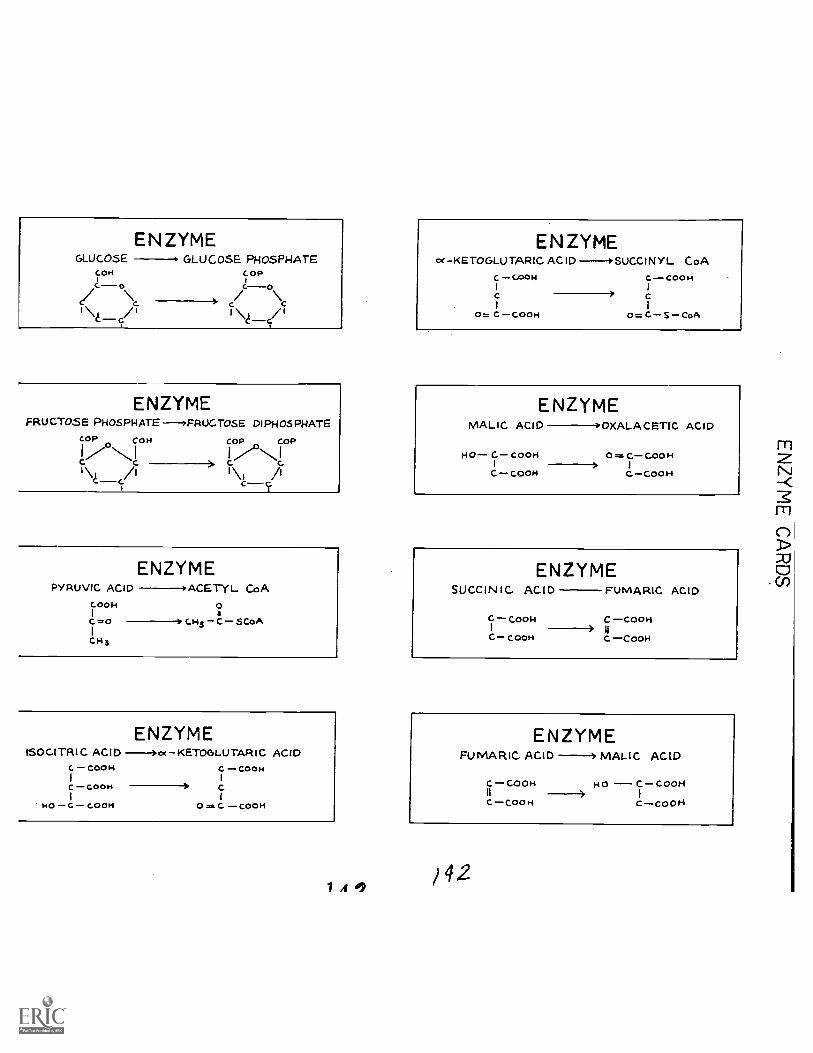
ENZYMEGLUCOSE GLUCOSE PHOSPHATE
i.OH COP
I \--Cr I I
ENZYMEFRUCTOSE PHOSPHATE 'FRUCTOSE DIPH 05 PHATE
I
OP COH COP COPOH
°1IN. /1 I \
NIC :
ENZYMEPYRUVIC ACID +ACETYL CoA
COOH 0IIC=0 ----a CH3 C SCOA
CH3
ENZYMEISOCITRIC ACID --)oc KETOGLUTARIC ACID
COON
C COOH
HO C COOH
C COONI
o.a.c COON
1 A
ENZYMEoc-KETOGLUTARIC ACID +SUC.CINYL CoA
C COON C.COOH
0= C S --CoA0= C COOH
ENZYMEMALIC ACID -IP OXALACETIC ACID
HO C CooH 0 = CooH1 -->
C C0014 CCOOH
ENZYMESUCCINIC ACID FUMARIC ACID
C, Cook C COOH-->C cooH C'COON
ENZYMEFUMARIC ACID --3 MALIC ACID
C COOH HO C COON
C--000 H CCOON
i42
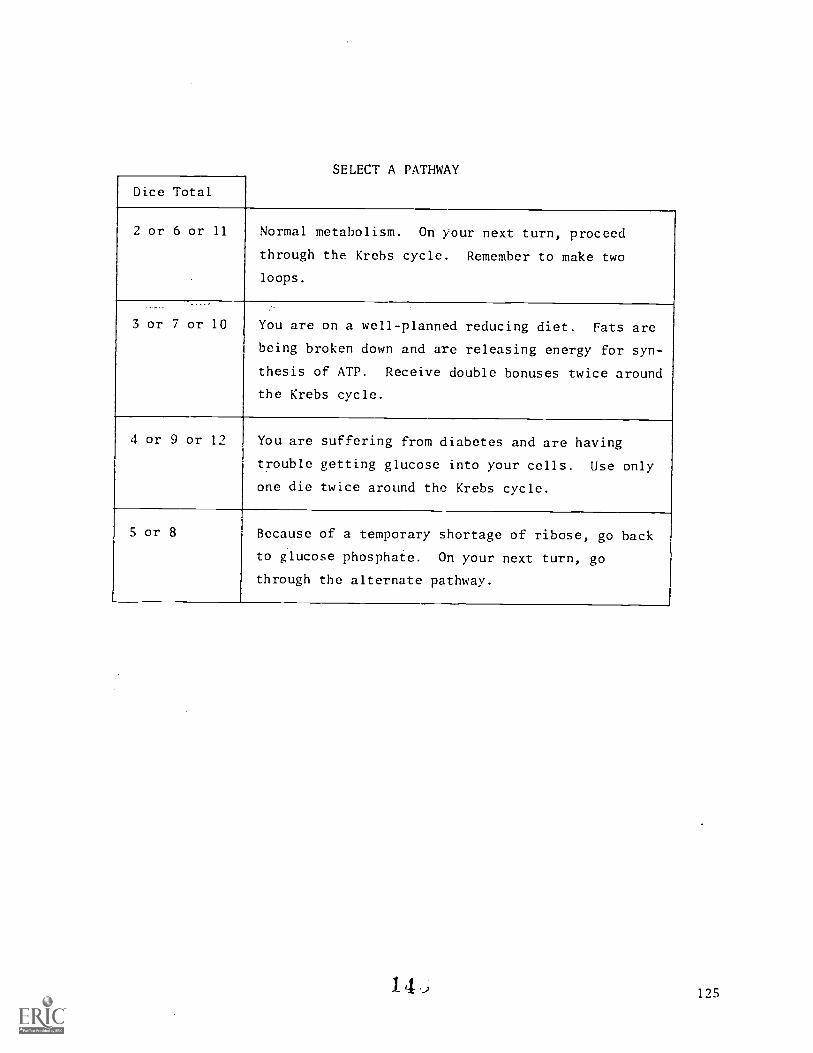
SELECT A PATHWAY
Dice Total
2 or 6 or 11 Normal metabolism. On your next turn, proceed
through the Krebs cycle. Remember to make two
loops.
3 or 7 or 10 You are on a well-planned reducing diet. Fats are
being broken down and are releasing energy for syn-
thesis of ATP. Receive double bonuses twice around
the Krebs cycle.
4 or 9 or 12 You are suffering from diabetes and are having
trouble getting glucose into your cells. Use only
one die twice around the Krebs cycle.
5 or 8 Because of a temporary shortage of ribose, go back
to glucose phosphate. On your next turn, go
through the alternate pathway.
14 125

ANTICIPATED RESULTS:
As a result of the games, students should have a better conception of the
material covered in Sections 25 and 26 and an idea of some of the ways that nutri-
tion and medicine are related to cell respiration.
ANSWERS TO DISCUSSION QUESTIONS:
1. The second version because it includes the relationship of many things
that may happen in the cell or in a person that affect cell respiration.
2. Answers will vary. There are many ways that the simulation differs
from real life. One interesting point to consider is that life is not as
"chancy" as the game suggests.
3. Answers will vary. (You may wish to discuss "simulations" with your
social science colleague since this technique is used more commonly in Biomedical
Social Science than in this course.)
LESSON 26: FACTORS RELATED TO CELL RESPIRATION
RATIONALE:
ST-25 considered the breakdown of glucose and the related generation of
ATP. ST-26 shows how other nutrients, namely fats and proteins, are related to
cell respiration. In addition, the roles of genes, enzymes, vitamins and cell
structure in cell respiration are discussed. Part III of the simulated cell
respiration game (Activity 25) includes a review of ST-26.
OBJECTIVES:
The student will:
-list at least two nutrients in addition to glucose that are metabolically
linked to cell respiration.
-state why enzymes are necessary for cell respiration.
-state how a gene controls a metabolic ,step.
-state that a vitamin may function by aiding an enzyme in the catalysis
of a metabolic step.
-define organelle.
14
126
SUGGESTIONS:
1. Part III of Activity 25 (the simulation game) is dependent upon the con-
cepts covered in ST-26 and should follow a discussion of this material. The
simulation game may stimulate some questions on cell respiration. It might be
a good idea to leave some time for a discussion after the students complete
the game.
2. ST-26 introduces subcellular anatomy and electron microscopy very briefly.
This might be a good opportunity to develop these subjects in more depth. A dis-
cussion of mitochondria and cell respiration would be especially worthwhile. For
background material refer to a college cell physiology text such as B. Pansky's,
Dynamic Anatomy and Physiology, Macmillan Publishing Co., N.Y., 1975, or
W.V. Brown and E.M. Bertke's, Textbook of Cytology, Second ed., C.V. Mosby Co.,
St. Louis, 1974.
3. This lesson affords an opportunity to review the roles of certain hormones.
You might mention, for example, that insulin and thyroxin increase the rate of
cell respiration.
LESSON 27: CHEMICAL EQUILIBRIUM
RATIONALE:
In ST-27, equilibria are considered because they are important biologically
and because they are basic to both chemistry and physics. A treatment of
reversible reactions and equilibria in ST-27 leads to a consideration of the
role of ATP in metabolism in ST-28. The concept of equilibrium will be useful
later in the Biomedical Science curriculum and will be related to quadratic
equations in the Biomedical Mathematics course. LA-27 considers a reversible
reaction and how equilibrium can be shifted. The shifting of an equilibrium
position is the subject of ST-28.
OBJECTIVES:
The student will:
define and give at least two examples of chemical equilibria.
distinguish between a "static" and a "dynamic" equilibrium.
define saturated solution and describe what is happening at equilibrium.
I f 127

-list at least one example of a chemical equilibrium in which there
are mostly products.
-list at least one example of a chemical equilibrium in which there are
mostly reactants.
SEQUENCE: ST-27; LA-27 (or reverse)
SUGGESTIONS:
1. A simple analogy that may be useful in explaining the concept of a
dynamic equilibrium is player substitutions in a football game. Every time
a player is added, another is removed from the playing field so that the total
number of players on each side is constant.
2. The subject of equilibrium may be extended in several directions as
indicated in the supplement to the Student Text located after the suggestions.
This material was not included in ST-27 because it digresses from ' :niergy-
metabolism theme of Sections 22 through 28, yet it may be of value Lr you in
clarifying the concept of equilibrium. You may wish to make copies of the
supplement for your class.
3. In Section 27-2, there is a possible semantical problem that may bother
a few students. That is, when we speak about "more product molecules than
reactant molecules," we are speaking about proportions of products to reactants
rather than the number of different product and reactant molecules. This may
be made clear with an example. Suppose we have an equilibrium in which
If we say that at equilibrium, there are more products than reactants, we do not
mean that there are 3 molecules of product (1 C + 2 D) to every 2 molecules of
reactant (1 A + 1 B). We simply mean that the total number of C + D molecules
is greater than the total number of A + B molecules.
SUPPLEMENT TO SECTION 27:
27-3 Other Kinds of Equilibria
What are some other bioloqicallq important examples of equilibria?
The equilibrium concept is a very useful one not only because it applies to
nutrition and chemical reactions and to solubility problems, but also because it
helps to explain biologically important phenomena. Recall, for example, the
activity on diffusion of food color in Unit I. The color gradually spread from
one small area eventually filling the entire vessel. When the color was evenly
128

spread, what was the state of the food-coloring molecules? One conceivable answer
to this question is that the molecules had stopped moving. But this is not
reasonable because molecu;.-3 always moving (except at absolute zero). The
correct answer is that the molecules were moving in all directions. This kind of
disorganized movement in all directions is called random motion and exemplifies
a dynamic equilibrium.
Another example of an equilibrium relates to the level of oxygen in the blood.
As oxygen molecules are used up in respiration, other oxygen molecules are trans-
ported from the blood to body cells to replace them. So the concentration of
oxygen in the blood normally remains about the same.
You may recall that your old friend Tom ran into several problems with
oxygen in Unit I. In one case, when he climbed Mt. Whitney, he was unable to
breathe in enough oxygen to maintain his blood oxygen level. This was because
of the reduced partial pressure of oxygen at high altitudes. At a reduced
partial pressure, less oxygen would bind to hemoglobin. As a result, his equilib-
rium was disturbed and this led to dramatic physiological effects. (For a review
of the effect of high altitude on body oxygen level, you may refer to Unit I,
Sections 15, 16 and 31.)
The concept of equilibrium provides another way to look at homeostasis.
Homeostatic devices invariably entail some kind of equilibrium. For example,
the normal body maintains fairly constant levels of 0,, CO2, electrolytes, glu-
cose and many other substances. Values of these substances outside of the normal
ranges indicate that one or more body equilibria have been disturbed. Such
clinical results are of great medical importance. They may be the first clue
to a serious illness.
The concept of equilibrium may also be applied to human populations. Many
scientists are concerned about the continually increasing world population. They
fear that the available food resources cannot keep up with the increasing number
of mouths to feed. Some people, including a number of scientists, have recom-
mended that the total world population be kept at a constant level. A stable
population would result if there were an equilibrium in which the number of births
equaled the number of deaths. Can you explain why this would be a "dynamic"
rather than a "static" equilibrium?
.1 4 ;
129

INFORMATION ON LABORATORY ACTIVITY 27:
TEACHING NOTES:
1. The purpose of this activity is to reinforce ST-27 by demonstrating that
the concentration of products will change if the concentrations of reactants are
changed. In addition, data taken during the activity are used to calculate the
equilibrium constant, Keq , which remains the same despite the changes in concen-
trations of participants in the reaction.
2. Anticipated time: two periods.
3. The activity may be stopped any time after Part I, Step 7, and resumed
later. The procedure assumes that Parts I and II occur on different days.
4. Part II may be omitted if you wish to condense the activity. A calibra-
tion curve is provided on p. 136 in case this activity is not performed.
5. The calibration curve in Part II is made with potassium dichromate in
water. However, in Part I, the dichromate forms in a chromate solution rather
than in water. Nevertheless, the effect on absorbance is slight, and it is
easier to prepare the solutions in this manner. Note that the curve is non-linear
at low concentrations of dichromate. For this reason, the students are instructed
to depart from the usual procedure of drawing a "best" straight line.
6. Part I calls for pH measurements. These are needed for Part III.
These measurements should be accurate to t 0.2 pH units if possible. This is
why narrow-range pH paper (pH 6.0 to 8.0) is called for.
7. The BIP pH probe may be used in addition to, or instead of, pH paper.
If there is only one probe per class, each group can be assigned to measure the
pH in only one or two of its cuvets, so that there will be enough time for every
group to use the probe. The class pH data can then be shared. If the pH probe
is used, more solution will be needed than described in Part I, and the proce-
dure will have to be modified very slightly.
Note: It is important to rinse the pH probe thoroughly before each
measurement. Do this by moving it around in a beaker of distilled water for
10 seconds or more. This step removes the solution that remains on the probe,
which will affect the reading if it is not rinsed off. Use about 100 ml of
distilled water for a rinse bath and change it after every 15 to 20 rinses.
1 j h
130

8. Part I, Step 8, asks students to suggest a way to reverse the reaction
and then to try it out. The answer is to add a base. This may not be obvious
and may require a class discussion. There are two ways to explain how this
reverses the reaction. The reaction is
2 Cr0 4-2 + 2 El+ Cr207-2 + Ei20
If a base is added, it reacts with the H ions to form water. This removes H+
ions,
so that the reaction shifts to the left. Another way to explain the effect is that
the base reacts with dichromate by the following reaction.
Cr20
-2+ 2 OH c---=5" 2 Cr0
4
-2+ H2O
9. In Part III students calculate the equilibrium constant, Keq
, for the
chromate-acid reaction in three cuvets. The calculations involve some time-
consuming arithmetic. If three prove to be too many, one may be assigned as
homework or group work. You may wish to review multiplication and division in
scientific notation.
The instructions call for rounding to one digit after each calculation.
This simplifies calculations considerably. However, if you desire more accuracy,
numbers may be rounded to two digits.
10. In the formula for Keq
, the concentration of water is considered 1 "by
convention." This is because in the solutions that concern us the concentration
of water is always much larger than the concentration of the solutes, and varies
very little. Hence the concentration of water is considered constant and is
ignored in the calculation of Keq
"Ignoring [H20] in such calculations is
equivalent to treating [H,0] as 1.
11. The reason Keq
is calculated for only three of the five cuvets is that
the two cuvets containing the highest acid concentrations would not yield accurate
values for Keq
. There are several reasons for this. First, the pH can be measured
accurately in only the three cuvets with intermediate acid concentrations (because
these lie in the pH range of the 6.0 to 8.0 paper).
Second, at high acid concentrations, new products may appear in the test
tube which are not taken into account.
Third, high acid concentrations produce near-maximum dichromate concentrations.
This introduces a large uncertainty in the calculated chromate concentrations,
149131
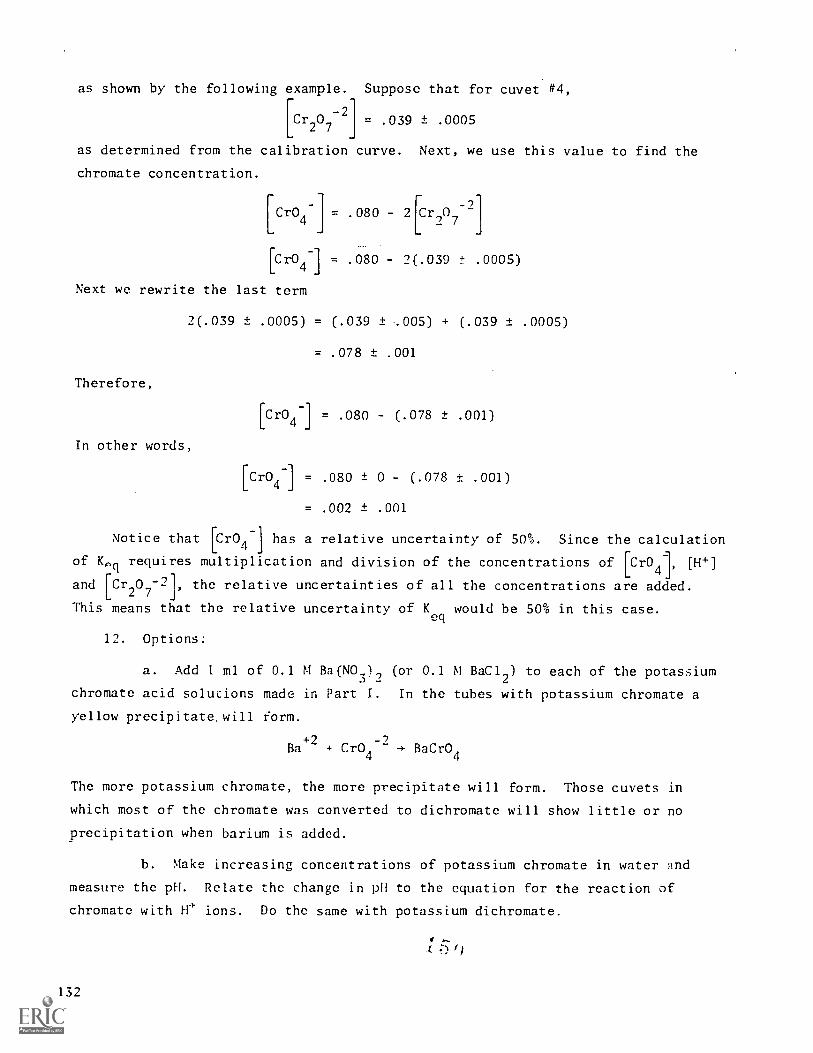
as shown by the following example. Suppose that for cuvet #4,
[Cr207-2] = .039 ± .0005
as determined from the calibration curve. Next, we use this value to find the
chromate concentration.
[Cr04 = .080 - 2[Cr107-2
[Cr04] = .080 - 2(.039 ± .0005)
Next we rewrite the last term
2(.039 ± .0005) = (.039 ± .005) + (.039 ± .0005)
= .078 ± .001
Therefore,
In other words,
[Cr041 = .080 - (.078 ± .001)
[Cr04] = .080 ± 0 - (.078 ± .001)
= .002 ± .001
Notice that [CrO4
I has a relative uncertainty of 50%. Since the calculation
of K 0,(1 requires multiplication and division of the concentrations of [Cr04I
'
[H41
and [Cr207-21
'
the relative uncertainties of all the concentrations are added.j
This means that the relative uncertainty of Keq
would be 50% in this case.
12. Options:
a. Add 1 ml of 0.1 M Ba(NO 1/
(or 0.1 M BaC12
) to each of the potassium3-
chromate acid solutions made in Part I. In the tubes with potassium chromate a
yellow precipitate. will form.
Ba+2
+ Cr04
BaCrO4
The more potassium chromate, the more precipitate will form. Those cuvets in
which most of the chromate was converted to dichromate will show little or no
precipitation when barium is added.
b. Make increasing concentrations of potassium chromate in water and
measure the pH. Relate the change in pH to the equation for the reaction of
chromate with H4- ions. Do the same with potassium dichromate.
132

MATERIALS: (for 10 set-ups)
14.57 g potassium chromate(K2Cr04)
16.7 ml conc. HC1
8 g sodium hydroxide (NaOH)
11.03 g potassium dichromate(K2Cr207)
5.23 g barium nitrate [Ba(NO3)2],(optional) or 4.89 g bariumchloride (BaC12.2H20) (optional)
20 beakers, 150-ml
10 beakers, 50-m1
10 pipets, 10-ml
120 cuvets, 16 x 125 mm, Pyrex
10 test-tube racks
10 BIP colorimeters
1 roll pH test paper, range 6.0-8.0
1 roll pH test paper, range 1-6 or 0-11
10 glass-marking pencils
graph paper, 60 sheets
PREPARATION OF REAGENTS:
0.1 M Potassium chromate, 750 ml: 14.57 ± .01 g potassium chromate + suffi-
cient water to make 750 ml.
1 M Hydrochloric acid, 200 ml: Add 16.7 ± .2 ml conc. HC1 to sufficient
water to make 200 ml.
1 M Sodium hydroxide solution, 200 ml: 8 ± .5 g NaOH + sufficient water to
make 200 ml.
0.05 M Potassium dichromate, 750 ml: 11.03 ± .01 g potassium dichromate +
sufficient water to make 750 ml.
0.1 M Barium nitrate, 200 ml (optional): 5.23 ± .01 g Ba(NO3)2 + sufficient
water to make 200 ml.
0.1 M Barium chloride, 200 ml (optional): 4.89 ± .01 g BaC12.2H20 + sufficient
water to make 200 ml (or use 4.17 ± .01 anhydrous BaC12).
ANTICIPATED RESULTS:
PART I:
Colorimeter.readings and their corresponding absorbances, which were observed
in our lab, are given in the table on the following page. pH is also shown, as
measured with pHydrion paper, range 6.0-8.0 (whenever possible) and range 1-6.
133

Cuvet Molarity of HC1 added % T Absorbance pH
0 0 100.0 .000 7.4
1 0.1 82.0 .085 6.8
2 0.2 73.0 .135 6.6
3 0.3 68.0 .165 6.4
4 0.4 62.5 .205 3.5
5 0.5 62.5 .205 1
PART II:
Colorimeter readings and their corresponding absorbances were observed to
be the following in our lab.
Tube Molarity of K2Cr207 added % T Absorbance
0 0 100 .000
1 .005 88 .055
2 .01 80 .095
3 .02 72 .145
4 .03 66 .180
5 .04 61 .215
6 .05 57 .245
The calibration curve drawn from these data is provided (Graph 1).
The calibration curve provided yields the following concentrations of di-
chromate from the absorbances in Part I:
Tube AbsorbanceDichromate concentration
(molarity)
0 .000 .00
1 .085 .0085
2 .135 .0175
3 .165 .026
4 .205 .0375
5 .205 .0375
134
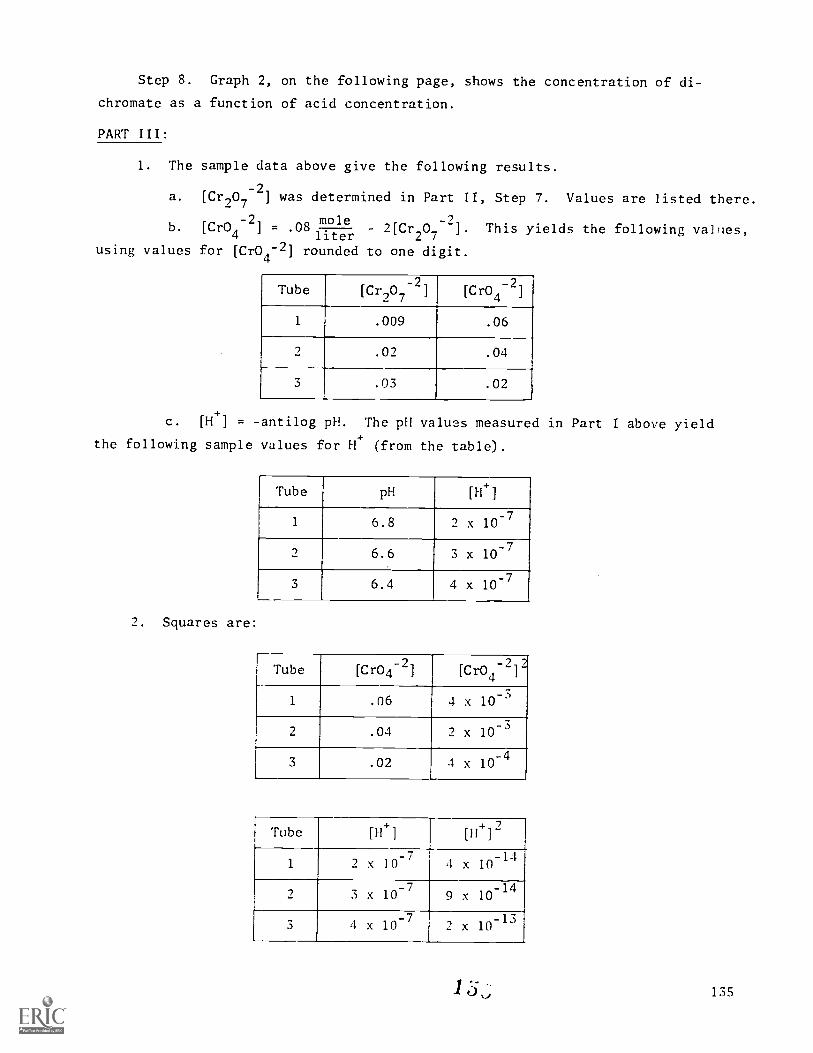
Step 8. Graph 2, on the following page, shows the concentration of di-
chromate as a function of acid concentration.
PART III:
1. The sample data above give the following results.
a. [Cr.707-2
] was determined in Part II, Step 7. Values are listed there.
mole4
b. [Cr°.-2
1
npt- 2[Cr207 ]. This yields the following values,
using values for [Cr04-2] rounded to one digit.
Tube [Cr207-2
] [Cr04-2]
1 .009 .06
2 .02 .04
3 .03 .02
c. [H+] = -antilog pH. The p11 values measured in Part I above yield
the following sample values for li+ (from the table).
2. Squares are:
Tube pH [H+]
1 6.8 2 x 10⁻⁷
2 6.6 3 x 10⁻⁷
3 6.4 4 x 10⁻⁷
Tube [Cr042] [Cr042
]
2
1 .06 4 x 10⁻³
2 .04 2 x 10⁻³
3 .02 4 x 10⁻⁴
Tube [H+]+
[H ]-,
1 2 x 10⁻⁷
4 x 10-14
2 3 x 10⁻⁷
9 x 10-14
3 4 x 10⁻⁷
2 x 10-13
135

136
.2
.2
.15
.10
.05
.0
0'
0
.0
GRAPH 1(CALIBRATION CURVE )
:Firg:::;. ...,i::ri
MAI11.21
r,iri-
,--i-f.---t;__..r-
--4F_111::-.
,_fT,-._-
-i_i_ 1_,
...Oi um!111:iriq
Inie.E: iiii.si1.11:::
MO"Mr Fir - , --1..... -; 1
.
.
Aam I 11-
r -L-- .1
SI'U
141011141: EPS'
IllaIllanaII
P
MirV
L. -1-_,_
i' '..i.
.4 .i.
.
A
lamV aple
umtelp1111111
46 Lig11 IIII
I am al i sa1 MIA iiiii i
l..T:
..iref.sm. . MiBN Asir
..m
1g qi.ffII....it, .. __n umb
.01 .02 .03
MOLARITY OF CrzOi
GRAPH 2.
.04 .05
---- ----------7-77-7-.7 -77 -771""' -1-
1 { t71- I"--1-
H-- , 4-..
!--4-7 --";-;-1- - TH-'---'--L,
771:, _.1 Ht...!--T-: jr_tiT Tr4-1-
---4--i! .-'--1+1-
- -'4H--1 ,
ri 7-7-7
-4-f-T--;--ri., ',',--- 1- .-----
: r -r-
! 'ir1-'. -'- ,
. - ._.-.-----------r--
--"---,.- --.--,-.:----
rt-r-1- , ' 1-I j- 4
1--.-1-, '.-r -1- r--" 'A--. --f4t7
--f f
..L.:_:_
.± ,-7_4. .-:_
-1'
. 1 i-,-_,.. 4,----1
i_f
--1: :___-1,--.14-r-_,
:__,_ .:....._ ,
St,. .
L.L.,. 1--1-, "T 177 '77, ---.-L.,
-I "7"7: i I1
I I rt-'--.. ;
i -1---i---14 4-
_....._ ,......_.
... . .... ..4. ._i._:._
,_-_.
:
_4_.._..._._ .__:._... , ,.._i__L_._
' 4
...._
-1--.. . _......._4_1._
--fr
i '. '
t- --', :
:
.. ,._ . ._:. .
;.. ; : ! ._- . _i_ i
--i-- --r-i-H---kl-T-7-- -,- i--*-
--1" 4* 4--.- . , 1 _I---;--t,r , .
L_;_i_i_.,.
i ', , 1 I WMnil--"--- --'- - '-t-t1H+-
. I-"r-rt-t- , 1-1-'- ,
-1--1-1-.: i . ' "7"-T77 . , ---1 '
__-4.- --4-- 4-
-,---1---
_-__-1-4-4.4---i-- --L-2.--4,-
___._.......- +-,--,----i--,
.
,_.,__...-t.:,.--
-+.---- ,-1-+ -t- ..;-:- ;---4-i-J,_:.,-,2t-i-1- ',_ -1-i-4--
------:-;-----.--',-. 1
. 1 I . 1
0 .1 .2 .3 .4
MOLARITY OP HCl ADDED TO CHROMATE
I 5
.5

[Cr207-2][H90] [Cr207-2]
[Cr04- 2]2[H4]2 [Cr04-2]2[H12eq
Cuvet
1
2
i3
Keq
009= .6 x 10 14
(4 x 10⁻³)(4 x 10⁻¹' )
.02
(2 x 10⁻³)(9 x= 1 x 10
14
.03= 4 x 10¹⁴
(4 x 10⁻⁴) (2 x 10-13)
ANSWERS TO DISCUSSION QUESTIONS:
1. Dichromate ions -- orange color; chromate ions--yellow color.
2. More.
3. Left.
4. Bases. such as sodium hydroxide, decrems9 the hydrogen ion concentration.
This causes dichromate to form chromate.
5. Any acid, such as acetic, nitric, sulfuric, etc.
6. As the concentrations of HC! approached 0.5 M, not much addition dichromate
formed be,Rusf: the reaction was nearly complete.
7. Potassium chormate uses up the H+ ions in water when it reacts with them
to form dichromate. Removal of H+ increases the proportion of OH- and thus raises
the pH.
8. See Teaching Note 5. Since the standard was made with dichromate in water,
it absorbs less light than the dichromate which forms in a chromate solution.
9. Values for Keq
will probably be found to differ. This is due to the in-
accv-racy of the measurements, including pH and % T. The standard curve contains a
small inaccuracy as well (see Question 8, above). Finally, the theory has inaccura-
cies as well. Molarities are actually only an approximate measure of the active ions
in a solution. To calculate Ken
, molarity must be multiplied by a constant called
the activity coefficient, which takes complex physical chemical considerations into
account.
10. Since Keq
is so large, there will be more products than reactants at
equilibrium. The reaction is exothermic.
137
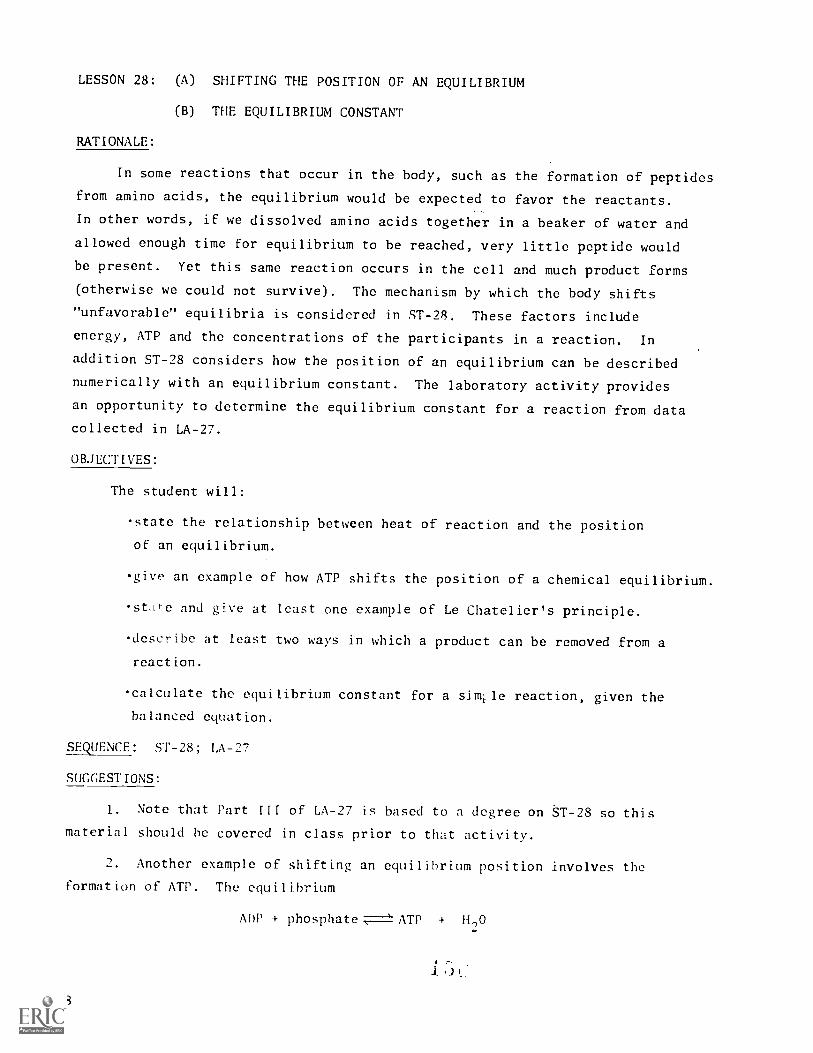
LESSON 28: (A) SHIFTING THE POSITION OF AN EQUILIBRIUM
(B) THE EQUILIBRIUM CONSTANT
RATIONALE:
In some reactions that occur in the body, such as the formation of peptides
from amino acids, the equilibrium would be expected to favor the reactants.
In other words, if we dissolved amino acids together in a beaker of water and
allowed enough time for equilibrium to be reached, very little peptide would
be present. Yet this same reaction occurs in the cell and much product forms
(otherwise we could not survive). The mechanism by which the body shifts
"unfavorable" equilibria is considered in ST-28. These factors include
energy, ATP and the concentrations of the participants in a reaction. In
addition ST-28 considers how the position of an equilibrium can be described
numerically with an equilibrium constant. The laboratory activity provides
an opportunity to determine the equilibrium constant for a reaction from data
collected in LA-27.
OBJECTIVES:
The student will:
e state the relationship between heat of reaction and the position
of an equilibrium.
give an example of how ATP shifts the position of a chemical equilibrium.
St e and give at least one example of Le Chatelier's principle.
-describe at least two ways in which a product can be removed from a
reaction.
calculate the equilibrium constant for a simile reaction, given the
balanced equation.
SEQUENCE: ST-28; LA-27
SUGGESTIONS:
1. Note that Part III of LA-27 is based to a degree on ST-28 so this
material should he covered in class prior to that activity.
2. Another example of shifting an equilibrium position involves the
formation of ATP. The equilibrium
ADP + phosphate ATP + 11,0
138

is normally in the direction of hydrolysis--at equilibrium, there is very
little ATP and a large proportion of ADP. In cell respiration, NADH is oxidized
to NAD. A great deal of energy is released in this process and this energy
drives the reaction in the direction of ATP formation. By coupling these two
reactions (NADH oxidation and ATP synthesis) the equilibrium is shifted to
favor ATP production. The actual coupling process involves a number of inter-
mediate steps and several enzymes.
3. In ST-28, AH is treated as the determinant of an equilibrium position.
However, it would be more correct to describe equilibria in terms of "free
energy" symbolized by AG (sometimes AF is used instead). We chose to use
AH in the Student Text for two reasons. First it is simpler to use and under-
stand and more in keeping with a high school chemistry course. Secondly,
AH is a useful approximation of AG in reactions that do not involve a signifi-
cant change in entropy, AS. (The relationship is: AH = AG - TAS.) You
may prefer to introduce a more rigorous treatment of energetics involving
AG. If so, the background information on free energy and equilibria may prove
useful.
4. The concept of chemical equilibria is complex and sometimes hard for
students to grasp. A simulation game is provided as an optional activity and
can be used to give students a clearer understanding of equilibrium. The
game follows the background information on free energy and equilibria.
INFORMATION ON FREE ENERGY AND EQUILIBRIA
In ST-23 and ST-24, it was pointed out that chemical reactions either
give off energy (exothermic reactions) or require energy (endothermic reactions).
Exothermic reactions are characterized by a negative value of AH while positive
values of AH imply an endothermic reaction.
Though the concept of AH is an extremely valuable one, it is not the best
term for describing the energy change in metabolic reactions. This is because
some of the energy released in a chemical reaction is not available in a usable
form. In other words, some of AH is "wasted" so far as life is concerned.
The wasted energy is heat. In a car not all the energy released by the combustion
of gasoline is used to propel the car forward since some heat energy is released
to the environment. Likewise not all the energy that we get from cell respira-
tion can be used for doing work. The usable energy component of AH is called
free energy. This kind of energy is "free" to do work. Reactions that occur
with a release of free energy are termed exergouic; those that require an
139

input of free energy are endergonic. The term exergonic, comes from two
Greek words--"ex" meaning "out" and "ergon" meaning "work." The term "en"
means "in."
The new terms can be reviewed with reference to the very first reaction
of glycolysis, one in which glucose phosphate is made from glucose.
glucose + phosphate a glucose phosphate (1)
The reaction can not proceed as written in Equation 1 because it is ender-
gonic. It requires an input of energy to proceed. On the other hand, the
hydrolysis of ATP is exergonic
ATP + H2O .4- ADP + phosphate (2)
Life "solves" the problem of making glucose phosphate by coupling, or
combining,the two reactions as shown in Equation 3. Thus Equation 2 provides
the free energy needed to drive Equation 1. It also provides the phosphate
of glucose phosphate.
glucoseATP ADP
glucose phosphate (3)
Many of the important processes of life are endergonic and require coupling
with exergonic processes to work. For example, building a protein from amino
acids and building a fat from two-carbon compounds are both endergonic processes
that can occur only if energy from the breakdown of ATP is supplied.
The concept of free energy is numerically related to the equilibrium constant.
In fact, if the free energy change of a reversible reaction is known, Keq
can
he easily calculated. Under standard conditions (specifically 25 °C, 1 atmosphere
pressure), AG = -RT In Keq.
The "R" is the gas constant (1.987) and "T" in the temperature on the
Kelvin scale. The relation is logarithmic.
The following table should make it easier to appreciate how AG varies with
K.
140
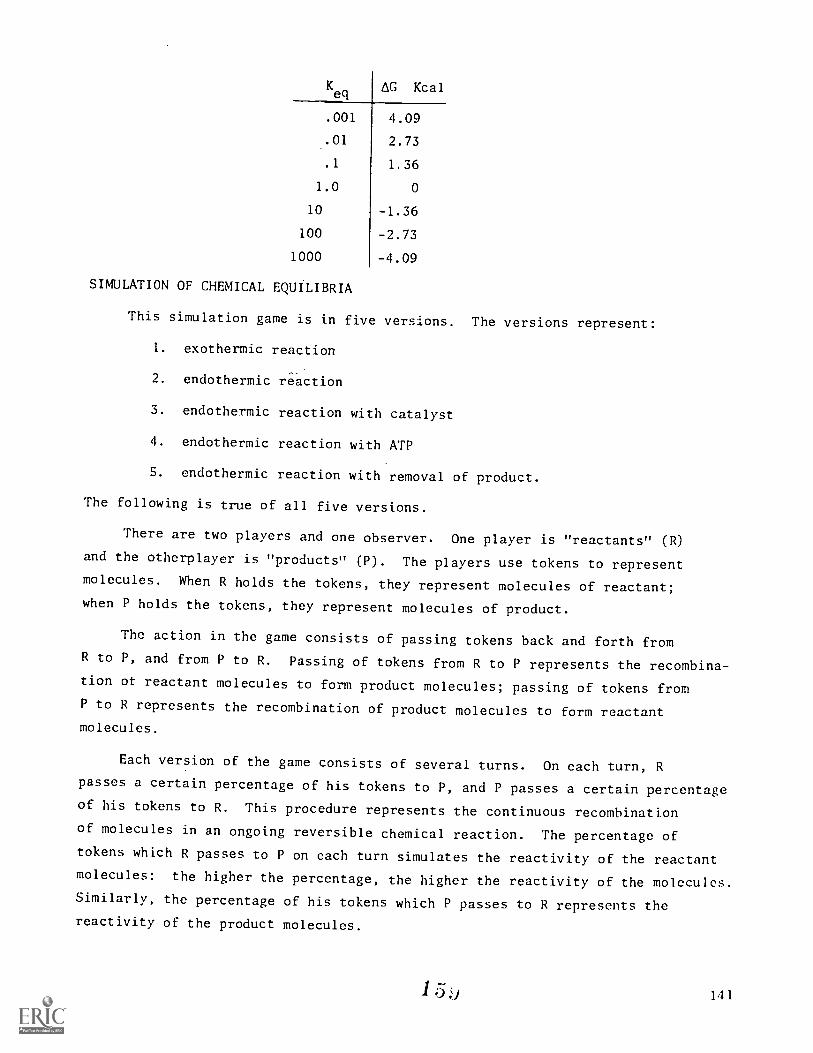
eqAG Kcal
.001 4.09
.01 2.73
.1 1,36
1.0 0
10 -1.36
100 -2.73
1000 -4.09
SIMULATION OF CHEMICAL EQUILIBRIA
This simulation game is in five versions. The versions represent:
1. exothermic reaction
2. endothermic reaction
3. endothermic reaction with catalyst
4. endothermic reaction with ATP
5. endothermic reaction with removal of product.
The following is true of all five versions.
There are two players and one observer. One player is "reactants" (R)
and the otherplayer is "products" (P). The players use tokens to representmolecules. When R holds the tokens, they represent molecules of reactant;
when P holds the tokens, they represent molecules of product.
The action in the game consists of passing tokens back and forth from
R to P, and from P to R. Passing of tokens from R to P represents the recombina-tion of reactant molecules to form product molecules; passing of tokens fromP to R represents the recombination of product molecules to form reactantmolecules.
Each version of the game consists of several turns. On each turn, R
passes a certain percentage of his tokens to P, and P passes a certain percentage
of his tokens to R. This procedure represents the continuous recombinationof molecules in an ongoing reversible chemical reaction. The percentage of
tokens which R passes to P on each turn simulates the reactivity of the reactantmolecules: the higher the percentage, the higher the reactivity of the molecules.
Similarly, the percentage of his tokens which P passes to R represents the
reactivity of the product molecules.
14 1

The function of the observer is to record the numbers of tokens passed
on each turn and the total numbers of tokens held on each side after eachturn. The observer will call a halt to the version with either (A) the
totals have not changed in five turns or (B) one side has only one token after
a turn. The situation in which the numbers have not changed in five turns
represents chemical equilibrium (A); the situation in which P is reduced to
one token (in the final version of the game) is an arbitrary stopping point
for the process in which molecules of product are removed from the reaction (B).
The observer can keep score on a score sheet as in the sample shown below.
SAMPLE SCORE SHEET
TURNR
hasR
passesnet
passedP
passesP
has
OBSERVERholds for P(version V)
100 0 0
1 0
....
10
The five versions differ from one another only in the percentage of tokens
passed by a player on each turn. Whenever a player calculates the number of
tokens he is to pass, the procedure is to (1) multiply the number of tokens
he has before this turn, by the percentage shown in Table I (2) round down
to the next lowest whole number if the product is not a whole number, (3) place
the resulting number of tokens in the center of the table, (4) remove from the
center of the table the tokens which the other player has placed there and
add them to his own pile, and (5) IN VERSION V, P ONLY, deduct a given percentage
of his pile and hand the tokens to the oberver for safekeeping. (Each time
a player has a turn, he begins with Step 1.)
I 6/}
112

TABLE 1PERCENTAGE RULES
VERSION I (EXOTHERMIC)
VERSION II (ENDOTHERMIC)
VERSION III (ENDOTHERMIC WITHCATALYST)
VERSION IV (ENDOTHERMIC WITHATP)
VERSION V (ENDOTHERMIC WITHREMOVAL OF PRODUCT)
R PASSES: P PASSES:
50% 10%
10% 50%
twice as many asin "endothermic,"i.e. 20%
twice as many asin "endothermic,"i.e. 100%
four times as manyas in "endothermic,"i.e. 40%
same as in "endo-thermic," i.e. 50%
same as in "endo-thermic," i.e. 10%
same as in "endo-thermic," i.e. 50%,but AFTER EACH TURN,REMOVE 80% OF PILEAND HAND TOKENS TOTHE OBSERVER
The results that will be obtaii,-. if R starts with 100 tokens at the
beginning of each version, are as shown on the next 5 pages. (Different colored
chips or toothpicks can be used for tokens, some representing 10, some 5 and
some 1; the observer can act as banker to make change if necessary. The game
can also be played without any tokens; players can simply perform calculations
and keep a running total on paper.)
143

TURNR
hasR
'assesnetpassed
P
assesP
has
OBSERVERholds forP(Version V)
100 0
1 50 50 --> 0
50 50
2 25 20 4 5
30 70
3 15 8 + 7
22 78
4 11 4+ 7
18 82
9 1 8
17 83
EQUILIBRIUM- , 8 0 8
17 83
7 8 0 8
17 83
8 8 0 8
17 83
9 8 0 8
17 83
10 8 0 8
VERSION I: Exothermic Reaction
NOTE: The reactants are much more reactive thanthe products; at equilibrium, there is much moreproduct than reactant.
144

TURNR
hasR
passesnet
passedP
passesP
has
OBSERVERholds for P(Version V)
100 0
1 10 10 --> 0
90 10
2 9 4 4 5
86 14
3 8 1 4. 7
. 85 15
4 8 1 + 7
84 16
5 EQWUBMUM-- 8 0 8
84 16
6 8 0 8
84 16
7 8 0 8
84 16
8 8 0 8
84 16
9 8 0 8
10
VERSION II: Endothermic Reaction
NOTE: The products are much more reactive thanthe reactants. At equilibrium, there is muchmore reactant than product.
1t145
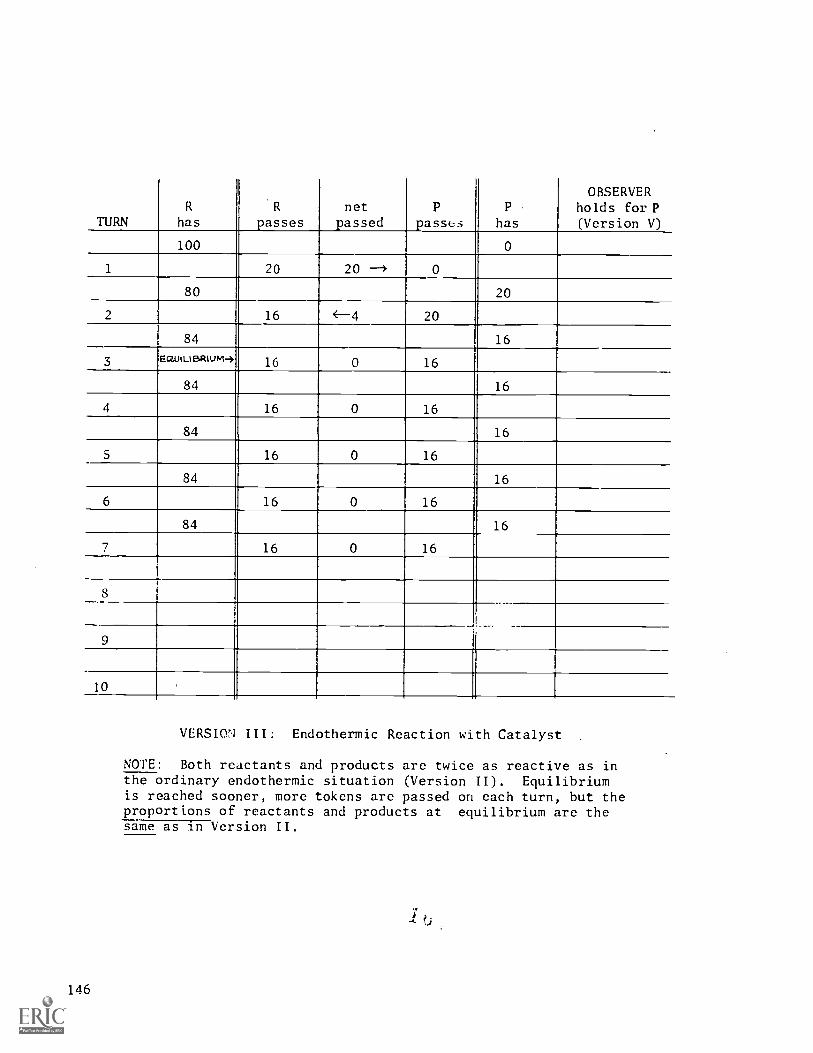
TURNR
hasR
passesnet
passedP
passesP
has
OBSERVERholds for P(Version V)
100 0
1 20 20 --> 0
80 20
2 16 <--4 20
84 16
3 EQUiLIBRIUM-+ 16 0 16
84 16
4 16 0 16
84 16
5 16 0 16
84 16
6 16 0 16
84 16
7 16 0 16
8
9
10
VERSION III: Endothermic Reaction with Catalyst
NOTE: Both reactants and products are twice as reactive as inthe ordinary endothermic situation (Version II). Equilibriumis reached sooner, more tokens are passed on each turn, but theproportions of reactants and products at equilibrium are thesame as in Version II.
146
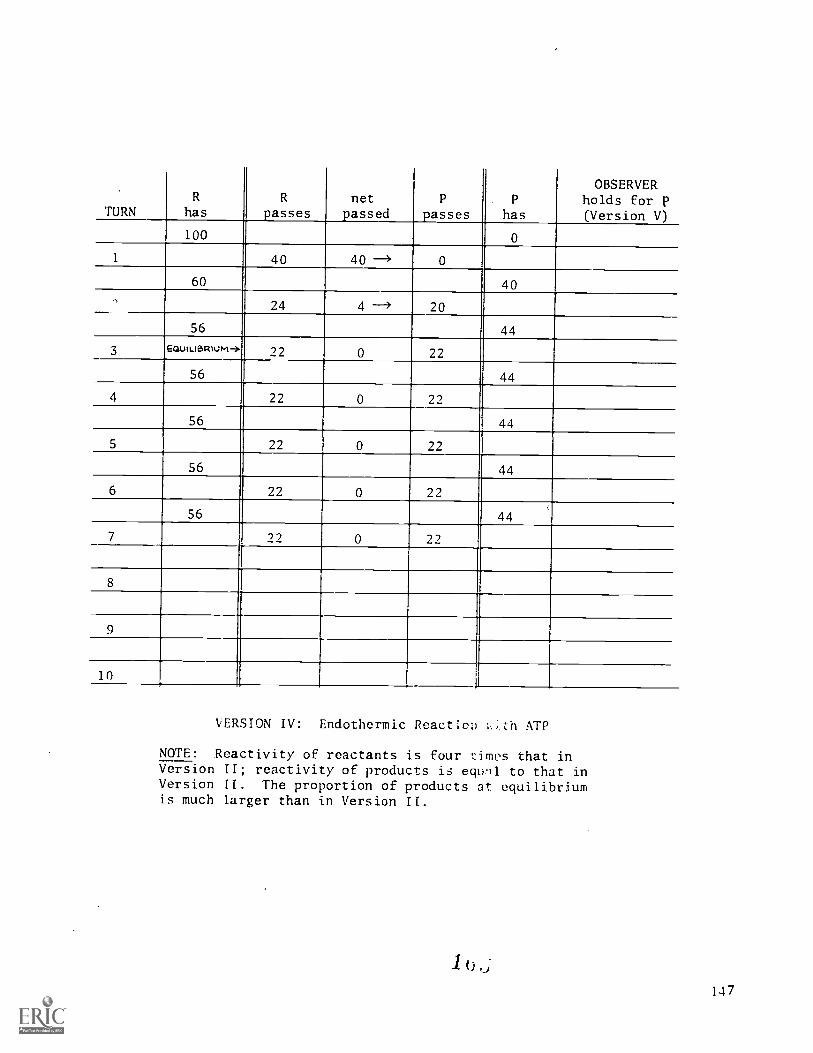
TURNR
hasR
'assesnetsassed
P
sassesP
has
OBSERVERholds for p(Version V)
100 0
1 40 40 --> 0
60 40,
24 4--) 20
56 44
3 EautuaRtum-> 72 0 22
56 44
4 22 0 22
56 44
5 22 0 22
56 44
6 22 0 22
56 44
7 22 0 22
9
10 -_IVERSION IV: Endothermic ReactieD ;:.th ATP
NOTE: Reactivity of reactants is four 1:imts that inVersion II; reactivity of products is equal to that inVersion II. The proportion of products at equilibriumis much larger than in Version II.
1 cj
147

TURNR
hasR
passesnet
__passedP
__passesP
has
0
OBSERVERholds for P(Version V)
0100
1 10 10 --) 0
90 2 8
2 9 8 1
82 2 16
3 8 7 --> 1
7S 2 23
4 7 6 4 1
69 2 29
S 6 5 -4 1
64 2 34
6 6 S --> 1
S9 2 39
7 S 4 ---> 1
SS 2 43
8 S 4 --> 1
S1 2 47
9 S 4 4. 1 c.,.-f
47 2 S1
10 4 3 3' 1
44 1 SS
VERSION V: Endothermic Reaction with Removal of Product
NOTE: Reactivities are the same as in Version II, but some product is removedafter each turn. After turn 10, P holds only one token so the version stops.But there are a total of S6 P tokens, SS of them having been removed fromthe reaction.
148
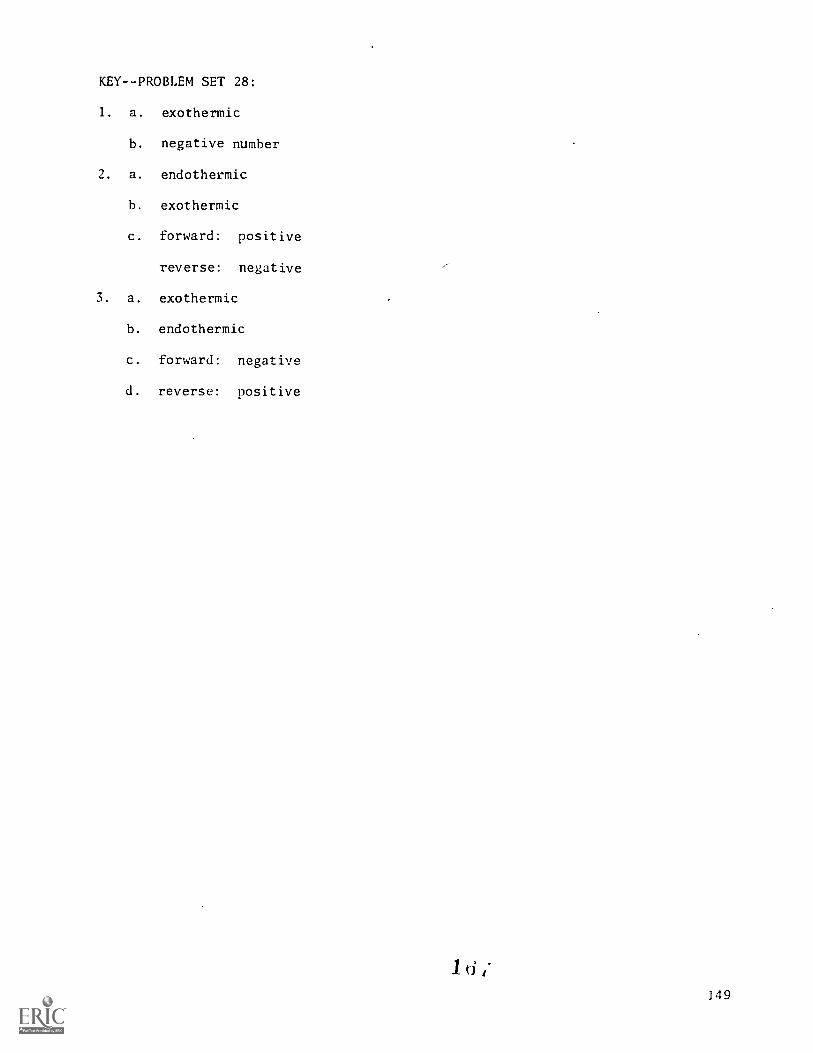
KEYPROBLEM SET 28:
1. a. exothermic
b. negative number
2. a. endothermic
b. exothermic
c. forward: positive
reverse: negative
3. a. exothermic
b. endothermic
c. forward: negative
d. reverse: positive
149

LESSON 29: DAILY FOOD INTAKE
RATIONALE:
This lesson, and the two that follow, serve to review and to complete the
study of the essential features of a diet that is beneficial to health. The
activity provides an opportunity for the students to learn about the nutrient
content of the foods that they normally eat, and allows them to begin thinking
about how they can improve their diets.
OBJECTIVE:
The student will determine the energy provided by and the quantities of
specific nutrients contained in his daily diet.
SUGGESTIONS:
1. Students who complete the worksheet may wish to read Section 30 of the
Student Text in preparation for Laboratory Activity 30.
2. The student should be advised to wear clothing appropriate for the mea-
surements of skinfold thickness to be made in Laboratory Activity 30 (see page 102
of the Laboratory Manual). Clothing such as dresses or coveralls may present
problems.
INFORMATION ON ACTIVITY 29:
TEACHING NOTES:
1. In this activity the students determine the total amounts of various
essential nutrients in their daily diets. These data will be compared to recom-
mended daily allowances in Activity 31, where the students use the results of
Activities 24, 29 and 30 in designing their optimal diets.
Anticipated time: one to two periods.
3. The students should make a list before they come to class of all the
foods that they eat during a particular clay. It is suggested that the students
carry an index card that can be filled out as day progresses.
4. The activity may be augmented by recording food intake over longer per-
iods of time (up to three days). Using this approach, it is generally easier to
detect diets that are deficient in an essential nutrient. As discussed in Sec-
tion 30-1, nutrient deficiencies on a particular day are not important if suffi-
cient amounts of each nutrient are supplied over longer periods of time. The
students mad. also be interested in evaluating the diets of friends, family mem-
bers or members of athletic teams.
150

:-:.. A copy of Worksheet 2D is included here for possible reproduction.
MATERIALS:
Bowes, Anne deP. and Charles F. Church. Food Values of Portions Commonly
Used. J. B. Lippincott, Philadelphia, latest edition (several copies).
Nutritive Value of Foods. Home and Garden Bulletin No. 72. U.S. Dept. of
Agriculture (one per student).
BACKGROUND INFORMATION ON WORKSHEET 29:
A complete determination of nutrient totals in the diet can be an imposing
task. The following is provided so that you can-anticipate-and-avoid-certain
problem areas.
The students should use Nutritive Value of 7oods to obtain information on
all the nutrients except the amino acids. Let us suppose that a student wishes
to find data on the egg he had for breakfast. He would first consult the CONTENTS,
appearing at the front of the book. He would then turn to page 9 and find the
Following table.
/i
Fatty acids j1
Food pro-Food, app. I Carbo- Cal- Vita- Thia- Rib o- Ascor-Water enertz.. tern Fat ' Saw- Unsaturated hy- . cium Iron mvainiu . min tlaYin Niac:r. bc:Icci.
I rated( ;:total:tirttte
2Lin-
Oleic ()fete
EGGS
Ecc,:, lart:e. ._
«'h ,i. 4. 71 .1) ti t; .,.1 Tra,, Trace 27 1.1 :on) .071 . I T Tract' 0
RANC,rt.00
Wh!:0 of \1.S:1 S... 1 T.-ae . Tract.' 3 Trayt, 0 Tr::.. .0!* T%v 0Y-A-: .f ....:: /, ...I
6.1 .: . ., 2; .9 -,0 .111 .t) Trace oSr rartibIed /61 7 l l'r : 3 3 Tra..... :',1 I .1 ';:'0 .0., .1". r.Lue 0
an,1 f.kt. i/
The next step is to transfer the nutrient values given for one whole egg
to the apprOpriate columns of Worksheet 21. At this point students should be
cautioned to pay close attention to the amounts of food (approx. portion) given
in the table. Frequently the amount given differs from the amount eaten and ap-
propriate adjustments must be made in the nutrient values. A visual display of1 1
Tmeasuring cups (i.e., 1 cup, 2 cup and cup) may be of some use in estimating
quantities of food.
151

NAME: WORKSHEET 29
Food, approx. portion
Food
energy
(Cal)
Pro-
tein
(g)
Amino Acids Total
Fat
(g)
Fatty Acids Carbohy-
drate
(g)
Cal-
cium
(mg)
Iron
(mg)
Vita-
in A
(IU)
Thia-
min
(mg)
Ribo-
flavin
(mg)
Nia-
cin
(mg)
Ascorbic
Acid
(mg)
TRP
(mg)
LYS
(mg)
MET
(mg)
Satu-
rated
(g)
Lino-
leic
(g)
/l)
TOTAL
if.
,-1

Note that the students have been asked to record only the values for "satur-
ated" and "linoleic" under the heading "fatty acids"; oleic has been excluded.
The reason for this is that when the students are creating their optimal diets,
an important consideration is the ratio of polyunsaturated fatty acids (repre-
sented by linoleic) to saturated fatty acids. Since oleic acid is a monounsatur-
ated fatty acid it is not necessary for this comparison.
In order to complete the listing for amino acids on the worksheet, the stu-
dent must refer to the second publication, Food Values of Portions Commonly Used.
There is a detailed index in the back of the book. Upon looking up "egg" and
turning to page 30 the student will encounter the following table.
A A T 1 Pi. Lt. IlPO i "tit Far IAA 1SL
,"` 1°' 9."S. I EGGS, Sf1ELL
EGG. CHICKEN - WHOLE, LARGE 54i
...I I1li I1 11 ,1./YOLK CNLY, MEDIUM
1 y,14
i; r,1'41 V. PAI (!'UMwikrtin
'WHOLE, SMALLsmIll 118 o,'do,)
I (Y:. cHir.vr1 soft 01 6m4
I 1 tap rnntlorsnotC/M1 F 11 Alt/
tom
: !brp ,111(0
SCRAMBLED
11Y11 1 0
1 mod, mill. 8 (1, rit.141Ho( r r rl r)i.'1113. Yr''r.
1 fib 1. sp6-,,
88 .5 6.2 1 112 6167.0-0- 5 0 462t r, r, i'l 5 t'
2 0rt. .r, -...,,,1 .!
7 59. .1 5.2 I 39 2352.8 0 .3 1 123 171
It 16 .3 If ',I 2+63.1 - 214 218
40 L 65 --.4 4.6 83 4585.2 - .4 302 343
10, 78 5.5 C) 5.166.2 0 .5 160 .107
108--.4 8.6 I 99 5461-6.2 ----0. -.5- ji:d 4o9"
61 In,' 1.5 it .0 t 15
7.2 0 .11.1
152 !. 329 7.6 229 125714.6 .5 261'..sc il A29 941
1P ?P. r7 ° Wi .... ! '
6.1 0 15.1 10i
65 1. 112_11.6_8.4 114 6511 7.1 0 e, 113 79
H 1 2 9
3 3 0 1 1111 211
....I ,;?
.1413 217 66 29 110 I 60 .1 640518 -1.,13 I 20 6 1.2 160 0 27
t',2 '11, i 110 1,7 5 1.1 110 0
_ 185 70 12 24 971
30 tr 5801)0 LW 19 3 70 (1 27.-2,; : I; 1 ,, ,, 0
252 1513 3 1') 0 0
333 161 i 49' 22 82 I 40 tr 470395 260 52 4 .9 1 120 if-o
09 59 2'.. 98 in ,, 570451 310 62 5 1.1 131 0 21
397'459.-
192 169 30.. __. 111 I. 50. i .1 710116 70 5 1.2 150 0 27
1
171 , I'') '77 1 i,",0 .1 I, '')'31 "50 '01 1 1.0 170 0 1i921 .'..18 H330) 103 -- 280 I 110 1 0 2000
1051 770 .1178) 17 2.7 1 260 13 31
I..) I ''-1 ., ;:., .111`, i ,Ob t.2 5 1.1 120 r . 7413 218 I. 157 52 123.1 50 .1 70'.535 361 . 95 7 1.1 I 180 0 31
In; ,) 1, ,,, ,,r,
, ri V.2 1 Au 1
He should select the appropriate entry, i.e., the particular type of egg,
and transfer the necessary information for amino acids to his worksheet. For
example, for a boiled egg the values the student is concerned with are those
circled above. Again, the students should he cautioned to compare the portions
used in the book to those which they actually have eaten. Call attention to the
fact that each food is a two-line entry, and that TRP, LYS and MET are on the
First line.
Because there are only a small number of copies of the publication Food Values
of Portions Commonly Used, students will have to take turns using it. This should
153
not prove too large a problem since students not using this publication can be
looking up the other necessary values in Nutritive Values of Foods.
The students can be expected to have two kinds of difficulty. One involves
deciding which of several entries to use. For example, did a slice of white bread
(soft-crumb type) come from a loaf with 18, 22, 24 or 28 slices? The best that
can be done in such cases is to select some intermediate value, rather than one
of the extremes.
Another problem is remembering include all the foods eaten. For example,
a hamburger "with everything" is more than meat and a bun. It includes lettuce,
onions, relish (found in the miscellaneous section under "pickles"), catsup (found
under "tomato") and mayonnaise (found in the fats and oils section under "salad
dressings"). Even finding the hamburger bun may be a problem. It is listed in
the grain section under "rolls, frankfurter or hamburger."
The preceding example was selected because of its difficulty. Most foods
present fewer problems.
LESSON 30: (A) RECOMMENDED DAILY ALLOWANCES
(B) OVERWEIGHT AND OBESE
(C) IDEAL WEIGHT
RATIONALE:
In order to understand the essential aspects of an optimal diet, the stu-
dents must become acquainted with Recommended Daily Allowances and the distinction
between the terms "overweight" and "obese." In addition, a determination of ideal
weight is necessary so that the students can correctly design their own optimal
diets in Activity 31.
OBJECTIVES:
The student will:
-explain the importance of Recommended Daily Allowances in the evalua-
tion of a diet.
-distinguish between the terms overweight and obese.
-determine his ideal body weight from measurements of skinfold thickness.
154

SEQUENCE: ST-30, LA-30
SUGGESTIONS:
1. Diet foods could be brought to class for a discussion of the nutrient
values of the ingredients. Comparisons may be made to regular foods.
2. The pros and cons of different methods of losing and gaining weight
could be discussed. Such methods include special liquid foods for gaining or
losing weight, increasing or decreasing caloric intake, and exercising.
3. It should be emphasized that the recommendations for ideal weight (12
to 16% fat for males, and 18 to 24% fat for females) may not reflect the aesthetic
ideals of some cultures. For example, some Polynesian populations (Hawaiian,
Tongan, Samoan) consider higher fat percentages to be more aesthetically appealing.
INFORMATION ON LABORATORY ACTIVITY 30:
TEACHING NOTES:
1. The purpose of this activity is for the students to obtain measurements
which can be used to determine their percentage body fat. This percentage is
then used to determine the ideal body weight. In Worksheet 31, ideal body weight
is used in establishing the student's optimal diet.
2. Anticipated time: one period.
3. The students may wish to augment the activity by using the calipers to
determine the ideal weights of members of their families, members of school ath-
letic teams, etc.
4. Two types of calipers may be necessary. One is designed for people of
average weight, while the other is for obese individuals. Special instructions
are provided in Procedure Steps 4 and 5 and in the Preparation of Materials section.
S. You may wish to have the students assemble their own calipers.
6. The formulas used in Step 13 may be derived from the following general
expression.
Ideal body weight = Lean body weight + Ideal amount of fat
Assuming that the ideal amount of fat for women and men is, respectively, 21% and
140 of ideal body weight (the midpoints of the ranges given in Section 30-2), our
initial expression may be restated algebraically as follows, where X = ideal body
weight and L = lean body weight.
155

Females: X = L + .21X
Solving for X in each case:
X - .21X = L
.79X = L
Females: X = 1.27L
Males: X = L + .14X
X .14X = L
.86X = L
Males: X = 1.16L
7. For a quick check of student calculations, the following general formu-
las may be used.
Females: X = 1.27(present weight in kg)(1P
100%)
Males: PX = 1.16(present weight in kg)(1100%)
8. It should be emphasized that ideal weight cannot be completely objecti-
fied or defined in absolute terms.
9. Females normally have a thicker subcutaneous fat layer than males. Thus
healthy females generally have significantly higher percentages of fat than healthy
males.
MATERIALS: (for 10 set-ups)
10 millimeter rulers
10 skinfold calipers
scale for measuring body weight
PREPARATION OF SKINFOLD CALIPERS:
Materials needed for each "fat grabber":
4 tongue blades (from pharmacy) rubber bands
2 rubber stoppers, #000 white glue
1 hinge, 3/4", with. 4 screws tape
Instructions for assembly (refer to sketch):
1. Make four tongue blades into two double-thickness blades by cement-
ing them together with white glue.
2. After allowing the glue to dry (an hour should be sufficient), trim
the hinge ends of the blade: so that they are flat.
3. Attach the hinge as shown in the sketch. The screws should be
placed approximately 3/8" from the ends of the blades. (If they are too close
1156

POSITION MEASURING imARKS oF THEWAY ALONG THE SIDEOF THE CALIPER
TWO TONGUE BLADESGLUED TOGETHER
POSITION SCREWS APPROXIMATELY 3/4"FROM ENDS OF BLADES To PREVENT SPLITTING
OF THE WOOD
POSITION RUBBER BANDS -----"50 THAT A 3009 WEIGHTJUST OPENS THE JAWS
-F-10mm BLOCK PLACED BETWEEN.1. STOPPERS
157

to the edge, the wood may split.) Pilot holes should prevent the wood from
splitting.
4. A*tach the stoppers as shown with white glue. Be sure that the
stopper ends meet evenly when the blades are closed.
5. Place measuring marks on the ')lades as shown, five-sixths of the
way along the sides of the caliper. It is 'seful to place the marks on both
sides of each blade (four marks altogether .
6. To adjust the closing tension, insert a 10-mm block between the
stopper ends (see sketch).
7. Place rubber bands about one-half to three-fourths of the way up
in such a position and number that a 300-g weight hung from the end just opens
the jaws. Tape the bands in position to prevent slippage.
8. One or two "low-tension" calipers should be made for obese indi-
viduals. This is done by adjusting the tension using a 14-mm block in place of
the 10-mm block.
LESSON 31: THE OPTIMAL DIET
RATIONALE:
A primary objective of he Nutriion Unit is to provide information concern-
ing he essential features or a diet that is beneficial to health. ST-31 and
Activity 31 summarize the informati,,n on nutrient requirements discussed in pre-
vious sections. The students use this information and the data from Activities
24, 29 and 30 in designing diet for themylvcs that provide the optimal intake
of nutrients and calories.
OBJECTIVES:
The student will
list the nutrients required in an optimal diet, and explain why at
least six of these are necess for the maintenance of health.
-define roughage and explain it is a desirable component of the diet.
-list two sources of roughage.
-explain why it is important to consider the amounts of salt, sugar
and saturated fatty acids when designing an optimal diet.
4
I
158

study the nutrient content of a meal and suggest changes that will
bring it closer to the optimum.
design an optimal diet.
SEQUENCE: ST-31; Activity 31
SUGGESTIONS:
1. Many factors may affect what constitutes an optimal diet, such as per-
sonal preferences, food sources available, etc. In Biomedical Social Science
Unit II, the students study the diets and health of various cultures. (For
further information, see Social Science Student Text, Unit II, Part One, pp. 144-45.)
Some of their findings might be discussed in relation to the requirements for op-
timal diets that are set Forth in the Sr.ionce Student Text. For example, were
there cultures in which the nutrient intake of the people deviated greatly from
the requirements for optimal diet discussed in this unit? If so, were dietary
deficiency diseases also seen frequently in these cultures? If not, what are pos-
sible explanations?
2. A possible supplement to this series of lessons would be a research pro
ject on diseases and special diets. Students could be asked to do library re-
search on the cause, nature and treatment of a disease of their choice, with
speciFic reference to dietary therapy and preventive maintenance. The students
may have close relatives or friends on special diets, and may be curious about
the purposes rF the diets.
Among the diseases or conditions that might be researched are diabetes,
hypertension, heart disease, atherosclerosis, obesity, phenylketonuria, cystic
fibrosis, hepatitis, chronic renal failure and lactose intolerance. Students
could he asked to report on their findings curing Lesson 33, since there is no
scheduled laboratory activity for that lesson.
3. LA-34 calls for agar for a microbiology investiu,ation. You may wish to
prepare the agar in advance.
INFORMATION ON ACTIVITY 31:
TT:ACHING NOTES:
1. In this activity the students use results from Activities 24, 29 and 30
in designing their optimal diets. A diet may be considered optimal if it meets
the following criteria.
159

a. The diet should have the recommended amounts of each essential
nutrient and, coincidentally. the pr:' r number of calories.
b. The diet sho the proper balance of nutrients (for example,
three to four times as muc, aydrate as fat).
c. The foods selected should be enjoyable to eat.
Anticipated time: one to two periods.
The activity may be augmented by having the students design three-day
diets. This approach makes it somewhat easier to acquire the proper amounts of
each nutrient. In addition, a three-day diet permits a greater variety of foods,
as well as more experience in selecting nutritious foods.
4. The recommended dietary allowances provided in Part I are average values
for persons 15 to 18 years of age. The values given for males and females differ
in part because the average male in this age group is heavier than the average
female.
S. Students could be asked to "price" their real and optimal diets, and to
compare the two on an economic basis. A similar approach is used in Activity 39.
6. You may wish to supply the students with additional blank copies of
Worksheet 29.
MATERIALS:
Same as For Activity 29.
LESSON 32: (A) DIABETES MELLITUS
(B) (;LUCOSF TOD:RAN:I TEST
RATIONALE:
In Activity 31 the students designed optimal diets for themselves. It was
pointed out that an optimal diet depends upon an individual and his physiology.
There are many diseases which alter human physiology and necessitate a modified
diet. Diabetes mellitus is an example and is considered in ST-32. As of 1974,
diabetes and its complications were the third most common cause of death in this
country. In LA-32, the students perform one of the clinical tests for blood
glucose used to detect diabetes.
160
OBJECTIVES:
The students will:
-define diabetes mellitus.
- explain the physiological reasons for two of the symptoms of diabetes
mellitus (i.e., sugar in the urine and a high blood glucose level).
- list_ at least two serious complications of diabetes mellitus
- list two clinical tests that are employed in the diagnosis of diabetes
mellitus.
-define "fasting plood-zlucose level" and explain its relationship to
the diagnosis of diabetes mellitus.
- list two methods employed in the treatment of diabetes.
- list two ways in which the diet prescribed for a diabetic differs from
the "optimal diet" for a normal individual.
- describe the system of "food exchange groups" used to help c11;.elbetics
control their diets.
-explain how to perform a glucose test on simulated serum samples and
use the results to determine whether a patient is diabetic.
SEQUENCE: ST-32; LA-32
SUGGESTIONS:
1. It has been hypothesized that there is an association between an increase
in the consumption of sugar in the United States and the incidence .if diabetes.
One or more students may wish to do some librtry research on this topic and make
a report to the class.
2. If any of the students have had a glucose-tolerance test performed, they
might share their recollections of the experience with the class.
INFORMATION: ON LABORATORY ACTIVITY 32:
TEACHING NOTES:
1. The purpose of this activity is to provide the students with the oppor-
tunity to perform a clinical glucose-tolerance test.
2. A:iticinated time: one period.
3. This activity may he extended by having the students make up their own
180 161
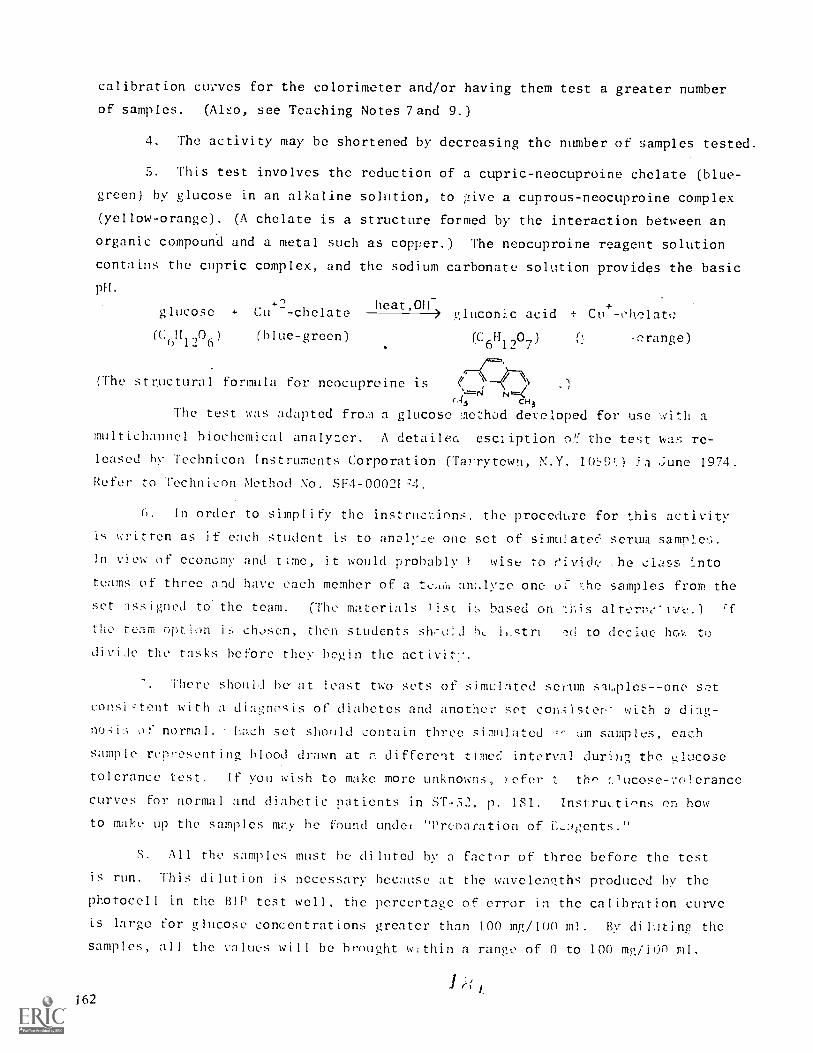
calibration curves for the colorimeter and/or having them test a greater number
of samples. (Also, see Teaching Notes land 9.)
4. The activity may be shortened by decreasing the number of samples tested.
5. This test involves the reduction of a cupric-neocuproine chelate (blue-
green) by glucose in an alkaline solution, to give a cuprous-neocuproine complex
(yellow-orange). (A chelate is a structure formed by the interaction between an
organic compound and a metal such as copper.) The neocuproine reagent solution
contains the cupric complex, and the sodium carbonate solution provides the basic
p11.
glucose + Cu --chelate
(C6H12
0 ) (blue-green)
heat,011)uluconic acid
(C6H1207.)
+
-erange)
(The structural formula for neocuproine is e , ,
C:-43 c143
The test was adapted from a glucose :flethod developed for use with a
multichannel biochemical analyzer. A detailec escliption or the test was re-
leased by Technicon Instruments Corporation (Tairytewn, N.Y. 10:9) Ja .rune 1974.
Refer to Technicon Method No. 5E4-00021:4.
6. In order to simplify the instructions, the procedure for this activity
is written as if each student is to analyLe one set of simu)ateC serum sample:i.
In view of economy and time, it would probably i wise to he class Into
teams of three and have each member of a te., an..lyze one of the samples from the
set assigned to the team. (The materials list i, based on .:his 'f
the team option is chosen, then students shra:3 be ii.stri Nd to declu ho:. to
divide the tasks before they begin the activity.
. There should be at least two sets of simulated se,um samples- -one set
consistent with a diagnosis of diabetes and anothe set colsistep- with a diag-
nosis of normal. F.ach set should contain three simulated rm samples, each
sample representing hlood drawn at different times. interval dun ;i the L;lucose
tolerance test. If you wish to make more unknowns, for the' f.'ucose-vo!crance
curves for normal and diabetic patients in ST-S2, p. 1S1. Instrut,tirms en how
to make up the samples riy he found undo "Prcnaration of il_Jgents."
S. All the samples must he diluted by a factor of three before the test
is run. This dilution is necessary because at the wavelengths produced by the
photocell in the BIP test well, the percentage of error in the calibration curve
is large for glucose concentrations greater than 100 mg/100 ml. Ry diluting the
samples, all the values will be brought within a range of 0 to 100 mg/i00 ml.
162
9. It is common procedure for apatient's urine to be tested qualitative:
for glucose before deciding .:tether or not to perform a glucose-tolerance test.
(However, a glucose-tolerary,! test is zuformed without a previous qualitative
test, for example, in testing for glucose -!t hypoglycemic patients.) If the
results of this preliminary test show a ;1:.,;h concentration of sugar, the glucose-
tolerance test is then done. It would be possible to add an extra "part" to this
activity by including this preliminary test for glucose. You would need one simu-
lated urine sample for each set of simulated serum samples. The results of such
a test could be used to corroborate the diagnoses based on the glucose-tolerance
tests. If you elect to incorporate the urine test into the activity, refer to
instructions on how to maNe up the urine samples under "Preparation of Reagents."
"Clinistix"strips (used for testing glucose) are available from Ames Company, Divi-
sion of Miles Laboratories, Inc., Elkhart, Indiana 16514. (They are also distribu-T.:.,
ted through companies such as Scientific Products.) The strips are designated
"Clinistix, Reagent Strips, 10-second Test for Urine Sugar." An alternative to
"Clinistrix" strips is "Testape," marketed by Eli Lilly and Co., 277 Park Ave.,
N.Y. 10017. You might also check in the telephone directory to sec whether the
company hat 1 regional office in your area.
10. If you make up the serum s 1os, reocuproine or simulated urine solu-
tions in advance of the activity, st.ce them in the refrieratr and allow time
for them to warm up to room temperature before use.
11. As in LA-27, the calibration line is curved rather ...111n straight. In
fact, all calibration curves are linear only over a certain concentration range,
and the calibration lines we have used thus far have shown only the linear por-
tion of the range.
MATERIALS: (per 10 set-ups)
0.32 g neocuproine(2,9-di,uethy1-1,10-phenanthroline)
15.5 g sodium carbonate (Na,C()_H,0)
2.0 g glucose (or dextrose)
1.0 g sodium benzoate
15.0 ml ethyl alcohol, denatured
70 cuvets, 16 x 125 mm, Pyrex
40 pipets, 1-ml
50 pipets, 10-m1
20 beakers, 50-m1
10 beakers, 250-ml
10 test tube racks
10 thermometers
10 ring stands with ring
10 wire gauze
10 graduated cylinders,
10 as burners
In RIP colorimeters
matches
10 glass-marking pencils
pape tissues
Ls_
10-mi
163

Simulated Scrum Sample(m glucoso/100 ml)
100
150
100
150
300
200
PREPARATION OF REAGENTS:
Neocuproine reagent, 200 ml: Dissolve 0.32 ± .01 g neocuproine in 15 ± 1
ml of denatured ethyl alcohol. Add enough water to make 200 ml. Dissolve 0.16
± .01 g copper (II) sulfate (CuSO4 51-120) in the solution. Store in a stoppercO,
flask in the refrirator. Should keep for about one week. If any color change
is noted during storage time, a new batch of reagent should be made up.
0.25 M sodium carbonate solution, 500 ml: 35.8 t .1 g sodium carbonate
(Na7CO 3 -10H 0) + sufficient water to make 500 mi.
Simulated scrum samples, 200 ml: You will need to make up six separate
simulated samples, three for the "normal" set and three for the "diabetic" set.
To do this, dissolve 2 t .01 g glucose and 4 t .1 g of sodium benzoate
(NaCr7H50 in sufficient water to make 200 ± 5 ml. Make up the samples using
this glucose solution and water in the amounts given in the following table.
All sample solutions should be placed in coded flasks and stored in the refriger-
ator. They will keep for about one week.
'1")
L L
CodeGlucose Solution
(ml)
F1
1
Water(ml)
90 ±
&:5
85
70+ 1
;:imples coded F1 and F, correspond to fa-, ing level.; of glucose. 11 and
correspond to glucose levels one hour after ingesting -5 g of glucose and III1
and III, correspond to glucose levels three hours after ingesting 75 g oi glucose.
NOTF. No attempt has been made to simulate yellowish color of scrum.
This because when the reagent solution is heated, some ;c1low color is produced.
If additional yellow is .:tided to the serum samples, the samples will be too "dark"
to road with the RIP colorimeter.
Simulated urine samples (optional): Distilled water may be used for the
simulated urine sample to match the "normal" sot of serum sah.plos. For the
164

ANTICIPATED RESUITS:
A copy of the calibration curve we obtained appears below.
5
.4
w .3
C.)
z
0.20
<
.10
-; - rt '?'
1- ----1.:!,
--.-;
-..--,
-'f ! '
.
7,:
.
i
.
9.
1. r
1
.;; --;[
:. ... 4
; f.
:
;"1
.4 " . . .
. '. *
1-- ;. .
,;...- ; l
. t L t
; ; ;
; - ;- t- f t. r
; I ;r
.;
' 1
; -1
4 ;
- i-.-.- i :
ri ' r 1
1-il. t ,7 "
1 t.. ,
1- 1"
...-.. .
' '
..
:,,1.1
.. .
1,...
r ;4. t i- r !- ,.. ..... . . .
- r 1 :-
.
1--r -
.
.!t: r r
.. .-7-T
'-r--t-
-...
.....r !
-,r- f r
;.;
+ r
t
.
I fy:.7 I 7
..1
-. : 1
r '`..'.
I'. 1
! r 7
Ili:I '
;
:7
I'..1:
" 'i: 1
,
t --"-i" t-7.
- 7
- 1
'
..... y 1
i -I- tii..' . : :
' ' '
::... 1' T. '....... :
'
.
. : y:: 1 : : . ; 1.
. 4 : :
; ;' -7 ''; r i
tr 1 ;
; ; .
;; .1.-- 0.
. t ; l
. . ;
; , ;; ; -
i 'I ' 9
t
: ! 1 ;
;
'f
; ; . .
; 1 ; 4.
.1 ; ;
.
. -; ;i
'
! ; L ;
- ;i ; ;
; ; ; ;9
4 -
O 10 20 30 4-0 50 60 70 80mg glucose / 100 nil
90 100
Three unknowns were analyzed to check the accuracy of the curve. The re-
sults obtained and the actual glnco concentrations of the unknowns appear below.
Unknown
;i2
Lab ResultIv, 100 ml
Actual Glucose Cone.mv1100 ml
26
105
158
100
150
165

ANSWERS TO DISCUSSION QUESTIONS:
1. Comparison of results with the glucose-tolerance curves for a normal
person and a diabetic (ST-32, p. 181) is the best way to make this decision. All
three glucose values are significantly higher in the diabetic than the normal
samples.
2. It was necessary to dilute the samples threefold to bring the glucose
concentrations of all samples within the range of the calibration curve provided,
i.e., 0 to 100 mg gluco,e/100 ml.
3. Other sources of helpful information might he family history, urine
test for glucose, information on frequency and volume of urine output, history
of frequent thirst, etc.
4. Sources of err..r in this activity include measurement error such as in
pipetting, inaccurate colorimetric readirw, error in making up the s..mulated
samplf:,, error in reading the calibration curve, error in the calibration curve
itself, error due to using a calibration curve constructed with a different color-
imeter, calculation error, etc.
166

LESSON 33: (A) OBESITY
(B) REVIEW
RATIONALE:
In ST-32, we considered the manner in which a disease (diabetes mellit,)
may alter the optimal diet of an individual, and conversely how the individual's
diet may he altered in treatment of the disease. ST-33 discusses the causes
and dietary treatment of obesity. Obesity is of special medical concern and
was chosen for several reasons: (1) it is a common condition, (2) it is asso-
ciated with a number of other diseases such as atherosclerosis, diabetes, hyper-
tension and arthritis, (3) there are many misconceptions about the best way
to lose weight.
OBJECIIVLS:
The student will:
- state the orimary cause of obesity
fist At least !=hree medical complications of obesity
. 1ist two ways in which obesity is treated
list two reasons why it i, not desirable to lose more than 2 to 3
pounds a week
cak.11atu the number , calories that should he included in the diet
of %Ir. X, it he is to lose 2 lbsiweek when given (1) his daily energy
expenditure in calories, (2) his Oail calorie intake (S) his present
weiht and 141 his ideal weight.
explain why A diet that contains too little carbohydrate is undesirable
define hypothyroidism
SEqUENCN: ST-33
SMGESUONS:
I. The primary reason for weight gain is that calorie intake exceeds
calorie expenditure. However, there are many reasons why this may happen,
some of them psychological. You may want to lead an open discussion on the
question of why some people "eat too much and exercise too little."
2. There are a great many diets on the market, each recommending a surefire
way in which to lose weight. It might he interesting to consider ho well
these diets measure up to the requirements given for an optimal diet. Also,
10t)
167

the students can evaluate diets based on the recommendations presented in this
lesson for treatment of obesity.
INFORMATION ON OBESITY:
While definitions of obesity are somewhat arbitrary and artificial, the
table below shows commonly accepted criteria.
BODY FAT CONDITION
12-16% male
18-24% femaleideLl body weight
-36% male
-44% female
37% and over male
45% and over female
slight to moderate obesity
moderate to marked obesity
Using the criteria shown in the table, approximately one-fourth of the U.S.
population can he considered obese. Obesity causes two types of medical prob-
lems (1) increases the risk of other medical conditions and (2) causes symptoms
directly due to excess weight. The following conditions are more common in
the obese.
1. diabetes
glIbladder iisease
3. premature atherosclerosis
4. hypertension
These symptoms are frequent in obese people.
1. shortness of breath up on exertion
general body aching
S. tiredness
1. painful joints, especially the knees and ankles.
Shortness of breath results because the weight of fat on the chest wall reduces
the vital capacity; in addition, more work is performed in climbing stairs, etc.
Ay aching and t'-',dness are related in some way to the mechanical
.:es caused by excess fat. Painful joints in the lower extremities
are the result of joint:. supporting too much weight.
168

Obesity may be caused by various medical disorders, but in at least 95
out of 100 cases the cause is an intak.a of more calories than are expended.
An obese person may maintain a steady weight on fewer calories than are needed
for an ideal body weight. This is largely because obese people tend to be
very inactive physically.
Why do people become obese? This answer is very crnplex. A number of
factors will be discussed briefly.
1. "It runs in my family." There are genetic factors in some cases, but
these are not well understood. Eating patterns are conditioned in early child-
hood. En many cases, parents believe a plump baby is a healthy baby au'
feed their infants too much food.
2. "Its due to low thyroid." This is an extremely common fallacy and
probably grew out of the observation that obese people have lower BMR's than
people with ideal body weights. However, BMR calculations are based on body
surface area (which is increased in obesity) while metabolic activity is largely
duo to muscle mass. The calculated BMR therefore gives a false index.
3. "Even if I stick to a diet I gain weight." This is the standard
cop-out The usual reducing diet is not easily followed, rnain, because low-
calorie foods are expensive or not very palatable.
4. "Fat people are happier." Maybe so, but they are not healthier.
We are constantly bombarded by pressures to eat, both social and from
advertising. The following summary should help most people attain an ideal
body weight without "dieting."
and refined carbohydrates.
2. Avoid desserts such as cake, pie and ice cr:mm.
3. Avoid snack foods.
4. Limit Fatty foods such as cheese, fatty meats, rich gravies, etc.
S. Exercise regularly and avoid elevators and automobiles as much as
possibly
Kl7.1 -.1,VI-EW SET 33:
a. Energy may neither he created nor destroyed. b. yes
b, c, d, f
3. a. endoL.Iermic; b. yes: c. absorbed; d. the sun r ,:oIar energy;
169

4. a. 37.5 kcal; b. 3.75 kcal/g; 3.75 Cal/g; c. 3.75 Cal /g
5. a. -P.03 kcal/mole; b. exothermic; c. 114 amu; d. .11.4 Cal/g
6. See Section 26-1.
a. Glycolysis--glucose is converted to pyruvic acid; 2 ATP's are
gained. In the rest of cell respiration, considerably more energy is obtained
in the form of ATP; CO..) is released, oxygen is consumed.
b. Cell respiration releases the energy from nutrients.
S. a. catalysis--speed up reactions.
h. assist enzymes in catalysis
c. Breakdown to glycerol and fatty acids. Both feed into the
metabolic pathway of cell respiration.
d. House the enzymes of cell respiration and serve to organize the
parts of the process.
9. In endothermic reactions, AHr
is positive, and Keq
tends to be <1.
In exothermic reactions, AHr
is negative, and K tends to beect
10. a. K ' 1; h. :,11 is positive; c. endothermic; d. nothing can beeq
>1.
inferred.
11. a. ATP + + phosphate; b. Provides energy needed for
many endothermic reactions; c. exothermic; d. Keg
is a large number.
12. chemical equilibriadynamic; diffusion--dynamic; motionless object--
stAtie
13. No. There is g t variation in dietary need., among individuals.
Children need less nutrients than adults; people with certain medical problems
may ne, ! increased amounts of specific nutrients, etc.
14. Sodium chloride. It occurs in many foods, particularly packaged
varicries.
13. indigestion, stomach ache, nausea, etc.
16. [t is likely that an excess of saturated fatty acids results in an
increase in cholesterol in our blood. Increased cholesterol level probably
increases our chance of heart disease.
17. Chocolate, coconut, ( v meats, whole-milk products (:.:e cream,
cheese, butter, etc.).
170

18. a. Roughage aids in maintaining the proper water content of thefeces. Such "fiber" possibly prevents certain diseases of the alimentary tract.
b. It is found in fruits, vegetables, and whole-grained breadsand cereals.
19. It is a disease characterized by high blood-sugar level. The bodyis unable to use glucose properly
20. Yes. Obese people may not he able to control their food intake for
psychological, or physiological reasons. In either case, this condition is a
medical problem and can be termed an illness.
21. To expend more energy than we consume. This may be achieved by eating
less "fattening" foods and by exercising more often or more strenuously.
LESSON Ti : (A) INTRODUCTION TO MICROBIOLOGY
(B) FOODBOL'i. DISEASE
RATIONALE:
This is the first lesson in the sequence on food and waterborne disease.
There are two topics of major importance. First, any discussion of food and
nutrition, should include the health problems associated with harmful microbes
and chemicals that may he found in food or water. `second, the alterat, offoods by processing has health implications. Les.-ons 34 through 39 deal withthese problems. ST-31 introduces microbiology and considers the recognition
and nrevcntion of some forms of disease related to the growth of microorganismsin food. LA-S.l introduces microbiological laboratory technique,.
OBJECTIVES:
The student will:
define microbe and name throe major types of microbes.
list at least one useful function of intestinal bacteria and of bac-
teria used in the food industry.
list three ways in which foodborne diseases may sprea(1.
list three symptoms of gastrointestinal disease caused by bacteria.
state how food "poisoning" may be nrevented in the home.
exnlain why asceptic techniques are necessary in a microbiological
laboratory.
1 C) r) 171

SEQUENCE: LA-34; ST-34
SUGGESTIONS:
1. Part I of the activity calls for melting agar in test tubes. Students
should begin this as soon as possible since it takes some time to melt the
agar and the agar must be allowed to cool before being poured.
2. You may wish to conduct a discussion of microbial diseases of the GI
tracr ,xp,,-Ienced by members of the class. Most symptoms are due to irritation
of GI lining. Nausea occurs when the stomach lining is irritated. Cramps
contractions of musclt cells in the GI wall when the lining is irri-
Fever is a generalized response to infection; muscle aches and Litz:i-
n__ .n stu-ach flu are a generalized response to viruses. Vomiting and diarrhea
, rho useful function of quickly eliminating the noxious agent.
3. Students may find a library study of cheese production interesting. A
ilicrobiology text or encyclopedia would he helpful in such a project.
4. This might he a good time to invite a medical technologist or patholo-
gist as a guest speaker.
In 19on infections were the number one cause of death in the U.S.
To(Iay they are still among the ten leading causes but behind cardiovascular
disease, cancer, strokes, :Ind accidents. The decrease in proportions of deaths
from infections has resulted from modern methods of prevention of infectious
diseases. You may wish to conduct a class discussion of the ways in which in-
fectious diseases are prevented todPy: control of food and water purity by
laws, vaccinations, drugs, hygiemi, refrigeration and other preservation
tcchn Hues.
6. In ST-34, protozoa are referred to as single-celled animals. The stu-
dents may wonder what distinguishes plants from animals. You may wish to comment
on the basic rules of c!Jssificatinp at this time.
-7 In all three Biomedical courses, we have stressed the difficulties in
statistical studiesthat trey do not constitute proof of a cause and e:fect
relationship. On the other hand, we would not want students to think that sta-
tisticai studies are not valuable. Section 34-1 described a population study
that led to a very important discovery implicating contaminated water as a cause
of chlolera. Perhaps this would be an opportunity to point out the importance
of statistics in healra. You could also mention the population studies nn
smoking and health problems.
172

INFORMATION ON LABORATORY ACTIVITY 34:
TEACHING NOTES:
1. One purpose of this activity is to allow students to explore the rela-
tion between bacteria and food spoilage. A second is to stress the careful tech-
nique needed in handling bacteria, and to introduce students to the concept of
sterile technique.
2. Anticipated time: two periods on different days plus a short segment
of a third period.
3. To shorten the activity, the preparation of agar plates and the growing
of bacteria on them may be eliminated, or done as a teacher demonstration, or
done by only a few students.
4. Nonfat milk is best for this activity because fat may confuse the in-
terpretation of the results by forming a separate layer on top of the milk. How-
ever, any type of milk will work.
5. Motile bacteria are usually present in food up to three days after in-
cubation is begun. After that, few motile bacteria will be seen. Therefore,
the microscopy (Part II) should be done within three days after incubation is
begun. After three days, there will still be many bacteria, but they will not
be motile.
6. It may be helpful to students if you demonstrate how to pour agar into
a sterile Petri dish. It may also help to demonstrate how to handle the test
tube caps (Part I) and the transfer of food onto the agar plate (Part II) with
a sterile loop.
7. Disposable Petri dishes are already sterile. To eliminate making agar,
pre-poured agar plates may be purchased from local medical or scientific supply
houses, or a hospital lab might give away their outdated ones. These are still
useful for LA-34.
8. IF inoculating loops are unavailable, they can be made from paperclips
or wire. Unbend the paperclip and twist the end into as small a loop as possi-
ble. Make a handle for it by inserting the other end in a cork, or by inserting
it in a thick glass tube and melting the end of the tube in a flame. Sterile
Q-tips can be used instead of loops if one removes them carefully from the package.
They are acceptable even if the package is not labelled "sterile."
9. Part I calls for test tubes of sterile agar. Special plastic or alumi-
num test tube caps are the usual means to keep dust out. If the caps are
173

unavailable, substitute caps are easily made by taking a double thickness of
aluminum foil and shaping it over the mouth. The cap must extend down about
two to three centimeters below the lip, to keep dust out. Be sure the home-
made cap can be removed and replaced easily.
10. For incubators, see Teaching Notes, LA-12, Period I, Teaching Note 7.
11. Agar plates may be stacked on one another in the incubator. Plates
should be inverted to prevent water of condensation from settling on the agar
surface. This would cause colonies to run together. Poured plates should be
kept in the refrigerator until they are used in Part II.
12. There are many optional activities relevant to nutrition and micro-
biology. Here are some possibilities.
a. Transfer some of the bacterial growth from the agar into a drop of
water on a slide, and examine microscopically (Part III).
b. Cabbage broth may be made by boiling chopped cabbage for 10 min-
utes. Since some bacterial spores on the cabbage are not killed by boiling for
a short time, the broth will often teem with bacteria after 24 hours of incuba-
tion. Other foods or vegetables may be tested too.
Less offensive to some in odor than cabbage broth is homemade
sauerkraut. To make sauerkraut, halve and core a cabbage, then shred and put
alternate layers of cabbage and salt into a container. (About 3 per cent of the
total mass should be salt.) Put a plate on the cabbage and weigh the plate down
to squee7e the juice out (a gallon jug of water on the plate is one technique).
The juice will contain many bacteria in a few days.
c. Examine microscopically and/or plate on agar, foods made by bacter-
ial action: buttermilk, yoghurt, sauerkraut or pickle juice, kafir, cottage and
other cheeses. Foods that are dense, such as buttermilk and cheese, should be
suspended in water in order to observe them microscopically.
d. The presence of bacteria on everyday objects may be demonstrated by
wiping these objects with a sterile Q-tip and then wiping the Q-tip on an agar
plate and incubating the plate. You could have students test their hands, faces,
the inside of their mouths, the floor, soil, kitchen utensils, etc.
Agar plates can also he touched or sneezed on, coughed on, etc. Use
caution with anything that grows on a nutrient-agar plate - -it may be pathogenic.
An agar plate may he left uncovered, exposed to the air for an hour or more, then
covered and incubated. One can keep plates exposed for different times to deter-
mine the likelihood of contamination from the air.
1 ('174 L.,

e. Test the effect of germicides on bacterial growth in foods. For
germicides, you may use alcohol, tincture of iodine, and 3% hydrogen peroxide.
f. Prepared slides of bacteria may be of interest to your students
and can be obtained from educational supply houses.
MATERIALS: (for 15 set-ups)
Part I:
15 test tubes, 16 x 125 mm
15 test tube caps, 18 mm (CarolinaBiological Supply Co., #73 -1474)
15 test-tube holders
nutrient agar powder, 4.65 g
autoclave
15 Petri dishes, sterile
Part II:
15 inoculating loops
methylene blue staining solution,20-ml
30 beakers, 50- or 250-ml
15 glass-marking pencils
pH paper, range 1-6 (or 0-11)
60 microscope slides
60 coverslips
Part III:
15 mm rulers
PREPARATION OF REAGENT:
5 to 10 hot water baths
30 beakers, 50- or 150-ml
5 glass-marking pencils
germicide (such as Lysol)
milk (nonfat preferred)
incubator
paper tissues
30 droppers (or 1-ml pipets)
30 toothpicks (or pieces of wire)
15 microscopes
germicide
15 gas burners
incubator
Methylene blue: A large quantity of stock solution was prepared for LA-10,
Unit I. See Teaching Notes for that activity for making a stain from the stock.
PREPARATION OF MATERIALS:
The only item to be prepared is tubes of sterile nutrient agar.
Autoclaving is the most time-consuming aspect of the preparation. Some
schools have electric pressure cookers for autoclaves, which may take as long
as 45 minutes to warm up. It is wise to start the autoclave early, before you
begin preparing the items; this will insure that it is warmed up when you are
ready to put the items into it.
175

The materials necessary for making tubes of sterile nutrient agar for 15
set-ups are:
flask, 500-ml
15 test tubes, 16 x 125 mm
15 test tube caps, 18 mm
nutrient agar powder, 4.65 g
hot water bath (or direct heating set-up)
stirring rod
balance
autoclave
1. Calculate how many ml of agar are needed: 10 ml,per set-up, more for
some of the options discussed in the Teaching Notes.
2. 31 g of powdered nutrient agar make 1,000 ml of agar. Calculate how
many grams of powdered agar :ou need, and weigh out this amount. For 15 set-ups
you would need 150 ml of agar and 4.65 g powder.
3. Measure out a volume of tap water equal to the amount of agar needed,
put it in a 500-ml flask and then add the measured powder to the water.
4. Dissolve the agar with heat. Use a hot water bath or, to heat it
faster, heat the agar directly while stirring. It is important to stir if direct
heat is used, otherwise the agar may burn on the bottom. Don't stop stirring un-
til the agar is dissolved, for it may burn. Agar also has a tendency to foam
over when it boils.
5. When the agar has completely dissolved, dispense about 10 ml of the
agar into each test tube, one test tube per set-up. Suggestion: Note the fluid
level of 10 ml of water before pouring the agar.
6. Cap the test tubes. See Teaching Note 9.
7. Autoclave the capped tubes for 20 minutesat pressures of 15 to 20
lb/sq in. Don't depressurize the autoclave too fast afterwards or the tubes
will boil over.
8. Allow the tubes to cool, and set them aside for the activity.
ANTICIPATED RESULTS:
Part II
1. The following is based upon observations in our lab. Your results may
differ from ours. After 24 hours of incubation, the milk showed the separation
176 1 !.).--j
of a white precipitate on the bottom (a curd). This is protein that has been
coagulated by acids or enzymes produced by bacteria. A fat layer floated on top
of whole milk, and there was none in nonfat milk. 4 transparent cloudy fluid
(whey--pronounced "way") was seen. There were gas bubbles and a strong odor
produced by the bacteria. The milk kept at the cooler temperature showed fewer
changes at first.
2. The pH of the incubated milk may be same or slightly lower than that
of the other milk sample, due to acid produced by bacteria.
3.
flora in
Microscopic appearance--there is great variability in the bacterial
milk. Our results are given below.
The 24-hour incubated milk contained many motile
visible under high power. Non-motile ones were seen too.
rod-shaped bacteria
In addition, epithelial
cells from the lining of the cow's udders were seen. These are large flat poly-
gonal cells. A whole milk sample showed large numbers of spherical fat globules,
low-fat milk showed fewer of them, and nonfat had hardly any.
Milk kept at room temperature contained little or no bacteria after 24
hours. After 4 days, there were many non-motile rods present in both the incu-
bated and room-temperature milk, as well as spherical bacteria in chains
(Streptococci).
The stain makes bacteria easy to see and stops them from moving. Cab-
bage (Teaching Note 12B) also contained many motile bacilli after incubation.
Part III
Growth on agar showed individual colonies as well as smears of growth.
Each colony grows up from a single bacterium or clump of bacteria that landed
on the agar away from other bacteria. A smear indicates many bacteria landed
near each other and the resultant colonies overlapped.
There may or may not be an equal number of bacteria on each side of the
plate. After 24 to 48 hours, in our samples the growth was predominantly white,
though occasional yellow colonies were seen. Luster was dull. Diameter of the
colonies varied from .2 mm to 4 mm. The edge of growth was smooth. Height of
colonies was = 1 mm, with a convex or flat surface. There was a decaying or
sharp odor, but not as strong as the incubated milk's.
The amount of growth depends on the temperature and length of time of
incubation.
1 9 G177

Molds may also be found on the plate. They may appear black, white, or
other colors, and are likely to be filamentous.
ANSWERS TO DISCUSSION QUESTIONS:
1. The sample of milk incubated at a warm temperature.
2. Answers will vary.
3. See Anticipated Result 1.
4. Cottage cheese is made by adding a culture of a certain bacterium to
skim milk and allowing it to incubate. The watery liquid that separates from
the protein precipitate is removed by draining. Cream and salt are sometimes
added by the manufacturers ("creamed cottage cheese") afterwards.to alter the
flavor.
5. No. The bacteria that gave rise to the colonies were either (1) in
the milk when it was bought or (2) got into the milk while it was handled during
the activity, such as from the beaker or the air. Which is true is not evident
without a carefully-designed experiment.
6. You could incubate milk in the original milk container or plate the milk
directly from the container.
7. The milk could have been contaminated from the beaker in which the milk
was incubated, or from the air when the beaker was uncovered, or from the drop-
pers or pipets used to transfei the milk to slides.
8. There is likely to be an unequal distribution of growth. This is be-
cause it is difficult to spread the milk over the entire plate in a uniform
manner.
9.C12H22011 H/0
C H12
06
(glucose) + C6H12
06
(galactose)
10. Agar is a carbohydrate which in aqueous solution solidifies below
40 °C. Agar is obtained from certain seaweeds. Nutrient agar is agar with
NaC1, peptones (hydrolyzed proteins) and beef extract added to nourish bacteria.
1
178

LESSON 35: (A) PARASITIC DISEASES
(B) OBSERVATION OF LIVE BACTERIA
RATIONALE:
In ST-34 food and waterborne bacterial diseases were considered. ST-35
examines food and waterborne diseases caused not by bacteria but by worms
and protozoa. On a worldwide basis, these are among the most common diseases
of all. Live bacteria are observed in the laboratory activity, to provide more
experience with microbiological techniques.
OBJECTIVES:
The student
define the terms parasite and give three examples of parasitic
diseases.
-define cyst and larva, and explain their role during the life cycle
of the trichinosis worm.
-describe the cycle and mode of transmission of at least one
animal parasite.
-explain how to prevent infection of at least two animal parasites.
SEQUENCE: LA-34 (cont.); ST-35
SUGGESTIONS:
1. Bacteria are difficult to focus on with the microscope. You may wish
to point this out to students and to review this technique before the laboratory
activity.
2. Parasites arc! a common health problem with dogs and other pets. Some
students may have had pets with parasites and may be interested in a discussion
of this topic. A visit to a veterinarian's clinic might be of interest.
3. ST-35 emphasizes pork as a source of trichinosis. This kind of infec-
tion can also result from eating bear meat or (presumably) from cannibalism.
:1d179
LESSON 36: WATER PURIFICATION
RATIONALE:
Food and water are essential to all life. However, food and water may
both carry organisms and/or chemicals that are harmful to the human body.
Some of the diseases caused by such organisms were discussed in ST-34 and
ST-35. ST-36 is devoted to describing the methods currently used to remove
harmful agents, both biological and chemical, from drinking water. In LA-36
the students construct a water-purification column and are given the opportunity
to design and carry out a study of water pollution in their community.
OBJECTIVES:
The student will:
list two bacterial diseases that can be transmitted by contaminated
water.
-describe at least one method used by water treatment plants to remove
bacteria from drinking water.
-list at least three toxic chemicals that are sometimes found as con-
taminants of drinking water.
-describe now to construct a water-purification column to remove chemicals
from water.
SEQUENCE: ST-36; LA-36
SUGGESTIONS:
1. Some students may be interested in researching the literature suggesting
a possible relationship between water pollution and diseases such as cancer,
heart disease, chemical poisoning, etc. It might also be interesting for stu-
dents to research federal or local laws regulating the disposal of chemical
wastes by industrial plants. Perhaps the students could locate some information
on purification procedures that have been developed for the removal of chemicals
from drinking water. This would relate to both ST-36 and LA-36. A three-part
report entitled, "Is the Water Safe to Drink?" (Consumer Reports, June, July
and August 1974), provides some interesting information on these topics.
2. The possibility of a field trip to a local water treatment or sewage
treatment plant is mentioned in the Teaching Notes for LA-36.
1 jj
180

INFORMATION ON LABORATORY ACTIVITY 36:
TEACHING NOTES:
1. The purpose of this activity is to demonstrate a method for removal
of chemical pollutants from water and to give the students an opportunity to
plan and carry out an investigation of water pollution in their community.
2. Anticipated time: two periods.
3. Parts I and II of this activity should probably be scheduled at least
one week before Part III in order to give the students time to plan their projects
and collect the samples they will need.
4. Although Parts I and II are designed for teams of two, the students may
wish to form larger groups for Part III.
5. The glass wool, activated charcoal and sand are all readily available
at most pet stores.
6. A very dilute solution of acetic acid was used in Part II because the
small quantity of activated charcoal used in the column is not capable of
adsorbing a large number of organic molecules. In fact, the students may find
that the column fails to remove all the odor from the 0.01 M acetic acid solu-
tion for this reason. The activated charcoal may become saturated before all
the acetic acid molecules have been adsorbed.
7. All of the equipment should be washed with an odorlesf. cleanser such
as Alconox (Scientific Products #C6300).
8. Note that the acrylic tubing called for in this activity is the same
as that used in LA-15 of Unit I.
9. For Part III, you may wish to have the students discuss their plans
with you before beginning the investigation and provide a written or oral report
when they complete it.
10. An alternative or supplementary activity would be a field trip to the
local water treatment or sewage treatment plant.
11. In Unit I, Biomedical Social Science, Lessons 40 to 45, the students
conducted surveys or different aspects of their community. If any students
happened to study water pollution, they might have something of interest to
report to the class at this time. Also they might enjoy an opportunity to
extend their survey in this activity.
200 181

MATERIALS: (for IS set-ups)
1.08 ml acetic acid (CH3COOH),glacial
IS lengths of acrylic tubing, 22 mm
I.D., 30 cm long
15 rubber stoppers, one- hole,tt4
15 lengths of glass tubing, 3/16" x
1/16", 2 to 3" long
IS lengths: of latex tubing, 3/16" x
1/16", 2 to 3" long
IS pinch clamps
15 mortars and pestles
15 ring stands with clamps
30 beakers, 250-ml
30 ":rlenmeyer flasks, 125 -ml
45 beakers, 50-ml
PREPARATION OF REAGENTS:
IS long glass stirring rods
IS scoopulas
1 box glass wool (approx. 12 g)
1 to 2 boxes activated filter
carbon (approx. 1 lb/box)
700 ml coarse sand
odorless cleanser
distilled water (in squeeze bottles,
if available)
IS graduated cylinders, 10-ml
15 glass-marking pencils
Parafilm
0.01 M acetic acid, 1800 ml: 1.08 ± .01 ml glacial acetic acid + suffi-
cient water to give a total of 1800 ml.
ANTICIPATED RESULTS:
In Part II of the activity a significant difference was noted in the
odor of tap water before and after it was filtered through the column. No
odor could be perceived after filtration. When compared with the "control,"
a barely perceptible odor could be perceived in the filtered 0.001 M acetic
acid solution, but the odor was much less than that of the unfiltered 0.001 M
acetic acid solution. Filtering the 0.01 M acetic acid solution produced only
a slight reduction in odor.
ANSWERS TO DISCUSSION QUESTIONS:
1. The column was very effective in filtering odorous chemicals out
of tap water, fairly effective in filtering the 0.001 M acetic acid and not
effective in filtering the 0.01 M acetic acid.
2. The column was ineffective in filtering the 0.01 M acetic acid solution
because the quantity of acetic acid molecules exceeded the capacity of the
column. That is, all the "active" sites on the charcoal were saturated before
the acetic acid molecules had been removed from solution.
18220

3. The effectiveness of the column might be improved by using more char-
coal and/or by using smaller particles of charcoal to increase the adsorptive
surface area available. Both of these changes would also lengthen the time
it takeS for a sample to flow through the column, thus increasing the time the
sample is in contact with the adsorptive surface of the charcoal.
LESSON 37: (A) FOOD PROCESSING
(B) NITRITES IN FOODS
RATIONALE:
Foods that have been processed in various ways to permit short- to long-
term storage make up a large portion of the average person's diet. Processed
foods differ from unprocessed foods in at least two ways: nutrients may have
been lost or removed during processing and many different types of additives
may have been used in the processing. Thesr:, factors are of importance in
evaluating the nutritional quality of a diet. ST-37 provides information on
food processing and how it may alter the nutritional content of foods. In
LA-37 the students analyze foods to determine the amount of nitrite present
as a result of processing.
OBJECTIVES:
The student will:
-list three reasons for food processing
-explain how milling changes the nutritionalvalue of grains.
-define fortification and give at least two examples of foods that
have been fortified
explain how canning, freezing and dehydration prevent the spoilage
of foods
explain how canning, freezing and dehydration alter the nutritional
value of food
-determine the concentration of nitrite in some processed foods
SEQUENCE: LA-37; ST-37
183

SUGGESTIONS:
1. If any of the students have done any home canning they may wish to
tell the class about the procedure and the various precautions involved to
prevent food poisoning.
2. Field trips to food processing plants are usually interesting. If
there are any such facilities in your area you might consider the possibility
of such an activity.
3. Food processing a controversial topic in nutrition, as discussed
in the text. Speakers with different viewpoints on the issue of food processing
could be invited to contribute to this lesson. The FDA can recommend speakers,
as can industrial corporations. Many health food stores can provide the names
of proponents of unprocessed, "natural" foods.
INFORMATION ON LABORATORY ACTIVITY 37:
TEACH'NG NOTES:
1. The purpose of this activity is to demonstrate how a potentially harm-
ful food additive (nitrite) can be analyzed for in foods.
Anticipated time: Part I--one period; Part II--one-half to one period.
3. The activity calls for pieces of meat. However, you may also find
other listing nitrite as an'ingredient, such as canned meat stews. In
any case, use a food which has or is likely to have some added nitrite. Sug-
gested foods are those which list nitrites in the ingredients, including hot
dogs, bologna, bacon, salami, sliced beef, and canned meats.
4. Once the color indicator is added (Step 6 in Part I, and Step 4 in
Part II) the rest of the part must be completed because the color intensity
must be read after 15 minutes. If the activity is stopped before either of
these two steps and resumed later, the test solutions should be refrigerated
overnight.
5. Each set-up requires 5 grams of food in 50 ml of solution. If this is
too small an amount to blend, double the quantities for blending purposes and
then use only half for analysis.
6. If there is only one blender per class, mortars and pestles may be
used as alternates to cut down on waiting time. Grinding with a mortar and
pestle should be done for at least two minutes to break up the food. Soft
4.4
184

meats are best because they have little fiber and so are easiest to break up:
these include hot dogs, bologna, and liverwurst.
Another option is to blend one food for the entire class and then subdivide
it.
7. The ratio of food to sulfanilic acid -olution is approximately 1:10 by
weight.
8. The nitrite reagent to be prepared is needed only in Part II. The
-other two reagents are used in both Parts I and II.
9. In Part II, nitrite concentration is expressed in parts per million
(ppm). Students may need to have this kind of concentration unit re-explained.
In Unit I, LA-39, ppm were used to express nitrogen dioxide gas concentration
in air by volume. Here, ppm are used to express nitrite concentration in
food by mass.
10. At the time of this writing there is controversy regarding safe levels
of nitrite and nitrate in food. The Agriculture Department has proposed re-
ducing the levels of nitrite and nitrate in many foods. These proposals include
the eventual total banning of nitrate and nitrite in bacon and all cured meats
except canned ones. (An immediate reduction of the nitrite level in bacon from
the present level of 200 ppm to 125 ppm has been proposed.) In addition,
Department proposals include reducing the nitrite level in sausages, hot dogs,
bologna and luncheon meats from the present level of 200 ppm to 100 ppm, and
in those cured meats which are canned to 50 ppm. The problem is to reduce the
level of nitrite used in processing to a level where nitrosamines are negligible,
and at the same time retain enough preservative to prevent botulism.
It should be noted that the present level of 200 ppm would rarely be found
in a sample of processed meat. The nitrite concentration decreases significantly
over a period of time, since nitrite reacts with oxygen to form nitrate.
For example, if nitrite is added to meat prior to packaging until a concentra-
tion of 200 ppm is obtained and then the meat is packaged and analyzed a few
weeks later, the new nitrite concentration is likely to be as low as 1 to 10 ppm.
20.;185

MATERIALS: (for 15 set-ups)
250 ml conc. HC1
15 g sulfanilic acid crystals(H2NC6H4S03HH20) (Sigma S 4127)
0.2 g N-(1-naphthyl)-ethylenediamine
dihydrochloride (Sigma N 9125)
0.5 g sodium nitrite (NaNO2)
meat samples
1 to 5 blenders (mortars and pestlesif only 1 or 2 blenders are available)
30 beakers, 150-m1
30 beakers, 50-m1
15 pipets, 10-m1
30 pipets, 1-ml
105 cuvets, 16 x 125 mm, Pyrex
PREPARATION OF REAGENTS:
15 graduated cylinders, 100 ml
15 funnels
15 stirring rods
15 balances
10 BIP colorimeters
5 to 10 knives (or spatulas)
filter paper, Whatman #1, 15-cm
15 test-tube racks
90 corks, #4
15 glass-marking pencils
15 pieces graph paper
These reagents were used in Unit I, LA-39. You
the second reagent below, and it may be reused here.
up or were unstable.
Sulfanilic acid solution, 1500 ml:
may still have some of
The other two were used
Add 250 ± 1 ml conc. HC1 to 1250 ± 10 ml water. Start heating the acid-
water solution to 40-45 °C. Add 15 ± 0.1 g of sulfanilic acid crystals. Main-
tain the temperature at 40-45 °C. The crystals will dissolve
May be stored at room temperature for a month.
N- (1-naphthyl)-ethylenediamine 2HC1 solution, 200 ml:
with stirring.
Add 0.2 ± .01 a of the powder to 200 ± 2 ml water. To help dissolve it,
use a stirring rod to break up the clumps, and stopper and shake. It takes
about 5 minutes to dissolve. The solution is
kept refrigerated in a stoppered brown bottle
stable for several months if
Sodium nitrite solution, 5 ppm, 400 ml:
Dissolve 0.5 ± .01 g sodium nitrite in a total volume of 250 ± 5 ml water.
Dilute 1 ± 0.01 ml of the solution to 400 ± 5 ml. Refrigerate. This solution
is stable for only a few days.
186

ANTICIPATED RESULTS:
We obtained the following results for the standard tubes.
[NO2]TUBE in ppm % T ABSORBANCE
0 0 100 .000
1 1.0 35 .455
2 .8 43 .365
3 .6 56 .250
4 .4 66 .180
5 .2 81 .090
% T of the "no dye" tube from Part I was 90, corresponding to an absorbance
of 0.05.
The graph is shown.
For our hot dogs, bologna, Italian salami and sliced beef, we obtained
1-.5 ppm for the meat solution, which corresponds to 1-5 ppm in the meat.
This is reasonable since nitrite is oxidized to nitrate after packaging.
See Teaching Note #11.
as
04
0.3
0.1
1 --4- - -,_
L. .L.,-:. -
c , ,tr--r--. ,
I
-1* 77 ,-, ; " '
- 7 . '7-7 '-'-'7. . 4 1-7
t .. .
, 111, ,'-~ + r :rry
---t,
1-7- i1,,-7 --r -
---,-1- 7 -44 4 I
L L..; i..
et
--
-r.r1-.-4-tr-t
- -1,4
i ---I---
.-4- it-
-f- -i-- - :-
-7--ii--,-,- .
T--; i if-t 4'
. .
.
i .
.
"t ti t----i-t--7-'
'--L.....7 -1 . .. .
1---IIo.
14 L.-t
--iD-t i--k 1
I-4,-.
Irt - -; --
.1:-..--.Pr . .
7....
1
.. T 14
-
II: 1-- 14re
- -....'-17,.- .
.- ..-!LSif'
118w
h.L4.\>`1_.._ ..-..1 .
1-1-,rr....tr I.,- 'Ar
1 (<9r-- C0,,g
_i_.14--1---
,_____I
-
+
1., i :.i ,
; .ti
.
MIMIIIIIIIIIII111111u.111111
1:::10/014161MiIMP:Melmill4.14111111ANN op_ AA1011 .
11.1-1-4ail
-t-
t-
1 1 r 7r -:.
t
i i;._i_.
i
r.
1211164112 1111 1111
illitLt
I .-
:.
1-
t
,
i 1
11:11111116PIPli11gemill1011a UM§Ail MIIIIIIIII III
11110 _
0 .2. .3 .4 .5 .6 .7 .8
NITRITE CONCENTRATION, ppm
2
.9 0
187

LESSON 38: FOOD ADDITIVES AND HEALTH
RATIONALE:
A variety of chemicals are added to foods when they are processed, for
a number of reasons (preservation, fortification, etc.). Such chemicals
are called food additives. Because almost all processed foods contain at
least some food additives and because we consume a great many processed foods,
it is appropriate to consider the effects these additives may have on our
health. ST-37 discusses some of the more common food additives. The contro-
versy surrounding the use of nitrites and nitrates is discussed in some de-
tail to illustrate the growing concern that certain food additives may be
detrimental to health.
OBJECTIVES:
The student will:
at least four classes of food additives and their uses
des:fibe the procedure that must be followed before a new food
additive is approved for use by the FDA
state the purpose of adding nitrites and nitrates to foods
describe the way in which nitrites affect the oxygen-carrying
capacity of the blood
define the term carcinogenic
discuss the connection between nitrites, nitrosamines and the con-
cern that nitrites in foods may cause cancer in humans.
SEQUENCE: LA-37 (cont.); ST-38
SUGGESTIONS:
Two or more students might organize a debate on the "pros and cons" of
food additives for presentation to the class. Reference material on food
additives can be obtained from the FDA, the Journal of Nutrition and magazines
dealing with "organic" foods. One book which might be helpful is Ruth Winter's,
A Consumer's Dictionary of Food Additives, Crown Publishers, N.Y., 1972.
188

LESSON 39: FOOD LABELS
RATIONALE:
In ST-37 and ST-38 the processing of foods and the use of food additives
were considered. ST-39 discusses the importance of food labels as a source
of information on nutrients and food additives present in processed foods.
In Activity 39 the students use the information contained in food labels to
compare different brands of the same food in terms of nutrients, additives
and'cost.
OBJECTIVES:
The student will:
list the types of information that are required by federal law to
appear on the labels of packaged foods
explain how to determine which ingredients listed in food labels are
present in the highest percentages.
list at least two types of food that are exempt from the nutrition-
labeling laws.
evaluate different brands of the same foods for nutrient value, presence
of additives and cost.
SEQUENCE: ST-39; Activity 39
SUGGESTIONS:
1. A good topic for class discussion might be additional types of inform-
ation that students think should appear on food labels. For example, a number
of the flavoring ingredients used in soft drinks are "top secret" and do not
appear on labels.
2. Students may be curious to know about the significance of the series of
lines and numbers that are often found on packaged food. These lines consti-
tute the Universal Product Code (UPC). The code was designed to be used with
a computer, to ring up purchases. This is accomplished by passing a specially
designed sensor over the lines. The probe transmits information on identity,
brand and size into a computer which totals the costs and produces a printed
version of all the information. It also maintains inventory information for
the merchant.
2u8189

3. Students may wish to explore the relation between politics and nutrition.
There are, of course, powerful lobbies representing the food industries and con-
sumer groups. Political battles on food additives and food processing are common.
Interested students can find much material on this subject in the library and in
newspapers. You may wish to discuss this topic with your Social Science colleague.
KEY--REVIEW SET 39:
1. Microbes and chemicals.
2. Production of vitamin K and folic acid.
3. Trichinella worms encysted in contaminated meat. By cooking pork
thoroughly.
4. Bacteria, viruses, protozoa, fungi.
5. Water treatment plants generally treat water by sedimentation, filtra-
tion and chlorination.
6. Chloroform, benzene, ether and others.
7. By using fresh foods.
8. Sodium nitrate may be converted to nitrites. Nitrites may react with
secondary amines inside the stomach to form nitrosamines. Nitrosamines may cause
cancer.
9. It provides information on quantities of nutrients, relative cost per
unit of nutrient and the identity of additives present.
10. Preservation; elimination of pests; improvement of color, flavor or
texture, etc.
11. A food additive is any substance Idded to a food during processing or
preparation. Examples include sodium nicr, gum arabic, dyes which act as
artificial coloring, etc.
INFORMATION ON ACTIVITY 39:
TEACHING NOTES:
1. The purpose of this activity is to reinforce the information on food
labels and food additives presented in ST-38 and ST-39. Students will analyze
.food labels to determine the ingredients and nutritional value of packaged
foods. They will also consider the cost of the food in terms of its major
nutrients.
2. Anticipated time: two to four periods. Part of one period is needed
for organization. (Students will need some time to form groups and select
190(,;)

foods to be studied.) At least one period is needed for analysis of the
labels and for calculations. Perhaps another one to two periods are needed
if oral reports are to be given.
The activity could be shortened by assigning foods to the class or by the
instructor supplying the labels. You could have only one member of each group
give a report or make the reports a writing assignment. The activity also
provides an opportunity for a library research project.
3. It is recommended that students work in groups, and that each group
investigate several brands of one kind of food. The students should select
packaged foods for which there are several available brands and which have
informative, detailed labels. A few possibilities are given in Step 1 of the
Procedure. Besides breads, breakfast cereals and peanut butter varieties, other
possibilities are canned or frozen fruits, vegetables and dinners, milk and
non-dairy creams and snack foods.
4. If time permits, the activity could include a survey of favorite foods
of the students and their families. The label research could center on the
most popular foods as determined by the survey. Another alternative would be
to determine the most popular menu for a meal such as breakfast and do the
label study on the items in the selected menu. The school cafeteria might be
able to provide information on their most popular offerings.
5. The activity has implications for your colleagues in Biomedical
Mathematics and Social Science. The calculations may employ vector multiplica-
tion, a technique stressed in Unit II Mathematics. The Biomedical Social
Science instructor may be interested in.the comparisons of costs and benefits
of raw and processed foods.
6. For the research on additives, zry to provide as many reference books
as possible or send students to the library. Some potentially useful sources
follow.
R. Winter, Consumer's Dictionary of Food Additives. Crown Publishers,
New York.
Textbooks on nutrition such as C. H. Robinson, Normal and Therapeutic
Nutrition, 14th Edition. Macmillan, New York, 1972.
The Merck Index, Merck and Co, Rahway, New Jersey.
United States Pharmacopeia
National Formulary, American Pharmaceutical Association.
210191
Readers' Guide to Periodical Literature
Consumer Reports articles on processed foods.
G. B6rgstrom, Principles of Food Science, Volume 2. Macmillan,
New York, 1968.
Specifications for Identity and Purity of Food Additives, Volumes 1
and 2. Columbia University Press, New York, 1963.
T. E. Furia, Handbook of Food Additives. Chemical Rubber Co., Cleveland,
1968.
7. A glossa-17y of common food additives is included below. This could
be reproduced for the students.
8. The students may need assistance in finding the cost per unit. You
may wish to point out that it is not necessary to find the cost per unit of
every nutrient given; calculations for vitamins and minerals should be limited
co those that are present in significant quantity.
9. The Superintendent of Documents, U.S. Government Printing Office,
Washington, D.C. 20402, is a good source of information on labeling. Also,
information may be obtained from the U.S. Fcod and Drug Administration,
5600 Fishers Lane, Rockville, Maryland 20852.
10. The activity could include a visit to a health food store or to a
food-processing plant. You might invite a speaker who is a proponent of
natural foods. Tf you do this, it might be good also to obtain a speaker who
would argue in favor of food processing and food additives.
11. Students may be curious about the set of black and white "bands" which
appear on labels. They are for the computerized check-out of goods by stores
and are called the "Universal Products Code." The information coded includes
the name of the supplier, the product, and the package size. For example, the
cash register may print out "Brand X Grn Peas, 11 oz" in response to the coded
lines. This information remains in the computer for inventory purposes.
MATERIALS:
food labels (to be provided by students)
references (see Teaching Note #6)
192

ANSWERS TO DISCUSSION QUESTIONS:
1-3. Answers will vary depending on foods studied.
4. "Store brands" are usually less expensive than other brands.
5. Packaged foods may last longer and have an appetizing appearance,
odor or taste.
GLOSSARY OF FOOD ADDITIVES
Aluminum calcium silicate: An anti-caking agent used mainly in table salt.
Aluminum potassium sulfate: Adjusts pH of baking powder; also used as a
cheese bleach.
Benzoic acid: A preservative.
BHA (Butylated hydroxyanisole): An antioxidant used in many foods.
BHT (Butylated hydroxytoluenej: An antioxidant.
Butyric acid: An artificial flavor.
Calcium propionate: A mold retardant used mainly in bread.
Chlorine dioxide: A bread bleach.
Diacetyl: Flavoring agent.
Ethylene gas: Used on fruit to hasten or stimulate ripening, and on nuts to
loosen the shells.
Fumaric acid: Used to provide tartness in soft drinks and desserts.
Gum arabic: Used as a thickener and stabilizer in dairy products and other
foods.
Magnesium carbonate: Used as an alkalizer in baked goods, some dairy products
and canned vegetables.
Maleic hydrazide: Used as a sprout inhibitor on potatoes and other root crops.
Methyl bromide: A fumigant used on a wide range of produce and in some dairy
products.
Mineral oil: Used on fruit wrappers and on fruits and vegetables.
Psyllium: Stabilizer used in frozen desserts.
Sodium alginate: Thickener used in desserts and dairy products.
Sodium ascorbate: A chemical used in preserving meat, to help it maintain
freshness and color. (Sodium salt of Vitamin C)
Zip 193

Sodium benzoate: A preservative.
Sodium citrate (sodium salt of citric acid): Used as a preservative in a wide
range of foods.
Sodium iodoacetate: A chemical used to add taste and increase tenderness in
chickens.
Sodium phosphate: Used in cooking ham to allow it to absorb the maximum amount
of water.
Stannous chloride: Used as an antioxidant in soft drinks and to preserve the
green color of canned asparagus.
Sulfur dioxide: Preservative, used in the preparation of fruit and vegetables.
J
194

LESSON 40: (A) THE ROLE OF TEETH IN NUTRITION
(B) THE ANATOMY OF THE TEETH
RATIONALE:
This last sequence of four lessons has been included because of the clear
relation between nutrition and dental health. The importance of teeth in nutri-
tion is apparent when one considers the fact that the teeth are responsible for
the mechanical breakdown of food, a process that facilitates digestion of food
both in the mouth and in the remainder of the digestive tract. In fact, the teeth
are so important that numerous dental-health professions have evolved. An addi-
tional relationship between nutrition and dental health is that poor nutrition
can result in dental problems.
In this first lesson, the anatomy of the teeth and their function in nutri-
tion is considered. In the remaining lessons, the development of the teeth,
health problems related to dentition and some of the professions involved with
dental health are discussed. LA-40 introduces the students to a basic technique
in dentistry, the making of dental charts.
OBJECTIVES:
The student will:
- state the function of the teeth in digestion.
-point out the following structures when given a diagram of the mouth:
palate, uvula, incisors, cuspids, bicuspids, molars.
- describe the structures and functions of incisors, cuspids, bicuspids
and molars.
-point out at least 5 of the following anatomical parts of the tooth when
provided with a diagram: enamel, cementum, dentin, pulp, crown, neck
and root.
- prepare a dental chart for a classmate including locations of fillings
and missing teeth.
-list at least three professions concerned with dental health.
SEQUENCE: ST-40; LA-40
195

SUGGESTIONS:
1. There are a number of teaching aids which might prove useful in this
dental sequence. Some of these are listed below.
a. charts showing the different parts of a tooth
b. scale models of the mouth showing a full set of teeth
c. models showing different types of malocclusion, cavities, fillings,
crowns, etc.
d. X-rays taken in a dental office showing cavities
e. X-rays of young children showing both the deciduous teeth and the
permanent teeth sitting "below" them in the jaw.
Your dentist might be willing to lend you some of the above material or
bring such items to the school and give a short presentation.
2. It would be helpful for students to have access to a file of information
concerning dental professions. Directions for organizing such a file on health
professions were given on p. 15 of the Instructor's Manual for Biomedical Social
Science, Unit I. The counselor at your school may also have such information.
3. A field trip to a school training dentists or dental technicians and
hygienists would be very instructive. This possibility was discussed previously
in the Introduction to the Instructor's Manual.
4. The students may be interested in a discussion of the comparative anatomy
of teeth in different animals. Such material provides a good example of adaptation.
For example, omnivores, carnivores and herbivores eat different types of food; and
each of these three classes of animals has a characteristic type of dentition.
Carnivores such as wolves tend to have larger canines and pointed incisors and
bicuspids. Herbivores such as horses, cows and gorillas have a greater number
of molars and may lack canines entirely. Omnivores such as humans tend to have a
more uniform mixture of the two types of teeth.
Another interesting example of dentition is shown by rodents. These animals
have incisors that continue to grow in length throughout their lives. Rodents
continuously wear these front teeth down by using them on hard substances such as
nuts, roots, wood, etc.
Z4 .1;
196

INFORMATION ON LABORATORY ACTIVITY 40:
TEACHING NOTES:
1. The purpose of this activity is to give the students an opportunity to
observe the structures of the human mouth and to become acquainted with some of
the tools and methods used by dentists and dental assistants, such as use of a
dental mirror and filling out a dental chart.
2. Anticipated time: one period.
3. The students should be informed about this activity a day ahead of time
so that they can make sure their teeth are clean when they come to class. This
should avoid most embarrassment. You may wish to have a few toothbrushes and some
toothpaste available for students who forget.
4. If some of the students are reluctant to have someone else examine their
mouth, have them perform a self-examination. Hand mirrors should be provided for
this pruposc.
5. You might tell the students that when they are looking for fillings in
their partner's mouth, careful observation will be necessary to distinguish porce-
lain and quartz fillings. These types of fillings are generally found in teeth
toward the front of the mouth.
6. Charts #1 and #2 are attached. Classroom quantities should be reproduced
before the activity.
MATERIALS: (for 15 set-ups)
30 copies each of Charts #1 and 2 15 red pencils
15 dental mirrors several hand mirrors (optional)
ANSWERS TO DISCUSSION QUESTIONS:
1. Answers will vary.
2. If students have fewer than 32 teeth it is probable that their wisdom
teeth have not yet erupted. Also, some students may have lost teeth due to decay
or accident, or had teeth removed by an orthodontist in an attempt to correct a
malocclusion.
3. Fillings tend to be more predominant in the back of the mouth for two
reasons: (a) brushing is not as effective in removing food particles, and
(b) because the irregular surfaces of the teeth provide ample locations where
food can become trapped.
197

CHART #1, LABORATORY ACTIVITY 40:
(A) STRUCTURE-OF THE MOUTH
(B) TYPES OF TEETH
2 I. i
198

CHART #2, LABORATORY ACTIVITY 40:
NAME OF PERSON EXAMINED: ,/\--\..-------- SEX:
NAME OF EXAMINER:
TOTAL NUMBER OF TEETH:
TOTAL NUMBER OF FILLINGS:
NUMBER OF TEETH MISSING:
199

LESSON 41: (A) THE DEVELOPMENT OF THE TEETH AND MALOCCLUSION
(B) DENTAL IMPRESSIONS
RATIONALE:
In ST-41 the development of the deciduous and the permanent teeth is dis-
cussed. The importance of proper nutrition for the development of healthy teeth
is considered. Malocclusion and the methods used to correct this condition are
also covered. LA-41 gives the students the opportunity to make dental impressions
of their own teeth.
OBJECTIVES:
The student will:
-explain how poor nutrition may lead to improper dentition.
- define resorption and describe its relationship to the eruption of
permanent teeth.
- define occlusion and malocclusion.
- list at least three causes of malocclusion.
two methods used to correct malocclusion.
-state the function of dental impressions.
- explain how dental impressions of teeth are made.
SEQUENCE: ST-41; LA-41
SUGGESTIONS:
1. Impacted wisdom teeth are a common health problem. You may wish to pro-
vide the students with the following information on this subject.
Wisdom teeth are the last teeth to erupt, and often there is not enough
room for them in the mouth. If these teeth are unable to erupt we say they are
"impacted." Impacted wisdom teeth are frequently the cause of discomfort because
they push against other teeth or nerves. When this happens they are usually
removed by a dentist. If the extraction is particularly difficult and/or requires
the use of general anesthesia, an oral surgeon performs the extraction.
2. This would be a good time to examine dental models showing malocclusion,
and some of the methods used to correct it, such as braces, metal bands, etc.
Students with braces might be willing to discuss their experiences with orthodon-
tics and allow other students to inspect their braces.
2 :
200

3. One or more students might be interested in researching the relationship
between malocclusion, jaw size and human evolution. The incidence of malocclusion
in modern man is thought to be high because the size of the jaw has decreased,
leaving less room for the teeth. Studies have also been done on the possible re-
lationship between diet, jaw size and malocclusion. A correlation is thought to
exist between diets rich in foods that require much chewing (e.g., fibrous foods)
and larger jaws. The larger jaw size, in turn, implies less malocclusion.
4. Remind students to bring their toothbrushes for LA-42. It might also
be a good idea to have a spool of dental floss on hand to help remove the red
stains that will result from chewing disclosing tablets in LA-42. Correct flossing
technique could also be demonstrated.
To use dental floss properly, use sufficient length to maintain control
(10 to 12 inches) and grasp the floss between the thumbs and index fingers of
both hands with about a half-inch of floss stretched between the two hands.
Bracing the fingers of one or both hands against teeth, slide the floss at an
angle through the contact area, making sure that the floss does not snap against
the gums. Manipulate the floss alternately into the gum crevices alongside each
tooth, working any debris free of the area. Bring the floss to the contact area
again and slide it back through. All material should be removed from the mouth
by rinsing.
INFORMATION ON LABORATORY ACTIVITY 41:
TEACHING NOTES:
1. The purpose of this activity is to introduce the students to a technique
used in dental offices: the making of dental impressions.
Anticipated time: one period.
3. Before the students start the activity, explain that they should not be
alarmed when they feel the alginate mixture hardening around their teeth. It is
of a rubbery consistency and will not get stuck in their mouths.
229201

4. Students should be cautioned to remove any temporary bridges that they
may have in their mouths. Students with braces should not perform this activity.
5. If you wish to have the students make full-mouth impressions, plates
for full upper and lower impressions can be obtained from any dental supply house.
The alginate and Hydrock may be obtained from the same source.
6. The temperature of the water used to make the alginate mixture is impor-
tant to ensure proper setting.
7. The scoop used to measure the alginate and Hydrock comes with the
alginate mixture.
8. Regular plaster of paris may be substituted for the Hydrock mixture.
However, if this is done the consistency of the impressions will not be as good.
If you choose to use plaster of paris, consult the package for mixing instructions.
9. We recommend that you perform this particular activity before having the
students do it, so that you may be prepared for any questions they may ask. If
time allows, you might demonstrate the technique before the students begin.
10. Make sure the beakers are cleaned before the Hydrock hardens. The excess
mixture should be placed in a container and thrown out. Pouring it down the sink
is not a good idea.
11. The trays that are used to make the impressions are designated "disposable."
However, they may be used again if properly cleaned. After the alginate mold has
been removed from the plates, the plates should be washed with soap and hot water.
They can then be stored and used again the following year.
MATERIALS: (for 30 set-ups)
3 boxes Tra-Ten disposable traysDP bilateral No. 8
3 boxes Tra-Ten disposable traysDP bilateral No. 7
2 lb DP alginate (Type 1)and scoop
30 beakers, 150-ml
30 beakers, 250-ml
15 graduated cylinders, 100-ml
15 thermometers
30 spatulas
10 lb Hydrock Yellow Dental Stone several hand mirrors (optional)
ANSWER TO DISCUSSION QUESTION:
Answers will vary. Possible causes of malocclusion are discussed in ST-41.
202

LESSON 42: (A) DENTAL DISEASE
(B) PLAQUE
RATIONALE:
ST-42 discusses the causes, prevention and treatment of some of the most
common dental diseases. The relationship between diet and dental disease is also
explored. In LA-42 the students examine specimens of plaque microscopically.
OBJECTIVES:
The student will:
- define calculus, caries, periodontal and plaque.
- define periodontitis and gingivitis and state the cause(s) of each.
- describe the relationship between plaque, calculus and dental disease.
-list two ways to reduce dental disease.
-describe the functions of fillings, crowns and bridges.
-discuss the usefulness of mouthwashes.
- describe the relationship between the carbohydrate content of the diet,
the texture of food eaten and dental disease.
-describe the microscopic appearance of plaque.
-explain how to evaluate the effectiveness of their toothbrushing
technique.
SEQUENCE: ST-42; LA-42
SUGGESTIONS:
1. In ST-42 root canal work on decayed teeth is mentioned but not elaborated
on. You may wish to give the students more information on this procedure. The
object of root canal work is to remove infected or damaged pulp from the pulp
cavity and from the root canals located inside the tooth. The procedure is to
remove all the pulp and to sterilize the pulp cavity and root canals. These areas
are then filled in with sterile cement and a filling or crown is used to seal off
the area and replace the original chewing surface of the tooth. In this way teeth
that arc badly infected and would have degenerated until their removal would have
been necessary, can be saved and rebuilt. The tooth is dead after the procedure,
but if properly crowned and properly cleaned at the gumline, it will last as long
as a live tooth.
203
2. It has often been noted that adults show a decrease in the incidence of
caries after the age of about 25 years. Perhaps one or more of the students might
do some library research on this topic and report to the class.
INFORMATION ON LABORATORY ACTIVITY 42:
TEACHING NOTES:
1. This activity was designed to give the students an opportunity to observe
the bacteria that reside in the mouth and to demonstrate the use of disclosing
tablets in improving brushing technique. The microscopic examination of plaque
should also serve to reinforce some of the techniques introduced in LA-34 on
food microbiology.
2. Anticipated time: one period.
3. If the lab period occurs at the beginning of the day the students might
be advised not to brush their teeth the morning of the activity. This is to
ensure that a sufficient quantity of plaque is present in the mouth.
4. The students may not know how to detect a dirty eyepiece on a microscope
or how to clean a dirty lens. An eyepiece can be inspected by looking through
it while rotating it. If particles appear to be moving in the field as the eye-
piece is turned, then it is dirty. Both eyepiece and objectives should be
cleaned only with lens paper. (Tissue paper or paper towels will not only leave
lint behind; they may scratch the lens.) When lens paper is used it should be
folded to ensure that no oil or sweat from the fingers passes through it to the
objective or eyepiece.
5. You may wish to review the concept of Brownian motion, which was initially
discussed in LA-34. It is important that the students not mistake a particle
being jolted by water molecules for a motile bacterium. One distinction worth
making--Brownian motion occurs with both living and non-living particles; motility
is a characteristic of life.
6. The students may find it interesting to read about the discovery of
bacteria in the mouth. It is described in a letter written by Antony van
Leeuwenhoek to the Royal Society of London, dated September 17, 1683. A trans-
lation of the letter can be found in C. Dobell's, Antony van Leeuwenhoek and his
"Little Animals," Dover Publications, Inc., New York, 1960.
7. Students should be advised to bring their toothbrushes from home. Those
who forget might take two disclosing tablets home with them and complete the
activity there.
2204

MATERIALS: (for 30 set-ups)
0.8 g sodium chloride (NaCl) 60 toothpicks
0.1 g crystal violet stain 15 microscopes
60 disclosing tablets lens paper
toothbrushes 30 medicine droppers
several hand mirrors 60 microscope slides with
30 paper cupscoverslips
PREPARATION OF REAGENTS:
saline solution, 100 ml: Dissolve 0.8 ± 0.01 g NaC1 in 100 ml water.
crystal violet stain, 100 ml: Dissolve 0.1 ± 0.01 g crystal violet stain
in 100 ml water.
ANSWERS TO QUESTIONS:
1.
EXAMPLE(ACTUAL FINDINGS WILL VARY)
2. Yes. (When students focus their microscopes properly, they are almost
certain to find bacteria in a scraping.)
3. Rods and cocci should be present.
4, 5 and 6. Students are likely to see three kinds of movement: Brownian
motion, movement of particles on currents that flow across the field and random
movement through the field. Schematically these three types of motion might be
shown as follows:
0
(a) vibration of particle (b) flow across field(Brownian motion)
/'>X)(c) random motion
205

7. Motile bacteria are likely to be present. Their movement follows
pattern (c) shown in the answer to Question 6.
8.
9. 1 to 2 um
10, 11, and 12. Answers will vary. Plaque is most likely to be found
between the teeth.
LESSON 43: (A) VITAMINS AND FLUORIDES IN DENTAL HEALTV
(B) UNIT REVIEW
RATIONALE:
ST-43 completes the discussion of the relation of diet and dental health.
The role of vitamins in the development of teeth is considered. In addition,
the value of fluoridation of drinking water is discussed. A set of problems
based on the entire unit is included for review purposes.
OBJECTIVES:
The student will:
-describe the roles of vitamins A, C and D in the development and
maintenance of the teeth.
-explain the difference between the terms "topical" and "systemic."
-compare the effect of topical and systemic administration of fluorides
on the incidence of dental caries.
-list the symptoms of too much fluorine in the body.
SEQUENCE: ST-43
SUGGESTIONS:
1. Section 43-2 presents data relating the fluoride content of water and
the incidence of dental decay in different communities. The students could use
these data to construct a graph for the purposes of estimating the correlation
coefficient between fluoride content of water and dental decay. The method for
doing this was described in Supplementary Section X of Biomedical Mathematics,
Unit II. You may wish to discuss this possibility with your colleague in
mathematics.
206

been k2. Since fluoridation has 1105' controversial issue, You might wish
-ciot..1S,Ides of theto have people come in to presentP- case to the class. Your
A0dentist or a representative of the °1.1-c411 Dental Association may be able to.
suggest the names of persons who 0ia be 4Illifig
t° sPeak to the class on this
topic.
3. Additional information 04nfil°1-±(1 s can be foUnd in Understandin Dentist -
by by Lantner and Bender, Beacon Ilf-
.A,4, Boston,1969' This book also lists sources
h obt4i,-from which further information ma_Y-'C 'led. Students interested in learning
more about fluoridation of water til° ha:" qn opportunity to research this topic
in Biomedical Social Science, Unit01,
KEY--UNIT REVIEW SET:
1. The study of food compos 04)11 an uses the nutrients for growth
and development.
2. a. Level of physical ac-tOtY' Nking, diet, personality,
sex of individual, obesity.
heredity,
b. Mostly epidemiologicza or stab.l - kstiCal evidence.
3. a. Food is broken down :i1156" si111131%/- molecules that can be absorbed
into the body.
b. Carbohydrates, prote05f
4. a. Biological catalysts 0ki.ch up chemical reactions.
fa-CS,
b. They catalyze the brelc
tions which transfer energy to ATP.
5. a. In the mouth.
dDwnof
food.They catalyze metabolic reac-
b. In the stomach Juice Nkes with the food. Some digestion
of proteins and carbohydrates occti5here.
0.5t the6. Excess stomach acid may dlig
or duodenum.
mucous lining of the stomach
Which7. a. The liver produces biiP.,
f.,ch ihtN
is stored in the gallbladder. The
pancreas secretes pancreatic juiccv,0' 'ludes enzYMes for hydrolysis of fats,
carbohydrates and proteins.
207
b. In the small intestine.
8. An inflammation of the liver; masses of solid matter formed in the gall-
bladder; an inflammation of the pancreas.
9. The colon absorbs water, minerals and vitamins from chyme. It also
stores and releases feces.
10. Water is the medium in which almost all chemical reactions occur inside
our bodies. It is required for regulating body temperature and essential for
lubricating the joints.
11. The chemistry of compounds containing carbon; proteins, fats, carbohy-
drates, vitamins, etc.
12. a. Carbohydrates.
b. Glucose.
13. a. The breaking down of chemicals with the addition of water.
b. The breakdown of proteins, fats and carbohydrates requires hydrolysis.
14. a. Glucose.
b. Excess glucose is converted to fats.
c. Atherosclerosis.
15. a. Sucrose.
b. Vitamins and minerals.
16. a. A fat; an ester of glycerol and fatty acids.
b. Fatty acids and glycerol.
17. a. Saturated fatty acids have no carbon-carbon double bonds; monoun-
saturated fatty acids have one carbon-carbon double bond; polyunsaturated fatty
acids have two or more such double bonds.
b. Saturated fatty acids tend to increase the blood cholesterol level
and the risk of atherosclerosis. Polyunsaturated fatty acids have the opposite
effect. Monounsaturated fatty acids appear to have no effect on the risk of
atherosclerosis.
18. a. Amino acids.
h. Amino (left); carboxyl (right).
208
2

c. Proteins.
19. a. Those which cannot be manufactured in sufficient quantity within
our bodies.
b. Meat, fish, poultry, eggs and dairy products. These foods are sources
of proteins that contain essential amino acids in the ideal proportions.
20. a. Phosphorous, calcium, magnesium, sodium, potassium, iron, zinc.
b. Copper, cobalt, iodine, fluorine, etc.
21. a. Insufficient vitamin B-1 (thiamin).
b. When the nutritious brown hull of rice is removed by food processing,
thiamin is removed. If rice is the main source of this vitamin, beriberi may
result.
22. a. Fats must be emulsified in order to be digested and absorbed.
b. Bile.
c. No. Hormones are transported to other parts of the body via the
bloodstream.
23. a. Kinetic energy is the energy of motion; potential energy is
stored energy.
b. Chemical potential energy.
24. a. Energy is neither created nor destroyed when it is changed from
one form to another.
b. In all of the processes of cell respiration, energy is transferred
or transformed, but there is no change in the amount of energy.
25. Building of large molecules from simpler molecules and conversion of
large molecules to simpler molecules with release of energy.
26. Protein, 4 calories; carbohydrate, 4 calorie; fat, 9 calories.
27. Glucose is broken down and energy is releas:!J for use.
28. ATP is the chemical in which energy generated in cellular respiration
is temporarily stored. When energy is required, ATP is broken down into ADP and
phosphate, the energy being released for use in biological processes.
29. Products are removed by further metabolism, and the reactions are
coupled with ATP hydrolysis thus changing the overall process to an exothermic one.
48209

Pregoently by lessening the intake of carbohydrates, especially sugar.
xpendit18 more calories than are consumed.
Use of refrigerationor cooking; processing of foods; use of food
adltivess
3.
b. By Qo014 ing pork thoroughly.
Bacterial chemical.
3.Iron, niacin, riboflavin, thiamin, pyridoxine, pantothenic acid,
viOrninphosphwo, magnesium, etc.
a. Use0 to Preserve food, to thicken, stabilize, flavor, color, etc.
e and4. Sodi sodium nitrite, used to preserve meat, may becafcillogenie, (svervl other answers are possible.)
I) ,
trigrediQI.Ity; nutrients, additives.
4tricisors,_cot food; cu5Pid5--tear food; bicuspids--cut, tear and
orincl food;molarcrush and grind food.
131000ltlion.
Gingivitis is an inflammation of the gums. Periodontitis is an advancedstage °f gingivitis characterized by weakening of the gum- tooth relationship.
41kicteria multiply in the translucent fluid secreted by the mucous
01e0r4tlesOf the h.,
-to0-t 11' The bacterial waste products mix with the translucentfluid to form Placlue. The bacteria in plaque metabolize sugar to acids. The
.csAel me excreted ,end cause caries.il
It helps Prevent dental caries, especiall in young children.
24. ti