doc1 - flybe.com\documents and settings\kevin\desktop\make_your_own_env_label.doc make your own...
TRANSCRIPT

c:\documents and settings \kevin\desktop\make_your_own_env_label.doc
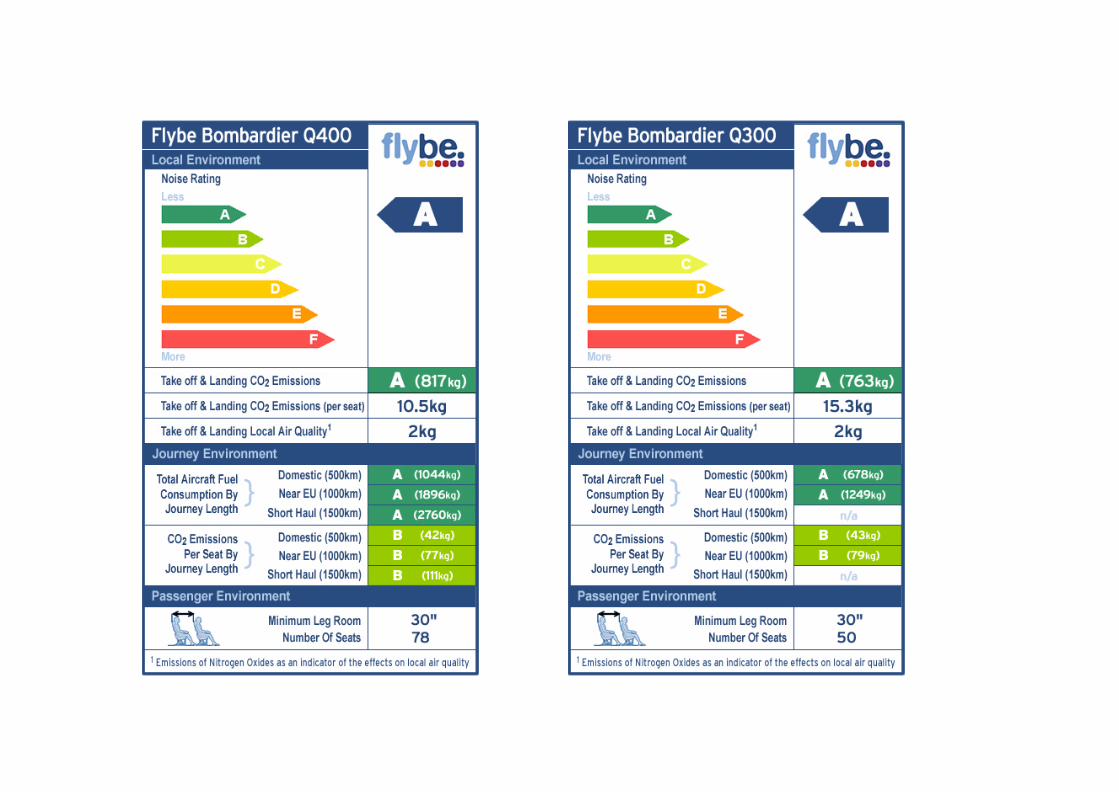
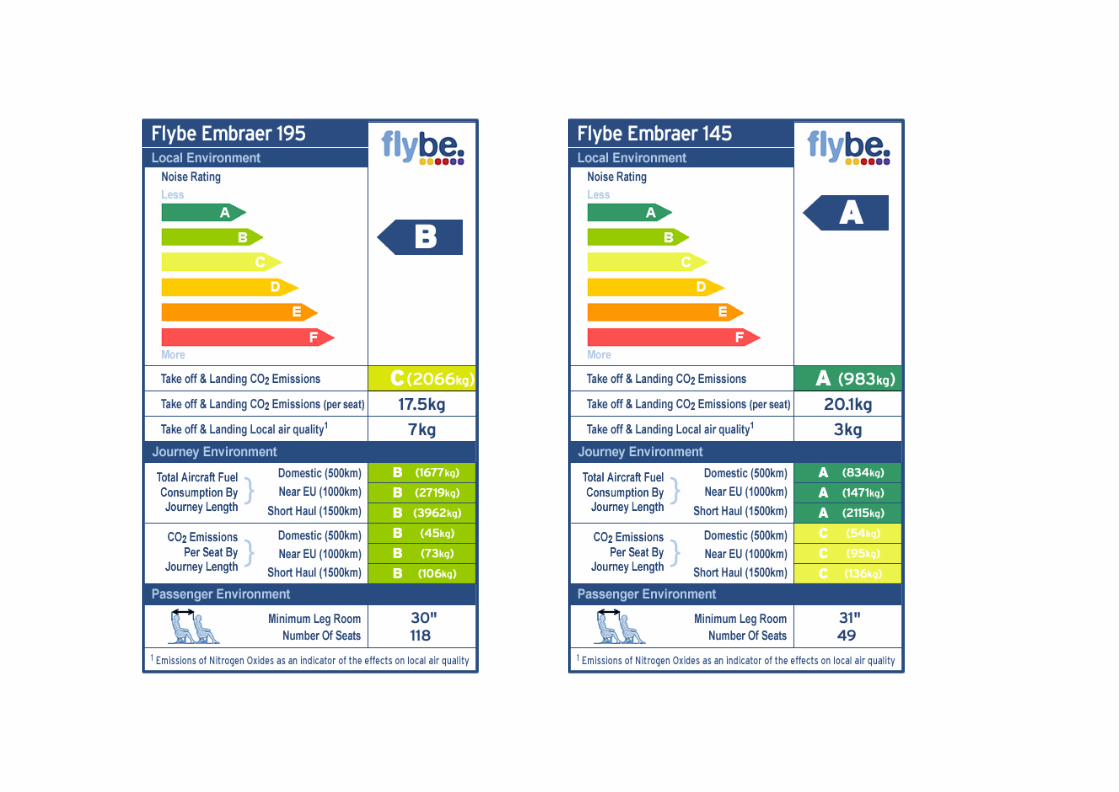
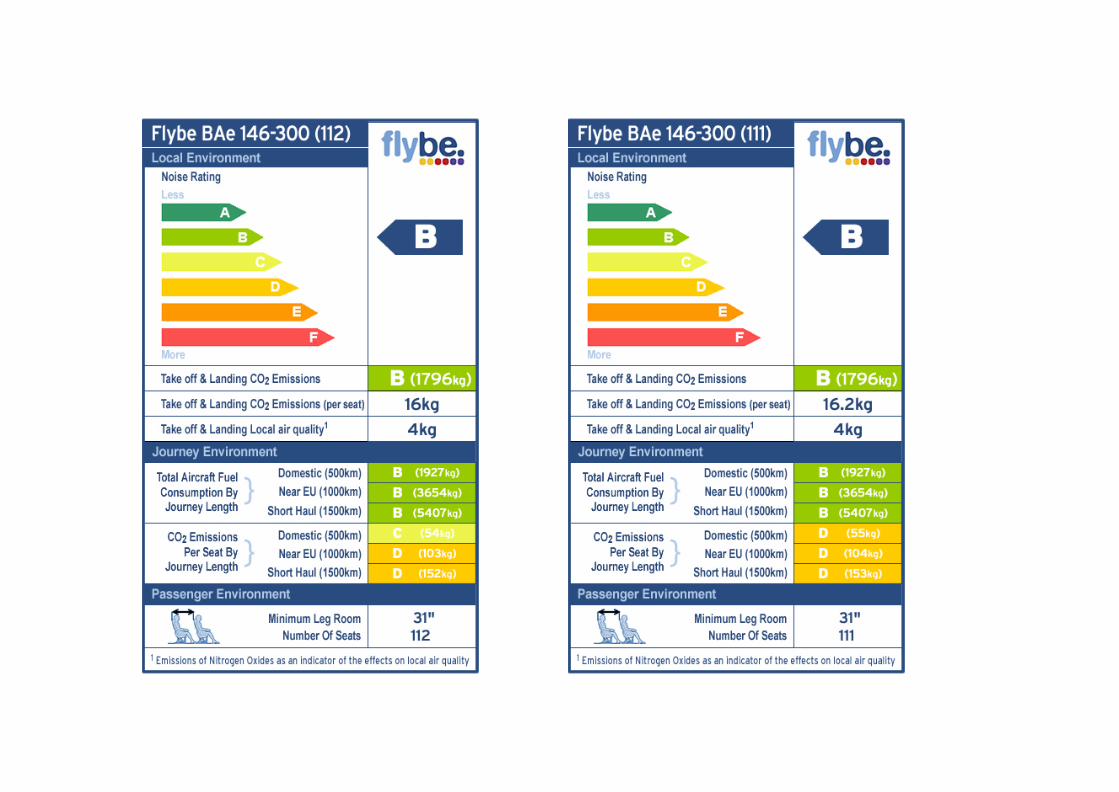
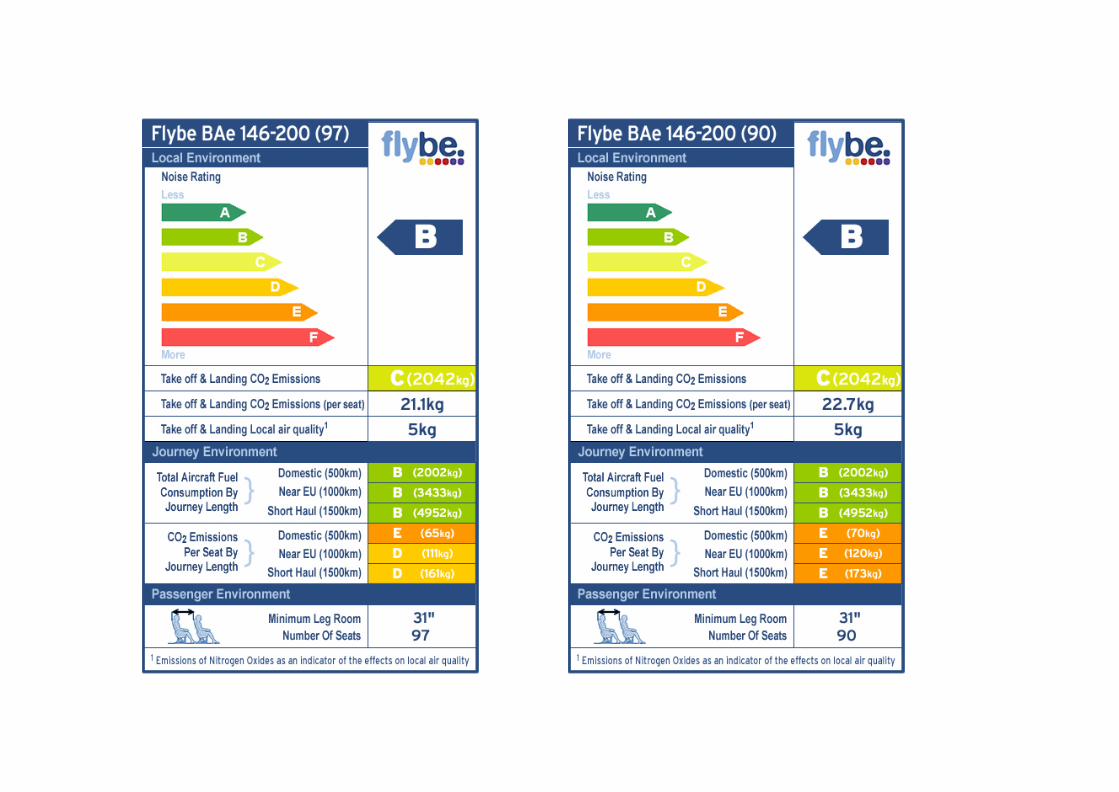
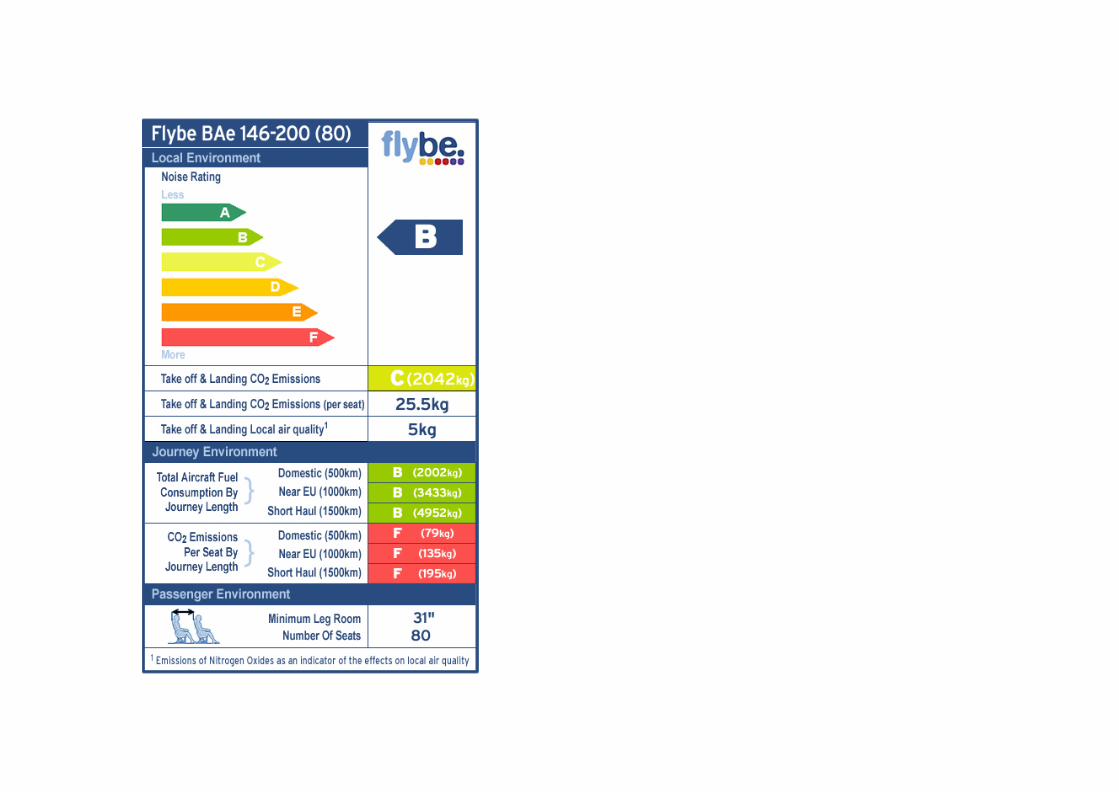
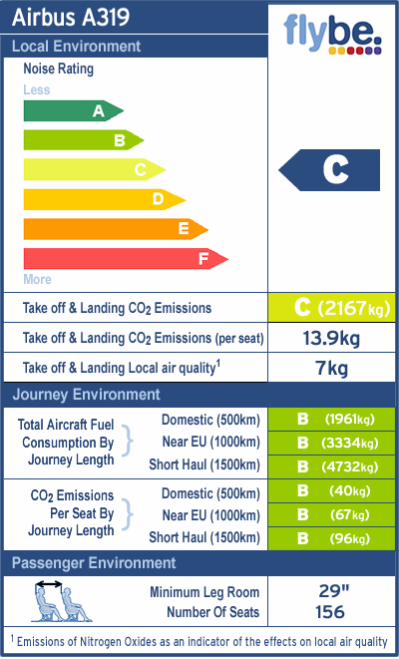
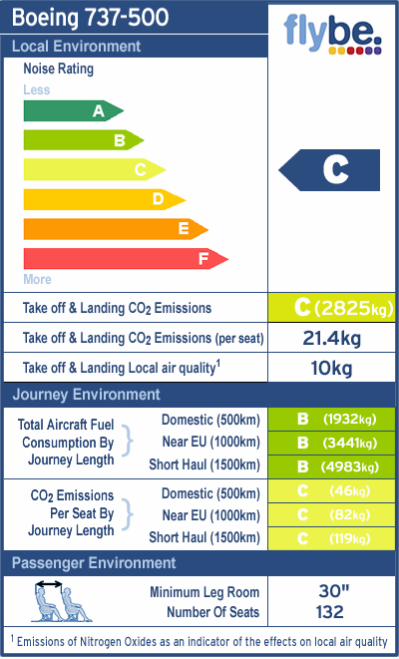
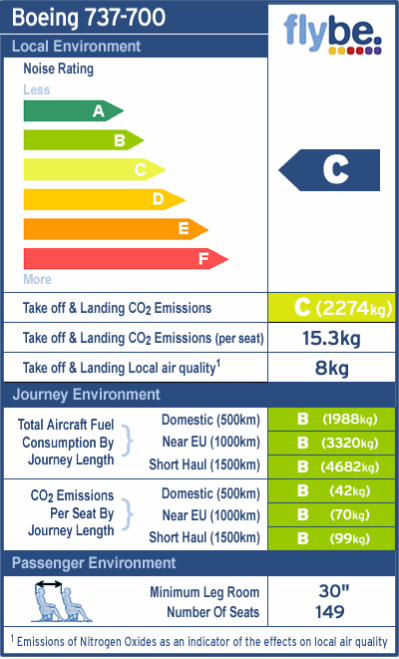
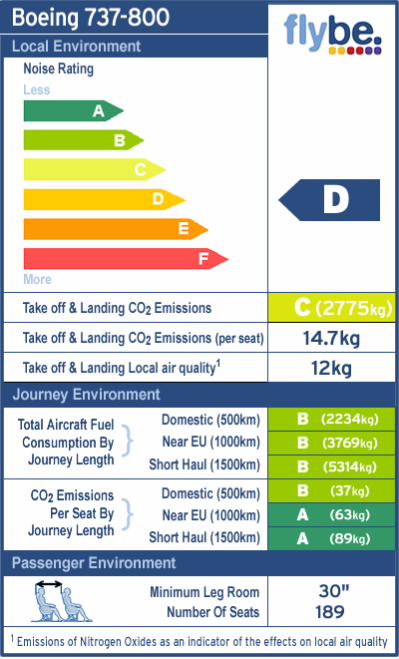
Make your own Environment Label The Environment Label describes the effects on the environment of your aircraft, that is, the effects on the local environment near airports, the effects on the global environment of the whole flight and also the passenger environment inside the cabin.
Through the Environment Label the effects of noise and emissions on communities near airports are highlighted as is the effect on climate change through emissions of carbon dioxide (CO2). These key indicators are presented alongside the passenger experience so that consumers can base their decision-making on the environmental impacts as well as passenger comfort and price.
This brief guide sets out how to prepare an Environment Label for your aircraft. Given the wide range of aircraft/engine combinations and seating configurations operated by different airlines, it is suggested that a label is prepared for each combination.
The information that follows provides a guide to ensure consistency between all Environment Labels for aircraft.
Local Environment
This section describes the effects of the aircraft at and near airports. It considers the noise on landing and take-off (LTO), emissions of carbon dioxide (CO2) and the effects on local air quality through the emissions of nitrogen oxides (NOx).
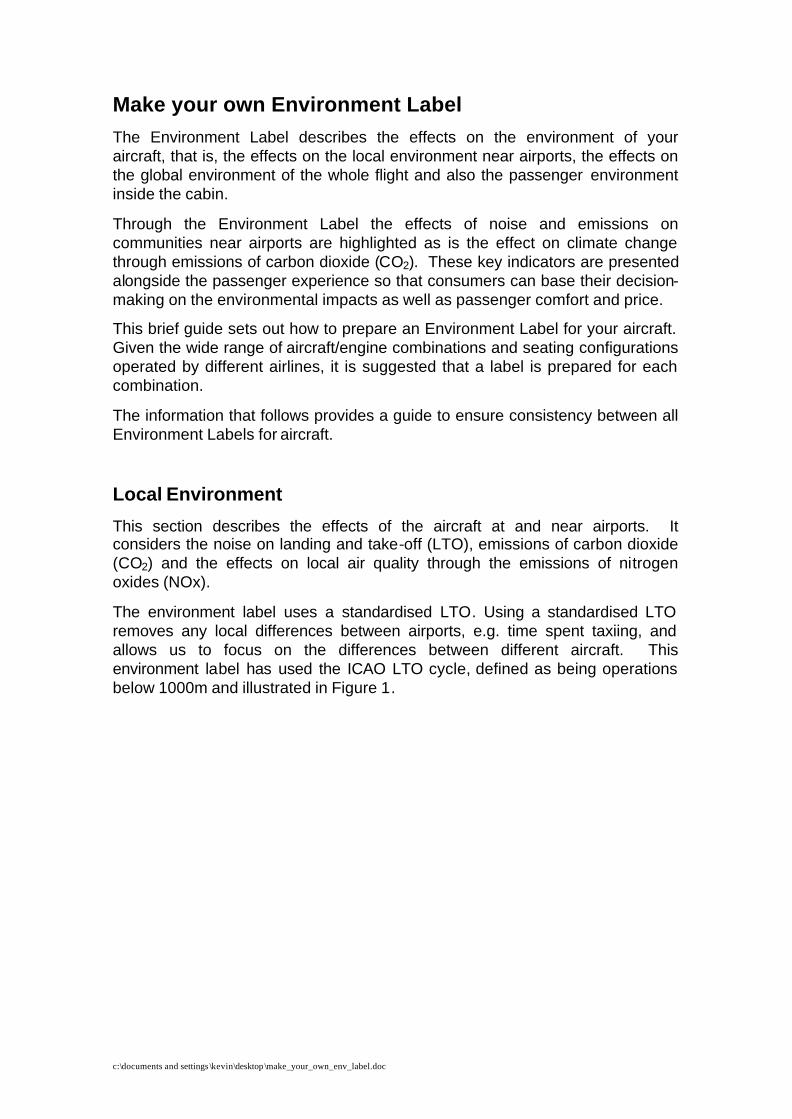
The environment label uses a standardised LTO. Using a standardised LTO removes any local differences between airports, e.g. time spent taxiing, and allows us to focus on the differences between different aircraft. This environment label has used the ICAO LTO cycle, defined as being operations below 1000m and illustrated in Figure 1.
c:\documents and settings \kevin\desktop\make_your_own_env_label.doc
Figure 1 ICAO LTO Cycle
Source: Emission Inventory Guidebook, European Environment Agency, 2001.
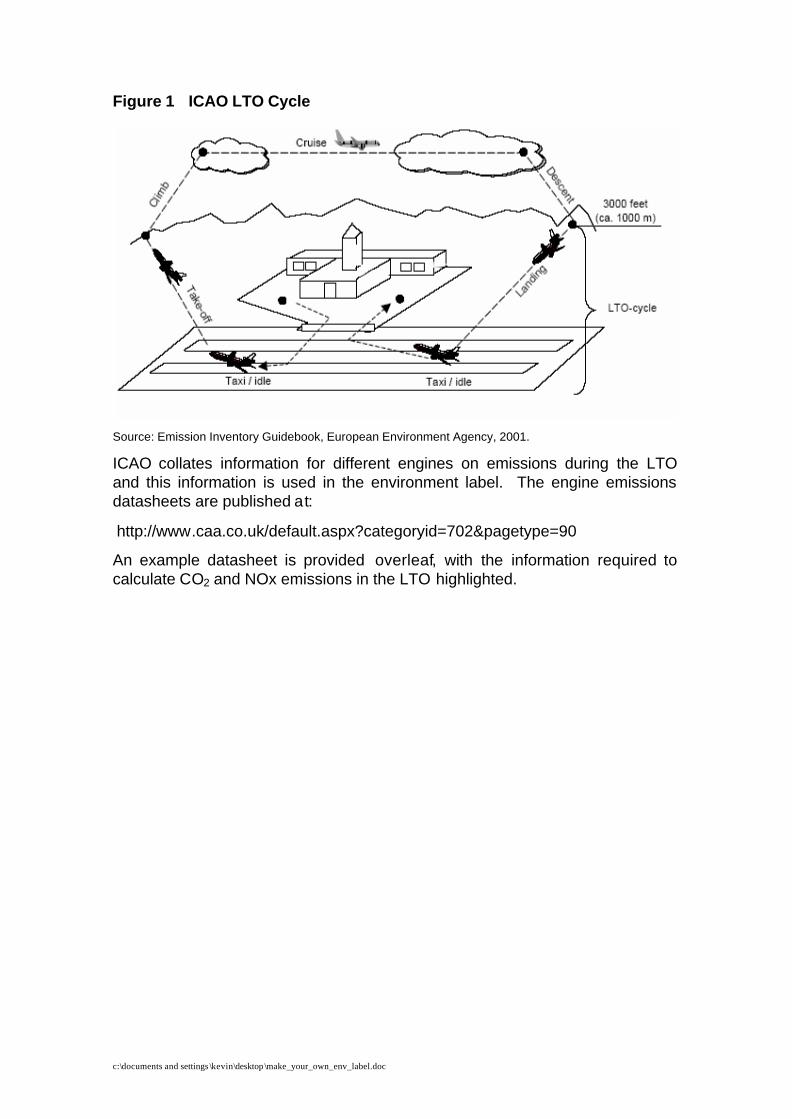
ICAO collates information for different engines on emissions during the LTO and this information is used in the environment label. The engine emissions datasheets are published at:
http://www.caa.co.uk/default.aspx?categoryid=702&pagetype=90
An example datasheet is provided overleaf, with the information required to calculate CO2 and NOx emissions in the LTO highlighted.
c:\documents and settings \kevin\desktop\make_your_own_env_label.doc
c:\documents and settings \kevin\desktop\make_your_own_env_label.doc
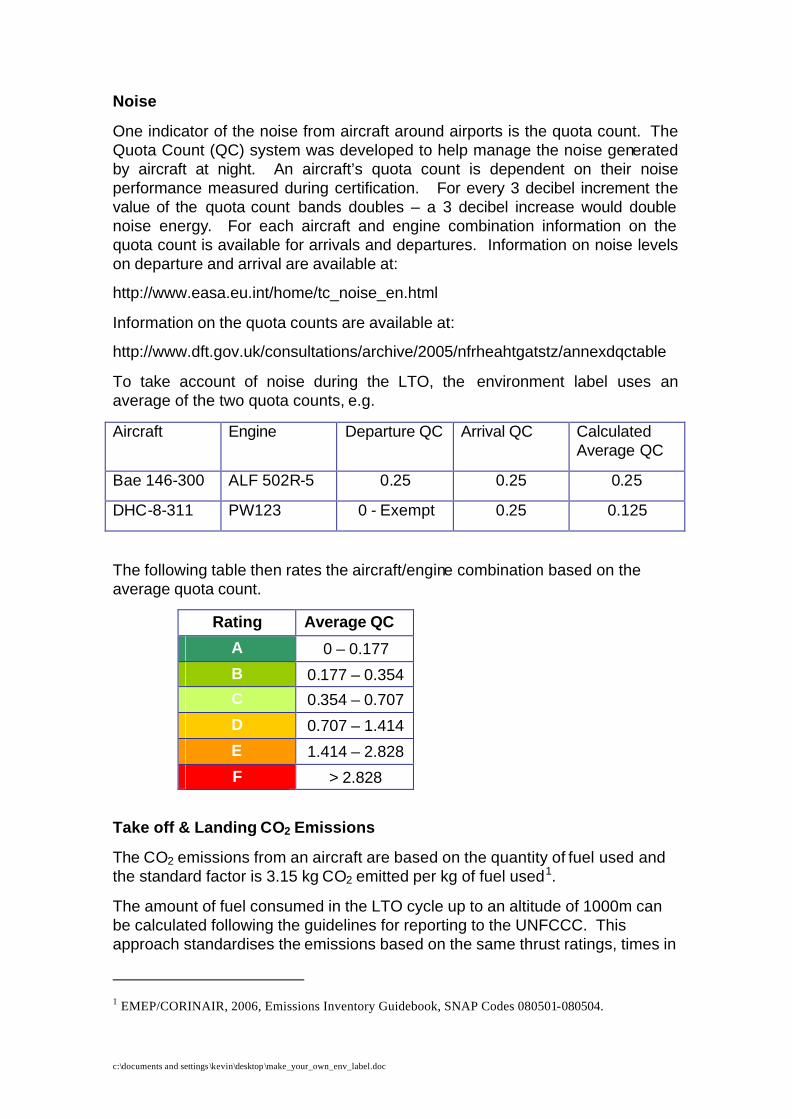
Noise
One indicator of the noise from aircraft around airports is the quota count. The Quota Count (QC) system was developed to help manage the noise generated by aircraft at night. An aircraft’s quota count is dependent on their noise performance measured during certification. For every 3 decibel increment the value of the quota count bands doubles – a 3 decibel increase would double noise energy. For each aircraft and engine combination information on the quota count is available for arrivals and departures. Information on noise levels on departure and arrival are available at:
http://www.easa.eu.int/home/tc_noise_en.html
Information on the quota counts are available at:
http://www.dft.gov.uk/consultations/archive/2005/nfrheahtgatstz/annexdqctable
To take account of noise during the LTO, the environment label uses an average of the two quota counts, e.g.
Aircraft Engine Departure QC Arrival QC Calculated Average QC
Bae 146-300 ALF 502R-5 0.25 0.25 0.25
DHC-8-311 PW123 0 - Exempt 0.25 0.125
The following table then rates the aircraft/engine combination based on the average quota count.
Rating Average QC
A 0 – 0.177
B 0.177 – 0.354 C 0.354 – 0.707
D 0.707 – 1.414
E 1.414 – 2.828
F > 2.828
Take off & Landing CO2 Emissions
The CO2 emissions from an aircraft are based on the quantity of fuel used and the standard factor is 3.15 kg CO2 emitted per kg of fuel used1.
The amount of fuel consumed in the LTO cycle up to an altitude of 1000m can be calculated following the guidelines for reporting to the UNFCCC. This approach standardises the emissions based on the same thrust ratings, times in
1 EMEP/CORINAIR, 2006, Emissions Inventory Guidebook, SNAP Codes 080501-080504.
c:\documents and settings \kevin\desktop\make_your_own_env_label.doc
mode and cabin factor. Information on the fuel consumption during the LTO is available on the Engine Emissions Datasheets available from ICAO and from engine manufacturers. Please note that the emissions are usually presented per engine and should be multiplied by the number of engines to obtain the total.
Once the total fuel consumed during the LTO has been determined, multiply by 3.15 to obtain the total CO2 emitted during the LTO.
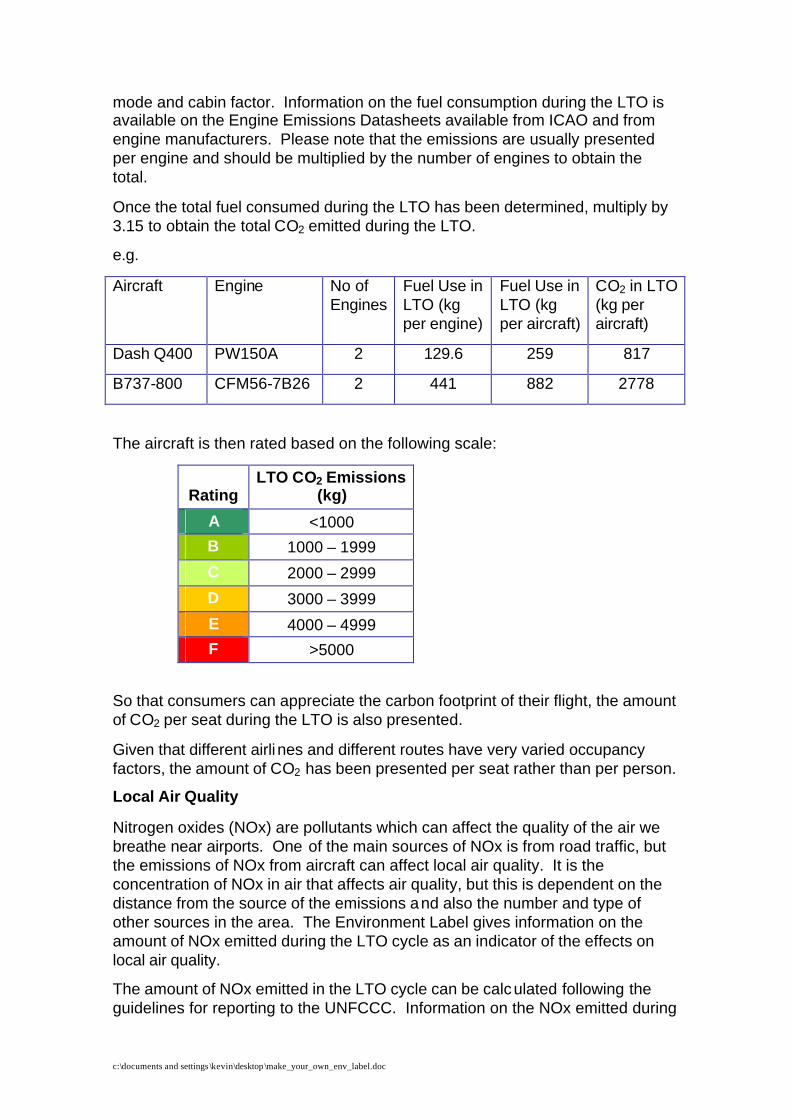
e.g.
Aircraft Engine No of Engines
Fuel Use in LTO (kg per engine)
Fuel Use in LTO (kg per aircraft)
CO2 in LTO (kg per aircraft)
Dash Q400 PW150A 2 129.6 259 817
B737-800 CFM56-7B26 2 441 882 2778
The aircraft is then rated based on the following scale:
Rating LTO CO2 Emissions
(kg)
A <1000 B 1000 – 1999
C 2000 – 2999
D 3000 – 3999
E 4000 – 4999 F >5000
So that consumers can appreciate the carbon footprint of their flight, the amount of CO2 per seat during the LTO is also presented.
Given that different airli nes and different routes have very varied occupancy factors, the amount of CO2 has been presented per seat rather than per person.
Local Air Quality
Nitrogen oxides (NOx) are pollutants which can affect the quality of the air we breathe near airports. One of the main sources of NOx is from road traffic, but the emissions of NOx from aircraft can affect local air quality. It is the concentration of NOx in air that affects air quality, but this is dependent on the distance from the source of the emissions and also the number and type of other sources in the area. The Environment Label gives information on the amount of NOx emitted during the LTO cycle as an indicator of the effects on local air quality.
The amount of NOx emitted in the LTO cycle can be calculated following the guidelines for reporting to the UNFCCC. Information on the NOx emitted during
c:\documents and settings \kevin\desktop\make_your_own_env_label.doc
the LTO is available on the Engine Emissions Datasheets available from ICAO and from engine manufacturers. Please note that the emissions are usually presented per engine and should be multiplied by the number of engines to obtain the total.
Journey Environment
This section describes the effects of the whole journey on the global environment. It considers the amount of fuel used and the effects on climate change through emissions of carbon dioxide (CO2).
The information presented under the Local Environment heading are standardised and theoretical to allow a like-for-like comparison of the effects near airports. However, we appreciate that actual operations are somewhat different to the standard ICAO model. Unlike many other industries, the aviation sector has extremely good information on the amount of fuel used by each of its aircraft over different routes. For the journey environment section, we make use of flight plan information to compare different aircraft.
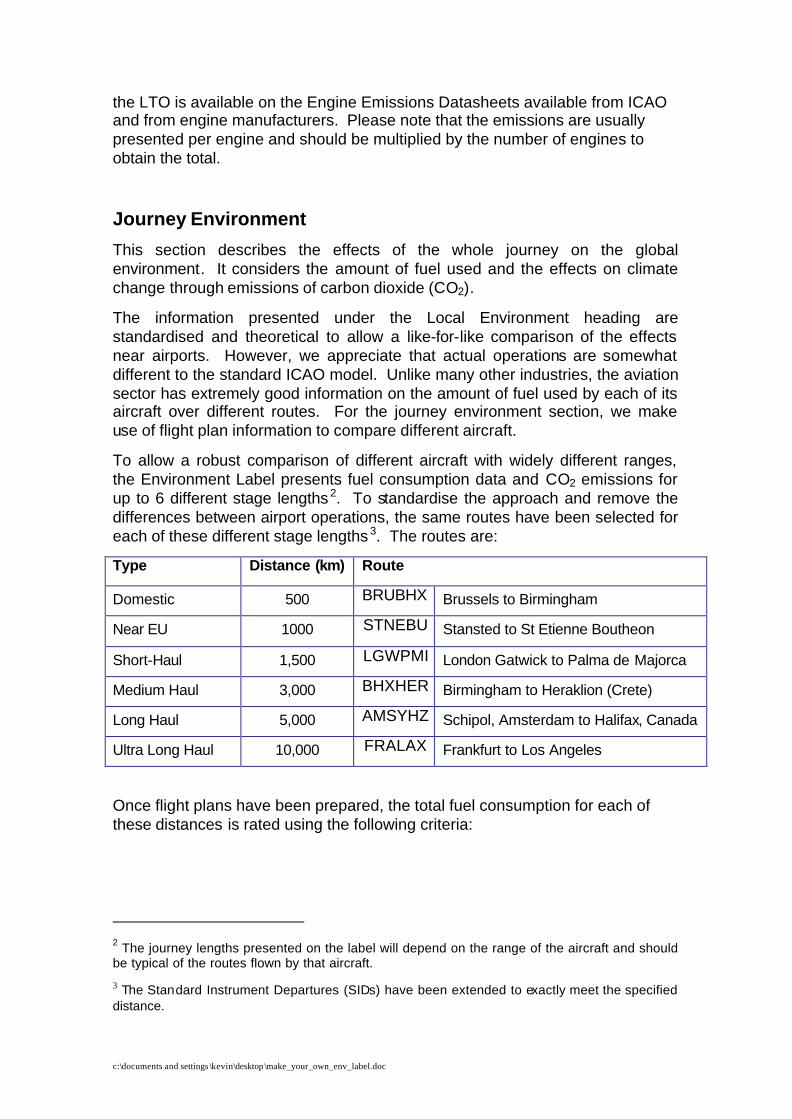
To allow a robust comparison of different aircraft with widely different ranges, the Environment Label presents fuel consumption data and CO2 emissions for up to 6 different stage lengths 2. To standardise the approach and remove the differences between airport operations, the same routes have been selected for each of these different stage lengths 3. The routes are:
Type Distance (km) Route
Domestic 500 BRUBHX Brussels to Birmingham
Near EU 1000 STNEBU Stansted to St Etienne Boutheon
Short-Haul 1,500 LGWPMI London Gatwick to Palma de Majorca
Medium Haul 3,000 BHXHER Birmingham to Heraklion (Crete)
Long Haul 5,000 AMSYHZ Schipol, Amsterdam to Halifax, Canada
Ultra Long Haul 10,000 FRALAX Frankfurt to Los Angeles
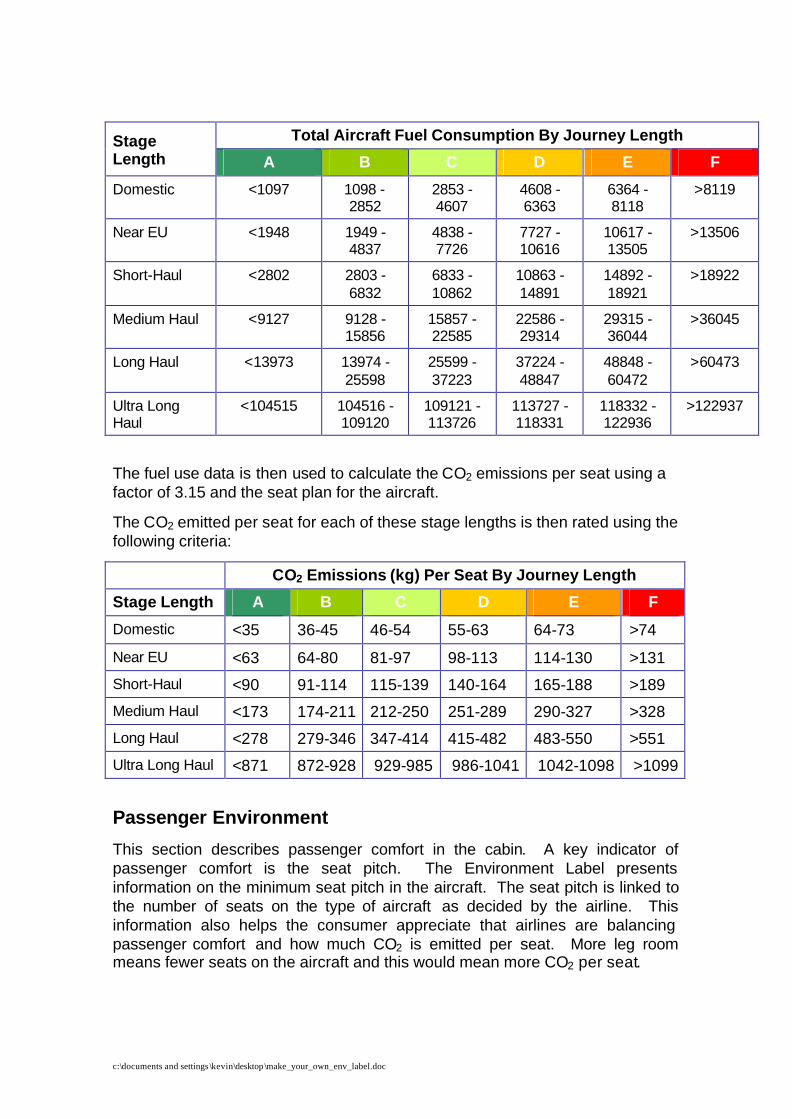
Once flight plans have been prepared, the total fuel consumption for each of these distances is rated using the following criteria:
2 The journey lengths presented on the label will depend on the range of the aircraft and should be typical of the routes flown by that aircraft.
3 The Standard Instrument Departures (SIDs) have been extended to exactly meet the specified distance.
c:\documents and settings \kevin\desktop\make_your_own_env_label.doc
Total Aircraft Fuel Consumption By Journey Length Stage Length A B C D E F
Domestic <1097 1098 -2852
2853 - 4607
4608 - 6363
6364 - 8118
>8119
Near EU <1948 1949 - 4837
4838 - 7726
7727 - 10616
10617 - 13505
>13506
Short-Haul <2802 2803 - 6832
6833 - 10862
10863 - 14891
14892 - 18921
>18922
Medium Haul <9127 9128 - 15856
15857 - 22585
22586 - 29314
29315 - 36044
>36045
Long Haul <13973 13974 - 25598
25599 - 37223
37224 - 48847
48848 - 60472
>60473
Ultra Long Haul
<104515 104516 - 109120
109121 - 113726
113727 - 118331
118332 - 122936
>122937
The fuel use data is then used to calculate the CO2 emissions per seat using a factor of 3.15 and the seat plan for the aircraft.
The CO2 emitted per seat for each of these stage lengths is then rated using the following criteria:
CO2 Emissions (kg) Per Seat By Journey Length
Stage Length A B C D E F
Domestic <35 36-45 46-54 55-63 64-73 >74
Near EU <63 64-80 81-97 98-113 114-130 >131
Short-Haul <90 91-114 115-139 140-164 165-188 >189
Medium Haul <173 174-211 212-250 251-289 290-327 >328
Long Haul <278 279-346 347-414 415-482 483-550 >551
Ultra Long Haul <871 872-928 929-985 986-1041 1042-1098 >1099
Passenger Environment
This section describes passenger comfort in the cabin. A key indicator of passenger comfort is the seat pitch. The Environment Label presents information on the minimum seat pitch in the aircraft. The seat pitch is linked to the number of seats on the type of aircraft as decided by the airline. This information also helps the consumer appreciate that airlines are balancing passenger comfort and how much CO2 is emitted per seat. More leg room means fewer seats on the aircraft and this would mean more CO2 per seat.
c:\documents and settings \kevin\desktop\make_your_own_env_label.doc
How to make your own Environment Label
The following worksheet will guide you through what information is required to produce the Environment Label and will step you through the calculations needed.
Use the criteria above to rate the environmental effects of your aircraft.
c:\documents and settings \kevin\desktop\make_your_own_env_label.doc
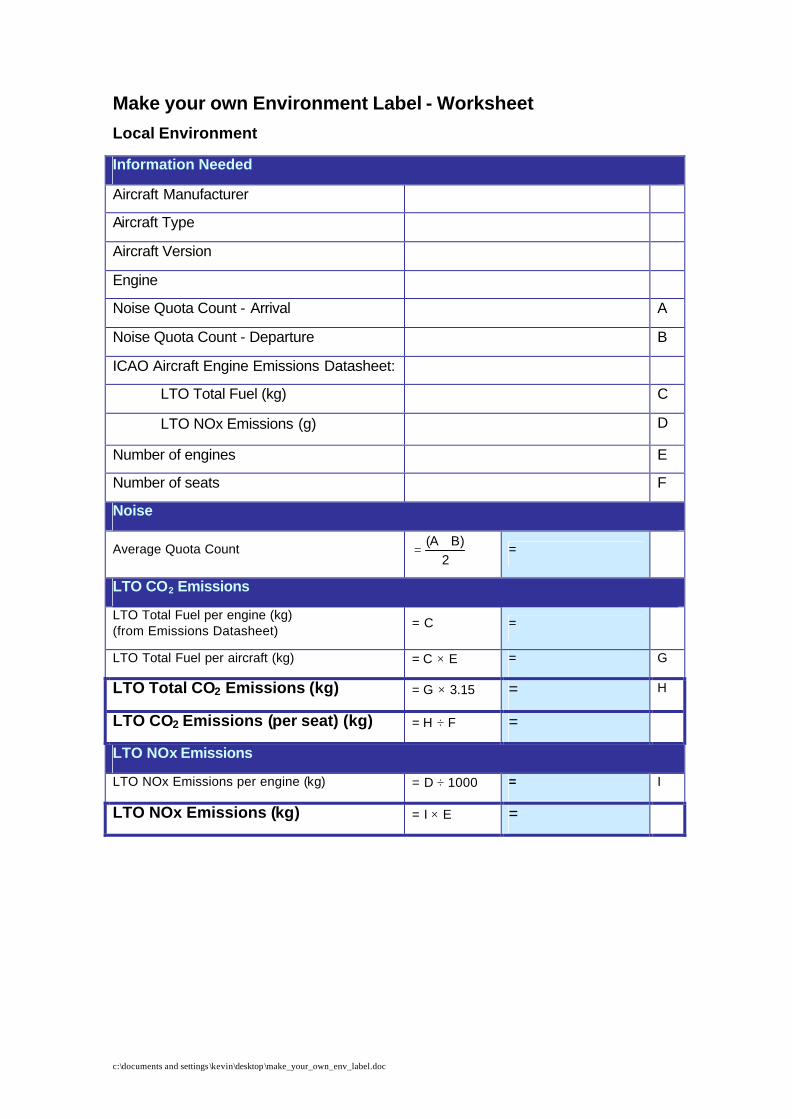
Make your own Environment Label - Worksheet
Local Environment
Information Needed
Aircraft Manufacturer
Aircraft Type
Aircraft Version
Engine
Noise Quota Count - Arrival A
Noise Quota Count - Departure B
ICAO Aircraft Engine Emissions Datasheet:
LTO Total Fuel (kg) C
LTO NOx Emissions (g) D
Number of engines E
Number of seats F
Noise
Average Quota Count 2
B)(A += =
LTO CO2 Emissions
LTO Total Fuel per engine (kg) (from Emissions Datasheet)
= C =
LTO Total Fuel per aircraft (kg) = C × E = G
LTO Total CO2 Emissions (kg) = G × 3.15 = H
LTO CO2 Emissions (per seat) (kg) = H ÷ F =
LTO NOx Emissions
LTO NOx Emissions per engine (kg) = D ÷ 1000 = I
LTO NOx Emissions (kg) = I × E =
c:\documents and settings \kevin\desktop\make_your_own_env_label.doc
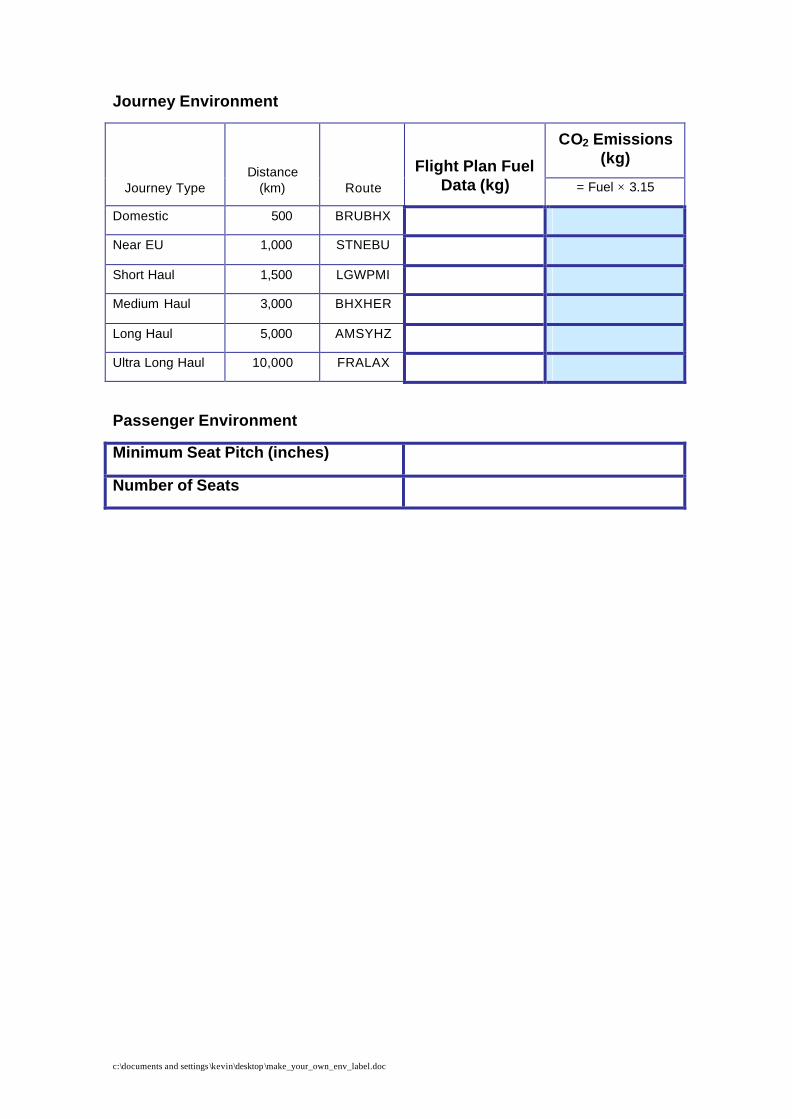
Journey Environment
CO2 Emissions (kg)
Journey Type Distance
(km) Route
Flight Plan Fuel Data (kg) = Fuel × 3.15
Domestic 500 BRUBHX
Near EU 1,000 STNEBU
Short Haul 1,500 LGWPMI
Medium Haul 3,000 BHXHER
Long Haul 5,000 AMSYHZ
Ultra Long Haul 10,000 FRALAX
Passenger Environment
Minimum Seat Pitch (inches)
Number of Seats