do tax increases on tobacco hurt the poor? some findings from south africa corné van walbeek school...
TRANSCRIPT

Do tax increases on tobacco hurt the poor? Some findings
from South Africa
Corné van WalbeekSchool of Economics
University of Cape Town

2
Background
• Tobacco control is receiving much attention internationally
• Tobacco control instruments:– Advertising ban– Clean indoor air legislation– Restrictions on sales to youth– Health awareness– Excise tax increases
• Consensus that tax increases are most effective

3
A strong inverse relationship
0
200
400
600
800
1000
12001
96
0
19
64
19
68
19
72
19
76
19
80
19
84
19
88
19
92
19
96
20
00
20
04
Re
al
pri
ce
pe
r p
ac
k o
f 2
0
( in
co
ns
tan
t 2
00
0 c
en
ts)
0
500
1000
1500
2000
2500
Cig
are
tte
co
ns
um
pti
on
(m
illi
on
s o
f p
ac
ks
)
Real price of cigarettes Consumption of cigarettes
4
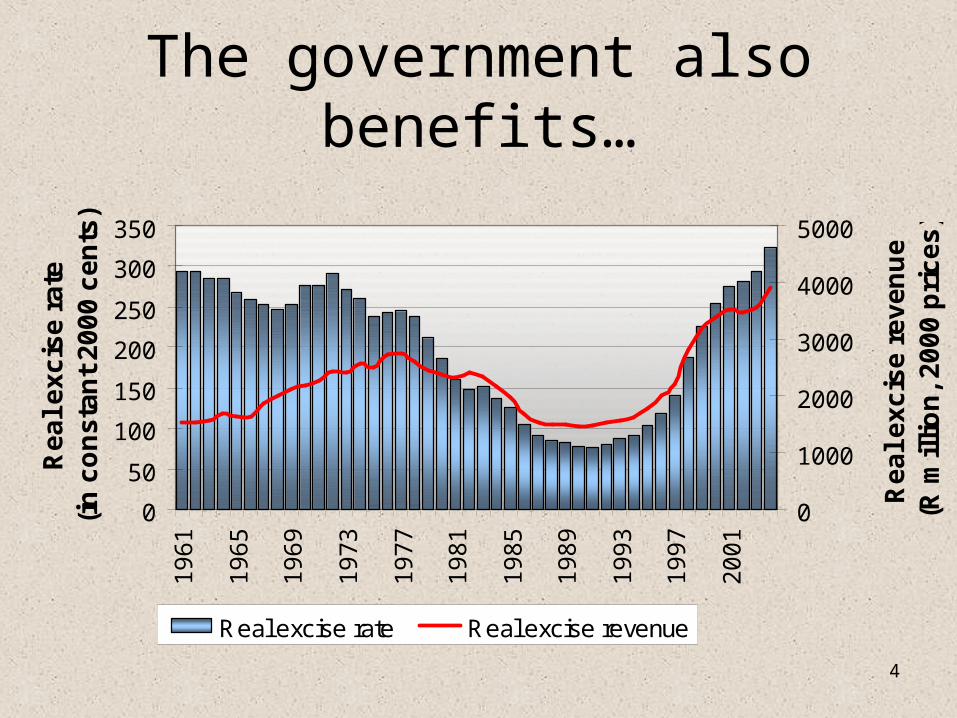
The government also benefits…
0
50
100
150
200
250
300
350
19
61
19
65
19
69
19
73
19
77
19
81
19
85
19
89
19
93
19
97
20
01
Re
al
ex
cis
e r
ate
(i
n c
on
sta
nt
20
00
ce
nts
)
0
1000
2000
3000
4000
5000
Re
al
ex
cis
e r
ev
en
ue
(R
mil
lio
n,
20
00
pri
ce
s)
Real excise rate Real excise revenue

5
One small problem….• In most countries smoking prevalence
among the poor is higher than among the rich
• The poor tend to spend a higher proportion of their income on cigarettes than the rich
• Implication: tobacco excise taxes are regressive
• Problem for tobacco control advocates: tax increases would hurt the poor

6
The tobacco control position
• Does this mean that tobacco excise taxes should be decreased because they are regressive?
• Tobacco control economists: NO• While the excise tax is regressive,
increases in the excise tax, reduces the regressivity of the excise tax
• How? Because the poor’s cigarette demand is more price sensitive than the rich
7
Aim of this paper
• Investigate the regressivity of tobacco taxation in South Africa, 1990 to 2000
• Have tobacco taxes become more or less regressive over time?

8
Methodology
• Obtain nationally representative and comparable surveys on tobacco use/expenditure
• Divide the sample into income quartiles• Calculate average percentage of
household income spent on tobacco products, by income quartile
• Estimate tax incidence by income quartile, and consider how this has changed over time

9
Finding appropriate surveys• Require at least two surveys to investigate the
impact of tobacco price and tax changes on consumption
• “Best” surveys are Income and Expenditure Surveys 1990, 1995 and 2000– 1990 IES: urban households only– 1995 and 2000 IES: urban and rural households, but
2000 IES has some very severe limitations– 2000 IES data “upscaled” to balance with national
income aggregates and national cigarette consumption
– Analysis applies to urban households only, and is based on weighted data
10
The possibility of product substitution
• Tobacco products investigated by the respective IESs:– Cigarettes– Cigars and cigarillos– Pipe and other tobacco (used for RYO
cigarettes)– Smoking requisites
• If cigarettes become too expensive people might switch to RYO cigarettes

11
Some evidence of product substitution among the poor
Cigarettes Pipe and other tobacco Other tobacco products Income quartile Q1 1990 92.5 5.1 2.4 1995 88.4 9.3 2.3 2000 77.9 18.7 3.4 Income quartile Q2 1990 94.5 2.4 3.1 1995 95.0 3.4 1.6 2000 91.1 7.1 1.8 Income quartile Q3 1990 95.5 1.6 2.9 1995 96.4 1.1 2.5 2000 96.4 2.1 1.5 Income quartile Q4 1990 94.8 1.9 3.3 1995 95.8 1.1 3.1 2000 95.0 0.9 4.1 Total 1990 94.5 2.5 3.0 1995 94.8 2.7 2.5 2000 93.0 4.1 2.9

12
Percentage of urban households spending money on cigarettes Percentage of households Change in percentage
1990 1995 2000 1990-1995 1995-2000
Cigarettes
Q1 46 42 22 -4 -20 Q2 54 46 31 -8 -15 Q3 51 45 34 -6 -11 Q4 43 44 34 +1 -10 African 48 41 25 -7 -16 Coloured 66 58 47 -8 -11 Indian 61 50 40 -11 -10 White 44 44 38 0 -6 Total 49 44 30 -5 -14

13
Average percentage of household income spent on tobacco excise taxes,
for urban smoking households only
Cigarettes All tobacco products 1990 1995 2000 1990 1995 2000 Q1 1.71 1.79 3.17 1.74 1.68 2.87 Q2 1.54 1.29 2.84 1.57 1.29 2.71 Q3 0.96 1.06 2.61 0.99 1.06 2.57 Q4 0.49 0.66 1.53 0.51 0.66 1.55 African 1.62 1.28 2.77 1.65 1.27 2.57 Coloured 1.33 1.36 2.56 1.37 1.36 2.57 Indian 1.10 0.91 2.03 1.11 0.93 2.03 White 0.76 1.02 1.67 0.79 1.02 1.70 Total 1.19 1.19 2.52 1.22 1.19 2.44

14
Relative incidence of the tobacco excise tax, for urban smoking households only
Cigarettes All tobacco products 1990 1995 2000 1990 1995 2000 Q1 144 150 126 142 141 118 Q2 129 108 113 128 108 111 Q3 80 89 104 81 89 106 Q4 41 55 61 42 55 63 African 136 108 110 135 106 105 Coloured 112 114 102 112 114 105 Indian 93 77 81 91 78 83 White 64 85 66 64 86 70 Total 100 100 100 100 100 100

15
But what about the quitters?
• The rate of quitting was not the same for all income quartiles and racial groups
• To account for quitting, we recalculated the average tax incidence percentages for all households that bought tobacco products in 1990

16
Relative incidence of the excise tax, for the proportion of urban households that were
smoking in 1990
Cigarettes All tobacco products 1990 1995 2000 1990 1995 2000 Q1 144 153 98 143 159 116 Q2 129 103 106 129 99 102 Q3 81 88 113 81 84 101 Q4 41 63 78 42 59 72 African 136 102 94 135 102 94 Coloured 112 112 118 112 119 122 Indian 92 70 86 91 66 75 White 64 95 93 65 91 84 Total 100 100 100 100 100 100

17
Conclusion
• Tobacco excise taxes in South Africa were regressive but have become less regressive
• Many poor households have quit smoking during the 1990s because it became unaffordable
• Substitution to RYO tobacco among the poor distorts the picture slightly for cigarettes, but does not alter the main conclusions

18
End of presentation

19
Backup slides

20
Percentage of urban households spending money on tobacco products
(not only cigarettes)
Percentage of households Change in percentage 1990 1995 2000 1990-1995 1995-2000 Q1 48 52 34 +4 -18 Q2 56 49 37 -7 -12 Q3 52 47 36 -5 -11 Q4 44 45 36 +1 -9 African 50 46 32 -4 -14 Coloured 67 67 56 0 -11 Indian 62 50 40 -12 -10 White 45 46 39 +1 -7 Total 50 48 36 -2 -12
21
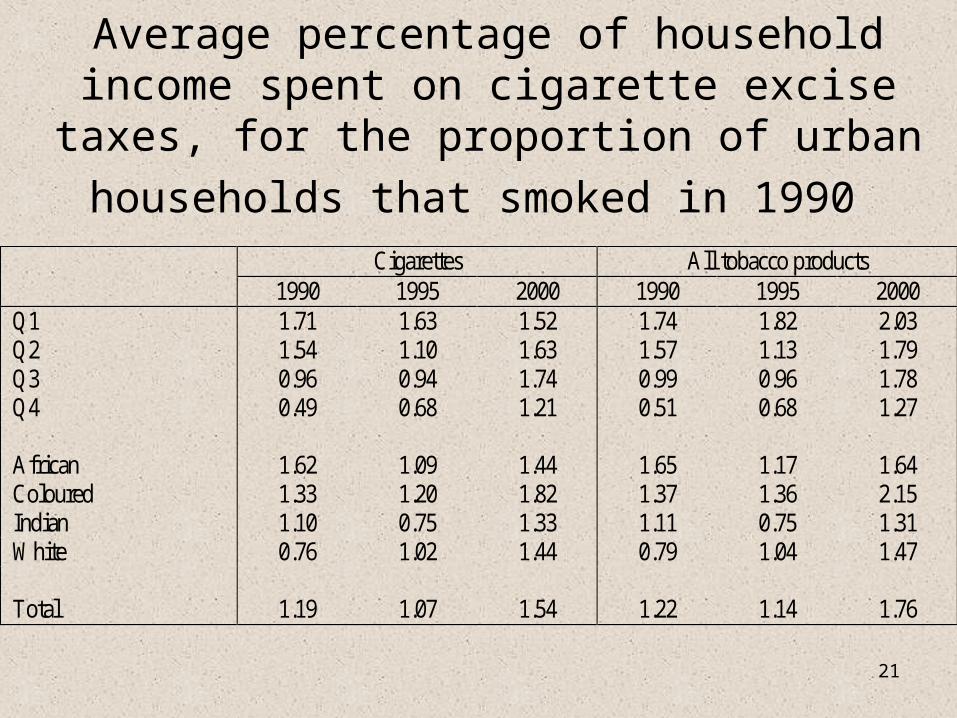
Average percentage of household income spent on cigarette excise taxes, for the proportion of
urban households that smoked in 1990
Cigarettes All tobacco products 1990 1995 2000 1990 1995 2000 Q1 1.71 1.63 1.52 1.74 1.82 2.03 Q2 1.54 1.10 1.63 1.57 1.13 1.79 Q3 0.96 0.94 1.74 0.99 0.96 1.78 Q4 0.49 0.68 1.21 0.51 0.68 1.27 African 1.62 1.09 1.44 1.65 1.17 1.64 Coloured 1.33 1.20 1.82 1.37 1.36 2.15 Indian 1.10 0.75 1.33 1.11 0.75 1.31 White 0.76 1.02 1.44 0.79 1.04 1.47 Total 1.19 1.07 1.54 1.22 1.14 1.76

22
End