do south-south trade agreements increase trade? commodity-level ... · do south-south trade...
TRANSCRIPT

WP/07/40
Do South-South Trade Agreements Increase Trade? Commodity-Level
Evidence from COMESA
Anna Maria Mayda and Chad Steinberg


© 2007 International Monetary Fund WP/07/40
IMF Working Paper
African and Research Departments
Do South-South Trade Agreements Increase Trade? Commodity-Level Evidence from COMESA
Prepared by Anna Maria Mayda and Chad Steinberg1
Authorized for distribution by Roger Nord and Shang-Jin Wei
February 2007
Abstract
This Working Paper should not be reported as representing the views of the IMF. The views expressed in this Working Paper are those of the author(s) and do not necessarily represent those of the IMF or IMF policy. Working Papers describe research in progress by the author(s) and are published to elicit comments and to further debate.
South-South trade agreements are proliferating: Developing countries signed 70 new agreements between 1990 and 2003. Yet the impact of these agreements is largely unknown. This paper focuses on the static effects of South-South preferential trade agreements stemming from changes in trade patterns. Specifically, it estimates the impact of the Common Market for Eastern and Southern Africa (COMESA) on Uganda’s imports between 1994 and 2003. Detailed import and tariff data at the 6-digit harmonized system level are used for more than 1,000 commodities. Based on a difference-in-difference estimation strategy, the paper finds that—in contrast to evidence from aggregate statistics—COMESA’s preferential tariff liberalization has not considerably increased Uganda’s trade with member countries, on average across sectors. The effect, however, is heterogeneous across sectors. Finally, the paper finds no evidence of trade-diversion effects. JEL Classification Numbers: F13, F14, F15, O24 Keywords: South-South trade agreements, trade creation, trade diversion Author(s) E-Mail Addresses: [email protected]; [email protected]
1 Anna Maria Mayda (Georgetown University) worked on this project during her stay as a resident scholar at the Trade Unit of the Research Department of the International Monetary Fund from January–July 2004. She would like to thank the Trade Unit for all the resources it provided. The authors would also like to thank Mary Amiti, Rod Ludema, John Romalis, Shang-Jin Wei, and participants at the IMF Research Department Lunch Seminar and at the SEA Annual Meetings for useful comments. Finally, the authors are grateful for research assistance provided by Utku Kumru.

2
Contents Page
I. Introduction ............................................................................................................................3
II. Literature ...............................................................................................................................5
III. Trade Creation and Trade Diversion....................................................................................6
IV. Data......................................................................................................................................7
V. Empirical Strategy and Results .............................................................................................9 A. Benchmark Estimators ............................................................................................11 B. Difference-in-Difference Estimator ........................................................................13 C. Robustness Checks..................................................................................................14 D. Trade Diversion.......................................................................................................16
VI. Conclusions........................................................................................................................17 Appendix Tables I. Uganda’s Preferential Tariff Rates by 2-digit 1996 HS Codes, 1994 and 2003 ..................25 II. Uganda’s MFN Tariff Rates by 2-digit 1996 HS Codes, 1994 and 2003 ...........................27 III. Uganda’s Imports by Country of Origin, 1994 and 2003 ..................................................29 References................................................................................................................................33 Figures 1. Uganda: Imports and Tariff Revenue (percent of GDP),1986–2003...................................18 2. Uganda: Imports from Developing Countries (percent of GDP),1986–2003......................18 Tables 1. Summary Statistics for Uganda vis-à-vis COMESA Countries (1994–2003).....................19 2. Summary Statistics for Uganda vis-à-vis non-COMESA Countries (1994–2003) .............19 3. Pattern of Protection in Uganda in 1994 and 2003 Under the Preferential Trade Agreements (PTA in 1994 and COMESA in 2003) ................................................................20 4. Pattern of Protection in Uganda in 1994 and 2003 vis-à-vis the Rest of the World (MFN Tariff Rates) .............................................................................................................................20 5. Estimates Based on Uganda Imports in 1994, 2000, 2001, 2002, and 2003 .......................21 6. Estimates Based on Uganda Imports in 1994, 2000, 2001, 2002, and 2003 .......................22 7. Robustness Checks...............................................................................................................23 8. Estimates of Trade Diversion Based on Uganda Imports from Non-COMESA Countries in 1994, 2000, 2001, 2002, and 2003...........................................................................................24

3
I. INTRODUCTION
The number of preferential trade agreements (PTAs) between low-income countries—so-called South-South trade agreements—, has increased dramatically in the last decade. Indeed, between 1990 and 2003, low-income countries signed 70 new PTAs (WTO, 2003). South-South arrangements account for more than 50 percent of all new trade agreements. Important examples of such arrangements include the Southern Cone Common Market (MERCOSUR) in South America and the Common Market for Eastern and Southern Africa (COMESA) in Africa. Countries that are both poor and small frequently enter into PTAs; Africa alone has 30 such arrangements (Yang and Gupta, 2005). Many PTA member countries belong to more than one agreement, resulting in competing demands. While increasingly popular, South-South PTAs between small countries may not yield significant economic gains for their members. South-South PTAs are more likely to give rise to trade diversion rather than trade creation. In addition, pro-competitive effects for local firms arising from greater competition and dynamic efficiency gains linked to economies of scale are unlikely, as partner countries are usually both poor and small. Moreover, fiscal revenues in low-income countries are more vulnerable to trade reforms (see section III). The empirical evidence of trade effects in PTAs is mixed (see section II). Papers in this literature, in general, use country-level data, and capture the impact of preferential trade agreements by introducing a PTA dummy variable in a gravity-model framework. The dummy variable, however, is endogenous, since the decision to create or join an agreement is not random. In addition, aggregate data masks commodity-level heterogeneity, which may also bias the estimates. Clausing (2001) and Romalis (2005) eliminate some of these problems by using commodity-level data to analyze the effects of the North American Free Trade Agreement (NAFTA) and the Canada–United States Free Trade Agreement (CUSFTA). To the best of our knowledge, this paper is the first to apply their empirical strategy to a South-South trade agreement. Specifically, we focus on the static effects of COMESA resulting from changes in trade patterns. By exploiting the variation in the data across commodities, origin countries, and time, we estimate the impact of COMESA-related preferential trade liberalization on Uganda’s imports between 1994 and 2003. We also investigate whether these changes stem from trade creation or trade diversion. The analysis here focuses on COMESA, as it is a good example of a South-South preferential trade agreement involving small economies. All member countries are truly small in the context of the world economy, and the agreement has been in effect since 1994. Within COMESA, we analyze the impact of preferential liberalization on Uganda’s trade patterns as Uganda represents a relatively stable economy during this time period. Using a difference-in-difference estimation strategy, we show that reductions in the preferential tariff rate applied by Uganda to other COMESA member countries did not considerably increase Uganda’s imports from such countries. In other words, Ugandan consumers on average across the sectors examined have been reluctant to switch the origin of their purchases to COMESA countries following the advent of the COMESA agreement.
4
According to our findings, the elasticity of imports with respect to tariff rates is between 14 percent and 16 percent. In addition, the elasticity of substitution between varieties of the same good from different origin countries is approximately 1.7. The magnitude of these effects is relatively small, compared with the results from previous studies for the United States and Canada within CUSFTA and NAFTA (Clausing, 2001; Romalis, 2005). Romalis’s estimate for Mexican imports, however, is closer to our estimate for Uganda. This difference could mean that consumers in low-income countries, in general, have relatively inelastic demand curves and are thus less likely to benefit immediately from trade reform. Search costs may partly explain the reluctance of low-income consumers to switch the origin of their purchases from one country to another. The results, however, are also consistent with the most important criticism of South-South PTAs—that is, because member countries are not natural trading partners, such agreements are unlikely to produce substantial increases in trade volumes. The finding that COMESA’s effect on Uganda’s imports is heterogeneous across sectors supports this interpretation. In particular, the industries that experienced larger and statistically significant increases in trade volume were those in which developing countries tend to have a comparative advantage. The elasticity estimates withstand a number of robustness checks. One concern is that COMESA-related reductions in tariff rates might have been offset by an increase in nontariff barriers on the same commodities. For example, after COMESA’s initial implementation, Uganda imposed ad valorem excise taxes on selected goods that tended to be produced by COMESA countries. Such an offsetting effect is unlikely, given that we partially account for nontariff barriers by using data on import excise taxes. Political economy factors are also unlikely to affect the results because our main specification controls for both time-invariant political-economy factors and political-economy factors that change over time that are common across member and nonmember countries. In addition, the findings are not overturned by a triple-difference estimation strategy that controls for factors that change over time and are specific to each import country (a robustness check that follows Romalis, 2005). Lastly, the results grow more robust when we consider the possible impact of tax evasion on recorded imports, as documented by Fisman and Wei (2004).2 Finally, the empirical analysis investigates whether Uganda’s small increase in trade volumes following COMESA reflects trade-creation or trade-diversion effects. We find no evidence that Uganda’s imports from non-COMESA countries shrunk after the start of the agreement. Thus, COMESA’s small but positive effects on trade volumes appear to be associated with trade creation. Notice that this result is not consistent with the expectation in the literature that South-South PTAs imply trade diversion. As a final point, although we conclude that the trade effects are minimal, it is important to note that even small increases could represent a marked improvement for small, low-income countries in Sub-Saharan Africa. 2 One reason why recorded imports are low when tariffs are high is tax evasion. Thus, when tariffs come down, a corresponding increase in imports might partly reflect an increase in recorded (as opposed to actual) imports due to reduced tax evasion.

5
II. LITERATURE
Empirical work on preferential trade agreements is extensive. In general, these studies are either ex ante computable-general-equilibrium (CGE) studies (see Baldwin and Venables, 1995, for a survey of such work) or ex post empirical studies. The ex post analyses can be further divided into studies using aggregate-level data and those using either sector-level or commodity-level data. The ex post studies drawing on aggregate-level data capture the impact of preferential trade agreements by introducing a PTA dummy variable in a gravity-model framework (e.g., Frankel and Wei, 1995).3 Although these papers generally find that PTAs boost trade volumes, the estimated effects are likely biased due to endogeneity and reverse causality concerns. Such bias mainly arises because the decision to create or join an agreement usually is not random. For example, high trade volumes increase the likelihood that countries will enter into an agreement. To address this concern, Magee (2003) models the PTA dummy variable as endogenous in a gravity-type equation. He finds that, once endogeneity is taken into account, the impact of PTAs on trade patterns is unstable and at times not positive across different specifications. Many studies on South-South PTAs and on African PTAs, in particular, use the pre-Magee (2003) gravity-type approach and thus may be subject to endogeneity concerns (for example, Cernat 2001; and Subramanian and Tamirisa, 2001). Cernat (2001) finds that COMESA has produced net trade-creation effects with no evidence of trade diversion.4 Subramanian and Tamirisa (2001), however, find a negative block effect for COMESA countries before the formation of the agreement. In 1990, COMESA members traded significantly less goods with each other than did the average pair of countries in the sample. This finding suggests that COMESA countries are not natural trading partners and that the agreement is more likely to lead to trade diversion.5 The second subset of ex post studies employs sector-level and commodity-level trade data to help overcome some of the limitations of the gravity-type approach (Clausing 2001; Krueger 1999, 2000; Romalis, 2005; Yeats 1998a, 1998b). Clausing (2001) estimates the effect of CUSFTA on trade flows from Canada to the United States, and Romalis (2005) estimates the impact of NAFTA and CUSFTA on member countries’ imports using a triple-difference estimation technique.6 Clausing finds no evidence of trade diversion as a result of CUSFTA. Romalis, in contrast, finds evidence of trade-diversion effects on member countries’ imports. In addition, he finds that import demand in the United States and Canada—two large, 3 The empirical approach of this early literature was of course limited by the fact that, at the time these papers were written, commodity-level data were not easily accessible. 4 To differentiate between trade creation and trade diversion, Cernat (2001) introduces two dummy variables: one that captures whether two countries belong to the same PTA, and one that captures whether one country belongs to a PTA while the other does not. 5 Other studies using aggregate data to analyze African trade patterns are Foroutan and Pritchett (1993), Coe and Hoffmaister (1999), Rodrik (1999), and Subramanian and others (2000). 6 This triple-difference estimation strategy is equivalent to what we use in thee last column of Table 7.

6
developed countries—are highly sensitive to tariff movements. By contrast, he finds that import demand in Mexico—a poorer, less-developed nation—are fairly inelastic, consistent with our findings for Uganda. In addition, based on estimated elasticities of total export supply, Romalis finds evidence that NAFTA and CUSFTA had a modest effect on border prices and welfare. From a methodological viewpoint, our paper is most closely related to Clausing (2001) and Romalis (2005). To the best of our knowledge, we are the first in the literature to apply their empirical strategy to a South-South trade agreement. Our paper is also closely related to recent works in the literature estimating import demand elasticities (Kee, Nicita, and Olarreaga, 2005) and elasticities of substitution (Broda and Weinstein, 2004).
III. TRADE CREATION AND TRADE DIVERSION
The welfare impact of PTAs is unclear. As first stated by Viner (1950), preferential trade liberalization can either result in inefficient, high-cost domestic production being supplanted by low-cost imports from member countries (i.e., trade creation) or in efficient, low-cost imports from nonmember countries being replaced with less-efficient imports from member countries (i.e., trade diversion). Consider the case of a small-open economy: If trade creation occurs as a result of a PTA, the agreement is welfare-improving. If trade diversion occurs, the effect on welfare through changes in trade patterns is unclear.7 In the case of large open economies, terms-of-trade changes make it harder to sign the net welfare effect of PTAs. However, our focus on COMESA, which involves small open economies,8 allows us to abstract from terms-of-trade changes.9 The difference between trade creation and trade diversion is also relevant from a political-economy point of view. Preferential trade agreements that result in trade creation are more likely to be building blocks for multilateral trade negotiations. Indeed, policymakers can build consensus around the visible gains of partial trade liberalization. By contrast, industries characterized by trade diversion—in which imports from PTA member countries replace imports from more efficient nonmember countries—could deter further multilateral free trade efforts. In such industries, the threat of direct competition with more efficient producers in
7 The case of trade diversion of preferential tariff liberalization for a small open economy (SOE) is, in welfare terms, very similar to the case of nondiscriminatory tariff liberalization for a large open economy (LOE). In both situations, the net welfare effect is ambiguous due to the change of border prices faced by the country. However, in the PTA SOE case with trade diversion, the change of border prices is due to the discriminatory nature of the PTA. In the LOE case of nondiscriminatory trade liberalization, the change of border prices is driven by a terms-of-trade effect. 8 Given the small-open-economy assumption—that is, infinite export supply elasticity—shifts in Uganda’s import demand caused by preferential trade liberalization do not affect border prices. 9 Besides the static effects of PTAs through changes in trade patterns, additional welfare effects include the impact of PTAs on imperfectly competitive markets and their dynamic effects. See Baldwin and Venables (1995) for a complete survey. In this paper, we focus only on the static effects of PTAs that take place through changes in trade patterns.

7
nonmember countries could create greater resistance to global free trade (Krishna, 1998; Krueger, 1999). The welfare effects occurring through trade creation and trade diversion—as well as through other channels—imply that South-South PTAs involving small countries are the least likely to produce gains for their members for several reasons. First, developing countries typically are not natural trading partners, as evidenced by the fact that they trade little with each other as a share of total imports.10 For example, the 2001 share of African imports from other African countries was approximately 9 percent (IMF, 2002). The reason is that low-income countries tend to have similar relative factors supplies, therefore the incentive to trade with each other is smaller than for dissimilar countries. In other words, developing countries tend to have a comparative advantage in the same sectors; therefore, they generally are not low-cost producers of goods imported by other developing countries. By this reasoning, South-South trade agreements are likely to lead to trade diversion as opposed to trade creation, if any increase in imports occurs at all. From a political-economy point of view, trade diversion in turn implies a stumbling-block effect of South-South trade agreements for multilateral trade liberalization. Second, low-income and small PTA partner countries are less likely to produce efficiency gains linked to economies of scale and to trigger pro-competitive effects for local producers. The reason is that South-South PTAs offer their members access to smaller markets than do North-South agreements. In addition, firms in PTA member countries with developing economies may not be much more efficient than home firms. Therefore, competitive pressure on domestic producers may not be very strong. Finally, because trade taxes constitute a large proportion of developing countries’ domestic revenues, the loss of tariff revenue may hurt a developing country’s fiscal position more than a developed country’s. In Uganda, for example, tariff revenue declined significantly (by 8 percent of GDP) after the inception of COMESA (Figure 1). For these and other reasons, some researchers think developing countries gain more economically from North-South PTAs than from South-South PTAs (Schiff, 1997; Schiff and Winters, 2003).11
IV. DATA
We use commodity-level import and tariff data at the 6-digit Harmonized System level. Import statistics by origin country come from the COMTRADE database, developed by the United Nations Statistics Division. Data on preferential and most favored nation (MFN) tariff rates as well as import excise taxes are from TRAINS, developed by UNCTAD. We access both data sets through the World Integrated Trade Solution (WITS) system, designed by the World Bank. 10 On the other hand, low trade volumes between developing countries may reflect mutually high trade barriers. 11 For example, consider the following quote from Schiff and Winters (2003): “One of the main themes of this book is our preference for North-South over South-South RIAs for developing countries. If a developing country is going to pursue regionalism, it will almost always do better to sign up with a large rich country than with a small poor one. In trade terms, a large rich country is likely to be a more efficient supplier of most goods and a source of greater competition for local producers” (p. 15).

8
COMESA is an example of a South-South PTA involving small economies. The treaty establishing COMESA as a preferential trade agreement of Eastern and Southern African states was ratified on December 8, 1994.12 At that date, some COMESA countries, including Uganda, were already part of a regional trade agreement called PTA.13 The data available for Uganda, used in this paper, cover the last year of the PTA agreement (1994) and four years of the COMESA agreement (2000 to 2003). For each of these five years, we merge data on the value of Uganda's imports, at the commodity level and by country of origin, with data on Uganda's PTA tariff rates (for 1994), COMESA tariff rates (for 2000 to 2003), and MFN tariff rates (for all years). We also use data on Uganda's import excise taxes. Uganda's data for the five years examined is coded according to three different versions of the Harmonized System (HS) classification: H0 for 1994, H1 for 2000 and 2001, and H2 for 2002 and 2003. We use WITS's concordance tables and recode all the data following the H0 classification.14 Tariff data is presented according to the HS classification up to the 8-digit level, but disaggregate import values only up to the 6-digit level. We use the simple average tariff rate for each 6-digit level code (averaged over the 7-digit and 8-digit level codes).15 Finally, the tariff rates used in the empirical analysis incorporate information on import excise taxes levied on each product. Tables 1 through 4 present summary statistics of the main variables used in our analysis. The tables document the extent and patterns of preferential and MFN tariff liberalization in Uganda between 1994 and 2003. The tables also offer a preliminary view of the impact of trade liberalization (preferential and otherwise) on Uganda's imports. Table 1 shows that tariff rates faced by COMESA countries decreased substantially from 1994 to 2003, from an average preferential tariff rate (across tariff lines) of 11.3 percentage points to an average of 5.5 percentage points. At the same time, the average value of imports of a 6-digit HS commodity from these same countries increased substantially (from US$155,000 to US$289,000). Table 2 shows that MFN tariff rates decreased even more than
12 The member countries of COMESA are Angola, Burundi, Comoros, Democratic Republic of Congo, Djibouti, Egypt (which joined in 1998), Eritrea, Ethiopia, Kenya, Madagascar, Malawi, Mauritius, Namibia, Rwanda, Seychelles (which joined in 1997), Sudan, Swaziland, Uganda, Zambia, and Zimbabwe. In terms of population, this agreement is extensive; the overall population of COMESA countries was approximately 380 million people in 1998. 13 The PTA, which was ratified in 1982, encompassed Burundi, Comoros, Djibouti, Ethiopia, Kenya, Malawi, Mauritius, Rwanda, Swaziland, Uganda, Zambia, and Zimbabwe (all of which were part of the later COMESA) as well as Somalia and Lesotho. 14 Going from the H2 and H1 to the H0 classification, a few different H2 codes and H1 codes are reclassified as the same H0 code. In those cases, for each H0 code we use the simple average of the tariff rates (averaged over the overlapping H2 or H1 codes). 15 Another complication is that Uganda belonged to other preferential trade agreements during the period examined (e.g., the Cross-Border Initiative and the East African Community agreement). We do not have data on preferential tariff rates within these other agreements. Our results hold to the extent that Uganda applied COMESA tariff rates to COMESA countries belonging to other PTAs. This assumption is consistent with our understanding of these arrangements (Subramanian and others, 2000; McIntyre, 2005).

9
preferential tariff rates (from 17.9 percentage points in 1994 to 10.2 percentage points in 2003), but were on average higher than preferential tariff rates in both 1994 and 2003. Imports from non-COMESA countries also increased during this time period. The overall evidence on changes in imports, from both COMESA and non-COMESA countries, is consistent with the pattern of total imports (as a percentage of GDP) shown in Figure 1. Tables 3 and 4 track the distribution of tariff rates (both preferential and MFN rates) between 1994 and 2003. In 1994, the distribution mode of preferential tariff rates is between 5 and 10 percent. In 2003, that same distribution mode is less than 5 percent. However, during the period, the distribution mode of MFN tariff rates remained the same (between 5 and 10 percent). Finally, Appendices I and II show preferential and MFN tariff rates in 1994 and 2003 by 2-digit 1996 HS codes. As shown in Appendix I, the sectors that experienced the greatest reduction in preferential tariff rates between 1994 and 2003 were “edible fruit and nuts...,” “vegetable plaiting materials...,” “essential oils, etc.; perfumery, cosmetic...,” “prep feathers, down etc..,” and “musical instruments...” Some sectors, including “tobacco and manufactured tobacco substitutes,” saw an increase in the preferential tariff rate due to import excise taxes that generally targeted COMESA-member goods. Appendix II shows that the sectors that experienced the greatest reduction in MFN tariff rates in the same period were “coffee, tea, mate and spices,” “vegetable plaiting materials,” and “raw hides and skins and leather.” Finally, appendix III shows Uganda's total imports by country of origin in 1994 and 2003 (calculated based on data at the commodity level). Kenya is the largest exporter to Uganda in both years. Imports from other COMESA countries are substantially smaller. In our empirical analysis, following the previous literature, we ask the following questions: To what extent did Uganda's imports from COMESA countries increase as a result of COMESA’s preferential trade liberalization? And to the extent such imports did increase, how much of this increase was a result of trade diversion, as evidenced by a reduction in imports from non-COMESA countries? To fully explore both questions, we take a counterfactual approach, as we cannot simply consider the change in imports from COMESA and non-COMESA countries between 1994 and 2003. Instead, we estimate how much trade would have changed in the absence of the trade agreement and net this effect out from our measure, as described in the next section.
V. EMPIRICAL STRATEGY AND RESULTS
In this section, we exploit the time, commodity, and origin-country variation in imports and tariffs to identify COMESA’s impact on Uganda’s imports. We first develop a simple model that delivers the estimating equations of our empirical analysis using a methodology closely related to that used by Clausing (2001) and Romalis (2005). We proceed from the simplest to the most sophisticated estimation strategy, reflecting the successive advances in the literature.
10
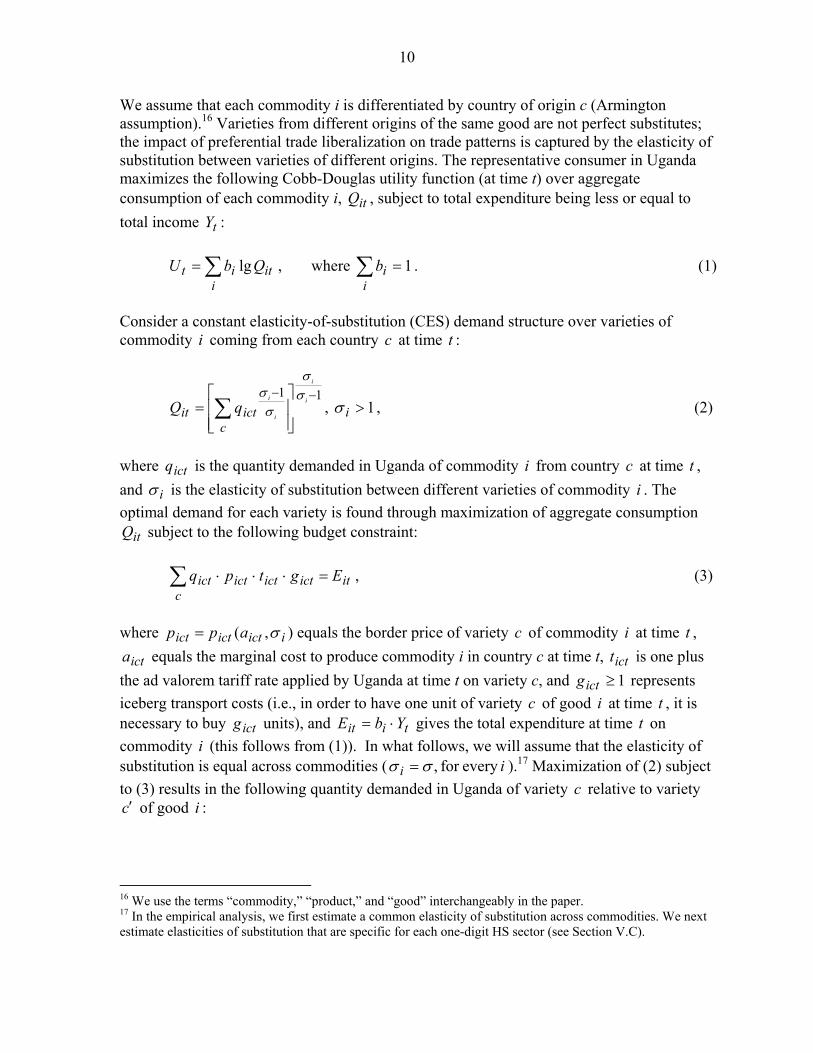
We assume that each commodity i is differentiated by country of origin c (Armington assumption).16 Varieties from different origins of the same good are not perfect substitutes; the impact of preferential trade liberalization on trade patterns is captured by the elasticity of substitution between varieties of different origins. The representative consumer in Uganda maximizes the following Cobb-Douglas utility function (at time t) over aggregate consumption of each commodity i, itQ , subject to total expenditure being less or equal to total income tY : ∑=
iitit QbU lg , where ∑ =
iib 1 . (1)
Consider a constant elasticity-of-substitution (CES) demand structure over varieties of commodity i coming from each country c at time t :
11 −−
⎥⎥⎦
⎤
⎢⎢⎣
⎡= ∑ i
i
i
i
cictit qQ
σσ
σσ
, 1>iσ , (2)
where ictq is the quantity demanded in Uganda of commodity i from country c at time t , and iσ is the elasticity of substitution between different varieties of commodity i . The optimal demand for each variety is found through maximization of aggregate consumption
itQ subject to the following budget constraint: ∑ =⋅⋅⋅
citictictictict Egtpq , (3)
where iictictict app σ,(= ) equals the border price of variety c of commodity i at time t ,
icta equals the marginal cost to produce commodity i in country c at time t, ictt is one plus the ad valorem tariff rate applied by Uganda at time t on variety c, and 1≥ictg represents iceberg transport costs (i.e., in order to have one unit of variety c of good i at time t , it is necessary to buy ictg units), and tiit YbE ⋅= gives the total expenditure at time t on commodity i (this follows from (1)). In what follows, we will assume that the elasticity of substitution is equal across commodities ( ii every for ,σσ = ).17 Maximization of (2) subject to (3) results in the following quantity demanded in Uganda of variety c relative to variety c′ of good i :
16 We use the terms “commodity,” “product,” and “good” interchangeably in the paper. 17 In the empirical analysis, we first estimate a common elasticity of substitution across commodities. We next estimate elasticities of substitution that are specific for each one-digit HS sector (see Section V.C).

11
σ−
′′′′⎟⎟⎠
⎞⎜⎜⎝
⎛⋅⋅⋅⋅
=tcitcitci
ictictict
tci
icttgptgp
. (4)
The quantity demanded of variety c is therefore equal to:
⎥⎥⎦
⎤
⎢⎢⎣
⎡⋅⋅
⋅⋅=
∑′
−′′′
−
ctcitcitci
itictictictict
tgp
Etgpq
)1()(
)(σ
σ , (5)
which gives a CIF value (cost including insurance and freight) of:
itictit
ictictictictictict Et
Pgp
gpqm ⋅⋅⋅
=⋅⋅≡ −− σσ )1()( , (6)
where ∑ −−=c
ictictictit tgpP )1(1
)1( ])([ σσ is the price index of good i at time t. Taking
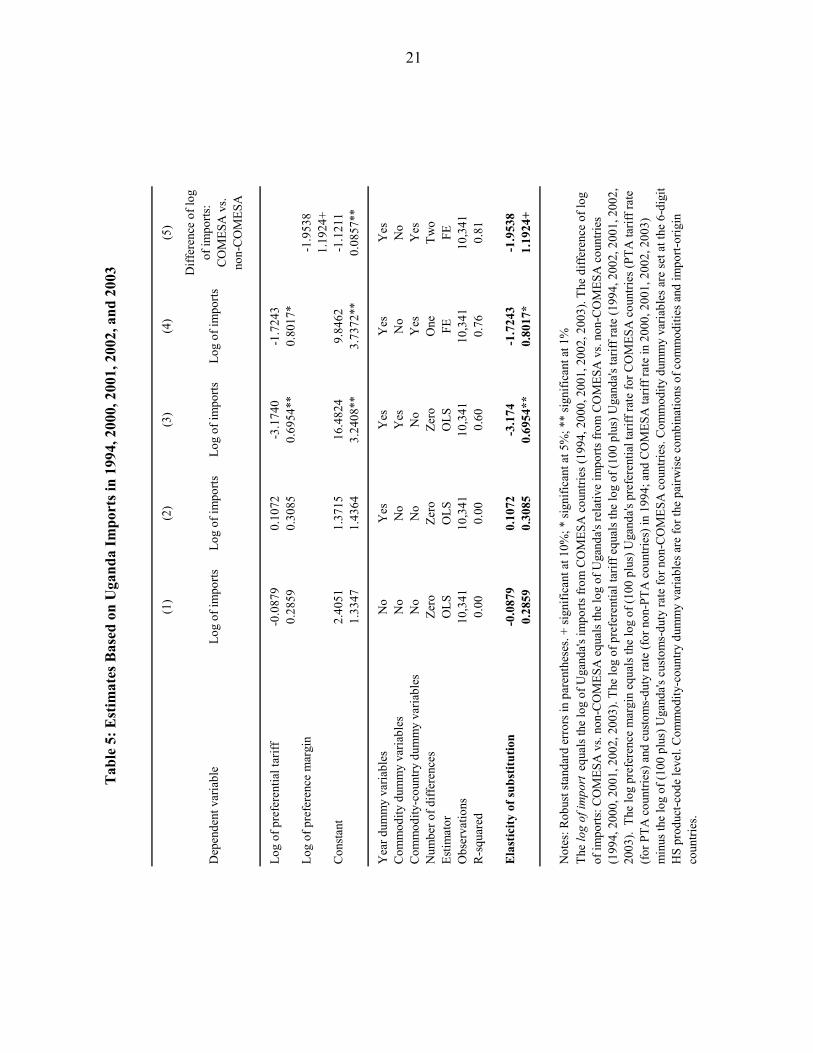
logarithms of expression (6), we can derive the first specification of the empirical model: ititictictictict EPgptm lglg)1(lg)1(lg)1(lglg +−−−+−+−= σσσσ . (7) Expression (7) is the starting point of our empirical analysis. Throughout our analysis, we use pooled yearly data for 1994 and 2000–2003, and measure the first term on the right hand side in expression (7) using two methods. In Table 5, we use the log of (one plus) the preferential tariff rate, as directly implied by (7).18 In Table 6, we use )1( −ictt , which is the ad valorem tariff rate applied by Uganda to commodity i from country c at time t (taking a first-order Taylor approximation, )1(lg −≅ ictict tt ). While the coefficient on the first measure represents the impact of a percentage change of (one plus) the tariff rate, the coefficient on the second measure gives the impact of a percentage-point change. Each column in the two tables labeled by the same number corresponds to the same specification.
A. Benchmark Estimators
The first step in our empirical strategy is to estimate naïve benchmark regressions meant to demonstrate that omitted variables biases are important. In particular, in regression (1) of Table 5, we start by regressing the log of imports on the log of (one plus) the preferential tariff rate, the first term on the right-hand side of expression (7). The implicit assumption in this specification is that the remaining terms are orthogonal to the preferential tariff rate. Next, in regression (2), we augment the first regression with year dummies that capture the
18 Since in the empirical analysis we express tariff rates in percentage terms, icttlg is calculated as the log of (100 plus) the tariff rate.

12
impact of time effects that are invariant across product codes (e.g., inflation, growth, etc.). Both estimates of trade liberalization (regressions (1) and (2)) are insignificant. We obtain the same insignificant results in Table 6. Next, in regression (3) of Table 5, we add dummy variables for 6-digit HS product-codes. This specification assumes that the impact of varieties’ prices ( ictp ) and transport costs ( ictg ) in (7) is captured by commodity and time dummy variables (in addition to idiosyncratic shocks in the error term). It also posits that, controlling for goods’ dummy variables and time effects, the remaining variation in the price index itP and expenditure itE is orthogonal to tariff changes. The results of this regression show that the reduction of preferential tariff rates increases imports from COMESA countries. The effect is statistically significant at the 1 percent level. However, the size of the coefficient is not large relative to the coefficient estimated for some other countries in the existing literature (see below).19 Next, in regression (4) (Tables 5 and 6) we replace commodity dummy variables with commodity-by-country fixed effects. This technique allows us to control for time-invariant factors that affected demand for, say, Kenyan but not Malawian mangos, or vice versa. This specification controls for all time-invariant determinants of imports of commodity i from country c, resulting in a true fixed-effect estimation. Clausing (2001) uses a similar estimation strategy for imports by the United States from Canada. The estimates we find are now smaller in absolute value than in regression (3) but still significant at the 5 percent level. The elasticity of substitution (σ ) is estimated to equal 1.7, while the elasticity of imports with respect to tariff rates is between 14 percent and 16 percent. In particular, if the ad valorem tariff rate decreases by 100 percent (for example, by 10 percentage points when the tariff rate equals 10 percent), then imports from COMESA countries increase by 16 percent (based on column (4), Table 5). Based on column (4), Table 6 if the ad valorem tariff rate decreases by 10 percentage points, imports increase by 14 percent. The magnitude of these effects is relatively small, compared with the results from previous studies for other countries and agreements. In her analysis of U.S. trade imports from Canada within the CUSFTA, Clausing (2001) finds that a 10 percentage point decrease in tariffs implies a 96 percent increase in imports from Canada. Our estimate of Uganda’s elasticity of substitution is also much smaller than the estimated elasticity for the United States computed by Romalis (2005), which ranges between 6.2 and 10.9. For Mexican imports, however, Romalis’s estimate ranges between 0.6 and 2.5 and is close to our own for Uganda. Our estimate is also similar in magnitude to the elasticity of import demand for Uganda estimated by Kee, Nicita and Olarreaga (2005) (equal to 1.22).20 This similarity may suggest that consumers in low-income countries, in general, have more inelastic demand curves and are, therefore, less likely to immediately benefit from trade reform. Search costs may help explain the reluctance of low-income consumers to switch the origin of their purchases from one import country to another. 19 We obtain a similar result in regression (3), Table 6. 20 The elasticity of import demand equals the elasticity of substitution, if the cross-price demand elasticity between goods is zero, which is the case given a utility function of the CES-Cobb Douglas form (Kee, Nicita, and Olarreaga, 2005).

13
Another interpretation of our estimates is that the small effect on Uganda’s imports of COMESA’s preferential tariff liberalization is due to the South-South nature of the agreement. This reading of the results is consistent with what we find below in Section V.C when we investigate cross-sector heterogeneity.
B. Difference-in-Difference Estimator
The estimation strategy up to this point depends on several assumptions that may not hold. In particular, the price index itP and expenditure itE may not be orthogonal to preferential tariff rates, after controlling for commodity (or commodity-by-country) fixed effects and time effects. For example, if commodities with increased expenditure levels itE (and thus high imports) are protected against preferential tariff reductions, then our coefficient estimate of σ− in regression (7) would be biased toward zero. Another concern is that itP might be correlated with preferential tariff movements since, by construction, itP is a function of all tariffs in the sector, including COMESA tariffs. In addition, in Uganda, COMESA and MFN tariff rates were liberalized simultaneously, resulting in a clear correlation between the regressor and itP . We next modify our empirical model to address these issues by constructing a difference-in-difference estimator, in which the control group is imports from non-COMESA countries. Using expression (6) for CIF imports by Uganda of variety c and of variety c′ of good i at time t, we can calculate the following ratio:
σσ −
′
−
′′′⎟⎟⎠
⎞⎜⎜⎝
⎛⋅⎟⎟
⎠
⎞⎜⎜⎝
⎛⋅⋅
=tci
ict
tcitci
ictict
tci
icttt
gpgp
mm )1(
. (8)
Let c represent COMESA countries and c′ represent non-COMESA countries. The advantage of considering expression (8), which represents Uganda's relative imports from COMESA to non-COMESA countries, is that the terms itP and itE are canceled out from the estimating equation. Expression (8) suggests a new specification of the empirical model. The dependent variable now becomes the logarithm of the ratio of imports from COMESA countries to imports from non-COMESA countries. We regress it on the log of the preference margin afforded by Uganda to preferential trading partners. We calculate the log of the preference margin as the difference between the log of (one plus) the preferential tariff rate and the log of (one plus) the MFN tariff rate. In other words, we estimate the following model (regression (5), Table 5):
tci
ict
tci
ictticict
tci
ict
gg
pp
ttmm
′′′
−+−+−⋅−= lg)1(lg)1()lg(lglg ' σσσ , (9)
where c and c′ represent, respectively, the varieties coming from each COMESA member country and from the rest of the world (as a whole). As in regressions (4), we introduce commodity-by-country fixed effects and time dummy variables. Therefore, in this last

14
specification, we only need to assume that the time variation in relative prices and relative transportation costs of two varieties of the same commodity is orthogonal to tariff movements. Equation (9) clarifies an important point. In the theoretical model, we assume that the elasticity of substitution between varieties of the same good is equal for any pair of origin countries of imports. In practice in the empirical analysis, as made clear by equation (9), the elasticity of substitution we estimate is between COMESA and non-COMESA origin varieties, since we exploit the differential variation in preferential versus MFN tariff rates. This regression represents our difference-in-difference (and preferred) specification. As mentioned above, this strategy makes it possible to net out the impact of commodity-specific effects that are time-varying, such as itP and itE . Thus, our difference-in-difference estimator also allows us to net out the impact of changes in MFN tariff rates that take place over the same period. Results in Table 5, regression (5), suggest that the biases due to itP and itE may not have been substantial, since our new estimate is very close to what we previously found: The coefficient on the log of the preference margin equals –1.9 (significant at the 10 percent level). In Table 6, regression (5), we also estimate this equation using, as an independent variable, )( itit MFNtariffPTAtariff − , which is the preference margin afforded by Uganda to preferential trading partners, calculated as the difference between the preferential tariff rate and the MFN tariff rate (as before, we use a first-order Taylor approximation to approximate
tlg ). The results are similar.
C. Robustness Checks
We next test the robustness of these results (see Table 7). First, in regression (1) of Table 7, we expand the dataset. Some COMESA countries increased exports from zero to a positive value in a specific product code or vice versa. In the former case, by excluding this variation, our previous regression estimates would be biased toward zero. Therefore, whenever import data exists for at least a single year but not the other years, we add observations for the missing year(s), and assign them an import value of US$1. Results in column (1) suggest that the exclusion of these observations in Tables 5 and 6 did not bias our estimate toward zero. Second, we relax the assumption that the elasticity of substitution is constant across product codes and run regressions that are specific for each one-digit HS code (see appendices I and II for a list of two-digit codes included in each one-digit code). Estimates of the elasticity of substitution are insignificant for each one-digit sector except HS1, HS2, and HS3 (which include agricultural products and beverages). For these sectors, we estimate elasticities that are substantially higher than the average. We draw two conclusions from this exercise. First, our previous average estimates hide cross-sector heterogeneity. Second, and not surprisingly, the sectors where the impact is larger and significant are those where developing countries are more likely to have a comparative advantage. These results are presented in regressions (2) through (4) in Table 7.

15
Finally, we address the possibility that the relative price (tic
ict
pp
'
) term in equation (9) might be
correlated with the preference margin, even after controlling for commodity (or commodity-by-country) fixed effects and time effects, as done in regression (5), Table 5. Our third robustness check attempts to control for this bias, which is, for example, due to unobserved changes in the marginal cost of production of commodity i in country c (affecting the border price) that may be correlated with tariff movements. For example, production of beer in Kenya might have become more efficient relative to non-COMESA countries, and this increased efficiency might be negatively correlated with preferential concessions for political-economy reasons (e.g., the excise taxes on alcohol). This would bias our estimate towards zero. Expression (8) above refers to Uganda’s relative imports (from COMESA versus non-COMESA countries). Based on the same model, we can derive a very similar expression for any other country’s relative imports from (the same) COMESA versus (the same) non-COMESA countries. In the following expression, we consider South African imports:21
σσ −
′
−
′′′⎟⎟⎟
⎠
⎞
⎜⎜⎜
⎝
⎛⋅
⎟⎟⎟
⎠
⎞
⎜⎜⎜
⎝
⎛
⋅
⋅=
SAtci
SAict
SAtcitci
SAictict
SAtci
SAict
t
t
gp
gp
m
m)1(
(10)
We then use this expression to construct our triple difference estimating equation, where the dependent variable is the logarithm of Uganda’s imports from COMESA countries relative to non-COMESA countries (expression (8)) divided by South Africa’s imports from COMESA countries relative to non-COMESA countries (expression (10)):
=−′′ SAtci
SAict
tci
ict
m
mmm
lglg (11)
)lg)(lg1()]lg(lg)lg[(lg ' SAtci
SAict
tci
ictSAtci
SAictticict g
ggg
tttt′′
′ −−+−−−⋅− σσ
This specification nets out the impact of the relative border-price term, which is independent of
the identity of the importing country (tci
ictpp
′ appears in both equations (8) and (10) and is
canceled out by taking their ratio). However, as in the previous specifications, we still need to assume that the relative transport-costs term is given by the sum of commodity-by-country fixed effects, time dummy variables, and a random component orthogonal to the preference margin. 21 We thank John Romalis for his suggestion to use South Africa in the triple difference specification. We choose South Africa since we want to maximize the number of products that both countries (Uganda and South Africa) import from the same origin country. These are the observations that can be used to estimate equation (11). The apartheid ban on exports to South Africa was lifted in 1993; therefore, the impact on changes between 1994 and 2003 should be minimal.

16
This is the approach taken by Romalis (2005). The last column in Table 7 shows the results based on equation (11). The estimated elasticity of substitution is insignificantly different from zero. If this result is due to a true zero elasticity of substitution, then our previous estimates were not underestimating the impact of COMESA on imports; however, if the insignificance of the elasticity is caused by the imprecision of the estimate (e.g., due to few observations), then we cannot draw strong conclusions from this robustness check. In addition, because this robustness check is based on a much smaller number of observations than previous specifications, the estimate might be affected by a selection-bias problem. We check for this problem in regression (5), which delivers a coefficient estimate that is not statistically different from our original estimate of –1.93.
D. Trade Diversion
Our last test is for trade diversion. This test is important to make a welfare statement about the impact of the trade agreement. Our investigation is based on the fact that, if trade diversion resulted from the PTA agreement, holding all other factors constant, we would expect a decline in imports from non-COMESA countries in those sectors in which preferential tariff rates decline. Our empirical strategy relies on expression (7) above implemented for imports from non-COMESA countries. Results are presented in Table 8. The first column presents the results from the regression of the log of non-COMESA imports on the log of the MFN tariff rate. The equation includes commodity-by-country dummies and year effects; therefore, it is equivalent to the fourth regression in Table 5 for imports from COMESA countries. The number of observations is more than 62,000, accounting for the much higher share of non-COMESA imports in total imports to Uganda. The coefficient is also small, significant, and is consistent with the results in Table 5. That is, the estimates for the elasticity of substitution between COMESA and non-COMESA countries’ origin goods, measured using data for imports either from COMESA or non-COMESA countries, are similar. To test for trade diversion effects, we include the log of the preferential tariff rate in regression (2) to capture the impact of COMESA trade liberalization on non-COMESA imports, which, according to the model, works through itP . The coefficient on the latter variable is insignificantly different from zero, thus, giving no support to the trade-diversion hypothesis. Trade diversion, however, may occur only in sectors in which COMESA has a comparative advantage. In regressions (3) and (4), to control for this factor, we include as regressors the log of COMESA imports and the COMESA share in imports, respectively, and their interaction with preferential tariff rates. All trade diversion variables remain insignificant. Finally, we find additional evidence consistent with no trade diversion taking place in Figure 2, which shows that the ratio of imports from COMESA relative to non-COMESA (developing) countries decreased after 1994. Therefore, although COMESA’s preferential tariff liberalization has not considerably increased Uganda’s trade with member countries, these small effects are likely to be associated with trade creation. This result is inconsistent with the expectations in the literature that South-South PTAs give rise to trade diversion.

17
VI. CONCLUSIONS
This paper presents evidence that South-South trade agreements create positive but minimal economic gains for member countries. In particular, using commodity-level data, it finds that Ugandan imports of goods from COMESA countries increased only slightly following the advent of COMESA. Notably, commodity-level data offer a different picture of the effect of COMESA than do aggregate-level data (see the summary statistics in Table 1 and Cernat, 2001, who uses a gravity-type analysis).22 Our estimates are similar to Romalis’s (2005) finding for Mexico within NAFTA. This similarity may indicate that low-income-country consumers generally have more inelastic demand curves than high-income-country consumers, and are thus less likely to immediately benefit from trade reform. Search costs may help explain low-income consumers’ reluctance to switch the origin of their imports. An alternative explanation, however, is that developing countries are not natural trading partners, owing to their size and similar resources. Our elasticity estimates withstand a number of robustness checks. One concern is that COMESA-related reductions in tariff rates might have been offset by an increase in nontariff barriers. For example, after COMESA’s initial implementation, Uganda imposed ad valorem excise taxes on selected goods that tended to be imported from COMESA countries. Such an offsetting effect is unlikely, given that we partially account for nontariff barriers by using data on import excise taxes. Political economy factors are also unlikely to affect the results because our main specification controls for both time-invariant political-economy factors and political-economy factors that change over time that are common across member and nonmember countries. In addition, the findings are not overturned by a triple difference estimation strategy that controls for factors that change over time and are specific to each import country (a robustness check that follows Romalis, 2005). Lastly, the results grow more robust when we consider the possible impact of tax evasion on recorded imports, as documented by Fisman and Wei (2004). The results of this paper suggest two important questions for future research. First, if economic gains are minimal, what other factors might explain the increased popularity of South-South PTAs? One explanation may be that such arrangements promote noneconomic benefits, such as peace and security within a region—a goal that is an official priority of COMESA. Indeed, Martin, Mayer, and Thoenig (2005) show that regional trade agreements can reduce the probability of war between liberalizing countries, while multilateral liberalization can potentially increase it. Second, from a normative point of view, given the limited capacity of institutions in the South, are resources efficiently spent in the negotiation and implementation of South-South trade agreements? Such an analysis would better inform efforts to promote trade in developing countries where institutions are weak and resources scarce.
22 However, as pointed out in the literature survey, the evidence on the effects of South-South African PTAs based on gravity-type analyses of aggregate data yields mixed results (Cernat, 2001; Subramanian and Tamirisa, 2001).

18
Figure 1. Uganda: Imports and Tariff Revenue, 1986–2003 (Percent of GDP)
Source: Ugandan Authorities, DOTS (IMF), and IFS (IMF); Non-COMESA countries are only non-COMESA developing countries. The ratio is COMESA imports to non-COMESA imports.
5
7
9
11
13
15
17
19
21
23
25
1986 1987 1988 1989 1990 1991 1992 1993 1994 1995 1996 1997 1998 1999 2000 2001 2002 20030
0.5
1
1.5
2
2.5
3
3.5
4
4.5
5
Imports (left scale)
Tariff Revenue (right scale)
0
2
4
6
8
10
12
14
16
1986 1987 1988 1989 1990 1991 1992 1993 1994 1995 1996 1997 1998 1999 2000 2001 2002 20030
0.5
1
1.5
2
2.5
3
Non-COMESA (left scale)COMESA (left scale)Ratio (right scale)
Figure 2. Uganda: Imports from Developing Countries, 1986–2003(Percent of GDP)
Source: Ugandan Authorities, DOTS (IMF), and IFS (IMF).

19
Var
iabl
eO
bsM
ean
Std.
Dev
.M
inM
ax
Tar
iff R
ate
for
CO
ME
SA c
ount
ries
199
4 (p
erce
ntag
e po
ints
)1,
204
11.3
10.0
0.0
118.
0
CO
ME
SA T
ariff
Rat
e 20
03 (p
erce
ntag
e po
ints
)1,
204
5.5
7.8
0.0
136.
0
Impo
rts f
rom
CO
ME
SA c
ount
ries
(199
4, th
ousa
nd $
)1,
204
155.
21,
065.
90.
520
,262
.3
Impo
rts f
rom
CO
ME
SA c
ount
ries
(200
3, th
ousa
nd $
)1,
204
289.
35,
269.
10.
518
1,27
5.2
Not
es: T
he sa
mpl
e is
rest
icte
d to
com
mod
ities
for w
hich
dat
a on
impo
rts fr
om C
OM
ESA
cou
ntrie
s is a
vaila
ble
for b
oth
1994
and
200
3. T
he ta
riff r
ates
are
ad
just
ed fo
r the
exi
sten
ce o
f im
port
exci
se ta
xes.
The
tarif
f rat
e fo
r CO
MES
A c
ount
ries i
n 19
94 is
the
aver
age
tarif
f rat
e fa
ced
by C
OM
ESA
cou
ntrie
s in
1994
, w
hich
use
s bot
h PT
A a
nd M
FN ra
tes.
Impo
rts re
fer t
o a
sing
le 6
-dig
it H
S co
mm
odity
. Pre
fere
ntia
l tar
iff ra
tes a
re se
t equ
al to
MFN
tarfi
ff ra
tes w
hen
no
pref
eren
tial r
ate
is sp
ecifi
ed.
Var
iabl
eO
bsM
ean
Std.
Dev
.M
inM
ax
MFN
Tar
iff R
ate
1994
(per
cent
age
poin
ts)
1,02
017
.98.
60.
060
.0
MFN
Tar
iff R
ate
2003
(per
cent
age
poin
ts)
1,02
010
.210
.20.
014
5.0
Impo
rts f
rom
non
-CO
ME
SA (1
994,
thou
sand
$)
1,02
036
4.6
1,28
9.2
0.5
18,2
23.9
Impo
rts f
rom
non
-CO
ME
SA (2
003,
thou
sand
$)
1,02
071
8.4
2,38
1.7
0.5
30,6
02.1
Tab
le 1
: Sum
mar
y St
atis
tics f
or U
gand
a vi
s-à-
vis C
OM
ESA
Cou
ntri
es (1
994-
2003
)
Tab
le 2
: Sum
mar
y St
atis
tics f
or U
gand
a vi
s-à-
vis n
on-C
OM
ESA
Cou
ntri
es (1
994-
2003
)
Not
es: T
he sa
mpl
e is
rest
icte
d to
com
mod
ities
for w
hich
dat
a on
impo
rts fr
om n
on-C
OM
ESA
cou
ntrie
s is a
vaila
ble
for b
oth
1994
and
200
3. T
his i
s a su
bset
of
the
data
set w
e us
e, w
hich
rest
ricts
pro
duct
cod
es to
com
mod
ities
that
in a
t lea
st o
ne o
f the
yea
rs w
as im
porte
d fro
m C
OM
ESA
. Tar
rif ra
tes a
re a
djus
ted
for
the
exis
tenc
e of
impo
rt ex
cise
taxe
s. Im
ports
refe
r to
a si
ngle
6-d
igit
HS
com
mod
ity.

20
PTA
tari
ff r
ates
CO
ME
SA ta
riff
rat
esFr
eq.
Perc
ent
Cum
.Fr
eq.
Perc
ent
Cum
.
Free
Tra
de33
4
6.66
6.66
Free
Tra
de98
6
20.2
020
.20
Tar
iffs u
nder
5 p
erce
nt1,
172
23.3
630
.01
Tar
iffs u
nder
5 p
erce
nt2,
035
41.7
061
.91
Tar
iffs b
etw
een
5 an
d 10
per
cent
1,55
8
31
.05
61.0
6T
ariff
s bet
wee
n 5
and
10 p
erce
nt1,
521
31.1
793
.07
Tar
iffs b
etw
een
10 a
nd 2
5 pe
rcen
t1,
367
27.2
488
.30
Tar
iffs b
etw
een
10 a
nd 2
5 pe
rcen
t30
5
6.25
99.3
2T
ariff
s ove
r 25
per
cent
587
11
.70
100.
00T
ariff
s ove
r 25
per
cent
33
0.
6810
0.00
Tot
al5,
018
100.
00T
otal
4,88
010
0.00
Not
e: P
refe
rent
ial t
ariff
rate
s are
set e
qual
to M
FN ta
riff r
ates
whe
n no
pre
fere
ntia
l rat
e is
spec
ified
. Tar
iff ra
tes a
re a
djus
ted
for t
he e
xist
ence
of i
mpo
rt ex
cise
taxe
s.
MFN
tari
ff r
ates
MFN
tari
ff r
ates
Freq
.Pe
rcen
tC
um.
Freq
.Pe
rcen
tC
um.
Free
Tra
de17
0
3.39
3.39
Free
Tra
de98
6
20.2
020
.20
Tar
iffs u
nder
5 p
erce
nt11
0.22
3.61
Tar
iffs u
nder
5 p
erce
nt12
0.25
20.4
5T
ariff
s bet
wee
n 5
and
10 p
erce
nt2,
268
45.2
048
.80
Tar
iffs b
etw
een
5 an
d 10
per
cent
2,02
1
41
.41
61.8
6T
ariff
s bet
wee
n 10
and
25
perc
ent
1,29
8
25
.87
74.6
7T
ariff
s bet
wee
n 10
and
25
perc
ent
1,81
3
37
.15
99.0
2T
ariff
s ove
r 25
per
cent
1,27
1
25
.33
100.
00T
ariff
s ove
r 25
per
cent
48
0.
9810
0.00
Tot
al5,
018
100.
00T
otal
4,88
0
10
0.00
Not
e: T
ariff
rate
s are
adj
uste
d fo
r the
exi
sten
ce o
f im
port
exci
se ta
xes.
1994
2003
Tab
le 3
: Pat
tern
of P
rote
ctio
n in
Uga
nda
in 1
994
and
2003
und
er th
e Pr
efer
entia
l Tra
de A
gree
men
ts (P
TA
in 1
994
and
CO
ME
SA in
200
3)
1994
2003
Tab
le 4
: Pat
tern
of P
rote
ctio
n in
Uga
nda
in 1
994
and
2003
vis
-à-v
is th
e R
est o
f the
Wor
ld (M
FN T
ariff
Rat
es)
21
T
able
5: E
stim
ates
Bas
ed o
n U
gand
a Im
port
s in
1994
, 200
0, 2
001,
200
2, a
nd 2
003
(1)
(2)
(3)
(4)
(5)
Log
of p
refe
rent
ial t
ariff
-0.0
879
0.10
72-3
.174
0-1
.724
30.
2859
0.30
850.
6954
**0.
8017
*Lo
g of
pre
fere
nce
mar
gin
-1.9
538
1.19
24+
Con
stan
t2.
4051
1.37
1516
.482
49.
8462
-1.1
211
1.33
471.
4364
3.24
08**
3.73
72**
0.08
57**
Yea
r dum
my
varia
bles
No
Yes
Yes
Yes
Yes
Com
mod
ity d
umm
y va
riabl
esN
oN
oY
esN
oN
oC
omm
odity
-cou
ntry
dum
my
varia
bles
No
No
No
Yes
Yes
Num
ber o
f diff
eren
ces
Zero
Zero
Zero
One
Two
Estim
ator
OLS
OLS
OLS
FEFE
Obs
erva
tions
10,3
4110
,341
10,3
4110
,341
10,3
41R
-squ
ared
0.00
0.00
0.60
0.76
0.81
Ela
stic
ity o
f sub
stitu
tion
-0.0
879
0.10
72-3
.174
-1.7
243
-1.9
538
0.28
590.
3085
0.69
54**
0.80
17*
1.19
24+
Not
es: R
obus
t sta
ndar
d er
rors
in p
aren
thes
es. +
sign
ifica
nt a
t 10%
; * si
gnifi
cant
at 5
%; *
* si
gnifi
cant
at 1
%Th
e lo
g of
impo
rt e
qual
s the
log
of U
gand
a's im
ports
from
CO
MES
A c
ount
ries (
1994
, 200
0, 2
001,
200
2, 2
003)
. The
diff
eren
ce o
f log
of
impo
rts: C
OM
ESA
vs.
non-
CO
MES
A e
qual
s the
log
of U
gand
a's re
lativ
e im
ports
from
CO
MES
A v
s. no
n-C
OM
ESA
cou
ntrie
s (1
994,
200
0, 2
001,
200
2, 2
003)
. The
log
of p
refe
rent
ial t
ariff
equ
als t
he lo
g of
(100
plu
s) U
gand
a's ta
riff r
ate
(199
4, 2
002,
200
1, 2
002,
20
03).
The
log
pref
eren
ce m
argi
n eq
uals
the
log
of (1
00 p
lus)
Uga
nda's
pre
fere
ntia
l tar
iff ra
te fo
r CO
MES
A c
ount
ries (
PTA
tarif
f rat
e (f
or P
TA c
ount
ries)
and
cus
tom
s-du
ty ra
te (f
or n
on-P
TA c
ount
ries)
in 1
994;
and
CO
MES
A ta
riff r
ate
in 2
000,
200
1, 2
002,
200
3)
min
us th
e lo
g of
(100
plu
s) U
gand
a's c
usto
ms-
duty
rate
for n
on-C
OM
ESA
cou
ntrie
s. C
omm
odity
dum
my
varia
bles
are
set a
t the
6-d
igit
HS
prod
uct-c
ode
leve
l. C
omm
odity
-cou
ntry
dum
my
varia
bles
are
for t
he p
airw
ise
com
bina
tions
of c
omm
oditi
es a
nd im
port-
orig
in
coun
tries
.
Log
of im
ports
Diff
eren
ce o
f log
of
impo
rts:
CO
MES
A v
s. no
n-C
OM
ESA
Dep
ende
nt v
aria
ble
Log
of im
ports
Log
of im
ports
Log
of im
ports

22
T
able
6: E
stim
ates
Bas
ed o
n U
gand
a Im
port
s in
1994
, 200
0, 2
001,
200
2, a
nd 2
003
(1)
(2)
(3)
(4)
(5)
Pref
eren
tial t
ariff
rate
0.00
100.
0025
-0.0
255
-0.0
136
0.00
240.
0025
0.00
69**
0.00
83+
Pref
eren
ce m
argi
n-0
.019
30.
0096
*C
onst
ant
1.98
791.
9888
2.27
721.
8901
-1.1
295
0.02
44**
0.04
43**
0.09
43**
0.06
02**
0.08
26**
Yea
r dum
my
varia
bles
No
Yes
Yes
Yes
Yes
Com
mod
ity d
umm
y va
riabl
esN
oN
oY
esN
oN
oC
omm
odity
-cou
ntry
dum
my
varia
bles
No
No
No
Yes
Yes
Num
ber o
f diff
eren
ces
Zero
Zero
Zero
One
Two
Estim
ator
OLS
OLS
OLS
FEFE
Obs
erva
tions
10,3
4110
,341
10,3
4110
,341
10,3
41R
-squ
ared
0.00
0.00
0.60
0.76
0.81
Not
es: R
obus
t sta
ndar
d er
rors
in p
aren
thes
es. +
sign
ifica
nt a
t 10%
; * si
gnifi
cant
at 5
%; *
* si
gnifi
cant
at 1
%
The
log
of im
port
equa
ls th
e lo
g of
Uga
nda's
impo
rts fr
om C
OM
ESA
cou
ntrie
s (19
94, 2
000,
200
1, 2
002,
200
3). T
he d
iffer
ence
of l
og
of im
ports
: CO
MES
A v
s. no
n-C
OM
ESA
equ
als t
he lo
g of
Uga
nda's
rela
tive
impo
rts fr
om C
OM
ESA
vs.
non-
CO
MES
A c
ount
ries
(199
4, 2
000)
. The
log
of p
refe
rent
ial t
ariff
equ
als t
he lo
g of
(100
plu
s) U
gand
a's ta
riff r
ate
(199
4, 2
002,
200
1, 2
002,
200
3).
The
log
pref
eren
ce m
argi
n eq
uals
the
log
of (1
00 p
lus)
Uga
nda's
pre
fere
ntia
l tar
iff ra
te fo
r CO
MES
A c
ount
ries (
PTA
tarif
f rat
e (f
or P
TA
coun
t). C
omm
odity
dum
my
varia
bles
are
set a
t the
6-d
igit
HS
prod
uct-c
ode
leve
l. C
omm
odity
-cou
ntry
dum
my
varia
bles
are
for t
he
pairw
ise
com
bina
tions
of c
omm
oditi
es a
nd im
port-
orig
in c
ount
ries.
Log
of im
ports
Diff
eren
ce o
f log
of
impo
rts:
CO
MES
A v
s. no
n-C
OM
ESA
Dep
ende
nt v
aria
ble
Log
of im
ports
Log
of im
ports
Log
of im
ports

23
T
able
7: R
obus
tnes
s Che
cks
(1)
(2)
(3)
(4)
(5)
(6)
Incl
udin
gM
issi
ng O
bs.
HS
1H
S 2
HS
3
Log
of p
refe
renc
e m
argi
n-0
.318
5-1
2.02
81-8
.016
9-4
.488
41.
1562
1.12
706.
7830
+3.
0652
**2.
1271
*6.
5281
-3.2
874
10.8
450
Con
stan
t-5
.065
7-0
.023
03.
5646
0.10
60-2
.139
24.
0646
0.07
92**
0.61
720.
3577
**0.
2060
0.62
61**
0.80
81**
Yea
r dum
my
varia
bles
Yes
Yes
Yes
Yes
Yes
Yes
Com
mod
ity d
umm
y va
riabl
esN
oN
oN
oN
oN
oN
oC
omm
odity
-cou
ntry
dum
my
varia
bles
Yes
Yes
Yes
Yes
Yes
Yes
Num
ber o
f diff
eren
ces
Two
Two
Two
Two
Two
Thre
eEs
timat
orFE
FEFE
FEFE
FEO
bser
vatio
ns21
,500
470
1,09
01,
357
317
317
R-s
quar
ed0.
570.
740.
770.
720.
990.
97
Ela
stic
ity o
f sub
stitu
tion
-0.3
185
-12.
0281
-8.0
169
-4.4
884
1.15
62-3
.287
41.
127
6.78
30+
3.06
52**
2.12
71*
6.52
8110
.845
Bro
ad S
ecto
rsTr
iple
Diff
with
Sout
h A
fric
a
Rat
io o
f pre
fere
nce
mar
gin:
Uga
nda
vs.
Sout
h A
fric
a
Not
es: R
obus
t sta
ndar
d er
rors
in p
aren
thes
es. +
sign
ifica
nt a
t 10%
; * si
gnifi
cant
at 5
%; *
* si
gnifi
cant
at 1
%Th
e di
ffere
nce
of lo
g of
impo
rts: C
OM
ESA
vs.
non-
CO
MES
A e
qual
s the
log
of U
gand
a's re
lativ
e im
ports
from
CO
MES
A v
s. no
n-C
OM
ESA
cou
ntrie
s (19
94,
2000
, 200
1, 2
002,
200
3). T
he d
iff -
in -
diff:
CO
MES
A vs
. non
-CO
MES
A, U
gand
a vs
. Sou
th A
fric
a eq
uals
the
log
of re
lativ
e im
ports
from
CO
MES
A v
s. no
n-C
OM
ESA
cou
ntrie
s in
Uga
nda
vs. S
outh
Afr
ica
(199
4, 2
001)
. The
log
pref
eren
ce m
argi
n eq
uals
the
log
of (1
00pl
us) U
gand
a's p
refe
rent
ial t
ariff
rate
for
CO
MES
A c
ount
ries (
PTA
tarif
f rat
e (f
or P
TA c
ount
ries)
and
cus
tom
s-du
ty ra
te (f
or n
on-P
TA c
ount
ries)
in 1
994;
and
CO
MES
A ta
riff r
ate
in 2
000,
200
1,
2002
, 200
3) m
inus
the
log
of (1
00 p
lus)
Uga
nda's
cus
tom
s-du
ty ra
te fo
r non
-CO
MES
A c
ount
ries.
The
ratio
of p
refe
renc
e m
argi
n: U
gand
a vs
. Sou
th A
fric
a is
th
e lo
g di
ffere
nce
betw
een
the
pref
eren
ce m
argi
n in
Uga
nda
and
the
pref
eren
ce m
argi
n in
Sou
th A
fric
a. C
omm
odity
dum
my
varia
bles
are
set a
t the
6-d
igit
HS
prod
uct-c
ode
leve
l. C
omm
odity
-cou
ntry
dum
my
varia
bles
are
for t
he p
airw
ise
com
bina
tions
of c
omm
oditi
es a
nd im
port-
orig
in c
ount
ries.
Bro
ad H
S co
des a
re
defin
ed in
App
endi
x I.
Diff
eren
ce o
f log
of
impo
rts:
CO
MES
A v
s. no
n-C
OM
ESA
Diff
eren
ce o
f log
of
impo
rts:
CO
MES
A v
s. no
n-C
OM
ESA
Diff
- in
- D
iff:
CO
MES
A v
s. no
n-C
OM
ESA
, U
gand
a vs
. Sou
th
Afr
ica
Dep
ende
nt v
aria
ble
Diff
eren
ce o
f log
of
impo
rts:
CO
MES
A v
s. no
n-C
OM
ESA
Diff
eren
ce o
f log
of
impo
rts:
CO
MES
A v
s. no
n-C
OM
ESA
Diff
eren
ce o
f log
of
impo
rts:
CO
MES
A v
s. no
n-C
OM
ESA

24
(1) (2) (3) (4)
Log of MFN tariff -0.8052 -0.7438 -0.6540 -0.643130.2869** 0.3440* 0.3444+ 0.3458+
Log of preferential tariff -0.1306 -0.1828 -0.31440.3838 0.3837 0.3884
-0.03780.0376
Log of COMESA imports 0.19610.1750
0.03900.5702
COMESA share in imports -1.13082.6690
Constant 5.6131 5.9363 5.7554 6.46761.3676** 1.6379** 1.6311** 1.7069**
Year dummy variables Yes Yes Yes YesCommodity-country dummy variables Yes Yes Yes YesNumber of differences One One One OneEstimator FE FE FE FEObservations 62,302 62,302 62,302 62,302R-squared 0.78 0.78 0.78 0.78
Table 8: Estimates of Trade Diversion Based on Uganda Imports from Non-COMESA Countries in 1994, 2000, 2001, 2002, and 2003
The log of import equals the log of Uganda's imports from non-COMESA countries (1994, 2000, 2001, 2002, 2003). The log of MFN tariff equals the log of (100 plus) Uganda's tariff rate (1994, 2002, 2001, 2002, 2003). The log of COMESA imports equals the log of Uganda's imports from COMESA countries (1994, 2002, 2001, 2002, 2003) in that commodity. The COMESA share in imports equals the share of Uganda's imports from COMESA countries (1994, 2002, 2001, 2002, 2003) in that commodity. Commodity dummy variables are set at the 6-digit HS product-code level. Commodity-country dummy variables are for the pairwise combinations of commodities and import-origin countries.
Log of preferential tariff *Log of COMESA imports
Log of preferential tariff *COMESA share
Log of imports
Notes: Robust standard errors in parentheses. + significant at 10%; * significant at 5%; ** significant at 1%
Dependent variable Log of imports Log of imports Log of imports
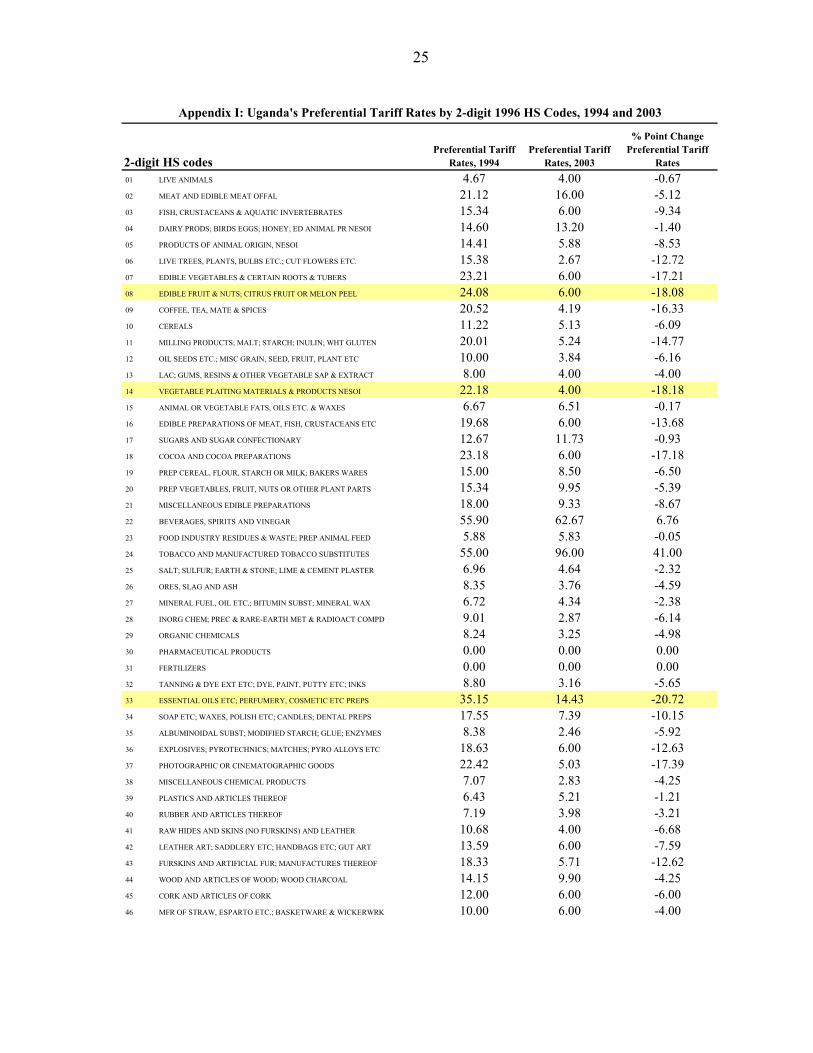
25
2-digit HS codes 01 LIVE ANIMALS 4.67 4.00 -0.67 02 MEAT AND EDIBLE MEAT OFFAL 21.12 16.00 -5.12 03 FISH, CRUSTACEANS & AQUATIC INVERTEBRATES 15.34 6.00 -9.34 04 DAIRY PRODS; BIRDS EGGS; HONEY; ED ANIMAL PR NESOI 14.60 13.20 -1.40 05 PRODUCTS OF ANIMAL ORIGIN, NESOI 14.41 5.88 -8.53 06 LIVE TREES, PLANTS, BULBS ETC.; CUT FLOWERS ETC. 15.38 2.67 -12.72 07 EDIBLE VEGETABLES & CERTAIN ROOTS & TUBERS 23.21 6.00 -17.21 08 EDIBLE FRUIT & NUTS; CITRUS FRUIT OR MELON PEEL 24.08 6.00 -18.08 09 COFFEE, TEA, MATE & SPICES 20.52 4.19 -16.33 10 CEREALS 11.22 5.13 -6.09 11 MILLING PRODUCTS; MALT; STARCH; INULIN; WHT GLUTEN 20.01 5.24 -14.77 12 OIL SEEDS ETC.; MISC GRAIN, SEED, FRUIT, PLANT ETC 10.00 3.84 -6.16 13 LAC; GUMS, RESINS & OTHER VEGETABLE SAP & EXTRACT 8.00 4.00 -4.00 14 VEGETABLE PLAITING MATERIALS & PRODUCTS NESOI 22.18 4.00 -18.18 15 ANIMAL OR VEGETABLE FATS, OILS ETC. & WAXES 6.67 6.51 -0.17 16 EDIBLE PREPARATIONS OF MEAT, FISH, CRUSTACEANS ETC 19.68 6.00 -13.68 17 SUGARS AND SUGAR CONFECTIONARY 12.67 11.73 -0.93 18 COCOA AND COCOA PREPARATIONS 23.18 6.00 -17.18 19 PREP CEREAL, FLOUR, STARCH OR MILK; BAKERS WARES 15.00 8.50 -6.50 20 PREP VEGETABLES, FRUIT, NUTS OR OTHER PLANT PARTS 15.34 9.95 -5.39 21 MISCELLANEOUS EDIBLE PREPARATIONS 18.00 9.33 -8.67 22 BEVERAGES, SPIRITS AND VINEGAR 55.90 62.67 6.76 23 FOOD INDUSTRY RESIDUES & WASTE; PREP ANIMAL FEED 5.88 5.83 -0.05 24 TOBACCO AND MANUFACTURED TOBACCO SUBSTITUTES 55.00 96.00 41.00 25 SALT; SULFUR; EARTH & STONE; LIME & CEMENT PLASTER 6.96 4.64 -2.32 26 ORES, SLAG AND ASH 8.35 3.76 -4.59 27 MINERAL FUEL, OIL ETC.; BITUMIN SUBST; MINERAL WAX 6.72 4.34 -2.38 28 INORG CHEM; PREC & RARE-EARTH MET & RADIOACT COMPD 9.01 2.87 -6.14 29 ORGANIC CHEMICALS 8.24 3.25 -4.98 30 PHARMACEUTICAL PRODUCTS 0.00 0.00 0.00 31 FERTILIZERS 0.00 0.00 0.00 32 TANNING & DYE EXT ETC; DYE, PAINT, PUTTY ETC; INKS 8.80 3.16 -5.65 33 ESSENTIAL OILS ETC; PERFUMERY, COSMETIC ETC PREPS 35.15 14.43 -20.72 34 SOAP ETC; WAXES, POLISH ETC; CANDLES; DENTAL PREPS 17.55 7.39 -10.15 35 ALBUMINOIDAL SUBST; MODIFIED STARCH; GLUE; ENZYMES 8.38 2.46 -5.92 36 EXPLOSIVES; PYROTECHNICS; MATCHES; PYRO ALLOYS ETC 18.63 6.00 -12.63 37 PHOTOGRAPHIC OR CINEMATOGRAPHIC GOODS 22.42 5.03 -17.39 38 MISCELLANEOUS CHEMICAL PRODUCTS 7.07 2.83 -4.25 39 PLASTICS AND ARTICLES THEREOF 6.43 5.21 -1.21 40 RUBBER AND ARTICLES THEREOF 7.19 3.98 -3.21 41 RAW HIDES AND SKINS (NO FURSKINS) AND LEATHER 10.68 4.00 -6.68 42 LEATHER ART; SADDLERY ETC; HANDBAGS ETC; GUT ART 13.59 6.00 -7.59 43 FURSKINS AND ARTIFICIAL FUR; MANUFACTURES THEREOF 18.33 5.71 -12.62 44 WOOD AND ARTICLES OF WOOD; WOOD CHARCOAL 14.15 9.90 -4.25 45 CORK AND ARTICLES OF CORK 12.00 6.00 -6.00 46 MFR OF STRAW, ESPARTO ETC.; BASKETWARE & WICKERWRK 10.00 6.00 -4.00
Appendix I: Uganda's Preferential Tariff Rates by 2-digit 1996 HS Codes, 1994 and 2003
Preferential Tariff Rates, 1994
Preferential Tariff Rates, 2003
% Point Change Preferential Tariff
Rates

26
2-digit HS codes 47 WOOD PULP ETC; RECOVD (WASTE & SCRAP) PPR & PPRBD 1.84 3.37 1.53 48 PAPER & PAPERBOARD & ARTICLES (INC PAPR PULP ARTL) 7.27 4.94 -2.33 49 PRINTED BOOKS, NEWSPAPERS ETC; MANUSCRIPTS ETC 5.42 2.32 -3.11 50 SILK, INCLUDING YARNS AND WOVEN FABRIC THEREOF 12.80 6.00 -6.80 51 WOOL & ANIMAL HAIR, INCLUDING YARN & WOVEN FABRIC 13.25 5.94 -7.31 52 COTTON, INCLUDING YARN AND WOVEN FABRIC THEREOF 19.09 7.57 -11.52 53 VEG TEXT FIB NESOI; VEG FIB & PAPER YNS & WOV FAB 11.87 5.86 -6.01 54 MANMADE FILAMENTS, INCLUDING YARNS & WOVEN FABRICS 11.02 10.06 -0.95 55 MANMADE STAPLE FIBERS, INCL YARNS & WOVEN FABRICS 12.43 6.09 -6.35 56 WADDING, FELT ETC; SP YARN; TWINE, ROPES ETC. 14.52 4.23 -10.29 57 CARPETS AND OTHER TEXTILE FLOOR COVERINGS 20.87 6.00 -14.87 58 SPEC WOV FABRICS; TUFTED FAB; LACE; TAPESTRIES ETC 17.56 6.00 -11.56 59 IMPREGNATED ETC TEXT FABRICS; TEX ART FOR INDUSTRY 9.92 5.75 -4.17 60 KNITTED OR CROCHETED FABRICS 15.00 5.88 -9.12 61 APPAREL ARTICLES AND ACCESSORIES, KNIT OR CROCHET 18.38 6.00 -12.38 62 APPAREL ARTICLES AND ACCESSORIES, NOT KNIT ETC. 15.04 6.00 -9.04 63 TEXTILE ART NESOI; NEEDLECRAFT SETS; WORN TEXT ART 14.66 6.81 -7.84 64 FOOTWEAR, GAITERS ETC. AND PARTS THEREOF 15.00 5.86 -9.14 65 HEADGEAR AND PARTS THEREOF 20.45 6.00 -14.45 66 UMBRELLAS, WALKING-STICKS, RIDING-CROPS ETC, PARTS 23.57 6.00 -17.57 67 PREP FEATHERS, DOWN ETC; ARTIF FLOWERS; H HAIR ART 30.00 6.50 -23.50 68 ART OF STONE, PLASTER, CEMENT, ASBESTOS, MICA ETC. 13.26 5.83 -7.43 69 CERAMIC PRODUCTS 8.93 5.57 -3.36 70 GLASS AND GLASSWARE 12.36 5.37 -6.99 71 NAT ETC PEARLS, PREC ETC STONES, PR MET ETC; COIN 20.13 5.77 -14.36 72 IRON AND STEEL 6.01 4.11 -1.90 73 ARTICLES OF IRON OR STEEL 12.42 3.88 -8.53 74 COPPER AND ARTICLES THEREOF 12.07 4.00 -8.07 75 NICKEL AND ARTICLES THEREOF 10.31 4.50 -5.81 76 ALUMINUM AND ARTICLES THEREOF 5.71 4.03 -1.68 78 LEAD AND ARTICLES THEREOF 8.50 3.60 -4.90 79 ZINC AND ARTICLES THEREOF 8.18 3.20 -4.98 80 TIN AND ARTICLES THEREOF 7.44 3.00 -4.44 81 BASE METALS NESOI; CERMETS; ARTICLES THEREOF 10.00 3.96 -6.04 82 TOOLS, CUTLERY ETC. OF BASE METAL & PARTS THEREOF 11.28 4.00 -7.28 83 MISCELLANEOUS ARTICLES OF BASE METAL 11.40 5.28 -6.12 84 NUCLEAR REACTORS, BOILERS, MACHINERY ETC.; PARTS 4.89 0.44 -4.45 85 ELECTRIC MACHINERY ETC; SOUND EQUIP; TV EQUIP; PTS 10.83 3.45 -7.38 86 RAILWAY OR TRAMWAY STOCK ETC; TRAFFIC SIGNAL EQUIP 2.58 0.00 -2.58 87 VEHICLES, EXCEPT RAILWAY OR TRAMWAY, AND PARTS ETC 10.12 5.32 -4.80 88 AIRCRAFT, SPACECRAFT, AND PARTS THEREOF 10.00 0.53 -9.47 89 SHIPS, BOATS AND FLOATING STRUCTURES 14.18 1.29 -12.88 90 OPTIC, PHOTO ETC, MEDIC OR SURGICAL INSTRMENTS ETC 10.19 1.21 -8.98 91 CLOCKS AND WATCHES AND PARTS THEREOF 23.05 6.00 -17.05 92 MUSICAL INSTRUMENTS; PARTS AND ACCESSORIES THEREOF 30.00 4.00 -26.00 93 ARMS AND AMMUNITION; PARTS AND ACCESSORIES THEREOF 9.41 4.00 -5.41 94 FURNITURE; BEDDING ETC; LAMPS NESOI ETC; PREFAB BD 11.16 6.75 -4.41 95 TOYS, GAMES & SPORT EQUIPMENT; PARTS & ACCESSORIES 14.67 5.77 -8.91 96 MISCELLANEOUS MANUFACTURED ARTICLES 20.84 5.02 -15.82 97 WORKS OF ART, COLLECTORS' PIECES AND ANTIQUES 7.14 6.00 -1.14
Appendix I: Uganda's Preferential Tariff Rates by 2-digit 1996 HS Codes, 1994 and 2003 (concluded)
Preferential Tariff Rates, 1994
Preferential Tariff Rates, 2003
% Point Change Preferential Tariff
Rates

27
2-digit HS codes 01 LIVE ANIMALS 6.67 7.00 0.33 02 MEAT AND EDIBLE MEAT OFFAL 30.00 25.00 -5.00 03 FISH, CRUSTACEANS & AQUATIC INVERTEBRATES 30.00 15.00 -15.00 04 DAIRY PRODS; BIRDS EGGS; HONEY; ED ANIMAL PR NESOI 22.80 22.20 -0.60 05 PRODUCTS OF ANIMAL ORIGIN, NESOI 15.88 13.29 -2.59 06 LIVE TREES, PLANTS, BULBS ETC.; CUT FLOWERS ETC. 17.69 4.67 -13.03 07 EDIBLE VEGETABLES & CERTAIN ROOTS & TUBERS 30.00 15.00 -15.00 08 EDIBLE FRUIT & NUTS; CITRUS FRUIT OR MELON PEEL 20.00 15.00 -5.00 09 COFFEE, TEA, MATE & SPICES 25.15 7.09 -18.06 10 CEREALS 14.06 9.44 -4.63 11 MILLING PRODUCTS; MALT; STARCH; INULIN; WHT GLUTEN 28.82 11.86 -16.96 12 OIL SEEDS ETC.; MISC GRAIN, SEED, FRUIT, PLANT ETC 19.32 6.73 -12.59 13 LAC; GUMS, RESINS & OTHER VEGETABLE SAP & EXTRACT 21.67 7.00 -14.67 14 VEGETABLE PLAITING MATERIALS & PRODUCTS NESOI 28.18 6.63 -21.56 15 ANIMAL OR VEGETABLE FATS, OILS ETC. & WAXES 22.88 11.68 -11.21 16 EDIBLE PREPARATIONS OF MEAT, FISH, CRUSTACEANS ETC 30.00 15.00 -15.00 17 SUGARS AND SUGAR CONFECTIONARY 22.00 17.93 -4.07 18 COCOA AND COCOA PREPARATIONS 30.00 15.00 -15.00 19 PREP CEREAL, FLOUR, STARCH OR MILK; BAKERS WARES 26.25 17.50 -8.75 20 PREP VEGETABLES, FRUIT, NUTS OR OTHER PLANT PARTS 30.00 18.95 -11.05 21 MISCELLANEOUS EDIBLE PREPARATIONS 26.00 14.93 -11.07 22 BEVERAGES, SPIRITS AND VINEGAR 29.05 71.67 42.62 23 FOOD INDUSTRY RESIDUES & WASTE; PREP ANIMAL FEED 10.00 14.30 4.30 24 TOBACCO AND MANUFACTURED TOBACCO SUBSTITUTES 50.00 105.00 55.00 25 SALT; SULFUR; EARTH & STONE; LIME & CEMENT PLASTER 14.29 8.68 -5.61 26 ORES, SLAG AND ASH 10.00 6.59 -3.41 27 MINERAL FUEL, OIL ETC.; BITUMIN SUBST; MINERAL WAX 10.45 9.10 -1.35 28 INORG CHEM; PREC & RARE-EARTH MET & RADIOACT COMPD 10.00 5.03 -4.97 29 ORGANIC CHEMICALS 9.80 5.69 -4.10 30 PHARMACEUTICAL PRODUCTS 0.00 0.00 0.00 31 FERTILIZERS 0.00 0.00 0.00 32 TANNING & DYE EXT ETC; DYE, PAINT, PUTTY ETC; INKS 15.43 6.26 -9.18 33 ESSENTIAL OILS ETC; PERFUMERY, COSMETIC ETC PREPS 28.53 22.58 -5.95 34 SOAP ETC; WAXES, POLISH ETC; CANDLES; DENTAL PREPS 24.85 13.52 -11.33 35 ALBUMINOIDAL SUBST; MODIFIED STARCH; GLUE; ENZYMES 11.54 4.31 -7.23 36 EXPLOSIVES; PYROTECHNICS; MATCHES; PYRO ALLOYS ETC 21.25 15.00 -6.25 37 PHOTOGRAPHIC OR CINEMATOGRAPHIC GOODS 23.89 12.40 -11.49 38 MISCELLANEOUS CHEMICAL PRODUCTS 10.18 4.94 -5.23 39 PLASTICS AND ARTICLES THEREOF 12.17 9.60 -2.57 40 RUBBER AND ARTICLES THEREOF 13.56 6.92 -6.64 41 RAW HIDES AND SKINS (NO FURSKINS) AND LEATHER 30.00 7.00 -23.00 42 LEATHER ART; SADDLERY ETC; HANDBAGS ETC; GUT ART 26.36 15.00 -11.36 43 FURSKINS AND ARTIFICIAL FUR; MANUFACTURES THEREOF 18.33 13.86 -4.48 44 WOOD AND ARTICLES OF WOOD; WOOD CHARCOAL 28.38 17.29 -11.10 45 CORK AND ARTICLES OF CORK 12.86 15.00 2.14
Appendix II: Uganda's MFN Tariff Rates by 2-digit 1996 HS Codes, 1994 and 2003
MFN Tariff Rates, 1994
MFN Tariff Rates, 2003
Percentage Point Change MFN Tariff
Rates

28
2-digit HS codes 46 MFR OF STRAW, ESPARTO ETC.; BASKETWARE & WICKERWRK 28.33 15.00 -13.33 47 WOOD PULP ETC; RECOVD (WASTE & SCRAP) PPR & PPRBD 12.11 5.89 -6.21 48 PAPER & PAPERBOARD & ARTICLES (INC PAPR PULP ARTL) 15.05 9.21 -5.83 49 PRINTED BOOKS, NEWSPAPERS ETC; MANUSCRIPTS ETC 8.42 4.05 -4.37 50 SILK, INCLUDING YARNS AND WOVEN FABRIC THEREOF 13.00 15.00 2.00 51 WOOL & ANIMAL HAIR, INCLUDING YARN & WOVEN FABRIC 13.06 14.78 1.72 52 COTTON, INCLUDING YARN AND WOVEN FABRIC THEREOF 21.34 14.21 -7.13 53 VEG TEXT FIB NESOI; VEG FIB & PAPER YNS & WOV FAB 12.26 14.45 2.19 54 MANMADE FILAMENTS, INCLUDING YARNS & WOVEN FABRICS 14.77 16.08 1.32 55 MANMADE STAPLE FIBERS, INCL YARNS & WOVEN FABRICS 15.91 10.13 -5.78 56 WADDING, FELT ETC; SP YARN; TWINE, ROPES ETC. 24.81 8.27 -16.55 57 CARPETS AND OTHER TEXTILE FLOOR COVERINGS 30.00 15.00 -15.00 58 SPEC WOV FABRICS; TUFTED FAB; LACE; TAPESTRIES ETC 20.37 15.00 -5.37 59 IMPREGNATED ETC TEXT FABRICS; TEX ART FOR INDUSTRY 17.20 14.00 -3.20 60 KNITTED OR CROCHETED FABRICS 30.00 14.53 -15.47 61 APPAREL ARTICLES AND ACCESSORIES, KNIT OR CROCHET 20.00 15.00 -5.00 62 APPAREL ARTICLES AND ACCESSORIES, NOT KNIT ETC. 20.00 15.00 -5.00 63 TEXTILE ART NESOI; NEEDLECRAFT SETS; WORN TEXT ART 19.48 15.04 -4.45 64 FOOTWEAR, GAITERS ETC. AND PARTS THEREOF 30.00 14.45 -15.55 65 HEADGEAR AND PARTS THEREOF 30.00 15.00 -15.00 66 UMBRELLAS, WALKING-STICKS, RIDING-CROPS ETC, PARTS 30.00 15.00 -15.00 67 PREP FEATHERS, DOWN ETC; ARTIF FLOWERS; H HAIR ART 30.00 15.50 -14.50 68 ART OF STONE, PLASTER, CEMENT, ASBESTOS, MICA ETC. 21.79 14.33 -7.46 69 CERAMIC PRODUCTS 22.50 13.93 -8.57 70 GLASS AND GLASSWARE 17.98 12.95 -5.04 71 NAT ETC PEARLS, PREC ETC STONES, PR MET ETC; COIN 21.47 14.42 -7.05 72 IRON AND STEEL 11.96 7.07 -4.89 73 ARTICLES OF IRON OR STEEL 17.64 6.65 -10.98 74 COPPER AND ARTICLES THEREOF 12.07 7.00 -5.07 75 NICKEL AND ARTICLES THEREOF 10.31 9.00 -1.31 76 ALUMINUM AND ARTICLES THEREOF 15.88 7.65 -8.24 78 LEAD AND ARTICLES THEREOF 12.00 6.30 -5.70 79 ZINC AND ARTICLES THEREOF 12.73 5.60 -7.13 80 TIN AND ARTICLES THEREOF 12.22 5.25 -6.97 81 BASE METALS NESOI; CERMETS; ARTICLES THEREOF 10.00 6.94 -3.06 82 TOOLS, CUTLERY ETC. OF BASE METAL & PARTS THEREOF 20.62 7.00 -13.62 83 MISCELLANEOUS ARTICLES OF BASE METAL 20.00 12.11 -7.89 84 NUCLEAR REACTORS, BOILERS, MACHINERY ETC.; PARTS 11.31 0.77 -10.54 85 ELECTRIC MACHINERY ETC; SOUND EQUIP; TV EQUIP; PTS 18.58 6.67 -11.91 86 RAILWAY OR TRAMWAY STOCK ETC; TRAFFIC SIGNAL EQUIP 10.00 0.00 -10.00 87 VEHICLES, EXCEPT RAILWAY OR TRAMWAY, AND PARTS ETC 15.83 10.24 -5.60 88 AIRCRAFT, SPACECRAFT, AND PARTS THEREOF 10.00 0.93 -9.07 89 SHIPS, BOATS AND FLOATING STRUCTURES 17.35 3.06 -14.29 90 OPTIC, PHOTO ETC, MEDIC OR SURGICAL INSTRMENTS ETC 12.14 2.39 -9.74 91 CLOCKS AND WATCHES AND PARTS THEREOF 29.45 15.00 -14.45 92 MUSICAL INSTRUMENTS; PARTS AND ACCESSORIES THEREOF 30.00 7.00 -23.00 93 ARMS AND AMMUNITION; PARTS AND ACCESSORIES THEREOF 9.41 7.00 -2.41 94 FURNITURE; BEDDING ETC; LAMPS NESOI ETC; PREFAB BD 24.86 15.17 -9.70 95 TOYS, GAMES & SPORT EQUIPMENT; PARTS & ACCESSORIES 20.23 14.07 -6.16 96 MISCELLANEOUS MANUFACTURED ARTICLES 27.25 11.08 -16.17 97 WORKS OF ART, COLLECTORS' PIECES AND ANTIQUES 10.00 15.00 5.00
MFN Tariff Rates, 1994
MFN Tariff Rates, 2003
Percentage Point Change MFN Tariff
Rates
Appendix II: Uganda's MFN Tariff Rates by 2-Digit 1996 HS codes, 1994 and 2003 (concluded )

29
COMESA countryRank Rank
1 Burundi 176.68 53 25.44 1071 Dem.Rp.Congo 1,140.56 39 298.98 581 Djibouti 2,787.93 26 0.00 1341 Egypt 951.83 40 6,413.00 301 Eritrea 0.00 136 84.62 841 Ethiopia 521.70 44 53.58 951 Kenya 186,784.85 1 357,194.21 11 Madagascar 0.00 136 1.99 1291 Malawi 890.89 41 300.13 571 Mauritius 1,175.95 36 2,479.16 371 Namibia 0.00 136 200.91 641 Rwanda 74.46 66 534.14 531 Sudan 28.25 85 10.08 1171 Swaziland 0.00 136 9,999.18 231 Zambia 1,831.85 31 210.10 631 Zimbabwe 2,217.92 28 848.67 490 Afghanistan 0.00 136 93.52 820 Algeria 1.67 126 149.21 710 Andorra 0.00 136 29.44 1050 Antigua,Barb 1.15 132 1,071.14 460 Argentina 48.46 71 2,190.64 380 Aruba 0.00 136 3.20 1250 Asia Othr.ns 1,161.79 37 2,512.74 360 Australia 370.95 47 31,973.42 110 Austria 4,566.90 21 1,647.10 430 Azerbaijan 0.00 136 14.35 1140 Bahrain 81.28 64 178.39 670 Bangladesh 7,429.17 18 802.76 500 Barbados 77.93 65 0.00 1340 Belarus 0.00 136 4.95 1220 Belgium 0.00 136 23,047.56 140 Belgium-Lux 15,338.12 10 0.00 1340 Belize 34.61 79 47.66 970 Benin 20.47 88 0.00 1340 Botswana 0.00 136 123.76 740 Br.Ind.Oc.Tr 13.23 98 0.00 1340 Br.Virgin Is 6.73 110 5.94 1200 Brazil 1,804.00 32 3,111.65 340 Bulgaria 159.07 54 29.01 1060 Burkina Faso 29.40 82 0.80 1320 Cambodia 1.63 127 1.50 1310 Cameroon 18.38 94 34.23 1020 Canada 14,343.23 11 8,268.96 26
Appendix III: Uganda's Imports by Country of Origin, 1994 and 2003
Imports, 1994 (US$ thousand)
Imports, 2003 (US$ thousand)
(Based on data at the commodity level)

30
COMESA countryRank Rank
0 Cayman Is 1.52 129 0.00 1340 Chad 18.82 92 0.00 1340 Chile 0.56 134 18.02 1120 China 9,196.41 15 70,188.67 80 Colombia 31.63 80 7.34 1180 Congo 26.70 87 443.58 550 Cote Divoire 38.81 77 150.14 700 Cuba 0.00 136 2.68 1260 Cyprus 317.89 48 74.21 850 Czech Rep 20.17 89 695.19 520 Denmark 13,662.48 12 10,953.22 210 Dominica 18.99 91 98.76 790 Dominican Rp 1.26 130 0.00 1340 East Timor 82.55 63 0.00 1340 Ecuador 2.97 118 2.57 1270 Estonia 0.00 136 46.04 980 Finland 742.60 42 1,909.34 400 Fr.Guiana 4.03 113 0.00 1340 Fr.Polynesia 456.82 45 0.00 1340 France+Monac 11,508.95 13 15,643.87 180 Gambia 0.00 136 53.55 960 Georgia 0.00 136 100.50 770 Germany 31,290.16 6 39,085.10 100 Ghana 2.22 121 53.61 940 Gibraltar 18.66 93 0.00 1340 Greece 6.29 111 440.78 560 Grenada 90.53 61 20.16 1090 Guinea 48.77 70 32.14 1040 Guyana 0.00 136 25.00 1080 Honduras 65.81 67 17.27 1130 Hong Kong 15,863.72 9 16,789.43 160 Hungary 297.21 49 888.48 480 Iceland 144.33 55 714.26 510 India 46,783.64 4 102,079.14 20 Indonesia 1,475.70 34 4,684.74 310 Iran-Islam.R 89.34 62 1,877.86 410 Ireland 2,470.53 27 3,625.53 330 Israel 2,102.33 29 4,027.72 320 Italy 22,485.03 8 23,286.53 130 Jamaica 14.70 97 97.07 800 Japan 57,643.46 3 90,320.65 40 Jordan 442.76 46 132.96 730 Kazakhstan 0.00 136 1,259.95 44
Appendix III: Uganda's Imports by Country of Origin, 1994 and 2003 (continued )(Based on data at the commodity level)
Imports, 1994 (US$ thousand)
Imports, 2003 (US$ thousand)

31
COMESA countryRank Rank
0 Kiribati 42.45 74 0.00 1340 Korea D P Rp 1,151.19 38 96.10 810 Korea Rep. 3,376.00 22 6,947.52 280 Kuwait 114.70 57 2,130.10 390 Lebanon 46.59 72 64.18 900 Lesotho 0.00 136 11.10 1160 Libya 0.00 136 5.59 1210 Luxemberg 0.00 136 1.77 1300 Malaysia 1,784.65 33 42,055.07 90 Mali 0.52 135 40.71 1010 Malta 10.96 103 46.00 990 Mauritania 15.03 95 0.00 1340 Mexico 5.71 112 165.78 680 Montserrat 3.32 116 18.09 1110 Morocco 2.11 122 64.31 890 Mozambique 12.75 100 235.34 610 Myanmar 28.21 86 0.00 1340 N.Mariana Is 1.72 124 0.00 1340 Nauru 65.54 68 0.00 1340 Nepal 3.77 115 0.00 1340 Neth.Antiles 291.44 50 98.87 780 Netherlands 9,576.52 14 24,978.35 120 Neutral Zone 6.84 109 0.00 1340 New Calednia 104.87 58 0.00 1340 New Zealand 95.87 60 261.00 600 Nicaragua 0.00 136 2.40 1280 Niger 1.68 125 60.77 910 Nigeria 19.85 90 482.06 540 Niue 8.92 105 0.00 1340 Norway,Sb,JM 534.43 43 1,029.62 470 Oman 39.89 76 284.47 590 Pakistan 3,359.62 23 18,277.27 150 Palau 8.04 108 0.00 1340 Panama 0.00 136 32.43 1030 Papua N.Guin 0.00 136 4.00 1240 Philippines 8.86 106 117.51 750 Pitcairn 0.00 136 64.36 880 Poland 221.52 51 188.65 650 Portugal 30.46 81 187.95 660 Qatar 11.84 102 154.85 690 Rep.Moldova 0.00 136 88.49 830 Reunion 13.22 99 0.00 1340 Romania 2.86 119 67.68 870 Russian Fed 29.21 83 3,108.98 35
Appendix III: Uganda's Imports by Country of Origin, 1994 and 2003 (continued )(Based on data at the commodity level)
Imports, 1994 (US$ thousand)
Imports, 2003 (US$ thousand)

32
COMESA countryRank Rank
0 South Africa 6,488.50 20 98,907.77 30 Saudi Arabia 1,222.27 35 12,258.02 190 Senegal 1.60 128 69.99 860 Sierra Leone 0.85 133 18.35 1100 Singapore 8,091.33 17 11,360.32 200 Slovakia 0.00 136 145.80 720 Slovenia 0.00 136 55.32 930 Somalia 104.03 59 0.00 1340 Spain 3,029.99 25 15,880.01 170 Sri Lanka 0.00 136 232.80 620 St.Helena 0.00 136 6.99 1190 Suriname 28.55 84 0.64 1330 Sweden 3,275.89 24 8,786.20 240 Switz.Liecht 6,598.45 19 7,028.06 270 Syrian A.R. 44.27 73 100.72 760 Tanzania 8,992.63 16 10,783.41 220 Thailand 1,915.47 30 8,751.30 250 Togo 40.33 75 0.00 1340 Tokelau 8.70 107 4.19 1230 Tonga 9.43 104 0.00 1340 Trinidad Tbg 3.98 114 0.00 1340 Tunisia 14.86 96 12.29 1150 Turkey 0.00 136 1,820.40 420 Turks,Caicos 1.88 123 0.00 1340 Tuvalu 60.34 69 0.00 1340 Ukraine 178.48 52 1,098.00 450 Untd Arab Em 35,383.55 5 80,295.46 60 Untd.Kingdom 91,131.10 2 86,318.43 50 USA,PR,USVI 30,373.51 7 78,040.89 70 Venezuela 141.84 56 60.17 920 Viet Nam 3.30 117 6,475.54 290 Wallis Fut.I 12.21 101 0.00 1340 Westn.Sahara 1.20 131 0.00 1340 Yemen 35.63 78 42.64 1000 Yugoslavia 2.39 120 0.00 134
Appendix III: Uganda's Imports by Country of Origin, 1994 and 2003 (concluded )(Based on data at the commodity level)
Imports, 1994 (US$ thousand)
Imports, 2003 (US$ thousand)

33
References Baldwin, R.E., and A.J. Venables, 1995, “Regional Economic Integration,” in Handbook of
International Economics, Vol. 3, edited by G. Grossman and K. Rogoff (Amsterdam: Elsevier).
Broda, C., and D. Weinstein, 2004, “Globalization and the Gains from Variety,” NBER
Working Paper No. 10314 (Cambridge, MA: National Bureau of Economic Research).
Cernat, L., 2001, “Assessing Regional Trade Arrangements: Are South-South RTAs More
Trade Diverting?” UNCTAD Policy Issues in International Trade and Commodities Study Series No. 16 (New York: United Nations Conference on Trade and Development).
Clausing, K.A., 2001, “Trade Creation and Trade Diversion in the Canada – United States
Free Trade Agreement,” Canadian Journal of Economics, Vol. 34, No. 3. Coe, D., and A. Hoffmaister, 1999, “North-South Trade: Is Africa Unusual?” Journal of
African Economies, Vol. 8, No. 2, pp. 228–56. Dixit A. , Norman V., 1980, Theory of International Trade (Cambridge, UK: Cambridge
University Press). Feenstra, Robert, 2004, Advanced International Trade: Theory and Evidence
(Princeton, NJ: Princeton University Press). Fisman, Raymond J., and S.J. Wei, 2004, “Tax Rates and Tax Evasion: Evidence from
‘Missing Imports’ in China,” Journal of Political Economy, Vol. 112, No. 2, pp. 471–96.
Foroutan, F., and L. Pritchett, 1993, “Intra-Sub-Saharan African Trade: Is It Too Little?”
Journal of African Economies, Vol. 2, No. 1, pp. 74–105. Frankel, J.A., and S.J. Wei, 1995, “European Integration and the Regionalization of World
Trade and Currencies: The Economics and the Politics,” CIDER, Working Paper C95–053 (Berkeley, CA: Center for International Development Economics Research).
Frankel, J.A., E. Stein, and S.J. Wei, 1996, “Regional Trading Arrangements: Natural or
Supernatural?” American Economic Review, Vol. 86, No. 2, Papers and Proceedings. ———, 1993, “Continental Trading Blocs: Are They Natural, or Supernatural?” NBER
Working Paper No. 4588 (Cambridge, MA: National Bureau of Economic Research).

34
Harrison, G.W., T.F. Rutherford, and I. Wooton, 1993, “An Alternative Welfare Decomposition for Customs Unions,” Canadian Journal of Economics, Vol. 26, No. 4).
International Monetary Fund, 2002, Direction of Trade Statistics: Yearbook (Washington:
International Monetary Fund). Kee, H. L., Nicita, A. and M. Olarreaga, 2005, “Import Demand Elasticities and Trade
Distortions,” CEPR Working Paper No. 3452. (Washington: World Bank) Unpublished.
Krishna, P., 1998, “Regionalism and Multilateralism: A Political Economy Approach,”
Quarterly Journal of Economics, Vol. 113, No. 1, pp. 227–51. Krueger, A.O., 2000, “NAFTA’s Effects: A Preliminary Assessment,” World Economy,
Vol. 23, No. 6, pp. 761–75. ———, 1999, “Are Preferential Trading Arrangements Trade-Liberalizing or Protectionist?”
Journal of Economic Perspectives, Vol. 13, No. 4. ———, 1999, “Trade Creation and Trade Diversion Under NAFTA,” NBER Working Paper
No. 7429 (Cambridge, MA: National Bureau of Economic Research). Magee, C., 2003, “Endogenous Preferential Trade Agreements: An Empirical Analysis,”
Contributions to Economic Analysis and Policy, Vol. 2, No. 1. Martin, P., Mayer, T., and M. Thoenig, 2005, “Make Trade Not War,” CEPR Working Paper
No. 5218 (London: Centre for Economic Diplomacy Research). McIntyre, M., 2005, “Trade Integration in the East African Community: An Assessment for
Kenya,” IMF Working Paper No. 05/143 (Washington: International Monetary Fund). Rodrik, D., 1999, Making Openness Work (London: Overseas Development Institute). Romalis, J., 2005, “NAFTA’s and CUSFTA’s Impact on North American Trade.” NBER
Working Papers 11059 (National Bureau of Economic Research, Inc.). Schiff, M., 1997, “Small Is Beautiful: Preferential Trade Agreements and the Impact of
Country Size, Market Share, and Smuggling,” Journal of Economic Integration, Vol. 12, No. 3.
———, and L.A. Winters, 2003, Regional Integration and Development (Washington:
World Bank and Oxford University Press).

35
Spilimbergo, A., and E. Stein, 1996. “The Welfare Implications of Trading Blocs Among Countries with Different Endowments,” NBER Working Paper No. 5472 (Cambridge, MA: National Bureau of Economic Research).
Subramanian, A., and N. Tamirisa, 2001, “Africa's Trade Revisited,” IMF Working Paper
No. 01/33 (Washington: International Monetary Fund). Subramanian A., E. Gelbard, R. Harmsen, K. Elborgh-Woytek, and P. Nagy, 2000, Trade
and Trade Policies in Eastern and Southern Africa, IMF Occasional Paper No. 196 (Washington: International Monetary Fund).
Venables, A.J., 2002, “Winners and Losers from Regional Integration Agreements.”
Vol. 113, Issue 490, The Economic Journal. Viner, J., 1950, The Customs Union Issue (New York: Carnegie Endowment for International
Peace). World Bank, 2000, “Trade Blocs,” World Bank Policy Research Report (Washington:
World Bank). World Trade Organization (WTO), 2003, Regional Trade Agreements Notified to the
GATT/WTO and in Force By Date of Entry into Force. Available via the Internet: http://www.wto.org/english/tratop_e/region_e/region_e.htm.
Yang, Y., and S. Gupta, 2005. “Regional Trade Arrangements in Africa: Past Performance
and the Way Forward” IMF Working Paper 05/36 (Washington: International Monetary Fund).
Yeats, A., 1998a, “Does Mercosur's Trade Performance Raise Concerns about the Effects of
Regional Trade Arrangements?” The World Bank Economic Review, Vol. 12, No. 1. ———, 1998b, “What Can Be Expected from African Regional Trade Arrangements? Some
Empirical Evidence,” World Bank. Vol. 1, No. WPS 2004.