do small firms benefit from auditor ...raw.rutgers.edu/docs/seminars/spring11/ky_apr42011.pdfdo...
TRANSCRIPT
DO SMALL FIRMS BENEFIT FROM AUDITOR ATTESTATION OF INTERNAL CONTROL EFFECTIVENESS?
Gopal V. Krishnan* Department of Accounting
College of Business and Economics 621 Taylor Street Lehigh University
Bethlehem, PA 18015 Phone: 610-758-2816 Fax: 610-758-5992
E-mail: [email protected]
Wei Yu Department of Accounting
College of Business and Economics 621 Taylor Street Lehigh University
Bethlehem, PA 18015 Phone: 610-758-2815 Fax: 610-758-5992
E-mail: [email protected]
April 4, 2011
*Corresponding author. We thank seminar participants at Villanova University for helpful comments and suggestions. Gopal Krishnan appreciates the financial support from the Joseph R. Perella and Amy M. Perella Professorship.

1
DO SMALL FIRMS BENEFIT FROM AUDITOR ATTESTATION OF INTERNAL CONTROL EFFECTIVENESS?
Abstract
While auditor attestation of the effectiveness of internal control over financial reporting (ICFR) is required for firms with a public float of more than $75 million (accelerated filers), the SEC has delayed auditor attestation for non-accelerated filers several times. The Dodd-Frank Act of 2010 exempts non-accelerated filers from auditor attestation. Does auditor attestation add value incremental to the certifications by management on the effectiveness of ICFR, particularly for small firms? We examine the relation between auditor attestation and revenue quality for a sample of non-accelerated filers and small accelerated filers. We find that discretionary (abnormal) revenues, our proxy for revenue quality, are lower by about 1.3% of total assets for accelerated filers relative to non-accelerated filers. This finding holds even among firms whose management has certified their ICFR to be effective. Further, we find that the association between past earnings and current period cash flows is higher for accelerated filers. Overall, the findings support the notion that auditor attestation of the effectiveness of ICFR benefits small accelerated filers via higher revenue quality. Results of our market valuation tests indicate that both the book value of equity and the earnings of accelerated filers are valued more relative to non-accelerated filers. These results suggest that investors in small public firms regard auditors’ attestation of the effectiveness of ICFR adds value via higher revenue quality relative to firms that are not required to submit themselves to additional scrutiny by their auditors. We believe our findings are timely and potentially informative to regulators, investors, and others. Keywords: Dodd-Frank Act; SOX 404; Revenue quality; Non-accelerated filers; Valuation.

2
DO SMALL FIRMS BENEFIT FROM AUDITOR ATTESTATION OF INTERNAL CONTROL EFFECTIVENESS?
I. INTRODUCTION
Regulators regard a good internal control system as the foundation for high-quality
financial reporting (PCAOB 2004; Donaldson 2005; and U.S. House of Representatives 2005).
Several sections of the Sarbanes-Oxley Act of 2002 (SOX) mandate disclosure of information on
the effectiveness of internal control over financial reporting (ICFR). Section 404(a) requires
each company’s annual report to include an internal control report containing management’s
assessment of the effectiveness of ICFR (management report). Section 404(b) requires
companies to have the auditor evaluate the effectiveness of the internal controls and attest to the
assessment made by management. Currently, an auditor’s attestation of the effectiveness of
internal control is required only in the U.S. and Japan. Other countries rely on regulations that
mandate certifications by management to enhance the effectiveness of ICFR. Does Section
404(b) add value incremental to Sections 302 and 404(a), particularly for small firms? There is
limited empirical evidence on how auditor attestation of ICFR benefits small firms.
We attempt to provide some answers to the above question by exploiting the successive
implementation of SOX’s internal control provisions. Filing both the management report on
internal controls and the attestation by the auditor went into effect starting fiscal year 2004 for
accelerated filers.1 For non-accelerated filers, Section 404(a) became effective in 2007 and the
SEC has postponed the effective date for Section 404(b) several times, and in October 2009 the
SEC announced that it will be effective for fiscal years on or after June 15, 2010. However, the
Dodd–Frank Wall Street Reform and Consumer Protection Act (“DF Act”), signed by President
1 An accelerated filer is an issuer with a public float of at least $75 million defined as the aggregate worldwide market value of voting and non-voting common equity held by non-affiliates as of the last business day of the issuer’s most recent second fiscal quarter (SEC 2005).

3
Obama on July 21, 2010 permanently exempts non-accelerated filers from Section 404(b). Note
the various provisions of SOX, including certifications by the CEO and the CFO and Section
404(a) apply to both non-accelerated filers and accelerated filers. However, non-accelerated
filers were never subject to auditor attestation of the effectiveness of ICFR. Thus, this setting
presents a natural experiment to study the potential value of auditor attestation of the
effectiveness of ICFR.
Focusing on firms with less than $125 million and more than $25 million in total assets,
we examine two research questions. First, is there a difference in the revenue quality of
accelerated filers that are subject to auditor attestation of ICFR and non-accelerated filers? If
auditor attestation of the effectiveness of ICFR has an incremental effect on the quality of
revenue, then revenue quality should be higher for accelerated filers relative to non-accelerated
filers, ceteris paribus. On the other hand, for small firms, management certifications as well as
an audit of financial statements might be sufficient to enhance revenue quality.
We focus on revenue quality for the following reasons. Revenue growth is perhaps the
most important driver of firm valuation, especially for small firms (Jegadeesh and Livnat 2006).
Revenue is the largest component of earnings and is subject to discretion (Stubben 2010). Prior
research finds that more than 70% of SEC enforcement actions involve revenue manipulation
(Dechow and Schrand 2004).
Our second research question examines whether there is a difference in the investor
valuation of accelerated filers relative to non-accelerated filers. If investors value auditor
attestation of the effectiveness of ICFR, then financial statement elements, such as book value of
equity and earnings should be valued more for accelerated filers relative to non-accelerated

4
filers. However, compliance with Section 404(b) also imposes significant cost of compliance on
small firms. Thus, the net effect of auditor attestation on firm value is an empirical issue.
Our study is motivated by the following reasons. First, much of the empirical accounting
research, including prior research on internal controls focuses on large firms. Evidence on small
firms is important because they employ nearly half of all Americans, account for a large
proportion of businesses, and face significant financial reporting challenges (Federal Reserve
Bank of New York 2010; Beasley et al. 1999). Aguilar (2009), a SEC Commissioner, argues
that auditor attestation of the effectiveness of ICFR is important for small firms because
managers may be able to dominate and override existing internal controls.2 Further, these
companies may lack the necessary resources needed to maintain appropriate technical controls.
However, some commentators on SOX argue that auditor attestation of the effectiveness of ICFR
may not be needed. For example, Cutler (2006) states, “In small firms, even a drastically
reduced standard for internal controls may be sufficient, since the structure is far less complex
and the financial condition of the company is much more transparent.” Would management
certification of the effectiveness of ICFR suffice for small firms? We contribute to the literature
by providing empirical evidence on the incremental impact of compliance with Section 404(b)
on the revenue quality of small firms.
Second, it is estimated that more than 6,000 public companies would be exempt from
auditor attestation of internal controls due to the DF Act (Aguilar 2009). What are the financial
reporting implications of exempting non-accelerated filers from Section 404(b) of SOX?
2 One recent example of the implications of exempting small firms from Section 404(b) comes from the breathtaking fraud at Koss Corp, a maker of stereo headphones with a market capitalization of $32 million. Koss’s long-time Vice President of Finance and Secretary was indicted on six counts of wire fraud amounting to $31 million over the course of five years to pay for clothing, furs, jewelry, and other items (Whitehouse 2010). Koss had no formal internal audit function, and as a non-accelerated filer it was not required to get an auditor’s opinion on its internal controls.
5
Currently, there is limited empirical evidence on whether there is a difference between the
revenue quality of accelerated filers and non-accelerated filers. Our objective is to inform
regulators, investors, and others of the potential consequences of exempting non-accelerated
filers from Section 404(b) of SOX.3
Third, regulators might extend the exemption from Section 404(b) of SOX to more small
firms. The DF Act requires the SEC to study and report to Congress by the spring of 2011 how
the cost of compliance with Section 404(b) for firms with a market capitalization between $75
million and $250 million could be reduced. We believe our findings are potentially relevant to
the Congress as further exemptions from Section 404(b) are debated.
Our measure of revenue quality follows Stubben (2010). He presents evidence that his
measure of discretionary revenues is more powerful than commonly used accrual models. He
finds that his model is more likely than accrual models to detect a combination of revenue and
expense manipulation. Further, while his measure detects earnings management by firms subject
to enforcement actions by the SEC, the performance-matched discretionary accruals models do
not. We also use the ability of past earnings to predict future cash flows, a fundamental
objective of financial reporting (FASB 1978), as a supplementary measure.
Our sample period covers years 2007 through 2009 during which Section 404(a)
(management’s report on the effectiveness of ICFR) is required for both accelerated and non-
accelerated filers. During this period, compliance with Section 404(b) was required only for
3 The SEC was not in favor of exempting non-accelerated filers from Section 404(b) (SEC 2003). The SEC Chairman Mary Schapiro (SEC 2009b) stated, “I believe that…Section 404 continues to significantly improve investor confidence in the integrity of companies’ financial reports and reporting.” In their letter to lawmakers, investor advocacy groups such as the American Association of Individual Investors, the CFA Centre for Financial Market Integrity, the Council of Institutional Investors, and the Consumer Federation of America state, “…we strongly oppose any effort to further defer or exempt public companies from the internal control requirements of Section 404. Such efforts would do a grave disservice to investors whose trust in the markets is an essential ingredient in any financial recovery” (CFA Institute 2009).

6
accelerated filers. Note other provisions of SOX, such as certifications of financial statements by
the CEO and the CFO, independent audit committee are required for both accelerated and non-
accelerated filers.
We document several key findings. First, on average, discretionary (abnormal) revenues
are lower by about 1.3% of total assets for accelerated filers relative to non-accelerated filers.
This finding is significant at the 0.01 level and robust to controlling for several firm
characteristics, such as size, market-to-book, leverage, performance, sales growth, operating
cycle, past accruals, cash flow volatility, auditor type and others. Our results are qualitatively
similar when we match accelerated and non-accelerated observations by year, industry, and total
assets.
Second, we exclude observations with ineffective internal controls, i.e., no significant
deficiency and examine a sample of non-accelerated filers whose managers have certified under
Section 404(a) that their internal controls are effective, along with a sample of accelerated filers
whose managers and auditors have certified their internal controls to be effective. Once again,
we find that the discretionary revenues are lower by about 1.5% for accelerated filers relative to
non-accelerated filers (significant at the 0.01 level). This finding indicates that even among firms
that claim to have effective internal controls, abnormal revenues are lower i.e., higher revenue
quality for accelerated filers relative to non-accelerated filers.
Third, we also identify a sample firms that appear to have changed their status from being
an accelerated filer to a non-accelerated filer. If the higher revenue quality associated with
accelerated filers is due to auditor attestation of the effectiveness of ICFR, then we should expect
a lower revenue quality for those firms exiting the accelerated filer status. We find that

7
discretionary revenues have increased by about 1.2% of total assets following the change from
an accelerated filer to a non-accelerated filer (significant at the 0.01 level).
Fourth, we find that the association between past earnings and current period cash flows,
a commonly used measure of earnings quality, is higher (significant at the 0.01 level) for
accelerated observations relative to non-accelerated observations. In other words, the predictive
value of earnings for future cash flows is higher for accelerated filers.
Fifth, results of our market valuation tests indicate that the book value of equity of
accelerated filers is valued more by investors relative to the book value of equity of non-
accelerated filers (significant at the 0.01 level). Finally, when we retain only those observations
with effective internal controls for both accelerated and non-accelerated filers, we find that both
the book value of equity and the earnings of accelerated filers are valued more relative to the
book value of equity and the earnings of non-accelerated filers. These results are significant at
the 0.01 level. We obtain similar results when we match accelerated and non-accelerated
observations by year, industry, and total assets.
Overall, our results are consistent with higher revenue quality for small accelerated filers
relative to non-accelerated filers after controlling for firm size and other characteristics. Further,
when we restrict the sample to accelerated filers with auditor attested effective internal controls
and non-accelerated filers with only manager certified effective internal controls, we find that the
investor valuation of book value of equity and earnings are higher for accelerated filers. Our
findings support the notion that investors in small public firms regard auditors’ assessment of the
effectiveness of internal controls adds value via higher revenue and earnings quality relative to
firms that are not required to submit themselves to additional scrutiny by their auditors. We
believe our findings are timely and potentially informative to capital market participants.

8
The rest of this paper is organized as follows. The next section summarizes the
development of regulation on internal controls and prior research on the relation between internal
control and financial reporting quality. The hypothesis and research design are presented in
section three, followed by sample selection. Results are in section five, conclusions in section
six.
II. BACKGROUND AND PRIOR RESEARCH Development of Internal Control Regulation
Internal control regulation for U.S. companies goes back to 1977 when the Foreign
Corrupt Practices Act (FCPA) was passed in response to questionable corporate political
campaign finance practices and foreign corrupt practices in the mid-1970s. FCPA required
companies to implement internal control programs. In 1987 the Treadway Commission issued a
report on factors that led to fraudulent financial reporting and made recommendations, including
strengthening internal controls to reduce the occurrence of fraudulent financial reporting.
Following this report, the Committee of Sponsoring Organizations (COSO) was formed to
develop an integrated framework of internal control; in 1992 COSO released guidance for
designing and implementing effective internal controls. According to COSO, the potential
benefits of having effective internal controls are effective and efficient operations, enhanced
reliability of financial reporting, and compliance with applicable laws and regulations.
Before SOX, there was no mandatory reporting of internal control weaknesses except
when a firm changed its auditors. A significant development in internal control regulation
occurred in 1993 when the Federal Deposit Insurance Corporation (FDIC) required each insured
depository institution with $500 million or more in total assets to perform an assessment by
management of the effectiveness of the internal controls over financial reporting and an auditor’s
9
attestation on the management’s assertion concerning the institution’s internal controls.
Although this regulation applied only to publicly held banks, it became the blueprint for Section
404 of SOX.
Section 302 of SOX became effective in August 2002 and requires the firm’s CEO and
CFO to certify 10-K and 10-Q reports, establish and maintain internal controls, evaluate the
effectiveness of internal controls within 90 days of the report and report their conclusion about
its effectiveness, disclose to the auditors and the audit committee all significant deficiencies in
internal controls, and identify for the auditors any material weaknesses in internal control (Gavin
2009). Certifications under Section 302 are not attested by the auditor.
Both Sections 404(a) and 404(b) became effective for accelerated filers in November
2004. For non-accelerated filers, Section 404(a) became effective in December 2007. Unlike
Section 302, management is required to test the effectiveness of ICFR under Section 404(a).
Section 404(b) requires auditors to test ICFR and present an opinion on its effectiveness.4
Compliance with Section 404(b) for non-accelerated filers was delayed several times by the
SEC. The Dodd-Frank Act, passed in July 2010, exempts non-accelerated filers from Section
404(b).
Prior Research
There is a growing literature on internal control regulation under Sections 302 and 404 of
SOX. Doyle et al. (2007) examine disclosure of material internal control weakness during the
years 2002 through 2005 under Section 302 and 404 and find that firms with weak internal
control over financial reporting have lower accruals quality, i.e., poor earnings quality. Beneish
4 Effective 2007, Auditing Standard 5 (AS5) replaced AS2. AS5 is designed to provide guidance to auditors on how to more effectively identify internal control weakness; unlike AS2, AS5 is more principles-based and uses a top-down, holistic approach toward risk assessment (Jiang and Wu 2009). Further, under AS5 auditors are no longer required to audit management’s ICFR assessment.

10
et al. (2008) examine the stock market reactions to disclosures of material weaknesses under
Sections 302 and 404 during the years 2004 and 2005 and find that the adverse stock market
reaction is greater for non-accelerated filers than for accelerated filers. Further, non-accelerated
filers reporting internal control weaknesses also experience an abnormal increase in equity cost
of capital while no such increase is found for accelerated filers. Ashbaugh-Skaife et al. (2008)
provide evidence that changes in internal control effectiveness can impact accrual quality. In a
recent study, using a sample of smaller accelerated filers and larger non-accelerated filers Nagy
(2010) finds that compliance with Section 404 during the years 2005 and 2006 reduces the
likelihood of misstatements in financial statements.
Our study differs from prior research in several ways. First, while small firms have often
been ignored in prior research, we focus on small accelerated and non-accelerated firms. This is
important because there is limited empirical evidence on how auditor attestation of ICFR
benefits small firms. Further, regulators are contemplating granting exemption from Section
404(b) of SOX to more small firms. To the best of our knowledge, ours is the first study to
examine the association between compliance with Section 404(b) and revenue quality of small
public firms.
Second, unlike prior research, we distinguish between non-accelerated filers who claim to
have effective ICFR, i.e., a clean management report under Section 404(a), and non-accelerated
filers with ineffective ICFR. This is important, because this analysis sheds light on the
incremental value of compliance with Section 404(b) beyond management’s certification of the
effectiveness of ICFR. Our results indicate that compliance with Section 404(b) is associated
with higher revenue quality even among firms that claim to have effective ICFR. Further, results
from our market valuation tests also indicate that investors value the book value of equity and

11
earnings of accelerated filers more relative to non-accelerated filers even among firms with
effective ICFR.
Third, by focusing on year 2007 when compliance with Section 404(a) of SOX became
effective for non-accelerated filers, our research design facilitates teasing out the effect of
Section 404(b) on revenue quality and investor valuation from the effects of other SOX
provisions.
III. HYPOTHESIS AND RESEARCH DESIGN Impact of Auditor Attestation of Internal Controls on Revenue Quality Investment in internal control systems can add value to an organization via operating
efficiencies, safeguarding assets, more reliable financial statements, and realizing an
organization’s goals and objectives.5 Congress and regulators regard a good internal control
system as the foundation for high-quality financial reporting (PCAOB 2004; Donaldson 2005;
and U.S. House of Representatives 2005). Note that poor internal controls can lead to both
unintentional and intentional errors (e.g., management override of internal control) which can
adversely affect financial reporting quality.
A recent study by Audit Analytics (2009) examined Section 404 disclosures during the
period November 2007 through November 2008 by non-accelerated and accelerated filers and
reports three significant findings. First, the rates of restatements of financial statements after a
company claimed to have effective internal controls over financial reporting were 5.1% for
accelerated filers and 7.4% for non-accelerated filers, i.e., 46% higher for non-accelerated filers.
Second, since the internal control assessment process occurs before SOX 404 disclosure, the
5 Feng et al. (2009) find that earnings guidance is less accurate in firms with ineffective internal controls. Thus, in addition to the adverse impact on external reporting, poor internal control could also affect the quality of internal management reports and decisions based on these reports.
12
study also looked at restatements that occurred within the 90 days prior to the SOX disclosure
and found that among firms that reported ineffective internal controls, the rate of restatement for
non-accelerated filers increased from 12.47% to 15.79%, while for accelerated filers the rate
jumped from 12.97% to 26.51%, indicating that auditor involvement in internal control
assessment increases the likelihood of restatements by client firms. Third, while only two
accelerated filers were silent or ambiguous about the effectiveness of their internal controls, 202
non-accelerated filers failed to properly disclose the status of internal controls and, subsequently,
30 of them restated their financial statements. This suggests that disclosures under Section
404(a) are potentially misleading or uninformative for some non-accelerated filers. Overall,
these findings indicate that auditor attestation of management’s assessment of the effectiveness
of internal controls over financial reporting enhances financial reporting quality.
However, some commentators on SOX argue that other provisions of SOX, such as the
certifications by the CEO and CFO required under Section 302, as well as the management’s
assessment of internal controls required under Section 404(a), board independence, audit
committee independence, and restrictions on nonaudit services might be sufficient for small
firms (Cutler 2006). Therefore, we present our hypothesis in null form is as follows:
H: There is no difference in revenue quality between small accelerated filers and non- accelerated filers.
Revenue Quality of Accelerated Filers vs. Non-accelerated Filers
In this section we describe the research design concerning our first research question
whether there is a difference in the revenue quality of accelerated filers and non-accelerated
filers. We do this by using three different, though not mutually exclusive, samples of accelerated
and non-accelerated filers. All samples are for the years 2007 through 2009. Our first sample

13
includes observations with total assets between $25 million and $125 million. We exclude
observations with less than $25 million to exclude very small non-accelerated filers and to ensure
that the non-accelerated and the accelerated filers in our sample are comparable in terms of firm
size.6
Our second sample excludes observations with ineffective internal controls, i.e., we focus
on non-accelerated filers and accelerated filers with no significant deficiencies in their ICFR.
Thus, this sample consists of observations with a “clean opinion” from the management (for both
accelerated and non-accelerated filers) and auditors (for accelerated filers). This is an important
sample because it could shed light on whether auditor attestation adds value even in firms that
claim to have effective ICFR. Our third sample consists of accelerated and non-accelerated
observations matched on year, industry, and beginning total assets. This sample mitigates the
concern that our results are driven by firm size.
Our measure of revenue quality is the discretionary (abnormal) revenues measure
developed by Stubben (2010). He compares his discretionary revenue models with several
commonly used accrual models, such as the Jones model, modified Jones model, and Dechow
and Dichev measure of accruals quality by assessing the models’ abilities to detect simulated
revenue and expense manipulations. He uses simulation as well as actual cases of revenue and
expense manipulation by firms subject to enforcement by the SEC. Overall, his findings indicate
that the discretionary revenue models are less biased, better specified, and more powerful than
commonly used accrual models. Most importantly, his revenue models detect actual instances of
manipulation while accrual models do not.
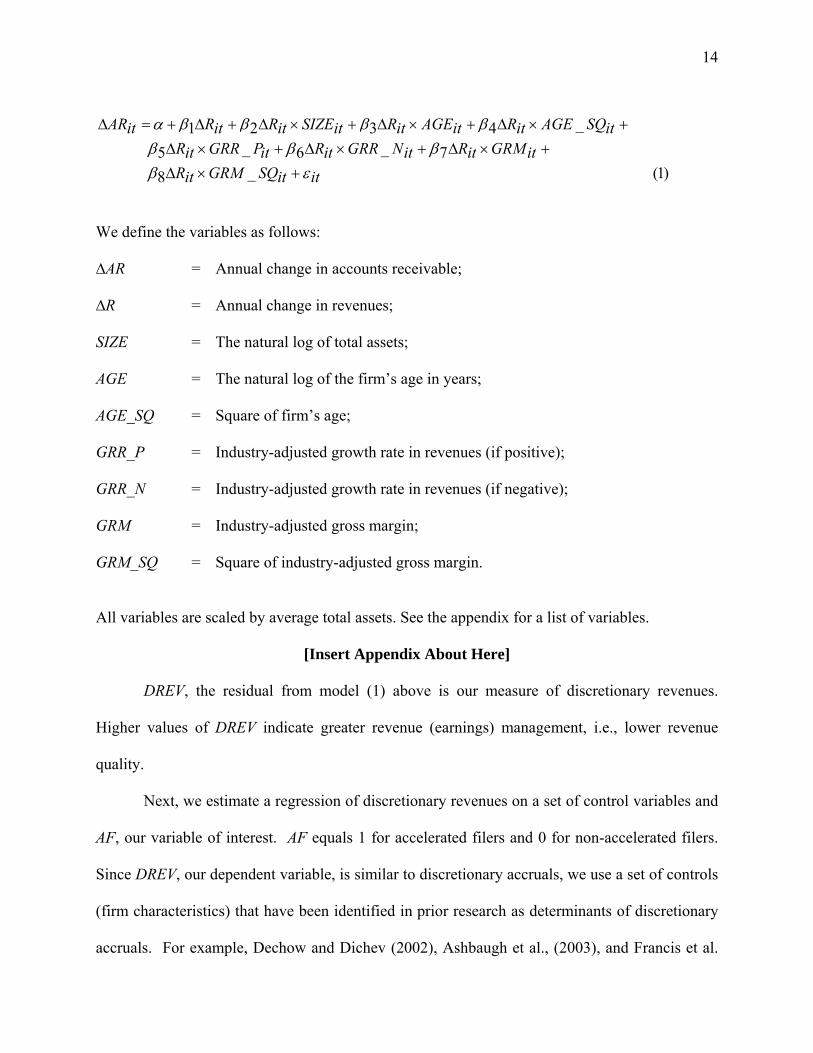
We estimate discretionary revenues using his conditional revenue model7:
6 We also use alternate cutoffs as well as an alternative proxy for firm size and those results are discussed under sensitivity analyses. 7 We also use Stubben’s (2010) basic revenue model and those results are discussed in a later section.
14
)1(_87_6_5
_4321
ititSQGRMitRitGRMitRitNGRRitRitPGRRitR
itSQAGEitRitAGEitRitSIZEitRitRitAR
εββββ
ββββα
+×Δ+×Δ+×Δ+×Δ
+×Δ+×Δ+×Δ+Δ+=Δ
We define the variables as follows:
∆AR = Annual change in accounts receivable; ∆R = Annual change in revenues; SIZE = The natural log of total assets; AGE = The natural log of the firm’s age in years; AGE_SQ = Square of firm’s age; GRR_P = Industry-adjusted growth rate in revenues (if positive); GRR_N = Industry-adjusted growth rate in revenues (if negative); GRM = Industry-adjusted gross margin; GRM_SQ = Square of industry-adjusted gross margin. All variables are scaled by average total assets. See the appendix for a list of variables.
[Insert Appendix About Here] DREV, the residual from model (1) above is our measure of discretionary revenues.
Higher values of DREV indicate greater revenue (earnings) management, i.e., lower revenue
quality.
Next, we estimate a regression of discretionary revenues on a set of control variables and
AF, our variable of interest. AF equals 1 for accelerated filers and 0 for non-accelerated filers.
Since DREV, our dependent variable, is similar to discretionary accruals, we use a set of controls
(firm characteristics) that have been identified in prior research as determinants of discretionary
accruals. For example, Dechow and Dichev (2002), Ashbaugh et al., (2003), and Francis et al.

15
(2004) find that discretionary accruals are associated with firm size, market-to-book ratio,
leverage, losses, cash flow from operations, sales growth, financial distress, prior period
accruals, operating cycle, mergers and acquisitions, volatility of cash flow, volatility of sale,
litigation risk, institutional holding, and auditor type. Thus, we estimate the following model:
)2(17
416151413121110987
6543210
itIDitAFitBIGitINSTitLITIGNitFINANCEitMA
itVOLSALEitVOLCFOitLOPCYCLitLACCitZitSGROWitCFOitLOSSitLEVitMTBitSIZEitDREV
εχχχχχχ
χχχχχχχχχχχχ
++++++++
+++++++++++=
where: DREV = Residual from model (1) for firm i for year t; SIZE = The natural log of the firm’s market value of equity at fiscal year-end measured in millions of dollars; MTB = Market value of equity divided by book value of assets; LEV = The firm’s long-term debt divided by its total assets; LOSS = An indicator variable that equals 1 if the firm reports a loss in the current year, and 0 otherwise; CFO = Cash flow from operations scaled by beginning of year total assets; SGROW = Sales growth defined as sales in year t minus sales in year t-1 scaled by sales in year t; Z = Zmijewski’s (1984) probability of bankruptcy score. Z-score calculated as: - 4.3 - 4.5 x net income scaled by total assets + 5.7 x total liability scaled by total assets - 0.004 x current assets / current liability; LACC = Last year’s total accruals equal to net income before extraordinary items minus operating cash flows scaled by beginning of year total assets; LOPCYCL = The natural log of operating cycle, measured by accounts receivable cycle and inventory cycle (360 x averages of account receivables / sales + 360 x average of inventories /cost of goods sold and each cycle is truncated at 360 days);
16
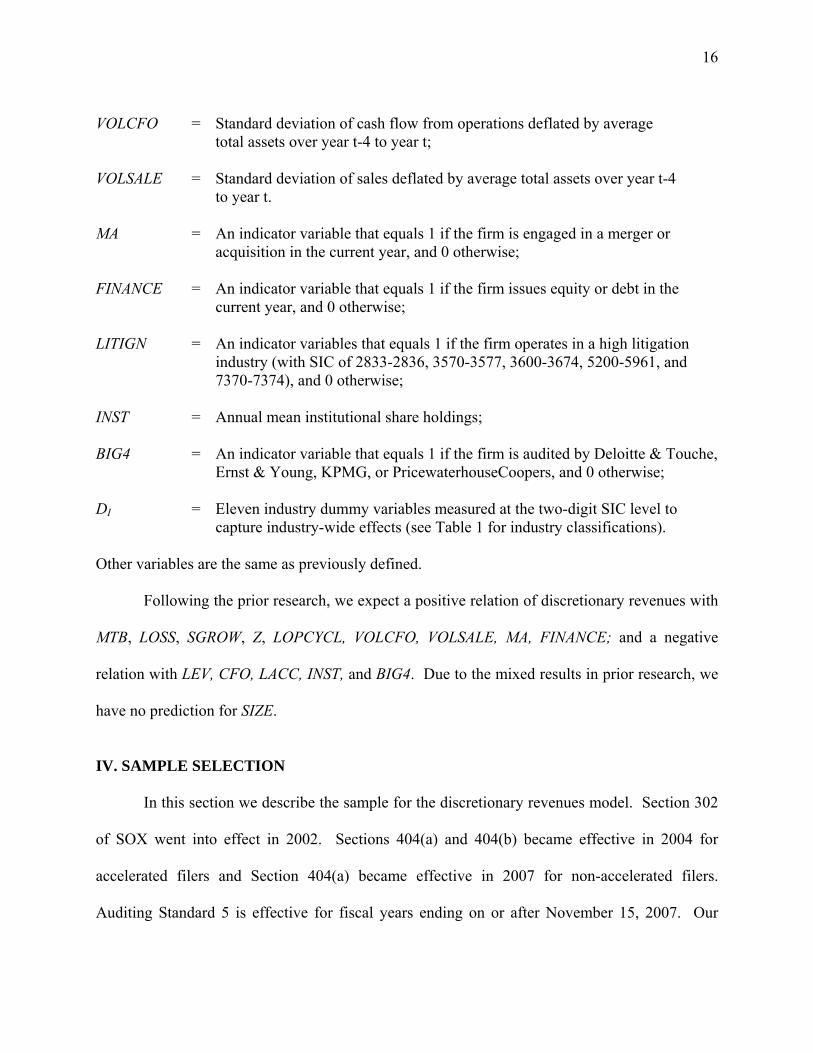
VOLCFO = Standard deviation of cash flow from operations deflated by average total assets over year t-4 to year t; VOLSALE = Standard deviation of sales deflated by average total assets over year t-4 to year t. MA = An indicator variable that equals 1 if the firm is engaged in a merger or acquisition in the current year, and 0 otherwise; FINANCE = An indicator variable that equals 1 if the firm issues equity or debt in the current year, and 0 otherwise; LITIGN = An indicator variables that equals 1 if the firm operates in a high litigation industry (with SIC of 2833-2836, 3570-3577, 3600-3674, 5200-5961, and 7370-7374), and 0 otherwise; INST = Annual mean institutional share holdings; BIG4 = An indicator variable that equals 1 if the firm is audited by Deloitte & Touche, Ernst & Young, KPMG, or PricewaterhouseCoopers, and 0 otherwise; DI = Eleven industry dummy variables measured at the two-digit SIC level to capture industry-wide effects (see Table 1 for industry classifications). Other variables are the same as previously defined.
Following the prior research, we expect a positive relation of discretionary revenues with
MTB, LOSS, SGROW, Z, LOPCYCL, VOLCFO, VOLSALE, MA, FINANCE; and a negative
relation with LEV, CFO, LACC, INST, and BIG4. Due to the mixed results in prior research, we
have no prediction for SIZE.
IV. SAMPLE SELECTION In this section we describe the sample for the discretionary revenues model. Section 302
of SOX went into effect in 2002. Sections 404(a) and 404(b) became effective in 2004 for
accelerated filers and Section 404(a) became effective in 2007 for non-accelerated filers.
Auditing Standard 5 is effective for fiscal years ending on or after November 15, 2007. Our

17
sample period covers years 2007 through 2009, which allows us to test the incremental effect of
404(b) on revenue quality. We identify accelerated and non-accelerated filers from Audit
Analytics. We obtain financial data from Compustat. After merging these two datasets, we
retain firm-years for which all necessary data are available. We include only firm-years with
fiscal year-end in December. We exclude the financial service and utility industries. Further, to
focus on small firms we exclude firm-years with beginning total assets less than $25 million or
greater than $125 million. Our final sample consists of 783 firm-years and 427 unique firms, of
which 66% of total firm-years (520 firm-years) and 67% of unique firms (286 firms) represent
accelerated filers.
Table 1 reports distribution by industry for accelerated and non-accelerated filers. The
top-three industry categories are the same for both accelerated and non-accelerated filers:
machinery, scientific instruments and miscellaneous manufacturing (two-digit SIC 35-39),
chemicals, stone, and concrete products (SIC 28-32), and lodging, business and other services
(SIC 70-79). More than 28% (15%) of the accelerated (non-accelerated) observations come from
the chemicals industry. More than 47% (30%) of the non-accelerated (accelerated) observations
come from the machinery industry. We include industry fixed-effects in our models to control
for industry effects.
[Insert Table 1 about Here]
Panel A of Table 2 presents the descriptive statistics for the variables used in model (2).
Panels B and C present the descriptive statistics for accelerated filers and non-accelerated filers,
respectively. The mean values of SIZE for accelerated and non-accelerated filers are,
respectively, 4.463 and 4.037.8 This indicates that accelerated filers in our sample are larger than
8 The mean values of total assets for accelerated and non-accelerated filers are, respectively, $102 million and $66 million.

18
non-accelerated filers. MTB and SGROW are also higher for accelerated observations. About
59% of the accelerated observations are audited by a Big 4 auditor compared to 40% for non-
accelerated observations. The mean value of DREV, our revenue quality measure, for
accelerated and non-accelerated filers are, respectively, -0.007 and 0.004. Recall that higher
values of DREV indicate greater revenue management. In other words, revenue quality appears
to be higher for accelerated observations relative to non-accelerated observations.
[Insert Table 2 About Here] V. RESULTS
Results of Revenue Quality of Accelerated Filers vs. Non-accelerated Filers
Results of model (2) are in Table 3. Coefficients on industry-dummy variables are not
tabulated. Note t-statistics are based on clustering of standard errors by firm and year. We
estimate two specifications. First, we drop all the control variables and include only AF (results
not tabulated). The coefficient on AF, the variable of interest is -0.012 and highly significant (t-
statistic = -4.20). Results of the second specification with all the control variables indicate that
MTB, LOSS, CFO, Z, LACC, MA, and INST are positively associated with discretionary revenues
(significant at the 0.10 level or better). LEV and LOPCYCL are negatively associated with
discretionary revenues while SIZE is not significant. The coefficient on AF is -0.013 and
significant at the 0.01 level. This finding rejects our null hypothesis. This indicates that on
average, discretionary revenues are lower by about 1.3% of total assets for accelerated filers
relative to non-accelerated filers. In terms of economic significance, the effect of discretionary
revenues on net income is about 13.97%.9 Overall, this result is consistent with higher revenue
9 The mean total (beginning) assets for non-accelerated filers were $64.24 million and the mean net income for non-accelerated filers was $-5.98 million. The effect of discretionary revenues on net income (in absolute value) = ($64.24 X 0.013) / $5.73 = 13.97%.

19
quality, as proxied by (lower) abnormal revenues, for accelerated observations relative to non-
accelerated observations. This finding supports the notion that auditor attestation of the
effectiveness of ICFR benefits small accelerated filers via higher revenue quality.10
[Insert Table 3 About Here]
Next, we re-estimate model (2) after excluding observations with ineffective internal
control (significant deficiencies or material weaknesses in ICFR). This analysis is important
because it can shed light on whether management certification of effective ICFR is sufficient for
small firms. Put it differently, does auditor attestation add value incremental to management
certification for firms that do not have any significant deficiency in ICFR (as claimed by
management)? We retain non-accelerated observations with a “clean” opinion under Sections
302 and 404(a) and accelerated observations with a “clean” opinion under Sections 302, 404(a),
and (b). The number of observations available for this test is 482 and the results are in Table 4.
We find that the coefficient on AF is -0.015 (significant at the 0.01 level). This indicates
that on average, discretionary revenues are lower by about 1.5% of total assets for accelerated
filers relative to non-accelerated filers. This finding is consistent with the result in Table 3 and
indicates that the higher revenue quality associated with accelerated filers holds even among
observations with effective ICFR.
[Insert Table 4 About Here]
To mitigate the concern that our results could be driven by firm size, we match
accelerated and non-accelerated observations by year, two-digit SIC, and beginning total assets
and re-estimate model (2). We do not impose a size constraint and the number of observations
10 Our results do not appear to be driven by extreme discretionary revenue observations. We partition the sample into quintiles of discretionary revenues and drop the top quintile (observations with the largest discretionary revenues) and re-estimate model (2). The coefficient on AF continues to be negative and significant at the 0.01 level.

20
available for this test is 1,180.11 The results are in Table 5. SIZE is not significant and the
variable of interest, AF is -0.008 and significant at the 0.05 level. Overall, findings in Tables 3
through 5 support the notion that compliance with Section 404(b) is associated with higher
revenue quality.
[Insert Table 5 About Here]
Sensitivity Analyses
We also perform a number of sensitivity checks and additional analyses to assess the
robustness of our findings to alternative size cutoffs, size proxy, specifications, and measures of
earnings quality. We discuss them below.
Alternate cutoffs. We examine whether our results are sensitive to alternate cutoff values for firm
size. We consider three alternate cutoffs based on total assets: $50 million to $150 million; less
than $150 million; and less than $200 million. Untabulated results from model (2) indicate that
the coefficient on AF is negative and significant for all three alternative cutoffs. These results
indicate that our results are not sensitive to alternate cutoff values for firm size.
Alternative measure of firm size. We use sales as an alternate measure of firm size. Once again,
we retain observations with total sales in the $25 - $125 million range. Untabulated results
indicate that the coefficient on AF -0.011 (significant at the 0.001 level). These findings indicate
that our results are robust to alternative measures of firm size.
11 The difference in mean values of total assets between accelerated filers and non-accelerated filers is not statistically significant.

21
Change in compliance status. Under the SEC (2005) rules, a company may exit the accelerated
filer status in the same year when its public float has dropped below $50 million.12 To identify
firms that may have changed their status from being an accelerated filer to a non-accelerated
filer, we look for firms that filed a Section 404(b) report in the previous year but not in the
current year. This suggests that these firms are no longer accelerated filers. If the higher revenue
quality associated with accelerated filers is due to auditor attestation of the effectiveness of
ICFR, then we should expect a lower revenue quality for those firms exiting the accelerated filer
status. We examine whether discretionary revenues have changed for these firms following the
change in their compliance status. We identify 75 such firms during the period 2005 through
2009. Thus, we reestimate model (2) using 150 (pre and post-status change) observations. We
replace AF with an indicator variable POST that equals 1 for the year when a firm became a non-
accelerated filer (the year of the change in the compliance status) 0 for the year before the
change. The results are in Table 6. We find that the coefficient on POST is 0.012 (significant at
the 0.01 level). This indicates that discretionary revenues have increased by about 1.2% of total
assets following the change from an accelerated filer to a non-accelerated filer.13 This finding is
consistent with the findings in Tables 3 through 5 and supports the notion that auditor attestation
of ICFR has a favorable impact on revenue quality.
[Insert Table 6 About Here]
12 Gao et al. (2009) provide evidence that some non-accelerated filers attempt to stay small to avoid compliance with Section 404(b) of SOX. 13 We verify that out of 150 firm-year observations in Table 6 (i.e., 75 firms) market value of equity is less than $50 million for 100 observations in the year following the status change to non-accelerated filers. When we reestimate model (2) using these observations, we find that the coefficient on POST is 0.010 (significant at the 0.10 level for a one-tailed test).

22
Controlling for internal control weakness. Our results are robust to controlling for internal
weakness, i.e., an adverse opinion under Section 404(b). While internal control weakness is
insignificant, the coefficient on AF is negative and significant at the 0.01 level.
Alternative measures of revenue and earnings quality. We use two additional measures of
revenue and earnings quality. First, is the discretionary revenue estimated from Stubben’s (2010)
revenue model:
)3(43_1 21 itititit RRAR εββα +Δ+Δ+=Δ
We define the variables as follows:
∆AR = Annual change in accounts receivable; ∆R1_3 = Annual change in revenues in the first three quarters; and ∆R4 = Annual change in revenues in the fourth quarter. The residual from model (3) is our alternate discretionary revenues measure. Stubben
(2010) finds that the revenue model performs as well as the conditional revenue model (1) in
detecting earnings management by firms subject to SEC enforcement actions while the
commonly used accrual models do not. We reestimate model (2) by replacing DREV with the
residual from model (3). Untabulated results indicate that the coefficient on AF -0.014 and
significant at the 0.01 level. Note this is nearly identical to -0.013 reported in Table 3. This
finding once again indicates that revenue quality is higher for accelerated filers relative to non-
accelerated filers.
We also use the ability of past earnings to predict current period cash flows as a measure
of earnings quality. We focus on cash flow prediction because that is the primary objective of

23
financial reporting, and the Financial Accounting Standards Board (FASB 1978, paragraph 37)
states, “financial reporting should provide information to help investors, creditors, and others
assess the amounts, timing and uncertainty of prospective net cash inflows to the related
enterprise.” Examples of other studies that examine the predictive ability of earnings for future
cash flows are Greenberg et al. (1986), Finger (1994), Krishnan and Largay (2000), Barth et al.
(2001), Mikhail et al. (2003), and Altamuro and Beatty (2009).
We estimate the following model:
)4(44
15
14131211
109876
543210
εαααααααααααααααα
++×++×++×++×++×+
+×++×+++=
Iitit
itititititit
ititititititit
itititititititit
DPEARNLOSSLOSSPEARNBIGBIGPEARNAGEAGEPEARNZZPEARNROAROA
PEARNSIZESIZEPEARNAFPEARNAFCFO
We define the variables as follows: CFO = Cash flow from operations for the year t scaled by beginning of year total assets; AF = An indicator variable that equals 1 for accelerated filers and 0 for non- accelerated filers; PEARN = Earnings before extraordinary items for the period t-1 scaled by beginning of year total assets; SIZE = The natural log of total assets; ROA = Return on total assets; Z = Zmijewski’s (1984) probability of bankruptcy score. Z-score calculated as: -4.3 - 4.5 X net income scaled by total assets + 5.7 x total liability scaled by total assets - 0.004 X current assets / current liability; AGE = The number of years the firm exists in the CRSP database; BIG4 = An indicator variable set equal to 1 if the firm is audited by Deloitte & Touche, Ernst & Young, KPMG, or PricewaterhouseCoopers, and 0
otherwise;

24
LOSS = An indicator variable that equals 1 if current period net income is negative and 0 for observations with positive net income; and
DI = Eleven industry dummy variables measured at the two-digit SIC level to capture industry-wide effects (see Table 1 for industry classifications). Consistent with prior research, we expect a positive coefficient on α2. The coefficient of
interest here is α3. A positive coefficient would be consistent with greater earnings quality for
accelerated filers relative to non-accelerated filers.
Results of model (4) are in Table 7. Coefficients on industry-dummy variables are not
tabulated. The adjusted R2 is 76.27%. The coefficient on PEARN is positive and highly
significant, indicating that on average, past earnings are positively associated with current period
cash flows, i.e., past earnings have predictive value. The coefficient on AF×PEARN is 0.047 and
significant at the 0.01 level. This indicates that the predictive value of past earnings of
accelerated filers is higher than the predictive value of past earnings of non-accelerated filers.
This finding is consistent with the results based on our revenue quality measure, discretionary
revenues. Collectively, our results support the notion that earnings quality is higher for
accelerated observations relative to non-accelerated observations.
[Insert Table 7 About Here] Market Valuation of Accelerated vs. Non-accelerated Filers
Next, we present the results of our second research question, i.e., whether investor
valuation of accelerated filers reflects the higher revenue and earnings quality relative to non-
accelerated filers. Following the results in Tables 3 through 5, our expectation is that ceteris
paribus, financial statement elements, such as book value of equity and net income should be

25
valued more for accelerated filers relative to non-accelerated filers. To test our conjecture, we
estimate the following Ohlson’s (1995) model of valuation:
)5(2765423210
εββββββββ
++×+×
+×+++++=
IDitSGROWitAFitNIitAFitBVEitAFitAFitSGROWitNIitBVEitP
We define the variables as follows: P = Common stock price per share measured at the end of three months after fiscal year-end; BVE = Book value of equity divided by the number of shares outstanding; NI = Net income divided by the number of shares outstanding; SGROW2 = Sales growth calculated as sales in year t minus sales in year t-2 scaled by sales in year t-2; AF = An indicator variable that equals 1 for accelerated filers and 0 for non- accelerated filers. Consistent with prior research, we expect a positive coefficient on β1, β2, and β3. We also
predict a positive coefficient for our coefficients of interest, β5 and β6. No prediction is offered
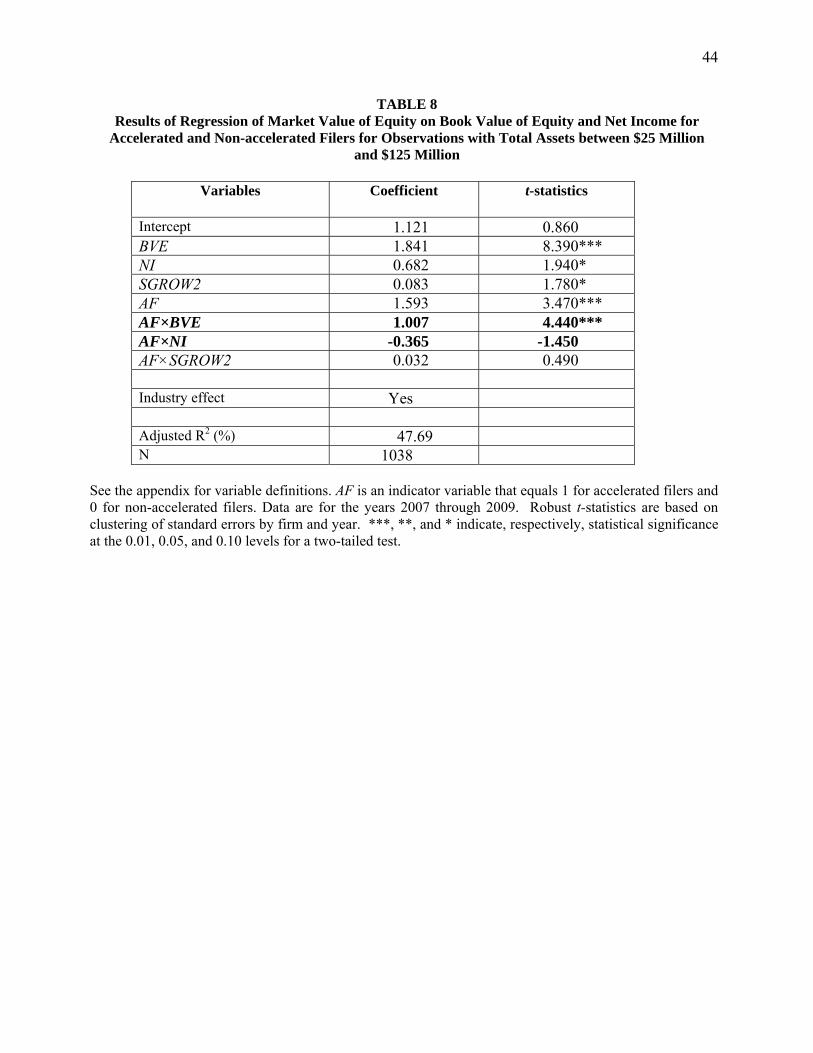
for β4 and β7. Results of model (5) are in Table 8. Coefficients on industry-dummy variables are
not tabulated. The adjusted R2 is 47.69%. The coefficient on BVE is positive and significant at
the 0.01 level. The coefficient on NI is also positive and significant at the 0.10 level. SGROW2
is positive and significant. These findings indicate that book value of equity, net income, and
sales growth are positively associated with the market valuation of equity. The coefficient on AF
is positive and significant at the 0.01 level, indicating that on average, the stock market valuation
is higher for accelerated filers relative to non-accelerated filers. Turning to the variable of
interest, the coefficient on AF×BVE is 1.007 and significant at the 0.01 level, indicating that the
book value of equity of accelerated filers is valued more than the book value of equity of non-
26
accelerated filers. The coefficient on AF×NI is negative and insignificant. In summary, these
findings are consistent with the notion that auditor attestation of the effectiveness of ICFR has a
favorable effect on the association between book value of equity and market value of equity for
accelerated filers.
[Insert Table 8 About Here]
We re-estimate model (5) after excluding observations with ineffective internal control
(significant deficiencies in ICFR). We retain non-accelerated observations with a “clean”
opinion under Sections 302 and 404(a) and accelerated observations with a “clean” opinion
under Sections 302, 404(a), and (b). The number of observations available for this test is 588 and
the results are in Table 9. The coefficients on AF×BVE and AF×NI are, respectively, 0.667 and
1.114 (both coefficients are significant at the 0.01 level). This indicates that even among firms
with effective ICFR, book value of equity and net income are valued more for accelerated filers
relative to non-accelerated filers.
[Insert Table 9 About Here]
We also match accelerated and non-accelerated observations by year, two-digit SIC, and
beginning total assets and re-estimate model (5). We do not impose a size constraint for this test
and the number of observations equals 1,948. The results are in Table 10. The variables of
interest, AF×BVE and AF×NI are, respectively, 0.644 (significant at the 0.01 level) and 1.012
(significant at the 0.05 level).14 Overall, findings in Tables 8 through 10 are consistent with the
results in Tables 3 through 5 and support the notion that the higher revenue and earnings quality
associated with accelerated filers has a favorable impact on the market valuation of equity of
accelerated filers.
14 We also construct an alternative sample by matching accelerated and non-accelerated observations on beginning of the year market value of equity. The coefficients on AF×BVE and AF×NI are, respectively, 0.324 (significant at the 0.01 level) and 0.558 (significant at the 0.10 level for a one-tailed test).

27
[Insert Table 10 About Here]
We also re-estimate model (5) after including the mean percent of shares held by
institutional investors to proxy for visibility and trading to mitigate the concern that the higher
valuation for accelerated filers might be due to the higher visibility and trading activities for
accelerated filers relative to non-accelerated filers. We find that the coefficient on AF×BVE is
0.971 (significant at the 0.001 level) and the coefficient on AF×NI is insignificant.
VI. SUMMARY AND CONCLUSIONS
While prior research has examined the relation between internal control over financial
reporting and financial reporting quality for large firms, empirical evidence on the potential
benefits of internal controls for small firms is limited. Auditor attestation of the effectiveness of
internal controls is particularly valuable for small firms as these firms may lack the necessary
resources needed to maintain appropriate technical controls. Also, managers in small firms may
override existing internal controls. However, the recently passed Dodd-Frank Act of 2010
exempts non-accelerated filers (firms with a public float of less than $75 million) from auditor
attestation of internal controls. This study examines whether revenue quality is higher for small
accelerated filers that are subject to auditor attestation relative to non-accelerated filers that are
required to disclose only management certification of the effectiveness of internal controls. Put
it differently, we examine whether auditor attestation adds value incremental to management’s
assurance on internal controls.
Our sample consists of firms with less than $125 million and more than $25 million in
assets and we focus on years 2007 through 2009. During this period, management certification
of internal controls is required for both accelerated and non-accelerated filers. However, auditor

28
attestation of internal controls is required only for accelerated filers. Thus, a comparison of
small accelerated filers with non-accelerated filers could potentially be informative for
understanding the incremental effect of auditor attestation on financial reporting quality.
Using Stubben’s (2010) discretionary (abnormal) revenues as a proxy for revenue quality,
we find that on average, discretionary revenues are lower by about 1.3% of total assets for
accelerated filers relative to non-accelerated filers. Further, compared to non-accelerated filers
whose managers have certified that their internal controls are effective, discretionary revenues of
accelerated filers with effective internal controls certified by their auditor are lower. Thus, even
among firms that claim to have effective internal controls, revenue quality is higher for
accelerated filers relative to non-accelerated filers. We also find that the predictive value of
earnings for future cash flows is higher for accelerated filers.
Results of our market valuation tests indicate that both the book value of equity and the
earnings of accelerated filers are valued more relative to the book value equity and the earnings
of non-accelerated filers. Overall, our findings support the notion that investors in small public
firms regard auditors’ assessment of the effectiveness of internal controls adds value via higher
revenue quality relative to firms that are not required to submit themselves to additional scrutiny
by their auditors.
We believe our findings are timely and have important implications for members of the
U.S. Congress, the SEC, managers, audit committee members, and investors. Our results support
the notion that an auditor’s opinion on the effectiveness of internal control over financial
reporting adds value beyond certifications provided by management. Currently, the SEC is
studying how the cost of compliance with Section 404(b) for small accelerated filers could be
reduced. Thus, the decision to exempt more firms from auditor attestation of internal controls

29
needs to be carefully balanced against the potential savings in compliance cost. Results of our
market valuation tests might be relevant for firms contemplating exiting accelerated status. Such
a move could have an adverse effect on firm valuation. Finally, we believe our findings are
potentially informative to regulators in other countries that are considering mandatory auditor
attestation of internal controls over financial reporting.

30
REFERENCES
Aguilar, M. 2009. Financial regulation moves ahead, with SOX exemption. Compliance Week December 14. Available at http://www.complianceweek.com/blog/aguilar/category/legislation. Altamuro, J., and A. Beatty. 2009. How does internal control regulation affect financial reporting? Journal of Accounting and Economics, forthcoming. Ashbaugh-Skaife, H., D. Collins, W. Kinney, Jr., R. LaFond. 2008. The effect of SOX internal control deficiencies and their remediation on accrual quality. The Accounting Review 83 (January): 217-250. Audit Analytics. 2009. Restatements disclosed by the two types of SOX 404 issuers. Available at http://www.complianceweek.com/s/documents/AARestatements2.pdf. Barth, M., D. Cram, and K. Nelson. 2001. Accruals and the prediction of future cash flows. The Accounting Review 76 (January): 27-58. Beasley, M., J. Carcello, and D. Hermanson. 1999. Fraudulent financial reporting 1987-1997: An analysis of U.S. public companies. Jersey City, NJ: AICPA/Committee of Sponsoring Organizations of the Treadway Commission. Beneish, M., M. Billings, and L. Hodder. 2008. Internal control weaknesses and information uncertainty. The Accounting Review 83 (May): 665-703. CFA Institute. 2009. Letter to the Honorable Barney Frank, Chairman, House Committee on Financial Services. Available at http://www.cfainstitute.org/centre/topics/comment/2009/pdf/091026.pdf Cutler, M. 2006. Sarbanes-Oxley: Section 404 and the death of the small public company. Available at http://law.bepress.com/expresso/eps/1254. Dechow, P., and I. Dichev. 2002. The quality of accruals and earnings: The role of accrual estimation errors. The Accounting Review 77 (Supplement): 35-59. Dechow, P., and C. Schrand. 2004. Earnings Quality. Charlottesville, VA: The Research Foundation of CFA Institute. Donaldson, W. 2005. Testimony concerning the impact of the Sarbanes-Oxley Act before the House Committee on Financial Services. Available at http://www.sec.gov/news/testimony/ts042105whd.htm Doyle, J., W. Ge, and S. McVay. 2007. Accruals quality and internal control over financial reporting. The Accounting Review 82 (October): 1141-1170. Federal Reserve Bank of New York. 2010. Facts & Trends 3 (October): 1-7.
31
Feng, M., C. Li, and S. McVay. 2009. Internal control and management guidance. Journal of Accounting and Economics 48 (December): 190-209. Financial Accounting Standards Board (FASB). 1978. Objectives of Financial Reporting by Business Enterprises. Statement of Financial Accounting Concepts No. 1. Stamford CT: FASB. Finger, C. 1994. The ability of earnings to predict future earnings and cash flow. Journal of Accounting Research 32 (Autumn): 210-223. Francis, J., R. LaFond, P. Olsson, and K. Schipper. 2004. Costs of equity and earnings attributes. The Accounting Review 79 (October): 967-1010. Gao, F., J. Wu, and J. Zimmerman. 2009. Unintended consequences of granting small firms exemptions from securities regulation: evidence from the Sarbanes-Oxley Act. Journal of Accounting Research 47 (May): 459-506. Gavin, T. 2009. Internal control assessments improve transparency of private company reporting. Commercial Lending Review (September/October): 29-34. Greenberg, R., G. Johnson, and K. Ramesh. 1986. Earnings versus cash flow as a predictor of future cash flow measures. Journal of Accounting, Auditing and Finance 1 (Fall): 266-277. Jegadeesh, N., and J. Livnat. 2006. Revenue surprises and stock returns. Journal of Accounting and Economics 41 (April): 147-171. Jiang, W., and J. Wu. 2009. The impact of PCAOB Auditing Standard 5 on audit fees. The CPA Journal 79 (April): 34-38. Krishnan, G., and J. Largay III. 2000. The predictive ability of direct method cash flow information. Journal of Business Finance & Accounting 27 (January/March): 215-245. Mikhail, M., B. Walther, and R. Willis. 2003. Reactions to dividend changes conditional on earnings quality. Journal of Accounting, Auditing and Finance 18 (Winter): 121-151. Nagy, A., 2010. Section 404 compliance and financial reporting quality. Accounting Horizons 24 (September): 441-454. Ohlson, J., 1995. Earnings, book value of equity and dividends in security valuation. Contemporary Accounting Research 11 (Spring): 661–687. Public Company Accounting Oversight Board (PCAOB). 2004. An Audit of Internal Control Over Financial Reporting Performed in Conjunction with An Audit of Financial Statements. Auditing Standard (AS) No. 2. Washington, D.C.: PCAOB.
32
Securities and Exchange Commission. 2003. Management’s Report on Internal Control Over Financial Reporting, Securities Act Release No. 8238, Exchange Act Release No. 47,986, 68 F.R. 36636, 36659. _____. 2005. Revisions to accelerated filer definition and accelerated deadlines for filing periodic reports. Available at http://www.sec.gov/rules/final/33-8644.pdf _____. 2009. Letter to the Chairman, Financial Services Subcommittee on Capital Markets, Insurance, Government Sponsored Enterprises. Available at http://www.complianceweek.com/s/documents/Kanjorski404Ltr.pdf Stubben, S., 2010. Discretionary revenues as a measure of earnings management. The Accounting Review 85 (March): 695-717. U.S. House of Representatives. 2005. The impact of the Sarbanes-Oxley Act. Hearing before the Committee on Financial Services. April 21. Washington, D.C.: Government Printing Office.
Whitehouse, T., 2010. Koss fraud spotlights small filers’ internal control issues. Compliance Week (February 2). Available at http://www.complianceweek.com/article/5782.
Zmijewski, M., 1984. Methodological issues related to the estimation of financial distress prediction models. Journal of Accounting Research 24 (Supplement): 59-82.

33
Appendix: Variable Definitions Variables in model (1) ∆AR = Annual change in accounts receivable; ∆R = Annual change in revenues; SIZE = The natural log of total assets; AGE = The natural log of the firm’s age in years; AGE_SQ = Square of firm’s age; GRR_P = Industry-adjusted growth rate in revenues (if positive); GRR_N = Industry-adjusted growth rate in revenues (if negative); GRM = Industry-adjusted gross margin; GRM_SQ = Square of industry-adjusted gross margin; DREV = Discretionary revenues estimated from model (1) (residual). All variables scaled by average total assets. Variables in model (2) SIZE = The natural log of the firm’s market value of equity at fiscal year-end measured in millions of dollars; MTB = Market value of equity divided by book value of assets; LEV = The firm’s long-term debt divided by its total assets; LOSS = An indicator variable that equals 1 if the firm reports a loss in the current year, and 0 otherwise; CFO = Cash flow from operations scaled by beginning of year total assets; SGROW = Sales growth defined as sales in year t less sales in year t-1 scaled by sales in year t; Z = Zmijewski’s (1984) probability of bankruptcy score. Z-score calculated as: -4.3 - 4.5 x net income scaled by total assets + 5.7 x total liability scaled by total assets - 0.004 x current assets / current liability; LACC = Last year’s total accruals equal to net income before extraordinary items minus operating cash flows scaled by beginning of year total assets; LOPCYCL = The natural log of operating cycle, measured by accounts receivable cycle and inventory cycle (360 x averages of account receivables / sales + 360 x average of inventories /cost of goods sold and each cycle is truncated at 360 days); VOLCFO = Standard deviation of cash flow from operations deflated by average total assets over year t-4 to year t; VOLSALE = Standard deviation of sales deflated by average total assets over year t-4 to year t. MA = An indicator variable that equals 1 if the firm is engaged in a merger or acquisition in the current year, and 0 otherwise; FINANCE = An indicator variable that equals 1 if the firm issues equity or debt in the subsequent year, and 0 otherwise; LITIGN = An indicator variables that equals 1 if the firm operates in a high litigation industry (with SIC of 2833-2836, 3570-3577, 3600-3674, 5200-5961, and 7370-7374), and 0 otherwise; INST = Annual mean institutional share holdings;

34
BIG4 = An indicator variable that equals 1 if the firm is audited by Deloitte & Touche, Ernst & Young, KPMG, or PricewaterhouseCoopers, and 0 otherwise; AF = An indicator variable that equals 1 for accelerated filers and 0 for non- accelerated filers; DI = Eleven industry dummy variables measured at the two-digit SIC level to capture industry-wide effects (see Table 1 for industry classifications). Variables in model (3) ∆AR = Annual change in accounts receivable; ∆R1_3 = Annual change in revenues in the first three quarters; and ∆R4 = Annual change in revenues in the fourth quarter. Variables in model (4) CFO = Cash flow from operations for the year t scaled by beginning of year total assets; AF = An indicator variable that equals 1 for accelerated filers and 0 for non- accelerated filers; PEARN = Earnings before extraordinary items for the period t-1 scaled by beginning of year total assets; SIZE = The natural log of total assets; ROA = Return on total assets; Z = Zmijewski’s (1984) probability of bankruptcy score. Z-score calculated as: - 4.3 - 4.5 x net income scaled by total assets + 5.7 x total liability scaled by total assets - 0.004 x current assets / current liability; AGE = The number of years the firm exists in the CRSP database; BIG4 = An indicator variable set equal to 1 if the firm is audited by Deloitte & Touche, Ernst & Young, KPMG, or PricewaterhouseCoopers, and 0 otherwise; LOSS = An indicator variable that equals 1 if current period net income is
negative and 0 for observations with positive net income; DI = Eleven industry dummy variables measured at the two-digit SIC level to capture industry-wide effects (see Table 1 for industry classifications). Variables in model (5) P = Common stock price per share measured at the end of three months after fiscal year-end; BVE = Book value of equity divided by the number of shares outstanding; NI = Net income divided by the number of shares outstanding; SGROW2 = Sales growth calculated as sales in year t minus sales in year t-2 scaled by sales in year t-2; AF = An indicator variable that equals 1 for accelerated filers and 0 for non- accelerated filers.

35
TABLE 1 Industry Distribution
2-digit
SIC code
Industry
Number of firm-year observations
for accelerated filers
%
Number of firm-year observations
for non- accelerated filers
%
10-14 Agriculture and mining 20 3.85 3 1.1420-21 Food and kindred products and cigarettes 7 1.35 6 2.28
23 Textile mill products and apparel 2 0.38 0 0.0024-27 Lumber, furniture, paper, and printing 3 0.58 8 3.0428-32 Chemicals, petroleum, rubber, leather,
stone, clay, glass, and concrete products 147 28.27 40 15.2133-34 Metal 12 2.31 1 0.3835-39 Machinery, electrical and computer
equipment, scientific instruments, miscellaneous manufacturing 158 30.38 124 47.15
40-48 Railroads, motor freight, transportation, communications 12 2.31 10 3.80
50-52 Wholesale goods, building material, hardware retail 4 0.77 5 1.90
53-59 Stores merchandise, auto dealers, apparel, home furniture stores, eating and drinking, misc. retail 8 1.54 19 7.22
70-79 Lodging services, business services, other services 101 19.42 41 15.59
80-99 Other 46 8.85 6 2.28 Total 520 100.00 263 100.00

36
TABLE 2 Panel A: Descriptive Statistics (N = 783)
Variable Mean Standard
Deviation Median Q1 Q3
DREV -0.003 0.047 0.000 -0.023 0.019 SIZE 4.320 0.612 4.384 3.889 4.730 MTB 3.246 7.059 2.176 1.153 4.394 LEV 0.425 0.332 0.354 0.204 0.529 LOSS 0.558 0.497 1.000 0.000 1.000 CFO -0.015 0.286 0.025 -0.139 0.144 SGROW 0.542 1.594 0.172 -0.023 0.448 Z -1.297 2.991 -2.045 -3.212 -0.300 LACC -0.144 0.468 -0.073 -0.168 -0.009 LOPCYCL 4.636 1.001 4.737 4.136 5.217 VOLCFO 0.310 0.920 0.110 0.065 0.224 VOLSALE 0.493 0.957 0.244 0.131 0.455 MA 0.148 0.355 0.000 0.000 0.000 FINANCE 0.300 0.459 0.000 0.000 1.000 LITIGN 0.580 0.494 1.000 0.000 1.000 INST 0.375 0.249 0.351 0.165 0.553 BIG4 0.522 0.500 1.000 0.000 1.000 AF 0.664 0.473 1.000 0.000 1.000
See the appendix for variable definitions. Data are for the years 2007 through 2009.

37
Panel B: Descriptive Statistics for Accelerated Filers (N = 520)
Variable Mean Standard Deviation
Median Q1 Q3
DREV -0.007 0.048 -0.002 -0.027 0.016 SIZE 4.463 0.588 4.511 4.046 4.822 MTB 4.102 8.261 3.057 1.725 6.120 LEV 0.433 0.362 0.345 0.192 0.531 LOSS 0.535 0.499 1.000 0.000 1.000 CFO -0.015 0.332 0.043 -0.170 0.177 SGROW 0.708 1.777 0.266 0.054 0.586 Z -1.281 3.283 -2.218 -3.420 -0.295 LACC -0.151 0.481 -0.078 -0.178 -0.012 LOPCYCL 4.554 0.999 4.641 4.028 5.166 VOLCFO 0.334 0.916 0.131 0.075 0.274 VOLSALE 0.515 0.972 0.248 0.134 0.482 MA 0.167 0.374 0.000 0.000 0.000 FINANCE 0.338 0.474 0.000 0.000 1.000 LITIGN 0.600 0.490 1.000 0.000 1.000 INST 0.423 0.253 0.426 0.226 0.606 BIG4 0.585 0.493 1.000 0.000 1.000

38
Panel C: Descriptive Statistics for Non-accelerated Filers (N = 263)
Variable Mean Standard Deviation
Median Q1 Q3
DREV 0.004 0.044 0.002 -0.014 0.023 SIZE 4.037 0.557 4.056 3.620 4.440 MTB 1.552 3.039 1.203 0.739 1.966 LEV 0.411 0.263 0.365 0.217 0.525 LOSS 0.605 0.490 1.000 0.000 1.000 CFO -0.017 0.163 0.010 -0.093 0.093 SGROW 0.214 1.080 0.050 -0.121 0.246 Z -1.329 2.313 -1.815 -2.770 -0.304 LACC -0.129 0.441 -0.062 -0.157 0.002 LOPCYCL 4.797 0.987 4.913 4.364 5.332 VOLCFO 0.264 0.926 0.087 0.055 0.137 VOLSALE 0.448 0.926 0.224 0.125 0.413 MA 0.110 0.314 0.000 0.000 0.000 FINANCE 0.224 0.418 0.000 0.000 0.000 LITIGN 0.540 0.499 1.000 0.000 1.000 INST 0.279 0.208 0.245 0.106 0.421 BIG4 0.399 0.491 0.000 0.000 1.000

TABLE 3 Results of Regression of Discretionary Revenues on AF and Controls for Observations with Total
Assets between $25 Million and $125 Million
Variables Coefficient
t-statistics
Intercept 0.046 1.790* SIZE -0.006 -1.120 MTB 0.000 2.020** LEV -0.036 -1.760* LOSS 0.005 2.720*** CFO 0.044 3.430*** SGROW 0.001 0.570 Z 0.006 2.000** LACC 0.002 1.700* LOPCYCL -0.008 -3.740*** VOLCFO -0.001 -0.480 VOLSALE 0.001 0.430 MA 0.010 1.780* FINANCE 0.004 1.110 LITIGN -0.004 -1.030 INST 0.013 2.650*** BIG4 -0.001 -0.690 AF -0.013 -3.580*** Industry effect Yes Adjusted R2 (%) 6.29 N 783
See the appendix for variable definitions. AF is an indicator variable that equals 1 for accelerated filers and 0 for non-accelerated filers. Discretionary revenues are estimated following Stubben (2010). Data are for the years 2007 through 2009. Robust t-statistics are based on clustering of standard errors by firm and year. ***, **, and * indicate, respectively, statistical significance at the 0.01, 0.05, and 0.10 levels for a two-tailed test.

40
TABLE 4 Results of Regression of Discretionary Revenues on AF and Controls for Observations with Total
Assets between $25 Million and $125 Million and Effective Internal Controls
Variables Coefficient
t-statistics
Intercept 0.044 1.180 SIZE -0.012 -2.480** MTB 0.000 1.750 LEV -0.033 -1.470 LOSS 0.004 0.530 CFO 0.051 5.810*** SGROW 0.000 0.210 Z 0.005 1.380 LACC -0.002 -0.630 LOPCYCL -0.007 -4.320*** VOLCFO 0.000 -0.140 VOLSALE -0.004 -0.520 MA 0.010 1.740* FINANCE 0.010 2.110** LITIGN -0.007 -1.410 INST 0.011 2.990*** BIG4 0.002 0.480 AF -0.015 -4.040*** Industry effect Yes Adjusted R2 (%) 7.32 N 482
See the appendix for variable definitions. AF is an indicator variable that equals 1 for accelerated filers and 0 for non-accelerated filers. Discretionary revenues are estimated following Stubben (2010). Data are for the years 2007 through 2009. Robust t-statistics are based on clustering of standard errors by firm and year. ***, **, and * indicate, respectively, statistical significance at the 0.01, 0.05, and 0.10 levels for a two-tailed test.

41
TABLE 5 Results of Regression of Discretionary Revenues on AF and Controls
Accelerated and Non-accelerated Observations Matched on Year, Industry, and Assets
Variables Coefficient
t-statistics
Intercept 0.027 6.850*** SIZE 0.000 -0.300 MTB 0.000 -0.150 LEV -0.031 -1.870* LOSS 0.002 1.140 CFO 0.048 6.480*** SGROW 0.003 2.600*** Z 0.005 3.100*** LACC -0.004 -0.860 LOPCYCL -0.005 -1.430 VOLCFO -0.010 -1.240 VOLSALE 0.005 1.180 MA 0.002 0.330 FINANCE 0.007 2.510** LITIGN -0.001 -0.430 INST 0.008 1.070 BIG4 -0.003 -0.530 AF -0.008 -2.100** Industry effect Yes Adjusted R2 (%) 7.43 N 1180
See the appendix for variable definitions. AF is an indicator variable that equals 1 for accelerated filers and 0 for non-accelerated filers. Discretionary revenues are estimated following Stubben (2010). Data are for the years 2007 through 2009. Robust t-statistics are based on clustering of standard errors by firm and year. ***, **, and * indicate, respectively, statistical significance at the 0.01, 0.05, and 0.10 levels for a two-tailed test.

42
TABLE 6 Results of Regression of Discretionary Revenues for Observations with a Change in Compliance
Status
Variables Coefficient
t-statistics
Intercept -0.022 -0.730 SIZE 0.009 2.180** MTB 0.001 2.540** LEV -0.057 -2.390** PLOSS -0.017 -3.100*** CFO 0.047 2.200** GRW_SALE -0.002 -0.250 Z 0.006 1.550 L1ACCR -0.031 -0.850 LOPCYCLE 0.000 -0.130 VOLCFO 0.010 2.460** VOLSALE 0.003 0.380 MA 0.013 1.260 FINANCE 0.004 1.040 LITIG 0.003 0.900 INST -0.007 -0.610 BIG -0.008 -1.830* POST 0.012 2.890*** Industry effect Yes Adjusted R2 (%) 11.41 N 150
See the appendix for variable definitions. POST equals 1 for the year when a firm became a non-accelerated filer, i.e., the year of the change in the compliance status and 0 for the year before the change. Discretionary revenues are estimated following Stubben (2010). Data are for the years 2005 through 2009 representing firms that complied with Section 404(b) in year t-1 but not in year t. Robust t-statistics are based on clustering of standard errors by firm and year. ***, **, and * indicate, respectively, statistical significance at the 0.01, 0.05, and 0.10 levels for a two-tailed test.

43
TABLE 7 Results of Regression of Current Period Cash Flow from Operations on Prior Period Earnings for
Accelerated and Non-accelerated Filers for Observations with Total Assets between $25 Million and $125 Million
Variables Coefficient
t-statistics
Intercept 0.018 0.270 AF -0.004 -0.290 PEARN 0.894 5.920*** AF×PEARN 0.047 3.790*** SIZE 0.005 0.300 SIZE×PEARN -0.164 -5.230*** ROA 0.517 16.060*** ROA×PEARN -0.239 -2.010** Z 0.010 4.310*** Z×PEARN -0.009 -2.350** AGE 0.001 1.620 AGE×PEARN 0.000 0.030 BIG4 0.004 0.500 BIG4×PEARN 0.084 2.960*** LOSS -0.019 -3.780*** LOSS×PEARN -0.195 -1.950** Industry effect Yes Adjusted R2 (%) 76.27 N 1137
See the appendix for variable definitions. AF is an indicator variable that equals 1 for accelerated filers and 0 for non-accelerated filers. Data are for the years 2007 through 2009. Robust t-statistics are based on clustering of standard errors by firm and year. ***, **, and * indicate, respectively, statistical significance at the 0.01, 0.05, and 0.10 levels for a two-tailed test.
44
TABLE 8 Results of Regression of Market Value of Equity on Book Value of Equity and Net Income for
Accelerated and Non-accelerated Filers for Observations with Total Assets between $25 Million and $125 Million
Variables Coefficient
t-statistics
Intercept 1.121 0.860 BVE 1.841 8.390*** NI 0.682 1.940* SGROW2 0.083 1.780* AF 1.593 3.470*** AF×BVE 1.007 4.440*** AF×NI -0.365 -1.450 AF×SGROW2 0.032 0.490 Industry effect Yes Adjusted R2 (%) 47.69 N 1038
See the appendix for variable definitions. AF is an indicator variable that equals 1 for accelerated filers and 0 for non-accelerated filers. Data are for the years 2007 through 2009. Robust t-statistics are based on clustering of standard errors by firm and year. ***, **, and * indicate, respectively, statistical significance at the 0.01, 0.05, and 0.10 levels for a two-tailed test.

45
TABLE 9 Results of Regression of Market Value of Equity on Book Value of Equity and Net Income for
Accelerated and Non-accelerated Filers for Observations with Total Assets between $25 Million and $125 Million and Effective Internal Controls
Variables Coefficient
t-statistics
Intercept -0.293 -0.280 BVE 1.693 7.230*** NI 1.231 2.710*** SGROW2 0.019 0.320 AF 2.239 5.070*** AF×BVE 0.667 2.730*** AF×NI 1.114 2.710*** AF×SGROW2 -0.021 -0.390 Industry effect Yes Adjusted R2 (%) 46.57 N 588
See the appendix for variable definitions. AF is an indicator variable that equals 1 for accelerated filers and 0 for non-accelerated filers. Data are for the years 2007 through 2009. Robust t-statistics are based on clustering of standard errors by firm and year. ***, **, and * indicate, respectively, statistical significance at the 0.01, 0.05, and 0.10 levels for a two-tailed test.

46
TABLE 10
Results of Regression of Market Value of Equity on Book Value of Equity and Net Income for Accelerated and Non-accelerated Filers for Observations Matched on Year, Industry, and Assets
Variables Coefficient
t-statistics
Intercept 1.747 3.160*** BVE 1.295 5.900*** NI 1.754 4.380*** SGROW2 0.029 2.940*** AF 2.068 4.140*** AF×BVE 0.644 4.050*** AF×NI 1.012 2.540** AF×SGROW2 -0.014 -0.540 Industry effect Yes Adjusted R2 (%) 55.78 N 1948
See the appendix for variable definitions. AF is an indicator variable that equals 1 for accelerated filers and 0 for non-accelerated filers. Data are for the years 2007 through 2009. Robust t-statistics are based on clustering of standard errors by firm and year. ***, **, and * indicate, respectively, statistical significance at the 0.01, 0.05, and 0.10 levels for a two-tailed test.