do not circulate or quote without...
TRANSCRIPT

DO NOT CIRCULATE OR QUOTE WITHOUT PERMISSION
1
Paris Office 164 rue de Vaugirard 75015 Paris, France Tel.: +33 (0)1 53 86 89 20 Fax: +33 (0)1 53 86 89 39 Email: [email protected]
Costing & Financing of Routine Immunization
and New Vaccines Introduction
in Ghana
November 15th, 2014 Final Report
Authors of the report: Jean-Bernard Le Gargasson, AMP (Routine Immunization, NUVI & funding flows)
Césaire Ahanhanzo, AMP (productivity and determinants) Contributors to the report: Anaïs Colombini, AMP Brad Gessner, AMP Franck Nyonator, GHS Moses Adibo, Consultant
Liaison Office AMP, immeuble JB Say 4e étage, aile C 13 chemin du Levant 01210 Ferney-Voltaire, France Tel.: +33 (0)4 50 40 49 26 Fax: +33 (0)4 50 42 98 07
Regional Office Côte d'Ivoire 08 BP 660 Abidjan 08, Côte d'Ivoire Tel.: +225 21 25 16 48 Fax: +225 21 25 16 80 Email: [email protected]
Country Offices Benin 03 BP 2309 Cotonou, Benin Tel.: +229 21 30 56 22 Fax: +229 21 30 83 91 Email: [email protected]
Burkina Faso 10 BP 638 Ouagadougou, Burkina Faso Tel.: +226 50 30 04 06 Fax: +229 50 30 04 09 Email: [email protected] BP 112 Bobo-Dioulasso, Burkina Faso Tel.: +226 20 98 20 41 Fax: +229 20 98 20 43 Email: [email protected]
Togo BP 348 Dapaong, Togo Tel.: +228 27 70 88 63 Vietnam 26 Nguyen Van Ngoc street Ba Dinh district Hanoi, Vietnam Tel.: +84 (0)432 115 770 Email: [email protected]

DO NOT CIRCULATE OR QUOTE WITHOUT PERMISSION
2
Table of Contents
ACKNOWLEDGMENTS ___________________________________ _________________ 5
ABBREVIATIONS _____________________________________ ____________________ 6
LIST OF TABLES AND GRAPHS _________________________ ____________________ 8
1. EXECUTIVE SUMMARY ______________________________________________ 11
1.1. INTRODUCTION 11
1.2. OBJECTIVES 11
1.3. METHODS 11
1.4. ROUTINE IMMUNIZATION COSTS 13
1.5. NEW AND UNDERUTILIZED VACCINE INTRODUCTION (NUVI) COSTS 14
1.6. DETERMINANTS OF ROUTINE IMMUNIZATION COSTS 15
1.7. FINANCING 15
1.8. CONCLUSION 17
2. PURPOSE AND SCOPE OF THE STUDY ________________________________ 18
2.1. INTRODUCTION 18
2.2. GOAL AND OBJECTIVES 18
2.3. STUDY QUESTIONS 18
2.4. STUDY SCOPE 19
2.5. ETHICAL ISSUES 19
3. BACKGROUND ________________________________________ _____________ 19
3.1. COUNTRY CHARACTERISTICS 19
3.2. HEALTH SYSTEM AND ROUTINE IMMUNIZATION PROGRAM IN GHANA 20
3.3. NATIONAL IMMUNIZATION SCHEDULE AND EPI PERFORMANCE IN GHANA 22
3.4. CURRENT KNOWLEDGE ON COSTS AND FINANCING OF IMMUNIZATION IN GHANA AND
GLOBALLY 26
4. COST ANALYSIS OF ROUTINE IMMUNIZATION _____________ _____________ 27

DO NOT CIRCULATE OR QUOTE WITHOUT PERMISSION
3
4.1. METHODS 27
4.2. NATIONWIDE ROUTINE IMMUNIZATION COSTS 34
4.3. ADMINISTRATIVE OFFICES COSTS FOR ROUTINE IMMUNIZATION (CENTRAL, REGION,
DISTRICT) 38
4.4. RESULTS AT FACILITY LEVEL FOR ROUTINE IMMUNIZATION ECONOMIC COSTS 40
4.5. ECONOMIC AND FINANCIAL COSTS 54
4.6. SENSITIVITY ANALYSIS 57
5. NEW VACCINES INTRODUCTION COSTS AND FINANCING _____ ___________ 58
5.1. ANALYTIC HORIZON. 58
5.2. MULTIPLE INTRODUCTION OF NEW VACCINES IN GHANA 58
5.3. BACKGROUND KNOWLEDGE ON NUVI COSTS 59
5.4. NEW VACCINES INTRODUCTION COSTS RESULTS (ECONOMIC AND FISCAL) 59
5.5. NUVI FUNDING SOURCES 66
5.6. UTILIZATION OF NUVI INTRODUCTION GRANT 67
7. DETERMINANT OF COSTS AND PRODUCTIVITY ANALYSIS AT F ACILITY
LEVEL _________________________________________________________________ 69
7.1. INTRODUCTION 69
7.2. PRODUCTIVITY ANALYSIS 69
7.3. DETERMINANT ANALYSIS 70
7.4. RESULTS 72
8. ANALYSIS OF FINANCIAL AND COMMODITY FLOWS FOR ROUTI NE
IMMUNIZATION __________________________________________________________ 81
8.1. BACKGROUND ON HEALTH CARE FINANCING AND FUNDING FLOWS FOR IMMUNIZATION 81
8.2. METHODS FOR THE QUANTITATIVE ANALYSIS OF FINANCIAL AND COMMODITY FLOWS 83
8.3. RESULTS OF THE QUANTITATIVE ANALYSIS 85
8.4. SCHEMATIC ILLUSTRATION OF FUNDS FLOW FOR ROUTINE IMMUNIZATION SERVICES IN
GHANA (2011) 90

DO NOT CIRCULATE OR QUOTE WITHOUT PERMISSION
4
8.5. METHODOLOGY FOR THE QUALITATIVE ASSESSMENT 92
8.6. RESULTS ON QUALITATIVE ASSESSMENT OF FUNDING FLOWS FOR ROUTINE
IMMUNIZATION 92
8.7. DISCUSSION AND COMPARISON OF FUNDING FLOW ANALYSIS 97
9. POLICY IMPLICATIONS & RECOMMENDATIONS _____________ ____________ 98
9.1. POLICY IMPLICATIONS 98
9.2. RECOMMENDATIONS 98
10. CONCLUSIONS ____________________________________________________ 100
11. MAIN FINDINGS ___________________________________________________ 102
12. REFERENCES (VANCOUVER) _______________________________________ 105
APPENDIX _____________________________________________________________ 106

DO NOT CIRCULATE OR QUOTE WITHOUT PERMISSION
5
Acknowledgments We would like to acknowledge the following individuals that contributed to the study: Frank Nyonator (MOH), Moses Adibo (Consultant), KO Antwi-Agyei (Ghana Health Service / EPI), John Frederick Dadzie (Ghana Health Service / EPI), Dan Osei (GHS, PPME), Gustav Togobo, Irene Hamba, Seth Adjei, Bernard Achampong, Vida Gyasi, Darwin Young (Consultant, BMGF), Logan Brenzel (Consultant,BMGF), Damian Walker (BMGF) Steering committee members : Carol Levin (UW)Ulla Griffiths (LSHTM), Mike Hanlon (UW), Raymond Hutubessy (WHO), Stephen Resch (HU), Santiago Cornejo (GAVI) Participants to the dissemination workshop in Accra (20/11/2013): Kwakye Kontoh (Ministry of Health), Isaac Akumah (Ghana Health Service, PPMED), Dr. George Bonsu (Ghana Health Service, EPI), Kwame Quandahor (Ghana Health Service, PPMED), Maame Esi Amekudzi (Ghana Health Service, PPMED), Paulina Ofori-Adu (Ghana Health Service, PPMED), Stephen Duku (Ghana Health Service, PPMED), Dan Osei (Ghana Health Service, PPMED), Mabel Segbafah (Ghana Health Service, PPMED).
This report is based on research funded by the Bill & Melinda Gates Foundation. The findings and conclusions contained within are those of the authors and do not necessarily reflect positions or policies of the Bill & Melinda Gates Foundation.

DO NOT CIRCULATE OR QUOTE WITHOUT PERMISSION
6
Abbreviations AD Auto-destruct (syringe) BCG Bacillus Calmette-Guerin BMC Budget Management Centers CC Cold Chain CHAG Christian Health Association of Ghana CHN Community Health Nurse CHPS Community-based Health Planning and Services CSO Civil Society Organization CWC Child Welfare Clinics DDHS District Director of Health Services DDPH Deputy Director Public Health DHMT District Health Management Team DHIMS District Health Information Management System DP Development Partners DTP Diphtheria, Tetanus, Pertussis (vaccine) DVDMT District Vaccine Distribution Management Tool EPI Expanded programme on Immunization GAVI Global Alliance for Vaccines and Immunization GDP Gross Domestic Product GDHS Ghana Demographic and Health Survey GHS Ghana Health Service GIVS Global Immunization Vision and Strategy GOG Government of Ghana GPRS Ghana Poverty Reduction Strategy GSS Ghana Statistical Service HC Health Centre HCW Health Care Worker HSMTDP Health Sector Medium Term Development Plan HepB Hepatitis B vaccine HF Health Facility Hib Haemophilus Influenzae type b vaccine HMIS Health Management Information System HSMTDP Health Sector Medium Term Development Plan ICC Inter Agency Coordinating Committee IDSR Integrated Disease Surveillance and Response IEC Information, Education and Communication ISS Immunization Services Support MCH Maternal and Child Health MCV-2 Measles Containing Vaccine 2nd dose MDG Millennium Development Goal M&E Monitoring and Evaluation MNT Maternal and Neonatal Tetanus MoFEP Ministry of Finance and Economic Planning MoH Ministry of Health NID National immunization Day NIP National Immunization Programme NT Neonatal Tetanus OPV Oral Polio Vaccine

DO NOT CIRCULATE OR QUOTE WITHOUT PERMISSION
7
PCV Pneumococcal Vaccine Penta Pentavalent vaccine REC/RED Reaching Every Child/Reaching Every District PPME Policy, Planning, Monitoring and Evaluation RCH Reproductive and Child Health RHMT Regional Health Management Team RI Rotary International SIAs Supplemental Immunization Activities SWAp Sector-Wide Approach TT Tetanus Toxoid UNICEF United Nations Children’s Fund USAID United State Agency for International Development VPD Vaccine preventable Disease WHO World Health Organization WICR Walk In Cold Room

DO NOT CIRCULATE OR QUOTE WITHOUT PERMISSION
8
List of tables and graphs Table 1: Macro-economic indicators in Ghana ............................................................... 20
Graph 1: Levels of service provision at district level (MOH) ........................................... 21
Graph 2: EPI structure within MOH/GHS in Ghana at national, regional and district levels ...................................................................................................................................... 22
Table 2: Immunization schedule by antigen in Ghana ................................................... 24
Table 3: Doses administered by routine EPI and coverage rate in Ghana from 2006 to 2011 .............................................................................................................................. 25
Table 4: comprehensive Multi-Year Plan (cMYP) estimates for 2011 ............................ 26
Table 5: Final sample selected by district and location .................................................. 28
Table 6: Useful Life Years by type of cold chain equipment........................................... 31
Table 7: Useful life years by type of vehicles ................................................................. 31
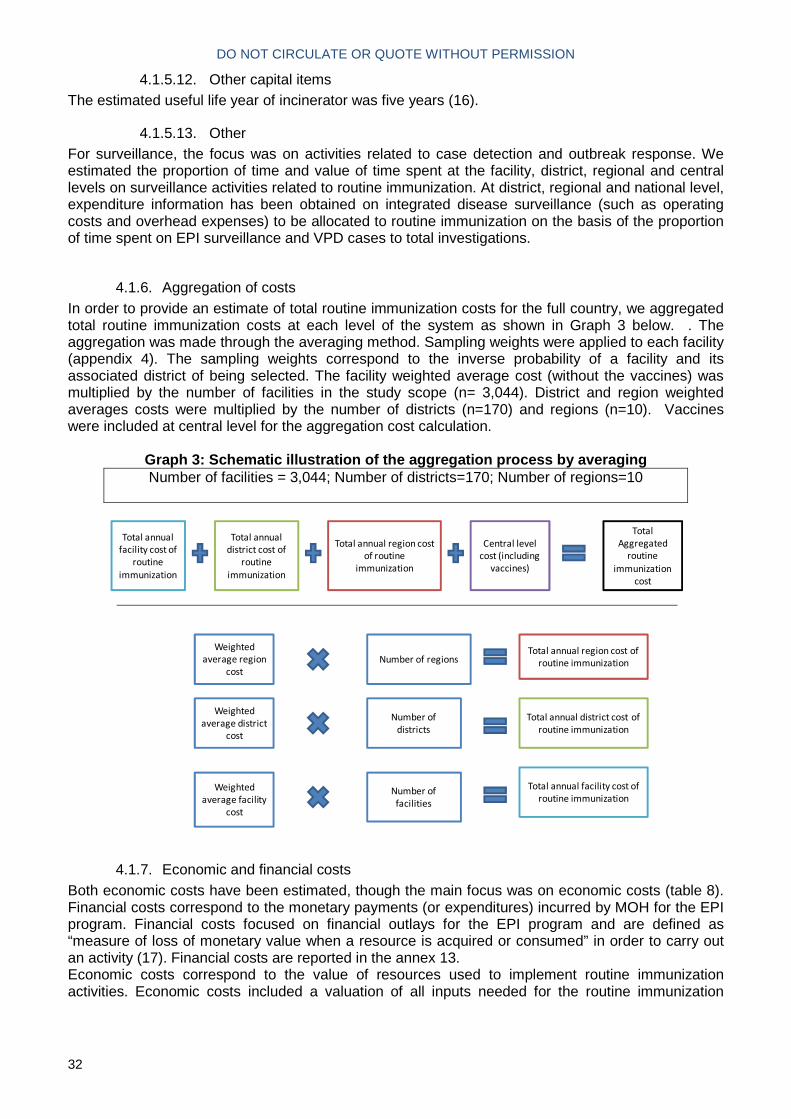
Graph 3: Schematic illustration of the aggregation process by averaging ...................... 32
Table 8: Economic and financial costs included ............................................................ 33
Graph 4: Distribution of total national routine immunization cost by line item ................. 34
Table 9: Distribution of routine immunization programmatic costs by administrative level and main cost drivers by activity and input .................................................................... 35
Table 10: Summary of aggregated economic costs and unit costs by input and administrative level (USD 2011) .................................................................................... 36
Graph 5: Distribution of aggregated cost for routine immunization by activity (USD, 2011) ...................................................................................................................................... 37
Table 11: Total routine immunization district and national health office immunization economic costs by line item (USD, 2011) ...................................................................... 39
Table 12: Total Routine Immunization District and National Level Economic Costs by Activity (USD, 2011) ...................................................................................................... 39
Table 13: Annual total costs, total outputs and unit costs at facility level by facility type (US$ 2011) .................................................................................................................... 40
Graph 6: Cost per dose, by facility type and location (USD, 2011) ................................ 41
Table 14: Unit costs in urban and rural settings (sampled facilities, average), USD....... 42
Graph 7: Distribution of total routine immunization economic costs of sampled facilities (weighted average) by line item (2011, Percentage) ...................................................... 43
Table 15: Total Routine Immunization Economic Costs by input and Facility Type (USD, 2011) ............................................................................................................................. 45
Table 16: Total routine immunization economic costs by input and location .................. 46
(USD, 2011) .................................................................................................................. 46
Graph 8: Distribution of total routine immunization economic costs by activity at facility level .............................................................................................................................. 48
Table 18: Total routine immunization economic costs by activity and facility type (USD, 2011) ............................................................................................................................. 50
Table 19: Main cost drivers (activities) by facility type ................................................... 51
Table 20: Total FTEs and staff time allocation by type of facility by line item (weighted averages) ...................................................................................................................... 51
Table 21: Staff time allocation and distribution of salaried costs by facility type by activity ...................................................................................................................................... 51
Table 22: Total Routine Immunization Economic Costs by Activity by Location (USD, 2011) ............................................................................................................................. 52
Table 23: Staff time allocation and distribution by location and area .............................. 52

DO NOT CIRCULATE OR QUOTE WITHOUT PERMISSION
9
Table 24: Total routine immunization district, region and central level financial costs by activity (USD, 2011) ...................................................................................................... 54
Table 25: Comparison of Economic and Financial Costs by Line Item by Facility Type . 55
(USD, 2011) .................................................................................................................. 55
Table 26: comparison of comprehensive multi-year plan projection for 2011 and costing study results .................................................................................................................. 56
Table 27: Sensitivity analysis of facility cost .................................................................. 57
Table 28: Doses administered the year of introduction .................................................. 58
Graph 11: Distribution of NUVI start-up economic incremental costs by activity ............ 61
Table 29: New Vaccine Introduction economic costs by activity (USD) ......................... 61
Table 30: New vaccine introduction economic costs by Line Item (USD, 2011) ............. 62
Table 31: New vaccine introduction fiscal costs by line item (USD, 2011) ..................... 63
Table 32: Summary table: start-up costs, ongoing costs and fiscal costs for new vaccine introduction in Ghana .................................................................................................... 64
Table 33: Cold chain equipment purchased specific to NUVI in Ghana ......................... 65
Table 34: Comparison of full needs and expenses for the new vaccine introduction (USD) ............................................................................................................................ 66
Table 35: External financing for NUVI in Ghana ............................................................ 67
Graph 12: Use of GAVI Vaccine Introduction Grant ....................................................... 68
Table 36: Percent distribution of some core categorical characteristics of the surveyed health facilities in Ghana ............................................................................................... 72
Table 37: Distribution of facilities as per some core continuous variables surveyed in Ghana ........................................................................................................................... 73
Graph 13: Total economic routine immunization Costs in USD (x axis) vs DTP3 vaccinated children (x axis), Ghana ............................................................................... 74
Graph 14: Quadrant analysis of Total Economic Cost (y axis) vs DTP3 Vaccinated Children (x axis), Ghana ................................................................................................ 75
Graph 15: Box and Whiskers plot of Total Economic cost, Ghana ................................. 76
Graph 16: Box and Whiskers plot of Total Economic cost broken down by region, Ghana ...................................................................................................................................... 76
Graph 17: Box and Whiskers plot of Total Economic cost broken down by type of area, Ghana ........................................................................................................................... 76
Graph 18: Box and Whiskers plot of Total Economic cost broken down by Type of facility, Ghana ............................................................................................................... 76
Table 38: Analysis of variances of Total cost, broken down as per some core categorical variables, Ghana ........................................................................................................... 76
Graph 19: Box and Whiskers plot of Log of Total Economic cost, outliers removed, Ghana ........................................................................................................................... 77
Table 39: Final linear regression model evaluating the association of different variables with total immunization costs in Ghana ......................................................................... 78
Table 40: Productivity indicators computed for Ghana ................................................... 79
Graph 20: Quadrant analysis of Total Economic Cost (y axis) vs Total doses administered in 2011 (x axis), Ghana ............................................................................ 80
Graph 21: Source of MOH revenues in Ghana .............................................................. 81
Graph 22: Internally Generated Funds by MOH facilities ............................................... 82
Table 41: Financial flow type and categories ................................................................. 83
Table 42: Identification of financial flow types for Ghana (2010-2011) ........................... 85
Graph 23: Distribution of funding sources for routine immunization (USD, 2011) .......... 86
Table 43: Funding sources (FS) to financing agents (FA), 2011 .................................... 87
Table 44: Financing agents (FA) to health care providers (HP) (2011) .......................... 88

DO NOT CIRCULATE OR QUOTE WITHOUT PERMISSION
10
Table 45: Financing agents (FA) to health care financing mechanism (HF) (USD, 2011) ...................................................................................................................................... 89
Graph 24: Mapping of funding flows for routine immunization in Ghana (2011) ............. 91
Graph 25: Funding flow from GOG to Regions .............................................................. 92
Graph 26: Funding flow to district level .......................................................................... 93
Graph 27: Reporting flows for regional level .................................................................. 93
Table 46: routine immunization activities supported by WHO and UNICEF ................... 95

DO NOT CIRCULATE OR QUOTE WITHOUT PERMISSION
11
1. Executive Summary
1.1. Introduction This study is part of a larger project “Analyses of the Costs and Financing of Routine Immunization Programs and New Vaccine Introduction” which is funded by the Bill and Melinda Gates Foundation. The project encompassed six countries (Moldova, Uganda, Zambia, Honduras, Benin and Ghana). The overall goal of the proposed project is to undertake analyses of the costs, funding flows of routine immunization programs and new vaccine introduction (NUVI) and determinants of costs and productivity at facility level in Ghana. The present report focuses on the Ghana study.
1.2. Objectives The objectives of the study are the following:
- Calculate costs of routine National Immunization Program (NIP) in 2011 including total cost, cost structure, unit cost and delivery cost
- Evaluate financing flows of routine NIP - Calculate incremental costs of new vaccine introduction including total cost, cost
structure, unit cost and delivery cost - Evaluate financing of new vaccine introduction activities - Evaluate productivity of immunization service providers and its determinants
1.3. Methods For the costing analysis, the scope of the analyses was a) the national routine immunization program and b) the new vaccine introduction from the central level to the vaccine delivery sites. We included in the study scope the health facilities that provide routine immunization services to children and their related sub-national administrative units at district and regional level. The chosen perspective for the study was the government health service. For routine immunization we estimate annual costs for 2011, the last fiscal year for which data are available. National Immunization Days were outside the study scope. Both economic and financial costs were estimated. The main focus was on annual economic costs, i.e., the value of resources paid for by or owned by the MOH (and other funding sources). Financial costs correspond to the monetary payments (or expenditures) incurred by MOH for the EPI program. For the NUVI costing, an incremental approach was adopted, i.e. additional activities and resources that would not have occurred if the new vaccines had not been introduced. The timeframe included the preparatory, start up and post introduction activities (August 2010 – October 2012 at central level; February 2012 – October 2012 at sub national levels). In addition, the additional time spent to administer the new vaccines at facility level was included as operational costs the year of introduction. For the funding flow analysis, the focus was on financial and commodity flows for the routine immunization program from external, government, and other domestic sources. Specific financing questionnaires were developed to capture funding flows for routine

DO NOT CIRCULATE OR QUOTE WITHOUT PERMISSION
12
immunization. A methodology derived from the System Health Accounts 2011 methodology for coding financial flows was adopted. Each financial flow was allocated to a funding source, financing agent, health-care provider, health-care provision and health-care function and was sub categorized within these categories. Three types of funding sources for the EPI program were identified for Ghana (1): Government of Ghana, Internally Generated Funds, and development partners (multilateral or bilateral donors). Donors that contributed to the Ghana EPI program during 2010 to 2011 included WHO, UNICEF, USAID, GAVI. Volunteers were not included as they do not receive any allowance for routine immunization activities. The fiscal years of 2010 and 2011 were included in the timeframe. A stratified random sampling approach was used for the district and facility selection. We classified districts according to urban and rural location, number of pentavalent doses administered in 2011 and population density. As most districts were rural (106 rural and 32 urban) in Ghana, we selected four rural districts (high and low doses administered / population density) and two urban districts (high and low doses administered). Within selected districts, we stratified health facilities associated with immunization programs within the following categories: type (Reproductive and Child Health Units, Health Centers, Community-based Health Planning and Services, Clinics), ownership and area (urban or rural). Within strata, if only one facility met the stratification criteria, it was included; for strata with more than one facility, we randomly selected one for inclusion. All selected facilities (n=50) had to be identified in the Ghana Health Service information systems and be functional during 2011, otherwise a replacement facility was randomly selected. Total national immunization costs were estimated by aggregating costs where the average weighted cost per facility was multiplied by the total number of facilities. . The facility weighted average cost (without vaccines) was multiplied by the number of facilities in the study scope (n= 3,044). District and region weighted averages were multiplied by the number of districts and regions. Vaccines were included at central level for the aggregated cost calculation. Routine dose administered are defined as the total number of doses administered in routine. Fully Immunized Child (FIC) are defined as the number of children who received the third dose of the DTP-HepB-Hib vaccine. Infant population is defined as the number of children under one year old. Capita refers to the total population. The following vaccines are part of the routine immunization schedule in 2011: BCG, Pentavalent, Polio, Measles first dose, Yellow Fever and Tetanus Toxoid. Ghana introduced in 2012 13-valent pneumococcal conjugate vaccine (Prevnar 13) using a three dose schedule with vaccine at 6-10-14 weeks, live oral monovalent G1P8 rotavirus vaccine (Rotarix) using a two dose schedule with vaccine at 6 and 10 weeks, and measles second dose vaccine (Biopharma) delivered at 18 months in their routine immunization schedule.

DO NOT CIRCULATE OR QUOTE WITHOUT PERMISSION
13
1.4. Routine immunization costs The total costs for the national routine immunization program (nationwide) amounted to 53.49 million USD in 2011, representing 5.7% of government health expenditures in Ghana (2), and 0.13% of GDP (current US$ in 2011)1. The routine EPI cost per dose administered was 5.7 USD, the cost per FIC 60.3 USD, and the cost per infant population in the country 52.9 USD. The cost per capita was 2.1 USD. Recurrent line items accounted for 91% of the aggregated costs. Within recurrent costs, salaried labor was the main cost driver, accounting for 61% of total routine EPI costs, consistent with salaries and benefits accounting for more than 60% of total public health expenditure in Ghana (1). Vaccine and injection supplies costs were captured at the central level and accounted for 19% of total national aggregate costs. The remaining substantial recurrent cost items, as a percentage of total EPI costs, were: volunteer labor (4.2%), transport (3.4%) and overhead utilities and communication (2.0%). Finally minor costs include cold chain energy (0.4%), per diem (0.8%), vehicle maintenance (0.1%), printing (0.1%) and other recurrent costs (0.3%) which together accounted for less than 2% of total cost. Within the sampled facilities (urban=11; rural=39), the weighted average unit cost per routine dose administered was 5.07 USD. The cost per Fully Immunized Child –FIC- (DTP3-HepB-Hib) was 51.26 USD. The cost per infant population in the catchment area was 36.11 USD. The cost per capita was 1.50 USD. The main cost driver was salaried labor with 60% of facility total cost. Vaccines and injection supplies were the second highest cost driver with 26% of the total facility cost. Vaccines were mostly delivered through outreach as 58% of the vaccine and supplies costs could be attributed to this strategy. Almost half of the facility costs could be attributed to service delivery, with outreach service delivery representing one fourth (25%) of total facility costs and facility-based delivery accounting for 22%. The cost of support activities (53%) was mostly driven by record-keeping (12%), social mobilization (10%) and surveillance (10%). Vaccine management, supervision, training, program management and cold chain maintenance each represented less than 10% of facility costs. The cost per dose was lower in urban (3.17 USD) than rural facilities (5.78 USD), due to the number of doses provided and variation in total cost. The cost profile also varied according to facility location. The percentage of total costs due to volunteer labor was higher in rural than urban settings as this labor source was mobilized more often in remote facilities or to target hard-to-reach populations. Similarly, the percentage of transportation and fuel in total costs was higher in rural settings. One reason being that the average distance travelled was systematically higher on average in rural areas for all facility types (2.5 higher in rural health centers for examples). Distribution within capital costs varied between urban and rural settings: capital costs in rural settings were mostly driven by vehicle costs whereas in urban settings building costs predominated due to larger areas dedicated to vaccine administration and vaccine storage. The higher percentage of costs associated with fixed vaccine delivery in urban areas occurred because urban areas offered immunization services every day (in
1 World Bank national accounts data, and OECD National Accounts data files:
http://data.worldbank.org/indicator/NY.GDP.MKTP.CD

DO NOT CIRCULATE OR QUOTE WITHOUT PERMISSION
14
general) due to higher population density. By contrast, in rural areas, the percentage of costs due to outreach delivery was higher because of the more dispersed population. The cost per FIC was lower in Reproductive and Child Health units of district hospitals (38.49 USD) or Health Centers (42.17 USD) compared to Community-based Health and Planning Services (CHPS) facilities (87.8 USD). Reproductive and Child Health units were located in district capitals and had a significantly higher catchment population and more health workers entirely dedicated to immunization. The higher unit cost of CHPS can be ascribed to a smaller catchment population that requires more effort to vaccinate (as outreach requires more manpower and fuel costs per vaccinated child). This study also measured above-facility costs at the central, regional and district levels. These include administrative and management costs pertaining to the program. The average yearly routine costs of EPI administrative offices was 28,285 USD for District Health Administrations (DHA) and 92,858 USD for Regional Health Administrations (RHA); the total cost for routine EPI at central level was 702,727 USD. The capital versus recurrent costs distribution was similar between DHAs (74% recurrent / 26% capital) and RHAs (76% recurrent / 24% capital). For the central EPI, recurrent costs represented 62% of total costs and capital 38%; the higher percentage of capital costs at central level was mostly explained by the importance of cold chain equipment costs at central level. The percentage of total costs due to capital costs in district (26%), region (24%) and central administration (38%) was much higher than in facilities due to their role in EPI vaccine distribution (requiring vehicle and cold chain equipment) and storage (requiring buildings). Routine immunization costs were significantly higher than previous comprehensive Multi-Year Plan or study estimates, indicating that the economic cost of routine immunization has been underestimated by MOH and the international community. Although some shared costs is included in cMYP (personnel…), the results of this study shows that they are have not been fully considered and highlights the importance of full costing approaches and covering shared costs at all levels. In addition, the substantial percentage of total costs accounted for by volunteers (5%) emphasizes the critical role played by volunteers in expanding community-based health promotion and services, a facet not considered by other costing exercises.
1.5. New and underutilized vaccine introduction (NUVI) costs According to the timeline of NUVI activities in the vaccine introduction plan, the analytic horizon starts in August 2010 with preparatory activities and ends approximately five months after introduction once most major additional activities (social mobilization, training, supervision, surveillance) have been performed. The incremental economic cost of new vaccine introduction in Ghana was 26.7 million USD. Programmatic start-up costs (i.e., excluding the value of vaccines and injection supplies) amounted to 3.9 million USD. The delivery cost per dose administered amounted to US$ 2.42, with US$ 1.22 for start-up costs and US$1.23 for ongoing costs. Overall, total costs (start-up and ongoing) were driven by vaccines (70%), salaried labor (18%), and cold chain (7%). We found that most significant ongoing incremental non-vaccine costs were related to salaried labor and cold chain utilization.

DO NOT CIRCULATE OR QUOTE WITHOUT PERMISSION
15
In the case of Ghana, when comparing the actual costs (fiscal cost) with the estimated new vaccine introduction plan costs, the following components of NUVI were under-estimated: training (by 40 thousand USD), social mobilization (0.41 million USD), cold chain equipment (1.23 million USD), vehicles (84 thousand USD), record keeping & HMIS (134 thousand USD). In total there was a variance of 1.99 million USD between forecasted expenses in the NUVI plan and actual fiscal costs. The difference between forecasted expenses and actual costs confirmed the higher costs for some line items identified in previous reviews where transportation, fuel, per diem, cold chain, equipment and maintenance costs had been underestimated (4). However, cold chain expansion had been planned in advance with purchase of walk in cold rooms several years in advance on the new vaccines introduction which was not supposed to be covered by the NUVI plan budget. In addition, some sub national (district, facility) expenses had not necessarily been planned in the new vaccine introduction plan. Some districts had assumed that regional and national levels would supply them with all inputs required for new vaccine introduction, which was not the case.
1.6. Determinants of routine immunization costs Regarding determinants of costs, the number of fully immunized children, the amount of full time equivalent devoted to routine immunization activities, the availability of sufficient human resource capacity to perform immunization activities correctly, and the availability of cold chain equipment were all associated with total costs at facility level.
1.7. Financing Routine immunization program received 50 million USD in 2011, including salaries and value of commodities. This funding was provided mostly through domestic sources, which accounted for 78% of the support. Of domestic sources, transfers were channeled through the central MOH, which accounted for 62% of total funds. Regional transfers to District Health Administrations represented 8.8% of total support. Internally Generated Funds (IGF) transferred to District Health Administrations accounted for 2.1% of total funds received. Within IGF, the national social insurance scheme represented 1.9% of total funding; out-of-pocket payments were marginal representing 0.2% of total support. External funding sources contributed 22% of total funding received. Most of the external financing (80%) is provided through the GAVI Alliance New Vaccine Support window through vaccines and supplies distributed by UNICEF supply division. The sources and levels of absolute external financial support distributed by the MOH included the GAVI Alliance (1.41 million USD), WHO (0.24 million USD), UNICEF (0.17 million USD) and USAID (0.15 million USD). GAVI support was channeled through the Ghana Health Service and part of GAVI support was directly disbursed to District Health Administrations. Minor in-kind support was provided by UNICEF (0.1%), WHO (0.1%) and World Vision (0.2%). Most funds spent for routine immunization were executed by the central level, with the central MOH executing 65% of total routine immunization expenditures (mostly driven by salaries). Central cold store (managing the vaccines) executed 22% and Ghana Health Service 1%. Funds executed at district level accounted for 11% of total spending. When excluding salaries and vaccines, expenditures executed at district level represented 61% of total funds, demonstrating the level of decentralization for the execution of funds.

DO NOT CIRCULATE OR QUOTE WITHOUT PERMISSION
16
The amount of financing during 2011 was higher than during 2010 by 8.1 million USD. The main factor is the value of vaccines which increased significantly between 2010 and 2011 (from 4.4 million USD in 2010 to 11.3 million USD in 2011). In particular, the cost of the pentavalent vaccine increased from 2.72 million USD (1.2 USD per dose) in 2010 to 7.40 million USD (2.9 USD per dose) in 2011. This increase is due to a switch in pentavalent vaccine presentation (from one dose per vial to ten doses per vial). Donor dependency decreased significantly compared to the costing and financing study conducted in 2000 (5). In 2000, development partners (mostly from DFID) supported 51% of routine immunization costs while the national government supported the remaining 49%. Currently, however, donor support accounts for 22% of total support and was mostly accounted for by GAVI support for vaccines. A qualitative assessment of funding flows was conducted with the different institutional actors providing or executing funds for immunization. From central EPI perspective, funding was considered as insufficient particularly for routine immunization (as opposed to campaigns). There was a late release of funds from Ghana Health Service, Disease Control Department and development partners to EPI. Consequently, support for routine immunization activities was taken from the positive fund within other activities. According to regional EPI teams, no specific funding dedicated to routine immunization exists but rather funds are shared through a pool of funds transferred by the national government to regions. However, funding delays occur (not specific to immunization). When funds arrive, they often are insufficient and lower than approved budgets. Consequently, the regional MOH will take money allocated to other health programs to supplement EPI program budgets. District informants had a similar viewpoint as that express at the regional level, since they mostly use national government funds transferred by regions. As with the regions, funding arrives late, is insufficient to carry out all routine immunization activities in the sub districts, and lower than that allocated in the approved budget. Districts have no alternative funds to close the gap between the amount of approved funds and funds received, so funding gaps lead to reduction in services. Most vaccine delivery facilities did not have financial data available. In the facilities where data was available financing amounts were not disaggregated for routine immunization. Identified funding sources included Internally Generated Funds (IGF) generated from user fees or sale of drugs which is supposed to be transferred to the district level. The survey in the fifty facilities found that 86% of facilities had collected user fees in 2011. Data on the amount collected through user fees was available in 64% of the facilities collecting user fees. The average sum collected (not weighted) through user fees was 1 156 USD. The portion supporting the operational costs of routine immunization services was not known. For urgent needs, health facilities may use IGF funds to pay for their expenses. In contrast to Ghanaian government workers, donors identified as their main concern the efficient spending of funds received by the recipients. Donors also indicated that delays in delivery of funds occur due to the failure of recipients to account in a timely way for fund disbursement. NUVI was funded mostly through domestic sources; among external sources, GAVI support was the most significant representing 1.5 million USD (through the new vaccine introduction grant and Immunization Services Support). Of GAVI new vaccine introduction grant, 29% was transferred to the regions to support new vaccine introduction activities at lower administrative levels. This support was used for social mobilization for vaccine introduction – including launch (28%), surveillance related to

DO NOT CIRCULATE OR QUOTE WITHOUT PERMISSION
17
new vaccine introduction (16%), research (11%) and program management / meetings (8%).
1.8. Conclusion Our study found a high cost of routine immunization compared to previous cMYP estimates in Ghana which include the pentavalent vaccine (6,7). The unit cost of immunization is even higher in hard to reach areas and small rural facilities, both for outreach delivery costs and associated support activities. Similarly, the unit cost per dose decreases with the facility type implying that RCH or Health Centers require fewer resources than CHPS to deliver one dose. In addition new vaccines introduction costs had been underestimated primarily cold chain equipment. The financing analysis outline the large proportion of financing by the national government, the substantial increase in 2011 versus 2010 and the lack of timely financing. Considering these main findings, one of the key challenges ahead for EPI Ghana is to maintain the current level of performance 91% DTP3-HepB-Hib coverage (2011 WHO-UNICEF estimate) but also reaching additional children, most of whom will require outreach strategies. At the same time, routine immunization programs are hampered by limited and delayed financing, in particular for outreach (1). Without changes, this situation may get worse as Ghana implements new vaccines such as rotavirus, pneumococcal conjugate vaccine and potentially others in the future. One path taken by the Ghanaian health system is the expansion of community-based service delivery under the ‘Community-based Health Planning and Services initiative,’ which will address the lack of access in some areas. CHPS had higher unit costs which shows that the higher the coverage, the more resources required. However, as Ghana is financing most of the program and a growing share of the program over time (through co-financing), there is scope to sustain the program if strong political commitment and resource allocation is maintained. The challenge of this initiative will be to ensure financial sustainability by mobilizing more resources through MOH subsidies, the National Health Insurance Scheme and user fees. At a time when the Ghanaian health sector moves towards more demand-side financing, vaccines remain mostly supported by donors and immunization service delivery remains supported mostly through supply-side subsidies through MOH transfers to district level. These larger issues relate to the larger eventual goal of national immunization program self-sufficiency.

DO NOT CIRCULATE OR QUOTE WITHOUT PERMISSION
18
2. Purpose and scope of the study
2.1. Introduction This study is part of a larger project “Analyses of the Costs and Financing of Routine Immunization Programs and New Vaccine Introduction” which is funded by the Bill and Melinda Gates Foundation. The project encompassed six countries (Moldova, Uganda, Zambia, Honduras, Benin and Ghana). The present report focuses on the Ghana study. The six countries used a common methodological approach developed by the Bill and Melinda Gates Foundation (8).
2.2. Goal and objectives The overall goal of the proposed project is to undertake analyses of the costs, funding flows of routine immunization programs and new vaccine introduction (NUVI) and determinants of costs and productivity at facility level in Ghana. The objectives of the study are the following:
- Calculate costs of routine National Immunization Program (NIP) in 2011 including total cost, cost structure, unit cost and delivery cost
- Evaluate financing flows of routine NIP - Calculate incremental costs of new vaccine introduction including total cost, cost
structure, unit cost and delivery cost - Evaluate financing of new vaccine introduction activities - Evaluate productivity of immunization service providers and its determinants
2.3. Study questions
2.3.1. Routine immunization costs Regarding routine immunization costs, the following questions will be addressed:
- What is the total cost of the routine immunization program? - What is the cost structure (i.e. cost by line item)? - What is the delivery cost associated with the routine immunization program? - What are the unit costs of the routine program at facility level, and what are the
factors that drive the variation in total and unit costs? - What are the determinants of routine program costs and levels of output (number
of children immunized, facility attendance)?
2.3.2. New and Underutilized Vaccine Introduction (NUVI) costs Regarding new vaccine introduction costs, the following questions will be addressed:
- What is the incremental cost of new vaccine introduction? - What is the delivery cost for new vaccine introduction?
2.3.3. Routine immunization financing (including NUVI) Regarding routine immunization financing, the following questions will be addressed:
- What are the main sources of financing of the routine immunization program? - How much funding for routine immunization is disbursed from funder down to the
district level? What are the sources of funding for routine immunization at facility level?

DO NOT CIRCULATE OR QUOTE WITHOUT PERMISSION
19
2.4. Study scope The scope of the analyses was a) the national routine immunization program and b) the new vaccine introduction from the central to the vaccine delivery sites. We include in the study scope the health facilities that provide routine immunization services to children except private for profit ones and their related sub-national administrative units at district and regional level. The cost and financing of dedicated immunization sessions (child days) implemented in facilities was included as well as outreach services provided from the facility. Supplementary immunization activities are outside the study scope.
2.5. Ethical issues We collected institutional data only. The study protocol was submitted to the Ghana Health Service Ethical Review Committee and the study was authorized in December 2012. We implemented standard confidentiality procedures to protect the identity of study informants including password-protected computer entry and deletion of all individual identifiers from the database at the end of data collection.
3. Background
3.1. Country characteristics Ghana is divided into ten administrative regions: Ashanti, Brong-Ahafo, Central, Eastern, Greater Accra, Northern, Upper East, Upper West, Volta and Western Regions. The country had 170 districts in 2011 and about 1000 sub-districts. The data compiled from the 2010 census provides an estimated population of 24,658,823 (9). The projected population of the country for 2011 was 25,275,293 based on an annual average growth rate of 2.5% (9). Life expectancy at birth (2008) was 62 years old for the total population (60 for male and 64 for females). The infant mortality rate is 51 per living 1000 living birth (2008, DHS) and the under five mortality rate was 76. The under five children represent 18.5% of total population and under 1 year old children represent 4%. The proportion of women in child bearing age is 24% (CHIM, 2012). Ghana was classified as a lower middle-income country in 2008. The poverty headcount ratio2 at national poverty line was 28.5% in 2006 (10) as opposed to 51.7% in 1992. The Ghana Statistical Service estimated the country’s GDP at US$31,548.4 million and GDP per capita US$1,303 and it is estimated to grow to about $1,517 in 2014. Similarly total health expenditure per capita is expected to grow from $56 to $79 by 2014 (Table 1).
2 National poverty rate is the percentage of the population living below the national poverty line. National estimates are based on population-weighted subgroup estimates from household surveys (World Bank data).

DO NOT CIRCULATE OR QUOTE WITHOUT PERMISSION
20
Table 1: Macro-economic indicators in Ghana
Macroeconomic Indicators 2010 2011 2014 Per capita GDP ($) 1,302 1,341 1,516 Total health expenditure per capita ($) 56 61 79 Population 24,233,431 24,804,793 26,633,944 GDP ($) million 31,548 33,265 40,394 Total health expenditure ($) 1,346,962,957 1,513,775,200 2,095,360,971 Government health expenditure ($) 202,044,446 272,479,536 628,608,291 GDP growth (annual %) 4% 8% n/a
Source: Budget statement 2010 (MoFEP), National Accounts Rebase 2010 (GSS), Housing and Population Census 2010 (GSS) and Estimation based on initial sources
3.2. Health System and routine immunization program in Ghana
3.2.1. Ghana Health Service Delivery system Ghana has a comprehensive health service delivery system (11) which follows an integrated delivery of health interventions. The delivery system includes Community Health Planning and Services (CHPS), sub district health centers and clinics, district general hospitals, regional general hospitals and specialized tertiary hospitals. Districts are divided into sub-districts3. Since 1997, the Ghana health system has undergone a reform that has decentralized funds and focused service improvements at the district level. Fiscal decentralization implies that district collect revenues and part of the execution of expenses is under their authority (as opposed to central level execution). District Health Management Teams (DHMT) plan, organize and manage services within the district. These teams provide support, supervision to the district and sub-district facilities. Ghana has also scaled up its community based health initiatives to reach rural and remote areas (11) with the expansion of Community-based Health Planning Services (CHPS) (cf. Graph 1).
3 Depending upon the size of the district, a district may have four, five, six or seven sub-districts

DO NOT CIRCULATE OR QUOTE WITHOUT PERMISSION
21
Graph 1: Levels of service provision at district le vel (MOH)
3.2.2. Immunization services delivery in Ghana Routine Immunization is now a main focus for an integrated district service delivery approach (12). There are over 3,000 immunization centers in the country (1). Due to the decentralized nature of health system in Ghana, District Health Management Teams are responsible for planning and implementing routine immunization activities. Within districts, sub-districts look at the number of communities in each of them. Each sub-district health team meets the various communities to schedule immunization sessions with communities. The outreach and facility-based delivery of immunization services (vaccine administration) in relies on the Community Health Nurses.
3.2.3. Description of facility types delivering routine immunization Four types of facilities are of interest for routine immunization delivery:
- Reproductive and Child Health (RCH) units (public): Reproductive and Child Health Units are one of the District Hospitals units (separate building) focusing on maternal and child curative and preventive care. District hospitals provide support to sub districts including referrals, emergencies and training (2). They have a large population in their catchment area as they are located in urban areas.
- Health Centers (HC) (public and private): health centers provide basic curative care, disease prevention services, and primary health care (2). HC serve as the reference facility for the sub district (and in this case the sub-district health management team is located in these health centers. They supervise the community level facilities (CHPS) and are located in urban or rural areas.

DO NOT CIRCULATE OR QUOTE WITHOUT PERMISSION
22
- Clinics: Clinics provide similar services than Health Centers. They can be owned by the Government or by NGOs.
- Community-based Health Planning and Services (CHPS) (public): They are the lowest level of service delivery and serve as the first-line health facilities. They refer patients to Health Centers when required. They provide interventions in small facilities and also provide outreach services to communities. They are mostly located in rural areas.
All these facilities conduct outreach services in addition to facility-based delivery.
3.2.4. EPI structure in Ghana The EPI in Ghana is organized in the following way by administrative level:
- At central level, the EPI Unit is under the Head of Disease Control Department that comes directly under the Directorate of Public Health.
- At the regional level, the EPI is integrated into the public health system under the Deputy Director Public Health (DDPH) and managed within the Regional Health Management Team. There are Regional EPI coordinators and Disease Control Officers who are responsible to the DDPH for the day-to-day management of immunization programs together with Regional Public Health Nurses.
- At district level, the District Health Management Team is led by the District Director of Health Services who implements integrated programs. There are Disease Control Technical Officers and District Public Health Nurses who are responsible for EPI activities in the districts. They do not administer the vaccines but focus on support activities (supervision, training, monitoring, program management….). They also collect activity reports from the sub-districts and summarize them for transmission to the regional level.
Graph 2: EPI structure within MOH/GHS in Ghana at n ational, regional and district
levels
3.3. National immunization schedule and EPI performance in Ghana In 1978, launch of EPI with six antigens: BCG, measles, diphtheria-pertussis-tetanus (DPT) oral polio for children under one year of age together with tetanus toxoid vaccination for pregnant women. In 1992, the yellow fever vaccine was introduced. In 2002, the pentavalent vaccine was introduced (including the DPT- Hepatitis B and the Haemophilus influenza type b antigens). In 2012, the following vaccines were
Dep. Dir. General
EPI team
EPI Manager
Head, DCD.
Director PH
EPI team
Public Health Unit
DDPH
EPI
DHMT
EPI team
Sub-District HT
Dist. Dir. Hlth. S.
Reg.Dir.Health Other Directors
Director General

DO NOT CIRCULATE OR QUOTE WITHOUT PERMISSION
23
introduced: Rotavirus, pneumococcal, measles second dose, meningitis A (campaign in meningitis belt districts).

DO NOT CIRCULATE OR QUOTE WITHOUT PERMISSION
24
The updated immunization schedule is provided by antigen in the table below (table 2). Table 2: Immunization schedule by antigen in Ghana
Vaccine/ antigen
Dosage
Doses required
Minimum interval between doses
Minimum age to start
Mode of administration
Site of administration
Doses per vial
Presentation Price per dose USD 2011 (source EPI Ghana)
BCG 0.05ml up to11 months, 0.10ml after11 months
1 dose None None At birth (or first contact)
Intra‐dermal Right Upper Arm 20 Lyophilized 0.07
Pentavalent 0.5 ml 3 doses 6, 10 and 14 weeks
4 weeks At 6 weeks (or first contact after that age)
Intra‐muscular Outer Upper Aspect of Left Thigh
1 Liquid 2.96
Pneumo 0.5 ml 3doses 6, 10 and 14 weeks
4 weeks At 6 weeks (or first contact after that age)
Intra‐muscular Outer upper Aspect of Right Thigh
1 Liquid 7*
Polio 2 drops 4 doses At birth, 6, 10 and 14 weeks
4 weeks At birth or within the first2 weeks
Oral Mouth 20 Liquid 0.13
Rotarix 1.2 ml 2 doses, 6 and 10 weeks
4 weeks At 6 weeks (or first contact after that age)
Oral Mouth 1 Liquid 2.42*
Measles first dose
0.5 ml 1 doses at 9 months
9 months At 9 months Sub-cutaneous Left Upper Arm 10 Lyophilized 0.19
Measles second dose
1 doses 18 months
At 18 months Right Upper Arm 10 Lyophilized 0.19
Yellow Fever 0.5 ml 1 dose None At 9 months Sub-cutaneous Right Upper Arm 5 Lyophilized 0.66 Tetanus Toxoid
0.5 ml 2 doses 1 month Pregnant Women
Inta-musculary Upper Arm 10 Liquid 0.085
*2012 price = NUVI

DO NOT CIRCULATE OR QUOTE WITHOUT PERMISSION
25
Table 3: Doses administered by routine EPI and cove rage rate in Ghana from 2006 to 2011 Year Antigen
2006 2007 2008 2009 2010 2011
Doses % Doses % Doses % Doses % Doses % Doses % BCG 888,556 100 938,488 102 967,579 103 1,008,183 104 1,019,676 102 1,070,080 105 OPV 3 746,792 84 803,243 88 812,630 86 861,220 89 867,350 87 884,615 87 Penta 3 751,000 84 805,079 88 817,154 87 867,652 89 869,670 87 887,086 87 Measles 759,222 85 812,083 89 815,617 86 861,967 89 875,449 88 894,546 88 YF 749,233 84 807,807 88 811,012 86 865,472 89 873,904 88 888,802 87 TT2+ 608,843 68 651,704 71 719,811 76 763,284 79 761,440 76 773,092 76
Data of doses administered in routine is compiled from immunization monitoring charts completed in Ghana facilities. The number of third doses of pentavalent vaccine administered followed a significant increase from 751,000 in 2006 to 887,086 in 2011 (table 3) (1). The pentavalent 3 coverage rate went from 84% in 2006 to 87% in 2011. For the pentavalent vaccine, the program has no yet reach the operational target of 90% of vaccine coverage in 2011 (1).

DO NOT CIRCULATE OR QUOTE WITHOUT PERMISSION
26
3.4. Current knowledge on costs and financing of immunization in Ghana and globally There is limited up-to-date knowledge on the full economic cost of routine immunization in Ghana. Some data exist but are mainly focused on resource requirements and financial projections. The latest official information available can be extracted from the comprehensive Multi Year Plan (cMYP) from 2010-2014 which is an immunization financial planning and budgeting tool (3). These estimates will serve as a reference point to discuss the present study results on costing and financing. The estimated projected cost for routine immunization in 2011 was US$ 32,293,328 (7), corresponding to (table 4).
Table 4: comprehensive Multi-Year Plan (cMYP) estim ates for 2011
Input cMYP 2010
projection (USD) cMYP 2011
projection (USD) Recurrent costs Vaccines and injection supplies (traditional and underused vaccines) includes DTP-HepB-Hib, excluding PCV, Rotavirus and MSD
13,474,512
14,317,285 Personnel (salaries and per diems – shared and specific) 8,918,560 12,880,520 Maintenance and overhead 2,735,974 3,751,821 Specific Transportation 22,254 22,699 Shared transportation cost (fuel, taxi) 0 0 Short-term training, IEC/social mobilization, Disease surveillance, Programme management)
810,900 728,280
Capital Cold Chain Equipment 0 0 Vehicles 117,957 592,524 Buildings 0 0 Other capital items 0 0 Total routine immunization costs 28,978,657 32,293,328
A costing study Levin et Al. (5) conducted in 2000, estimated total cost for routine EPI was 4,026,905 USD (in nominal value and 5,074,703 USD in real value) corresponding to 9.74 USD per FIC (n=478,719) and a cost of 0.26 USD per capita4.
4 Average costs are presented adjusted for inflation

DO NOT CIRCULATE OR QUOTE WITHOUT PERMISSION
27
4. Cost analysis of routine immunization
4.1. Methods
4.1.1. Perspective and key methodological assumptions
4.1.1.1. Perspective The chosen perspective for the study is the government health service.
4.1.1.2. Analytic horizon For routine, the last fiscal year available being year 2011, the costs were assessed over this period.
4.1.1.3. Definitions of activities and inputs We organized our data collection and analysis to capture routine immunization costs by activity and inputs. The following activities related to routine immunization were included: routine facility based vaccine administration, outreach vaccine administration, record-keeping, surveillance, supervision, training, vaccine collection/distribution/storage, cold chain maintenance. Capital (cold chain equipment, vehicles, and buildings) as well as recurrent inputs (vaccines, salaried labor, volunteer labor, fuel, overheads) were included. Appendix 2 and 3 for provides the definitions of activities (A2) and inputs (A3).
4.1.2. Sampling The sampling of districts and primary health care facilities was conducted in collaboration with EPI manager, deputy EPI manager and PPME division of the Ghana Health Service.
4.1.2.1. Rationale for district selection A stratified random sampling approach was used for the district selection. First, we developed a complete list of the 170 urban and rural districts in Ghana based on GHS listings. The rural/urban classification of localities was population based, with a population size of 5,000 or more being urban and less than 5,000 being rural. An urban community was a settlement with 5000 or more inhabitants, whiles a rural community was a settlement with less than 5000 inhabitants. Therefore, by definition, a district with most communities having less than 5000 inhabitants was classified as a rural district; and a district with most communities having more than 5000 inhabitants was classified as an urban district. We then classified urban and rural district lists within the following categories:
- Number of doses administered (Pentavalent) in 2011 - Inhabitants per square kilometer (population density)
This information was arrayed in an Excel file. This spreadsheet served as the basis for district sample selection. We grouped the district between the different categories (combinations) and performed a randomized sampling within these stratification variables in order to have diversity in terms of immunization performance and population density. As most districts were rural (106 rural and 32 urban)5 in Ghana, we randomly selected four rural districts and two urban districts. We randomly selected four rural districts in the following strata:
- High Population density and high doses administered: Asante Akim South (Ashanti region) - High Population density and low doses administered: Bunkpurugu Yunyoo (Northern region)
5 We excluded Volta region as pre test was performed in this region and also 8 districts from Western region, 2 from Ashanti region, 2 from Eastern region, 1 from Brong Ahafo and 1 from Northern region for which the urban / rural information was not available at the GHS.

DO NOT CIRCULATE OR QUOTE WITHOUT PERMISSION
28
- Low Population density and high doses administered: Atwima Mponua (Ashanti region) - Low Population density and low doses administered Kassena Nankana (Upper East region)
We randomly selected two urban districts in the following strata:
- High doses administered Ga West (Greater Accra) - Low doses administered Wa Municipal (Upper West region)
4.1.2.2. Facility selection We stratified the facilities through the following categories:
- Area (urban or rural) - Facility type (Health Center, CHPS, RCH units of district hospitals, Clinics) - Ownership (Government, NGO/Mission)
For a margin of error of 12%; and a confidence level of 90% with a total number of facilities of 2668, the recommended sample size was 506. In order to have 50 facilities, we selected in each district approximately 50% of the total of health facilities (107). The rule applied to select the number of facilities within each district for each strata is the following: if there was only one facility in the strata, we selected one facility (automatically selected). If there was more than one facility in the strata, we selected approximately 50% of the facilities of same strata. Within strata, we randomly selected the facilities for which there was more than one facility. We used the software, random sorter for Excel. All selected facilities could be verified and were captured in the Ghana Health Service information systems. Some of the facilities initially selected were not functional in 2011. Therefore in some of the districts, replacement facilities were selected. Table 5 lists the six districts that were included in the study and the number and rural facilities per district. See Appendix table A.2 for a list of facilities.
Table 5: Final sample selected by district and loca tion
District Sampled Urban facilities
Total Urban Facilities in a District
% of Total Urban Facilities Sampled
Sampled Rural facilities
Total Rural Facilities in a District
% of Total Rural Facilities Sampled
Asante Akim South 2 2 100% 5 12 42% Atwima Mponua 1 1 100% 5 9 55% Ga West 4 8 50% 4 9 44% Bunkpurugu Yunyoo
1 1 100% 5 9 55%
Kassena Nankana 2 2 100% 6 20 30% Wa Municipal 1 1 100% 12 28 43% Total 11 15 73% 37 87 42%
4.1.3. Data collection and entry
4.1.3.1. Survey units The different sites for data collection included:
- At central level: EPI located within the Diseases Control Department at the Public Health Division of the Ghana Health Service, Ghana Health Service transport, finance, human resource units, MoH administrative and financial directorate, Human Resource department at the MoH, Ministry of Finance and Development partners office (WHO country office, UNICEF country office), Central Cold Store.
- At regional level: EPI administrative units within the regional health services (Regional Health Administrations)
6 http://www.raosoft.com/samplesize.html

DO NOT CIRCULATE OR QUOTE WITHOUT PERMISSION
29
- District level: EPI administrative unit within the district health services and district hospitals (District Health Administration), and reproductive and child health units of district hospitals for service delivery.
- At sub-district level: primary health care facilities that provide immunization services (owned by government or NGOs): including health centers, community based health planning and services (CHPS), and clinics.
4.1.3.2. Training of interviewers and pre-test of questionnaires The questionnaire was adapted from a generic questionnaire developed as part of the common approach (8) to the Ghana context. The interviewers received six day training on the questionnaires in Accra. The deputy EPI manager provided inputs on the questionnaires during the training. The objectives were to:
- Present the study to the interviewers - Discuss and adjust the different questionnaires of the study - Perform a pre-testing of the questionnaires on the field - Finalize operational planning of the data collection
The pre-test of the questionnaires was performed in the Volta Region (which was therefore not part of the study sample). The different facility types were visited as well as the district and regional administrative offices. Based on the pre-test feedback from interviewed individuals, the questionnaires were finalized during a one day debrief session.
4.1.3.3. Field data collection Directed interviews and document review has been performed to collect data on the inputs used by the routine immunization program and for vaccine introduction activities. The data collection at facility, district and region levels was conducted by the interviewers. A National Team Leader was in charge of data collection implementation and supervision at the sub national levels. The Health Economist conducted the central level data collection.
4.1.3.4. Supervision of data entry The supervisors conducted the following activities: Review of first surveys completed followed by random selection out of all final surveys Sending feedback for corrections to interviewers Support the interviewers when issues arise by proposing corrections to resolve them (through a dedicated document).
4.1.3.5. Sharing of the files by interviewers Interviewers sent by email to supervisors the data entry files completed on an on-going basis. Interviewers uploaded the data entry files in a dedicated shared folder created for the study that allowed close monitoring of the data entry. The folders were organized by district and there was one excel file created for each survey.
4.1.3.6. Identification and correction of data entry mistakes and issues A document “Identification of mistakes and issues” has been developed for each survey. This document was completed during data entry by the interviewer when issues were identified. Corrections were proposed by the supervisors and for action (if required) by interviewers. Frequent telephone exchange between interviewers and supervisors were set up to exchange on the problems identified and on the review of the initial surveys competed.
4.1.4. Cost analysis Given the government perspective chosen for the costing, both specific immunization program and shared health system costs were included. The recurrent as well as the capital line item were also within the cost analysis scope.

DO NOT CIRCULATE OR QUOTE WITHOUT PERMISSION
30
For each facility in the sample, we estimated total routine immunization facility costs combining expenditure data and information on quantities and their prices for the activities and inputs described in section above. For each facility, we estimated unit costs by dividing the total routine immunization costs by (1) the annual number of EPI doses delivered in routine schedule; (2) the annual number of fully immunized children who receive DTP3-HepB-Hib; (3) the annual number of infants (under 1 years of age); and (4) the annual total population of the catchment. In sum, the following costs are provided for the facility analysis: facility total cost, cost per dose, unit cost per fully immunized child (DTP3-HepB-Hib), cost per infant, and cost per capita. Costs were weighted based on their respective sampling weights. For the facilities in the sample, we estimated the average weighted total and unit cost by facility type (RCH unit, Clinic, Health Center and CHPS) and by area (urban or rural). For each district and regional administrative unit, we estimated the additional costs related to management, supervision, and vaccine supply chain management. We then estimated a weighted average cost for the sampled districts and regions. The average weighted costs for facility, district and region were then used as inputs into estimating Ghana’s national routine immunization costs for the whole country through an aggregation method described below (Section 3.1.5). Our final set of cost metrics represent national level estimates for total routine immunization costs and cost per dose, cost per FIC, cost per infant and cost per capita, where total costs are divided by national level estimates for the total number of doses delivered, the total number of fully immunized children, the total infant population and the total population, respectively. We present these costs by administrative level (facility, region, district and central levels).
4.1.5. Cost calculation by input classification
4.1.5.1. Paid labor Paid labor was estimated based on the percentage of total working time spent on routine immunization activities. Staff salaries were extracted from the MOH payroll by position and grade of staff in each facility. In Ghana, benefits are embedded in the salary and were collected together with the annual salary.
4.1.5.2. Volunteer labor As volunteers are not paid for their activities in routine EPI, the daily allowance given to them for the National Immunization Days was collected in each facility and served as proxy salary for their work on routine immunization activities. The average number of hours spent by volunteers was also collected.
4.1.5.3. Per-diem and travel allowances The amount of per diem received for routine immunization activities implying overnigh (training, supervision, surveillance, vaccine distribution or collection, outreach) were directly reported by respondents in the survey.
4.1.5.4. Vaccines and injection supplies Vaccine costs are based on the stock position at the end of 2011 (based on reported stock records of doses utilized at the facilities). The stock of doses utilized being assessed; doses wasted were implicitly included in the stock position, in addition to the doses administered. Vaccine costs were allocated to outreach or facility-based service delivery level based on the number of dose administered in each strategy in the facility. Table on vaccine price is available page 26 (table 2).

DO NOT CIRCULATE OR QUOTE WITHOUT PERMISSION
31
4.1.5.5. Transport and fuel Transportation costs were estimated based on the number of kilometers of each vehicle in 2011. The number of kilometers was collected in the log books for vehicles or estimated by respondents7. This figure was apportioned by the share of use for routine immunization also estimated by respondents. Within the use for routine immunization the share of use for each activity was distributed based on the number of trips conducted, the frequency and travel time for a given activity. The pump gasoline price was US$ 0.82 per liter and was uniform across facilities (13).
4.1.5.6. Cold chain energy costs Expenditures on cold chain energy costs were collected at regional level. At national and regional level, expenses were estimated based on the power consumption of the different cold chain equipments and electricity cost in the forecasting tool of 2011 (GHC 0.245 per kiloW/h) (14).
4.1.5.7. Printing costs Specific printing of immunization support documents or tools is performed at central level and the related expenditures for printing were collected at this level.
4.1.5.8. Overheads, utilities and communication Overheads, utilities and communication were estimated based on the facility or administration total overhead expense. A tracing factor was applied based on the number of patients and the number of children who received the third dose of DTP8. Cold chain energy costs were not counted at facility level to avoid double counting of the expense.
4.1.5.9. Cold chain equipment The useful life years of cold chain equipment used for the costing are detailed in the table below (table 6) and were provided by EPI cold chain manager. Prices of cold chain equipment were extracted from the forecasting tool (14) or UNICEF supply database (15). The percentage of use for routine immunization was estimated by cold chain focal point. Cold chain equipment costs were allocated to the activity of vaccine storage.
Table 6: Useful Life Years by type of cold chain eq uipment Cold Chain equipment type Useful life years Walk In Cold Room (WICR) 15 Refrigerator / freezer 8 Cold Box 5 Vaccine Carrier 3
4.1.5.10. Buildings The estimated useful life years of buildings were 25 years (6). The price per square meter of buildings was extracted from the UN population and housing census (9) and varied between facilities and administrative offices (appendix 3).
4.1.5.11. Vehicles The useful life years of vehicles used for the costing are detailed in the table below (table 7).
Table 7: Useful life years by type of vehicles Vehicle type Useful life years Pick up 8 Saloon car 8 Motorbike 5
7 When this data was not available for a given vehicle, the estimated number of km from the last cMYP costing tool was used as a replacement variable. 8 The following formula for the tracing factor was applied: factor = FIC / (outpatient vists + r * inpatient admissions);
DO NOT CIRCULATE OR QUOTE WITHOUT PERMISSION
32
4.1.5.12. Other capital items The estimated useful life year of incinerator was five years (16).
4.1.5.13. Other For surveillance, the focus was on activities related to case detection and outbreak response. We estimated the proportion of time and value of time spent at the facility, district, regional and central levels on surveillance activities related to routine immunization. At district, regional and national level, expenditure information has been obtained on integrated disease surveillance (such as operating costs and overhead expenses) to be allocated to routine immunization on the basis of the proportion of time spent on EPI surveillance and VPD cases to total investigations.
4.1.6. Aggregation of costs In order to provide an estimate of total routine immunization costs for the full country, we aggregated total routine immunization costs at each level of the system as shown in Graph 3 below. . The aggregation was made through the averaging method. Sampling weights were applied to each facility (appendix 4). The sampling weights correspond to the inverse probability of a facility and its associated district of being selected. The facility weighted average cost (without the vaccines) was multiplied by the number of facilities in the study scope (n= 3,044). District and region weighted averages costs were multiplied by the number of districts (n=170) and regions (n=10). Vaccines were included at central level for the aggregation cost calculation.
Graph 3: Schematic illustration of the aggregation process by averaging Number of facilities = 3,044; Number of districts=170; Number of regions=10
4.1.7. Economic and financial costs Both economic costs have been estimated, though the main focus was on economic costs (table 8). Financial costs correspond to the monetary payments (or expenditures) incurred by MOH for the EPI program. Financial costs focused on financial outlays for the EPI program and are defined as “measure of loss of monetary value when a resource is acquired or consumed” in order to carry out an activity (17). Financial costs are reported in the annex 13. Economic costs correspond to the value of resources used to implement routine immunization activities. Economic costs included a valuation of all inputs needed for the routine immunization
Weighted
average facility
cost
Number of
facilities
Total annual facility cost of
routine immunization
Number of regions
Weighted
average region
cost
Number of
districts
Weighted
average district
cost
Central level
cost (including
vaccines)
Total annual
district cost of
routine
immunization
Total annual region cost of
routine immunization
Total annual
facility cost of
routine
immunization
Total annual district cost of
routine immunization
Total annual region cost
of routine
immunization
Total
Aggregated
routine
immunization
cost

DO NOT CIRCULATE OR QUOTE WITHOUT PERMISSION
33
program including valuation of time, supplies, equipment; and annualization of costs that adjusts for a discount rate. For financial cost evaluation, capital costs are divided by the number of years of useful life without discounting (straight line depreciation)(8).
Table 8: Economic and financial costs included Economic Financial Salaried labor Volunteer labor Per diems Transport and fuel Vaccines Building overheads
Included Included Included Included Included Included
Included Excluded Included Included Included (central level) Included
Cold Chain equipment Vehicles Buildings
Included (discounting) Included (discounting) Included
Included (straight line depreciation) Included (straight line depreciation) Excluded
4.1.8. Limitations of the approach
4.1.8.1. Paid labor The estimation of time spent was provided by the staff themselves during interviews. Inconsistent answers (e.g. percentage of staff time superior to 100%, figure not expressed in percentage…) were verified with interviewers and corrected accordingly in order to minimize bias.
4.1.8.2. Volunteers The NIDs daily allowance was used to estimate volunteer labor costs. This may overestimate the volunteer labor costs when compared to local wages.
4.1.8.3. Surveillance We did not estimate the costs of laboratory or the cost of capital equipment for surveillance due to the heavy data collection implied. This may result in surveillance costs being underestimated. This would have required a separate study. Focus was on the most relevant aspects of surveillance.
4.1.8.4. Vehicles and cold chain equipment The data collected did not allow an estimation of actual useful life years of vehicles or cold chain equipment by district or facility as the estimates were not available at this level. Consequently, useful life years were based on national estimates verified by cold chain manager. This approach may not reflect the different settings where actual life years can vary depending on the environment or frequency of use and maintenance.
4.1.8.5. Cold Chain maintenance Expenses for cold chain were collected at national level. Cost related to staff time spent on cold chain and vehicle maintenance was assessed at all levels.

DO NOT CIRCULATE OR QUOTE WITHOUT PERMISSION
34
4.2. Nationwide Routine immunization costs
4.2.1. National costs by line item The total nationwide costs for Ghana’s routine immunization program amounted to 53 492 285 USD in 2011. This represented 5.21% of general government expenditure on health and 0.14% of Gross Domestic Product9. The cost per dose was US $ 5.65 USD. The cost per FIC (DTP3-HepB-Hib) 10 was US $ 60.30. The cost per infant was US $ 52.91. The cost per capita was US $ 2.12. Recurrent costs are the largest component at 91% of total national costs. Within recurrent costs, salaried labor was the main cost driver, accounting for 60.81% of total routine cost. This result is consistent with the fact that currently, salaries and benefits account for more than 60% of total public health expenditure in Ghana (3). Vaccine and injection supplies costs were captured at the central level and accounted for 18.62% of total costs. The remaining recurrent items of the total aggregated costs were, in order of importance: volunteer labor (4.20%), transport (3.37%) and overhead utilities and communication (2.02%). Finally, minor costs drivers concerned cold chain energy costs (0.36%), per diem (0.75%), vehicle maintenance (0.13%), printing (0.11%) and other recurrent costs (0.31%) which together account for less than 2% of total cost (Graph 4).
Graph 4: Distribution of total national routine imm unization cost by line item
Regarding programmatic costs (i.e excluding the vaccines), most of the routine immunization (85%) were supported at facility level (table 10). The share of district was also substantial (11%) considering their critical role in the service provision in Ghana. The table below provides the main cost drivers at the different levels by line items for each administrative level (table 9). Administrative office levels (district, region and central) focus on support activities and facilities on service delivery.
9 General Government Health Expenditure and gross domestic product data are extracted from ‘Health Expenditure
Series’, WHO
(http://apps.who.int/nha/database/StandardReport.aspx?ID=REP_WEB_MINI_TEMPLATE_WEB_VERSION&COUNTRYKEY
=84639) 10 FIC = number of children who received third dose of DTP3 in 2011
Building
overhead,
Utilities,
Communication
2%
Per Diem &
Travel
Allowances
1%
Salaried Labor
61%
Transport/Fuel
3%
Volunteer Labor
4%
Vaccines
17%
Vaccine
Injection &
Safety
Supplies
1%
Cold Chain
Equipment
2%
Vehicles
5%
Buildings
3%

DO NOT CIRCULATE OR QUOTE WITHOUT PERMISSION
35
Table 9: Distribution of routine immunization progr ammatic costs by administrative level and main cost drivers by activity and input
Level Distribution
of costs
Input (four highest in %) Activities (four highest in %)
Facility 85% Salaried labor (82%) Volunteer labor (6%) Vehicles (5%) Transport/fuel (3%)
Record-keeping & HMIS (17%) Facility-based delivery (15%) Outreach service delivery (15%) Social mobilization (14%)
District 11% Salaried labor (38%) Overheads, utilities (15%) Buildings (13%) Vehicles (13%)
Program management (18%) Surveillance (17%) Supervision (14%) Social mobilization (12%)
Region 2% Salaried Labor (39%) Cold Chain Energy costs (18%) Vehicles (13%) Cold Chain equipment (8%)
Vaccine coll., dist. & storage (38%) Program management (17%) Supervision (11%) Surveillance (9%)
Central 2% Cold chain equipment (25%) Salaried labor (18%) Overheads, utilities (13%) Other recurrent (12%)
Vaccine coll., dist. & storage (38%) Social mobilization (22%) Program management (15%) Supervision (10%)
Table 10 provides insights into the main cost drivers by presenting costs by inputs for administrative and health service delivery levels (table 10). The magnitude of cost differences between facilities, regions and district is explained by (1) the difference average costs at each level; (2) the larger number of health facilities compared to the number of administrative offices at the district and regional level; and (3) different budgetary responsibilities at each level of the system. For instance, districts directly pay for utilities, communications and overheads (table 10). Specific cold chain energy costs are supported by central and regional levels (which are the two critical levels for vaccine storage). Per diems are mostly provided at administrative office levels (district, region, central) and are relatively much lower at facility level. Most of the salaried labor was captured by the facility level due to the number of staff involved at facility level and their critical role in service delivery. The cost of transport of fuel was mostly captured by the facility (60%) and district level (37%) and the central and regional levels have a much lower share. Vehicle maintenance and printing costs were supported by the central level.

DO NOT CIRCULATE OR QUOTE WITHOUT PERMISSION
36
Table 10: Summary of aggregated economic costs and unit costs by input and administrative level (USD 2 011) Line item Total
Cost Share Facilities District Health
Administration Regional Health Administration
Central EPI
Recurrent costs
Building overhead, utilities & communication
953,099 2.02% 83,470 723,089 52,326 94,215
Cold chain energy costs 196,677 0.36% 0 0 169,510 27,167
Other recurrent 169,377 0.31% 0 75,899 8,028 85,450
Per diems & travel allowances 355,483 0.75% 125,788 167,067 55,790 6 838
Salaried labor 32,566,697 60.81% 30,231,147 1,850,881 358,054 126,615
Transport/fuel 1,795,528 3.37% 1,069,759 661,529 43,225 21,016
Volunteer labor 2,267,997 4.20% 2,267,997 0 0 0
Vaccines 9,278,187 17.18% 0 0 0 9,278,187
Vaccine injection & safety supplies 779,738 1.44% 0 0 0 779,738
Vehicle maintenance 13,516 0.03% 0 0 0 13,516
Printing 58,279 0.11% 0 0 0 58,279
subtotal recurrent 48,434,577 91% 33,778,159 3,478,465 686,932 10,491,020
Capital costs
Cold chain equipment 1,174,019 2.21% 726,026 203,467 71,106 173,417
Vehicles 2,432,026 4.52% 1,742,250 497,118 124,373 68,285
Buildings 1,431,615 2.65% 748,149 613,628 41,908 27,930
other capital 20,048 0.05% 0 15,785 4,263 0
subtotal capital 5,057,708 9% 3,216,426 1,330,001 241,651 269,631
TOTAL 53,492,285 100% 36,994,586 4,808,466 928,582 10,760,651
Cost per routine dose administered; n=9,464,165
5.65 - 3.91 0.51 0.10 1.14
Cost per FIC (DTP3); n=887,086 60.30 - 41.70 5.42 1.05 12.13
Cost per infant population; n= 1,011,012 52.91 - 36.59 4.76 0.92 10.64
Cost per capita; n= 25,275,293 2.12 - 1.46 0.19 0.04 0.43
*Cold chain maintenance, review meeting, social mobilization expenses / **expenses for electricity, water

DO NOT CIRCULATE OR QUOTE WITHOUT PERMISSION
37
4.2.2. Aggregated costs by activity The main cost drivers of aggregated cost are linked to the activity of vaccine collection, distribution and storage (Graph 5). This is linked to the aggregation methods that counted vaccines at central level (and therefore allocated their cost to the activity of vaccine collection, distribution and storage). The other main cost drivers were surveillance (11%), social mobilization & advocacy (11%), routine facility-based service delivery (11%), record keeping (12%) and outreach service delivery (10%).
Graph 5: Distribution of aggregated cost for routin e immunization by activity (USD, 2011)
Cold Chain Maintenance
2%
Other
4%
Outreach Service
Delivery
10%Program Management
4%
Record‐Keeping & HMIS
12%
Routine Facility‐
based Service
Delivery
11%
Social
Mobilization &
Advocacy
11%Supervision
5%
Surveillance
11%
Training
3%
Vaccine Collection,
Distribution, & Storage
27%

DO NOT CIRCULATE OR QUOTE WITHOUT PERMISSION
38
4.3. Administrative offices costs for routine immunization (central, region, district)
The EPI routine total costs of administrative offices were:
- 702,727 USD at central level - 92,858 USD by Regional Health Administration (RHA) (weighted average) - 28,285 USD by District Health Administrations (DHA)
Regions play a critical role in administration, supervision and sub-national vaccine supply chain, where they are the hub for regional vaccine storage. Districts have a more critical role in EPI operational support to sub district facilities but also store vaccines and injection supplies. The cost at district office level varies from 12,067 USD (Bunkpurugu Yunyoo district) to 50,425 USD (Wa Municipal). When comparing the number of pentavalent doses administered in these two districts, the Bunkpurugu Yunyoo district has a lower cost per FIC than the Wa Municipal district office. One explanation could be that the superficy of Wa Municipal is three times the one of Bunkpurugu Yunyoo implying a much more dispersed population in Wa Municipal. The cost at regional level varies from 57,650 USD (Greater Accra) to 145,520 USD (Upper West). Greater Accra has a lower cost per FIC than the Upper West region.
4.3.1. Economic costs by line items (DHA, RHA, Central EPI) The capital versus recurrent costs distribution was similar between DHA (74% recurrent / 26% capital) and RHA (76% recurrent / 24% capital). For central EPI, recurrent costs represented 62% of total costs and capital represented 38%. This is mostly explained by the importance of cold chain equipment costs at central level. The proportion of capital costs in district (26%), region (24%) and central administration (38%) was much higher than in facilities due to their vaccine supply chain distribution role (implying vehicle and cold chain equipment costs) and storage (buildings) in the EPI system (9). The distribution of costs between line items varied importantly depending on the administrative level of interest. Salaried labor represented a significant share of total cost in DHA (38.49%) and RHA (38.59%) but was lower at central level (18.02%). The lower share of salaried labor costs at central level is accounted by the fact that many expenses are executed at the central level (such as the cold chain energy costs). The share transport and fuel cost in DHA (13.76%) was much higher than in RHA (4.65%) and at central EPI (2.99%). Most of the supervisory, surveillance and operational activities for routine immunization take place at DHA level (9).

DO NOT CIRCULATE OR QUOTE WITHOUT PERMISSION
39
Table 11: Total routine immunization district and n ational health office immunization economic costs by line item (USD, 2011 )
Administrative level
Line item
District Health Administration
(weighted average)
N=6
Regional Health Administration
(weighted average)
N=5
Central EPI N=1
Total cost (USD) Range (Min-Max)
28,285 (12,067 – 50,425)
92,858 (57,650 – 145,520)
702,727
Building overhead, utilities & communication 4,253 5,233 94,215
Cold chain energy 0 16,951 27,167
Other recurrent 446 803 85,450
Per diems & travel allowances 983 5,579 6,838
Salaried labor 10,888 35,805 126,615
Transport & fuel 3,891 4,322 21,016
Subtotal recurrent 20,462 68,693 433,096
Buildings 3,610 4,191 27,930
Cold chain equipment 1,197 7,111 173,417
other capital 93 426 -
Vehicles 2,924 12,437 68,285
Subtotal capital 7,824 24,165 269,631
4.3.2. Economic costs by activity (DHA, RHA, Central EPI) Program management, surveillance, supervision and vaccine supply chain management and distribution were the most important activities in terms of costs at the district health administration level. At regional level, vaccine supply chain management and distribution (collection, distribution and storage) had the highest share in total cost (37.54% ) as this activity is one of their prerogatives (Walk in cold rooms at regional level, Trucks to distribute the vaccines). Program management was the second highest activity in terms of share of total costs, followed by supervision (table 12). At central level, the main cost drivers are vaccine collection/distribution/storage, social mobilization and program management.
Table 12: Total Routine Immunization District and N ational Level Economic Costs
by Activity (USD, 2011) Line Items DHA RHA Central EPI
Cost (USD) Cost (USD) Cost (USD) Record-keeping/HMIS Supervision Social mobilization & advocacy Cold chain maintenance Vaccine coll., dist. & storage Program management Training Surveillance Other
2,666 3,900 3,292
654 3,843 5,178 1,506 4,749 2,407
3,932 10,166
4,554 1,810
34,862 15,897
7,637 7,898 6,102
13,545 72,534
156,756 46,500
266,498 102,229
19,790 8,905
15,971 Total immunization economic cost 28,285 92,858 702,727

DO NOT CIRCULATE OR QUOTE WITHOUT PERMISSION
40
4.4. Results at facility level for routine immunization economic costs
4.4.1. Total and unit costs at facility level The weighted average facility cost for routine immunization was 16,460 USD in 2011 within the sampled facilities. The weighted average unit costs were US$ 5.07 per dose, US$ 51.26 per FIC (DTP3-HepB-Hib)11, US$ 36.11 per infant and US$ 1.50 per capita.
4.4.1.1. Total and unit cost by facility type Reproductive and Child Health Units of District Hospitals and Health Centers have the highest total cost compared to Clinics and CHPS (table 13). One explanation is that Health Center serves as a reference point for sub districts (for vaccine storage in particular). The highest cost per FIC (DTP3-HepB-Hib) was in the Community-based Health and Planning Services (CHPS) facilities (US$ 87.78). This is due to the lower population level in catchment area of CHPS facilities and the lower number of children that were fully immunized (5,831 total population and 146 fully immunized children). This result outlines the higher cost of immunizing children in hard-to-reach communities and health facilities which occurs more frequently in CHPS zones (table 13).
Table 13: Annual total costs, total outputs and uni t costs at facility level by facility
type (US$ 2011) Outputs and Unit Costs RCH
N=4 Clinic N=9
Health Center N=17
CHPS N=20
All N=50
Total routine doses administered Standard deviation
11,119 1,241
3,628 409
4,432 157
1,647 75
3,245 53
Total DTP3 Vaccinated Children (FIC) Standard deviation
695 84
330 33
545 21
146 5
321 5
Infant population (catchment area) Standard deviation
1,402 192
552 66
573 22
261 12
513 8
Total population (catchment area) Standard deviation
56,547 11,537
8,875 646
13,809 573
5,831 221
12,398 222
Routine immunization costs (vaccines & delivery cost) Weighted average facility total cost Standard deviation
26,743 3,692
12,885 712
22,989 612
12,778 564
16,460 217
Cost per routine dose administered Cost per FIC Cost per infant population Cost per capita
2.41 38.49 19.08
0.47
3.55 39.07 23.33
1.45
5.19 42.17 40.11
1.66
7.76 87.78 48.89 2.19
5.07 51.26 36.11
1.50 Delivery cost (excluding vaccines and supplies) Weighted average delivery cost Standard deviation
16,425 2,330
10,526 461
14,515 440
10,891 381
12,154 146
Cost per routine dose administered Cost per FIC Cost per infant population Cost per capita
1.48 23.64 11.72
0.29
2.90 31.91 19.06
1.19
3.27 26.62 25.32
1.05
6.61 74.82 41.67 1.87
3.75 37.85 26.66
1.10
Larger catchment facilities have both higher total costs and relatively higher numbers of children they are immunizing. The unit cost per dose decreased with the facility type and size of catchment area implying that larger like the RCH and health centers have a more efficient use of resources per dose administered (Graph 6), and they may require more total resource 11 FIC = number of children who received third dose of DTP3 in 2011

DO NOT CIRCULATE OR QUOTE WITHOUT PERMISSION
41
compared to smaller facilities (who have lower total costs). This also suggest economies of scale according to facility type, identified in other studies (18). Within the same facility types, urban facilities appear to have a lower cost per dose (Graph 6).
Graph 6: Cost per dose, by facility type and locati on (USD, 2011)
4.4.1.2. Total and unit economic cost by area Although the total cost was higher in urban areas (18,750 USD) than rural areas (16,061 USD) the unit cost was substantially lower in urban areas as larger catchment areas reduce unit costs (Graph 6, table 14).
8.00
3.64
5.51
3.66 3.44
2.16 2.41
CHPS
rural
CHPS
urban
Health
Center
rural
Health
Center
urban
Clinic
rural
Clinic
urban
RCH
urban
Unit cost per dose , by type and area (USD)

DO NOT CIRCULATE OR QUOTE WITHOUT PERMISSION
42
Table 14: Unit costs in urban and rural settings (s ampled facilities, average), USD
CHPS
rural
N=19
CHPS
urban
N=1
Health
center
rural
N=14
Health
center
urban
N=3
Clinic
rural
N=6
Clinic
urban
N=3
RCH
urban
N=4
Average cost
Standard deviation
12,833
593
11,017
-
23,098
679
22,238
4953
13,501
1023
11,413
2418
26,743
3692
Average delivery cost
Standard deviation
11,030
394
6,429
-
14,537
510
14,364
2,973
11,000
579
9,393
1,841
16,425
2,330
Outputs
Routine dose
Standard deviation
1,604
79
3,024
-
4,195
196
6,078
581
3,925
720
5,276
1452
11,119
1241
FIC
Standard deviation
136
5
443
-
545
26
549
62
365
55
245
52
695
84
Infant
Standard deviation
263
12
-
-
562
27
650
25
607
109
422
147
1,402
192
Total population
Standard deviation
5,842
232
5,468
-
13,457
722
16,246
632
8,009
679
10,949
3,526
56,547
11,537
Unit costs
per dose 8.00 3.64 5.51 3.66 3.44 2.16 2.41
per FIC 94.16 24.87 42.41 40.50 36.94 46.66 38.49
per infant 48.85 - 41.09 34.24 22.25 27.06 19.08
per total population 2.20 2.01 1.72 1.37 1.69 1.04 0.47
Unit delivery costs
per dose 6.88 2.13 3.47 2.36 2.80 1.78 1.48
per FIC 80.94 14.51 26.69 26.16 30.10 38.41 23.64
per infant 41.99 29.36 25.86 22.11 18.13 22.27 11.72
per total population 1.89 1.18 1.08 0.88 1.37 0.86 0.29
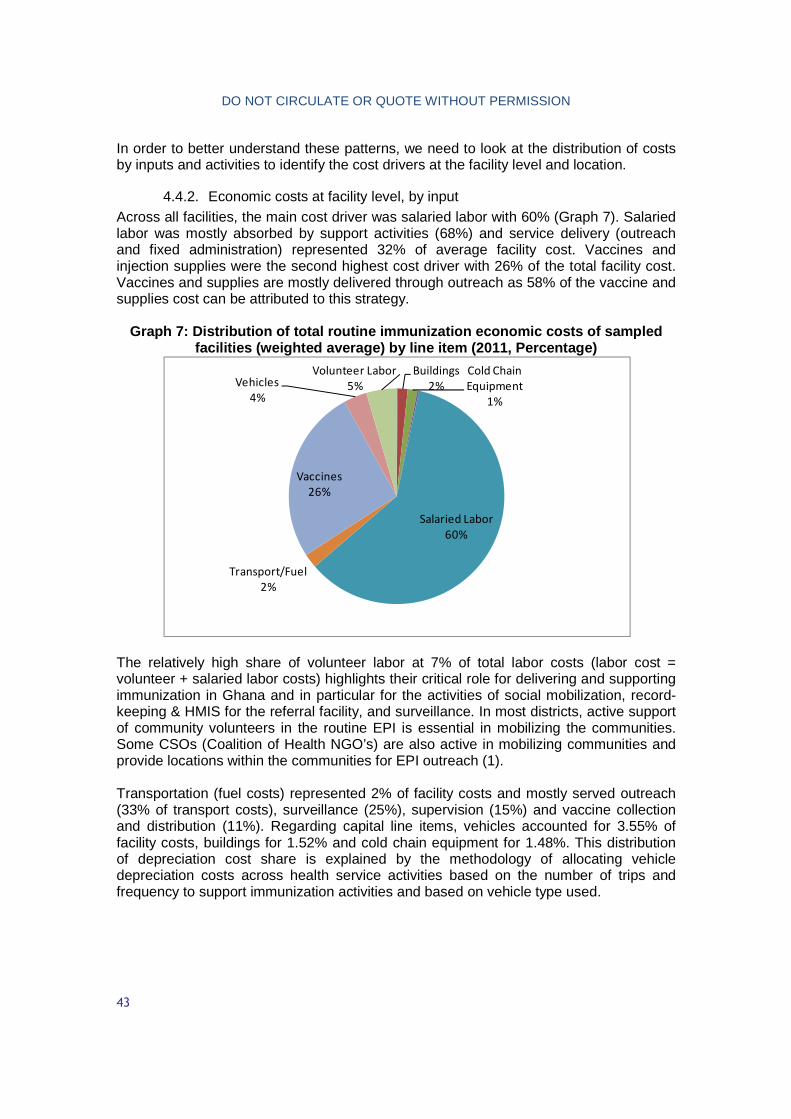
DO NOT CIRCULATE OR QUOTE WITHOUT PERMISSION
43
In order to better understand these patterns, we need to look at the distribution of costs by inputs and activities to identify the cost drivers at the facility level and location.
4.4.2. Economic costs at facility level, by input Across all facilities, the main cost driver was salaried labor with 60% (Graph 7). Salaried labor was mostly absorbed by support activities (68%) and service delivery (outreach and fixed administration) represented 32% of average facility cost. Vaccines and injection supplies were the second highest cost driver with 26% of the total facility cost. Vaccines and supplies are mostly delivered through outreach as 58% of the vaccine and supplies cost can be attributed to this strategy.
Graph 7: Distribution of total routine immunization economic costs of sampled
facilities (weighted average) by line item (2011, P ercentage)
The relatively high share of volunteer labor at 7% of total labor costs (labor cost = volunteer + salaried labor costs) highlights their critical role for delivering and supporting immunization in Ghana and in particular for the activities of social mobilization, record-keeping & HMIS for the referral facility, and surveillance. In most districts, active support of community volunteers in the routine EPI is essential in mobilizing the communities. Some CSOs (Coalition of Health NGO’s) are also active in mobilizing communities and provide locations within the communities for EPI outreach (1). Transportation (fuel costs) represented 2% of facility costs and mostly served outreach (33% of transport costs), surveillance (25%), supervision (15%) and vaccine collection and distribution (11%). Regarding capital line items, vehicles accounted for 3.55% of facility costs, buildings for 1.52% and cold chain equipment for 1.48%. This distribution of depreciation cost share is explained by the methodology of allocating vehicle depreciation costs across health service activities based on the number of trips and frequency to support immunization activities and based on vehicle type used.
Buildings
2%
Cold Chain
Equipment
1%
Salaried Labor
60%
Transport/Fuel
2%
Vaccines
26%
Vehicles
4%
Volunteer Labor
5%

DO NOT CIRCULATE OR QUOTE WITHOUT PERMISSION
44
4.4.2.1. Economic costs at facility level, by input and facility type Distribution of costs by line items follows important variations depending on the facility type (table 15). The range of cost per facility was USD 12,778 (CHPS) to USD 26,743 (table 15), with the average weighted cost of USD 16,460. Labor accounted for the majority of costs in all facilities except the health center. In CHPS facilities and clinics, salaried labor costs represented respectively 71% and 74% of total facility cost, which is higher than the weighted average share of salaried labor cost across facilities (60%). In turn, in Health Centers and RCH units, the proportion of salaried labor costs was lower at 47%; and 57%, respectively. The low share of salaried labor in Health Centers and RCH is explained by the higher cost shares for vaccines (37%) and capital depreciation compared to the other facilities. The cost of vaccines is higher in RCH units than Health Centers. However, differences of vaccines costs in relation to vaccine doses administered implies higher wastage rates in Health Centers compared to RCH units of district hospitals. The proportion of volunteer labor cost was higher in CHPS (6.34%) as these facilities are in the first line of immunization delivery within communities which requires support from volunteers. Similarly, the share of transport and fuel costs was also the highest in CHPS and due to the number of communities in remote areas (for outreach delivery). The share of capital items in the facility total cost was much higher in Health Centers (9.73%) as they often serve as the sub-district reference center for EPI activities (operations and coordination). Therefore, they have the capacity to store vaccines (more cold chain equipment) and also have a bigger vehicle fleet available and dedicated to immunization activities (including for supervision and surveillance). CHPS and Clinics had a lower share in capital costs (5.19%; 2.93%) compared to Health Centers. The low cost of per diem can be explained by the fact that they are only provided for overnight missions (which are more frequent at district and regional EPI) and not for one-day duties out of health centers.

DO NOT CIRCULATE OR QUOTE WITHOUT PERMISSION
45
Table 15: Total Routine Immunization Economic Costs by input and Facility Type (USD, 2011)
Facility Type Line Items
RCH Unit n=4
Clinic n=9
Health Center n=17
CHPS n=20
All n=50
Cost (USD)
% Cost (USD)
% Cost (USD)
% Cost (USD)
% Cost (USD)
%
Salaried Labor Volunteer Labor Per Diems Vaccines Transport & fuel Building overheads
15,331 553
22 10,318
183 0
57.33% 2.07% 0.08% 38.58% 0.68%
-
9,545 321
22 2,359
267 6
74.08% 2.49% 0.17% 18.31% 2.07% 0.05%
10,752 908
99 8,474
467 81
46.77% 3.95% 0.43%
36.86% 2.03% 0.35%
9,066 816
15 1,887
326 5
70. 95% 6.34% 0.12% 14.77% 2.55% 0.04%
9,931 745 41
4,306 351 27
60.34% 4.53% 0.25% 26.16% 2.14% 0.17%
Subtotal recurrent 26,407 98.74% 12,127 97.16% 20,474 90.40% 12,114 94.81% 15,066 93.58% Cold chain equipment Vehicles Buildings
157 155
24
0.59% 0.58% 0.09%
117 209
41
0.91% 1.62% 0.31%
477 1,322
409
2.07% 5.75% 1.78%
143 280 240
1.12% 2.19% 1.88%
239 572 246
1.45% 3.48% 1.49%
Subtotal capital 336 1.26% 366 2.84% 2,208 9.60% 664 5.19% 1,057 6.42% Total Facility Immunization Cost
26,743 100% 12,885 100% 22,989 100% 12,778 100% 16,460 100%

DO NOT CIRCULATE OR QUOTE WITHOUT PERMISSION
46
4.4.2.2. Economic cost at facility level, by line item and location Table 16: Total routine immunization economic costs by input and location
(USD, 2011) Input Rural Urban
Building overheads, utilities & communication 0.20% 0.00% Buildings 1.06% 3.61% Cold chain equipment 1.56% 0.90% Per diems & travel allowances 0.28% 0.12% Salaried labor 60.95% 57.31% Transport / fuel 2.46% 0.55% Vaccines 24.69% 33.41% Vehicles 3.88% 1.48% Volunteer labor 4.91% 2.63% Total général 100.00% 100.00%
The total facility average cost was higher in urban settings due to larger facility size and the higher catchment population on average and the increased impact on vaccine and injections supply costs (table 16). The cost shares between urban and rural remained almost similar for salaried labor, per diem and cold chain equipment but were different for vaccines, transport, volunteer, vehicles and building. Salaried labor represented 65.41% of total cost in urban facilities and 66.02% in rural ones. The share of volunteer labor was substantially higher in rural settings (5.32%) than in urban settings (3.00%) as they are more mobilized by remote facilities and to target hard to reach population. Similarly, the share of transportation and fuel was higher in rural settings due to the frequency of use of vehicles for the different immunization activities (outreach, vaccine collection, supervision). In addition, the average distance travelled was systematically higher on average in rural areas for all facility types (2.5 higher in rural health centers for examples). The proportion of capital depreciation costs was almost similar between urban and rural facilities (6.83% for urban and 7.05% for rural). However, the distribution within capital costs varied between urban and rural settings. The main difference being that, in rural settings, capital costs were mostly driven by vehicle costs (4.21% in rural; 1.69% in urban); whereas, in urban settings, capital costs were driven by building costs of (4.11% in urban; 1.15% in rural). This difference is explained by the fact that urban facilities tend to have a bigger surface dedicated to vaccine delivery and vaccine storage (because they administer and store more vaccines on average). Similarly, the need to use vehicles more frequently and for longer distances for outreach and other activities in rural settings impacted on the share of use of vehicles and their associated costs.

DO NOT CIRCULATE OR QUOTE WITHOUT PERMISSION
47
When excluding salaried labor costs, CHPS had the highest unit cost per dose, per child and per FIC. On the opposite, RCH units had the lowest cost per dose, per child and per FIC. These findings are consistent with the total and delivery costs per unit of output (table 17). Table 17: total and delivery costs (excluding human resources)
Facility Type Unit cost Non-HR unit cost Delivery unit cost
Non-HR Delivery unit cost
Per dose administered
CHPS 7.76 USD 2.25 USD 6.61 USD 1.11 USD
Clinic 3.55 USD 0.92 USD 2.90 USD 0.27 USD
Health Center 5.19 USD 2.76 USD 3.27 USD 0.85 USD
RCH 2.41 USD 1.03 USD 1.48 USD 0.10 USD
All facilities 5.07 USD 2.01 USD 3.75 USD 0.68 USD
Per infant population
CHPS 48.96 USD 14.22 USD 41.73 USD 6.99 USD
Clinic 23.34 USD 6.05 USD 19.07 USD 1.78 USD
Health Center 40.12 USD 21.36 USD 25.33 USD 6.57 USD
RCH 19.07 USD 8.14 USD 11.72 USD 0.78 USD
All facilities 32.09 USD 12.73 USD 23.69 USD 4.33 USD
Per Fully Immunized Child (FIC)
CHPS 87.52 USD 25.43 USD 74.59 USD 12.50 USD
Clinic 39.05 USD 10.12 USD 31.90 USD 2.97 USD
Health Center 42.18 USD 22.45 USD 26.63 USD 6.90 USD
RCH 38.48 USD 16.42 USD 23.63 USD 1.57 USD
All facilities 51.28 USD 20.34 USD 37.86 USD 6.92 USD

DO NOT CIRCULATE OR QUOTE WITHOUT PERMISSION
48
4.4.3. Economic costs at facility level, by activity Graph 8: Distribution of total routine immunization economic costs by activity at
facility level
Almost half of the facility costs (48%) can be attributed to service delivery with outreach services representing one fourth of total facility costs (26%) and facility-based delivery accounting for 22%. The cost of service delivery (facility-based or outreach) was mostly driven by the value of the vaccines, salaried labor, fuel, vehicles and volunteer labor. Record-keeping (12%), social mobilization (10%) and surveillance (10%) were the remaining activities driving facility-level costs. Salaried and volunteer labor were the main inputs of these activities which seemed consistent with the nature of these activities and the fact that costs associated with laboratory surveillance were not included. Surveillance also involves transportation costs to a minor extent. The activities of vaccine collection/distribution/storage, supervision, training, program management and cold chain maintenance each represent less than 10% of facility costs. Cold chain maintenance and social mobilization is limited to salaried labor as no expense is borned at facility level. Supervision is not a major cost driver at facility level (4%) as it is mostly conducted by the district level. The higher proportion of support activities in some facilities did not seem to influence the cost per dose of a given facility.
Cold Chain
Maintenance
2%
Other
3%
Outreach Service
Delivery
26%
Program
Management
2%Record‐Keeping &
HMIS
12%
Routine Facility‐
based Service
Delivery
22%
Social Mobilization
& Advocacy
10%
Supervision
4%
Surveillance
10%
Training
2%
Vaccine Collection,
Distribution, &
Storage
7%

DO NOT CIRCULATE OR QUOTE WITHOUT PERMISSION
49
4.4.3.1. Economic costs at facility level, by activity and facility type Health centers and clinics have the highest share of outreach services in total facility cost. This is partly explained by the higher value of vaccines (for health centers in particular that store more vaccines). The highest share of facility-based delivery is in RCH due to a larger catchment population in RCH units on average (56 547) compared to the average total population across facilities (12 398) and higher population density. The share of social mobilization costs is relatively higher in the CHPS and clinics (12.41%; 14.94%) and relatively lower in the HC and RCH (7.62%; 3.97%) outlining that more time is spent on mobilizing communities in smaller facilities.

DO NOT CIRCULATE OR QUOTE WITHOUT PERMISSION
50
Table 18: Total routine immunization economic costs by activity and facility type (USD, 2011) Facility type
Activity RCH n=4
Clinic n=9
HC n=17
CHPS n=20 All Percent
Facility-based delivery Record-keeping/HMIS Supervision Outreach services Social mobilization Cold chain maintenance Vaccine coll. & dist. Program management Training Surveillance Other
12,341 4,271
754 5,428
905 246 471 597 344
1,369 16
46.15% 15.97% 2.82% 20.30% 3.38% 0.92% 1.76% 2.23% 1.29% 5.12% 0.06%
2,862 1,399
889 3,434 1,867
157 785 159 233
1,069 31
22.21% 10.86% 6.90% 26.65% 14.49% 1.22% 6.10% 1.24% 1.80% 8.29% 0.24%
5,248 2,160
701 7,485 1,729
536 1,823
515 689
1,280 823
22.83% 9.40% 3.05% 32.56% 7.52% 2.33% 7.93% 2.24% 3.00% 5.57% 3.58%
2,098 1,920
461 2,574 1,586
291 818 121 250
1,991 667
16.42% 15.03% 3.61% 20.15% 12.41% 2.28% 6.40% 0.95% 1.96% 15.58% 5.22%
3,627 2,006
620 4,312 1,647
339 1,096
266 382
1,591 574
22.04% 12.19% 3.77% 26.20% 10.01% 2.06% 6.66% 1.62% 2.32% 9.67% 3.48%
Total Cost 26,743 100% 12,885 100% 22,989 100% 12,778 100% 16,460 100%

DO NOT CIRCULATE OR QUOTE WITHOUT PERMISSION
51
In all facility types, facility based and outreach were among the three main cost drivers (table 19). In RCH units, record-keeping was the second activity cost driver. This is explained by the higher activity volume for vaccine administration in RCH units, implying higher personnel time for reporting (high share of record-keeping and HMIS). Outreach is the first activity cost drivers in Health Centers (32%), Clinics (26%) and CHPS (20.15%) as most of them are located in rural areas where outreach is the favored delivery mode. See table 21 for the number of FTE by facility type and how their time is allocated across activities.
Table 19: Main cost drivers (activities) by facilit y type Facility t ype Three main cost drivers RCH units ; n=4 Facility-based delivery (46.15%)
Outreach services (20.30%) Record-Keeping & HMIS (15.97%)
Health centers ; n=17 Outreach delivery (32.56%) Facility-based delivery (22.83%) Record-keeping & HMIS (9.40%)
Clinics ; n=9 Outreach delivery (26.65%) Facility-based delivery (22.21%) Social mobilization (14.49%)
CHPS; n=20 Outreach delivery (20.15%) Facility-based delivery (16.42%) Surveillance (15.58%)
Table 20: Total FTEs and staff time allocation by t ype of facility by line item (weighted averages)
Line Items RCH Health
Center
Clinic CHPS All
Sample (n) 4 9 17 20 50
Total FTEs per facility 3.00 1.57 1.99 1.69 1.76
Range of FTE (1.19-8.38) (0.44-5.60) (0.56-4.90) (0.53-3.85) (0.44-8.38)
Doses 11,119
1,241
3,628
409
4,432
157
1,647
75
3,245
53
Doses per FTE 3,706 2,311 2,227 975 1,843
FTE per dose delivered 0.0010 0.0004 0.0004 0.0003 0.0005
Table 21: Staff time allocation and distribution of salaried costs by facility type by activity Facility type RCH Health
Center Clinic CHPS
FTE for routine immunization Range (Min-Max)
3.00 (1.19-8.38)
1.57 (0.44-5.60)
1.99 (0.56-4.90)
1.69 (0.53-3.85)
Distribution of salaried labor costs by activity Cold chain maintenance 1.60% 4.99% 1.65% 3.21% Other 0% 3.73% 0.09% 6.75% Outreach delivery 12.47% 12.66% 25.10% 15.07% Program management 3.90% 4.76% 1.66% 1.18%

DO NOT CIRCULATE OR QUOTE WITHOUT PERMISSION
52
Facility type RCH Health Center
Clinic CHPS
Record-keeping & HMIS 26.87% 19.70% 14.59% 17.54% Routine Facility-based Service Delivery 34.87% 20.67% 14.13% 10.50% Social Mobilization & Advocacy 4.44% 12.94% 18.07% 14.43% Supervision 4.92% 5.73% 8.39% 4.02% Surveillance 6.68% 5.70% 8.55% 19.03% Training 2.20% 5.55% 2.36% 1.95% Vaccine Collection, Distribution, & Storage 2.05% 3.58% 5.41% 6.32% Total facility immunization cost 26,743 22,989 12,885 12,778
4.4.3.2. Economic costs at facility level, by activity, location and area
Table 22: Total Routine Immunization Economic Costs by Activity by Location (USD, 2011) Activity Urban Rural Routine Facility-based Service Delivery 6,152 3,187 Outreach Service Delivery 4,773 4,773 Record-Keeping & HMIS 2,598 1,903 Supervision 729 601 Social Mobilization & Advocacy 688 1,814 Surveillance 1,342 1,635 Cold Chain Maintenance 425 324 Vaccine Collection, Distribution, & Storage 711 1,163 Program Management 268 266 Training 263 402 Other 803 534 Weighted total average 18,750 16,061
Rural and urban facilities had a similar cost structure by activity, but the cost of fixed-based service delivery in urban area was significantly higher than in rural areas. The higher proportion of fixed-based delivery cost in urban area was explained by the fact that immunization services are offered everyday in urban locations (19) (20) due to higher population density, whereas it is not always provided on a daily basis in rural areas (20). In turn, in rural areas, the share of outreach delivery cost is higher than in urban areas as rural areas rely heavily on outreach (20) due to more a dispersed population. The share of social mobilization is higher in rural settings (as communities are more spread-out than in urban areas which involves more staff time). Social mobilization methods and tools to mobilize communities include mobile phones, “Gong-Gong” beater and face to face communication (1). The share of vaccine collection is also higher (due to the higher frequency that small rural facilities need to collect vaccines as some of them do not cold chain equipment to store the vaccines). On the opposite, urban facilities have higher costs for record-keeping and HMIS due to the volume of activity (higher number of doses administered).
Table 23: Staff time allocation and distribution by location and area Rural Urban % FTE for routine immunization (weighted average)
1.71 2.08
Salaried labor cost by activity Cost (USD) (standard deviation)
% Cost (USD) (standard deviation)
%
Cold Chain Maintenance 324 (11 )
3,31% 425 (49)
3,95%
Other 352 3,59% 791 7,36%

DO NOT CIRCULATE OR QUOTE WITHOUT PERMISSION
53
Rural Urban
(53) (239) Outreach Service Delivery 1,590
(39) 16,24% 1,442
(128) 13,42%
Program Management 257 (11)
2,63% 266 (35)
2,47%
Record-Keeping & HMIS 1,701 (43)
17,37% 2,546 (248)
23,69%
Routine Facility-based Service Delivery 1,456 (47)
14,87% 2,402 (248)
22,35%
Social Mobilization & Advocacy 1,531 (48)
15,64% 496 (55)
4,62%
Supervision 500 (17)
5,11% 718 (86)
6,68%
Surveillance 1,241 (42)
12,67% 998 (86)
9,29%
Training 332 (21)
3,39% 234 (17)
2,17%
Vaccine Collection, Distribution, & Storage 507 (16)
5,18% 428 (50)
3,99%
Total 9,790 10,746
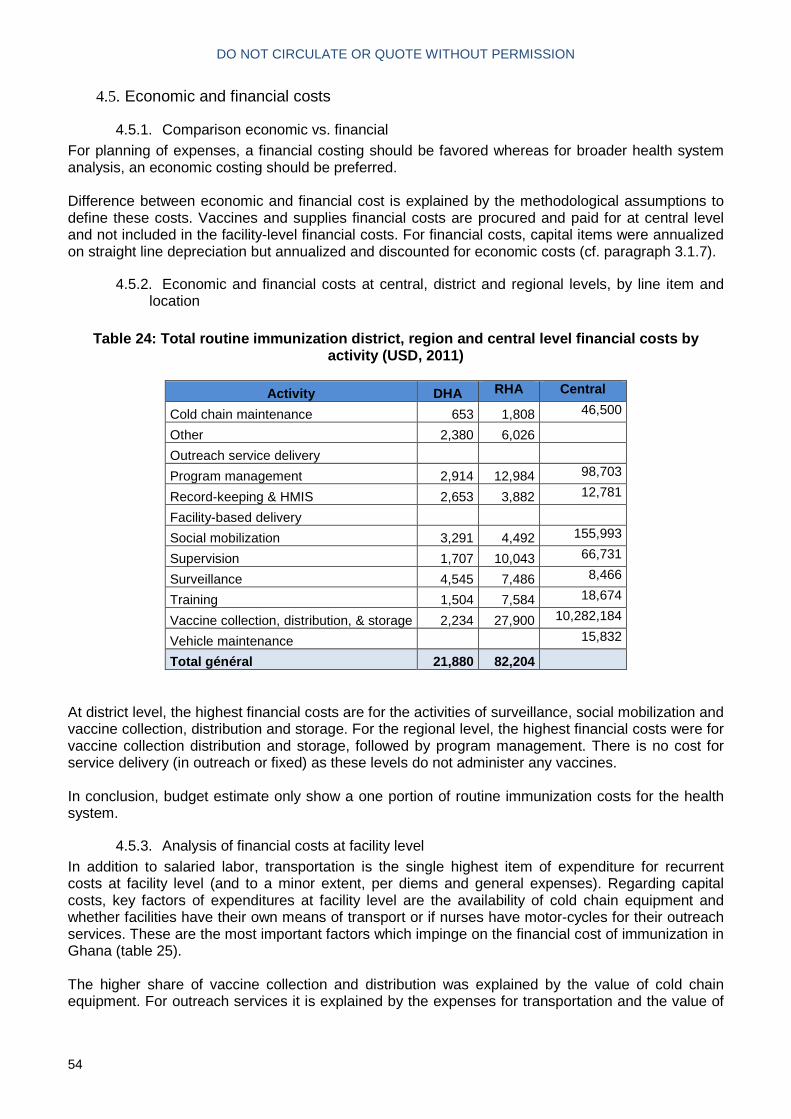
DO NOT CIRCULATE OR QUOTE WITHOUT PERMISSION
54
4.5. Economic and financial costs
4.5.1. Comparison economic vs. financial For planning of expenses, a financial costing should be favored whereas for broader health system analysis, an economic costing should be preferred. Difference between economic and financial cost is explained by the methodological assumptions to define these costs. Vaccines and supplies financial costs are procured and paid for at central level and not included in the facility-level financial costs. For financial costs, capital items were annualized on straight line depreciation but annualized and discounted for economic costs (cf. paragraph 3.1.7).
4.5.2. Economic and financial costs at central, district and regional levels, by line item and location
Table 24: Total routine immunization district, regi on and central level financial costs by
activity (USD, 2011)
Activity DHA RHA Central
Cold chain maintenance 653 1,808 46,500
Other 2,380 6,026
Outreach service delivery
Program management 2,914 12,984 98,703
Record-keeping & HMIS 2,653 3,882 12,781
Facility-based delivery
Social mobilization 3,291 4,492 155,993
Supervision 1,707 10,043 66,731
Surveillance 4,545 7,486 8,466
Training 1,504 7,584 18,674
Vaccine collection, distribution, & storage 2,234 27,900 10,282,184
Vehicle maintenance 15,832
Total général 21,880 82,204
At district level, the highest financial costs are for the activities of surveillance, social mobilization and vaccine collection, distribution and storage. For the regional level, the highest financial costs were for vaccine collection distribution and storage, followed by program management. There is no cost for service delivery (in outreach or fixed) as these levels do not administer any vaccines. In conclusion, budget estimate only show a one portion of routine immunization costs for the health system.
4.5.3. Analysis of financial costs at facility level In addition to salaried labor, transportation is the single highest item of expenditure for recurrent costs at facility level (and to a minor extent, per diems and general expenses). Regarding capital costs, key factors of expenditures at facility level are the availability of cold chain equipment and whether facilities have their own means of transport or if nurses have motor-cycles for their outreach services. These are the most important factors which impinge on the financial cost of immunization in Ghana (table 25). The higher share of vaccine collection and distribution was explained by the value of cold chain equipment. For outreach services it is explained by the expenses for transportation and the value of
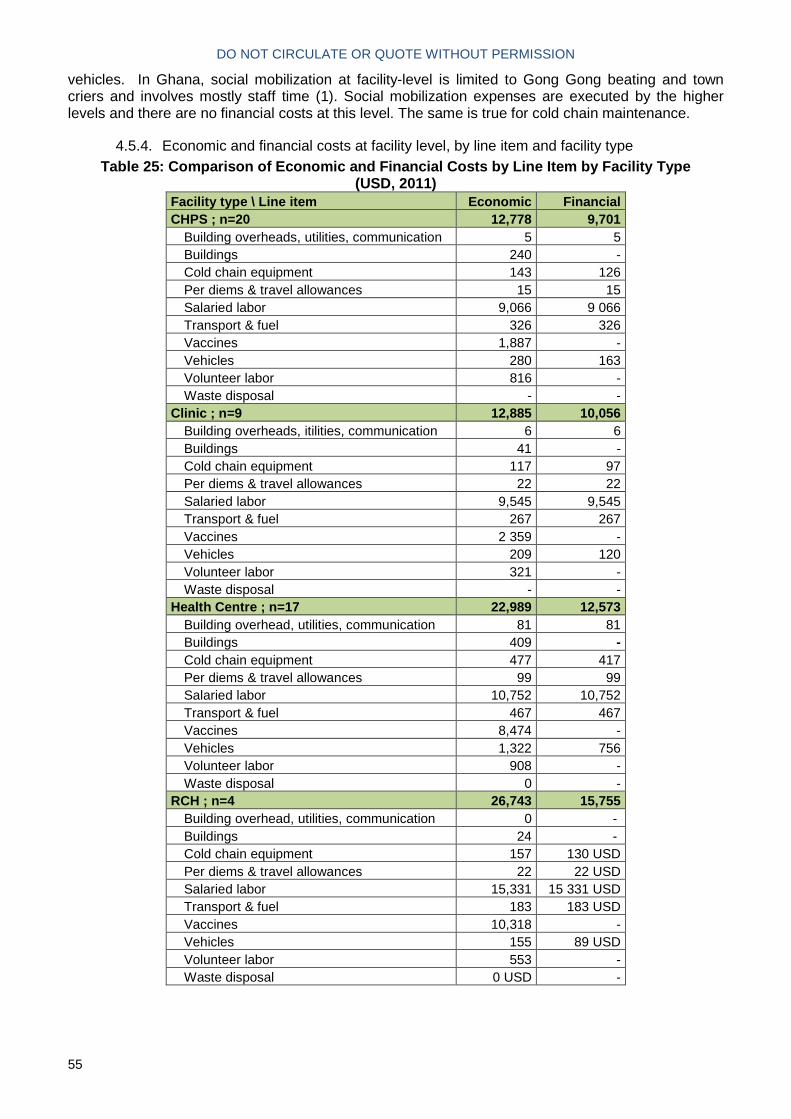
DO NOT CIRCULATE OR QUOTE WITHOUT PERMISSION
55
vehicles. In Ghana, social mobilization at facility-level is limited to Gong Gong beating and town criers and involves mostly staff time (1). Social mobilization expenses are executed by the higher levels and there are no financial costs at this level. The same is true for cold chain maintenance.
4.5.4. Economic and financial costs at facility level, by line item and facility type Table 25: Comparison of Economic and Financial Cost s by Line Item by Facility Type
(USD, 2011) Facility type \ Line item Economic Financial CHPS ; n=20 12,778 9,701
Building overheads, utilities, communication 5 5 Buildings 240 - Cold chain equipment 143 126 Per diems & travel allowances 15 15 Salaried labor 9,066 9 066 Transport & fuel 326 326 Vaccines 1,887 - Vehicles 280 163 Volunteer labor 816 - Waste disposal - -
Clinic ; n=9 12,885 10,056 Building overheads, itilities, communication 6 6 Buildings 41 - Cold chain equipment 117 97 Per diems & travel allowances 22 22 Salaried labor 9,545 9,545 Transport & fuel 267 267 Vaccines 2 359 - Vehicles 209 120 Volunteer labor 321 - Waste disposal - -
Health Centre ; n=17 22,989 12,573 Building overhead, utilities, communication 81 81 Buildings 409 - Cold chain equipment 477 417 Per diems & travel allowances 99 99 Salaried labor 10,752 10,752 Transport & fuel 467 467 Vaccines 8,474 - Vehicles 1,322 756 Volunteer labor 908 - Waste disposal 0 -
RCH ; n=4 26,743 15,755 Building overhead, utilities, communication 0 - Buildings 24 - Cold chain equipment 157 130 USD Per diems & travel allowances 22 22 USD Salaried labor 15,331 15 331 USD Transport & fuel 183 183 USD Vaccines 10,318 - Vehicles 155 89 USD Volunteer labor 553 - Waste disposal 0 USD -

DO NOT CIRCULATE OR QUOTE WITHOUT PERMISSION
56
4.5.5. Comparison of aggregated results Table 26: comparison of comprehensive multi-year pl an projection for 2011 and costing study
results
Input cMYP 2011 projection
Costing study (2011)
Recurrent costs Vaccines and injection supplies (traditional and underused vaccines) 14,317,285 10,057,923
Personnel (salaries and per diems – shared and specific) 12,880,520
32,922,179 Maintenance and overhead 3,751,821 1,390,948 Specific Transportation 22,699 21,016 Shared transportation cost (fuel, taxi) 0 1,774,512 Volunteer labor n/a 2,432,026 Activities from cMYP (Short-term training, IEC / social mobilization, Disease surveillance, programme management) 728,280 n/a Capital costs
Cold chain equipment 0 1,174,019
Vehicles 592,524 2,432,026 Buildings 0 1,431,615 Other capital items 0 20,048
There are important differences between cMYP and costing study (table 26). There are several factors that explain this substantial difference mainly driven by personnel and volunteer labor costs. Firstly, the cMYPs underestimate the shared personnel costs compared to this costing study. In the cMYP costing tool, the shared staff involved in immunization at facility level is limited to two staff. However in the costing study the number of staff involved in routine immunization was much more significant. The shared transportation costs at sub national are not estimated which significantly underestimates the true cost of transportation. Secondly, when comparing the last two cMYP data, they either provide very high costs for some line items and no cost for the other. These differences can be explained by the fact that cMYP is used as a planning tool and is not meant to be an evaluation tool and therefore can vary depending on needs at a given period (which could explain the absence of cold chain cost in the cMYP for example). The baseline 2008 cMYP tool estimates that there is no cost for maintenance (7). On the contrary, the same cost is estimated at 3,258,422 USD in 2011 CMYP (6). The 2008 cMYP tool estimates the cost of per diems at 3,636,667 USD (7) whereas the 2011 estimate is of 14,251 USD (6). In the 2010 cMYP costs, the transportation costs are only estimated at central EPI. Thirdly, the comparison between cMYP and study estimates can be questioned for different reasons. First the cMYP provides a mix of line items and activities whereas the costing study is disaggregated by line items and activities. Therefore, some line items of the costing study can be allocated to activities of the cMYP (a portion of per diems and personnel costs could be allocated to training for example). In general, routine immunization costs are significantly higher than previous cMYP or study estimates (3,5,6) which confirms that the true cost of routine immunization is under estimated. Regarding cMYPs, the main explanation is that the cost of human resources is not considered or is underestimated in Ghana cMYP. The study results show that the economic costs based on the actual time spent on routine immunization activities by health workers and other staff is substantial. However, it could also be linked with potential over estimation of time spent (self reported time spent on activities) by the study itself. Regarding the costing study conducted in 2000 (5), the higher costs from the present study are explained by several factors: the increase in the number and value of vaccines, the increase in the

DO NOT CIRCULATE OR QUOTE WITHOUT PERMISSION
57
volume of activity of the immunization program and the significant increase in MOH salaries for staff (11). In addition, the significant proportion of volunteers in total costs (5%) outlines their critical role in expanding community-based health promotion and services. High personnel costs for record keeping (due to important time spent on this activity) could explain the fact that immunization register have been considered as well kept (20) and consequently used for tracking defaulting children. A lack of investment in capital items has been identified in CHPS and Clinics in a recent review of health sector in Ghana (11). Investments for capital items in these facilities have been below target (11). This is confirmed for immunization as capital costs are lower in CHPS compared to Health Centers.
4.6. Sensitivity analysis A sensitivity analysis was conducted to test the impact of different scenarios on the weighted average facility cost (table 27).
Table 27: Sensitivity analysis of facility cost
Scenarios Weighted
Average (USD)
Change from Baseline
(USD)
% Change from
Baseline
Baseline estimate 16,460 - -
Scenario 1: Provision of allowance to volunteers by Government of Ghana based on the daily minimum wage (3.39 USD per day)
16,460 16,124 -2% -45% for volunteer
labor costs
Scenario 2: Increase of 10% in wastage rate for all vaccines
16,460 16,890 +2.6%
Scenario 3: Decrease of 5% in wastage rate for all vaccines
16,460 16,029 -1.3%
Scenario 4: Assumption of occupancy rate = 50% of cold chain equipment costs in 2011
16,460 16,340 -0.7%
Scenario 5: labor time allocation higher by 10% 16,460 17,453 +6.03%
Scenario 6: labor time allocation lower by 5% 16,460 15,963 -3.02%
Although volunteers do not receive any allowance for their contribution on routine immunizations support.
4.6.1. Scenario 1: Reevaluation of volunteers allowance One of the key finding of this study is the critical economic contribution of volunteers in the routine immunization costs at facility level. In our analysis, the economic contribution of volunteers was valued based on the per diem provided to them for National Immunization Days (Polio). In the first scenario of the sensitivity analysis, we assumed a new policy that would compensate the contribution of volunteers with the daily minimum wage of Ghana (3.39 USD per day). The facility cost in this scenario was 16,124 USD, representing a decrease of 2% compared to the baseline (45% decrease of volunteer labor costs).
4.6.2. Scenario 2 & 3: Reevaluation of wastage rate In order to assess the sensitivity of facility costs to the varations in wastage rates, scenario 3 and 4 looked at wastage variations. An increase of 10% in the wastage rate (for all vaccines) increased the total facility cost of 2.6%. A decrease of 5% of all vaccines implies a decrease of 1.3% of facility costs.

DO NOT CIRCULATE OR QUOTE WITHOUT PERMISSION
58
4.6.3. Scenario 4: Inclusion of cold chain occupancy rate for cold chain costs calculation Cold chain equipment costs take into account the percentage of use for routine immunization. However this may not always reflect the actual occupancy rate of cold chain equipment (fridges, vaccine carriers…) at the facility level. Therefore it was necessary to evaluate the sensitivity of cold chain equipment costs in regards this occupancy rate. In this respect, an occupancy rate of 50% decreased the facility of 0.7%.
4.6.4. Staff time allocation variation for all staff Considering that personnel cost was the most important cost driver at facility level, the sensitivity of facility costs to the variations in staff costs was analyzed in scenarios 5 and 6. With a 10% increase of staff labor time allocation, the facility cost was 17 453 USD, representing a 6% increase in facility cost. On the opposite, a 5% decrease of staff labor time allocation the facility cost was 15 963 USD, representing a 3% decrease in facility cost.
5. New vaccines introduction costs and financing
5.1. Analytic horizon. As the new vaccines were introduced in 2012, NUVI start-up costs and ongoing costs in 2012 were not included in the 2011 routine costs estimate (facility, district and region levels). Similarly, NUVI vaccines costs are not included in the 2011 routine costs estimates. According to the timeline of NUVI activities in the vaccine introduction plan, at central level, the analytic horizon starts in August 2010 with preparatory activities (cMYP update, preparation of GAVI application documents) and introduction planning activities for most of 2011 and goes through September 2012, approximately five months after introduction of the first doses of (rota and pneumo) have been introduced in all facilities, Surveillance establishment and assessment of cold chain needs) and the end approximately five months after introduction once major most additional activities have been performed for NUVI and once first doses are introduced in all facilities. Specific investment related to new vaccines introduction before this timeframe were also included in the analysis (cold chain capacity expansion). Results presented in this analysis combine the three vaccines into one total and unit cost.
5.2. Multiple introduction of new vaccines in Ghana Ghana was the first African country to introduce rotavirus, PCV and measles second dose vaccines simultaneously in their routine immunization program in 2012. Diarrhea and pneumonia were the leading cause of death in children under five (21). This analysis presents the incremental program costs for introducing or increasing coverage of new and underutilized vaccines, which are rotavirus, pneumococcal, and measles second dose). Table 28 provides the number of NUVI doses (pneumococcal, rotavirus and measles second dose) administered the year of introduction (2012). In particular, the coverage for the first dose of the PCV was 81% and the coverage for the first dose of the rotavirus vaccine was 75%.
Table 28: Doses administered the year of introducti on Vaccine Doses administered Denominator Coverage
PCV first dose 667,237 821,185 81%
PCV second dose 524,458 739,067 71%
PCV third dose 419,715 656,948 64%

DO NOT CIRCULATE OR QUOTE WITHOUT PERMISSION
59
Vaccine Doses administered Denominator Coverage
rotavirus vaccine first dose 613,983 821,185 75%
rotavirus vaccine second dose 483,105 739,067 65%
measles vaccine second dose 523,891 903,304 58%
Source: EPI Ghana, 2013
5.3. Background knowledge on NUVI costs The cost of new vaccines (plus their distribution and storage costs) remains unaffordable to many governments (4). There is a lack of information on the cost of vaccine introduction and even more for simultaneous introductions. The full range of non-vaccine costs, especially in decentralized systems such as the Ghana one, are often overlooked and underestimated (central perspective of planning and budgeting approaches). New vaccines with much higher price are becoming main drivers of introduction costs, before human resources even. Therefore, the availability and consistency of costing and financing is a key challenge in not only planning properly introduction of new vaccines, but ensuring the most efficient and successful introduction of NUVI in Ghana. Additionally, NUVI is usually introduced one at a time, rather than simultaneously. The Ghana study allows us to examine the incremental cost of simultaneous NUVI—to determine if there is an economic basis for simultaneous introduction from an economies of scope rationale. Economic and fiscal costs were assessed. Economic represents incremental opportunity cost of NUVI while fiscal represents the additional financial requirement for the new vaccines. Economic costs included both start-up costs (additional activities and investment) and on-going (incremental costs of routine activities) the year of introduction.
5.4. New vaccines introduction costs results (economic and fiscal) NUVI costs presented here are for the 3 vaccines together (PCV and rotavirus and MSD). The total NUVI incremental economic costs of for the three new vaccines introduction was 3.9 million USD for start-up activities and 22.8 million USD for ongoing costs the year of introduction. The total economic cost (start-up and ongoing) per NUVI dose administered represented 6.9 USD with programmatic representing 1.7 USD per dose. The cost per infant amounted to 26.9 USD with 4.0 for start-up programmatic costs (graph 9).

DO NOT CIRCULATE OR QUOTE WITHOUT PERMISSION
60
Graph 9: Distribution of new and underutilized vacc ines introduction total costs in Ghana
The delivery cost per dose administered amounted to US$ 2.42, with US$ 1.22 for start-up costs and US$1.23 for ongoing costs (Graph 10). Graph 10: New and underutilized vaccines introducti on total and delivery costs (start-up, ongoing) per dose and per child in Ghana, US$
At the aggregated level, excluding cost of vaccines and supplies, the following activities are capturing most of NUVI incremental cost for the start-up costs (Graph 11):
- Social mobilization and advocacy for the introduction (33%) - Surveillance for the introduction (25%) - Training (14%) - Program management (14%)
Labor, 17.8%
Vaccines, 70.4%
Cold
Chain/Energy,
7.5%
Other, 4.4%

DO NOT CIRCULATE OR QUOTE WITHOUT PERMISSION
61
Graph 11: Distribution of NUVI start-up economic in cremental costs by activity
Regarding ongoing costs, the most important ongoing incremental non-vaccine costs related to cold chain expansion (based on new vaccine volume increase (see Appendix 28: Volume Vaccine Calculator). The value of time spent (one year) by personnel on activities for NUVI introduction is substantial and new vaccines were mostly delivered through outreach with US$ 0.9 million for facility based and US$ 1.2 million for outreach delivery (table 29) which is similar vaccine administration costs for routine costing in 2011 for other vaccines.
Table 29: New Vaccine Introduction economic costs b y activity (USD) Type of cost \ Input Cost (USD) Distribution On-going 22,762,790 85.19%
Fixed based delivery 914,416 3.42% Outreach delivery 1,202,935 4.50% Vaccine collection distribution and storage 20,645,440 77.27%
Start up 3,956,321 14.81% Cold chain maintenance 5,806 0.02% Other 61,891 0.23% Outreach service delivery 0 0.00% Program management 581,871 2.18% Record-keeping & HMIS 143,026 0.54% Facility-based delivery 0 0.00% Social mobilization & advocacy 1,321,657 4.95% Supervision 66,301 0.25% Surveillance 975,036 3.65% Training 571,888 2.14% Vaccine collection, distribution, & storage 228,845 0.86%
Total 26,719,111 100.00%
Social Mobilization
& Advocacy
33%
Surveillance
25%
Training
14%
Program
Management
14%
Vaccine
Collection,
Distribution, &
Storage
6%
Record‐
Keeping &
HMIS
4%
Supervision
2%
Other
1%
Printing
1%

DO NOT CIRCULATE OR QUOTE WITHOUT PERMISSION
62
Table 30: New vaccine introduction economic costs b y Line Item (USD, 2011)
Total Cost (2011$) Percent of Cost
On-going 22,762,790 85.19% cold chain energy cost 296,204 1.11% cold chain equiment 1,549,177 5.80% Salaried Labor 2,117,351 7.92% vaccines 18,800,058 70.36%
Start up 3,956,321 14.81% Building overhead, utilities, communication 164,461 0.62% Cold Chain equipment 149,853 0.56% Other 52,723 0.20% other capital 27,021 0.10% Other recurent 552,413 2.07% Per diem & travel allowances 101,403 0.38% Salaried Labor 2,634,785 9.86% Transport & fuel 69,130 0.26% Vehicles 90,073 0.34% Volunteer labor 89,231 0.33% Printing 25,229 0.09%
Total 26,719,111 100.00%

DO NOT CIRCULATE OR QUOTE WITHOUT PERMISSION
63
Table 31: New vaccine introduction fiscal costs by line item (USD, 2011)
Line item Cost (USD) Distribution (%) Building overhead, utilities, communication 157 007 0.48% Cold chain equipment 1 531 426 4.64% Other 52 723 0.16% other capital 100 000 0.30% Other recurent 552 413 1.67% Per diem & travel allowances 101 356 0.31% Additional staff hired (NUVI coordinator) 28 389 0.09% Transport/fuel 92 191 0.28% Vehicles 584 000 1.77% Vaccines 27 883 815 84.40% Vaccine injection & safety supplies 1 929 605 5.84% Printing 25 229 0.08% TOTAL 33 038 153 100.00%
The total fiscal cost amounted to US$ 33 million and the cost per dose of new vaccine purchased represented US$ 5.13. The cost of new vaccines purchased for introduction represents a three-fold increase in vaccine costs (compared to EPI vaccine costs in 2011), mostly driven by pneumococcal vaccine (87%) and rotavirus (12%). The additional cold chain equipment for new vaccines represented 5% of total fiscal costs (table 33) and was mostly supported by external support.

DO NOT CIRCULATE OR QUOTE WITHOUT PERMISSION
64
Table 32: Summary table: start-up costs, ongoing co sts and fiscal costs for new vaccine introduction i n Ghana Line item Economic costs
US$
Fiscal costs
US$
Start-up costs
Salaried labor for introduction-related activities 2,634,785 7.92% 28 389* 0.09%
Other recurrent expenses** 552,413 2.07% 552,413 1.67%
Building overheads, utilities, communication 164,461 0.62% 157,007 0.48%
Per diem & travel allowances 101,403 0.38% 101,356 0.31%
Volunteer labor 89,231 0.33%
Transport/fuel 69,130 0.26% 92,191 0.28%
Printing 25,229 0.09% 25,229 0.08%
New cold chain equipment 149,853 0.56% 1,531,426 4.64%
Vehicles 90,073 0.34% 584,000 1.77%
other capital 27,021 0.10% 100,000 0.30%
Other 52,723 0.20% 52,723 0.16%
On-going costs
Salaried labor for new vaccines delivery 2,117,351 7.92% - -
Vaccines and supplies 18,800,058 70.36% 29,813,420 90.24%
Cold chain energy cost 296,204 1.11% - -
Cold chain equipment utilization 1,549,177 5.80% - -
Total start-up economic costs per doses administered
3,956,321
1.22
14.81% - -
Total on-going economic costs (delivery) Per doses administered
3,962,732
1.23
85.19% - -
Total economic delivery cost Per doses administered
7,919,053
2.45
Total fiscal costs
- - 33,038,153
100%
*Hiring of coordinator for new vaccine introduction
**Studies, new vaccines pilot, launch, AEFI surveillance

DO NOT CIRCULATE OR QUOTE WITHOUT PERMISSION
65
Table 33: Cold chain equipment purchased specific t o NUVI in Ghana
Number Type of equipment (specify) Brand name Make year Vaccine storage Capacity
(m3) Funding sources
91 Refrigerator TCW2000 2009 99 Liters USAID, UNICEF, GAVI
98 Refrigerator TCW3000 2009 126,5 Liters USAID, UNICEF, GAVI
21 Freezers TFW800 2009 247 Liters USAID, UNICEF, GAVI
8 WICR Dayard Europer 2006 30 m3 JICA
1 WICR Dayard Europer 2006 40 m3 UNICEF
1 WICR Dayard Europer 2006 40 m3 JICA

DO NOT CIRCULATE OR QUOTE WITHOUT PERMISSION
66
Table 34: Comparison of full needs and expenses for the new vaccine introduction (USD)
Line item / activity NUVI Plan (2011 USD)
Study Fiscal Cost Estimate (2011 USD)
Variance
Training 40,000 79,668 -39,668
Social mobilization, IEC and advocacy 60,000 472,478 -412,478
Cold chain equipment & maintenance 300,000 1,531,426 -1,231,426
Vehicles and transportation 500,000 584,000 -84,000
Program management 50,000 62,495 -12,495
Surveillance 150,000 164,560 -14,560
Technical assistance 45,000 0 45,000
Injection safety and waste management 100,000 100,000 0
Total NUVI plan 1,245,000 2,994,627 -1,749,627
Additional staff hired (NUVI coordinator) 28,389
Record-keeping and HMIS 134,880 -134,880
Supervision 24,957 -24,95
Vaccine collection 13,047 -13,047
Other 28,533 -3,244
1,245,000 3,224,733
-1,989,558
Regarding, the investment cost for expanding the cold chain capacity: the actual cost was higher than the provisional amount in new vaccine introduction plan (21). In the case of Ghana, when comparing fiscal costs and the new vaccine introduction plan costs, the following were below in the NUVI plan: training (by 40 K USD), social mobilization (by 0.41 M USD), cold chain equipment (by 1.23 M USD), vehicles (by 84 K USD), record keeping & HMIS (134 K USD). In total a variance of 1.99 M USD between forecasted expenses in NUVI plan and actual fiscal costs. However, we should keep in mind that NUVI plan is not supposed to cover all resources and activities of the new vaccine introduction. In addition, the cold chain expansion had been planned years in advance (table 34).
5.5. NUVI funding sources When excluding the value of vaccines and supplies, NUVI was mostly funded by domestic funding (68%) GAVI support was the most significant external source for NUVI (table 32).

DO NOT CIRCULATE OR QUOTE WITHOUT PERMISSION
67
GAVI financial support for NUVI represents 1.5 M USD (table 35) and a significant share of ISS funds received where used for NUVI activities or investments.
Table 35: External financing for NUVI in Ghana
Donor Amount
(USD)
GAVI :
Value Vaccines shipped (UNICEF estimate)
Vaccine Introduction Grant :
ISS funds - start-up activities (launch, per diem, fuel) capital investment (Cold chain equipment, vehicles, mobile incinerators)
27,700,000
915,000
574,000
93.05%
3.07%
1.93%
Total 29 189 000 98.05%
WHO:
- Rotavirus surveillance sites
- EPI / Program Management
- HR from country Office
46 000
41 000
47 000
0.15%
0.14%
0.16%
Total 134 000 0.45%
UNICEF:
- HR from country Office
- Walk-in Cold Room
11 000
29 000
0.04%
0.10%
Total 40 000 0.14%
JICA - Walk in Cold Rooms 406 000 1.36%
Total donor financing 29 769 000 100%
5.6. Utilization of NUVI introduction grant Specific funding for NUVI was provided by GAVI (New vaccine introduction grant) and were first used in January 2012. 29% of this support was transferred to the regions to support new vaccine introduction activities at the lower levels. This support was mostly used for social mobilization for NUVI – including the launch (28%), Surveillance related to new vaccine introduction (16%), Research (11%) and program management / meetings (8%) (22)(Graph 12).

DO NOT CIRCULATE OR QUOTE WITHOUT PERMISSION
68
Graph 12: Use of GAVI Vaccine Introduction Grant
The difference between forecasted expense and actual costs confirms the higher costs for some line items identified in previous reviews where transport, fuel, per diem, cold chain, equipment and maintenance costs had been underestimated (1). In particular, some sub national (district, facility) expenses had not necessarily been planned in the new vaccine introduction plan. Some districts had assumed that regional and national levels would supply them with all inputs required for new vaccine introduction which was not the case (1). They were able to perform the activities but no dedicated funding was provided for the full range of costs. Simultaneous introduction of two new vaccines have a potential for cost-savings due to the shorter overall time for training compared with two individual trainings. Simultaneous introduction also reduces the loss of productivity caused by removing staff from their posts to be trained on separate subjects (1). One of the challenges reported in the last EPI review was that there was no budget line for cold chain equipment which limits the potential investments that can be made to invest in new equipment. The lack of capital equipment in small facilities was identified in other reports (11). One of the recommendations from last EPI review (1) was to “make provision in the national budget for purchasing cold chain equipment including funds for preventive maintenance as the portfolio of vaccines is expanded”.
M&E, HMIS
3%Program
management
8%
Regional
transfer
29%
Research
11%
Social
Mobilization
28%
Surveillance
16%
Training
3%
Transport/Fuel
2%

DO NOT CIRCULATE OR QUOTE WITHOUT PERMISSION
69
7. Determinant of costs and productivity analysis a t facility level
7.1. Introduction This analysis aims at identifying the determinants of routine immunization costs, as well as performing the productivity analysis of health facilities. Ultimately, the determinants analysis intends to come up with sound analyses and compelling results that will be used to simulate various scenarios and fine tune immunization management system with regard to the planning of activities, the management process, and the decision-making approach, where the binding constraints and enablers could be pretty well known and foreseen prior undertaking further activities. Concerning the productivity analysis, it will allow well classifying facilities through quadrant analysis. In all, beyond a simplest analysis exercise, the study findings might be considered as full-fledged performance management tools, useful to designing and implementing actions with high impact in terms of effectiveness. The independent variables of the determinant analysis are the total cost for providing routine immunization services. The potential explanatory characteristics are both continuous and categorical variables. They range from intrinsic factors related to children features (coverage doses) to extrinsic characteristics associated to facilities setting, vaccines supply and management system, as well as some variables of the catchment area of the facilities.
For this analysis, further identification and correction of persistent discrepancies and errors have been performed during the data management process prior the data analysis stage. For this purpose, additional routine on Visual Basic Excel have been developed to capture some lingered issues.
7.2. Productivity analysis The productivity analysis consists in ranking heath facilities according to their cost-effective performance. The productivity analysis has been performed in computing different productivity indicators such as the total doses administered per FTE, the total doses per total facility staff and working day, the total doses per fully immunized child, the total wastage doses of pentavalent and the total wastage doses of polio. The analysis of these figures is completed by the quadrant exploration, which helps to graphically assess the performance of the facilities. Productivity is thought of as the relationship between units of output per unit of input. In that vein, the following productivity indicators are explored and evaluated and summarized. These are:
- Total doses administered/The total time spent in the facility for immunization per week divided by the number of working hours per week (FTE)
- Total doses/Total facility staff/working day - Doses/FIC, (FIC here measured as DTP3 covered children); - Wastage rates

DO NOT CIRCULATE OR QUOTE WITHOUT PERMISSION
70
7.3. Determinant analysis
The determinants Analysis of Immunization costing is a cross-country study with the 50 health facilities in our sample. It consists to identifying factors that are driving routine immunization costs, as well as their magnitude. The independent variables of the determinant analysis are the total costs for providing Routine Immunization services. The potential explanatory characteristics are both continuous and categorical variables. They range from intrinsic factors related to children features (coverage doses) to extrinsic characteristics associated to facilities’ setting, vaccines supply and management system, as well as some variables of the catchment area of the facilities. The study aims to identifying the determinants of routine immunization cost, as well as performing the productivity analysis of health facilities. Ultimately, the determinants analysis intends to come up with sound analyses and compelling results that will be used to simulate various scenarios and fine tune immunization management system at all levels with regard to the planning of activities, the management process, and the decision-making approach, where the binding constraints and enablers could be pretty well known and foreseen prior undertaking further activities. Concerning the productivity analysis, it will allow well classifying facilities through quadrant analysis. In all, beyond a simplest analysis exercise, the study findings might be considered as full-fledged performance management tools, useful to designing and implementing actions with high impact in terms of effectiveness. Two stages sampling approach has been used for samples drawing. Stage One The determination of the sample size was made in using the formula of SCWARTZ below: Equation 1: Where a normal distribution is assumed, and: n0 = Sample size; Z² = Area under the normal curve (1.96 for 95% CI); p = Estimated proportion of an attribute that is present in the population (assume 0.5); q = 1 – p = 0.5; The resulting sample size is (1.96)²(0.5)(0.5)/(0.1)²= 96
Stage Two Assume that the population of facilities is small. Then the sample size can be adjusted, because a given sample size provide proportionately more information for a small population than for a large population. Equation 2 Where n0 = initial sample size and N = population size.
2
2
0
**
e
qpZn =
N
nn
n)1(
1 0
0
−+=

DO NOT CIRCULATE OR QUOTE WITHOUT PERMISSION
71
If we assume approximately 100 primary care facilities in the geographical areas that have been sampled, the resulting sample size will be 96/ (1+ (96-1)/100) = 50 health facilities to be sampled in total. Data analysis and regressions were performed under Stata version 12.0 software. To run the regression analysis, a descriptive analysis of the sample characteristics was performed. Means, standard deviations, minimum, maximum and the number of observations were computed for all continuous variables, while percentage distributions were displayed for categorical variables. Then, prior to the regression analysis step, we worked out the correlation tables of core continuous variable candidates for the determinant analysis. We also performed one-way ANOVA testing to calculate the homogeneity of the sample (comparison of the mean cost per stratum of categorical variables), and tested the equality of variances amongst stratum by using the Bartlett test. For instance, we compared the mean of total cost per region, type of area and type of health facility. Similarly, Box and Whiskers plots were used to ascertain the normality feature of the total economic cost, as per the same covariates. Scatter plots of the total economic cost, and then of the delivery cost (cost without vaccines), were plotted against the characteristic number of Fully Immunized Child (FIC). This was to capture the rough trend of the economic cost (or delivery cost) compared to the variable FIC, and eye-catch potential outliers. For the variable total economic cost, the best-fitted functional shape was checked by using Stata commands “ladder” and “gladder”. We used the cost function to build our determinant model. We conducted all analyses with Stata Version 12 software. An initial model, called the “theoretical model”, was built based on the following formula:
.*)log(*)log(*)log(*)log( 43210 iiiii ZPFTEFICCQ βββββ ++++=
In this linear model, CQi is the total facility immunization cost (including vaccine cost); FICi the Fully Immunized Child number expressed as a measure of production outcome; FTEi the proportion of time dedicated to immunization by immunization staff as a quantity input measure judged likely to be a key driver of facility cost; Pi the average wage of staff as a price measure; and Zi a measure of quality based on a yes or no answer to the question, “Do you have enough staff to conduct routine immunization well?”. Log transformation was performed for quantitative variables because this allowed these variables to have a normal distribution. The coefficients of the explanatory variables in log transformation indicated the elasticity of the vaccination cost relative to the corresponding explanatory variables.
Using the above as the base model, we developed several linear regression models, starting from the theoretical model and adding control variables one by one (all categorical), and assessed the behavior of the model. The control variables used were the ‘urban or rural location’, ‘type of health facility’, and ‘region’. The covariates ‘existence of users’ fees, ‘existence of volunteers supporting immunization’, and ‘existence of cold chain equipment’ are not included in the regression model because their terms were invariant. After performing each model, post estimation diagnostics were computed to check the validity of each model. The various tests computed were the Linktest test to ascertain whether the model was well specified; the Ramsey RESET ovtest to verify if there were omitted variables; the sktest test for the normality of residual; the Breush-Pagan test for heteroskedasticity to verify the assumption of the equality of variance; and the VIF multicollinearity test for covariates. Finally, the endogeneity test of Hausman was also performed for the output covariate ‘FIC’ upon the dependent ‘total immunization cost’ variable in order
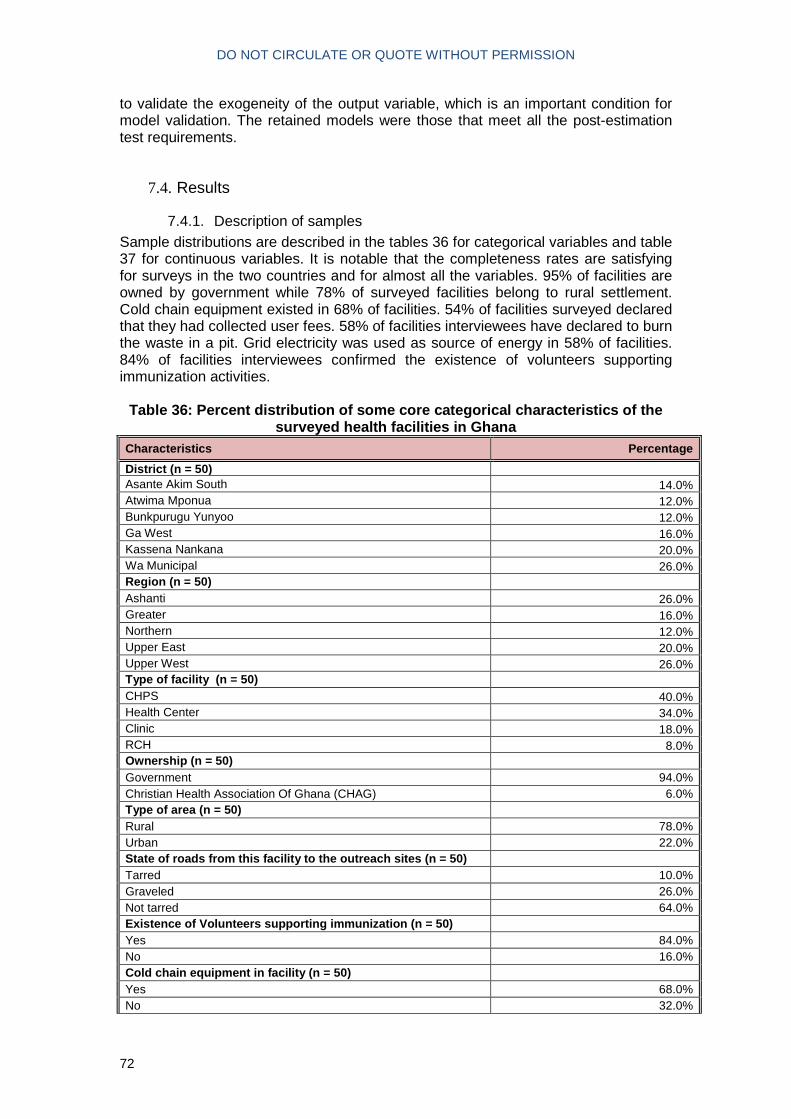
DO NOT CIRCULATE OR QUOTE WITHOUT PERMISSION
72
to validate the exogeneity of the output variable, which is an important condition for model validation. The retained models were those that meet all the post-estimation test requirements.
7.4. Results
7.4.1. Description of samples Sample distributions are described in the tables 36 for categorical variables and table 37 for continuous variables. It is notable that the completeness rates are satisfying for surveys in the two countries and for almost all the variables. 95% of facilities are owned by government while 78% of surveyed facilities belong to rural settlement. Cold chain equipment existed in 68% of facilities. 54% of facilities surveyed declared that they had collected user fees. 58% of facilities interviewees have declared to burn the waste in a pit. Grid electricity was used as source of energy in 58% of facilities. 84% of facilities interviewees confirmed the existence of volunteers supporting immunization activities.
Table 36: Percent distribution of some core categor ical characteristics of the
surveyed health facilities in Ghana Characteristics Percentage
District (n = 50) Asante Akim South 14.0% Atwima Mponua 12.0% Bunkpurugu Yunyoo 12.0% Ga West 16.0% Kassena Nankana 20.0% Wa Municipal 26.0% Region (n = 50) Ashanti 26.0% Greater 16.0% Northern 12.0% Upper East 20.0% Upper West 26.0% Type of facility (n = 50) CHPS 40.0% Health Center 34.0% Clinic 18.0% RCH 8.0% Ownership (n = 50) Government 94.0% Christian Health Association Of Ghana (CHAG) 6.0% Type of area (n = 50) Rural 78.0% Urban 22.0% State of roads from this facility to the outreach si tes (n = 50) Tarred 10.0% Graveled 26.0% Not tarred 64.0% Existence of Volunteers supporting immunization (n = 50)
Yes 84.0% No 16.0% Cold chain equipment in facility (n = 50) Yes 68.0% No 32.0%

DO NOT CIRCULATE OR QUOTE WITHOUT PERMISSION
73
Characteristics Percentage
Way of disposing (n = 50) burning in a pit 58.0% Transferred to / collected by DHMT 22.0% sent to /collected by hospital or other health center 6.0% Other 2.0% Incinerator 8.0% Not Applicable 4.0% Users' fees (n = 50) Yes 54.0% No 46.0% Flood in the year (n = 50) Yes 34.0% No 66.0% Availability of public transportation (n = 50) Low 48.0% Medium 34.0% High 18.0% Energy supply for cold chain (n = 50) Grid electricity 48.0% Bottled gas 4.0% Solar energy 8.0% Not applicable 40.0% Enough staff to perform RI well? (50) Strongly agree & Agree 64.0% Others responses 32.0% Missing 4.0%
The indicators were all weighted and provided with their standard deviation values. The weighted average total economic cost per facility was US$ 16,459.38 (ET = US$ 1,624.02). The weighted average delivery economic cost per facility was US$ 12,153.01 (ET US$ 1,041.89). The average number of Full Immunization Children (number of children having received third dose of DTP3) per facility was 321.09 (ET =40.76). The average Full Time Equivalent (FTE) representing the time spent by facility staff on routine immunization activities was 1.76 ± 0.16 by facility. The average total routine dose administered by facility was 3,244.52 (ET = 411.47). The average number of staff per facility in Ghana was 12.2 (ET = 11.97). The average number of campaign per facility organized in 2011 was 2.21 (ET = 0.31). On average, routine Immunization activities have been interrupted in 2011 during 6.86 (ET = 3.2) days in Ghana due to floods.
Table 37: Distribution of facilities as per some co re continuous variables surveyed in Ghana
Characteristics Weighted Mean Std. Dev.
Total routine immunization costs (USD) 16,459.38 1,624.02
Total routine immunization cost, excluding vaccine costs (USD) 12,153.01 1,041.89
Children having received DTP-HepB-Hib dose 3 (defined as a fully immunized child) 321.09 40.76

DO NOT CIRCULATE OR QUOTE WITHOUT PERMISSION
74
Characteristics Weighted Mean Std. Dev.
Number of days of interruption due to flood 6.86 3.2
Total full-time equivalents working on routine immunization 1.76 0.16
Proportion of time on RI for personnel involved in immunization 34.67% 2.73%
Routine doses administered in 2011 3,244.52 411.47
Total number of facility staff 12.2 1.97
Number of campaigns in 2011 2.21 0.31
Average wage of staff per facility 432.55 10.94
We performed graphical analysis of data that also helped to see the trends of the total cost per the number of children having received the third dose of pentavalent vaccine (FIC). The depicted graph (Graph 13) showed upward trends. Some outliers stand out from the set of facility scatter points. The same findings were made on quadrant scatter plots where outliers identified previously are confirmed.
Graph 13: Total economic routine immunization Costs in USD (x axis) vs DTP3
vaccinated children (x axis), Ghana
When using the median as a threshold for statistical comparison of both economic cost and the number of fully immunized children, one clearly sees that, for Ghana, only 7 facilities out of 50 fell in the southern-east area of cost-effectiveness; the same

DO NOT CIRCULATE OR QUOTE WITHOUT PERMISSION
75
number fell in the northern-west area of ‘counter-performance’. The vast majority of facilities fell in the intermediary northern-east and southern-west zones considered as neither performing nor counter-performing (Graph 14).
Graph 14: Quadrant analysis of Total Economic Cost (y axis) vs DTP3
Vaccinated Children (x axis), Ghana
Various Whiskers plots of total economic costs, broken down by variables such as region, area type and facility type are presented (Graphs 15 to 18). These plots show the total economic cost is not normally distributed, because its means differ from medians and also the 25 and 75 percentiles are not located at the same distance from the beginning and end of the distribution. It is worth noting also that the means of the total economic cost differ from one region to another, from urban area to rural settlement and from one type of health facility to another. These graphical findings are confirmed by the ANOVA tests of comparison of means.

DO NOT CIRCULATE OR QUOTE WITHOUT PERMISSION
76
Graph 15: Box and Whiskers plot of
Total Economic cost, Ghana
Graph 16: Box and Whiskers plot of Total Economic cost broken down by
region, Ghana
Graph 17: Box and Whiskers plot of
Total Economic cost broken down by type of area, Ghana
Graph 18: Box and Whiskers plot of Total Economic cost broken down by
Type of facility, Ghana
Table 38: Analysis of variances of Total cost, brok en down as per some core
categorical variables, Ghana
Characteristics Mean Std. Dev. Freq.
ANOVA Bartlett Test for equal variances
F Prob > F chi2(3) Prob > B
1. Type of facility
CHPS 11,881.84 8,048.84 20
5.36 0.0030** 13.0205 0.005** Health Center 26,455.30 14,512.31 17
Clinic 17,414.46 15,997.45 9
RCH 36,501.16 28,476.34 4
Total 19,802.23 15,814.30 50
2. Region
Ashanti 21,178.14 17,378.58 13
1.16 0.3425 7.2677 0.122
Greater Accra 16,529.47 20,276.02 8
Northern Region 30,554.87 14,141.94 6
Upper East 13,986.07 7,606.13 10
Upper West 19,951.54 16,044.95 13
Total 19,802.23 15,814.30 50
3. District Asante Akim South 9,653.37 3,283.68 7
3.05 0.0188* 18.7960 0.002**
Atwima Mponua 34,623.71 17,578.65 6
Bunkpurugu Yunyoo 30,554.87 14,141.94 6
Ga West 16,529.47 20,276.02 8
Kassena Nankana 13986.073 7,606.13 10
Wa Municipal 19951.541 16,044.95 13
Total 19802.232 15,814.30 50

DO NOT CIRCULATE OR QUOTE WITHOUT PERMISSION
77
Characteristics Mean Std. Dev. Freq. ANOVA Bartlett Test for equal
variances
4. Type of area Rural 17,587.98 12,423.47 39
3.66 0.061 7.6139 0.006** Urban 27,652.78 23,495.42 11
Total 19,802.23 15,814.30 50
4. Ownership
Government 18,517.50 15,064.07 47
5.66 0.0214* 0.0172 0.896 CHAG 39,929.66 16,170.84 3
Total 19,802.23 15,814.30 50
Due to the fact that the total economic cost distribution curve is not normally distributed, the Log transformation function of this variable is performed.
Graph 19: Box and Whiskers plot of Log of Total Eco nomic cost, outliers removed, Ghana

DO NOT CIRCULATE OR QUOTE WITHOUT PERMISSION
78
7.4.2. Regression models of the total costs of routine immunization Table 39 displays the final regression models performed upon health facilities. The theoretical model is (M0) while the subsequent ones are those with controlling covariates.
Table 39: Final linear regression model evaluating the association of different variables with total immunization costs in Ghana
(M0) (M1) (M2) (M3) (M4) (M5) (M6) (M7) A. log of Full Immunized Children 0.395*** 0.420*** 0.360*** 0.356*** 0.383*** 0.391*** 0.383*** 0.423*** (4.47) (5.18) (3.72) (4.41) (4.55) (4.85) (5.87) (4.65) B. log of Average dedication proportion time 0.432** 0.433** 0.458* 0.422* 0.445* 0.474** 0.429** 0.492* (3.37) (2.94) (2.63) (2.25) (2.41) (2.79) (3.14) (2.65) C. log of Average monthly wage of staff 0.608 0.609† 0.587 0.633 0.677† 0.505 0.442 0.418 (1.51) (1.98) (1.53) (1.68) (1.75) (1.28) (1.21) (1.05) D. Enough staff to perform RI well (Yes =1/No =0) 0.511** 0.443* 0.448* 0.501** 0.488* 0.530** 0.443** 0.526** (3.05) (2.67) (2.57) (2.79) (2.51) (3.11) (3.03) (2.97) E. Region (Greater Accra =1/ Others= 0) -0.438* (-2.03) F. Type of facility (Health center used as reference) RCH -0.120 (-0.56) CHPS -0.144 (-0.57) Mission hospital -0.382† (-1.74) G. Ownership (Government =1/ Others=0) -0.293 (-1.16) H. Location (Urban=1/Rural=0) -0.141 (-0.66) I. User fees (Yes =1/No=0) -0.188 (-1.13) J. Cold chain equipment in facility (Yes =1/No=0)
0.312*
(2.20) K. Existence of Volunteers supporting immunization (Yes =1/No=0)
0.260†
(1.70) Constant 3.930† 3.817† 4.418† 4.225† 3.586 4.677* 5.719* 4.730* (1.83) (1.90) (1.90) (1.93) (1.60) (2.05) (2.36) (2.19) r2 0.549 0.567 0.524 0.499 0.497 0.510 0.568 0.505 r2_a 0.502 0.543 0.440 0.439 0.437 0.451 0.529 0.446 N 48 48 48 48 48 48 48 48 df_r 43 42 40 42 42 42 42 42
t statistics in parentheses † p < 0.1, * p < 0.05, ** p < 0.01, *** p < 0.001 In the final regression model including all 50 facilities in Ghana, the variables associated with total immunization costs per facility were the number of fully immunized children, the dedication proportion of vaccinating personnel time, availability of enough staff to perform immunization activities, region, and the availability of cold chain equipment. Urban/rural status, facility ownership, user fees, and facility type did not contribute to the regression model. Holding constant all the remain covariates, an equal 1% increase in FIC or in the proportion of time dedicated to immunization were associated with, respectively, a 0.37% and 0.44% increase in total facility immunization cost. The existence of cold chain equipment also increased total immunization cost by an average of 44%. Overall, the existence of enough staff to perform routine immunization properly (as reported by the facility manager) increased facility cost by 51%. Also, immunization

DO NOT CIRCULATE OR QUOTE WITHOUT PERMISSION
79
cost is 39% less in Greater Accra than in the remaining regions. There was no statistically significant relationship between the total economic cost and the controlling variables like urban/rural status, government facility ownership, user fees, and type of facility. Finally, the means of the total economic costs differed from one region to another, from urban area to rural facilities and from one type of health facility to another. These figures reveal an uneven distribution of the total economic costs by region, type of area and type of facility. The EPI Coordination as well as staff at decentralized levels should closely look at these figures and dig around so as to better assess the factors associated.
7.4.3. Productivity Analysis for Ghana facilities Productivity is thought of as the relationship between units of output per unit of input. In that vein, vein, the following productivity indicators are explored and evaluated and summarized for each county in the table 40. There are:
- Doses administered per Full Time Equivalent for routine immunization - Doses administered per total facility staff (includes all staff including the ones
not working on immunization ) per working day - Doses per FIC, (FIC here measured as children receiving third dose of DTP)
One can perceive from these figures that the total doses administered per FTE was 1 943 in Ghana. Whereas the doses per the total number of fully Immunized children was 10.24 (table 40).
Table 40: Productivity indicators computed for Ghan a
Indicators Ghana 1. Total doses administered in 2011 / FTE 1,943.51
2. Total doses/Total facility staff/working day 1.04
3. Doses per FIC 10.24
The productivity analysis of the total of cost of immunization and doses administered are run through quadrant analysis: 9 out of the 50 facilities (18%) have performed well, since they fell in the southern-east region of the quadrant. Conversely, 6 (12%) fell in the northern-west counter-performance area. An overwhelming majority of facilities fell in the northern-east area (36%) and 17 (34%) fell in the southern-west area.

DO NOT CIRCULATE OR QUOTE WITHOUT PERMISSION
80
Graph 20: Quadrant analysis of Total Economic Cost (y axis) vs Total doses administered in 2011 (x axis), Ghana
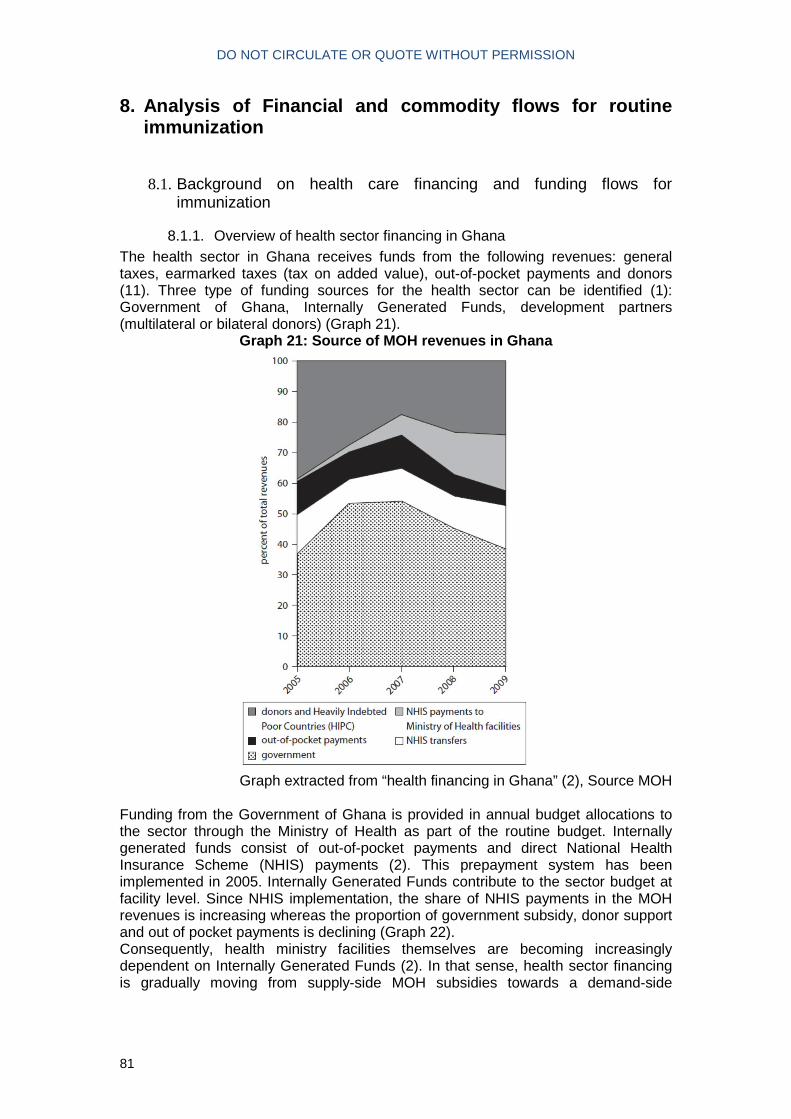
DO NOT CIRCULATE OR QUOTE WITHOUT PERMISSION
81
8. Analysis of Financial and commodity flows for ro utine immunization
8.1. Background on health care financing and funding flows for immunization
8.1.1. Overview of health sector financing in Ghana The health sector in Ghana receives funds from the following revenues: general taxes, earmarked taxes (tax on added value), out-of-pocket payments and donors (11). Three type of funding sources for the health sector can be identified (1): Government of Ghana, Internally Generated Funds, development partners (multilateral or bilateral donors) (Graph 21).
Graph 21: Source of MOH revenues in Ghana
Graph extracted from “health financing in Ghana” (2), Source MOH
Funding from the Government of Ghana is provided in annual budget allocations to the sector through the Ministry of Health as part of the routine budget. Internally generated funds consist of out-of-pocket payments and direct National Health Insurance Scheme (NHIS) payments (2). This prepayment system has been implemented in 2005. Internally Generated Funds contribute to the sector budget at facility level. Since NHIS implementation, the share of NHIS payments in the MOH revenues is increasing whereas the proportion of government subsidy, donor support and out of pocket payments is declining (Graph 22). Consequently, health ministry facilities themselves are becoming increasingly dependent on Internally Generated Funds (2). In that sense, health sector financing is gradually moving from supply-side MOH subsidies towards a demand-side

DO NOT CIRCULATE OR QUOTE WITHOUT PERMISSION
82
financing. However, the current health system is still fragmented between these two types of funding schemes as providers still receive MOH subsidies.
Graph 22: Internally Generated Funds by MOH facilit ies
Graph extracted from “health financing in Ghana” (2), Source MOH
Development Partners (DPs) funds are provided through Sector Budget Support (SBS) channeled through the Ministry of Finance and Economic Planning (MOFEP) and is part of the annual budget process. Donors also provide earmarked funds for specific projects or programs (including GAVI Alliance funding). The Government Of Ghana is the main funding source for the public health sector in Ghana (3). There are four areas of public expenditure (personnel salaries, administrative, service and investment expenses).
8.1.2. Background on funding flows for immunization In low-income settings, immunization financing (besides limited budgets) in many countries faces the issue of inefficient national disbursement procedures (4). According to MOH Ghana, a considerable amount of Districts’ service budgets (GOG3) is allocated to delivering routine immunization (12). However, no data is currently available to confirm this assertion. What is known is that since 2008, the Government of Ghana (GOG) purchases all traditional vaccines and devices and fulfills its co-financing amount (1). Funding for operational costs for campaigns is also partly covered by the Government. Immunization is considered as heavily subsidized with tax or donor financing (11) compared to curative care. Salaries and benefits of all EPI staff are paid by the Government. Government budget for administration (GOG2) and service (GOG3) is allocated to districts based on the final activity plan (district are also called “cost centers”). District plans include provision for outreach, supervision, training and monitoring. The planning process in Ghana is a “bottom-up” process. The process of annual planning is carried out in collaboration with the regions based on immunization performance and key issues highlighted during the course of the year and during the annual review meeting. Micro planning for immunization service delivery is widely used by peripheral health facilities using the Reaching Every District (RED) strategy.

DO NOT CIRCULATE OR QUOTE WITHOUT PERMISSION
83
8.2. Methods for the quantitative analysis of financial and commodity flows
8.2.1. Scope For this exercise, the focus was on financial and commodity flows for the routine immunization program from external, government, and other domestic sources. The purpose of this analysis was to better describe these flows, to quantify funding available from various sources for routine immunization, and to document how funds and commodities flow to end users.
8.2.2. Data collection The sampled unit were similar than the ones chosen for the costing study. Specific financing questionnaires were developed to capture funding flows for routine immunization. These questionnaires were administered to the following institutions and departments:
• MOH/GHS including: Central EPI (included EPI manager), Disease Control Department (included DCD accountant), GHS Finance Unit, MOH Supply Division.
• Development Partners12 (included WHO and UNICEF) • 5 Regional Health Administrations (respondents included accountants and
regional director of public health, EPI coordinators) • 6 District Health Administrations (respondents included accountants, district
director of public health and EPI coordinators) • Data was collected from budget and expenses records from the different
levels. Health facilities did not have any or insufficient financial information to be included in the analysis. Data was entered in Excel template for data entry.
8.2.3. Coding
A methodology derived from the System Health Accounts methodology for coding financial flows was adopted. Each financial flow was allocated to one type and was further sub categorized (table 41).
Table 41: Financial flow type and categories Financial flow type Categories Funding Source (FS) Transfers from government domestic revenue; Transfers
distributed by government from foreign origin; Social insurance contributions; Compulsory prepayment; Voluntary prepayment; Direct foreign transfers
Financing Agent (FA) General Government, Insurance Corporations, Other corporations, Non-profit institutions serving households, non-profit institutions serving households, households, Rest of the world (including bilateral and multilateral donors)
Health Financing Mechanism (HF)
Government schemes and compulsory contributory health care financing schemes, Voluntary health care payment schemes (other than OOP), Household out-of-pocket payment, Rest of the world.
Health Provider (HP) Hospitals, Providers of ambulatory health care, Provider of
12 Although the Rotary was mapped as a partner for immunization, they did not provide any funding for routine immunization in 2010 and 2011. Therefore, no questionnaire was administered.

DO NOT CIRCULATE OR QUOTE WITHOUT PERMISSION
84
Financial flow type Categories ancillary services, Providers of preventive care, Providers of health care system administration and financing, Rest of the economy, Rest of the world
Health Care Function (HC)
Curative care, Preventive care, (IEC / Social mobilization), facility-based delivery, training, vaccine collection, distribution and storage, cold chain maintenance, supervision, program management, other routine activity, EPI surveillance, record-keeping and HMIS, not disaggregated.
Health Care Provision (FP)
Compensation of employees, Self-employed professional remuneration, materials and services used, consumption of fixed capital, other items of spending on inputs
The codes used for the categorization of funding flows are provided in appendix 5.
8.2.4. Aggregation For district a weighted average of funding flow was generated based on district sampling weight and region population. This was then aggregated based on the number of districts for the full country in order to provide estimate of funding flows at sub national levels. In addition, regional amounts could not be disaggregated for immunization and therefore their expenses are not included as part of the quantitative analysis results. The costing study showed that their cost represented only 2% of total aggregated cost for routine immunization. The transfers received by districts from regions are however included.

DO NOT CIRCULATE OR QUOTE WITHOUT PERMISSION
85
8.3. Results of the quantitative analysis
8.3.1. Specification of Ghana funding flow framework Table 42: Identification of financial flow types fo r Ghana (2010-2011)
Financial flow type Categories Funding Source (FS) Government domestic resources (internal transfers, internal transfers
within central government, internal transfer within region/local government) Direct financial support from donors (USAID, UNICEF, WHO, GAVI Alliance) Social Insurance Contributions (National Health Insurance Scheme) Compulsory prepayments from households (user-fees) In-kind support from donors (UNICEF, WHO, GAVI Alliance, World Vision)
Financing Agent (FA) MOH Central, EPI program, District level Ministry of Health, Ghana Health Service, Central Cold Store, National Surveillance Agency, UNICEF, WHO
Health Financing Mechanism (HF)
Central government scheme, Community level financing, Compulsory contributory health insurance schemes, rest of the world, state/regional/local government schemes
Health Provider (HP) Ambulatory health care facilities, Central MOH, Regional MOH, District MOH, Rest of the World
8.3.2. Funding sources to Financing Agents in 2011 The funding received for routine immunization represents 49.9 million USD in 2011 (table 43). The funding is mostly provided through domestic sources that accounts for 78.17% of the support (Graph 23). Transfers from domestic revenues are mostly channeled through central MOH with 61.85% of funds received. Regional transfers to District Health Administrations represent 8.84% of total support. Internally Generated Funds (IGF) transferred to District Health Administrations account for 2.08% of total funds received. Within IGF, the national social insurance scheme represents 1.85% of total funding and out-of-pocket payments are marginal with 0.23% of total support. External funding sources represent 21.83% of the funding received. Most of the external financing is provided by GAVI Alliance New Vaccine Support (17.50%) through vaccines and supplies distributed by UNICEF supply division. External financial support distributed by Government are provided by GAVI Alliance (1.41 million USD), WHO (0.24 million USD), UNICEF (0.17 million USD) and USAID (0.15 million USD). GAVI support is channeled through the Ghana Health Service and part of GAVI support is directly disbursed to District Health Administration. Minor in-kind support is provided by UNICEF (0.10%), WHO (0.13%) and World Vision (0.16%).

DO NOT CIRCULATE OR QUOTE WITHOUT PERMISSION
86
Graph 23: Distribution of funding sources for routi ne immunization (USD, 2011)
76%
4%
2%
0%
18%
FS.1 (Transfers from domestic sources)
FS.2 (Transfers distributed by government from foreign origin)
FS.3 (Social Insurance Contribution)
FS.4 (Prepayments)
FS.7 (Direct foreign transfers)

DO NOT CIRCULATE OR QUOTE WITHOUT PERMISSION
87
Table 43: Funding sources (FS) to financing agents (FA), 2011
EPI program Central MOH District HA GHS Cold Stores
National Surveillance Agency UNICEF WHO Total
Dist
Transfers from government domestic revenue
FS.1.1 Internal transfers 30 881 135 30 881 135 61.85%
FS.1.1.1 Central transfers 14 686 112 214 2 542 471 2 669 372 5.35%
FS.1.1.2 within local 24 799 24 799 0.05%
FS.1.1.4 Regional transfer 4 416 113 4 416 113 8.84%
Transfers distributed by Government from foreign origin
FS.2.1.1.1 USAID 147 220 147 220 0.29%
FS.2.1.2.1 UNICEF 4 473 167 811 172 284 0.35%
FS.2.1.2.2 WHO 131 769 665 784 38 510 236 063 0.47%
FS.2.1.3 GAVI 351 847 1 057 303 1 409 150 2.82%
Social Insurance contribution and compulsory prepayment
FS.3 Social Insurance 925 335 925 335 1.85%
FS.4.1 User Fees 114 869 114 869 0.23%
Direct foreign aid in-kind
FS.7.2.2.2.1 UNICEF 51 426 51 426 0.10%
FS.7.2.2.2.2 WHO 64 617 64 617 0.13%
FS.7.2.2.2.4 GAVI 8 740 169 8 740 169 17.50%
FS.7.2.2.3.3 World Vision 80 300 80 300 0.16%
TOTAL 298 147 30 993 349 6 081 075 1 123 087 11 282 640 38 510 51 426 64 617 49 932 852 100%

DO NOT CIRCULATE OR QUOTE WITHOUT PERMISSION
88
8.3.3. Financing Agents to Health-Care Providers in 2011 Most of funds spent for routine immunization are executed by central level and paid to staff directly. The total amount spent is higher than total of funds received the same year indicating that some activities have been performed either with balance from previous year or financed on other budgets. Central MOH executes 65.25% of expenditures (mostly driven by salaries). The funds executed at district level account for 10.84% of total spending. However, when excluding the salaries and vaccines, expenditures executed at district level represent 61% of total funds, outlining the level of decentralization for the execution of funds. Expenses by ambulatory health care centers are limited to salaries for routine immunization and are executed by central MOH. Funds spent for other flows than salaries have been disaggregated up to the district level but not up-to facility level.
Table 44: Financing agents (FA) to health care prov iders (HP) (2011) FA HP
EPI program
Central MOH DHA National Health Service Agency (GHS)
National Medical Stores / Central Cold Stores
National Surveillance Agency
UNICEF WHO Total
Ambulatory health care centers
30 231 147,02 30 231 147,02
District MOH
2 082 758,67 5 478 069,04 7 560 827,72
National MOH
242 587,29 238 829,24 387 527,26 11 282 639,87 38 523,87 29 028,85 12 219 136,39
Provincial MOH
396 758,40 396 758,40
Rest of the world
22 396,71 64 616,77 87 013,48
Total 242 587,29 32 949 493,33 5 478 069,04 387 527,26 11 282 639,87 38 523,87 51 425,56 64 616,77 50 494 883,01

DO NOT CIRCULATE OR QUOTE WITHOUT PERMISSION
89
8.3.4. Financing Agents to Health Care Financing Mechanisms in 2011 Health care financing mechanisms focus on the financing modality. Central government schemes represent 92% of total funds spent, executed mainly by central MOH (65%) and Central Cold Stores (22%). Service delivery and financing being decentralized at district level; this level captures the five different financing schemes. 45.13% of district administration spending is provided through sub national (regions) government schemes, 31% of through central government schemes, 17% through the health insurance fund. External financing schemes and out of pocket payments are minor schemes at district level with respectively 4.85% and 2.1% of total spending.
Table 45: Financing agents (FA) to health care fina ncing mechanism (HF) (USD, 2011)
FA HF EPI program
Central MOH DHA GHS
Central Cold Stores
National Surveillance Agency UNICEF WHO Total
Central government schemes 242 587 32 949 493 1 700 257 387 527 11 282 640 38 524 46 601 028 Community level financing 114 869 114 869 Compulsory contributory health insurance schemes 925 335 925 335
Rest of the world 265 548 51 426 64 617 381 590 State/regional/local government schemes 2 472 060 2 472 060
Total 242 587 32 949 493 5 478 069 387 527 11 282 640 38 524 51 426 64 617 50 494 883

DO NOT CIRCULATE OR QUOTE WITHOUT PERMISSION
90
8.4. Schematic illustration of funds flow for routine immunization services in Ghana (2011) The graph below provides the flow of funds and their distribution from funding sources to financing agents to health care provider to activities (Graph 24).

DO NOT CIRCULATE OR QUOTE WITHOUT PERMISSION
91
Transfers distributed by Gvt from foreign originTransfers from Gvt domestic revenue
WHO
Central
MOH
Central
Cold
Store
Ghana
Health
Service
National
Surveillance
Agency
DHAEPI
Regional
TransferUNICEF
Internal
transfersGAVI USAID
Central
Transfers
Within
local
Social Insurance and prepayment Direct foreign transfers
Social
Insurance
Prepayment
householdsUNICEF WHO GAVI
World
Vision
UNICEF WHO
Ambulatory
Health Care
Facilities
Central
administration
District
Administration
Regional
AdministrationRest of the World
SurveillanceCold Chain
Maintenance
Program
management
Facility
based
delivery
RI n.dOther
activity
Outreach
delivery
Record‐
keeping &
HMIS
Social
Mobilization
&
Advocacy
Supervision Training
Vaccine
Coll.
Dist. &
Stor.
0.17%
0.16%
0.18%
61.85%
0.22%
10.85%
0.04% 0.13%
10.70% 9.62% 2.54%7.85% 2.49% 8.90% 3.87% 3.02% 12.03% 10.49%2.79% 25.63%
Graph 2 4: Mapping of funding flows for routine immunization in Ghana (2011)

DO NOT CIRCULATE OR QUOTE WITHOUT PERMISSION
92
8.5. Methodology for the qualitative assessment In order to complement and further interpret the quantitative analysis, a qualitative survey was conducted focusing on the process and perception of the different actors relating to the funding for routine immunization. In particular, the results reported here reflect the viewpoint of the interviewed officials (government and development partners) on their engagement in the process, complementing the quantitative analysis on actual financing data. Semi-structured interviews were conducted at the central, regional and district levels on the following topics:
- Access to funding - Reporting requirements - Key difficulties faced relating to financial management - Bottlenecks for planning, budgeting, disbursement, expenditure and reporting
8.6. Results on qualitative assessment of funding flows for routine immunization
8.6.1. Access to funds for EPI and funding flow mechanisms
8.6.1.1. Central level perspective The EPI Ghana prepares a budget. It is then submitted to the Director of Public Health and collated as one budget with other department and programs. EPI Ghana receives earmarked funds from donors and partners (WHO, UNICEF, USAID, GAVI). Government of Ghana is the domestic funding source.
8.6.1.2. Regional perspective Through the Ghana Health Service, the funds are directly transferred on the regional department of health (RDH) accounts (Graph 24).
Graph 25: Funding flow from GOG to Regions
Funds are usually transferred to regions with a memo attached that provides them guidance on how the funds should be spent or to which institution they should be transferred. The RDH then disburses the funds to one of the four Budget and Management Centers (Office of the Regional Director, Public Health Unit, Support services unit and the Finance Unit). Funds allocated to EPI activities (campaigns or routine) flow through the Public Health Unit. In general, specific funding is provided for campaigns / NIDs but not for routine immunization.
Government
of Ghana
Ministry Of
Health
Ghana Health
Service
Regional
Department of
Health
Public Health
UnitFinance UnitSupport services
Budget & Management
Centers:Office of the
regional director

DO NOT CIRCULATE OR QUOTE WITHOUT PERMISSION
93
8.6.1.3. District perspective The Government and Ministry of Health provide quarterly budget to all districts via the regional administrative level to support service delivery including immunization (non earmarked transfer). Districts access funds through the Ghana Health Service at regional level by submitting their plan of activities and budget. The funding flow for routine immunization goes from GOG to MOH to GHS to RDH to DHMT account (Graph 25). Districts then transfer funds to sub districts or directly pay for expenses (no data was available to inform distribution between the two).
Graph 26: Funding flow to district level
Funding sources at district level are either Internally Generated Funds, GOG (2 & 3)13, donor pooled funding, and support from other vertical programs (National Malaria Control Program and HIV/AIDS). Significant funds are also received through the support of NGOs.
8.6.2. Reporting requirements
8.6.2.1. Central level For domestic funding, the DCD accountant submits monthly reports to the Ghana Health Service Headquarters (Finance Unit at GHS). For UNICEF, the reporting mechanism is the Funding Authorization and Certificate of Expenditures (FACE) form. For WHO, the reporting mechanism is the Direct Financial Cooperation (DFC) form. The financial reporting is compulsory on any expenditure from these funding sources (WHO or UNICEF). Reporting on GAVI Alliance use of funds are provided through financial statements attached to the country Annual Progress Report (APR) submitted to GAVI.
8.6.2.2. Regional level Sub-districts report to District Health Management Teams, which report to the Regional Health Department, to Ghana Health Service to MoH (Graph 26). Regions have a standard MOH/GHS reporting format which has to be followed strictly. Regions mentioned the lack of quality in the financial reports received from the districts.
Graph 27: Reporting flows for regional level
8.6.2.3. District level MOH and GHS have a reporting format that districts must follow strictly. It includes validation reports, financial reports and completion of receipt books. The reporting of expenditures involves financial monitoring to validate the financial statements which can burden the services.
13 GOG 2 = Administration GOG 3 = Services
Government
of Ghana
Ministry Of
Health
Ghana Health
Service
Regional
Department of
Health
District Health
Management Team
Sub‐
districts
District Health
Management
Team
Regional Health
Administration
Ghana
Health
Service
Ministry of
Health

DO NOT CIRCULATE OR QUOTE WITHOUT PERMISSION
94
8.6.3. Key difficulties faced by EPI
8.6.3.1. Central level The funding is considered as insufficient and in particular for routine immunization (as opposed to campaigns) by EPI manager. There is a late release of funds from GHS, DCD and development partners to EPI. The positive balance of funds from other activities is used to support routine immunization activities. The financial support for the cold chain is considered by respondent as too low. Another difficulty is the lack of flexibility on how the funds can be spent. For EPI, one of the challenges is to spend the funds within the same budgeted line items despite that issues from the field may arise and require immediate action from EPI.
8.6.3.2. Regional level At regional level, there are no funds dedicated to routine immunization. Regional cold stores are funded and maintained by the central level. As mentioned at central level, the key difficulty at regional level is the late release of funds. In general government funds only start to flow around the months of April/May. The funds received (shared funding) are insufficient as they are often inferior to the approved budgets. Consequently, EPI programs ride on other program budgets to conduct routine immunization activities.
8.6.3.3. District level For disbursement, districts use the GOG funding transferred by regions but they do not receive it in a timely manner (4 districts). The funding is insufficient to carry out all the routine immunization activities in the sub districts and inferior than the approved budget (3 districts). Districts have no alternative funds to close the gap between the amount of approved funds and funds received.
8.6.4. Bottlenecks for planning, budgeting, disbursement, expenditure and reporting
8.6.4.1. Central level From EPI perspective, the delays in receiving the funds impact the spending.
8.6.4.2. Regional level Pre-financing EPI activities sometimes result in overspending. Funding is sometimes provided to regions without a memo guide on the spending. In that case, the disbursement of funds by the region can be difficult which results in uneven allocation of funds. Also, the inflation in prices or pricing differentials can result in shortfalls in budget proposals.
8.6.4.3. District level One issue mentioned is the fact that budget ceilings limit the availability of funds (1 district). The procurement laws sometime burden the spending of funds. Reporting activities face inadequate human resource skills and late reporting. One issue mentioned by one district is the need to pay for volunteers for the campaigns which burdens the budget due to the high number of volunteers in this district. Another bottleneck mentioned was the inadequate logistic equipment in the district.

DO NOT CIRCULATE OR QUOTE WITHOUT PERMISSION
95
8.6.5. Other challenges related to funding for routine immunization
8.6.5.1. Regional level Among other challenges mentioned, one region mentioned that the vehicle fleet of motorbikes was insufficient.
8.6.6. Results at the facility level Most facilities do not have any financial data available. In the facilities where data was available financing amounts were not disaggregated for routine immunization. The funding sources identified in the surveys are mostly Internally Generated Funds (IGF) through out-of-pocket-payments. IGF are generated from user fees or sale of drugs and is retained at the point of collection or transfer to the district level. For urgent needs, health facilities may use IGF to pay for their expenses. MoH facilities are becoming increasingly dependent on IGF. The survey conducted in the 50 facilities found that 86% of facilities had collected user fees in 2011. The amount collected through user fees was available in 64% of the facilities collecting user. The average sum collected (not weighted) through user fees was 1 156 USD. The portion going to immunization services was not known.
8.6.7. Results from development partners
8.6.7.1. Routine immunization activities supported The table below provides the routine immunization activities supported by WHO and UNICEF (table 46).
Table 46: routine immunization activities supported by WHO and UNICEF WHO UNICEF Red approach implementation Cold chain management and logistics Data management Vaccine Preventable Disease Surveillance Operation research (assessment. Review, surveys etc) Waste management Laboratory services
Provision of cold chain equipment, Technical support Monitoring and evaluation Provision of vehicles to support service delivery Direct financial support for service delivery
8.6.7.2. Access to donor funds WHO funds are accessed through submission of a proposal, budget and an official request letter from Heads of Units. Funding flows depend on the administrative level requesting the funds and the type of activity. Most of the time, funds are channeled through the national head office for transmission to various level. This is to ensure coordination, monitoring and accountability. For some programs implemented by civil society organizations, funds flow directly to these organizations with the same submission process. For UNICEF, at the planning stage, the implementing partner institution and UNICEF discuss areas where support is needed. These areas are incorporated into UNICEFs annual work plan. The institution sends a proposal and budget to access funds to implement activities which is then approved by the chief of section. Finance section processes and transfers the funds to the requesting institution. Finally, the chief of Section notifies requesting institution about the transfer (date and amount).

DO NOT CIRCULATE OR QUOTE WITHOUT PERMISSION
96
8.6.7.3. Conditions for funding and reporting requirements For UNICEF, funds to be used for activities must be agreed upon. UNICEF must be informed and approve of any variation in expenditure before it is carried out. The reporting requirements are the following: A report must be submitted no later than six months from the date of transfer of the funds. The report should include a narrative report showing how the activity was implemented, any specific outputs indicating any variation from what was planned and reasons for this; challenges, constraints and any further action. The financial report should indicate whether funds were used as planned. Any unutilized funds are to be refunded unless permission has been sought from and granted by UNICEF for these to be reprogrammed. For WHO, all relevant documents must be submitted. All outstanding finances must be accounted for with technical report. The request must satisfy the priority needs (enhancing disease prevention or contributing to MDG) and a credible mechanism or sources for financial transactions must be in place (accredited bank). For WHO, two reports are required after utilization of funds:
- Comprehensive activity technical report giving full detail about output. - Financial report accounting for funds received and utilization of funds.
8.6.7.4. Difficulties faced by recipient of donor funds According to donors, the issues faced by recipient in efficiently spending the funds transferred to them by the donor institution are the following ones:
- Delay in utilizing and accounting for funds - UN rates for some expenditure are too low - Meeting requirements for release of funds (GSM process for WHO) - Organization specific reporting format (DFC) - Delayed Bank transactions - Change of value in terms of exchange rates
8.6.7.5. Causes of bottlenecks in the funding mechanisms Donor identified the key causes of bottlenecks in the funding mechanisms, in terms of planning, budgeting, disbursements, expenditure, and reporting. The donors mentioned the inability to determine in advance amount of funds that will be available for the year. Recipients are not able to develop long term strategic plans for resource mobilization. In terms of budgeting, some requests for funds for activities are not covered by the work plan. For disbursement, delays in disbursement for current request are due to failure of requesting institution to account for previous use of funds. For expenses, there is a delay in utilizing and accounting for funds. For reporting, donor requirements for funds are not standardized. Reports are of poor quality and there are delays in the reporting.
8.6.7.6. Other issues and challenges related to funding for routine immunization services
The following challenges were mentioned by development partners regarding routine immunization financing: late submission of request, lack of skills to mobilize resources locally and high dependency on donor support.

DO NOT CIRCULATE OR QUOTE WITHOUT PERMISSION
97
8.7. Discussion and comparison of funding flow analysis Regarding the funding flow quantitative analysis of 2011 and 2010, the 2011 amount of financing is higher than the 2010 amount (increase of US$ million 8.12). There are several factors that explain this increase. The main factor is the value of vaccines which increased significantly between 2010 and 2011 (from 4.4 million USD in 2010 to 11.3 million USD in 2011). In particular, the cost of the pentavalent vaccine increased from 2.72 million USD (1.2 USD per dose) in 2010 to 7.40 million USD (2.9 USD per dose) in 2011(23). This increase is due to a switch in pentavalent vaccine presentation (from one dose per vial to ten doses per vial). Secondly, health insurance funds have been reported in the 2011 funding flow analysis but not in 2010. The volume of activities seems to be impacted by the insufficient financing for routine immunization. For example, monthly EPI reviews have been scaled to quarterly due to lack of funds in one region (20). Furthermore, the difficulties in delays of funds can be explained by the fact that financing for immunization used to be pooled under MOH. Since 2007, multi-budget financial support is under the MOFEP, and delays in the release of funds for the purchase of vaccines have been identified since then (1). Cold chain equipment has been identified as lacking funds. However, there is no dedicated budget line in the national budget for cold chain equipment. Donor dependency has decreased significantly compared to the costing and financing study conducted in 2000 (5). In 2000, routine immunization was much more donor dependant as 51% of its costs were supported by development partners (mostly from the DFID with 41% of total support). Government of Ghana represented 49% of the funding. In the funding flow analysis, donor support accounts for less than 20% of total support and is mostly captured by GAVI support for vaccines.
DO NOT CIRCULATE OR QUOTE WITHOUT PERMISSION
98
9. Policy implications & recommendations Policy implications and recommendations were discussed during a dissemination workshop dedicated to this study with Ghana Health Service and EPI in Accra. A summary of these is provided below.
9.1. Policy implications The policy implications are the following:
- The study results provide solid evidence on the actual cost and financing of routine immunization; it should serve as reference points for planning, budgeting and advocacy
- Study findings confirm the current high wage bill in service delivery (this is confirmed by the regression analysis where the Full Time Equivalent and the average wage of staff involved in immunization per facility are statistically and strongly related to the total economic routine immunization costs).
- Study highlights the substantial contribution of volunteer labor and whether it should be taken into account
- Additional resources are required to reach additional children and strengthening CHPS - Findings reaffirm government strategies of CHPS , National Health Insurance Scheme and
decentralization to attain Universal Health Coverage - Key challenges ahead for EPI Ghana is to maintain the current level of performance but also
reaching additional children, most of whom will require outreach strategies - Adequate financing of outreach is critical to sustain and improve immunization program
performance - Vaccines remain mostly supported by donors and immunization service delivery remains
supported mostly through supply-side subsidies through MoH transfers to district level. ‐ Routine immunization are hampered by limited and delayed financing (non earmarked) ‐ Study results show that immunization is labor intensive
‐ The high unit cost of CHPS, highlights the importance of proper micro planning from CHPS to ensure service delivery
9.2. Recommendations
9.2.1. To MOH, EPI, NHIS and donors - The evidence and findings from this costing study should be used as an advocacy tool to call
for funding for routine immunization from all stakeholders including Ministry of health, National Health Insurance and Health partners.
9.2.2. To District Health Administration planning departments - There is the need to get the managers at the lower levels to do proper micro planning for
CHPS implementation (including the construction of the compounds).
9.2.3. To Ghana Health Service, Policy Planning, Monitoring & Evaluation (PPME) Department
- For the future, there is the need to look at public health financing in terms of purely government commitment since this is key for national development.
- There is the need to look at other vaccinations outside the traditional routine vaccinations such as costing of HPV vaccines.
- When integrating these new cost estimates, there is the need to assess impact of potential graduation (within four to five years) on financial sustainability of the immunization program
- Budget requirements should be based on actual cost rather than projections

DO NOT CIRCULATE OR QUOTE WITHOUT PERMISSION
99
- The number of staff involved in routine immunization (and their associated FTE) in the cMYP tool should be reconsidered for personnel cost calculations
- There is the need to secure funding (to be provided in the adequate amount and in a timely manner) for outreach to be conducted regularly
- The vaccine introduction plans only covers part of the introduction cost and also there is the need to plan well in advance for cold chain expansion.
9.2.4. To donors - Donors need to improve predictability and visibility of funding (1 to 2 years) to immunization
program

DO NOT CIRCULATE OR QUOTE WITHOUT PERMISSION
100
10. Conclusions Our study found a high cost of routine immunization compared to previous estimates in Ghana (6,7) and other costing studies (5). Key findings show that the non-vaccine routine immunization costs at facility level are substantial. The unit cost of immunization is even higher in CHPS facilities, both for outreach delivery costs and associated support activities.
We found that current cMYP assumptions on human resources involvement at facility levels seem to underestimate the real implication of staff for routine immunization. Consequently, the number of staff involved in routine immunization (and their associated FTE) should be reconsidered for personnel cost calculations in the cMYP. The distribution of costs varied importantly when compared to cMYP costs structure. However, this may be linked to methodological assumptions from cMYP which provide a mix of line items and activities whereas the costing study provided a clear cut separation between line items and activities. The unit cost of immunization was higher in hard to reach areas and small rural facilities, both for outreach delivery costs and associated support activities. Similarly, the unit cost per dose decreases with the facility type implying that delivery in larger facilities requires less resources for a given activity volume. The percentage of total costs due to volunteer labor was substantially higher in rural than urban settings as this labor source was mobilized more often in remote facilities or to target hard-to-reach populations. Similarly, the percentage of transportation and fuel in total costs was higher in rural settings. The cost per FIC (DTP3-HepB-Hib) was lower in Reproductive and Child Health units of district hospitals (38.5 USD) compared to Community-based Health and Planning Services facilities (87.8 USD). The higher cost of CHPS can be ascribed to a smaller catchment population that requires more effort to vaccinate (as outreach requires more manpower and fuel costs per vaccinated child). District hospitals were located in district capitals and had a significantly higher catchment population and more health workers entirely dedicated to immunization.
Budget estimate only show a small portion of routine immunization costs for the health system. For planning of expenses, a financial costing should be favored whereas for broader health system analysis, an economic costing should be preferred. However, financial costs may be less accurate due to the absence of financial reporting at facility level and lack of financial reporting at district levels.
Vaccine introduction grant was found to be lower than the incremental fiscal costs related to introduction. Part of it was covered with remaining with domestic funding and additional external funds.
Routine immunization program received 50 million USD in 2011. This funding was provided mostly through domestic resources accounting for 78% of total support; external sources accounted for 22% of total funding. The financing analysis also outlined the substantial increase in 2011 versus 2010 and the lack of timely financing. Considering these main findings, one of the key challenges ahead for EPI Ghana is to maintain the current level of performance but also reaching additional children, most of whom will require outreach strategies. However, one of the main difficulty to improve outreach is the insufficient financing to implement micro plans for immunization (1). At the same time, routine immunization programs are hampered by limited and delayed financing. Without changes, this situation may get worse as Ghana implements new vaccines such as rotavirus, pneumococcal conjugate vaccine and potentially others in the future. One path taken by the Ghanaian health system is the expansion of community-based service delivery under the ‘CHPS initiative,’ which will address the lack of access in some areas. This full costing study shows that this strategy being implemented relies heavily on staff in the first line of service delivery (for its immunization component at least). Similarly, volunteers are paid for campaigns but not for activities relating to routine immunization. It also appears that community

DO NOT CIRCULATE OR QUOTE WITHOUT PERMISSION
101
health nurse are paid much less than in the private sector (1). Therefore, the contribution of volunteers and community health nurses needs to be fully assessed, recognized and potentially incentivized when needed to make sure that CHPS strategy is successful. The challenge of this initiative will be to ensure financial sustainability by mobilizing more resources through MOH subsidies (supply-side), National Health Insurance Scheme and user fees (demand-side). At a time when the Ghanaian health sector moves towards more demand-side financing, funding profile for immunization is particular, as vaccines remain mostly supported by donors and immunization service delivery remains supported mostly through supply-side subsidies through MOH transfers to district level. These larger issues relate to the larger eventual goal of national immunization program self-sufficiency.

DO NOT CIRCULATE OR QUOTE WITHOUT PERMISSION
102
11. Main Findings Main findings by topic Nation wide routine immunization costs:
� The total aggregated costs for the routine immunization program amounted to 53.49 million USD in 2011
� The cost per dose administered was 5.7 USD � The cost per FIC (DTP3-HepB-Hib) by administrative level was 60.30 USD � The cost per infant in the country was 52.9 USD � The cost per capita was 2.1 USD. � The share of total national costs varies by administrative level was the following: 69% at
facility level, 9% at district level, 2% at regional level and 20% at central level (with vaccines counted at central level).
� The unit cost per FIC (DTP3-HepB-Hib) aggregated is consistent with the unit cost per FIC of the sample
� Vaccine and injection supplies costs were captured at the central level and accounted for 19% of total costs.
� Recurrent line items accounted for 91% of the aggregated costs. � Within recurrent costs, salaried labor was the main cost driver, accounting for 61% of total
routine EPI costs � The remaining substantial recurrent cost items, as a percentage of total EPI costs, were:
volunteer labor (4.2%), transport (3.4%) and overhead utilities and communication (2.0%). � Outreach and Fixed delivery costs accounted for 21% of total cost (excluding vaccines)
Administrative offices costs for routine immunizati on:
� The average EPI routine costs of administrative offices was 28 285 USD per District Health Administration (DHA) office, and 92 858 USD per Regional Health Administration (RHA) level and the total EPI routine cost at central level was 702 727 USD
� Salaried labor represented a significant share of total cost in DHA (38.49%) and RHA (38.59%) but is lower at central level (18.02%)
� The share transport and fuel cost in DHA (13.76%) was much higher than in RHA (4.65%) and at central EPI (2.99%) as most of the supervisory, surveillance and operational activities for routine immunization take place at DHA level
� Program management, Surveillance, Supervision and Vaccine collection/distribution were the most important activities in terms of costs at the district health administration level.
� At regional level, the highest share in total cost is for vaccine/collection/distribution/storage Routine Immunization facility-level costs:
� The unit cost per routine dose administered was 5.1 USD � The cost per FIC (DTP3-HepB-Hib) was 51.3 USD � The cost per infant population in the catchment area was 36.1 USD � The main cost driver was salaried labor with 61% � Vaccines and injection supplies were the second highest cost driver with 26% of the total
facility cost � Vaccines and supplies are mostly delivered through outreach as (58% of the vaccines &
supplies cost) � Almost half of the facility costs (47%) could be attributed to service delivery � Outreach service delivery represented 25% of total facility costs and facility-based delivery
22% (including the value of vaccines) � Cost of support activities (53%) is mostly driven by record-keeping, social mobilization and
surveillance � The cost per dose was lower in urban settings (3.2 USD in urban areas; 5.8 USD in rural
areas) � Outreach services are more mobilized by remote facilities and to target hard-to-reach
population � The share of volunteer labor is significantly higher in rural settings (4.9% vs. 2.6%) � Similarly, the share of transportation and fuel is higher in rural settings

DO NOT CIRCULATE OR QUOTE WITHOUT PERMISSION
103
Main findings by topic � The cost per FIC (DTP3-HepB-Hib) was lower in Reproductive and Child Health units of
district hospitals (38.5 USD) � Cost per FIC (DTP3-HepB-Hib) was higher in Community-based Health and Planning
Services facilities (87.8 USD) � The unit cost per routine dose administered decreases with the facility type implying
efficiency differences according to facility type � Distribution within capital costs varies between urban and rural settings with capital costs
being mostly driven by vehicle costs in rural areas and by the costs of buildings in urban areas
Costs for New Vaccine Introduction (NUVI):
� Total economic cost of new vaccine introduction in Ghana was 26.7 million USD (including vaccines and supplies)
� Programmatic incremental costs amounted to 3.9 million USD (representing 9% of routine immunization costs)
� Fiscal costs amounted to 33 million USD � Cost of new vaccine purchases represented a three-fold increase in total vaccine costs of
routine 2011 � The personnel cost for vaccine administration outreach was higher (1.2 million USD) than for
fixed-based (0.9 million USD) Determinants analysis of routine immunization:
� The number of fully immunized children, the dedication proportion time of vaccinating personnel, the availability of sufficient human resource capacity to perform immunization activities correctly, , and the availability of cold chain equipment were all associated with total costs at facility level
Quantitative funding flow analysis of routine immun ization: � Routine immunization program received 50 million USD in 2011 (including salaries) � This funding was provided mostly through domestic sources, which accounted for 78% of the
support. � The main funding source was the central MOH � Donor support accounts for less than 20% of total support and is mostly captured by GAVI
support for vaccines � Funding for immunization is mostly based on supply-side subsidies from MOH and demand-
side financing remains marginal (2%) in 2011 � External funding plays a critical role in funding the vaccines and supplies that have become a
major cost driver of routine immunization costs and new vaccine introduction costs � Central government scheme is the main funding mechanism � Excluding salaries and vaccines, district receive and execute most of the spending for routine
immunization delivery � 86% of facilities had collected user fees in 2011 � The amount collected through user fees was available in 64% of the facilities collecting user
fees. � The average sum collected (not weighted) through user fees was 1 156 USD and the portion
going to immunization services was not known (if any) Qualitative assessment of funding flows for routine immunization:
� According to qualitative assessment, funding for routine immunization is considered at all levels (central, regional and district) as insufficient (sometimes inexistent) and is not provided in a timely manner
� Consequently, regions and district need to ride on other program budgets to fund and implement routine immunization activities in their area
� No funds are specifically earmarked for routine immunization and are shared with overall

DO NOT CIRCULATE OR QUOTE WITHOUT PERMISSION
104
Main findings by topic service delivery
� The view from donors is different as the main issue concerns the efficient spending of funds received by the recipients
� According to donors, the late disbursement is due to the failure from recipients in accounting for the funds and delays in reporting on their use
� According to regions, there is a lack of quality in financial reporting from districts

DO NOT CIRCULATE OR QUOTE WITHOUT PERMISSION
105
12. References (Vancouver) 1. EPI Ghana, Ghana Health Service, World Health Organization, UNICEF. Ghana Immunization Services Review - 2012. 2012. 2. G.Schieber, C.Cashin, K.Saleh, R.Lavado. Health Financing in Ghana. 2012. 3. EPI, WHO, UNICEF, GHS. Immunization Programme Comprehensive Multiyear Plan (2010-2014). 2010. 4. USAID (Maternal and Child Health Integrated Program ). Impact of New Vaccine Introduction on Developing Country Immunization Programs: A Review of the Grey Literature. 2011. 5. Levin Ann, England Sarah, Jorissen Joann, Garshong Bertha, and Teprey James. Case Study on the Costs and Financing of Immunization Services in Ghana. 2001. 6. D.Osei. Comprehensive Multi-Year Plan costing tool: EPI Ghana / Revised cMYP_Costing_Tool 2011. 2010. 7. D.Osei. Comprehensive Multi-Year Plan costing tool: EPI Ghana / Ghana_Costing_2_2. 2008. 8. Logan Brenzel. Common approach for the costing and financing of routine immunization and new vaccines introduction. 2012. 9. Ghana Stastitical Service. 2010 population and housing census: summary report of final results. 2012. 10. World Bank. World Development Indicators [Internet]. 2012. Disponible sur: http://data.worldbank.org/indicator/SI.POV.NAHC/countries/GH?display=graph 11. Karima Saleh. The Health Sector in Ghana. World Bank. 2013. 12. F. Nyonator. Immunization Status in Ghana. 2012. 13. World Bank. Pump price for gasoline (US$ per liter) | Data | Table [Internet]. [cité 25 sept 2013]. Disponible sur: http://data.worldbank.org/indicator/EP.PMP.SGAS.CD/countries 14. EPI Ghana. EPI logistics forecasting tool, Ghana. 2011. 15. UNICEF Supply Division. UNICEF supply catalogue for cold chain equipment [Internet]. 2011. Disponible sur: https://supply.unicef.org/unicef_b2c/app/displayApp/%28cpgsize=5&layout=7.0-12_1_66_68_115_2&uiarea=2&carea=4F0BAEC7A0B90688E10000009E711453&cpgnum=1%29/.do?rf=y 16. Patrick Lydon (WHO V&B). Costing of Waste Management West Pacific Region CAMBODIA: Case Study: Sicim Incinerator in Kompong Chnang Province. 2002. 17. Perrin. Resource management in the NHS. 1988. 18. Walker D. Mosquiera NR. Penny ME, Lanata CF. Clark AD. Sanderson CFB and Fox-Rushby. Variation in the costs of delivery routine immunization services in Peru. Bull World Health Organ. 82:676‑682. 19. S.Sackey, G.Mayers, L.Mekpor. Ghana EPI Review: Greater Accra Region Report. 2012. 20. E. Odai, E. Hammond, F. Oyewole. Field Findings of the EPI review in Ashanti Region. 2012. 21. EPI, WHO, UNICEF, GHS. New Vaccine Introduction Plan. 2011. 22. Ghana Health Service. Vaccine introduction grant financial statements: Statement of Income and Expenditure. 2012. 23. UNICEF Supply Division. Quantity and value of vaccines shipped to Ghana through UNICEF from 2010 to 2011. 2013.

DO NOT CIRCULATE OR QUOTE WITHOUT PERMISSION
106
Appendix A1 - Project Team The project team role and responsibilities were as follow:
- The health economist adapted the methodology and tools, performed central level data collection, cost calculation, cost and funding analysis, report and manuscript writing (Jean-Bernard Le Gargasson, AMP)
- The project leader recruited the core team, oversaw the project development and implementation, guided the methodology and the data analysis, reviewed project documents including protocol, reports and articles (Anaïs Colombini, AMP).
- Two technical advisors assisted with design, analysis, and interpretation (Alfred Da Silva and Brad Gessner, AMP).
- The MOH focal point was in charge of interface between the health authorities of the country and AMP, represent the project towards national authorities, including the Ethics Committee, facilitate administrative implementation, and participate in meetings and conference calls about the project (Dr Frank Nyonator, MOH Ghana).
- The national technical advisor provided advice on costing and financing issues of immunization program (Dr Dan Osei, MOH Ghana)
- A statistician health economist performed the statistical analysis on determinants of facility-level costs and determinants of productivity at facility level (Césaire Ahanhanzo, AMP)
- A statistician health economist developed the data entry template and cost calculation program (Darwin Young, Consultant)
- The national team leader was in charge of survey implementation and data entry oversaw data collection, and data entry phase by supervising the interviewers and oversaw data entry (Dr Moses Adibo)
- The project operations manager (Audrey Gavard Lonchey AMP) - Five interviewers performed the data collection at the immunization service delivery and
administrative units as well as data entry (Bernard Achampong, Seth Adjei, Vida Gyasi, Irene Hamba, Gustav Togobo)

DO NOT CIRCULATE OR QUOTE WITHOUT PERMISSION
107
A2 – Definition of activity types The definition of the different activities included in the study is listed below:
Activity Definition Routine facility-based service delivery: Administering the vaccine to children within the
facility/compound. Outreach service delivery: Administering the vaccine to children outside
of the facility, travelling to and from a place for this purpose.
Record-keeping, Health Management Information System (HMIS), monitoring and evaluation:
Entering and analyzing data, including maintaining stock registers, maintaining records of children vaccinated, completing reports and analyzing, monitoring, and evaluating immunization program data.
Supervision: Supervising subordinate or peer health or community workers.
Training: Attending and/or providing immunization-related training.
Social mobilization and advocacy: Mobilizing the community and households, and advocating for vaccination. This could include the cost of television and radio time, as well as the cost of hiring actors, etc. Also includes the activities related to information and education.
Surveillance: Following-up post-vaccination events and active cases of diseases that are prevented by vaccination.
Vaccine collection, distribution and storage: Collecting vaccines at the airport or other distribution points, storing vaccines in national and/or sub national cold stores, maintaining stock records of vaccines, and distributing vaccines down to the facility.
Program management: Planning, budgeting, and managing the immunization program at various levels. This would include the cost of time and resources spent on forecasting vaccine needs and procuring vaccines.
Cold chain maintenance: Maintaining the cold chain at the respective level of analysis.
Vehicle maintenance: Maintaining vehicles (of all types) used for immunization-related activities.
Other: Other immunization-related activity not covered in the above categories.

DO NOT CIRCULATE OR QUOTE WITHOUT PERMISSION
108
A3 - Definition of line items (input) The following line items capture the types of inputs included in the scope for routine immunization activities (when existing):
Line item Definition Paid labor: salaried labor to immunization-related activities. Volunteer labor: Value of volunteer labor used for immunization-related
activities. Per Diem and travel allowances: Any allowances paid or volunteer workers for immunization-
related activities. Vaccines: Traditional and new vaccines. Vaccine injection and safety supplies:
Auto-disabled syringes, diluents, reconstituting syringes, safety boxes and other supplies used for administration of vaccines
Transport and fuel: Bus/taxi fare and the cost of fuel for immunization-related transport.
Cold chain energy costs: Butane, gas, electricity for the running the cold chain. Printing costs: Printing of immunization cards, training and IEC materials,
and other materials that are immunization-related. Overheads, utilities and communication:
Building overheads, including maintenance, utilities, telephone, and internet connections.
Other supplies: Stationery and other supplies for the immunization program that needs to be renewed every year.
Other recurrent: Other recurrent costs for immunization-related activities those are not included in the above line items.
Cold chain equipment: Cold chain equipment used to store and transport vaccines. Vehicles: Vehicles and modes of transport (pick up, saloon cars,
motorbikes, bicycles) Other equipment: Computers, printers, peripherals, furniture, other medical
equipment used for immunization-related activities (lifespan > one year).
Buildings: Building space used for the delivery (or program management at district and regional levels) and storage of vaccines.
Other capital Other capital investments (this category should be very small) not included in the above line items.

DO NOT CIRCULATE OR QUOTE WITHOUT PERMISSION
109
A4 - Vaccine prices of Ghana routine immunization schedule in 2011
Vaccine Presentation Vial Size
(doses)
price per
dose (USD)
BCG Lyophilized 20 0.069
Polio Liquid 20 0.13
Measles 1 Lyophilized 10 0.193
Yellow Fever Lyophilized 5 0.66
Tetanus Toxoid Liquid 10 0,085
Pentavalent DTP-HepB-Hib Liquid 1 2.96
A5 - Sampling frame Note that in each district, there are never more than 5 of the above strata. In the selected districts, the total number of facilities was distributed as follow:
District
Rur. Gvt HC
Urb. Gvt HC
Rur. Miss HC
Urb. CHP
Rur. Gvt CHP
Urb. Gvt DH
Rur. Gvt Cli.
Urb. Gvt Cli.
Rur. Miss Cli.
Urb. MH
Urb. Miss Hosp TOT
sample approx 50%
Asante Akim South 8 0 0 0 2 1 3 1 0 0 0 15 7
Atwima Mponua 5 0 1 0 2 1 0 0 1 0 0 10 6
Ga West 0 0 0 2 3 0 5 5 0 1 0 17 8
Bunkpurugu Yunyoo 4 0 1 0 6 0 0 0 0 0 1 12 6
Kassena Nankana 1 1 0 0 19 1 1 0 0 0 0 23 10
Wa Municipal 6 0 0 0 20 0 2 2 0 0 0 30 13
24 1 2 1 52 3 12 9 1 1 1 107 50 Miss= Mission; HC= Health Center; CHP=CHPS; Cli=Clinic; MH= Municipal Hospital By applying this rule we obtain the following number of facility to select in each strata and for each district: District Rur
. Gvt HC
Urb. Gvt HC
Rur. Miss HC
Urb. Gvt CHP
Rur. Gvt CHP
Urb. Gvt DH
Rur. Gvt Cli.
Urb. Gvt Cli.
Rur. Miss Cli.
Urb. MH
Urb.Miss DH
TOTAL
Asante Akim South 3 0 0 0 1 1 1 1 0 0 0 7
Atwima Mponua 2 0 1 0 1 1 0 0 1 0 0 6
Ga West 0 0 0 1 2 0 2 2 0 1 0 8
Bunkpurugu Yunyoo
2 0 1 0 2 0 0 0 0 0 1 6
Kassena Nankana 1 1 0 0 6 1 1 0 0 0 0 10
Wa Municipal 4 0 0 0 7 0 1 1 0 0 0 13
12 1 2 1 19 3 5 4 1 1 1 50

DO NOT CIRCULATE OR QUOTE WITHOUT PERMISSION
110
A6 - List of facilities in the survey The following facilities were selected as replacement facilities: Nachanta, Doba, Gia, Adomfe, Nnadieso, Bimbagu, Nasua, and Boli.
District
Facility Name
Strata
Asante Akim South
1 Banso CHPS (linked with Ofoase HC*) Rural Government CHPS
2 Juaso RCH/FP Urban Government Clinic
3 Kyempo Epi Centre Rural Government Clinic
4 Juaso District Hospital Urban Government District Hospital
5 Banka Health Centre Rural Government Health Centre
6 Dwendwenase Health Centre Rural Government Health Centre
7 Ofoase Health Centre * Rural Government Health Centre
Atwima Mponua
8 Ahyiresu CHPS Compound (linked with Gyereso HC*) Rural Government CHPS
9 St Peters (atwima Mponua) Clinic Rural CHAG Clinic
10 Nyinahin Hospital Urban Government District Hospital
11 Anglican Health Centre Rural CHAG Health Centre
12 Gyereso Health Center* Rural Government Health Center
13 Bayerebon Health Centre Rural Government Health Center
Ga West
14 Akramaman CHPS Rural Government CHPS
15 Nsakina CHPS Rural Government CHPS
16 Pokuase CHPS Urban Government CHPS
17 Oduman Community Clinic Rural Government Clinic
18 Afiaman Outreach Clinic Rural Government Clinic
19 Kojo Ashong Community Clinic Urban Government Clinic
20 Mayera Faase Community Clinic Urban Government Clinic
21 Ga West Municipal Hospital Urban Government Municipal Hospital
Bunkpurugu Yunyoo
22 Kambagu CHPS (linked with Bunkpurugu HC*) Rural Government CHPS
23 Mozio CHPS (linked with Yunyoo HC*) Rural Government CHPS
24 Binde Rural Hospital Urban CHAG Hospital
25 Nakpanduri Health Centre Rural CHAG Health Center
26 Bunkpurugu Heakth Centre * Rural Government Health Centre
27 Yunyoo Heakth Centre* Rural Government Health Centre
Kassena Nankana
28 Biu CHC (linked with Kologo HC*) Rural Government CHPS
29 Gongnia Chc (linked with Navrongo HC*) Rural Government CHPS
30 Korania CHC (No HC Center in sub district Wuru) Rural Government CHPS
31 Nayagnia Chc (No HC in sub district Navrongo East)) Rural Government CHPS
32 Vunania Chc (No HC in Vunania/Kpania) Rural Government CHPS
33 Wuru Chc (No HC Center in sub district Wuru) Rural Government CHPS
34 Biu St. Martins Clinic Rural Government Clinic

DO NOT CIRCULATE OR QUOTE WITHOUT PERMISSION
111
District
Facility Name
Strata
35 War Memorial Hospital Urban Government District Hospital
36 Kologo Health Centre* Rural Government Health Centre
37 Navrongo Health Centre* Urban Government Health Centre
Wa Municipal
38 Dondoli CHPS (linked with Wa Central HC*) Rural Government CHPS
39 Gbegru CHPS (linked with Charingu HC*) Rural Government CHPS
40 Konjiehi CHPS (linked with Charingu HC*) Rural Government CHPS
41 Kperisi CHPS (linked with Charingu HC*) Rural Government CHPS
42 Kunbiehi CHPS (linked with Wa Central HC*) Rural Government CHPS
43 Mangu/Sombo CHPS (linked with Kambali HC*) Rural Government CHPS
44 Piisi (wa) CHPS (linked with Bamahu HC)
Rural Government CHPS
45 Bamahu Health Center* Rural Government Health Centre
46 Charingu Health Center* Rural Government Health Centre
47 Kambali Health Center* Rural Government Health Centre
48 Wa Urban Health Center* Rural Government Health Centre
49 Konta North Clinic Rural Government Clinic
50 Wa Market Clinic Urban Government Clinic

DO NOT CIRCULATE OR QUOTE WITHOUT PERMISSION
112
A7 - Sample weights by district and facility or other area used in the analysis Sampling weights = inversed probability of being selected
District Name of facility Sampling weight
Asante Akim South
Juaso RCH/DH 29
Kyempo Epi Centre 87
Banka Health Centre 68
Dwendwenase Health Centre 68
Ofoase Health Centre * 68
nnadieso 29
adomfe 58
TOTAL ASANTE AKIM SOUTH 319
Atwima Mponua
Ahyiresu CHPS Compound (linked with Gyereso HC*) 48
St Peters (atwima Mponua) Clinic 24
Nyinahin Hospital 24
Anglican Health Centre 24
Gyereso Health Center* 60
Bayerebon Health Centre 60
TOTAL ATWIMA MPONUA 240
Ga West Akramaman CHPS 24
Nsakina CHPS 24
Pokuase CHPS 32
Oduman Community Clinic 48
Afiaman Outreach Clinic 48
Kojo Ashong Community Clinic 40
Mayera Faase Community Clinic 40
Ga West Municipal Hospital 16
TOTAL GA WEST 272
Bunkpurugu Yunyoo
Kambagu CHPS (linked with Bunkpurugu HC*) 60
Nakpanduri Health Centre 24
Bunkpurugu Heakth Centre * 36
Yunyoo Heakth Centre* 36
Bimbagu CHPS 60
Nasuan Health Center 24
TOTAL BUNKPURUGU YUNYOO 156
Kasena Nankana
Gongnia Chc (linked with Navrongo HC*) 75
Nayagnia Chc (No HC in sub district Navrongo East)) 75
Vunania Chc (No HC in Vunania/Kpania) 75
Wuru Chc (No HC Center in sub district Wuru) 75
Biu St. Martins Clinic 29
War Memorial Hospital 29
Kologo Health Centre* 29
Navrongo Health Centre* 29
doba 75
gia 75

DO NOT CIRCULATE OR QUOTE WITHOUT PERMISSION
113
District Name of facility Sampling weight
TOTAL KASSENA NANKANA 414
Wa Municipal
Dondoli CHPS (linked with Wa Central HC*) 43
Gbegru CHPS (linked with Charingu HC*) 43
Kperisi CHPS (linked with Charingu HC*) 43
Kunbiehi CHPS (linked with Wa Central HC*) 43
Piisi (wa) CHPS (linked with Bamahu HC) 43
Bamahu Health Center* 24
Charingu Health Center* 24
Kambali Health Center* 24
Wa Urban Health Center* 24
Konta North Clinic 32
Wa Market Clinic 32
boli CHPS 43
nachanta CHPS 43
TOTAL WA MUNICIPAL 377
ALL 2185
A8 - Coding for financial flow analysis : Funding sources
FS. CODE FS. Descritpion
FS.1
Transfers from government domestic revenue
FS.1.1 Internal transfers and grants
FS.1.1.1 - Internal transfers within central government
FS.1.1.2 - Internal transfers within region/local government
FS.1.1.3 - Grants from central government
FS.1.1.4 - Grants from regional/local government
FS.1.2 Transfers by government on behalf of specific groups
FS.1.3 Subsidies
FS.1.4 Other transfers
FS.2 Transfers distributed by government from foreign origin
FS.2.1 Monetary transfers
FS.2.1.1 - from bilateral organizations
FS.2.1.1.1 - USG bilateral financial transfer
FS.2.1.1.2 - DfiD bilateral financial transfer
FS.2.1.1.3 - JICA bilateral financial transfer
FS.2.1.1.4 - NORAD bilateral financial transfer
FS.2.1.1.5 - Other agency bilateral financial transfer (Specify)
FS.2.1.2 - from multilateral organizations
FS.2.1.2.1 - from UNICEF direct financial transfer
FS.2.1.2.2 - from WHO direct financial transfer

DO NOT CIRCULATE OR QUOTE WITHOUT PERMISSION
114
FS. CODE FS. Descritpion FS.2.1.2.3 - from PAHO direct financial transfer
FS.2.1.2.4 - from Other multilateral financial transfer (Specify)
FS.2.1.3 - from GAVI Alliance
FS.2.1.4 - from other sources
FS.2.1.4.1 - from BMGF financial transfers
FS.2.1.4.2 - from CHAI financial transfers
FS.2.1.4.3 - from other external/NGO source financial transfers (Specify)
FS.2.2 Commodity transfers
FS.2.2.1 - from bilateral organizations
FS2.2.1.1 - USG bilateral commodity transfer
FS.2.2.1.2 - DfiD bilateral commodity transfer
FS.2.2.1.3 - JICA bilateral commodity transfer
FS.2.2.1.4 - NORAD bilateral commodity transfer
FS.2.2.1.5 - Other agency bilateral commodity transfer (Specify)
FS.2.2.2 - from multilateral organizations
FS.2.2.2.1 - from UNICEF commodity transfers
FS.2.2.2.2 - from WHO commodity transfers
FS.2.2.2.3 - from PAHO commodity transfers
FS.2.2.2.4 - from other external/NGO source commodity transfers (Specify)
FS.2.2.3 - from GAVI Alliance
FS.2.2.4 - from other sources
FS.2.2.4.1 - from BMGF commodity transfers
FS.2.2.4.2 - from CHAI commodity transfers
FS.2.2.4.3 - from other external/NGO source commodity transfers (Specify)
FS.3 Social insurance contributions
FS.3.1 Social insurance contributions from employers
FS.3.2 Social insurance contributions from employees
FS.3.3 Social insurance contributions from self-employed
FS.3.4 Other social insurance contributions
FS.4 Compulsory prepayment
FS.4.1 Compulsory prepayment from households/individuals
FS.4.2 Compulsory prepayment from employers
FS.4.3 Other
FS.5 Voluntary prepayment
FS.5.1 Voluntary prepayment from households/individuals
FS.5.2 Voluntary prepayment from employers
FS.5.3 Other
FS.6 Other domestic revenues not elsewhere classified (n.e.c)
FS.6.1 Other revenues from households n.e.c
FS.6.2 Other revenues from communities n.e.c
FS.7 Direct foreign transfers
FS.7.1 Direct foreign financial transfers

DO NOT CIRCULATE OR QUOTE WITHOUT PERMISSION
115
FS. CODE FS. Descritpion FS.7.1.1 Direct bilateral transfers
FS.7.1.2 Direct multilateral transfers
FS.7.1.3 Other direct foreign transfers
FS.7.2 Direct foreign aid in kind
FS.7.2.1 Direct foreign aid in goods
FS.7.2.1.1 Direct bilateral aid in goods
FS.7.2.1.2 Direct multilateral aid in goods
FS.7.2.1.3 Other direct foreign aid in goods
FS.7.2.2 Direct foreign aid in kind: services (including TA)
FS.7.2.2.1 Direct bilateral foreign aid in kind
FS.7.2.2.1.1 - from USG bilateral aid in kind
FS.7.2.2.1.2 - from DfID bilateral aid in kind
FS.7.2.2.1.3 - from JICA bilaeral aid in kind
FS.7.2.2.1.4 - from NORAD bilateral aid in kind
FS.7.2.2.1.5 - from other bilateral aid in kind (Specify)
FS.7.2.2.2 Direct multilateral foreign aid in kind
FS.7.2.2.2.1 - from UNICEF aid in kind
FS.7.2.2.2.2 - from WHO aid in kind
FS.7.2.2.2.3 - from PAHO aid in kind
FS.7.2.2.2.4 - from other multilateral aid in kind GAVI Alliance
FS.7.2.2.3 Other direct foreign aid in kind
FS.7.2.2.3.1 - from BMGF aid in kind
FS.7.2.2.3.2 - from CHAI aid in kind
FS.7.2.2.3.3 - from Worldvision direct foreign aid in kind
FS.7.3 Other direct foreign transfers n.e.c
FS.7.9 Any other source not elsewhere classifiec (n.e.c)
FSR.1 Loans
FSR.1.1 Loans taken by government
FSR.1.1.1 Loans from international organizations
FSR.1.1.1.1 Concessional loans
FSR.1.1.1.2 Non-consessional loans
FSR.1.1.1.3 HIPC/Debt relief
FSR.1.1.2 Other loans taken by government
FS.RI.1 Institutional units providing revenues to financing schemes
FS.RI.1.1 Government
FS.RI.1.2 Corporations
FS.RI.1.3 Households
FS.RI.1.4 Non-profit institutions
FS.RI.1.5 Rest of the world
FS.RI.2 Total foreign revenues (FS.2 + FS.7)

DO NOT CIRCULATE OR QUOTE WITHOUT PERMISSION
116
A9 - Financing Agents Codes
FA.CODE FA.Description
FA.1 General Government
FA.1.1 Central Government Agencies
FA.1.1.1 Central Ministry of Health:
FA.1.1.1.1 Central Ministry of Health (DCD / EPI programme)
FA.1.1.1.2 Central Ministry of Health (other programmes)
FA.1.1.1.3 National Medical Stores / Central Cold Stores
FA.1.1.1.4 National Laboratories
FA.1.1.1.5 National Surveillance Agency
FA.1.1.2 Other Central Ministries and Units
FA.1.1.3 National Health Service Agency (GHS)
FA.1.1.4 National Health Insurance Agency
FA.1.2 State/Regional/Local Govt Agents
FA.1.2.1 Provincial Level Ministry of Health
FA.1.2.2 Other Provincial Level Ministries/Departments
FA.1.2.3 District Level Ministry of Health
FA.1.2.4 Other District Level Ministries/Departments
FA.1.3 Social Security Agency
FA.1.3.1 Social Health Insurance Agency
FA.1.3.2 Other social security agency
FA.1.9 All other general government unit
FA.2 Insurance Corporations
FA.3 Other Corporations /Business (other than insurance)
FA.4 Non-Profit Institutions Serving Households
FA.5 Households
FA.5.1 Community organizations/groups
FA.6 Rest of the World
FA.6.1 International Organisations (Multilaterals)
FA.6.1.1 UNICEF
FA.6.1.2 WHO
FA.6.1.3 PAHO
FA.6.1.4 Other multilateral agent 1
FA.6.1.5 Other multilateral agent 2
FA.6.1.6 Other multilateral agent 3
FA.6.2 Foreign Govts (Bilateral Agents)
FA.6.2.1 Govt of USA: PEPFAR, CDC, USAID etc
FA.6.2.2 Govt of United Kingdom:

DO NOT CIRCULATE OR QUOTE WITHOUT PERMISSION
117
FA.CODE FA.Description
FA.6.2.3 Govt of Japan (JICA):
FA.6.2.4 Govt of Norway (NORAD):
FA.6.2.5 Other bilateral agency 1
FA.6.2.6 Other bilateral agency 2
FA.6.2.7 Other bilateral agency 3
FA.6.3 Other Foreign Entities
FA.6.3.1 BMGF
FA.6.3.2 CHAI
FA.6.3.3 Other International Foundation 1
FA.6.3.4 Other International Foundation 2
FA.6.3.5 Other International Foundation 3
FA.9 Any other agents not else where classified A10 - Health financing mechanism codes
HF.CODE HF.Description HF.1 Government schemes and compulsory contributory health care
financing schemes
HF.1.1 Government schemes
HF.1.1.1 Central government schemes
HF.1.1.2 State/regional/local government schemes
HF.1.2 Compulsory contributory health insurance schemes
HF.1.2.1 Social health insurance
HF.1.3 Compulsory medical savings accounts
HF.2 Voluntary health care payment schemes (other than OOP)
HF.2.1 Voluntary health insurance schemes
HF.2.2 Non-profit institutions financing schemes (NPISH)
HF.3 Household out-of-pocket payment
HF.3.1 Community level financing
HF.4 Rest of the world
HF.99 Not disaggregated
A11 - Health Providers codes
HP.CODE HP.Description HP.1 Hospitals
HP.1.1 General hospitals
HP.1.1.1 General hospitals - public
HP.1.1.1.1 National general hospitals
HP.1.1.1.2 Provincial or regional general hospitals

DO NOT CIRCULATE OR QUOTE WITHOUT PERMISSION
118
HP.CODE HP.Description HP.1.1.1.3 District hospitals
HP.1.1.2 General hospitals - social security
HP.1.1.3 General hospitals - NGO/private non-profit
HP.3 Providers of ambulatory health care
HP.3.1 Medical practices
HP.3.4 Ambulatory health care centres
HP.3.4.9 All other ambulatory centres
HP3.4.9.1 Government facilities
HP.3.4.9.3.1 PHC Type 1 (Health Centre)
HP.3.4.9.3.2 PHC Type 2 (CHPS)
HP.3.4.9.3.3 PHC Type 3 ()
HP.3.4.9.3.4 PHC Type 4 (Specify)
HP.3.4.9.2 Social security facilities
HP.3.4.9.3 NGO facilities
HP.4 Providers of ancillary services
HP.4.2 Medical and diagnostic laboratories
HP.6 Providers of preventive care
HP.6.1 Country Specific Preventative providers
HP.6.2 Research Providers
HP.6.2.1 Public research institutions
HP.6.2.2 Para-statal (quazi-public) research institutions
HP.6.2.3 Private research institutions HP.7 Providers of health care system administration and financing
HP.7.1 Government health administrative agencies
HP.7.1.1 National MOH
HP.7.1.2 Provincial MOH
HP.7.1.3 District MOH HP.7.2 Social health insurance agencies
HP.7.3 Private health insurance administrative agencies
HP.7.9 Other administrative agencies
HP.8 Rest of the economy
HP8.1 Households as providers of home health care
HP.8.9 Other industries n.e.c
HP.9 Rest of the world
HP.99 Not classified elsewhere
A12 - Health Care Functions codes
HC.CODE HC.Description HC.1 Curative care

DO NOT CIRCULATE OR QUOTE WITHOUT PERMISSION
119
HC.CODE HC.Description HC.6 Preventive care
HC.6.1 Information, education and counseling programmes
HC.6.1.1 Social mobilization, advocacy
HC.6.2 Immunization programmes
HC.6.2.1 Facility-based routine immunization service delivery
HC.6.2.2 Outreach routine immunization service delivery
HC.6.2.3 Training
HC.6.2.4 Vaccine collection, storage and distribution
HC.6.2.5 Cold chain maintenance
HC.6.2.6 Supervision
HC.6.2.7 Program management
HC.6.2.8 Other routine immunization programme activity
HC.6.5 Surveillance
HC.6.5.1 EPI Surveillance
HC.6.6 Record-keeping and HMIS
HC.7 Governance and health system financing and administration
HC.99 Not disaggregated
HC.RI.3 Prevention and public health services
HC.RI.3.3 Prevention of communicable diseases

DO NOT CIRCULATE OR QUOTE WITHOUT PERMISSION
120
A13 - Health-Care Provisions
FP.CODE FP.Description FP.1 Compensation of employees
FP.1.1 Wages and salaries
FP.1.3 All other costs relating to employees
FP.1.3.1 Per diem
FP.2 Self-employed professional remuneration
FP.2.1 Volunteer labour
FP.3 Materials and services used
FP.3.1 Health care services
FP.3.2 Health care goods
FP.3.2.1 Pharmaceuticals
FP.3.2.1.1 Vaccines and other goods
FP.3.2.2 Other health care goods
FP.3.2.2.1 Injection supplies
FP.3.2.2.2 Other supplies
FP.3.3 Non-health care services
FP.3.3.1 Transport
FP.3.3.2 Maintenance
FP.3.3.3 Printing
FP.3.4 Non-health care goods
FP.3.4.1 Utilities and communications
FP.3.4.2 Other
FP.4 Consumption of fixed capital
FP.4.1 Cold chain equipment
FP.4.2 Vehicles
FP.4.3 Other equipment
FP.4.4 Buildings
FP.5 Other items of spending on inputs
FP.5.1
Taxes and customs duties
FP.5.2 Other
FP.99 Not disaggregated/n.e.c

DO NOT CIRCULATE OR QUOTE WITHOUT PERMISSION
121
A 14 – Economic and financial costs at facility level, by activity and facility type
Comparison of Economic and Financial Costs by Activity by Facility Type (USD, 2011)
Facility type \ Activity Economic Financial CHPS 12 778 USD 9 701 USD
Cold Chain Maintenance 291 USD 291 USD Other 667 USD 659 USD Outreach Service Delivery 2 574 USD 1 526 USD Program Management 121 USD 117 USD Record-Keeping & HMIS 1 920 USD 1 597 USD Routine Facility-based Service Delivery 2 098 USD 970 USD Social Mobilization & Advocacy 1 586 USD 1 309 USD Supervision 461 USD 447 USD Surveillance 1 991 USD 1 857 USD Training 250 USD 189 USD Vaccine Collection, Distribution, & Storage 818 USD 741 USD
Clinic 12 885 USD 10 056 USD Cold Chain Maintenance 157 USD 157 USD Other 31 USD 31 USD Outreach Service Delivery 3 434 USD 2 537 USD Program Management 159 USD 159 USD Record-Keeping & HMIS 1 399 USD 1 393 USD Routine Facility-based Service Delivery 2 862 USD 1 348 USD Social Mobilization & Advocacy 1 867 USD 1 725 USD Supervision 889 USD 871 USD Surveillance 1 069 USD 879 USD Training 233 USD 233 USD Vaccine Collection, Distribution, & Storage 785 USD 722 USD
Health Centre 22 989 USD 12 573 USD Cold Chain Maintenance 536 USD 536 USD Other 823 USD 722 USD Outreach Service Delivery 7 485 USD 1 596 USD Program Management 515 USD 514 USD Record-Keeping & HMIS 2 160 USD 2 123 USD Routine Facility-based Service Delivery 5 248 USD 2 223 USD Social Mobilization & Advocacy 1 729 USD 1 391 USD Supervision 701 USD 689 USD Surveillance 1 280 USD 822 USD Training 689 USD 679 USD Vaccine Collection, Distribution, & Storage 1 823 USD 1 276 USD
RCH 26 743 USD 15 755 USD Cold Chain Maintenance 246 USD 246 USD Other 16 USD 16 USD Outreach Service Delivery 5 428 USD 2 047 USD Program Management 597 USD 597 USD Record-Keeping & HMIS 4 271 USD 4 119 USD Routine Facility-based Service Delivery 12 341 USD 5 346 USD Social Mobilization & Advocacy 905 USD 680 USD Supervision 754 USD 754 USD Surveillance 1 369 USD 1 160 USD Training 344 USD 344 USD Vaccine Collection, Distribution, & Storage 471 USD 445 USD

DO NOT CIRCULATE OR QUOTE WITHOUT PERMISSION
122
A 15 – Nationwide economic total and unit costs by activity (US$, 2011)
Total costs by activity (Economic Costs USD, 2011)
Facilities District Health Administration
Regional Health Administration
Central EPI Total routine immunization costs
Percent Distribution
Cold chain maintenance 1 030 467 111 145 18 095 46 500 1 206 207 2,23% Other 1 745 983 409 273 61 020 15 971 2 232 246 4,18% Outreach service delivery 5 488 246 0 0 0 5 488 246 10,16% Program management 809 867 880 277 158 973 102 229 1 951 346 3,80% Record-keeping & HMIS 6 107 476 453 237 39 322 13 545 6 613 579 12,25% Routine facility-based service delivery 5 570 428 0 0 0 5 570 428 10,32% Social mobilization & advocacy 5 012 898 559 570 45 543 156 756 5 774 767 11,04% Supervision 1 887 611 678 372 101 658 72 534 2 740 174 5,10% Surveillance 4 844 307 807 339 78 979 8 905 5 739 530 10,70% Training 1 161 962 255 951 76 375 19 790 1 514 078 3,03% Vaccine collection, distribution, & storage 3 335 341 653 302 348 618 10 324 422 14 661 68414 27,19% Total 36 994
586 4 808 465.51 928 582 10 760 651 53 492 285 100%
14 Includes vaccines and Injection supplies

DO NOT CIRCULATE OR QUOTE WITHOUT PERMISSION
123
Cost per routine dose administered by activity (USD, 2011)
Facilities District Health Administration
Regional Health Administration
Central EPI Total routine immunization costs
Cold Chain Maintenance 0,11 0,01 0,00 0,00 0,13 Other 0,18 0,04 0,01 0,00 0,24 Outreach Service Delivery 0,58 0,00 0,00 0,00 0,58 Program Management 0,09 0,09 0,02 0,01 0,21 Record-Keeping & HMIS 0,65 0,05 0,00 0,00 0,70 Routine Facility-based Service Delivery 0,59 0,00 0,00 0,00 0,59 Social Mobilization & Advocacy 0,53 0,06 0,00 0,02 0,61 Supervision 0,20 0,07 0,01 0,01 0,29 Surveillance 0,51 0,09 0,01 0,00 0,61 Training 0,12 0,03 0,01 0,00 0,16 Vaccine Collection, Distribution, & Storage
0,35 0,07 0,04 1,09 1,55
Total per routine dose administered 3,91 0.51 0,10 1,14 5,65

DO NOT CIRCULATE OR QUOTE WITHOUT PERMISSION
124
Cost per fully immunized child (DTP-HepB-Hib) by activity (USD, 2011)
Facilities District Health Administration
Regional Health Administration
Central EPI Total routine immunization costs
Cold Chain Maintenance 1,16 0,13 0,02 0,05 1,36 Other 1,97 0,46 0,07 0,02 2,52 Outreach Service Delivery 6,19 0,00 0,00 0,00 6,19 Program Management 0,91 0,99 0,18 0,12 2,20 Record-Keeping & HMIS 6,88 0,51 0,04 0,02 7,46 Routine Facility-based Service Delivery
6,28 0,00 0,00 0,00 6,28
Social Mobilization & Advocacy 5,65 0,63 0,05 0,18 6,51 Supervision 2,13 0,76 0,11 0,08 3,09 Surveillance 5,46 0,91 0,09 0,01 6,47 Training 1,31 0,29 0,09 0,02 1,71 Vaccine Collection, Distribution, & Storage
3,76 0,74 0,39 11,64 16,53
Total per FIC 41,70 5,42 1,05 12,13 60,30

DO NOT CIRCULATE OR QUOTE WITHOUT PERMISSION
125
A16 - Funding Sources to Health-Care Functions in 2011 25.82% of the funds are spent for vaccine collection, distribution and storage. This activity is supported by GAVI at 67.03% (through in-kind). 31.98% of this activity is supported by domestic funding. External financial support is also provided by USAID for this activity to a minor extent (0.77%). 10.49% of the funds spent for routine immunization could not be disaggregated by health care function. WHO mostly supports surveillance (39% of WHO support), program management (20%) and training (18.56%).

DO NOT CIRCULATE OR QUOTE WITHOUT PERMISSION
126
Financing sources (FS) to health care functions (HC) (USD, 2011)
Soc.Mob. Imm° Prog F-based Outreach Training Vacc C°D°St ColdCh.M Supervis° Prog.Mgt Other Surveill. Rec.Keep n.d
HC.6.1.1 HC.6.2 HC.6.2.1 HC.6.2.2 HC.6.2.3 HC.6.2.4 HC.6.2.5 HC.6.2.6 HC.6.2.7 HC.6.2.8 HC.6.5.1 HC.6.6 HC.99 Total
Transfers from government domestic revenue
Internal transfers 4 469 607 4 857 790 4 773 351 1 403 900 1 627 661 1 163 061 1 932 962 1 213 370 1 407 028 3 951 292 6 037 258 32 837 279
Central transfers 112 214 2 542 471 14 686 2 669 372
Within local 24 799 24 799
Regional transfer 3 153 588 627 052 46 445 3 827 085
Transfers distributed by Government from foreign origin
USAID 100 315 100 315
UNICEF 167 811 900 168 711
WHO 7 609 0 42 870 16 318 20 236 46 193 90157 7 609 230 990
GAVI 709 284 709 284
Social Insurance contribution and compulsory prepayment
Insurance 925 335 925 335
User fees 114 869 114 869
Direct foreign transfers
WHO 22 397 29 029 51 426
UNICEF 64 617 64 617
GAVI 8 740 169 8 740 169
World Vision 30 632 30 632
Total 4 477 216 5 294 914 5 484 841 4 773 351 1 523 846 13 039 645 1 180 279 1 953 198 1 259 563 1 407 028 4 041 449 6 037 258 22 295 494 3

DO NOT CIRCULATE OR QUOTE WITHOUT PERMISSION
127
A 17 - Funding Sources to Health-Care Provisions in 2011 Wages and salaries represent 65.03% of total funds spent for routine immunization and are entirely paid for by central government. Vaccines and supplies capture 22.34% of the expenses, and are supported by GAVI and Central MOH. 11.17% of the funds spent could not be disaggregated by health care provision (line item) due to the absence of systematic disaggregated financial data at sub national levels. Cold chain equipment is supported by UNICEF and USAID and represents 0.26% of total spending. Taxes and custom duties account for 0.22% of total funds spent and are exclusively paid by central government. Per diems represent 0.20% and are supported by local government (district, province) and WHO. 0.19% of funds spent can be allocated to transport/fuel expenses, mostly supported by district administration and WHO, to a minor extent. Vehicles purchase accounts for 0.17% and was supported by GAVI. 0.06% of funds spent is attributable to utilities & communication and are supported evenly by central MOH and WHO.

DO NOT CIRCULATE OR QUOTE WITHOUT PERMISSION
128
Financing sources (FS) to health care provision (FP) in 2011
Internal Transfer
Within Central
Within local
Grants From Region Local
USAID (dist by Gvt) UNICEF WHO GAVI Insur
User Fees
UNICEF In-kind
WHO In-kind
GAVI In-kind
World Vision In-kind
FS.1.1 FS.1.1.1 FS.1.1.2 FS.1.1.4 FS.2.1.1.1 FS.2.1.2.1 FS.2.1.2.2 FS.2.1.3 FS.3 FS.4.1 FS.7.2.2.2.1 FS.7.2.2.2.2 FS.7.2.2.2.4 FS.7.2.2.3.3 Total Cold chain equipment 100 315 900 29 029 130 244 Not disaggregated /n.e.c 24 799 3 678 636 167 811 143 958 552 535 925 335 114 869 30 632 5 638 576
Other 19 183 19 183
Other equipment 70 290 70 290
Per diem 46 445 57 012 103 457 Taxes and customs duties 112 214 112 214
Transport 82 821 13 702 96 523 Utilities and communications 14 686 16 318 31 005 Vaccines and other goods 2 542 471 8 740 169 11 282 640
Vehicles 86 459 86 459
Wages and salaries 32 837 279 22 397 64 617 32 924 293
Total 32 837 279 2 669 372 24 799 3 827 085 100 315 168 711 230 990 709 284 925 335 114 869 51 426 64 617 8 740 169 30 632 50 494 883

DO NOT CIRCULATE OR QUOTE WITHOUT PERMISSION
129
A18 - Funding sources to Financing Agents in 2010 The funding received for routine immunization represents 41.81 million USD in 2010. It is mostly provided through domestic sources that accounts for 91.87% of the support. Transfers from domestic revenues are mostly channeled through central MOH. Regional transfers to District Health Administrations represent 6.28% of total support. Out of pocket payments are marginal with 0.30% of total support. External funding sources represent 8.13% of the funding received. Most of the external financing is provided by GAVI Alliance New Vaccine Support (5.51%) through vaccines and supplies distributed by UNICEF supply division. External financial support distributed by Government are provided by GAVI Alliance (0.45 million USD), WHO (0.45 million USD), UNICEF (0.06 million USD). GAVI support is channeled through the Ghana Health Service and part of GAVI support is directly disbursed to District Health Administration. Minor in-kind support is provided by UNICEF (0.06%), WHO (0.17%) and World vision (0.09%).

DO NOT CIRCULATE OR QUOTE WITHOUT PERMISSION
130
Funding sources (FS) to financing agents (FA) (USD, 2010)
EPI program
Central Ministry of Health (other program
Central Ministry of Health:
Community organizations
District Level Ministry of Health
(GHS)
National Laboratories
Central Cold Stores
Local Govt Agents UNICEF WHO Total
Transfers from government domestic revenue
FS.1.1 33 323 010 33 323 010
FS.1.1.1 14 073 80 897 2 145 658 2 240 629
FS.1.1.3 84 013 84 013
FS.1.1.4 2 627 563 2 627 563
FS.1.4 12 329 12 329
Transfers distributed by Government from foreign origin
FS.2.1.2.1 62 062 62 062
FS.2.1.2.2 255 971 24 859 4 886 31 790 4 886 126 460 448 853
FS.2.1.3 20 942 79 013 353 249 453 204
Social Insurance contribution and compulsory prepayment
FS.4.1 123 830 123 830
Direct foreign transfers
FS.7.2.2.2.1 24 144 24 144
FS.7.2.2.2.2 69 657 69 657
FS.7.2.2.2.4 2 303 993 2 303 993
FS.7.2.2.3.3 36 984 36 984

DO NOT CIRCULATE OR QUOTE WITHOUT PERMISSION
131
Total 353 048 24 859 33 403 907 4 886 2 963 732 385 039 4 886
4 449 651 126 460 24 144
69 657
41 10 270
A19 - Financing Agents to Health-Care Providers in 2010 Most of funds spent for routine immunization are executed by central level. Central MOH executes 81.31% of expenditures (mostly driven by salaries). The funds executed at district level account for 6.22% of total spending.
Financing agents to health-care provider (USD, 2010) Central Ministry of Health / DCD / EPI program
Central Ministry of Health:
Community organizations/groups
District Level Ministry of Health
National Health Service Agency (GHS)
National Laboratories
National Medical Stores / Central Cold Stores
State/Regional/ Local Govt Agents UNICEF WHO Total
Ambulatory health care centers
32 621 758 4 886
32 626 645
District MOH 428 133 2 557 199
2 985 332
Hospitals 0 0
National MOH 187 405 217 389 297 278 4 845 4 449 651
5 156 568
Providers of health care system administration and financing 55 845 55 845
Provincial MOH 136 627 6 879 143 507 Public research institutions 19 228 19 228
Rest of the world 24 144 69 657 93 801
Total 187 405 33 403 4 886 2 557 297 278 4 845 4 449 81 952 24 144 69 41 080

DO NOT CIRCULATE OR QUOTE WITHOUT PERMISSION
132
907 199 651 657 925

DO NOT CIRCULATE OR QUOTE WITHOUT PERMISSION
133
A20 - Financing Agents to Health Care Financing Mechanisms in 2010 Central government schemes represent 93.29% of total funds spent, executed mainly by central MOH and Central Cold Stores. Service delivery and financing being decentralized at district level; this level captures the four different financing schemes. 93.44% of district administration spending is provided through sub national (regions) government schemes in 2010.
Financing Agents to health care financing mechanism (USD, 2010) EPI program
Central Ministry of Health:
Community organizations/groups
District Level Ministry of Health
(GHS)
National Laboratories
National Medical Stores / Central Cold Stores
State/Regional/Local Govt Agents
UNICEF
WHO Total
Central government schemes
161 228 33 403 907 6 963
297 278 4 845 4 449 651
38 323 872
Community level financing 123 830
123 830
Rest of the world 26 177 36 984 24 144
69 657
156 962
State/regional/local government schemes 4 886 2 389 423 81 952
2 476 262
Total 187 405 33 403 907 4 886 2 557 199
297 278 4 845 4 449 651 81 952
24 144
69 657
41 080 925

DO NOT CIRCULATE OR QUOTE WITHOUT PERMISSION
134
A 21 - Funding Sources to Health-Care Functions in 2010 14.90% of the funds are spent for vaccine collection, distribution and storage. This activity is supported by GAVI and by domestic funding. 5.38% of the funds spent for routine immunization could not be disaggregated by health care function.
Funding sources to health care function (USD, 2010)
Internal Transfers from Government domestic revenue Financial donors
In-kind from donors
Int. Transf.
Central Gvt
Grants
Local Gvt
other
UNICEF WHO GAVI
User fees UNICEF WHO GAVI
World Vision
FS.1.1 FS.1.1.1
FS.1.1.3
FS.1.1.4
FS.1.4
FS.2.1.2.1
FS.2.1.2.2
FS.2.1.3 FS.4.1
FS.7.2.2.2.1
FS.7.2.2.2.2
FS.7.2.2.2.4
FS.7.2.2.3.3 Total
HC.6.1.1
4 597 953 4 886
4 602 840
HC.6.2 94 970
84 013
1 466 684
12 329 0 0
321 169
123 830 24 144 69 657 36 984
2 233 780
HC.6.2.1
5 241 933 470 965
5 712 898
HC.6.2.2
5 150 817
5 150 817
HC.6.2.3
1 184 903 308 766 26 275 48 093
1 568 038
HC.6.2.4
1 672 383
2 145 658
2 303 993
6 122 034
HC.6.2.5
1 145 561 1 300
1 146 861
HC.6.2.6
1 885 666 3 474 33 925
13 765
1 936 831
HC.6.2.7 992 169 26 177
1 018 346
HC.6.2.8
1 375 679 0
1 375 679

DO NOT CIRCULATE OR QUOTE WITHOUT PERMISSION
135
HC.6.5.1
4 014 644 30 952
4 045 596
HC.6.6
6 061 302
105 904
6 167 206
Total 33 323 010
2 240 629
84 013
2 246 415
12 329 57 227
223 761
334 934
123 830 24 144 69 657
2 303 993 36 984
41 080 925

DO NOT CIRCULATE OR QUOTE WITHOUT PERMISSION
136
A 22 - Funding Sources to Health-Care Provisions in 2010 Wages and salaries represent 81.34% of total funds spent for routine immunization in 2010 and are entirely paid for by central government. Vaccines and supplies capture 10.83% of the expenses, and are supported by GAVI and Central MOH. 6.59% of the funds spent could not be disaggregated by health care provision (line item) due to the absence of systematic disaggregated financial data at sub national levels. Cold chain equipment is supported by GAVI and represents 0.34% of total spending. Taxes and custom duties account for 0.21% of total funds spent and are exclusively paid by central government. Per diems represent 0.40% and are supported by local government (district, province), UNICEF, WHO and GAVI. 0.17% of funds spent can be allocated to transport/fuel expenses, mostly supported by district administration and WHO, to a minor extent. 0.03% of funds spent are attributable to utilities and communication supported evenly by central MOH and WHO.

DO NOT CIRCULATE OR QUOTE WITHOUT PERMISSION
137
A23 - total cost by facility (USD, 2011) Facility Name Area Type Total cost (USD)
adomfe CHPS rural 6 463,42 USD afiaman Clinic rural 8 560,88 USD akramaman CHPS rural 6 755,76 USD anglican Health Centre rural 24 286,60 USD ashyiresu CHPS rural 19 167,05 USD bamahu Health Centre rural 39 683,04 USD banka Health Centre rural 11 163,67 USD bayerebon Health Centre rural 27 926,71 USD bimbagu CHPS rural 29 660,44 USD biu Clinic rural 11 725,68 USD boli CHPS rural 10 135,88 USD bunkpurugu Health Centre rural 29 059,83 USD charingu Health Centre rural 17 076,66 USD doba CHPS rural 15 860,06 USD dondoli CHPS rural 15 500,13 USD dwendwenase Health Centre rural 8 934,91 USD ga_west_dh_rch RCH Urban 64 553,54 USD gbegru CHPS rural 13 273,09 USD gia CHPS rural 14 214,75 USD gongnia CHPS rural 6 116,24 USD gyereso Health Centre rural 22 328,66 USD juaso RCH urban 13 755,04 USD kambagu CHPS rural 4 337,55 USD kambali Health Centre rural 29 952,10 USD kojo_ashong Clinic Urban 2 836,84 USD kolongo Health Centre Rural 15 335,48 USD konta_north Clinic Rural 19 384,33 USD kperisi CHPS Rural 10 996,23 USD kumbiehi CHPS Rural 7 677,13 USD kyempo Clinic Rural 4 413,81 USD mayera Clinic Urban 14 721,13 USD nachanta CHPS rural 4 467,73 USD nakpanduri Health Centre rural 38 921,29 USD nasua Health Centre Urban 44 843,72 USD navrongo Health Centre Urban 13 574,57 USD nayagnia CHPS rural 8 989,84 USD nnadieso Health Centre urban 12 193,97 USD nsakina CHPS rural 3 281,81 USD nyinahin RCH urban 20 978,35 USD oduman Clinic rural 20 509,00 USD ofoase Health Centre rural 10 648,79 USD piisi CHPS rural 5 922,63 USD pokuase CHPS urban 11 016,83 USD saint_peters Clinic rural 30 398,28 USD vunania CHPS rural 9 986,83 USD wa_market RCH urban 17 997,41 USD wa_urban Clinic Urban 58 988,89 USD war_memorial Health Centre rural 10 243,94 USD wuru CHPS rural 33 813,36 USD

DO NOT CIRCULATE OR QUOTE WITHOUT PERMISSION
138
Facility Name Area Type Total cost (USD)
yunyoo Health Centre rural 36 506,41 USD

DO NOT CIRCULATE OR QUOTE WITHOUT PERMISSION
139
A24 - Distribution of total cost by activity for each facility
Facility Name Tot
al
Cos
t (U
SD
)
Col
d C
hain
M
aint
enan
ce
Oth
er
Out
reac
h S
ervi
ce
Del
iver
y
Pro
gram
M
anag
emen
t
Rec
ord-
Kee
ping
&
H
MIS
R
outin
e F
acili
ty-b
ased
S
ervi
ce
Del
iver
y
Soc
ial
Mob
iliza
tion
&
Adv
ocac
y
Sup
ervi
sion
Sur
veill
ance
Tra
inin
g
Vac
cine
C
olle
ctio
n
adomfe 9 991 1,89% 0,42% 40,05% 0,73% 8,87% 27,32% 1,95% 5,20% 8,82% 1,20% 3,55% afiaman 13 234 0,00% 0,00% 45,92% 0,00% 3,93% 2,61% 45,11% 0,00% 0,19% 0,06% 2,17% akramaman 10 443 1,80% 1,13% 21,79% 0,28% 16,92% 7,93% 10,50% 6,20% 14,88% 2,77% 15,78% anglican 37 543 1,67% 0,14% 26,34% 0,00% 12,77% 12,12% 27,25% 2,26% 2,52% 0,28% 14,66% ashyiresu 29 629 5,03% 1,55% 17,49% 1,75% 18,44% 4,76% 36,46% 0,00% 9,40% 1,02% 4,09% bamahu 61 343 0,26% 0,69% 19,05% 1,21% 16,94% 15,63% 30,69% 4,87% 8,08% 0,51% 2,07% banka 17 257 0,91% 9,68% 46,64% 0,27% 3,03% 19,03% 1,98% 2,34% 7,13% 1,86% 7,13% bayerebon 43 170 5,69% 0,90% 18,60% 5,69% 2,30% 24,31% 3,56% 5,69% 4,45% 14,66% 14,16% bimbagu 45 850 3,22% 34,35% 20,05% 0,53% 1,24% 8,36% 0,63% 1,02% 26,22% 2,62% 1,75% biu 18 126 3,36% 1,46% 12,79% 1,20% 12,71% 17,20% 13,89% 3,72% 22,31% 2,16% 9,19% boli 15 668 0,00% 0,01% 8,17% 0,00% 66,10% 0,00% 0,95% 2,88% 16,73% 1,80% 3,36% bunkpurugu 44 921 2,75% 13,88% 63,06% 3,03% 5,88% 1,65% 3,34% 0,00% 4,19% 0,00% 2,22% charingu 26 398 1,88% 1,53% 19,76% 2,80% 22,80% 8,96% 18,39% 5,01% 10,44% 1,34% 7,08% doba 24 517 1,73% 0,04% 17,29% 0,21% 15,53% 17,16% 11,15% 7,57% 12,00% 3,15% 14,17% dondoli 23 960 0,00% 0,00% 10,26% 2,81% 30,96% 0,00% 20,39% 0,00% 28,04% 0,17% 7,36% dwendwenase 13 812 2,42% 0,45% 42,54% 0,72% 6,98% 30,34% 2,65% 1,76% 4,83% 3,78% 3,53% ga_west_dh_rch 99 789 0,22% 0,00% 0,00% 3,69% 26,70% 61,92% 3,51% 1,62% 0,96% 0,75% 0,63% gbegru 20 518 1,87% 0,00% 16,34% 0,00% 17,00% 0,00% 47,25% 0,00% 16,41% 0,40% 0,73% gia 21 974 4,68% 0,01% 13,35% 1,20% 17,78% 15,17% 14,11% 3,75% 19,40% 2,94% 7,63% gongnia 9 455 2,74% 0,34% 10,28% 0,00% 8,18% 30,78% 15,60% 0,00% 19,84% 2,98% 9,25% gyereso 34 516 2,71% 0,15% 27,59% 6,03% 3,62% 26,85% 18,84% 4,82% 4,40% 0,87% 4,10% juaso 21 263 2,45% 0,39% 27,83% 0,73% 10,45% 44,62% 2,19% 0,00% 3,53% 2,94% 4,88% kambagu 6 705 0,00% 0,03% 11,94% 14,12% 8,28% 3,09% 19,99% 4,25% 15,98% 0,85% 21,46% kambali 46 301 0,22% 1,89% 17,24% 7,27% 22,21% 25,94% 1,34% 8,05% 13,44% 1,34% 1,07% kojo_ashong 4 385 0,00% 0,96% 8,59% 2,15% 42,96% 17,20% 0,82% 0,00% 18,42% 0,00% 8,91% kolongo 23 706 3,83% 0,01% 30,12% 0,20% 6,20% 25,83% 10,33% 2,01% 15,88% 2,25% 3,33% konta_north 29 965 0,00% 0,07% 7,96% 1,03% 17,64% 10,48% 36,00% 9,97% 10,92% 0,90% 5,04% kperisi 16 998 4,99% 4,74% 43,98% 0,00% 21,89% 0,28% 9,90% 0,00% 10,66% 0,98% 2,57% kumbiehi 11 868 0,00% 3,72% 13,30% 0,01% 23,69% 6,36% 2,78% 0,00% 47,11% 0,61% 2,42%

DO NOT CIRCULATE OR QUOTE WITHOUT PERMISSION
140
Facility Name Tot
al
Cos
t (U
SD
)
Col
d C
hain
M
aint
enan
ce
Oth
er
Out
reac
h S
ervi
ce
Del
iver
y
Pro
gram
M
anag
emen
t
Rec
ord-
Kee
ping
&
H
MIS
R
outin
e F
acili
ty-b
ased
S
ervi
ce
Del
iver
y
Soc
ial
Mob
iliza
tion
&
Adv
ocac
y
Sup
ervi
sion
Sur
veill
ance
Tra
inin
g
Vac
cine
C
olle
ctio
n
kyempo 6 823 3,60% 0,62% 18,19% 1,07% 10,39% 26,67% 6,09% 5,91% 12,08% 4,33% 11,05% mayera 22 756 3,49% 0,01% 26,40% 0,84% 9,83% 10,72% 6,95% 12,16% 16,77% 2,95% 9,88% nachanta 6 906 0,00% 1,14% 7,50% 0,00% 28,62% 0,01% 10,36% 39,59% 9,44% 0,00% 3,35% nakpanduri 60 166 1,30% 0,85% 16,20% 0,51% 0,39% 29,04% 2,13% 0,06% 1,09% 0,68% 47,75% nasua 69 321 5,25% 23,83% 43,58% 0,03% 0,44% 18,58% 0,97% 0,58% 3,27% 1,46% 2,01% navrongo 20 984 0,73% 0,00% 5,32% 0,43% 3,80% 54,55% 7,44% 0,92% 10,94% 2,97% 12,91% nayagnia 13 897 2,33% 0,01% 8,07% 0,68% 4,66% 15,84% 28,24% 6,21% 16,16% 7,68% 10,12% nnadieso 18 850 2,35% 0,22% 41,19% 0,68% 16,98% 22,45% 1,70% 1,03% 7,70% 0,64% 5,07% nsakina 5 073 9,68% 0,04% 61,00% 2,93% 2,93% 10,70% 2,92% 1,06% 5,82% 0,00% 2,92% nyinahin 32 429 1,54% 0,01% 28,55% 1,68% 14,82% 26,49% 7,77% 6,41% 11,06% 1,44% 0,24% oduman 31 703 0,19% 0,07% 34,07% 0,59% 0,79% 42,43% 6,16% 9,51% 1,90% 0,39% 3,89% ofoase 16 461 2,40% 0,50% 27,78% 0,72% 8,67% 33,94% 2,67% 4,87% 6,05% 5,41% 7,00% piisi 9 155 0,00% 0,39% 10,98% 0,00% 18,97% 3,05% 14,34% 4,46% 47,47% 0,33% 0,00% pokuase 17 030 5,20% 0,00% 60,59% 4,68% 17,33% 0,13% 0,78% 0,73% 9,38% 0,00% 1,19% saint_peters 46 990 0,72% 0,28% 53,04% 4,49% 4,49% 8,38% 11,47% 0,12% 4,74% 4,49% 7,78% vunania 15 438 4,48% 4,82% 11,58% 0,20% 11,72% 17,38% 14,77% 4,02% 10,60% 3,47% 16,98% wa_market 27 821 1,19% 0,01% 0,00% 0,00% 30,54% 35,85% 7,62% 12,96% 7,36% 0,80% 3,69% wa_urban 91 187 0,49% 0,02% 12,82% 0,51% 27,18% 43,57% 2,38% 3,35% 5,99% 2,79% 0,89% war_memorial 15 835 1,47% 0,00% 12,35% 3,06% 8,90% 37,20% 1,53% 8,39% 18,34% 2,34% 6,41% wuru 52 270 0,07% 0,00% 27,71% 0,13% 11,11% 44,54% 2,77% 4,98% 3,39% 0,75% 4,54% yunyoo 56 433 1,83% 0,00% 72,27% 1,73% 10,89% 2,93% 3,43% 1,82% 1,98% 0,55% 2,56%

DO NOT CIRCULATE OR QUOTE WITHOUT PERMISSION
141
A25- Distribution of total cost by line item for each activity
Facility name Tot
al C
ost (
US
D)
Bui
ldin
g ov
erhe
ad,
Util
ities
, C
omm
unic
atio
n
Bui
ldin
gs
Col
d C
hain
E
quip
men
t P
er
Die
m
&
Tra
vel
Allo
wan
ces
Sal
arie
d La
bor
Tra
nspo
rt/F
uel
Vac
cine
s
Veh
icle
s
Vol
unte
er L
abor
adomfe 9 991 0,00% 0,03% 0,00% 1,62% 71,94% 8,05% 9,29% 6,86% 2,21% afiaman 13 234 0,00% 0,00% 0,10% 0,00% 91,68% 8,22% 0,00% 0,00% 0,00% akramaman 10 443 0,00% 0,00% 1,76% 0,00% 80,00% 5,52% 6,02% 4,69% 2,01% anglican 37 543 0,09% 0,07% 3,00% 0,08% 61,31% 2,45% 30,90% 2,09% 0,00% ashyiresu 29 629 0,36% 1,80% 0,93% 0,07% 80,69% 0,50% 0,00% 0,66% 15,00% bamahu 61 343 0,00% 0,29% 1,54% 0,01% 81,24% 1,69% 11,44% 1,44% 2,35% banka 17 257 0,00% 2,25% 5,23% 0,24% 22,56% 7,57% 49,07% 10,52% 2,56% bayerebon 43 170 0,90% 0,42% 2,22% 0,00% 59,83% 1,55% 21,25% 2,27% 11,56% bimbagu 45 850 0,01% 2,86% 0,56% 0,02% 72,24% 0,60% 14,42% 5,13% 4,15% biu 18 126 0,00% 0,04% 3,05% 0,45% 64,99% 0,05% 5,68% 2,16% 23,58% boli 15 668 0,00% 0,00% 0,00% 0,08% 88,72% 6,62% 0,00% 3,66% 0,92% bunkpurugu 44 921 2,68% 0,29% 1,79% 0,00% 25,73% 2,22% 54,81% 8,98% 3,50% charingu 26 398 0,00% 0,00% 4,62% 0,01% 75,88% 3,89% 7,38% 3,31% 4,91% doba 24 517 0,00% 3,89% 3,04% 0,25% 80,11% 1,88% 9,00% 0,00% 1,84% dondoli 23 960 0,00% 0,00% 0,00% 0,00% 90,19% 4,33% 0,00% 3,68% 1,80% dwendwenase 13 812 0,00% 0,82% 1,87% 1,32% 48,19% 1,67% 40,91% 1,42% 3,80% ga_west_dh_rch 99 789 0,00% 0,23% 0,00% 0,05% 65,28% 0,00% 34,44% 0,00% 0,00% gbegru 20 518 0,00% 0,00% 0,46% 0,05% 84,96% 5,00% 0,00% 4,26% 5,26% gia 21 974 0,00% 0,04% 0,00% 0,01% 83,25% 2,36% 4,11% 0,00% 10,24% gongnia 9 455 0,32% 21,87% 0,19% 0,02% 73,59% 0,91% 0,00% 0,77% 2,33% gyereso 34 516 0,09% 0,07% 2,88% 0,09% 58,31% 2,67% 33,62% 2,27% 0,00% juaso 21 263 0,00% 0,00% 3,46% 0,39% 45,36% 0,00% 48,42% 0,00% 2,37% kambagu 6 705 0,00% 0,02% 0,00% 0,10% 66,34% 12,03% 0,00% 10,24% 11,27% kambali 46 301 0,00% 0,11% 0,44% 0,83% 93,86% 2,24% 0,00% 1,91% 0,62% kojo_ashong 4 385 0,00% 0,01% 0,31% 0,96% 96,66% 0,00% 0,00% 0,00% 2,05% kolongo 23 706 0,00% 0,00% 2,24% 0,02% 40,52% 0,00% 42,99% 0,00% 14,24% konta_north 29 965 0,00% 0,00% 0,00% 0,27% 92,20% 3,46% 0,00% 2,95% 1,12% kperisi 16 998 0,00% 0,00% 0,50% 0,35% 73,51% 6,10% 15,08% 3,38% 1,09% kumbiehi 11 868 0,00% 0,00% 0,00% 0,34% 80,37% 9,31% 0,00% 5,13% 4,85%

DO NOT CIRCULATE OR QUOTE WITHOUT PERMISSION
142
Facility name Tot
al C
ost (
US
D)
Bui
ldin
g ov
erhe
ad,
Util
ities
, C
omm
unic
atio
n
Bui
ldin
gs
Col
d C
hain
E
quip
men
t P
er
Die
m
&
Tra
vel
Allo
wan
ces
Sal
arie
d La
bor
Tra
nspo
rt/F
uel
Vac
cine
s
Veh
icle
s
Vol
unte
er L
abor
kyempo 6 823 0,00% 0,01% 0,00% 0,62% 70,33% 11,70% 0,00% 9,96% 7,39% mayera 22 756 0,00% 0,06% 0,00% 0,01% 82,70% 0,00% 17,19% 0,00% 0,04% nachanta 6 906 0,00% 0,01% 0,00% 0,03% 59,19% 15,01% 0,00% 12,78% 12,98% nakpanduri 60 166 0,84% 0,44% 0,37% 0,00% 9,29% 0,00% 39,27% 48,05%15 1,74% nasua 69 321 0,00% 17,93% 0,29% 0,06% 34,05% 0,03% 38,01% 5,66% 3,98% navrongo 20 984 0,00% 5,91% 6,49% 0,00% 25,10% 0,00% 48,76% 0,22% 13,51% nayagnia 13 897 0,00% 5,89% 2,94% 0,23% 51,74% 0,00% 11,99% 0,00% 27,20% nnadieso 18 850 0,00% 0,00% 0,77% 0,86% 75,80% 4,28% 12,64% 3,64% 2,01% nsakina 5 073 0,00% 0,00% 0,00% 0,04% 97,12% 2,84% 0,00% 0,00% 0,00% nyinahin 32 429 0,00% 0,00% 0,00% 0,01% 84,54% 3,55% 0,00% 3,02% 8,88% oduman 31 703 0,04% 1,51% 1,31% 0,13% 46,03% 0,00% 50,99% 0,00% 0,00% ofoase 16 461 0,00% 0,71% 5,31% 0,50% 48,36% 4,90% 36,78% 0,00% 3,44% piisi 9 155 0,00% 0,00% 0,00% 0,02% 77,67% 11,32% 0,00% 6,27% 4,72% pokuase 17 030 0,00% 0,00% 0,67% 0,00% 57,69% 0,00% 41,65% 0,00% 0,00% saint_peters 46 990 0,26% 0,00% 2,11% 0,03% 94,79% 0,16% 0,00% 2,15% 0,51% vunania 15 438 0,00% 0,02% 5,40% 0,00% 93,56% 0,00% 0,00% 0,00% 1,02% wa_market 27 821 0,00% 0,00% 0,86% 0,01% 77,44% 0,00% 21,70% 0,00% 0,00% wa_urban 91 187 0,00% 0,00% 0,26% 2,76% 46,55% 1,20% 45,06% 0,66% 3,50% war_memorial 15 835 0,00% 0,00% 0,52% 0,05% 74,58% 0,00% 24,84% 0,00% 0,00% wuru 52 270 0,00% 0,01% 1,03% 0,00% 42,68% 0,00% 49,38% 0,00% 6,89% yunyoo 56 433 0,00% 0,23% 1,81% 0,00% 26,58% 1,63% 67,33% 1,39% 1,02%
15 High share of vehicles is explained by 2 pick up to collect vaccines and distribute to other facilities + one motrocylce for other routine activities. Most facilities rely on one
motorcycle only or sometimes do not have any vehicles and use taxi/public transportation.

DO NOT CIRCULATE OR QUOTE WITHOUT PERMISSION
143
A26 – District costs and distribution by activity
Tot
al C
ost (
US
D)
Col
d C
hain
M
aint
enan
ce
Oth
er
Out
reac
h S
ervi
ce
Del
iver
y
Pro
gram
Man
agem
ent
Rec
ord-
Kee
ping
&
H
MIS
Rou
tine
Fac
ility
-bas
ed
Ser
vice
Del
iver
y
Soc
ial
Mob
iliza
tion
&
Adv
ocac
y
Sup
ervi
sion
Sur
veill
ance
Tra
inin
g
Vac
cine
C
olle
ctio
n,
Dis
trib
utio
n, &
Sto
rage
asante_akim_south_dha 16 554 1,11% 8,06% 0,00% 7,40% 5,99% 0,00% 2,02% 10,24% 41,41% 12,44% 11,32% atwima_mponua_dha 44 663 2,93% 18,25% 0,00% 32,86% 4,90% 0,00% 4,34% 2,34% 16,41% 8,95% 9,02% bunkpurugu_yunyoo_dha 12 067 1,33% 4,96% 0,00% 25,01% 2,52% 0,00% 3,39% 5,45% 22,18% 0,00% 35,17% ga_west_dha 24 639 2,15% 12,29% 0,00% 3,46% 30,69% 0,00% 1,72% 9,71% 29,82% 1,91% 8,24% kassena_nankana_dha 18 973 2,07% 2,33% 0,00% 33,11% 2,73% 0,00% 11,67% 4,67% 8,46% 1,64% 33,34% wa_municipal_dha 50 425 3,70% 2,76% 0,00% 7,26% 17,77% 0,00% 39,31% 10,68% 6,50% 4,40% 7,63%

DO NOT CIRCULATE OR QUOTE WITHOUT PERMISSION
144
A27- Region costs distribution by activity
Tot
al C
ost
Col
d C
hain
M
aint
enan
ce
Oth
er
Pro
gram
Man
agem
ent
Rec
ord-
Kee
ping
&
H
MIS
Soc
ial
Mob
iliza
tion
&
Adv
ocac
y
Sup
ervi
sion
Sur
veill
ance
Tra
inin
g
Vac
cine
C
olle
ctio
n,
Dis
trib
utio
n, &
Sto
rage
atwima_mponua_rha 135 289 0,15% 0,67% 1,11% 0,36% 0,54% 1,17% 0,42% 0,58% 94,99% bunkpurugu_yunyoo_rha 61 540 0,15% 0,17% 1,60% 0,10% 0,05% 0,32% 0,50% 0,00% 97,12% ga_west_rha 57 650 0,01% 0,00% 0,58% 0,12% 0,13% 0,25% 0,66% 0,16% 98,10% kassena_nankana_rha 72 845 0,18% 2,05% 1,98% 1,19% 0,46% 0,78% 1,41% 1,99% 89,95% wa_municipal_rha 145 520 1,67% 2,03% 8,15% 1,75% 0,87% 2,09% 4,08% 11,05% 68,31%

DO NOT CIRCULATE OR QUOTE WITHOUT PERMISSION
145
A28- Funding sources to health care provisions
Funding sources to health care provisions (USD, 2010)
FS.1.1 FS.1.1.1 FS.1.1.3 FS.1.1.4 FS.1.4 FS.2.1.2.1 FS.2.1.2.2 FS.2.1.3 FS.4.1 FS.7.2.2.2.1 FS.7.2.2.2.2 FS.7.2.2.2.4 FS.7.2.2.3.3 Total
Cold chain equipment 1 300 138 546 139 846
Not disaggregated/n.e.c 84 013 2 062 033 12 329 27 501 178 460 180 262 123 830 36 984 2 705 412
Other 24 766 24 766
Other equipment 5 104 5 104
Per diem 101 829 24 544 35 503 4 477 166 354
Printing 2 565 2 565
Taxes and customs duties 80 897 4 717 85 614
Transport 57 787 3 881 7 232 1 829 70 729
Utilities and communications 14 073 14 073
Vaccines and other goods 2 145 658 2 303 993 4 449 651
Wages and salaries 33 323 010 24 144 69 657 33 416 811
Total 33 323 010 2 240 629 84 013 2 246 415 12 329 57 227 223 761 334 934 123 830 24 144 69 657 2 303 993 36 984 41 080 925
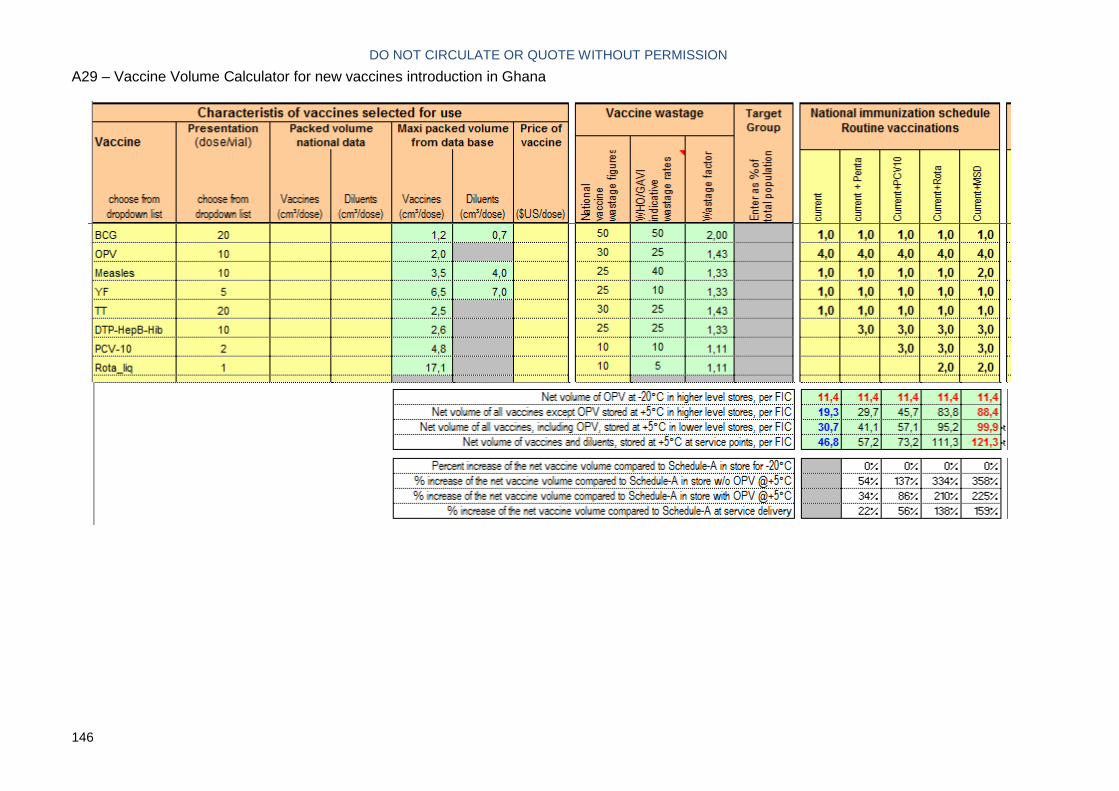
DO NOT CIRCULATE OR QUOTE WITHOUT PERMISSION
146
A29 – Vaccine Volume Calculator for new vaccines introduction in Ghana