do foreign investments affect stock marketslibproject.hkbu.edu.hk/trsimage/hp/03017885.pdf · do...
TRANSCRIPT

Do foreign investments affect stock markets
—the case of Shanghai Stock Market
BY
Chau Kit Yi 03017885
BBA/Finance
An Honours Degree Project Submitted to the School of Business in Partial Fulfilment
Of the Graduation Requirement for the Degree of Bachelor of Business Adminstration (Honours)
Hong Kong Baptist University Hong Kong
April 2006

ACKNOWLEDGEMENTS
I would like to gratefully acknowledge my supervisor, Professor Gordon Y.N. Tang,
for his invaluable advice, guidance, and assistance in the process of the supervision.
His enthusiastic support helps me to solve many problems throughout the Honours
Project and I wish to express my sincere thanks for his kindness.
I am particularly grateful to Dr. Ryan W.C. Shum for his recommendations for
improvement on my Honours Project and his help in developing the econometric
models.
Finally, I am indebted to those for their support and encouragement during the time
when I was working through the thesis.
All the glory belongs to our Almighty God.
Table of Content
Abstract
1. Introduction
2. Literature Review
3. Data and Methodology
4. Empirical Results
5. Conclusion
P. 1
P. 2
P. 5
P. 8
P. 15
P. 21
Abstract
From the literature, Foreign Investments (FI) have been controversial due to the
potential beneficial and adverse effect they may induce. The Chinese government
introduced Qualified Foreign Institutional Investor (QFII), a measure similar to that of
FI, in December 2002, however, there is no paper examines the effects of QFII
brought to the Chinese stock market. This paper is aimed to fill this gap.
This paper provides evidence that investment strategy of individual investors in China
is based on “nonfundamental or speculation factor” and not on fundamental factor
during the pre-QFII period and further the fundamental factor shows a striking
difference, from having no influence on stock returns to becoming a significant
influence on stock returns, so the demonstration effect is partly supported. Also, there
is a significantly and positively relation between beta and return during the pre-QFII
period, however, this relation disappears after the introduction of QFII. Moreover, the
risk premium carried by total risk is found to be smaller, though insignificant after the
launch of QFII. This supports the base-broadening hypothesis which suggests that an
expansion of investor base in the market would increase diversification and reduce
risk. The volatility of the specific portfolio is found to be larger after the launch of
QFII illustrating that FI, instead of stabilizing the market, destabilize the market.

1. Introduction
Foreign investment (FI) has long been a controversial issue for the beneficial and
adverse effects that it may bring about. Two main aspects are concerned when it
comes to FI, destabilization and demonstration effects. Destabilization effect deals
with the issue that whether FI increases or decreases the volatility of stock prices
while demonstration effect indicates whether the fundamental factors on stock
markets would change. Wang and Shen (1999) state that individual investors account
for the largest portion of the stock market in developing countries. Yang (2002)
indicates the fact that due to the lack of information and poor training received by
individual investors, they tend to follow rumours and abide by the herding instinct.
Their decisions are not influenced by stock fundamentals that are related to a firm’s
fundamental financial information or prospects. According to Wang and Shen (1999),
individual investors usually adopt the investment strategy of “buy high, sell low”,
which potentially destabilizes the stock market. These end up with a high turnover
rate and return volatility in emerging stock markets, such as Taiwan. On the other
hand, Wang and Shen (1999) mention that foreign institutional investors (FII)
emphasize the fundamentals of stocks when making investment decisions. Their
trading strategies are more inclined to stabilize the stock market. Arbel and Strebel
(1983) find that individual investors tend to follow institutional investors’ trading

activities based on the perception that they are more informed traders. Lakonishok,
Shleifer, and Vishny (1992) believe that institutional investors are rational and
cool-headed. This could counter individual investors’ sentimental change. The
introduction of FII could be helpful for the maturity of stock market in emerging
markets thanks to the stabilization and demonstration effects.
Other possible benefits of FII come from Calrk and Berfko (1997). They emphasize
the beneficial effects of allowing foreigners to trade in stock markets based on
“base-broadening’ hypothesis. Base-broadening refers to an increase in the investor
base and as a consequence, risk premium in the market would be reduced due to risk
sharing. India opened its financial markets and permitted FII to invest in their
domestic markets in 1992. The liberalization forces the stock exchanges to improve
the quality of their trading and settlement procedures in accordance with the best
practices of the world. Besides, the information environment in India is improved
under the urge of major international financial institutional investors.
Wang and Shen (1999) urge that dissenters of FI fear that large and sudden inflows
may stimulate stock prices while the outflow of FI may reduce equity value.
Consequently, volatility of stock markets would increase.

China introduced the Qualified Foreign Institutional Investor (QFII)1 scheme in
December 2002 to allow licensed foreign investors to trade quoted yuan bonds and
yuan-denominated A shares. As aforementioned, numerous challenges may emerge
during the process of liberalization to the inflow of foreign investment. The potential
effect brought by FI will be of considerable concern to the development of the
financial market of China. Since there is no study in examining the effect brought by
FI after the introduction of QFII in China, this paper is aimed to fill this gap and so it
would be worth studying whether the positive influence would outweigh the adverse
effects brought by FI in the Shanghai stock market, the most active market in China.
The paper is organized as follows: Section 2 first presents the literature of the FI and
the relation between risk and returns. Section 3 describes the data and methodology
used to test the effects brought by FI and the relation between risk and returns.
Section 4 reports empirical results of the tests and finally section 5 concludes the
paper.
1 QFII refers to foreign funds management companies, securities companies, insurance companies and
other asset management institutions approved by the China Securities Regulatory Commission
(“CSRC”) to invest in the PRC securities market within the quotation obtained from the State
Administration of Foreign Exchange (SAFE).

2. Literature Review
Previous researches postulate a positive tradeoff between beta (risk) and expected
returns, which supports the validity of CAPM. However, researchers, in general, find
an insignificant, but positive relation between beta and returns over the sample period
in following researches. Therefore, they claim that the results are inconsistent with the
positive linear relation between beta and returns that stated by the CAPM. The
validity of the CAPM is in doubt. The findings of three critical studies are as follows.
Fama and MacBeth (1973) use a three-step approach to test the validity of the CAPM.
In the first period, portfolios are formed based on the estimated beta for securities.
Portfolio’s beta is estimated in a subsequent time period in the second period. In the
final period, portfolio returns are regressed on portfolio betas so as to test the relation
between beta and returns. Average market excess return is found to be 1.30 percent
per month with a t-statistic of 4.28 and a significant positive slope coefficient during
the sample period of 1935 to 1968. A positive linear relationship between beta and
returns as prescribed by the CAPM in capital markets is concluded. Following the
methodology of Fama and Macbeth, Schwert (1983) concludes that only surprisingly
weak support for a positive risk-return tradeoff is provided since the t-statistic of
Fama and MacBeth (1973) which tests the hypothesis of the slope of the risk-return
relation is zero is 2.57 for the 1935-68 whole sample period. However, it is only 1.92,
0.70 and 1.73 respectively for the 1934-45, 1946-55 and 1956-68 sub-periods. Hence,
the risk-return relation is not significant across sub-periods. When it comes to the
result of the seasonal behavior of the Fama and MacBeth, the t-statistic for the
1935-1968 sample period becomes highly suspicious and the basic risk-return tradeoff
virtually disappears.
Fama and French (1992) examine the monthly returns of NYSE stocks and an
insignificant relation between beta and average returns is found since market
capitalization and the ratio of book value to market value have significant explanatory
power for portfolio returns instead of beta. Fama and French (1992), thus, confirm
that the CAPM cannot describe the last 50 years of average stock returns.
Wang and Shen (1999) carried out a research about the effect of FI in Taiwan, like
China, a developing country. FI has been launched since 1990s in Taiwan. Wang and
Shen (1999) adopt the following steps in investigating the effects of FI.
They first adopt a conventional moving average to generate the volatility of asset
prices. Then, the Granger-causality test is used to investigate the lead-lag relation

between the volatility and FI, followed by the autoregressive conditional
heteroscedasticity (ARCH) method to study the stabilization effect. Regarding the
question of demonstration, only stocks those are invested in by QFII are selected.
Daily data is employed in the investigation because the inflow of foreign capital may
not be invested in the stock market immediately. And it is more reasonable to study
the effect in stock price on a day-to-day basis.
Wang and Shen (1999) find out the following result:
1. Foreign investment has a mild influence on the volatility of stock returns.
2. Stock purchases have a larger impact than stock sales
3. Stock returns are affected by both nonfundamental and fundamental elements
after the inflow of foreign investment whereas the stock returns are mainly
affected by only the nonfundamental factors before the liberalization.
With regard to the significance of stabilization effect demonstrated by FII,
Ananthanarayanan, Krishnamurti and Sen (2005) study the matter on the foundation
of base-broadening hypothesis. The theory behind the base-broadening hypothesis

recommends that including foreign investors would result in an expansion of investor
base in the market. This would lead to increased diversification which is followed by
reduced risk. As a consequence, the required risk premium, which is the
compensation of risk required by investors, would be lowered. Therefore, according
to Merton (1987), there is a permanent increase in the stock price through risk pooling.
Cark and Berko (1997) find evidence in favour of base-broadening hypothesis in their
study on the relation between foreign equity purchases in Mexico and market returns.
Similar relation between aggregate mutual fund flows in U.S and security returns is
also found by Warther (1995)
3. Data and Methodology
3.1 Data Description
Weekly stock returns of 68 China A-share stocks which were invested by QFII and
traded on the Shanghai Stock Exchange (SSE) from Janaury 2001 to December 2002
and January 2004 to December 2005 are collected from the DataStream International.2
This period is chosen because QFII was introduced in December 2002 and most
authorized QFII did not inject their capital into the Shanghai Stock Exchange until
2 Those stocks are mainly concentrated on steel, import, energy, finance, raw material, transportation,
telecommunication and technology industries according to the research by the SSE.

late 2003. In view of making the difference in volatility and market condition between
the two sub-periods, pre-QFII and post-QFII more obvious, stock prices from 2004 to
2005 is chosen as the post-QFII data. The Shanghai Stock Exchange Composite Index
is also retrieved from the DataStream International as the market proxies. The
3-month deposit rate for financial institutions from January 2001 to December 2002
and January 2004 to December 2005 is used as the risk-free interest rate.
Weekly trading volume, number of outstanding shares and annual data of earnings per
share (EPS) of the above 68 China A-share stocks is also collected from the same time
period to examine the demonstration effect.
3.2 Test for the Demonstration Effect
One of the arguments of the trading behavior of individual investors in China is that
their investment strategy is based on “nonfundamental or speculation factor”. This
part follows the methodology of Wang and Shen (1999) to investigate the
demonstration effect. Wang and Shen (1999) suggested using turnover rate (TOR)3 of
the stock to proxy for the nonfundamental factors, such as technical analysis and other
“news” information. If the turnover rate is high, there would be much more significant
3 Turnover rate is defined as the total trading volume divided by outstanding shares.
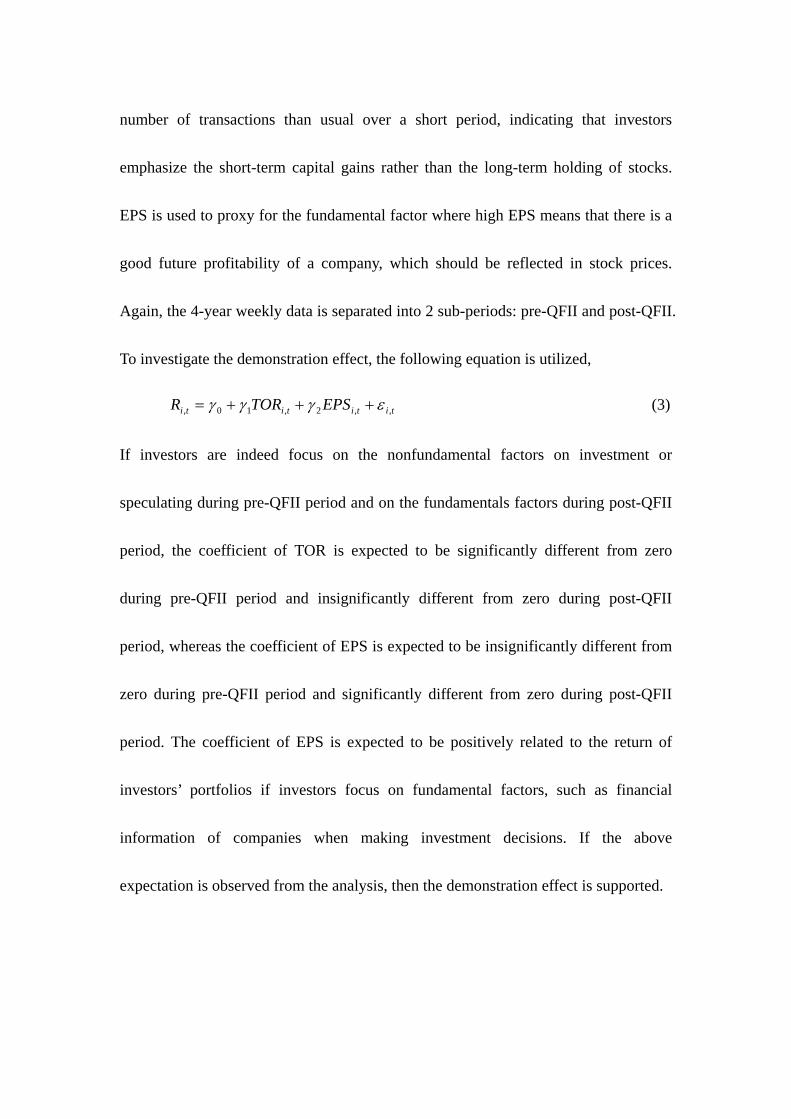
number of transactions than usual over a short period, indicating that investors
emphasize the short-term capital gains rather than the long-term holding of stocks.
EPS is used to proxy for the fundamental factor where high EPS means that there is a
good future profitability of a company, which should be reflected in stock prices.
Again, the 4-year weekly data is separated into 2 sub-periods: pre-QFII and post-QFII.
To investigate the demonstration effect, the following equation is utilized,
titititi EPSTORR ,,2,10, εγγγ +++= (3)
If investors are indeed focus on the nonfundamental factors on investment or
speculating during pre-QFII period and on the fundamentals factors during post-QFII
period, the coefficient of TOR is expected to be significantly different from zero
during pre-QFII period and insignificantly different from zero during post-QFII
period, whereas the coefficient of EPS is expected to be insignificantly different from
zero during pre-QFII period and significantly different from zero during post-QFII
period. The coefficient of EPS is expected to be positively related to the return of
investors’ portfolios if investors focus on fundamental factors, such as financial
information of companies when making investment decisions. If the above
expectation is observed from the analysis, then the demonstration effect is supported.

3.3 Test for the Positive Risk-Return Tradeoff
According to the traditional finance theory, rational investors demand higher expected
returns in order to compensate for higher systematic risk, which is measured by beta.
Therefore, there is a positive risk-return tradeoff. Fama and MacBeth (1973) provided
evidence supporting this conclusion. However, Fama and French (1992, 1996) and
other researchers provided evidence that is contradictory to this positive risk-return
tradeoff. Their results indicate that betas are not statistically related to returns. Some
researchers thus conclude that beta is dead and suspect the validity of beta in
measuring risk. In this paper, the relation between beta and returns would be tested
and we would see whether CAPM holds in the two sub-periods. And we could see if
there is a positive risk-return tradeoff in the Shanghai stock market.
The methodologies of Fama and MacBeth (1973) and Tang and Shum (2003, 2004)
are applied to test for the positive risk-return tradeoff. The 4-year weekly data is
divided into 2 sub-periods: pre-QFII and post-QFII. For each sub-period, 3
non-overlapping subperiods are divided – the portfolio construction period (first
12-week), the parameter estimation period (next 12-week) and the model testing
period (remaining weeks). In the construction period, 68 individual stocks’ betas are
estimated by regressing individual stock excess returns on the market excess returns.

Eight equally weighted portfolios, with 8 stocks for portfolios 1-2 and 7-8 and 9
stocks for portfolios 3-6, are then formed according to these estimated betas ranked in
ascending order. Hence, the first (last) portfolio contains stocks with the smallest
(largest) betas. In the estimation period, betas and total risk of each portfolio formed
in the construction period are estimated. In the testing period, returns of these 8
portfolios from the first week of the testing period are matched with their
corresponding portfolios’ betas and total risk obtained from the estimation period. The
whole process is re-done by dropping the first week’s observation in the construction
period and adding the second week’s observation in the testing period. This procedure
is then repeated for the third and the following weeks up to the last week of the testing
period. When the whole matching process is completed, the weekly returns of the 8
portfolios in the whole testing period are then regressed on their corresponding
estimated parameters by running a stacked regression using all the portfolios weekly
returns in the testing period to obtain a single set of slope coefficients for parameters.
To test for a positive risk-return tradeoff, the following equation is utilized.
tititiR ,,10, εβγγ ++= (1)
Equation (1) estimates the beta risk for each portfolio. If the value of γ 1 is greater
than zero with a significant t-statistic, a systematic relation between beta and returns
is supported. This proves that positive reward exists for holding beta risk.
Thanks to the irrational individual investors’ trading habit and their speculation, there
may not be a significantly and positively relation between beta and returns. However,
beta should significantly affect the pricing of risky assets with the involvement of
institutional investors in the stock market. It follows that when measuring risk, testing
for the significance of beta would indeed enhance the analysis of the trading habit and
behavior of market participants. It is perceived that individual investors focus on the
“news” side of stock movements and tend to be relatively speculative compared to
institutional investors, the coefficient of beta is expected to be insignificantly different
from zero during pre-QFII period, in which individual investors account for the major
portion of the stock market. On the other hand, if the investment strategy of investors
is based on fundamental analysis, the coefficient of beta is expected to be significantly
different from zero and be positive. Thus, the coefficient of beta is expected to be
insignificantly different from zero during pre-QFII period and significantly different
from zero during post-QFII period after the involvement of institutional investors who
emphasize the fundamentals of stocks.
According to the theory of CAPM, beta is the only measurement that affects the stock

markets, so other factors such as total risk do not play a role in pricing risky assets. To
test for the significance of total risk, the following equation is employed.
tititi TRR ,,10, εγγ ++= (2)
If the risk premium of total risk (value of 1γ ) is smaller during period of post-QFII
than that of pre-QFII, then the stabilization effect is supported.
3.4 Test for the Stabilization Effect
Supporters of foreign investment argue that individual investors in developing
markets focus on “news” side of stock movements and their investment behaviors are
relatively speculative, leading to a more volatile market. However, foreign
institutional investors emphasize fundamental factors, such as return on equity and
EPS, in making investment decisions, so their trading schemes tend to stabilize the
stock market. If the above argument is indeed correct, the volatility of the stock
market is higher during pre-QFII period and lower during post-QFII period and hence
investors would demand higher compensation for bearing higher total risk (TR).4
4 Wang and Shen (1999) utilize the Granger causality and GARCH to test for the volatility of exchange
rate. However, the exchange rate of Chinese Yuan to US dollar is rather stable until the State
Administration of Foreign Exchange (SAFE) of China adopted a pegged exchange rate with a basket
of foreign currencies in 21 July 2005. As a result, this paper mainly concentrates on the stabilization
effect of the stock market only.

Regarding the examination of change in volatility across the two sub-periods, firstly,
the average of excess returns of the 68 stocks is calculated. Then, variances of average
excess returns of pre-QFII period and post-QFII periods are directly compared using
F-test. The same approach is adopted in testing the variances of average excess
returns of each portfolio across the two sub-periods.
In fact, there are limitations for the F-test in testing volatility. The test ignores many
other factors, such as the change in macro-economic environment, liquidity of stocks,
and so on. And these factors would possibly affect volatility besides the involvement
of FII. Being unable to keep other factors constant, interferences may occur.
4. Empirical results
4.1 Demonstration Effect
Table 1 presents the regression results of returns on turnover rate and earnings per
share5. Before the launch of QFII, the investment strategy of individual investors in
China is based on “nonfundamental or speculation factor” and not on fundamental
factor, so the coefficient of TOR is expected to be significantly different from zero
whereas the coefficient of EPS is expected to be insignificantly different from zero.
5 The correlation coefficient between turnover rate and earnings per share is less than 0.7, so
multicollinearity problem does not exist.

However, after the launch of QFII, inventors’ trading strategies are mainly based on
fundamental factors, so the coefficient of TOR is expected to be insignificantly
different from zero whereas the coefficient of EPS is expected to be significantly
different from zero.
From Table 1, the coefficient of TOR is indeed significantly different from zero at the
0.01 level whereas the coefficient of EPS is insignificantly different from zero at the
0.05 level during the pre-QFII period, indicating that the investment strategy of
individual investors in China is based on “nonfundamental or speculation factor” and
not on fundamental factor during the pre-QFII period. We can, therefore, conclude
that nonfundamental factors are the key influence on stock returns prior to foreign
investment. During the post-QFII period, the coefficient of TOR is unexpectedly and
significantly different from zero at the 0.01 level whereas the coefficient of EPS is
different from zero as expected, though it is only marginally significant at the 0.10
level.
The coefficients of EPS are all negative in both sub-periods. Such a result is out of
our expectation and maybe attributed to the preference of FII. Technology is one of
the industries which FII concentrate on their investment. Technology is still in the

growth stage in which companies have to allocate a lot of resources to research and
development and this would reduce earnings of companies to a certain extent.
Investors inject capital in this industry based on their anticipation that technology
would be one of the most profitable industries in the coming decades. The same case
applies to the telecommunication industry, one of the industries concentratedly
invested by FII. Another possible cause for the negative coefficient of EPS could be
explained by the speculation of individual investors. If investors do speculate, they
would not consider the EPS, that is the profitability of the companies, but instead,
they would speculate on the surprise of EPS.
The result of post-QFII period is very similar to that of Wang and Shen (1999) in
which TOR and EPS are all significant using the OLS method, suggesting that both
nonfundamental and fundamental factors are influential after 2002 in China. Since the
fundamental factor shows a striking difference, from having no influence on stock
returns to becoming a significant influence on stock returns, the demonstration effect
is partly supported.
4.2 Relations between Returns, Beta and Total Risk
According to traditional finance theory, beta is the only parameter that affects stock

returns because unsystematic risk would be diversified through holding diversified
portfolio. Following the methodology of Fama and MacBeth (1973), many studies
such as Fama and French (1992, 1996) find weak or even insignificantly positive
linear relation between risk and realized returns.
Table 2 presents the regression results of return on beta. During the pre-QFII period,
there is a significantly and positively relation between beta and returns at the 0.05
level, supporting the finding of a positive risk-return tradeoff by Fama and MacBeth
(1973). However, this result is contradicted to my expectation that there should be a
flat (or an insignificant) beta-return relation before the introduction of QFII. One
possible reason may be due to the irrational individual trading behavior. Because of
the irrational individual trading behavior, the original flat beta-return relation, as
suggested by Fama and French (1992, 1996), becomes significant. The other
possible reason may be that this result is limited only to this sample period. The same
significantly and positively beta-return relation may not occur in other time period.
During the post-QFII period, there is a positive risk premium on beta, however, it is
insignificantly different from zero at the 0.05 level. One possible reason may be due
to the short sample period after the introduction of QFII, so the significance of the

effect of QFII that affects beta in pricing risky asset may not be so obvious. In order
to make correct judgment of the effect of QFII on the beta-return relation, a longer
time period is required and this is left for future research. The value of 0γ is
significant at the 0.01 level during pre-QFII period but the value of 0γ is
insignificant at the 0.05 level during post-QFII period, which supports the findings of
Sharpe (1964) and Lintner (1965) that there is a unrestricted borrowing and lending at
an unique known risk-free rate. This implies that the expected value of 0γ is zero as
the risk-free rate is deducted from the market total returns.
Table 3 presents the regression results of returns on total risk. The risk premium of
total risk is significant at the 0.05 level before the launch of QFII, indicating that
investors in China do not hold diversified portfolio, so total risk should be the more
appropriate risk measure in asset pricing. After the introduction of QFII, the risk
premium of total risk becomes insignificantly different from zero at the 0.05 level.
This indicates that the portfolio held by investors after the launch of QFII become
well-diversified and so total risk plays no role in pricing risky asset in China. Also,
the risk premium carried by total risk is found to be smaller, though insignificant after
the launch of QFII. This supports the base-broadening hypothesis which suggests that
an expansion of investor base in the market would increase diversification and reduce
risk.
To summarize, the test results of pre-QFII partially supports the theory of CAPM.
They prove that beta is a significant measurement but not the only parameter in
estimating portfolio returns since risk premium of total risk is also proved to be a
significant measurement for the estimation of portfolio returns. In contrast, test
statistics from post-QFII deny the validity of CAPM as both risk premiums of beta
and total risk are insignificant in estimating portfolio returns. However, a positive
relation between portfolio return and total risk exists during both sub-periods.
4.3 Stabilization Effect
Variances of average excess returns of 68 stocks during pre-QFII period and
post-QFII period are compared using F-test. However, the test statistic is not
significantly different from zero at the 0.05 level; indicating that the variances of the
two sub-periods are not different. For the test statistic of the variances of excess
returns of each portfolio across the two sub-periods, among the eight portfolios, only
one shows the variances of the two sub-periods being significantly different at the
0.05 level. The volatility of the specific portfolio becomes larger after the launch of
QFII, which is consistent with the findings of Wang and Shen (1999) that foreign
investments mildly increase the volatility of stock returns. The result illustrates that FI,
instead of stabilizing the market, destabilize the market in fact. One of the possible
causes maybe as follows: as mentioned, before the introduction of QFII, individual
investors account for the major portion of investors in the Shanghai stock market.
They focus more on the ‘news’ side and tend to follow the trading strategy of FII.
Upon the launch of QFII, individual investors anticipate average stock return would
rise as a result of capital injection from FII. This encourages individual investors
further speculate and trade more, which in turn increases the volatility of stocks,
particularly those invested by FII.
In fact, there are limitations for the F-test in testing volatility. The test ignores many
other factors, such as the change in macro-economic environment, liquidity of stocks,
and so on. And these factors would possibly affect volatility besides the involvement
of FII. Being unable to keep other factors constant, interferences may occur.
5. Conclusion
Foreign Investments have been controversial due to the potential beneficial and
adverse effect they may induce. Wang and Shen (1999) conduct a research about the
effects of stabilization and demonstration brought by Foreign Investment in Taiwan.

They find that foreign investment has mild influence on the volatility of stock returns
and fundamental factors become one of the elements that affect stock returns after the
launch of FI in the market.
As QFII, a measure similar to that of FI in Taiwan, was introduced to China in
December 2002, there is no paper examines the effects of QFII brought to the Chinese
stock market, this paper is aimed to fill this gap. Regarding the demonstration effect,
before the launch of QFII, the coefficient of TOR is indeed significantly different
from zero at the 0.01 level whereas the coefficient of EPS is insignificantly different
from zero at the 0.05 level, indicating that the investment strategy of individual
investors in China is based on “nonfundamental or speculation factor” and not on
fundamental factor during the pre-QFII period. During the post-QFII period, the
coefficient of TOR is unexpectedly and significantly different from zero at the 0.01
level whereas the coefficient of EPS is different from zero as expected, though it is
only marginally significant at the 0.10 level, suggesting that both nonfundamental and
fundamental factors are influential after 2002 in China. Since the fundamental factor
shows a striking difference, from having no influence on stock returns to becoming a
significant influence on stock returns, the demonstration effect is partly supported.

There is a significantly and positively relation between beta and return during the
pre-QFII period, however, this relation disappears after the introduction of QFII. One
possible reason may be due to the irrational individual trading behavior. In which the
original flat beta-return relation, as suggested by Fama and French (1992, 1996),
becomes significant. The other possible reason may be that this result is limited only
to this sample period. Moreover, the risk premium of total risk is significant at the 0.0
level before the launch of QFII whereas the risk premium of total risk is insignificant
after the introduction of QFII, indicating that the portfolio held by investors after the
launch of QFII become well-diversified and so total risk plays no role in pricing risky
asset in China. Also, the risk premium carried by total risk is found to be smaller,
though insignificant after the launch of QFII. This supports the base-broadening
hypothesis which suggests that an expansion of investor base in the market would
increase diversification and reduce risk.
For the stabilization effect, variances of average excess returns of 68 stocks and 8
portfolios during pre-QFII period and post-QFII period are compared using F-test.
The results show that there is no different for the average of volatility of excess
returns of stocks and portfolios before and after the introduction of QFII. However,
the volatility of the specific portfolio becomes larger after the launch of QFII, which
is consistent with the findings of Wang and Shen (1999) that foreign investments
mildly increase the volatility of stock returns, illustrating that FI, instead of stabilizing
the market, destabilize the market in fact.
The above results imply that liberalization of stock market could bring about positive
and adverse impact. This may not lead to the conclusion that foreign investment
should not be encouraged, but instead, more cautious measures should be
implemented. From my perspective, in order to stabilize a specific stock market, one
of the appropriate steps is to educate individual investors on investment apart from the
involvement of institutional investors.
Tables
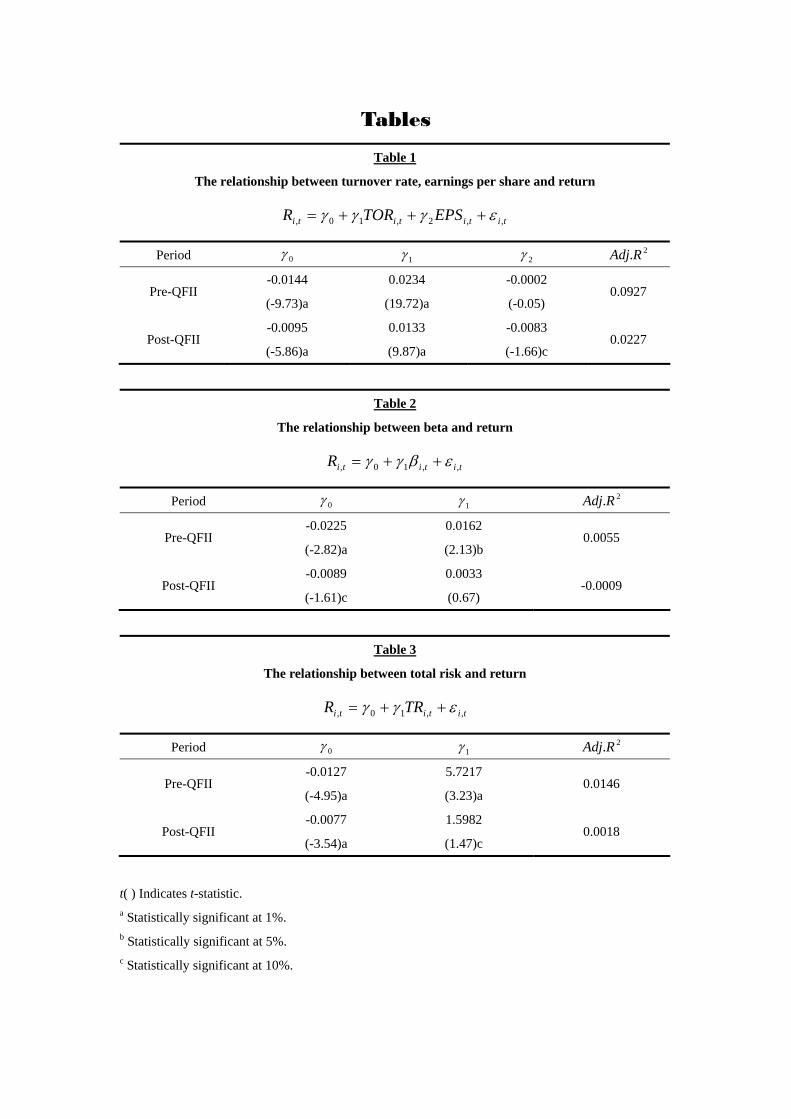
Table 1
The relationship between turnover rate, earnings per share and return
titititi EPSTORR ,,2,10, εγγγ +++=
Period 0γ 1γ 2γ 2.RAdj
Pre-QFII -0.0144
(-9.73)a
0.0234
(19.72)a
-0.0002
(-0.05) 0.0927
Post-QFII -0.0095
(-5.86)a
0.0133
(9.87)a
-0.0083
(-1.66)c 0.0227
Table 2
The relationship between beta and return
tititiR ,,10, εβγγ ++=
Period 0γ 1γ 2.RAdj
Pre-QFII -0.0225
(-2.82)a
0.0162
(2.13)b 0.0055
Post-QFII -0.0089
(-1.61)c
0.0033
(0.67) -0.0009
Table 3
The relationship between total risk and return
tititi TRR ,,10, εγγ ++=
Period 0γ 1γ 2.RAdj
Pre-QFII -0.0127
(-4.95)a
5.7217
(3.23)a 0.0146
Post-QFII -0.0077
(-3.54)a
1.5982
(1.47)c 0.0018
t( ) Indicates t-statistic. a Statistically significant at 1%. b Statistically significant at 5%. c Statistically significant at 10%.

References
Ananthanarayanan, Krishnamurti and Sen (2005), Foreign institutional investors and
security returns: Evidence from Indian Stock Exchanges, Paper Presented at the CAF
Hosts Annual Winter Research Conference in France.
Fama, E.F. and J.D. MacBeth (1973). Risk, return and equilibrium: Empirical test,
Journal of Political Economy, 81, 607-637.
Fama, E.F. and French, K.R. (1992), The cross-section of expected stock returns,
Journal of Finance, 47, 427-465.
Fama, E.F. and French, K.R. (1996), The CAPM is wanted, dead or alive, Journal of
Finance, 51, 1947-1958.
Jack J.W. Yang (2002), The information spillover between stock returns and
institutional investors’ trading behavior in Taiwan, International Review of Financial
Analysis, 11, 533-547
Schwert, G. (1983), “Size and stock returns, and other empirical regularities.” Journal
of Financial Economics, 12, 3-12.
Tang, G.Y.N. and W.C. Shum (2004). The risk-return relations in the Singapore stock
market, Pacific-Basin Finance Journal, 12, 179-195.
Tang, G.Y.N. and W.C. Shum (2003). The relationships between unsystematic risk,

skewness and stock returns during up and down markets, International Business
Review, 12, 523-541.
Wang L.R. and C.H. Shen (1999). Do foreign investments affect foreign exchange and
stock markets – the case of Taiwan, Applied Economics, 31, 1303-1314.