do desperate times call for ... - texas a&m university
TRANSCRIPT

DO DESPERATE TIMES CALL FOR DESPERATE MEASURES?
STRATEGIC RESPONSES TO REGULATORY PUNCTUATIONS IN THE
MEXICAN BANKING INDUSTRY, 1991-2004
A Dissertation
by
LUIS ANTONIO PEREZ BATRES
Submitted to the Office of Graduate Studies of
Texas A&M University in partial fulfillment of the requirements for the degree of
DOCTOR OF PHILOSOPHY
August 2006
Major Subject: Management

DO DESPERATE TIMES CALL FOR DESPERATE MEASURES?
STRATEGIC RESPONSES TO REGULATORY PUNCTUATIONS IN THE
MEXICAN BANKING INDUSTRY, 1991-2004
A Dissertation
by
LUIS ANTONIO PEREZ BATRES
Submitted to the Office of Graduate Studies of Texas A&M University
in partial fulfillment of the requirements for the degree of
DOCTOR OF PHILOSOPHY
Approved by:
Co-Chairs of Committee, Lorraine A. Eden Michael A. Hitt Committee Members R. Duane Ireland Dudley L. Poston, Jr. Head of Department, R. Duane Ireland
August 2006
Major Subject: Management

iii
ABSTRACT
Do Desperate Times Call for Desperate Measures? Strategic Responses to Regulatory
Punctuations in the Mexican Banking Industry, 1991-2004. (August 2006)
Luis Antonio Perez Batres, B.S., Tecnológico de Monterrey-Campus Laguna;
M.S., University of Illinois at Urbana-Champaign
Co-Chairs of Advisory Committee: Dr. Lorraine A. Eden Dr. Michael A. Hitt
Drawing insights from liability of foreignness, the punctuated equilibrium model
and the resource-based view, this dissertation develops an integrated model to identify
the successful strategies and characteristics of both domestic and foreign firms operating
in emerging markets, affected by regulatory punctuations. Accordingly, three research
questions are addressed: Why are some foreign firms more likely to survive than other
foreign firms? Why are some domestic firms more likely to survive than other domestic
firms? Are there any similarities between successful foreign firms and successful
domestic firms?
Using event-history methodologies and the Mexican banking industry as the unit
of analysis, this dissertation shows the following results: Foreign firms (banks) from
countries with stronger commercial ties to Mexico (the focal emerging market), were
less likely to exit the banking industry. Also, the likelihood of exiting the industry, by a
foreign firm, was negatively related to domestic firm (bank) acquisitions. For the
domestic firms (banks), there was a positive relationship between international
diversification and firm survival and a negative relationship between aggressive (loan)

iv
growth and firm survival. Also, marginal support was found about the positive
relationship between “grupo” affiliation and firm survival.
This research contributes to the extant literature by extending current theories
when considering the effect of radical change. For instance, while punctuated
equilibrium provides a good “environmental” explanation about a firm’s need to adapt to
radical change, it does not suggest how firms should adapt to this change. However, by
providing an explanation on how firms suppose to adapt to this radical change, this
dissertation had expanded the theoretical implication of the punctuated equilibrium
model. Similarly, the present dissertation provides a theoretical extension to liability of
foreignness by finding that not all foreign firms face the same liability of foreignness.
Lastly, the resource-based view is also extended by this dissertation research, as it is
found to have implications for emerging markets firms that are different from foreign
developed market firms.

v
DEDICATION
I dedicate this dissertation to my family. Cristina, my lovely wife, without your
love, support and encouragement; I could not have done it! You are my inspiration. I
love you…
Luis Antonio, beloved son, you are the light of my life and my best friend in the
whole wide world. You bring joy and happiness to my life. I love you…
Mom and Dad, your unconditional love, your example of honesty, hard work,
family values, and above all, your trust in our Lord Jesus Christ have been a priceless
legacy. I thank God for sending me such wonderful parents! I love you…
Lucy, Alex, and Christian (Lulu & Diego), always dear children, I often thought
about you during this challenging process. You complete my family! I love you…
Aunts Prieta, Yolis, Lichita, and uncle Manolo (Gaby, Gaby, Karina, Gloria &
Verónica), I have always felt your love and support during the special and not so special
moments of my life! I love you…
It is a privilege to dedicate this dissertation to all of you! My family…

vi
ACKNOWLEDGEMENTS
This dissertation represents the hard work of many people. I thank God for
having the magnificent group of individuals who led me through this effort.
First of all, I would like to acknowledge the members of my dissertation
committee: Dr. Lorraine A. Eden, Dr. Michael A. Hitt, Dr. R. Duane Ireland and
Dr. Dudley L. Poston, Jr.
Lorraine, while I will always be thankful for all the time and energy you put in
mentoring and training me over the past few years. What I admire the most about you is
your passion for research. Lorraine, you have succeeded in many academic fields, and
yet you have humbly shared your time and wisdom with me. I always felt that I could
come to your office and talk to you. I knew everything would be better after that!
Without question, your guidance has inspired me during my time at TAMU and will
continue to influence me throughout my career. I will be forever grateful that you agreed
to chair my dissertation. Thank you, Dr. Eden…
Mike, I am very grateful that you agreed to co-chair my dissertation, even though
you had just come back to TAMU and had a million and one other things on your
agenda. You were always available and provided me with priceless advice. You always
managed to listen to me during the struggles and joys that a research effort of this
magnitude brings to a doctoral student. Mike, I particularly appreciate that you always
recognized my research improvements (even the minor ones). And although this is
always pleasant, coming from someone that has contributed to the management arena in
such an exceptional manner does have an impact on one’s life. Thank you, Dr. Hitt…

vii
Duane, you provided invaluable comments, time and energy in my writing this
dissertation. Also, as department head, I always felt I could approach you. You always
had time to listen despite your busy schedule! Thank you, Dr. Ireland...
Dudley, I almost did not take your sociology class. A friend of mine; however,
advised me to do so. Thanks to you I re-learned statistics (that simple). I believe all the
hard work you put into your class helped me conduct my dissertation analysis. Further,
your help in the last leg of the dissertation, the results chapter, was most helpful. Thank
you, Dr. Poston…
Next, I want to recognize the help of other magnificent individuals. As a previous
member of the committee, I owe special thanks to Dr. Bert Cannella (Arizona State
University). Bert, I also appreciate what you did for all of us students in your role of
Ph.D. Coordinator! Likewise, the efforts of Dr. Klaus Uhlenbruck (University of
Montana), a previous member of my committee, are very much appreciated. Thanks,
Klaus…
Special thanks also go to professors: Paige Fields (for allowing me access to her
Bankscope database), Trevis Certo (methods inquiries), Elizabeth Umphress, Richard
Woodman, Mike Pustay, Ramona Paetzold, Maura Belliveau, Mike Wesson, Asghar
Zardkoohi, Len Bierman, Jonathan Brookfield, Cindy Devers, Chris Porter, and Don
Hellriegel from whom I received support and encouragement. Also, I would like to thank
Dr. Colella, Dr. DeNisi and Phyl Washburn for their administrative support.
The financial support provided by the Mays Business School and the Center of
International Studies for the purchase of the database on the Mexican banking industry is

viii
very much appreciated. Thank you, Dr. Griffin! Thank you, Dr. Gaspar! Thank you,
Dr. DeNisi!
Last but certainly not least, I like to acknowledge my fellow Ph.D. students:
Carrie Belsito, Celile Gogus, Chazara Clark-Smith, John Bingham, and Race Yu.
Meeting you the first day of class was an honor. Thanks for your friendship…
Jamie Collins, Bill Worthington, Chris Reutzel and Chris Tuggle, I enjoyed our
“chow time” and our academic trips. Thanks for your friendship…
Also, my stay in College Station has been made more enjoyable thanks to: Dan
Li, Matt Semadeni, Tim Holcomb, Michael Holmes, Brian Connelly, Aneika Coleman,
Lily Ren, Mary Triana, Victor Franklin, Justin Webb, Fernanda, Harry Kim, Jay Lee,
Toyah Miller, Laura Riedel, Susan Zhu, Sandra Wolverton, and Y-Lo. Thanks for your
friendship…

ix
TABLE OF CONTENTS
Page
ABSTRACT ..................................................................................................................... iii
DEDICATION ...................................................................................................................v
ACKNOWLEDGEMENTS ..............................................................................................vi
TABLE OF CONTENTS ..................................................................................................ix
LIST OF FIGURES...........................................................................................................xi
LIST OF TABLES ...........................................................................................................xii
CHAPTER I INTRODUCTION AND RESEARCH OBJECTIVES ..................................1
Motivation and Research Question.................................................................1 Expected Contributions...................................................................................7 Organization....................................................................................................8
II LITERATURE REVIEW .............................................................................10
The Punctuated Equilibrium Model..............................................................10 Emerging Markets.........................................................................................17 Liability of Foreignness ................................................................................24 Summary and Conclusions ...........................................................................28
III THEORY AND HYPOTHESES..................................................................30
MNE vs MNE ...............................................................................................31 Domestic vs Domestic ..................................................................................39 MNEs vs Domestic Firms.............................................................................51 Summary.......................................................................................................52
IV PILOT TEST: A DESCRIPTIVE ANALYSIS ...........................................55
The Four Regulatory Punctuations ...............................................................56 Firm Responses to Regulatory Punctuations ................................................60 MNEs vs MNEs ............................................................................................61 Domestic vs Domestic ..................................................................................70 Summary.......................................................................................................74

x
CHAPTER Page
V METHODOLOGY .......................................................................................75
Sample ..........................................................................................................75 Measures .......................................................................................................76 Dependent Variables.....................................................................................76 Independent Variables ..................................................................................79 Control Variables ..........................................................................................86 Statistical Models..........................................................................................87 Model Justification .......................................................................................89
VI EMPIRICAL RESULTS...............................................................................90
Descriptive Statistics.....................................................................................90 Results of Hypothesis Testing ......................................................................94 Foreign Banks ...............................................................................................94 Domestic Banks ............................................................................................99 Ex-Post Analysis of Results........................................................................105 Foreign Banks Database .............................................................................105 Domestic Database .....................................................................................108 Summary.....................................................................................................109
VII DISCUSSION AND CONCLUSIONS ......................................................111
Discussion...................................................................................................111 Conclusions.................................................................................................123 Limitations and Future Research ................................................................130
REFERENCES...............................................................................................................133
APPENDIX A ................................................................................................................149
APPENDIX B ................................................................................................................157
APPENDIX C ................................................................................................................164
APPENDIX D ................................................................................................................169
VITA ..............................................................................................................................172
xi
LIST OF FIGURES
FIGURE Page
1.1 Regulatory Punctuations and Firm Performance .............................................4
4.1 Bank Entries ...................................................................................................67
4.2 Bank Failures..................................................................................................67
4.3 Banks’ M&A Activity....................................................................................68
4.4 Market Share Participation.............................................................................68
4.5 Total Number of Banks ..................................................................................69

xii
LIST OF TABLES
TABLE Page
3.1 Commercial Banks Reprivatized by the Mexican Government (1991-1992)......45
3.2 Summary of Hypotheses ......................................................................................53
4.1 Top 25 Banks of the World (The Banker 6/2003) ...............................................63
4.2 Entries and Market Share of Multinational Banks in Mexico..............................64
4.3 Mexican Banking Industry Entries, Exits and Other Statistics ............................66
4.4 Market Share of Original Banks per Period .........................................................73
5.1 Dependent Variables ............................................................................................77
5.2 Independent Variables..........................................................................................78
5.3 Control Variables .................................................................................................79
6.1 Foreign Banks Database Descriptive Statistics ....................................................92
6.2 Domestic Banks Database Descriptive Statistics .................................................93
6.3 Foreign Banks Weibull Distribution (Model 1, Control Variables) Foreign Banks Gompertz Distribution (Model 2, Full Model) Dependent Variable = Exit ........................................................................................................................ 96
6.4 Domestic Banks Weibull Distribution (Model 1, Control Variables)
Domestic Banks Weibull Distribution (Model 2, Full Model) Dependent Variable = Exit ...................................................................................................100
6.5 Domestic Banks Exponential Distribution (Model 3, Full Model)
Dependent Variable = Exit .................................................................................102 6.6 Foreign Banks Database (Fixed Effects, Random Effects Regressions and
Hausman Test) Dependent Variable = ROE ......................................................107 6.7 Foreign Banks Database (Ex-post Analysis Comparison: Gompertz, Fixed
and Random Effects) Dependent Variable = Exit, ROE, and ROE, Respectively .......................................................................................................109

xiii
TABLE Page
6.8 Domestic Banks Database (Ex-post Analysis Comparison: Exponential
Model, Logistics Regression, and Cox Model) Dependent Variable = Exit......110

1
CHAPTER I
INTRODUCTION AND RESEARCH OBJECTIVES
There is nothing more difficult than to take the lead in the introduction of a new order of things.
-Niccolo Machiavelli You can never rest in your laurels, apart from higher performance targets, unprecedented environmental change requires us to create a culture of continuous change.
-Percy Barnevik, former CEO of ABB
Motivation and Research Question
The ability to understand the external environment has been long recognized as a
key determinant of organizational performance (Porter, 1990). In the last few years,
however, profound transformations of the business landscape have taken place as a result
of globalization and technological advances (Hitt et al., 1998). Therefore, it has been
suggested that successful organizations will be those with the ability to adapt to radical
environmental change (Richardson, 1996; Volberda, 1996).
While the importance of radical environmental change has been recognized (e.g.,
Meyer et al., 1990; Gersick, 1991, 1994; Wollin, 1998; Sabherwal et al. 2001), firm
strategies and characteristics that facilitate or hamper firm performance, under radical
The style and format for this dissertation follow that of the Academy of Management Journal.

2
environmental change, have not received the same attention (Keister, 2002). Also,
because emerging economies1 have experienced a more radical transformation in their
business landscapes, examining firms operating in these regions should allow us to better
identify the causes behind a successful or failed (radical) adaptation. For instance,
DeCastro and Uhlenbruck (1997) suggest that different government privatization
approaches (from former communist countries) evoked diverse multinational firm
strategies, as privatization policies drastically changed the business landscapes of these
countries. According to Peng and Heath (1996), the old institutional rules of the
communist system became useless under the new environment. Similarly, after major
liberalization policies carried out by most Latin American governments during the
1990s, multinational firms (MNEs) suddenly could easily enter the Latin American
markets after 50 plus years of government protectionism (Sheahan, 1987, 1997; Toulan,
2002). In turn, this abrupt policy change forced domestic2 firms to quickly adapt to the
new landscape.
The strategic management and international business literatures have produced a
wealth of research gauging the actions and strategic shifts of large multinational
corporations (e.g., Ferrier, 2001; Luo and Peng, 1999). However, this research has
emphasized performance comparisons between multinational and domestic firms, largely
1 As defined by Hoskisson et al. (2000, p. 249) “Emerging economies are low-income, rapid-growth countries using economic liberalization as their primary engine of growth. They fall into two groups: developing countries in Asia, Latin America, Africa, and the Middle East and transition economies in the former Soviet Union and China.”
2 Throughout this paper, the words domestic and local are used interchangeably to refer to firms that are owned by the citizens of a particular emerging market.

3
overlooking the performance differences among foreign multinational firms competing
in a third host market (Rangan and Drummond, 2004).
Also, there has been a dearth of research gauging how domestic firms in
emerging markets from all over the globe are adjusting to these radical environmental
changes (e.g., globalization). A review of the literature reveals a need to better
understand domestic firms’ strategic responses to radical environmental change. For
instance, Doh (2000) recognized the scarcity of studies on firm-level responses to
privatization, while Hoskisson et al. (2000) commented on the need to study the larger
institutional context on individual firm responses.
Since it would be impossible to identify all the possible causes of radical
environmental change, this dissertation focuses on firms’ responses to regulatory
punctuations. Following Haveman et al. (2001: 254), regulatory punctuations are those
discontinuities originated by “sudden and extensive shifts in state constraints on business
operations.” Therefore, this research identifies the characteristics and strategies of
successful multinational and domestic firms adapting to regulatory punctuations in a
given (emerging) host market. Figure 1.1 illustrates the performance implications of the
firms’ strategic responses and characteristics after a regulatory punctuation.
Furthermore, the present study takes advantage of the Mexican banking industry’s recent
regulatory punctuations. These punctuations came in the form of nationalization,
reprivatization, and market liberalization policies (1991-1998), which dramatically
altered the banks’ business landscape. Thus, the Mexican banking industry’s radical

4
transformation presents an excellent opportunity to study the characteristics and
strategies of successful firms adapting to regulatory punctuations in emerging markets.
FIGURE 1.1
Regulatory Punctuations and Firm Performance
Integrating ideas from liability of foreignness (LOF), business groups in
emerging markets, and the punctuated equilibrium model, this research is designed to
answer the following research questions:
Why are some MNEs more likely than other MNEs to survive regulatory
punctuations in an emerging host market? Why are some domestic firms more likely
than other domestic firms to survive regulatory punctuations in their home emerging
Firm Characteristics
• Nationality (Domestic v. Foreign; strength of home-host country ties)
Firm Strategies
• Corporate Strategy (conglomerate structure)
• Business Strategy (specialization strategies; aggressive competitive behavior)
• International Strategy (international alliances; FDI)
• Acquisitions • Social Capital
Firm Performance

5
market? Are there any similarities between successful MNEs and successful domestic
firms in their strategic responses to regulatory punctuations in an emerging market?
Answering the first research question addresses the more general question of why
some multinational firms perform better than others. However, this approach is different
from previous studies in the literature which emphasize the comparison between
multinationals and domestic firms (e.g., Ataullah & Le, 2004; Mezias, 2002; Zaheer,
1995; Zaheer & Mosakowski, 1997). In contrast, this research question explores the
relationship between MNE strategies and characteristics and firm performance; thus, the
focal unit of analysis is the MNE. In so doing, the study follows an LOF rationale
focusing on the sociopolitical-relational costs of doing business abroad, namely,
unfamiliarity, relational and discriminatory costs (Eden & Miller, 2004). Thus,
measuring the effectiveness of multinational firms’ strategies and firm characteristics
that might help multinational firms reduce LOF is at the heart of this research question.
Particularly for firm strategies, the effect of strategic alliances (with local partners) on
MNE performance is addressed. For firm characteristics, however, the strength of the
MNE’s home nation sociopolitical-relational ties with those of the host nation and their
effect on firm performance is investigated.
Answering the second research question addresses successful strategies of
emerging market domestic firms (EMFs) in response to radical environmental change in
that home market. Essentially, exploring the effectiveness of domestic firm strategies in
response to regulatory punctuations (i.e., radical change), judged by their ultimate
outcome (survival or death), allows us to identify the link between domestic firms’
6
strategies and firm performance. Furthermore, our research approach is different from
previous studies in the literature that emphasize the comparison between MNEs and
domestic firms (e.g., Miller & Parkhe, 2002; Zaheer, 1995). In so doing, our study is
designed to answer why some emerging market firms were successful, relative to their
domestic counterparts; thus, the unit of analysis in research question two is the domestic
firm.
Among the domestic firms’ strategies considered for this research question, I
explore the firms’ corporate strategy, that is, the effect of conglomerate structures and
business structures on firm performance. Also, I consider the effect of strategic alliances
and business level strategies on firm performance. The answers theoretically draw from
different literatures, namely, LOF (e.g., Eden & Miller, 2004), business groups (e.g.,
Guillen, 2000), and the punctuated equilibrium (e.g., Gersick, 1991).
In sum, answering research questions one and two allow us to identify how
certain strategies affect MNEs and domestic firms’ performance, respectively. On the
other hand, the answer to research question three seeks to identify the similarities
between successful MNEs and successful domestic firms’ strategies and characteristics.
Although research question three revisits the comparison between the performance of
MNEs and domestic firms, it does not ask whether MNEs outperform domestic firms, or
vice versa. Rather, the question focuses on whether there are certain firm strategies or
characteristics that allow either MNEs or domestic firms to gain a competitive
advantage. In so doing (identifying superior firm strategies and characteristics),
7
answering research question three allows us to also identify unsuccessful firm strategies
and characteristics.
Essentially, research question three asks if, for foreign or domestic firms
operating in emerging markets during regulatory punctuations, there are certain firm
strategies or characteristics that allow them to better fit the new environment. Thus,
finding if MNEs outperform domestic firms or vice versa is irrelevant for research
question three. The key issue is to understand which certain firm strategies and
characteristic are equally effective (or ineffective) for both MNEs and EMFs.
Expected Contributions
From an academic perspective, it is worth noting that studies about strategic
responses of either multinational or domestic firms operating in emerging markets, when
the rules of business have changed so radically, have been scarce. Thus, the present
study contributes to the business literature by addressing this gap. In so doing, I attempt
to confirm what other studies have found about the opportunities that most recent
regulatory punctuations have provided for foreign firms (e.g., privatization and market
liberalization policies). However, the present study goes one step further by explaining
why, despite regulatory punctuations’ normally positive effects on foreign firms, there
are some multinational firms that performed poorly. Conversely for domestic firms, our
study seeks to explain why, despite regulatory punctuations’ normally negative effects
on domestic firms, there are some domestic firms that manage to overcome these

8
negative effects. Thus, by linking environment and strategy we demonstrate why some
multinational and domestic firms perform better than other multinational and domestic
firms, respectively. Also, this research explores whether there are certain “universal”
firm strategies or firm characteristics that enable either MNEs or domestic firms to better
align with the new business landscape (after a regulatory punctuation).
From a practical perspective, Porter (1998: 57) suggests, “we are entering a new
phase (of globalization) which is more counterintuitive because now globalness is
assumed.” In this sense, we believe our research can provide practical managerial
implications for multinational firms trying to enter new international markets, and also to
domestic firms trying to defend their local market position from international
competitors.
Organization
This dissertation is organized in the following manner. Chapter II presents a
review of the extant literature on the punctuated equilibrium model, emerging markets,
and the liability of foreignness (LOF). The chapter’s goal is to set the stage for the
theoretical framework developed in the next chapter. Chapter III presents the theoretical
framework of this research with its corresponding hypotheses, aiming at answering the
research questions presented in the introductory chapter. Next, Chapter IV offers a
descriptive (qualitative) pilot test of four hypotheses offered in Chapter III. Chapter V
discusses the traditional quantitative approach on sample selection, data collection

9
issues, operationalization of variables, and statistical testing techniques. The results of
these statistical procedures are exhibited in Chapter VI. Finally, Chapter VII presents
conclusions, limitations, as well as avenues for future research once the analysis is
completed.

10
CHAPTER II
LITERATURE REVIEW
This chapter provides a review of the extant literature on the punctuated
equilibrium model, emerging markets, and the liability of foreignness (LOF). The
chapter’s objective is to present a logical sequence of this study’s research questions
(i.e., environmental punctuation firm response). The punctuated equilibrium model
literature review offers a general perspective on radical environmental change and
organizational response. In contrast, the literature review on emerging markets and LOF
offers a more specific account of the types of environmental punctuations and firm
responses covered in this research. In other words, these literatures explore the
punctuations occurring in emerging markets and the strategic responses of both the
MNEs and EMFs operating in them (i.e., market liberalization policies firm
strategies). The chapter ends with a brief summary and conclusions about the relevance
of considering the effects of radical environmental change and firm strategies.
The Punctuated Equilibrium Model
Theoretical Antecedents
Research on organization-environment alignment is not scarce. For instance,
population ecology theory (Aldrich, 1979; Hannan & Freeman, 1977, 1984) suggests
that environmental changes reshape organizations. The theory is deterministic in that it

11
assumes environmental selection rather than organizational adaptation (Carroll, 1984).
Adaptation models, on the other hand, assume that organizational actors are purposeful
and able to respond properly to environmental challenges (Allmendinger & Hackman,
1996). More recently, population ecologists have come to accept, to some extent, the
organizational importance of actors. Likewise, adaptation theorists have come to accept
the importance of environmental forces and that sometimes choice is nonexistent
(Hambrick and Finkelstein, 1995).
To bridge these two polar views, Hambrick and Finkeltstein (1987) conceptualize
‘discretion’, as a measure of the managers’ latitude of choice, which would estimate the
decision makers’ ability to influence the firm in a given environment. Further,
Abrahamson and Hambrick (1997) identify several industries that allow decision makers
different levels of discretion. Despite the well-deserved attention lent to the importance
of organizational-environment alignment, Sabherwal et al. (2001) recognize a dearth of
research on the dynamics of alignment. Also, Gersick (1994: 11) suggests halting the
debate between selection and adaptation and rather focusing on “when and how
organizations steer successfully through changing environments.” However, most
research on how organizational systems develop and change had been conducted with a
static view. According to Haveman et al. (2001), even longitudinal studies would not
necessarily satisfy the requisite for dynamics of alignment research given their ahistoric
nature. Further, these authors caution that gradual change is only an assumption of social
theory but not a fact of social life.

12
Almost 40 years ago, Thompson (1967: 234) viewed environmental alignment as
a ‘moving target.’ More recently, Hitt et al. (1998) acknowledge frequent strategic
discontinuities cause rapid transformations on the competitive landscape, and Boeker
(1997) stresses the change in the focus of organizational research from static to more
dynamic organizational research. In light of both recent and abrupt changes of the
business landscape, such as privatization and globalization policies enacted in several
countries, Gersick (1991, 1994) calls into question the traditional Darwinian assumption
about how change unfolds. Gersick (1991) suggests that organizational theories
traditionally at odds with each other, such as resource dependency (Pfeffer & Salancik,
1978) and population ecology (Hannan & Freeman, 1977), are not always in conflict.
Rather, they are valid at different times depending on the system’s stage.
Conceptualization and Dimensions
As an alternative to Darwinian gradualism, Eldredge and Gould (1972),
evolutionary biology theorists, conceive evolution as punctuated equilibrium. They
disputed the notion that ecosystems evolve steadily from one state to the next, or evolve
toward preset ends. Rather, they suggest that frame-breaking change took place through
sudden and revolutionary punctuations. Indeed, Gould and Eldredge (1977) recognize
incremental evolution, but emphasize that a system reaching its breaking point would
precipitate discontinuities. Also, Eldredge and Gould’s arguments are strikingly similar
to those made by Kuhn’s (1970) structure of scientific revolutions. Among the earliest
organizational scientists incorporating some conceptualization of severe environmental
13
punctuations, Meyer’s (1982) jolts, Tushman and Romanelli’s (1985) revolutionary
change, Tushman and Anderson (1986), and Anderson and Tushman’s (1990)
technological discontinuities stand out. However, Gersick’s (1991) seminal piece is the
most comprehensive ‘translation’ of the punctuated equilibrium model from
evolutionary biology to organizational theory. For Gersick, the punctuated equilibrium
model consists of three main dimensions: 1) Deep Structure, 2) Equilibrium Periods, and
3) Revolutionary Periods.
Deep Structure
Deep structure is the way a system is organized through stable routines. Gersick
(1991; 16) justifies a system’s stability due to its path dependency, comparing it to a
decision tree. Necessarily, she states, “a trial of choices made by a system rules many
options out, at the same time as it rules mutually contingent options in.” For
Fox-Wolfgramm et al. (1998), deep structures favorably compare to management
systems. Greenwood and Hinings (1993) called these deep structures design archetypes
or holistic patterns. These archetypes or ‘templates for organizing’ (DiMaggio & Powell,
1991: 27) are the firm’s psyche or ‘interpretative schemes’ (Ranson et al., 1980: 1052).
Thus, change consistent with prevailing interpretative schemes is convergent (non-
radical) because it occurs within the parameters of an existing archetype.
On the other hand, radical, frame-breaking change occurs if an organization
departs from its current template to pursue a different one (Greenwood and Hinings,
1996; Ouchi, 1980). According to Sabherwal et al. (2001), because organizational

14
archetypes evolve without specific pattern, punctuated equilibrium models cannot be
equated to life cycle theories. In other words, the punctuated equilibrium model does not
assume an orderly transition towards a desired end-state. Wollin (1999) suggests,
however, that organizations’ deep structure or archetype changes are not chaotic either.
For him, firms’ deep structures are nested within a hierarchy where elements of
suprasystems and subsystems are interdependent with one another. In sum, deep
structures are ways in which a system is organized through stable routines (Gersick,
1991: 16). In turn, the deep structure would last as long as it allows organizations to be
aligned with the business landscape.
Equilibrium Periods
Gersick’s (1991) equilibrium periods are similar to ‘rules of engagement’ in a
game. That is, even though there are different ways to play a game, all the alternatives
are bounded by its rules or paradigm and there is limited uncertainty on how to proceed.
For instance, in a chess game, a very good player is able to recognize up to 1,300 game
patterns, while a grand master recognizes about 50,000 (Simon, 1979: 369). In this
sense, as long as chess rules do not change dramatically, chess grand masters are likely
to stay grand masters even though every match could evolve differently. In this example,
the chess game mimics a system in equilibrium where only incremental adjustments can
take place. However, if chess rules were to change abruptly, suddenly recognizing
50,000 (old rule) game patterns could become worthless. Essentially, “solutions based
on past experiences or analogy may (at a given time) be inappropriate” (Prahalad &

15
Bettis, 1986: 493). In other words, as long as the environment does not force the
system’s deep structure to change, it will remain in equilibrium (Wake, Roth and Wake,
1983).
Gersick (1991) also suggests that inertial forces keep a system in equilibrium.
Thus, it appears that archetypes are reinforced by (accepted) institutional mechanisms.
For old institutionalism, “institutions are nothing more than imperfect and practical
solutions to solve past conflicts” (Scott, 1995: 3). The older are the firms, the more
likely they will follow their institutional routines that enhance their legitimacy and allow
them to resist pressures to adapt (Meyer & Rowan, 1977). However, when abrupt
environmental change occurs, coercive pressures can cause organizations to radically
alter their structures (Haveman, 2001). In sum, an equilibrium period lasts as long as the
organizations operating in a certain business landscape conform to a deep structure.
Revolutionary Periods
The revolutionary period starts when the organizations’ deep structure collapses
(i.e., suffers a punctuation). At this point, there is no environmental equilibrium; chaos
sets into the system and the path to cosmos (order) or new alignment begins. However,
because this change is not part of a life cycle, end-states are unknown. Under these
circumstances, firms try to reconfigure their archetypes in accordance to the new set of
environmental rules (Gersick, 1991).
Deep structure punctuations may come from the inside when changes break the
harmonious way (alignment) in which the pieces are integrated. For instance, Gold

16
(1999) suggests that a leader’s sudden succession can destabilize an organization. Also,
Haveman (1992) recognize that deep structure punctuations can be caused by external
events such as political turmoil or major changes in government regulation that might
devalue the systems’ resources (Gersick, 1991). According to Baum et al. (1995), abrupt
environmental change may create new habitats where new organizational designs can
flourish. However, abrupt environmental change may also induce the extinction of
existing habitats. In other words, radical changes can force organizations to change
tracks or structural coherence.
In fact, Greenwood and Hinings (1988, 1993) consider four track possibilities:
1) Inertial, or major resistance to fundamental reorientations in policy (Tushman &
Romanelli, 1985). 2) Aborted Excursions, essentially 360-degree interpretative scheme
‘trips’, where organizations briefly depart from their current archetype only to come
back to it. 3) Reorientations, where organizations successfully move from their current
archetype to a new one. And 4) Unresolved Excursions, or organizations’ successful
departures from original archetypes, combined with unsuccessful adoptions of new ones.
According to this classification, reorientation and unresolved excursion tracks
depict the organization trying to replace its original deep structure. In both cases the
response signals revolutionary, second-order change. Conversely, inertial and aborted
excursion tracks present the organization as ultimately following its original
interpretative scheme; thus, any change would be within the bounds of equilibrium or
first-order change (Fox-Wolfgramm et al., 1998).

17
In sum, revolutionary periods should be understood as transition periods. During
these unstable periods organizations try to transform their deep structures to reach a new
equilibrium. Thus, revolutionary periods should last until the organizations that operate
in an abruptly changed business landscape are able respond to the challenges brought
about by this change. In the following section, the literature review on emerging markets
depicts how the organizations operating in that business landscape were forced to change
their deep structure as revolutionary periods came to pass because of abrupt policy
changes.
Emerging Markets
Economic Model (From Protectionism to Liberalization)
Hoskisson et al. (2000) identified 64 countries as emerging markets. According
to Wright et al. (2005), these emerging markets represented 12 per cent of the world’s
foreign direct investment (FDI) outflows in 2002. Wright et al. (2005) further suggest
these countries had recently attracted higher amounts of FDI because of the widespread
implementation of economic liberalization policies (liberalization). Before the adoption
of liberalization, however, most emerging markets followed protectionist policies. To
better understand the importance of the business landscape change on emerging markets,
this section offers a brief description of the Latin American and East Asian economic
models prior to the implementation of liberalization. The description serves as a
depiction of the ‘original’ business landscape on emerging markets.

18
The world depression of the 1930s showed that countries dependent on primary
exports could be vulnerable to adverse changes in the world economy. The depression
cracked the foundation of the primary export model and drove Latin America and East
Asian economies toward intensive import substitution industrialization (ISI) (Ranis,
1995; Sheanan, 1987). By the early 1950s, substitution in light manufacturers was far
more advanced in Latin America, thus, further industrialization could come about only
through protectionist policies (Diamond, 1978). For instance, Brazil and Mexico had
already nationalized their electrical and oil industries (Haggard, 1990). By contrast, East
Asian economies moved into primary import substitution between 1953 and 1963.
According to Ranis, larger economies such as those of Brazil and Mexico took longer
time to reach domestic saturation than those from Singapore, Malaysia or Taiwan. Thus,
once their domestic markets became saturated with import substitution products, East
Asian economies move cleverly into primary export substitution (Sheanan, 1987, 1997).
One of the most costly effects of the ISI strategy in Latin America was that it
worked against industrial exports and tied the growth of industrialization to the rate of
growth of domestic demand. In turn, the domestic industry was unable to finance its own
import needs (Sheanan, 1987). In contrast, the East Asian economies share of the World
exports eight-folded from 0.19% in 1960 to 1.59% in 1975. In that same period,
however, the Latin American export share of world exports only grew slightly from
1.23% to 1.26% (Ranis, 1995: 182).
According to Edwards (1995), the inward orientation of the Latin American
economies meant that foreign exchange supply remained dependent on volatile primary-

19
product markets. As a result, the oil shocks of the 1970s quickly consumed their foreign
exchange reserves and governments turned to international loans to pay for oil and other
imports. East Asia economies, however, while experiencing economic difficulties in the
post 1973 years and in the late 1990s, never followed the ISI path of Latin America to as
great an extent, and poverty was never as widespread. In fact, East Asian economies kept
healthy industrial export growth rates from an already high base, despite high-energy
prices, global inflation, and recession.
In August 1982, Mexico announced it could no longer service its foreign debt,
marking the beginning of Latin America’s ‘debt crisis’ (Crisp & Kelly, 1999). As a
result both the IMF and the World Bank mandated ‘structural adjustments’ in five areas:
liberalization policies, exchange-rates, tax reform, financial reform, and public enterprise
reform and privatization (Edwards 1995). In turn, several Latin American countries
passed the policies. For instance, the Mexican liberalization appeared successful for the
first few years (1987-1993), until the economy hit a spectacular crisis in December 1994
(Sheanan, 1997). However, the Mexican economic crisis was not the only one in the
region. Brazil suffered its last crisis in 1997 and Argentina in 2000. Park (1996) noted
that liberalization had made several East Asian countries more prone to financial crisis.
East Asian markets also suffered a similar economic crisis due to liberalization in 1997
(Chang & Velasco, 2000).
In sum, after the 1930s world economic depression both Latin American and East
Asian economies selected inward industrialization development policies. However, East
Asian economies moved to outward industrialization development policies in the late

20
1950s as world trade reopened. Latin American economies, however, kept its ISI
strategies until the crisis years of the early 1980s. As a result, Latin American firms only
focused on conquering their respective domestic markets. In other words, whereas East
Asian firms have been competing in the world markets for almost fifty years, Latin
American firms have only begun to do so within the last fifteen years. However, both
Latin American and East Asian firms have confronted limited outside competition within
their home markets. The implications for emerging market firms are further explored.
Emerging Market Firms (Before Liberalization)
Extant literature suggest that because emerging market institutions are less
perfect than those in developed markets, unrelated diversification strategies makes sense.
For instance, Khanna and Palepu (1997) argue that local conglomerates3 or business
grupos4 are superior structures designed to internally reproduce the functions of perfect
capital, labor, product markets, and contract enforcement. Wan (2005) also suggests that
inadequate institutions mean difficulty in obtaining needed country resources. Thus,
Wan (2005) concludes that (domestic) emerging market firms are better off
monopolizing country resources rather than improving production efficiency or
transformational capabilities. In this sense, Schuler et al. (2002) found that when facing
3 Although the concept of conglomerates is not exactly the same as the one for grupo firms (grupos), through out this study both words are used interchangeably to mean that the firm follows an unrelated diversification strategy.
4 For Khanna and Rivkin (2001) a grupo is a set of legally independent firms that are bound together by formal and informal ties and which actions are coordinated. According to Strachan (1979), business groups are diversified in several industries.

21
the possibility of foreign competition (i.e., new entries), domestic firms lobby their
government to impose restrictions on FDI.
Pollack (1985) also suggests that business conglomerates (family firms) are
prevalent in emerging markets due to their ‘low-trust’ business environment. For
instance, Weidenbaum and Hughes (1996) found that kinship-based conglomerates,
characterized by strong hierarchical authority and trust, are the prevalent business
structure in many Asian countries.
While it is widely accepted that emerging market firms business structures allow
them to overcome external capital market failures (Williamson, 1975), and ‘low trust’
environments (Pollack, 1985), conglomerate structures also foster sociopolitical-
relational advantages. For instance, Guillen (2000) argues that business grupos in Latin-
America, Korea, India and Turkey have been able to resist the threat of international
competition in their own soil because of their superior informational capabilities. Thus,
according to Guillen (1997), this superiority in local information exchange capabilities
allows domestic firms an asymmetric access to resources and opportunities, and a
competitive advantage over their foreign counterparts. In other words, we can assume
that grupo firms have familiarity advantages since their structure allows them to access
information in several industries at a time. Also, conglomerate structures lead to multiple
interactions with the host country’s authorities, which could translate in both relational
and preferential treatment advantages (e.g., access to information) that firms with other
business structures cannot enjoy. Apparently, in emerging markets conglomerate

22
structures could carry sociopolitical-relation advantages that are absent in other kinds of
business structures.
In sum, the international business literature recognizes that conglomerates have
been successful business structures in emerging markets. Thus, unrelated diversification
strategies can be thought as successful firm responses to the emerging markets business
landscape. Business scholars have utilized four main theoretical perspectives to
understand the business landscape on emerging markets, institutional theory, agency
theory, transactions costs theory and the resource-based view (Wright et al., 2000).
However, as emerging markets business landscapes change radically from a set of
known institutional ‘rules of the game’ (derived from protectionist policies) to
liberalization, extant literature has not yet provide enough insights to a new question:
“How do organizations play the new game when the new rules are not completely
known?” (Peng, 2003: 283).
Emerging Markets (Domestic Firms Response to Liberalization)
While there has been a reasonable amount of research on MNEs on emerging
markets, research on domestic firm responses to liberalization is scarce. Among the few
studies about the specific effects of market liberalization (i.e., a regulatory punctuation
on local firms), Toulan (2002) contends that vertical integration decreases following the
opening of the economy. His study shows that firms responding to market liberalization
were more likely to reduce their presence in peripheral aspects of the value chain, thus
increasing their focus on core competencies. In other words, because liberalization

23
intensifies firm competition (Mortimore, 2000), Toulan concludes that local firms realize
they will no longer be able to compete in every phase of the value chain as effectively.
Guillen (2000) advocates that local firms’ advantages are the result of
asymmetric access to resources, thus, that conglomerate structures allow domestic firms
to obtain a competitive advantage. Toulan (2002) on the other hand, argues that once
liberalization takes place, local firms seek efficiency by focusing in their core
competencies through vertical integration. According to Toulan (2002: 559) “…a closely
related subject which is also in need of further research is the impact of the former (i.e.,
market liberalization) on the horizontal scope of the firm.”
Analyzing the effect of liberalization on partner selection in Russia and China,
Hitt et al. (2004) suggest that emerging market firms pay special attention to the
prospective partner’s technological capabilities. They further advocate that because of
the lack of intellectual property rights in these economies, domestic firms are ill
prepared to compete against the MNEs’ higher research and development capabilities.
Also, Ahlstrom and Bruton (2001) notes that emerging market firms have a higher need
for establishing legitimacy in their home markets; thus alliance partners with strong
reputation allow domestic firms to acquire legitimacy in their respective home market.
Echoing Hitt et al. (2004) and Ahlstrom and Bruton (2001), the study by Gillespie and
Teegen (1995) illustrate the motives behind the formation of strategic alliances between
American and Mexican firms after NAFTA. Gillespie and Teegen (1995) found that
Mexican firms needed greater customer orientation and seek alliances to satisfy the new

24
demands of the business landscape such as new technology and internationally
recognized brand names (legitimacy).
The present study seeks to build in this (recent) research stream of emerging
market firms’ responses to radical business landscape change (e.g., responses to rapid
liberalization).
Liability of Foreignness
This (LOF) literature review hinges in answering three questions: whether LOF
exists, when it exists, and what drives it. Following Eden and Miller (2004), our focus
goes beyond the well-known advantages related to costs of production, distribution, and
other economic-based advantages (i.e., OLI advantages) advocated by traditional IB
theorists (e.g., Dunning, 1995; Rugman, 1981). Thus, our focal point lies in
understanding the “sociopolitical-relational” hazard of foreignness, whether it exists,
when it exists, and what drives it.
Hymer (1976) was the first to argue that, when going abroad, foreign firms
would be at a disadvantage to domestic firms. In his view, these disadvantages or cost of
doing business abroad (CDBA) arose out of the heightened barriers to entry in a host-
country market. For instance, Hymer identified three types of such increased barriers or
disadvantages, namely: 1) informational, 2) discriminatory, and 3) currency exchange.
According to Eden and Miller (2004), CDBA is a well-accepted concept in the
international business literature. However, for years, international business scholars
25
favored the study of MNEs firm-specific advantages instead of their added costs of
doing business abroad (e.g., Dunning, 1977; Dunning & McQueen, 1982; Rugman,
1981;). As a result, during the 1970s and 1980s the CDBA literature did not progress
(Eden & Miller, 2004).
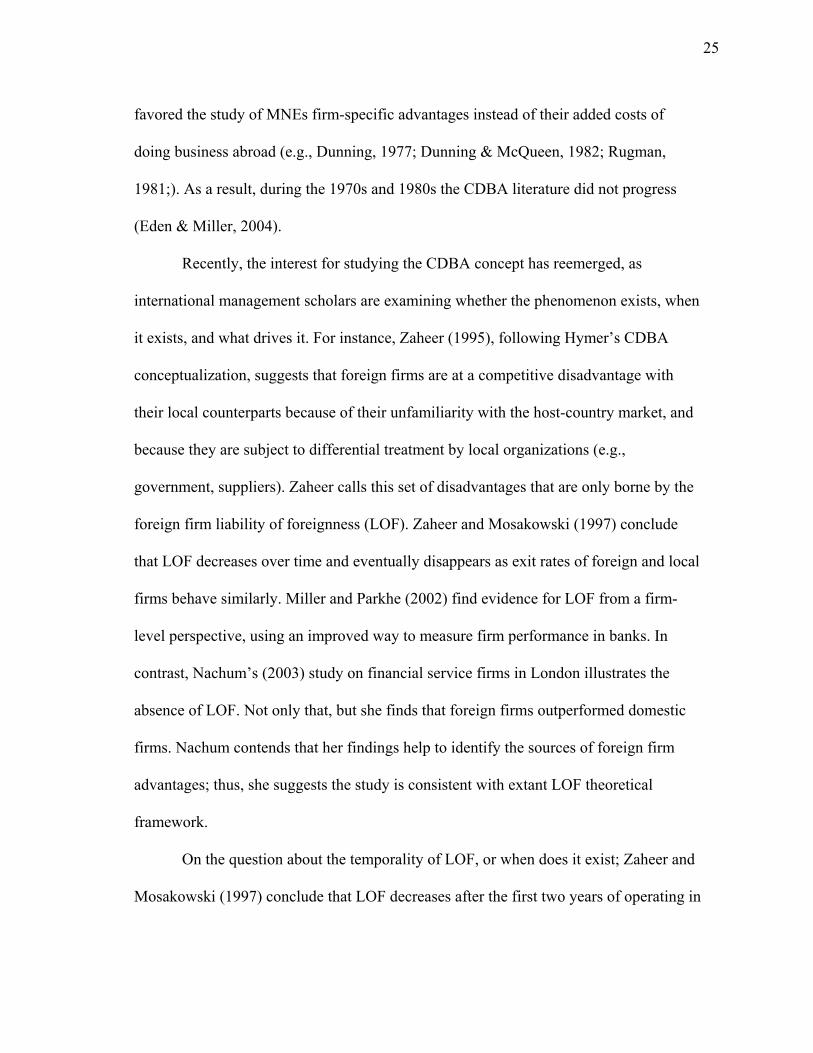
Recently, the interest for studying the CDBA concept has reemerged, as
international management scholars are examining whether the phenomenon exists, when
it exists, and what drives it. For instance, Zaheer (1995), following Hymer’s CDBA
conceptualization, suggests that foreign firms are at a competitive disadvantage with
their local counterparts because of their unfamiliarity with the host-country market, and
because they are subject to differential treatment by local organizations (e.g.,
government, suppliers). Zaheer calls this set of disadvantages that are only borne by the
foreign firm liability of foreignness (LOF). Zaheer and Mosakowski (1997) conclude
that LOF decreases over time and eventually disappears as exit rates of foreign and local
firms behave similarly. Miller and Parkhe (2002) find evidence for LOF from a firm-
level perspective, using an improved way to measure firm performance in banks. In
contrast, Nachum’s (2003) study on financial service firms in London illustrates the
absence of LOF. Not only that, but she finds that foreign firms outperformed domestic
firms. Nachum contends that her findings help to identify the sources of foreign firm
advantages; thus, she suggests the study is consistent with extant LOF theoretical
framework.
On the question about the temporality of LOF, or when does it exist; Zaheer and
Mosakowski (1997) conclude that LOF decreases after the first two years of operating in

26
the host-country and lasts no more than 16 years. Lu and Beamish (2001) demonstrate
that after an initial negative relationship between a firm’s FDI activity and its
performance, performance markedly improves as LOF decreases.5 Thus, according to
extant literature, LOF decreases as foreign firms become familiar with the local
environment (Zaheer, 1995; Lu and Beamish, 2001), gain access to information
networks (Zaheer & Mosakowski, 1997) and earn legitimacy (Kostova & Zaheer, 1999).
According to Hitt et al. (1998), because the competitive landscape is nowadays
more global and technologically driven, frequent discontinuities causing rapid
transformations are more likely to occur. Haveman et al. (2001) also note that sudden
environmental discontinuities caused by shifts in regulatory policies and technological
breakthroughs are likely to precipitate radical organizational change. In this regard, some
LOF theorists have considered the effects of such discontinuities, in particular, the
effects of market liberalization on LOF. For instance, Ataullah and Le (2004) finds that
after market liberalization, the performance of foreign banks in Pakistan and India was
equal or higher than that of Pakistani and Indian banks, respectively. And Zaheer and
Mosakowski (1997) find that under financial market deregulation, local firms are more
likely to exit the market than foreign firms. Also, Nachum (2003) suggests that a
plausible explanation for the absence of LOF in her study of financial services firms in
London is that British policies did not discriminate against foreign firms. In fact,
5 They actually found evidence of an S curve relationship between a firm’s FDI activity (internationalization) and its performance. Explaining the whole aspect of the relationship is beyond the scope of the question of when LOF exist.

27
Nachum (2003) comments that the Big Bang liberalization of the British stock exchange
enhanced the status of the city of London as a premier international financial center.
Taken together, these studies have demonstrated that market liberalization (i.e., a
regulatory punctuation) decreases the negative effects of LOF at the expense of the local
firms. More importantly, these studies allow us to expand our understanding of when
LOF exists, and more importantly, to recognize the external factors that increase or
decrease LOF.
As Eden and Miller (2004: 196) put it, the main disadvantage of an international
firm when going abroad is being a “stranger in a strange land.” In this sense, CDBA and
LOF are no longer seen as interchangeable concepts (Zaheer, 2002). In fact, Eden and
Miller (2004) argue that CDBA consists of both economic-activity decision making
having to do with cost of production, distribution and the like, and LOF. They argue
LOF should (only) be seen as sociopolitical-relational costs, namely: unfamiliarity,
relational, and discriminatory hazards. This clarification is important because it allows
us to better understand the theoretical drivers of LOF. In this sense, Eden and Miller
(2004) identified institutional forces as key drivers of LOF. According to these authors,
legitimacy and institutional distance explain how MNEs adjust to the ‘rules of the game’
or business environment of the host-country (i.e., unfamiliarity, relational, and
discriminatory hazards).
Mezias’ (2002) study is a good empirical illustration of the importance of these
sociopolitical relational costs. He finds that foreign firms conducting business in the US
were more likely than their American counterparts to face unfavorable labor lawsuit

28
judgments. The study supports his claim that American firms’ familiarity with their
domestic legal system plays a key role avoiding undesirable outcomes (i.e., labor
lawsuits). Also, Rangan and Drummond (2004) demonstrate that MNEs from home
countries with closer ties (i.e., less sociopolitical-relational costs) outperform firms from
home countries with more distant ties.
Both Mezias (2002) and Rangan and Drummond (2004) lend credence to Eden
and Miller’s (2004) argument favoring the importance of the sociopolitical-relational
costs beyond the well understood economic-based ones. What is more, these
sociopolitical-relational costs can be understood from the perspective of both foreign and
domestic firms. That is, the unfamiliarly, relational and discriminatory hazards faced by
foreign firms can also be seen as advantages for domestic firms competing with foreign
firms in their home market.
Summary and Conclusions
The main tenets for developing this research are based on previous research on
punctuated equilibrium, emerging economies and liability of foreignness literature.
Because this research explores firm responses to radical environmental change, the
punctuated equilibrium model is utilized to help frame the theoretical environmental
context in general terms (i.e., regulatory punctuations). The emerging markets literature
succinctly addresses both the specific domestic business landscape (i.e., the
environment) and how domestic firms from these markets developed their business
29
strategies, both before and after liberalization. Finally, LOF explores the three
dimensions of sociopolitical-relational disadvantages of MNEs when going abroad,
namely: unfamiliarity, relational, and discriminatory hazards.
Following Hoskisson et al. (2000) and Wright et al. (2005), the review implicitly
acknowledges some of the multi-theoretical lenses that various authors have used when
studying emerging markets (i.e., institutional theory, agency theory, transaction cost
theory and resources-based view). Thus, the present research further contributes on three
of the four strategic options suggested by Wright et al. (2005), namely: 1) firms from
developed markets entering emerging economies, 2) domestic firms competing within
emerging markets, and 3) firms from emerging markets entering developed markets.
As stated in the introductory chapter, the specific contribution of this research
rests on exploring firms’ strategic responses to punctuations on the emerging markets
business landscape. In so doing, the study implicitly considers the emerging markets’
institutional environment (e.g., institutional theory), the most efficient business
structures follow by emerging market firms (e.g., transaction costs), and how some firms
obtain access to valuable resources (e.g., resourced-based view). However, these ideas
are explored within the framework of the punctuated equilibrium model, emerging
markets and liability of foreignness.

30
CHAPTER III
THEORY AND HYPOTHESES
The main purpose of Chapter III is to develop the theoretical rationale to address
the research questions from Chapter I. The hypotheses presented in this chapter seek to
identify the successful strategic responses and characteristics of both multinational and
domestic firms trying to adapt to regulatory punctuations. In so doing, the chapter is
divided in three sections. In the first section, the chapter offers hypotheses about the
strategic responses and characteristics of MNEs. The goal is to contribute to the
international business and strategy literatures by uncovering why some MNEs perform
better than other MNEs in a host (emerging) market, affected by regulatory
punctuations. Next, the chapter presents hypotheses conducive to identifying why some
domestic firms perform better than other domestic firms. Thus, in this section, the
hypotheses are about the success of the strategic responses of domestic (emerging
market) firms facing regulatory punctuations in their home market. The third section
does make a performance comparison between MNEs and domestic firms. However, the
emphasis is placed on the strategic choices made by these firms. In other words, the one
hypothesis posed in this last section seeks to understand if similar strategies are equally
successful for MNEs and domestic firms. The chapter ends with a recount of the
hypotheses.

31
MNE vs MNE
Characteristics
The Strategic Management and International Business literatures have largely
overlooked the performance differences among MNEs competing in a third host market
(Rangan & Drummond, 2004). However, in light of the profound transformations of the
business landscape of the last few years (e.g., globalization), competition among MNEs
in emerging markets is becoming more pervasive (Rangan & Drummond, 2004). Indeed,
emerging markets have moved from protectionism (e.g., Latin America) or central
planning policies (e.g., Russia) towards market oriented policies (Sheanan, 1987, 1997;
Spicer et al., 2000). Because this policy shift effectively changes the ‘rules of the game’
in several emerging markets, firms operating in these markets had to adapt quickly in
order to survive.
Institutions, defined by Scott (1995: 33) as “cognitive, normative, and regulative
structures and activities that provide stability and meaning to social behavior”, reduce
uncertainty by providing dependable and efficient frameworks for economic exchange
(DiMaggio & Powell, 1991). However, during revolutionary periods, such as the ones
brought about by regulatory punctuations (e.g., liberalization policies), following old
institutional rules could become useless as these rules rapidly lose legitimacy (Peng &
Heath, 1996). Apparently, under these conditions, following old institutional rules no
longer reduce uncertainty as they are no longer the consensus for efficient economic
exchange.

32
Zaheer and Mosakowski (1997) found that under financial market deregulation,
local firms are more likely to exit the market than foreign firms. Ataullah and Le (2004)
found that after liberalization, the performance of foreign banks in Pakistan and India
was higher than that of Pakistani and Indian banks, respectively. Judging by these
results, the change of rules (after liberalization) did not affect MNEs as much as it did
domestic firms. Perhaps, because the policy change signified a move towards market
oriented economic policies, MNEs did not experience as much uncertainty as their
domestic peers because MNEs already knew how to operate under market oriented
conditions. While the literature demonstrates that MNEs outperformed their domestic
counterparts after liberalization, implying a sharp decrease of LOF (e.g., Zaheer &
Mosakowski, 1997), we are yet to know why some MNEs outperformed other MNEs
after liberalization.
Eden and Miller (2004) identify institutional forces as key drivers of LOF.
According to these authors, legitimacy and institutional distance explain how MNEs
adjust to the ‘rules of the game’ or business environment of the host-country (i.e., adjust
to the host-country’s unfamiliarity, relational, and discriminatory hazards). However,
during a regulatory punctuation (e.g., liberalization), emerging market institutions are in
a state of flux. According to Gersick (1991), during a punctuation (i.e., a revolutionary
period), firms try to adapt to a new set of environmental rules. Yet, because this change
is not part of a life cycle, end-states are unknown. Under these circumstances of
evolving institutionalization where new rules for economic exchange are being tested
and selected, carefully gauging how institutions evolve should allow MNEs to better
33
adapt to the new environmental rules. In other words, Eden and Miller’s (2004) assertion
that institutional distance explains the MNEs ability or inability to adapt to the new
‘rules of the game’ of a host country, should become even more important during
regulatory punctuations.
Rangan and Drummond (2004) found support for the notion that MNEs that are
from (institutionally) closer host nations, that is, MNEs whose home nation has stronger
ties to a focal host nation will outperform their competition. For instance, they mention
that the Dutch Unilever and the American Procter & Gamble, two equally large and
powerful MNEs, dominate each other in Europe and North-America, respectively.
According to them, this is because the Netherlands have stronger ties with European
host-nations than America does, while the US has stronger ties with their North-
American neighbors than the Netherlands does.
Following this rationale, it seems that MNEs from countries with closer ties to
the target host market are better aligned to the host market’s business landscape (Rangan
& Drummond, 2004). It is also apparent that after liberalization, old institutions from
emerging markets began to collapse as protectionist and central planned economic
policies were substituted by market oriented policies (Peng & Heath, 1996). Because
MNEs had experience operating under these conditions, MNEs outperformed domestic
firms during this regulatory punctuation (e.g., Ataullah & Le, 2004). However, because
new institutions in emerging markets would probably evolve slowly and would not
become exact replicas of those from developed markets, MNEs from countries with

34
stronger ties to the target host market will be in a better position to align to the evolving
institutions. Following this explanation, I hypothesize the following:
Hypothesis 1. Among MNEs competing in an emerging host market, MNEs from
countries with stronger (closer) ties to that host market will outperform6 MNEs from
countries with weaker (more distant) ties to that host market.
Strategic Alliances
Liability of foreignness advocates that when firms enter a foreign market they are
at a disadvantage compared to their local counterparts because they face unfamiliarity,
relational and discriminatory hazards (Eden & Miller, 2004). Thus, often times MNEs
form cooperative arrangements with domestic firms to improve their ability to gain a
competitive advantage in the host market. For instance, Glaister and Buckley (1996)
suggest that international strategic alliances are critical for firm success. According to
Oliver (1990), an alliance could be formed due to one of five reasons: 1) asymmetry, to
increase power and market share; 2) reciprocity, to obtain synergies in technology and
information sharing; 3) efficiency, to achieve economies of scale; 4) stability, to share
risks when entering new markets, and 5) legitimacy, for enhancing the profile of the
organization within the industry.
Doz (1996) argues that strategic alliances improve the partners’ environmental
adaptation, and Kraatz (1998) also finds that strategic alliances enhance the firms’
6 According to Barney (2002), survival is one of the four major approaches used to measure firm performance. In this study, firm survival is the measure of firm performance.

35
adaptability to their business landscape through their improved ability to acquire
knowledge. In a related vein, Osborn and Hagedoorn (1997) acknowledge that strategic
alliances have gained popularity as a means for entering international markets.
Apparently, firms entering new markets need to obtain certain resources or develop
certain capabilities to remain competitive (Hitt et al., 1999). Thus, it is clear that through
strategic alliances, firms seek to effectively respond to the challenges of the new
business landscape (Bettis and Hitt, 1995; Das and Teng, 1996; Prahalad, 1999).
Beamish (1994) suggests that when forming alliances, MNEs emphasize market
knowledge and access to customers and distribution channels. Particular to the context of
emerging markets, Hitt et al. (2000) argue that when forming strategic alliances, MNEs
also seek to learn about the culture and idiosyncrasies of the host market. Thus, they
conclude that MNEs form strategic alliances with emerging market firms mainly to gain
knowledge about the local (emerging) market. In contrast, Hitt et al. (2000) find that
emerging market firms (i.e., local firms) want technological capabilities and intangible
assets from their alliance partners.
In congruence to these arguments, Gillespie and Teegen (1995) explain the
motives behind the strategic alliances between American and Mexican firms in light of
the NAFTA. Gillespie and Teegen (1995) found that Mexican firms needed greater
customer orientation and seek alliances to satisfy the new demands of the business
landscape such as new technology and internationally recognized brand names. In
contrast, their American partners’ main motivations were to increase geographic market
access, geographic market knowledge, customer access, and access to marketing

36
infrastructure. While access to local knowledge is always desirable as it decreases LOF,
because the business landscape changes radically during regulatory punctuations, the
need to adapt to this changing environment is critical for the success of the MNE. Also,
because MNEs are in competition against one another, they need to adapt quickly in
order to be successful.
In other words, MNEs that form alliances with local firms will be better able to
acquire the necessary resources to compete successfully in the focal host market than
those MNEs without local alliances. According to Hitt et al. (2000), MNEs are likely to
have the necessary absorptive capacity to obtain local knowledge. Thus, in congruence
with these arguments, I predict the following:
Hypothesis 2. Among MNEs competing in an emerging host market, MNEs
forming strategic alliances with local partners will outperform MNEs that do not.
International Diversification Strategies
Franko (2004) demonstrates that developed market firms turned away from
unrelated diversification strategies, and even related diversification strategies, in favor of
focused strategies. His study shows that among the top American, European and
Japanese firms, the number of product diversified firms (those with more than 20 percent
of their sales outside their main industry), dropped by half between 1980 and 2000. In
contrast, Franko (2004) also finds the number of developed market firms turning away
from product diversification strategies (those with 95 percent or more of their sales
within their main industry), increasing dramatically during that same time frame.

37
Nonetheless, the relationship between product diversification and firm performance has
remained elusive (Hoskisson & Hitt, 1990). According to Hill et al. (1992) this could be
because most of the research on diversification has overlooked the importance of firm
internal organizational arrangements.
More recently, however, the topic of international diversification has gained
favor among corporate diversification scholars (e.g., Delios & Beamish, 1999; Hitt et al,
1994). Because international diversification strategies seek to leverage firm-specific
capabilities or ownership advantage (Dunning, 1977), Geringer et al. (2000) argue that
higher international diversification should be preferred as long as MNEs can maintain
their ownership advantage. In a related vein, Hitt et al. (2000) suggest that because
MNEs are likely to have a higher number of learning experiences than local emerging
market firms, MNEs should possess higher absorptive capacity (Cohen & Levinthal,
1990). Thus, it follows that MNEs can profit from international diversification not only
through their ownership advantage (Dunning, 1977), but also through increasing their
learning experience repertoires.
Previous studies find that international diversification is positively related to firm
performance, albeit not linearly (e.g., Geringer et al., 1989; Hitt et al., 2001). Hitt et al.
(2002: 265), however, caution that international diversification can be carried too far,
meaning that “firms can grow only so large and diverse before becoming
unmanageable.” According to Delios and Beamish (1999), the positive effect of
international diversification on firm performance comes as a result of both the
possession of superior resources (i.e., proprietary assets) and the acquired ability to

38
develop new technological expertise. For instance, Kim et al. (1993) argue that the more
internationally diversified a firm is, (i.e., ‘the more multinational’), the greater the
opportunities to leverage its resources and increase its performance. However, the extant
literature has yet to test the link between the MNE’s international diversification and the
performance of its subsidiary in a focal emerging market. In other words, do more
internationally diversified MNEs hold an advantage over less diversified ones when
entering a new (emerging) market?
Important to the context of the present study, regulatory punctuations are likely
to create the need for new organizational designs (Baum et al., 1995). Thus, under these
circumstances, organizations might need to change their current business archetypes
(Gersick, 1991). According to Greenwood and Hinings (1988, 1993) organizations
facing such revolutionary periods will seek to reconfigure their business archetypes
based on their learning experiences or repertoires. In this sense, because during
revolutionary periods (Gersick, 1991), organizations operating in these contexts are
trying to make sense of the evolving business landscape, it follows that firms with larger
business repertoires should adapt more quickly. In other words, more internationally
diversified firms7 (i.e., firms with larger repertoires) should be quicker to identify the
proper business archetype for that particular market based on their previous experiences.
Following this explanation, I hypothesize the following:
7 This statement assumes firm manageability (Hitt et al., 2002) and the maintenance of the firm’s ownership advantage (Dunning, 1977).

39
Hypothesis 3. Among MNEs competing in an emerging host market, more
internationally diversified MNEs will outperform less internationally diversified MNEs.
Domestic vs Domestic
Diversification Strategies
Corporate Diversification. Because emerging economies lack adequate
institutions, emerging market firms typically use conglomerate structures as a means to
internally reproduce the functions of capital, labor, and product markets (Khanna and
Palepu, 1997). As a result, several conglomerates have secured monopoly status as
unrelated diversification facilitates frequent interaction between firms and local
governments (Chazan, 2000).
These internalization strategies of conglomerates in emerging markets translate
into sociopolitical-relational advantages. For instance, Guillen (2000) argues that
business conglomerates have been able to resist the threat of international competition in
their home market because of their superior informational capabilities. According to
Guillen (2002), this superiority in local information exchange capabilities gives domestic
firms asymmetric access to resources and opportunities, and thus, a competitive
advantage over their foreign counterparts. Congruent to the idea of asymmetric access to
information, Wan (2005) suggests that emerging market firms succeed with unrelated
diversification because it fosters social ties with key stakeholders (e.g., government
officials or bank officers).

40
Considering the effects of market liberalization on local firms, Toulan (2002)
contends that vertical integration decreases following the opening of the economy. His
study shows that firms responding to liberalization were more likely to reduce their
presence in peripheral activities of the value chain, thus increasing their focus on core
competencies. In other words, because liberalization intensifies firm competition
(Mortimore, 2000), local firms realized they were not able to compete in every phase of
the value chain as effectively as before. In contrast, Guillen (2000) advocates that local
firms’ advantages are the result of asymmetric access to resources; thus, business grupos
are the superior business structure in these environments.
The extant literature has not addressed the performance implications of either of
these strategies, following liberalization. In this sense, we still do not know whether an
emerging market firm (following liberalization), should favor vertical integration
(market capabilities) or grupo membership (non-market capabilities).
According to D’Aveni and Macmillan (1990), under strenuous situations (e.g., a
regulatory punctuation), firms should focus their attention on the external environment
rather than on the internal aspects of the business. Their argument rests on the notion
that most internal aspects of the business are not necessarily aligned with the new
business landscape and will need to change. Thus, they demonstrate that firms focusing
on the internal aspect of the business during challenging circumstances are indeed
focusing on what might no longer work (given the new environment).
Because regulatory punctuations force local firms to reinterpret their new
business landscape (i.e., the external environment), it follows that firms with greater
41
informational capabilities should have an advantage over firms with lesser informational
capabilities. Under this rationale, grupo firms, which Guillen (2000) argues have
superior abilities to scan the environment, should have an advantage over those firms
that are not part of a grupo, and thus, do not have the same environment scanning
abilities. Thus, in congruence with these arguments, I predict the following:
Hypothesis 4. Among local firms competing in an emerging market, those local
firms that are members of a grupo will outperform local firms without such membership.
Product Diversification
Indeed, Toulan (2002) finds emerging market firms turning away from vertical
integration, after liberalization, in order to focus more on their core competencies.
However, he also recognizes that extant literature has yet to find whether there is a link
between corporate diversification and performance. Product diversification is defined as
a firm’s diversification into several product markets within a single business unit (Wan
& Hoskisson, 2003).8 Wan and Hoskisson demonstrate that product diversification is
positively related to firm performance in the context of less munificent environments. In
other words, it follows that under emerging market contexts, ‘non-market capabilities’
(e.g., social ties) should be more important than market capabilities (Wan, 2005).
Bae et al. (2002) illustrate the importance of social ties in emerging markets
under a regulatory punctuation by showing that adverse shocks to Korean banks also had
8 This definition is consistent with Wan and Hoskisson’s (2003). However, the present study focuses on the product diversification of the single business unit. Thus, this is not corporate diversification.
42
a negative effect on the value of their clients’ firms. Thus, they conclude that when a
bank does poorly and suffers from a decreased ability to lend, the client’s firm is also
negatively affected because the firm loses the benefits of the durable bank relationship.
In this sense, under regulatory punctuations, emerging market firms should be more
likely to diversify their products to emphasize their non-market capabilities over their
market capabilities. Following this explanation, I hypothesize the following:
Hypothesis 5. Among local firms competing in an emerging market, local firms
with higher product diversification will outperform local firms with lower product
diversification.
International Diversification
International business scholars argue that MNEs have two main motivations to
engage in international diversification: 1) exploiting their capabilities in international
environments (Hymer, 1976; Dunning, 1977), and 2) exploring or augmenting their
knowledge base (Cantwell, 1989). For local firms facing a new business landscape,
perhaps the motivation is not to exploit their capabilities, but rather, to learn how to
compete under a different set of rules. Hillman and Hitt (1999) comment that many local
firms are dominant in their home market because of their quasi-monopoly status. This
suggests that most local firms might lack the resources or capabilities to compete in
developed markets. However, local firms can still benefit from international
diversification by transferring back their learning experiences.
43
Hitt et al. (2000) suggest that emerging market firms may lack the necessary
absorptive capacity to learn from developed market sources. However, under a
regulatory punctuation that demands local firms to operate under developed market like
conditions (i.e., market oriented conditions), international diversification might help
local firms understand how to better align with the new environment. Thus, the lack of
technological absorptive capacity might not be problematic for the local firm seeking
internationalization, at least at the punctuation’s start. In this sense, by centering their
attention on how to better understand the external environment, rather than the internal
aspects of their firm, local firms should expedite their environmental learning (e.g.,
D’Aveni and Macmillan, 1990).
Alternatively, local firms that do not engage in international diversification might
take more time to understand how to compete under the new business environment. For
instance, Gillespie and Teegen (1995) note that local firms only gain limited knowledge
about international markets when forming an international strategic alliance. Thus, I
hypothesize the following:
Hypothesis 6. Among local firms competing in an emerging market, more
internationally diversified local firms will outperform less internationally diversified
local firms.
Non-Market Capabilities
Because local firm advantages in emerging markets can be derived from
asymmetric access to resources (Guillen, 2000), it follows that their competitive

44
advantage hinges on their ability to access asymmetric information or opportunities,
rather than in their market capabilities (Wan, 2005). For instance, according to Gruben
and Welch (1996), the high price-to-book ratios offered by Mexican investors to buy the
state-owned banks in the early 1990s were a sign that these investors expected the
industry to remain uncompetitive. In other words, a certain (monopolistic) performance
expectation had already been set (by these investors) by virtue of being part of the
selected group of new bank owners. Table 3.1 shows the prices that Mexican investors
paid for the formerly state owned banks.
As regulatory punctuations (e.g., liberalization) abruptly changed the emerging
markets business landscape, some domestic firms opted to focus on developing market-
oriented capabilities (e.g., efficiency, technology) to defend their market share. For
instance, Chang and Velasco (2000) suggest that liberalization policies encourage
greater risk taking by competitive banks to defend their market share. However,
Mortimore (2000) suggests that firms operating in countries or regions not accustomed
to fierce competition (e.g., Latin America), could soon face a traumatic experience.
Indeed, Kaminsky and Reinhart (1998) find that financial crises occur when an economy
is fueled by overlending. For these authors, overlending is a classic example of an ‘ultra’
competitive behavior exhibited by most financial institutions after financial deregulation.
Also, Sachs et al. (1996) find that countries that experienced lending booms, as a result
of liberalization, were more likely to suffer currency crises.

45
TABLE 3.1 Commercial Banks Reprivatized by the Mexican Government (1991-1992)
Date Bank Name % of Shares
Sold Amount received
(Millions of USD*) Price/Book
Value 6/7/1991 Mercantil de Mexico (Probursa) 77.2 202 2.66
6/14/1991 Banpais 100 180 3.03 6/21/1991 Banca Cremi 66.7 248 3.40 8/2/1991 Confia 78.7 295 3.73 8/9/1991 Banco de Oriente 66 74 4.04
8/16/1991 Bancrecer 100 141 2.53 8/23/1991 Banamex 70.7 3,227 2.63 10/25/1991 Bancomer 56 2,848 2.99 11/8/1991 BCH 100 291 2.68 1/24/1992 Serfin 51 915 2.69 2/7/1992 Comermex 66.5 876 3.73
2/28/1992 Somex 81.6 607 3.31 3/27/1992 Atlantico 68.5 475 5.30 4/3/1992 Promex 66 348 4.23
4/10/1992 Banoro 66 368 3.95 6/12/1992 Mercantil del Norte (Banorte) 66 575 4.25 6/26/1992 Internacional (Bital) 51 481 2.95 7/3/1992 Centro 66.3 281 4.65 6/7/1991 Mercantil de Mexico (Probursa) 77.2 202 2.66
6/14/1991 Banpais 100 180 3.03 6/21/1991 Banca Cremi 66.7 248 3.40
Total $12.433 *Dollar-Peso Average Exchange Rage 1991=3.01615 1992=3.09408 The amount paid does not assume 100% ownership. In all cases, however, the controlling interest surpassed 51%. Source: Hovey (1996: 247-250); Rogozinski (1998: 131)
Essentially, local firms which usually obtain their competitive advantage through
monopolistic status (Chazan, 2000) were forced to compete under a more leveled
playing field (after liberalization). For instance, both Kaminsky and Reinhart (1998), and
Sachs et al. (1996) find that by increasing their lending portfolios, banks tried to defend
their market positions (gained through monopolistic status). However, these authors also

46
find that countries in which financial institutions did not engage in overlending did not
experience currency crises.
Because local firms’ competitive expertise rests within the realm of non-market
capabilities such as social ties (Wan, 2005), it is unlikely that they can develop market
capabilities as soon as the environment demands it. Thus, it follows that local firms
enjoying monopolistic status are unlikely to maintain their market status by engaging in
aggressive market-oriented (as opposed to non-market-oriented) growth strategies (e.g.,
overlending) against their foreign counterparts or other local firms. In this sense, firms
that deviate from their strengths (i.e., non-market capabilities) by engaging in aggressive
market-oriented growth strategies, rather than keeping their focus on developing socio-
political relational advantages (asymmetric access to resources), should be less
successful in their respective industry. Thus, in congruence with this argument, I predict
the following:
Hypothesis 7. Among local firms competing in an emerging market, local firms
following less aggressive (market-oriented) growth strategies will outperform local firms
following more aggressive (market-oriented) growth strategies.
Strategic Alliances
Business scholars argue that strategic alliances improve the firms’ ability to
acquire knowledge, thereby increasing their ability to adapt to the changing business
landscape (Kraatz, 1998; Doz, 1996). Also, Osborn and Hagedoorn (1997) acknowledge
that strategic alliances have gained popularity as a means for entering international
47
markets. Firms entering new markets often need to obtain certain resources or develop
certain capabilities to become competitive (Hitt et al., 1999).
Ataullah and Le (2004) demonstrated that liberalization had a positive effect on
foreign banks operating in India and Pakistan. Zaheer and Mosakowski (1997) found
that under financial market deregulation, local firms were more likely to exit the market
than foreign firms. Taken together, these studies show that market liberalization
decreases the negative effects of LOF at the expense of the local firms. In this sense, as
LOF decreases for MNEs under market liberalization policies, local firms’ advantages or
the benefit of being local also decreases. Thus, after the playing field is leveled, MNE
production, distribution, and other economic-based advantages (e.g., Dunning, 1977;
Rugman, 1981) are likely to offset the remaining disadvantages of LOF. In contrast,
local firms need to learn to operate in a new environment while competing with new
rivals.
According to Sun Tzu (600 BC) (1988), if an army knows the enemy and itself,
in a hundred battles it will never be defeated. However, if an army is ignorant of the
enemy but knows itself, its chances of winning or losing are equal. And if ignorant both
of the enemy and itself, then, defeat will be guaranteed in every battle. Because local
firms are, to a large extent, ignorant of both the new environment and their new foreign
competitors (i.e., after the regulatory punctuation), continuing their same strategies
should guarantee them “defeat in every battle.” Therefore, the pursuit of strategic
alliances with foreign partners should allow EMFs to gain important knowledge about
both the new environment and their new competitors. This is because local firms cannot

48
gain this knowledge from other local firms or through prior experience. According to
Miner et al. (1990), interorganizational linkages increase a corporation’s ability to
transform by having a more complete understanding (thus, less uncertainty) of the new
environment. Further, forming an international strategic alliance with an MNE might
help the local firm to acquire knowledge about how to operate in the new environment
and compete against new rivals. Thus, I hypothesize the following:
Hypothesis 8. Among local firms competing in an emerging market, local firms
forming strategic alliances with international partners will outperform local firms that
did not.
Social Capital
According to Powell and Smith-Doerr (1994), social capital is both the glue of
the network and the lubricant that enables network interaction. From this perspective,
emerging market firms seek to gain a competitive advantage through non-market
capabilities (Wan, 2005) by filling structural holes, that is, by developing their social
capital. For Burt (1997), structural holes are the disconnection between individuals (or
organizations) in a marketplace. Because this disconnection leaves individuals unaware
of the benefits they could offer one another, filling the disconnection (i.e., the structural
hole) creates information benefits (e.g., access, timing, referrals). Thus, social capital is a
function of brokerage opportunities in a network (Burt, 1997). In this sense, because
domestic firms attempting to develop their social capital can gain broker advantages as a
member of a tight network (Kogut & Zander, 1996), they are also able to influence and

49
interpret the local environment efficiently. In other words, local firms high in social
capital are able to connect the structural holes that exist in the market and gain
information benefits such as access, timing or referrals, or as Guillen (2000) puts it gain
asymmetric access to resources.
Because local firms are often part of a network of firms, it is easy to think of
them as embedded in a network. For Uzzi (1996), embeddedness is the process by which
social relations shape economic action in ways that economic schemes incorrectly
specify when they assume that social ties affect economic behavior only minimally.
Further, Granovetter (1985) suggests that embeddedness stresses the role of social
structures and relations in the generation of trust and the discouragement of malfeasance.
Uzzi (1997) also notes that embedded ties facilitate efficient investments by reducing
risks (matching known investors through a network structure) and increasing good will
and reciprocity. In addition, he notes that embedded ties promote economies of time (the
ability to capitalize quickly on market opportunities) due to lower costs of monitoring
and establishing contractual safeguards.
However, abrupt changes of the business landscape may diminish the value of
social capital. For instance, Uzzi (1997) states three reasons that turn embeddedness into
a liability. First, the unexpected loss of a core network member might disrupt the
benefits of network membership. Second, and related to the first, is a change in the
institutional arrangements that underscore the network. And third, is the problem of
being overembedded in a network, where too high a proportion of embedded ties in a
network lead to too few links to outside members who might contribute innovative ideas.

50
Under emerging market arrangements, local firms such as grupo firms that are
embedded in a network of firms have obtained a competitive advantage (e.g., Guillen,
2000; Khanna & Palepu, 1997). However, regulatory punctuations such as liberalization
policies might turn embeddedness into a liability. For instance, because local firms
might no longer have superior knowledge about the local business landscape because
liberalization requires a higher emphasis in market capabilities (Wan, 2005), the value of
the social ties could be lost. In this sense, following inertial practices on how to transact
(after the regulatory punctuation) might translate in a liability for the embedded firms.
On the other hand, Blyler and Coff (2003) propose that social capital is a
necessary condition to develop dynamic capabilities. Eisenhardt and Martin
(2000: 1007) define dynamic capabilities as the firm’s “processes to integrate,
reconfigure, gain and release resources, to match and even create market change.”
According to Teece et al. (1997), dynamic capabilities allow firms to gain a competitive
advantage by reconfiguring or adapting to the environment. And Grant (1987) suggests
that social capital is a key mechanism for knowledge integration.
Although, it is clear that after regulatory punctuations that favor liberalization
local firms lose some of their advantages against foreign firms, it is also clear that not all
domestic firms lose their advantages (e.g., Ataullah and Le, 2004; Zaheer and
Mosakowski, 1997). For instance, Guillen (2000) argues that local firms prosper under
asymmetrical paths to development. He advocates that either through export-led or
import substitution policies, the local government aims to favor (some) local firms.
Moreover, though necessary, social capital is not sufficient (alone) to allow a firm to

51
foster dynamic capabilities. However, absent social capital, firms would be unable to
interpret the flow of information in a volatile environment (Blyler and Coff, 2003).
In sum, while social capital alone might not be enough to allow domestic firms to
overcome the market capabilities of MNEs, social capital might still provide advantages
against other domestic firms. Social capital is an essential component of a dynamic
capability in that it enables resource management (Eisenhardt and Martin, 2000). Thus,
in congruence with this argument, I predict the following:
Hypothesis 9. Among local firms competing in an emerging market, local firms
with higher social capital will outperform local firms with lower social capital.
MNEs vs Domestic Firms
Acquisition Strategies
Mergers and acquisitions are perhaps the most aggressive organizational
response to resource dependence. Through an acquisition, the organization is trying to
mitigate the resource dependence through internalization. In other words, the acquiring
firm tries to bring the resource dependence under its control. For instance, Burt
(1977: 70) states that “the most direct strategy for eliminating a source of market
constraint would be to purchase an establishment within the constraining sector.” Also,
according to Pfeffer and Salancik (1978), horizontal acquisitions (i.e., acquisitions of
firms competing in the same industry as their acquirers), seeks to reduce commensalistic
dependence by simultaneously reducing competition and increasing power.

52
In contrast to internationalization or strategic alliances, which help firms
understand how to better align with the new environment, acquiring a local competitor
does not necessarily improve the knowledge stock about the new environment. However,
through a domestic acquisition, the buyer does ‘buy’ time by virtue of mitigating its
resource dependence. In this sense, firms that acquire their competitors are able to cope
with adversity for a longer period of time than those firms that did not acquire
competitors nor gain new insights on how to compete under the new regulations. Also
inherent to any merger and acquisition is the concept of growth, which increases the
probability of survival (Katz & Kahn, 1966). Thus, in congruence with this argument, I
predict the following:
Hypothesis 10. Among both MNEs and emerging market firms operating in an
emerging market, those that engage in more acquisition activity will outperform those
with less acquisition activity.
Summary
Chapter III presents a total of 10 hypotheses (see Table 3.2 for a summary of the
hypotheses). The first section compares the performance of MNEs operating in a host
emerging market, under a regulatory punctuation (e.g., liberalization). One particular
characteristic and two strategic responses are examined. The MNE characteristic argued
to positively affect MNE performance is the extent of the MNEs’ sociopolitical-
relational ties with the host nation institutions. In terms of the responses, this section

53
suggests that alliances and international diversification strategies are positively related to
MNE performance.
TABLE 3.2
Summary of Hypotheses Hypothesis 1: Among MNEs competing in an emerging host market MNEs from countries
with stronger (closer) ties to that host market will outperform MNEs from countries with weaker (more distant) ties to that host market.
Hypothesis 2: Among MNEs competing in an emerging host market MNEs forming strategic alliances with local partners will outperform MNEs that do not.
Hypothesis 3: Among MNEs competing in an emerging host market more internationally diversified MNEs will outperform less internationally diversified MNEs.
Hypothesis 4: Among local firms competing in an emerging market those local firms that are members of a grupo will outperform local firms without such membership.
Hypothesis 5: Among local firms competing in an emerging market local firms with higher product diversification will outperform local firms with lower product diversification.
Hypothesis 6: Among local firms competing in an emerging market more internationally diversified local firms will outperform less internationally diversified local firms.
Hypothesis 7: Among local firms competing in an emerging market local firms following less aggressive (market-oriented) growth strategies will outperform local firms following more aggressive (market-oriented) growth strategies.
Hypothesis 8: Among local firms competing in an emerging market local firms forming strategic alliances with international partners will outperform local firms that did not.
Hypothesis 9: Among local firms competing in an emerging market local firms with higher social capital will outperform local firms with lower social capital.
Hypothesis 10: Among both MNEs and emerging market firms operating in an emerging market those that engage in more acquisition activity will outperform those with less acquisition activity.
The next section compares the performance of domestic firms operating in an
emerging market, under a regulatory punctuation. The section examines the following
domestic firm strategic responses: corporate diversification, product diversification,
international diversification, aggressive market-oriented growth strategies, alliances, and
social capital. All diversification strategies are hypothesized to be positively related to

54
firm performance. Furthermore, aggressive market-oriented growth is the only
hypothesis of this section that suggests a negative relation to firm performance. Lastly,
the chapter ends with a general hypothesis about acquisition strategies, where it is
argued that acquisition strategies for either MNEs or domestic firms are positively
related to firm performance.

55
CHAPTER IV
PILOT TEST: A DESCRIPTIVE ANALYSIS
Chapter IV is both a pilot test and a descriptive analysis of hypotheses 1, 2, 4,
and 7, presented in three sections. In the first section, the chapter begins with a brief
summary of the four regulatory punctuations that most affected the Mexican banking
industry (1990-2004). Next, the chapter presents an account of how these punctuations
affected the banks operating in Mexico during that period and identifies why some banks
perform better than others. Essentially, the first section represents the descriptive
account of the regulatory punctuations. The second section, on the other hand, tests the
effectiveness of the firms’ characteristics and strategic responses to these punctuations
(hypotheses 1, 2, 4, and 7). Finally, a summary of the results and a brief commentary is
offered.
The strategic management and international business literatures have produced a
wealth of research gauging the actions and strategic shifts of large multinational
corporations (e.g., Ferrier, 2001; Luo & Peng, 1999). However, this research has
emphasized performance comparisons between multinational and domestic firms, largely
overlooking the performance differences among foreign multinational firms competing
in a third host market (Rangan & Drummond, 2004). Likewise, a review of these
literatures reveals a need to better understand emerging market firms strategic responses

56
to radical environmental change. For instance, Doh (2000) recognized the scarcity of
studies on firm-level responses to regulatory punctuations such as mass privatization.
To contribute to the extant literature in strategic management and international
business, the present study uses the case of the Mexican banking industry as its sample.
Mexico is classified as an emerging market by Hoskisson et al. (1999) and the banking
industry had several regulatory punctuations. Thus, this sample is adequate to test the
proposed hypotheses.
The Four Regulatory Punctuations
Theoretical and Empirical Antecedents
In the past fifteen years, the Mexican banking industry has experienced several
regulatory punctuations. Several authors have explained the reasons and effects of these
punctuations at the country and industry levels. For instance, White (1991) touches on
the political reasons and implications of the nationalization, whereas Zebadúa and Kolari
(1997) take a historical perspective. Ortiz 1994) and Hovey (1996) offer a detailed
description about how the reprivatization process unfolded, whereas Unal and Navarro
(1999) and Haber and Kantor (2003) take a more critical perspective. In fact, according
to Haber and Kantor (2003: 12) “The Mexican banking system was set for collapse right
from the start of the privatization.” Finally, most studies about the industry’s
liberalization consider the role played by Mexico’s exchange rate crisis (1994-1995). For
instance, Froot and McBrady (1996), and Maskooki (1994) recount how the crisis

57
unfolded. And Yacaman (2000) and Murillo (2000) present an account of the industry’s
evolution once the crisis onsets (1995-2000).
Although there are plenty of studies about the Mexican banking industry from a
macroeconomics perspective (i.e., country level of analysis), there are no comprehensive
studies about the effects of regulatory punctuations at the firm level, either for
multinational or domestic banks. In other words, previous researchers have not studied
why some banks performed better than others under the new state constraints or new
“rules of the game.”
The Punctuations
1. Reprivatization of the Mexican Banking Industry (1990-1992). In 1990, the
Mexican Congress authorized two main modifications to the banking law.
The first change would allow for the return of (domestic) private banks to do
business in Mexico. The second, and perhaps more important change, would
allow for banking services to be treated as a regular economic activity, rather
than as a concession from the government. This change was important in the
sense that the Mexican government would no longer be able to nationalize
banks (legally). It could however, revoke their authorization to operate, but
not take them over as it did in the 1982 nationalization (Ortiz, 1994).
As the authorization took place, Mexican President Salinas issued a document
providing the basis for the sale of the 18 commercial banks owned by the government
(Table 3.1). This document also established the Bank Divesture Committee, created to

58
oversee the sale of the state-owned banks (Ortiz, 1994). Also, the reprivatization era
marked the first time in history that Mexican authorities granted bank authorizations (not
concessions) for new institutions. The first such institutions (Interestatal and
Interacciones) began operations in the last quarter of 1993.
2. Mexican Banking Industry Provisions for NAFTA (1994). The North
American Free Trade Agreement (NAFTA) took effect on January 1, 1994.
About the provisions of the Mexican banking industry in light of NAFTA,
there are some important limitations. Although Mexico would grant
permission to American and Canadian financial firms to operate in Mexico,
these firms would face certain market share limitations. These limitations
would start immediately (1/1/1994) and would be phased out through the year
2000 (Ortiz, 1994: 181). During the transition period, the maximum market
share allowed for banking institutions from the US and Canada would be
gradually increased from 8% to 15%; although the maximum individual
market share for an American or Canadian bank could not exceed 1.5% of the
Mexican banking industry. After the transition period, American and
Canadian banks would be permitted to gain up to 4% of individual market
share had this come as a result of buying a Mexican bank. However, Mexican
authorities could stop the growth of foreign bank subsidiaries for up to three
years if the combined market share of foreign banks amounted 25% (or more)
of the industry (Ortiz, 1994: 181-182).

59
3. Exchange Rate Crisis, FDI Restrictions Relaxed (1995). In December 20,
1994, the Mexican government implemented a 15% devaluation of the peso
(Froot & McBrady, 1996; Maskooki, 1994). Applying this policy change
marked the beginning of the worst economic recession of this country’s
history. However, the extent of the crisis became clearer during the first days
of 1995. In fact, American President Clinton had to approve an economic
rescue package for Mexico on January 11, 1995 as the Mexican GDP fell 7%
in 1995 (Krueger & Tornell, 1999; Wilson et al., 2000).
The crisis also forced the Mexican authorities to carry out a radical revision to
the country’s banking law, which came into effect in March 1995. This adjustment
reduced market-share limitations imposed in the NAFTA’s transition period, increasing
both the individual and industry-wide market share that international banks could hold.
From this date on, each foreign bank could control up to 6% of the Mexican banking
industry, and in total, all foreign banks combined could have up to 25% market share of
the industry. Had this change not occurred, foreign banks could only have controlled
1.5% individually and 9% in total. This modification did not include the largest three
Mexican banks (i.e., Banamex, Bancomer and Serfin). That is, these three banks could
only be owned by Mexican nationals (Mendoza & Torre, 1999).
4. FDI Restrictions Canceled (1998). To avoid future costly financial rescue
packages, the Mexican lawmakers passed four significant banking law
amendments (12/14/1998). The first amendment allowed for the creation of
the Institute for the Protection of Bank Savings, which oversees the

60
establishment of a new deposit insurance program. The insurance aims to
mimic what has already been established in countries such as the United
States. The insurance deposit amounted to 400,000 UDIS, roughly $127,000
(dollars). Amendments two and three had to do with crisis support programs,
and the last and most important modification, at least for this study, reads as
follows:
“Foreign investors will be allowed to hold a majority share in Mexican
commercial banks, regardless of size. Under the previous law, foreign investors
were not permitted to hold a majority share in banks that had a capital share in
excess to 6% of the aggregate capital of the system. This restriction is eliminated
in the new law” (Mexico’s Finance Secretariat 12/14/1998).
Firm Responses to Regulatory Punctuations
To facilitate the analysis of these regulatory punctuations in the Mexican banking
industry, Appendix A, Appendix B, and Appendix C presents a ranking order of
multinational banks, original domestic banks and new domestic banks respectively. This
ranking is based on the banks’ markets share, ROA, and ROE. Thus, this ranking allows
us to identify successful from unsuccessful banks (i.e., firm performance).

61
MNEs vs MNEs
Hypothesis 1
Hypothesis 1 predicts that MNEs from countries with stronger ties to that host
market will outperform MNEs from countries with weaker ties to that host market. To
test the strength or closeness of the ties between the emerging host country and the MNE
country of origin, Hofstede (1980) cultural distance, as well as the commercial distance
between the host country and the MNE country origin is used. Also, to avoid
measurement bias, The Banker’s (7/2003) classification of the Top 1,000 Banks of the
world is used as a (performance) control measure. The Banker’s top 1,000 banks list
considers the following factors for its rankings: bank strength, size, soundness, profits,
performance, BIS capital ratio, and NPL to total loans (see Appendix D for finer detail).
Our assumption is as follows: if all multinational banks are equally capable to enter and
perform well in the Mexican banking industry, then there should be no difference
between the top banks’ asset allocation in the Mexican banking industry and that of the
rest of the world’s banking industry. In other words, if a top bank has a 10% market
share of the world’s banking industry (excluding Mexico), that top bank should have a
similar market share in the Mexican banking industry, if indeed the Mexican market
presents and equal opportunity to enter and perform well for that MNE.
About the ability to enter the Mexican banking industry: because there were only
20 plus MNEs entering the Mexican market, only the top 25 banks of the world
(according to The Banker 6/2003) are used to calculate an average weight by nationality.

62
The weight by nationality of the top 25 banks of the world in the world’s banking
industry (shown in Table 4.1) is as follows: USA 24%, UK 16%, Japan 16%, France 8%,
Germany 8%, China 12%, The Netherlands 12%, and Switzerland 4%. However, the
actual weight by nationality of the MNEs that entered the Mexican banking industry is
as follows: USA 46%, Netherlands 8%, Japan 8%, Spain 8%, France 8%, Germany 8%,
Switzerland 4%, UK 4%, and Canada 4% (shown in Table 4.2). Comparing the two
tables produce the following results. Germany, Switzerland, and France have exactly the
same values in both tables. The countries that ‘lost’ representation in the Mexican
market (compared to the world market) are: the UK, Japan, China, and the Netherlands.
In contrast, the MNEs from the USA, Spain, and Canada have a larger presence in the
Mexican market, that is, beyond the representation that these countries’ MNEs have in
the world’s banking industry.
About the ability to perform: firm performance is based on the ranking developed
in Appendix A. The nationalities of the top five (75th percentile) multinational banks
operating in Mexico are compared to the nationality of the bottom five banks on
Table 4.2. The top five MNEs and their nationalities are: BBVA (Spain), Citibank
(USA), Santander (Spain), HSBC (UK), and Scotiabank (Canada). The bottom five
MNEs and their nationalities are: Fuji (Japan), Societe General (France), BNP (France),
Dresdner (Germany), ABN AMRO (Netherlands).

63
TABLE 4.1 Top 25 Banks of the World (The Banker 6/2003)
Top 25 Banks Country Country # Banks % Weight Citigroup USA USA 6 24% Bank of America USA UK 4 16% HSBC UK JAPAN 4 16% JP Morgan Chase USA CHINA 3 12% Credit Agricole Groupe FRANCE NETHERLANDS 3 12% Mizuho Financial JAPAN FRANCE 2 8% Royal Bank of Scotland UK GERMANY 2 8% Sumitomo Mitsui JAPAN SWITZERLAND 1 4% Mitsubishi Tokyo JAPAN BNP Paribas FRANCE Bank One USA Deutsche Bank GERMANY HBOS UK Barclays Bank UK Bank of China CHINA Industrial and Commercial Bank of China CHINA Wells Fargo USA Wachovia USA UFJ JAPAN HypoVereinsbank GERMANY UBS SWITZERLAND ING NETHERLANDS ABN AMRO NETHERLANDS Rabobank NETHERLANDS Agricultural Bank of China CHINA Source: Banco de México (1991-2004)

64
TABLE 4.2 Entries and Market Share of Multinational Banks in Mexico
Market Share Bank Name/Country
Entry Date
Last Report Date Assets Equity Country # Bank Entries Percentage
BBV/ Spain Jun-95 Mar-04 24.42% 24.80% USA 11 46% Citibank/USA Dec-94 Mar-04 22.60% 26.96% France 2 8% Santander/ Spain Dec-94 Mar-04 13.57% 12.15% Germany 2 8% HSBC (5)/ UK Sep-95 Mar-04 9.87% 5.62% Japan 2 8% Scotiabank Inverlat/ Canada Mar-96 Mar-04 4.71% 3.84% Netherlands 2 8% Bank of America/ USA Jun-95 Mar-04 1.71% 0.35% Spain 2 8% ING/ Netherlands Dec-95 Mar-04 1.51% 1.00% Canada 1 4% JP Morgan/USA Mar-95 Mar-04 1.03% 1.17% Switzerland 1 4% Deutsche/ Germany Sep-00 Mar-04 0.67% 0.62% UK 1 4% Bank of Boston/ USA Sep-95 Mar-04 0.33% 0.31% Total 24 Credit Suisse/Switzerland Sep-03 Mar-04 0.31% 0.32% GE Capital/ USA Sep-97 Mar-04 0.31% 0.32% Top 5 Banks Bottom 5 Banks American Express/ USA Jun-96 Mar-04 0.18% 0.22% BBV Fuji Comerica Bank/USA Sep-97 Mar-04 0.18% 0.15% Citibank Societe General Bank of Tokyo/ Japan Mar-95 Mar-04 0.13% 0.17% Santander BNP First Chicago(3)/ USA Mar-96 Mar-04 0.06% 0.20% HSBC Dresdner ABN AMRO/ Netherlands Sep-95 Mar-04 0.03% 0.11% Scotia Bank ABN AMRO BNP*/ France Sep-95 Sep-01 0.02% 0.18% Dresdner*/ Germany Dec-95 Jun-03 0.02% 0.16% (1) Chase acquires Chemical (1996) Fuji*/ Japan Mar-95 Sep-99 0.01% 0.17% (2) JP Morgan and Chase merge (2000) Societe General*/ France Dec-95 Jun-00 0.01% 0.15% (3) Bank One acquires First Chicago (1998) Chase(2)/ USA Mar-95 (4) Bank of America acquires Nations Bank (1998) Chemical(1)/USA Mar-95 (5) HSBC acquires Republic Bank NY (2000) Nations Bank(4)/ USA Sep-96 * These banks exited the Mexican banking industry Source: Banco de México (1991-2004)

65
According to Hofstede’s cultural distance values, of the listed countries in the top
25 world banks, Mexico is closest to Spain, while commercially, Mexico is closest to its
North American neighbors (i.e., USA and Canada). Judging from the results of this
analysis, both on the ability to enter the Mexican banking industry and the ability to
perform once the MNE enters the Mexican market, it is clear that the two distances (i.e.,
cultural and commercial) are related to firm performance. In the first test, the ability to
enter the market, the banks from ‘closer’ countries (i.e., Spain, Canada and the US) were
the top performers. For the second test, the nationalities of four of the top five MNEs are
very close to Mexico, commercially (USA and Canada), and culturally (Spain). In
contrast, all of the bottom five multinational banks’ nationalities were either culturally,
or commercially farther to Mexico: France, Japan, Germany and the Netherlands. These
results provide support for hypothesis 1
Hypothesis 2
Hypothesis 2 suggests that MNEs that formed alliances with local partners
should outperform MNEs that did not. Multinational banks arrived during the second
regulatory punctuation (NAFTA), but dramatically increased their presence once the
crisis onset. Table 4.3 and Figures 4.1 through 4.5 illustrate the individual influence of
MBs in the Mexican banking industry. During the third punctuation, foreign banks
increased their market share in the Mexican banking industry from 6.4% to 66.2%
(Murillo, 2000), and by March 2004 the MBs had 82% of the industry’s market share.

66
TABLE 4.3 Mexican Banking Industry Entries, Exits and Other Statistics
# BANK ENTRIES Regulatory Punctuation Domestic Banks Foreign Banks Privatization 20 0 NAFTA 11 2 FDI relaxed 4 20 FDI total openness 2 2 # BANK EXITS Regulatory Punctuation Domestic Banks Foreign Banks Privatization 0 0 NAFTA 2 0 FDI relaxed 17 0 FDI total openness 2 4 TOTAL # BANKS Regulatory Punctuation Domestic Banks Foreign Banks Privatization 20 0 NAFTA 29 2 FDI relaxed 15 20 FDI total openness 12 17 M&A Activity Regulatory Punctuation Domestic-Domestic Foreign-Domestic Domestic-Foreign Privatization 0 0 0 NAFTA 1 0 0 FDI relaxed 9 6 0 FDI total openness 1 4 1 Market Share (%) in the Mexican Banking Industry
Regulatory Punctuation Domestic Banks
(Total) Foreign Banks
(Total) Foreign Banks
(Controlling Interest) Privatization 94.5 5.5 0.6 NAFTA 93.6 6.4 1.3 FDI relaxed 33.8 66.2 16.4 FDI total openness 18.0 82.0 82.0 Source: Banco de México (1991-2004)

67
FIGURE 4.1Bank Entries
0
5
10
15
20
25
Privatization NAFTA FDI relaxed FDI total openessPeriods
#
DomesticForeign
FIGURE 4.2Bank Failures
0
2
4
6
8
10
12
14
16
18
Privatization NAFTA FDI relaxed FDI total openessPeriods
#
DomesticForeign

68
FIGURE 4.4Market Share Participation
0
10
20
30
40
50
60
70
80
90
100
Privatization NAFTA FDI relaxed FDI total openessPeriods
#
Total DomesticTotal ForeignControling Foreign
FIGURE 4.3Banks' M&A Activity
0
1
2
3
4
5
6
7
8
9
10
Privatization NAFTA FDI relaxed FDI total openessPeriods
#
Domestic-DomesticForeign-DomesticDomestic-Foreign

69
Out of the 20 net foreign entries (i.e., without considering international M&As
such as HSBC acquiring Republics Bank of NY), 16 MBs still remain operating in
Mexico by 2004. Out of those 16 MBs, the top two control 47% of the Mexican banking
industry (i.e., BBVA and Citibank), while the top five control 75% (i.e., BBVA,
Citibank, HSBC, Santander, and Bank of Nova Scotia). All of these top five banks had
alliances with local banks: BBVA with Probursa, Citibank with Confia, Santander with
InverMexico, Bank of Nova Scotia with Inverlat and HSBC with Bital. In contrast, none
of the four banks that exited the Mexican banking industry established an alliance with a
local bank.
When comparing the rest of the foreign banks operating in Mexico, it is also
clear that those banks that formed alliances with local partners fared much better than
FIGURE 4.5Total Number of Banks
0
5
10
15
20
25
30
35
Privatization NAFTA FDI relaxed FDI total openessPeriods
#
Domestic
Foreign

70
those banks that did not. For instance, ABN AMRO, American Express, Boston Bank,
Bank One, Comerica Bank, GE Capital and Deutsche Bank (i.e., banks that did not form
alliances with local partners), had a combined 1.58% of market share in the Mexican
market. In contrast, ING and JP Morgan had a combined 2.54% of the Mexican market.
The former banks had assets of roughly 2700 billions worldwide, while the latter banks
(ING and JP Morgan), had assets of roughly 1260 billions worldwide. In other words,
size was apparently not a factor. Based on this descriptive analysis, hypothesis 2 is
supported.
Domestic vs Domestic
Hypothesis 4
Hypothesis 4 predicts that local firms that are members of a grupo will
outperform local firms without such membership. To analyze whether belonging to a
grupo gives a local firm a competitive advantage in the Mexican banking industry, the
domestic banks competing in this industry are split in two groups: original banks, and
new banks. Appendix B (original banks) and Appendix C (new banks) present the
ranking of the Mexican banks that is used as a proxy for firm performance. Both
rankings (for the original and new banks) consider size, financial health, length of
survival (as independent banks), investor’s rate of return (if applicable), equity, loans,
and client holdings market share.

71
For the 18 original banks set, four of the banks can be considered grupo members
as these banks, although legally independent, are tied to other businesses from other
industries. The grupo banks are: Banorte (Grupo Maseca), Bancomer (Grupo Femsa),
Bital (Grupo El Asturiano and Grupo Mabe), and Serfin (Grupo Vitro), which are ranked
number 1, 3, 4, and 7, respectively (Appendix B). The rest of the banks in this group do
not belong to grupos.
For the new banks set, comprised of 18 banks, three can be considered grupo
members, namely: Inbursa (Grupo Carso), Azteca (Grupo Elektra), Ixe (Grupo Soriana,
and Gigante), and Quadrum (Grupo San Luis) which are ranked number 1, 3, 4, and 11,
respectively (Appendix C). The rest of the banks in this group do not belong to grupos.
According to these results, 75% of the banks that belonged to conglomerates
were among the top four banks in each group (i.e., original and new banks). The results
suggest that banks that belong to grupos outperform those without such membership,
thereby providing support for hypothesis 4.
Hypothesis 7
Hypothesis 7 suggests that local banks following less aggressive (market-
oriented) growth strategies will outperform local banks following more aggressive
(market-oriented) growth strategies. Table 4.4 shows the conditions of the original
banks, relative to the industry, in each of the four regulatory punctuations (periods).
During the first period, (1991-1993), from reprivatization to the start of NAFTA, there
were seven out of 18 banks in which market share in assets was lower than market share
72
in equity. Such a situation (when market share assets / market share equity < 1), implies
that relative to the industry, those banks that have a lower asset market share (than
equity market share) are lending relatively less than their counterparts. In other words,
based on their equity, these banks were less aggressive. In this first period, the ratio was
not important, since there were no economic difficulties and no bankruptcies.
At the start of period 2 (NAFTA), there were five banks with a ratio of less
than 1 (assets market share/ equity market share) and 13 banks with a ratio of 1 or more.
At the end of the second period, none of the banks with a ratio of less than 1 failed,
while 4 of the 13 banks with a ratio of 1 or higher went bankrupt (i.e., 31%). At the start
of period 3, there were 4 banks with a ratio of less than 1, and 10 banks with a ratio of 1
or higher. At the end of this third period, 1 of the 4 banks with a ratio of less than 1
failed (25% failure), while 8 of the 10 banks with a ratio of 1 or more went bankrupt
(80%). At the start of period 4, there were 2 banks with a ratio of less than 1, and 3 with
a ratio of 1 or more. At the end of the fourth period, both of the banks with a ratio of less
than 1 outperformed the other 3 banks (i.e., those with a ratio of 1 or more).
Therefore, based on these results, it is evident that among the original banks
group, those that were less aggressive in their lending policies outperform those trying to
maintain or even gain market share quickly through these punctuations. However, in the
new banks group, there was no relationship between aggressive (market-oriented)
growth strategies and bank performance. Thus, hypothesis 7 received only partial
support.

73
TABLE 4.4 Market Share of Original Banks per Period
Market Share Market Share Market Share Market Share Market Share
Bank Name Entry Assets Equity
End of Period
(P)1 Assets Equity
End of P2/last report Assets Equity
End of P3/last report Assets Equity
3/2004 or last report Assets Equity
Atlantico Mar-92 2.6% 1.8% Dec-93 3.9% 4.1% Dec-94 5.2% 3.5% Sep-97 4.2% 3.1% Sep-97 Banamex Sep-91 24.2% 28.5% Dec-93 21.3% 26.3% Dec-94 22.4% 25.4% Dec-98 20.7% 25.8% Sep-01 20.0% 28.5% Bancomer Dec-91 22.7% 24.2% Dec-93 17.9% 22.9% Dec-94 18.8% 20.3% Dec-98 20.8% 19.2% Sep-00 21.6% 18.5% Bancrecer Sep-91 3.6% 0.9% Dec-93 2.6% 1.9% Dec-94 2.5% 2.0% Sep-97 8.9% 3.1% Sep-97 Banoro Jun-92 0.9% 1.9% Dec-93 0.8% 1.8% Dec-94 1.3% 1.5% Dec-96 2.2% 1.6% Dec-96 Banorte Sep-92 1.6% 2.5% Dec-93 2.0% 2.6% Dec-94 2.5% 2.8% Dec-98 7.39% 6.40% Mar-04 10.7% 5.7% Banpaís Sep-91 1.0% 1.1% Dec-93 4.3% 2.8% Sep-94 3.7% 2.9% Sep-94 Sep-94 Centro Sep-92 1.0% 1.2% Dec-93 1.3% 1.2% Dec-94 2.4% 1.4% Jun-95 2.4% 2.1% Jun-95 Comermex Mar-92 6.7% 5.1% Dec-93 6.0% 3.9% Dec-94 6.6% 4.8% Jun-95 6.1% 6.1% Jun-95 Confia Sep-91 2.1% 1.7% Dec-93 2.0% 1.7% Dec-94 2.7% 2.1% Jun-97 3.7% 1.1% Jun-97 Cremi Sep-91 2.1% 2.0% Dec-93 2.5% 2.2% Jun-94 2.4% 2.0% Dec-94 Dec-94 De Oriente Sep-91 0.3% 0.5% Dec-93 0.6% 0.4% Dec-94 0.5% 0.6% Dec-94 Dec-94 Internacional Sep-92 6.3% 3.9% Dec-93 5.8% 4.0% Dec-94 5.3% 4.3% Dec-98 8.4% 6.1% Jun-02 7.8% 4.2% M. Probursa Sep-91 2.4% 1.8% Dec-93 4.3% 2.1% Dec-94 2.5% 1.7% Jun-95 2.8% 2.1% Jun-95 Mexicano Mar-92 3.8% 3.1% Dec-93 6.9% 4.4% Dec-94 7.5% 5.8% Sep-96 8.3% 3.4% Sep-96 Promex Jun-92 1.0% 1.6% Dec-93 1.9% 1.9% Dec-94 3.4% 2.4% Dec-97 3.8% 3.2% Dec-97 Serfin Mar-92 14.0% 9.9% Dec-93 10.6% 10.2% Dec-94 13.1% 10.4% Dec-98 13.6% 9.0% Sep-99 13.4% 8.1% Union Dec-91 1.6% 1.6% Dec-93 3.4% 3.2% Jun-94 3.1% 3.4% Dec-94 Dec-94 Centro 1.8% 1.2% Banpaís 2.3% 1.3% Banorte 3.2% 3.9% 7.39% 6.40% Source: Banco de México (1991-2004)

74
Summary
The present descriptive analysis serves two purposes: 1) to show why some
MNEs perform better than other MNEs, in an emerging market host nation under an
environment of regulatory punctuations; and 2) to show why some local firms perform
better than other local firms under those same conditions. On the MNE side, the study
sheds light on the importance of the ties between the MNEs’ home countries and the host
country. Of particular interest is the fact that geographical, commercial, and cultural
distances ties between the MNEs’ home countries and the host country seem equally
effective at predicting firm performance. Also, the results support the notion that MNEs
which formed strategic alliances with local banks outperform those that did not.
On the domestic side, it is important to note that domestic firms that formed part
of a grupo outperformed their domestic counterparts that did not follow that business
structure. Also, another novel finding was that original domestic banks fare much better
when they followed a less aggressive growth (market-oriented) strategy.
Although this is only a descriptive analysis, the results of this pilot test are
encouraging. Perhaps, the main conclusion from Chapter IV is that the developing of
hard data to test the suggested hypotheses more rigidly is indeed worthwhile pursuing.

75
CHAPTER V
METHODOLOGY
The main objective of Chapter V is to explain the methodology used to test the
hypotheses elaborated in the previous chapter. Thus, the present chapter is organized in
the following sections: First, the chapter describes the sample and its sources of data.
The next section elaborates on the measures. Here, detailed information about the
dependent, independent, and control variables is presented. After the measures section,
the chapter presents the statistical models that will be used to test the hypotheses
developed in the previous chapter. Finally, the last section justifies the method selected.
Sample
The Mexican banking industry is this study’s sample9 to test firm strategic
responses to regulatory punctuations. The database consists of all private commercial
banks, domestic10 and multinational subsidiaries, operating in the Mexican banking
industry from 3/1991 to 3/2004. Quarterly data was collected from two sources, the
(Mexican) National Commission of Banking and Securities’ Statistical Bulletins and the
9 In page 49 it is justified why the Mexican banking industry is a good sample to test the hypotheses.
10 There are two main classifications of domestic banks; formerly state owned banks or the original banks (Table 3.1 and Appendix B presents detailed information about them) and new banks, those established ‘de novo’ by Mexican nationals since 1993 (Appendix C presents detailed information about these banks).

76
Bankscope dataset. The bulletins have all the financial data available for both
multinational and domestic banks, such as loan portfolio, net income, assets, market
share, etc. This financial information also allows the calculating of other measures such
as loan portfolio entropy, and identifying when a bank entered or exited the industry.
Other non-financial information used in this dataset, such as the number of international
strategic alliances per bank, was retrieved from several scholarly articles on the subject.
For instance, Guillen and Tschoegl (1999) depict all the international strategic alliances
of Spanish banks in Latin-America (including Mexico). Also, Mailander (1999) provides
information about the ownership percentage that multinational banks have in some
Mexican banks. More details about how the database was used are presented in the
measures section.
Measures
The measures of dependent (Table 5.1), independent (Table 5.2), and control
variables (Table 5.3) are described in the following paragraphs.
Dependent Variables
I used two approaches to measuring the dependent variable. In the first approach
(continuous-time hazard model), the he dependent variable is a continuous variable that
signals the hazard or probability of a bank to survive, (i.e., not exit) the Mexican banking

77
industry between 3/1991-3/200411. This ability is measured in number of financial
quarters, which ranges from 1 to 52. In turn, the dependent variable is named
NuQuarters, as it records the number of quarters between when the bank entered the
Mexican banking industry (i.e., started the risk period) and when the bank either exited
or was censored (from 1 to 52). In this approach, the NuQuarters variable is used in
combination with the variable Exit. Exit records whether the event actually occurred,
that is, whether a bank exited the industry (exit=1) or was censored (exit= 0). For this
dataset, almost 50% of the banks at risk of exiting the Mexican banking industry, within
the 52 quarters, did exit the industry.
TABLE 5.1
Dependent Variables
Constructs Variable Name Units Number of months a bank operated in the Mexican banking industry 3/1991-3/2004
NuQuarters Number of Quarters
Probability of exit records whether the event occurs. If a bank exits the banking industry, this variable takes a value of 1, and zero otherwise.
Exit Dummy
11 The year of 1991 was selected as the starting point of the period of study because it was 5/1991 when the first bank was reprivatized.

78
TABLE 5.2 Independent Variables
Constructs Variable
Name Units Sociopolitical-relational ties Commercial distance: FDI Factor Measured as exports, and FDI from X firm country of origin to Y host country. Also considers FDI from X country firm country of origin to neighboring regions of Y host country Cultural distance: The GLOBE index GCDI Index Diversification International Diversification Intl Div Ordinal Portfolio Entropy Entropy Entropy equation Grupo Membership Grupo Dummy Aggressive Growth Strategies AGS Ratio (market share assets/ market share equity) International Strategic Alliances ISA Dummy Acquisition Acq_Cumul Ordinal Social Capital -Bank's Reputation and Access to Asymmetric Information (BRAAI)
*Bank Reputation= Franchise Saturation= # branches Saturation Equation *Access to Asymmetric information = Bank deposits / # accounts
Assym Inf Equation
-Owners’ Power and Access to Asymmetric Information (OPAI) *Club Membership= Mexican Association of Businessmen Own_Power Dummy *Owners Asymmetric information measures if board
members have regional or national reputation. National =1 OA Info Dummy

79
TABLE 5.3 Control Variables
Constructs Variable
Name Units Liberalization. Acquires the value of 0 for the first two periods, 1 for the third period and 0 for the fourth period.
Lib Dummy
Top 1000 banks, four ranges: top 25, top 200, top 1000, the rest Franchise Experience, number of years operating in the Mexican banking industry since 9/1982.
Bankers ZM Ordinal
For the discrete-time approach, a “life table” of subject-time units is created
(Cox, 1972). Here, the dependent variable is the hazard rate or probability that a bank
exits the Mexican banking industry in a given quarter. The banks at risk are those
already operating in the Mexican banking industry. Thus, the hazard of exiting starts
when a bank enters the industry.
For both cases, when the dummy variable Exit equals one, it means that a bank
went bankrupt, exited the industry, or was sold at a loss. The implication for all three
cases is that the bank performed poorly. Censoring (Exit=0) will occur at the end of the
observation period if the event did not occur or if a bank was sold at a premium.
Independent Variables
Sociopolitical-Relational Ties
Sociopolitical-relational ties are separated into two distinct variables,
a) commercial distance and b) cultural distance.

80
a) Commercial distance. Liability of Foreignness suggests that firms are at a
disadvantage because of sociopolitical-relational costs that foreign firms must
incur to do business in a host market. Eden and Miller (2004) suggest that
these sociopolitical-relational costs can be understood as: unfamiliarity,
relational, and discriminatory hazards. However, it is worth noting that not all
foreign firms face the same LOF. Presumably, MNEs from countries that are
closer, in some dimension, to a given host country would have lesser
sociopolitical-relational costs than MNEs from more distant countries. For
instance, international business scholars have used Hofstede’s (1980) index
to measure cultural distance, arguing that MNEs from culturally closer
countries to that of the host market would have an advantage over a MNEs
from more culturally distant countries (e.g., Brouthers and Brouthers, 2001).
Thus, while recognizing that cultural distance plays an important role in the
international business literature, certainly there are other ways to measure country
distance (i.e., a proxy for LOF distance). For instance, because globalization reduces
country barriers (Hitt et al., 2002), it make sense to measure closeness or distance
between countries by measuring how commercially close they are. The underlying
assumption on this construct is that there is no need to be similar (i.e., culturally close),
in order to know how to do business in a foreign country (e.g., several American firms
have succeeded in China).

81
Furthermore, the knowledge on how to conduct business in another country’s
home market is a multi-dimensional construct. Because this stock of knowledge is at the
country-level, firms are likely to tap into their country’s general knowledge of a certain
host market. Thus, the following dimensions of commercial distance and how to
measure them are proposed: 1) country of origin to host country exports. I argue that the
more exports (from country X to Y host country), the more the knowledge available to X
country firms to conduct business in the Y host market. 2) FDI, the inflow of foreign
direct investment from country X firms to country Y host market suggest a certain level
of knowledge about the Y market. Thus, the more FDI from country X to country Y, the
more the stock of knowledge available to country X firms about the Y host market. Also,
higher FDI inflows might decrease LOF as country X firms gain more legitimacy with
domestic institutions.
b) Cultural distance. Cultural distance will be measured using the Globe’s12 nine
scales (House et al., 2004). These nine scales will be weighted equally to
determine the distance between Mexico’s scales and that of the multinational
banks’ country of origin.
12 This book, authored by House et al. 2004 (Culture, leadership, and organizations: The GLOBE study of 62 societies), seek to refine Hofstede’s measure of cultural distance. Peterson (2004) provides a good review on this book and the Globe project. Also, while this book is only two years old, it is already been cited more than 20 times (Luthans & Ibrayeva, 2006; Newburry & Yakova, 2006; Stahl & Caligiuri, 2005; Teagarden, 2005).

82
International Strategic Alliance (ISA)
For MNEs, this dummy variable records whether a multinational bank has a
strategic alliance with a local partner. For local banks, this variable records whether the
local bank had an alliance with a multinational bank. ISA equals 1 if an ISA takes place
and 0 otherwise.
International Diversification
Because Bankscope does not report the revenues of a bank at a country or
regional level, an entropy measure cannot be calculated. Following Barkema and
Vermeulen (1998), the number of foreign countries where a bank has subsidiaries is used
as a proxy for the level of international diversification. The data was collected from the
Directory of Corporate Affiliations.
Grupo Membership
This is a dummy variable that captures whether the local bank is part of a grupo
(grupo membership=1) or if it does not have such membership (grupo membership=0).
Loan Portfolio Entropy
According to Hitt et al. (1997), the entropy index has been the popular way to
measure product diversification among strategic management researchers. This index
has been used to estimate a firm’s proportion of sales across the different industries in
which it operates (i.e., corporate diversification). However, there is no precedent for
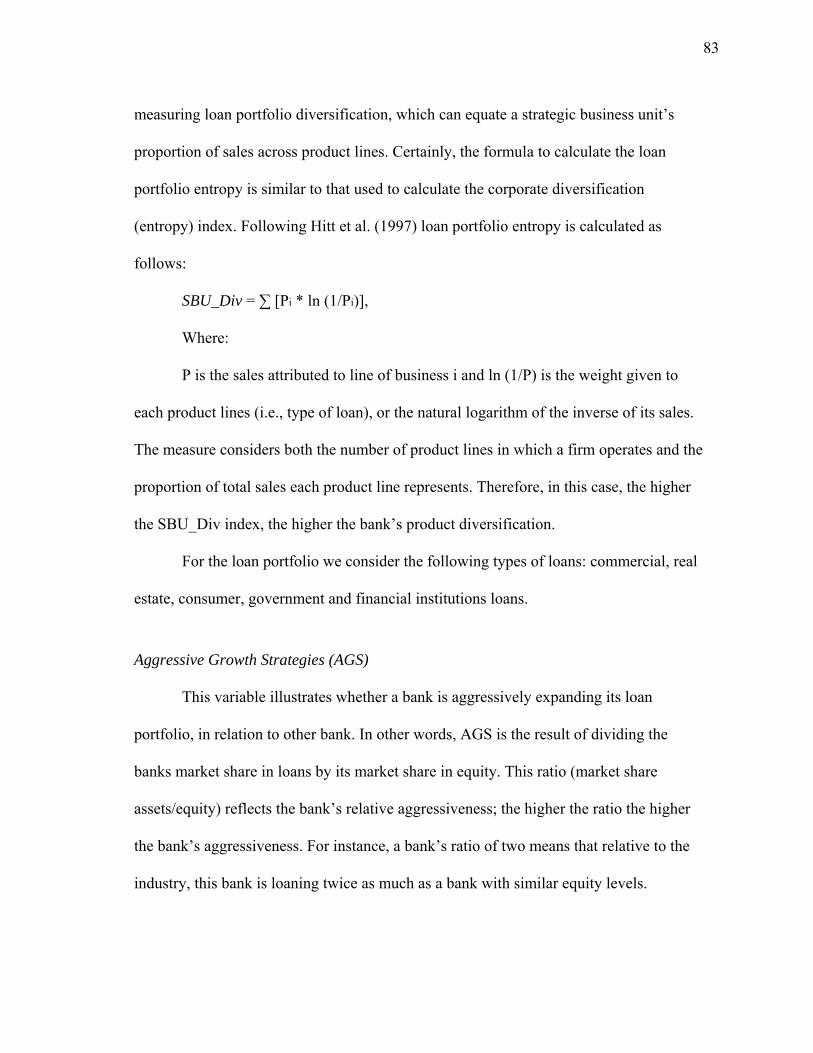
83
measuring loan portfolio diversification, which can equate a strategic business unit’s
proportion of sales across product lines. Certainly, the formula to calculate the loan
portfolio entropy is similar to that used to calculate the corporate diversification
(entropy) index. Following Hitt et al. (1997) loan portfolio entropy is calculated as
follows:
SBU_Div = ∑ [Pi * ln (1/Pi)],
Where:
P is the sales attributed to line of business i and ln (1/P) is the weight given to
each product lines (i.e., type of loan), or the natural logarithm of the inverse of its sales.
The measure considers both the number of product lines in which a firm operates and the
proportion of total sales each product line represents. Therefore, in this case, the higher
the SBU_Div index, the higher the bank’s product diversification.
For the loan portfolio we consider the following types of loans: commercial, real
estate, consumer, government and financial institutions loans.
Aggressive Growth Strategies (AGS)
This variable illustrates whether a bank is aggressively expanding its loan
portfolio, in relation to other bank. In other words, AGS is the result of dividing the
banks market share in loans by its market share in equity. This ratio (market share
assets/equity) reflects the bank’s relative aggressiveness; the higher the ratio the higher
the bank’s aggressiveness. For instance, a bank’s ratio of two means that relative to the
industry, this bank is loaning twice as much as a bank with similar equity levels.

84
Acquisitions
This is an ordinal variable that records the cumulative number of acquisitions
that a focal bank made through out the observation period.
Social Capital
Because social capital is a multi-dimensional construct, the variable is further
separated in two components: bank reputation and access to asymmetric information
(BRAAI) and ownership power and access to asymmetric information (OPAI).
a) BRAAI. Two dimensions, 1) bank reputation and 2) the bank’s ability to
access asymmetric information. 1) Mehra (1996) suggests that a bank’s
reputation resides on the value of its franchise. In other words, reputation is
the bank’s ability to be recognized in the market place. Following Sirmon
(2004), franchise saturation is used as a proxy for reputation. In turn, the
bank’s number of branches is the proxy for franchise saturation. 2) To
measure the bank’s ability to acquire asymmetric information, Sirmon’s
argument is also followed (2004). He argues that deposit size indicates the
bank’s potential for garnering asymmetric information. In his view, larger
deposits allow the bank to invest more time cultivating the client-bank
relationship, which increase the bank’s potential access to information
asymmetries. In other words, banks with smaller size deposits are at a
disadvantage. BRAAI’s second dimension is measured as the average bank
deposits calculated as follows: bank’s total deposits divided by the number of

85
accounts. Because it is assumed that banks are going to pay more attention to
their important clients, only the number of investment accounts is used to
calculate this variable.
b) OPAI. This variable also has two dimensions: 1) owners’ power and 2)
owners’ access to asymmetric information. To measure 1) owners’ power,
data on a bank’s board “club” membership to exclusive ‘executive clubs’ was
collected. For instance, Ortiz-Rivera (2000) suggests that the Mexican
Businessmen Council (MBC) is the most exclusive and influential group of
businessmen in Mexico. According to Ortiz-Rivera, there are less than 30
MBC active members. Utilizing organizational membership is consistent with
empirical approaches used by Putnam (2000) and Glaser et al. (2002) to
measure social capital. 2) To measure owners’ asymmetric information board
members were identify according to their ability to obtain information from
different sources. Thus, owners were split in two categories, those with
regional reputation and those with national reputation, where national =1.This
measure was proposed as a proxy for measuring access to asymmetric
information. The rationale is the following: board members with national
reputation have the ability to tap into more sources of information than those
with only regional influence.

86
Control Variables
Liberalization
The dummy “liberalization” represents the regulatory punctuation that took place
in the Mexican banking industry. Chapter IV describes, in detail, all four regulatory
punctuations. We classify regulatory periods one and two as liberalization equaling zero
(liberalization = 0), because in these periods, the regulatory framework had several
protectionist policies. In contrast, periods three and four saw the demise of these polices,
thus facilitating liberalization. Therefore, periods three and four have a value of 1
(liberalization=1).
Top 1000 Banks of the World
Zaheer and Mosakowski (1997) used the Top 200 banks of the world (reported
by the Banker) as a control variable. This variable is important because it controls for
overall size, reputation, and the overall performance of the bank. In other words, this
variable controls for the possible positive (or negative) effects of a bank’s international
franchise. The Banker’s ranking factors include: strength, size, soundness, profits,
performance, BIS capital ratio, and NPL to total loans (see Appendix D). This variable is
presented annually and as an ordinal measure as there will be four ranges for this
variable: Top-25, Top-200, Top-1000, and the rest.

87
Statistical Models
To measure performance, defined in this study as the ability of a firm to survive,
I utilized a continuous-time hazard model approach (maximum-likelihood). However, to
enhance the quality of the analysis I developed a “life table” for both the foreign and
domestic banks datasets. For each bank-quarter period point, I coded the dependent
variable as 1 if a bank failed (i.e., changed its ownership or exited the industry) and 0
otherwise. For this method, the bank’s hazard of “dying” starts when it enters the
Mexican banking industry (at age quarter #0) and finishes if the event occurs or when
the observation is censored (quarter # 52, 3/2004).
About the specific models used in this dissertation, I used the exponential,
Weibull and Gompertz models according to how the time is to be entered the equation.
Allison (1984) notes that the exponential model implies that a hazard is constant over
time, which mean that logarithms of the survival function (ln (S (t)) are linearly related
to time t. In other words, the exponential model assumes that the subjects studied (e.g.,
firms) are no more likely or less likely to fail towards the end of the period observation
than they were at its star. The exponential model can be express by the following
equation:
log h (t ) = a + b1Χ1 + b2Χ2

88
The Weibull model allows the log of hazard to increase or increase linearly with
the log of time (Hamilton, 1998) and can be express by the following equation (where c
is a constant that can be positive or negative):
log h (t ) = a + b1Χ1 + b2Χ2 + c log t
The Gompertz model is appropriate to use when a hazard increases with time
(Cleves, Gould and Gutierrez, 2004) and can be express by the following equation:
log h (t ) = a + b1Χ1 + b2Χ2 + ct
To determine the suitability of the model to be used, I first ran a Weibull
distribution model because it provides information about the distribution shape
parameter p. According to Cleves et al. (2004), a p value of 1 corresponds to an
exponential model; where the hazard does not change with time. A p value >1, on the
other hand, indicates that the hazard increases with time, and thus, that the Gompertz
model is the appropriate model to be used. Finally, if p value <1, that it, that the hazard
decreases with time these authors suggest the Weibull model as the appropriate model to
be used.
The use of a maximum likelihood approach was preferred over the partial
likelihood approach (i.e., Cox model) mainly because the Cox model is unable to model
variables that predict success perfectly. This is because the partial likelihood estimation
is a product of likelihoods for all events that are observed to occur; whereas the
maximum likelihood estimation is a product of the likelihoods for all individuals in the
sample (not only the ones that occurred).

89
Model Justification
The hazard models utilized to test the hypotheses are the best way to model firm
performance. This is because out of the 65 banks that entered the Mexican banking
industry from 3/1991-3/2004, only 30 banks survived. Thus, survival indeed reflects
firm performance.

90
CHAPTER VI
EMPIRICAL RESULTS
This chapter is divided in three sections. The first section reports the descriptive
statistics and correlations among the variables included in the two datasets employed in
the present study. The second section presents the results of the ten hypotheses
developed in Chapter III. The last section presents an ex-post analysis of the results.
Descriptive Statistics
Table 6.1 shows the means, standard deviations and correlation coefficients of
the variables identified in the foreign banks dataset. The foreign banks dataset was
created to test hypotheses regarding commercial distance, cultural distance, international
strategic alliances, international diversification and number of acquisitions and their
effect on firm performance (survival). This dataset consists of one observation per
foreign bank per quarter for the years of 1994-2004 (# foreign banks=26; time-subject
observations or # of periods at risk=644). The time period does include attrition and
accretion changes. Potential multicollinearity between variables was checked and
controlled.13
13 I dropped one of the two variables measuring commercial distance, that is, country of origin to host country exports. This variable was measured as the total of exports from country X to Mexico divided by the total amount of Mexican imports. The variable strongly correlates with the FDI variable, measured

91
Table 6.2 reports the means, standard deviations and correlation coefficients of
the variables identified in the domestic banks dataset. The domestic dataset was created
to test hypotheses regarding grupo affiliation, (loan portfolio) entropy, international
diversification, aggressiveness, social capital (saturation, asymmetric information,
power), and number of acquisitions and their effect on firm performance (survival). This
dataset consists of one observation per domestic bank per quarter for the years of 1991-
2004 (#domestic banks=37; time-subject observations or # of periods at risk=872). The
time period considers attrition and accretion changes. Potential multicollinearity between
variables was checked and controlled.14
as the total amount of FDI from each of the nine countries of origin represented divided by the total amount of FDI received by Mexico. While both constructs overlapped, I kept FDI because this variable is more congruent with the theoretical argument espoused in hypothesis 1.
14 I dropped one of the four variables measuring social capital, that is, ownership asymmetric information. This variable was a dummy variable (0, 1), where 1 means that the main bank shareholder has a national reputation as opposed to only a regional reputation (0). The variable strongly correlates with the ownership power variable, dummy variable (0, 1) where 1 means that at least one of the bank’s board members belong to the exclusive Mexican Businessmen Council. While both constructs overlapped, I decided to keep ownership power given there is at least one author (e.g., Ortiz-Rivera, 2000) who has written extensively about the influence of this group of businessmen in the Mexican economy.
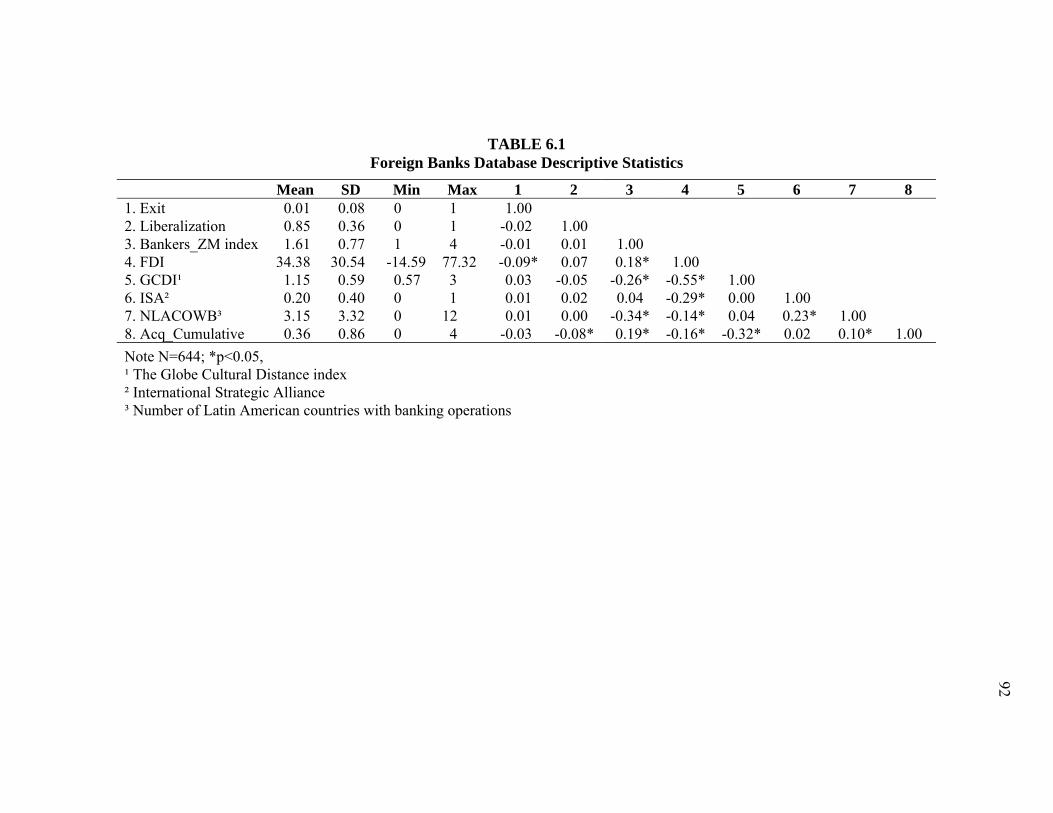
92
TABLE 6.1 Foreign Banks Database Descriptive Statistics
Mean SD Min Max 1 2 3 4 5 6 7 8 1. Exit 0.01 0.08 0 1 1.00 2. Liberalization 0.85 0.36 0 1 -0.02 1.00 3. Bankers_ZM index 1.61 0.77 1 4 -0.01 0.01 1.00 4. FDI 34.38 30.54 -14.59 77.32 -0.09* 0.07 0.18* 1.00 5. GCDI¹ 1.15 0.59 0.57 3 0.03 -0.05 -0.26* -0.55* 1.00 6. ISA² 0.20 0.40 0 1 0.01 0.02 0.04 -0.29* 0.00 1.00 7. NLACOWB³ 3.15 3.32 0 12 0.01 0.00 -0.34* -0.14* 0.04 0.23* 1.00 8. Acq_Cumulative 0.36 0.86 0 4 -0.03 -0.08* 0.19* -0.16* -0.32* 0.02 0.10* 1.00 Note N=644; *p<0.05, ¹ The Globe Cultural Distance index ² International Strategic Alliance ³ Number of Latin American countries with banking operations

93
TABLE 6.2 Domestic Banks Database Descriptive Statistics
Mean SD Min Max 1 2 3 4 5 6 7 8 9 10 11 12 1. Exit 0.03 0.16 0 1 1.00 2. Liberalization 0.55 0.50 0 1 0.08* 1.00 3. Bankers_ZM index 3.66 0.55 2 4 0.02 -0.03 1.00 4. Grupo 0.25 0.43 0 1 -0.05 0.03 0.44* 1.00 5. Entropy 52.71 37.35 0.01 136.65 0.05 -0.03 0.55* 0.31* 1.00 6. Intl_Diversification 0.45 0.79 0 2 -0.06 0.02 0.54* 0.63* 0.29* 1.00 7. Aggressiveness 96.80 59.74 -45.87 380.24 0.09* -0.14* -0.25* 0.13* 0.48* 0.14* 1.00 8. ISA¹ 0.22 0.42 0 1 0.04 0.10* -0.34* 0.30* 0.30* 0.03 0.30* 1.00 9. Saturation 2,302 2,230 0.22 17,523 0.02 0.11* -0.28* 0.38* 0.27* 0.33* 0.03 0.12* 1.00 10. Assymetric Information 450 1,109 0 24,000 -0.03 0.17* 0.19* 0.02 -0.18* 0.04 -0.15* -0.17* 0.10* 1.00 11. Ownership Power 0.30 0.46 0 1 -0.02 0.04 -0.50* 0.57* 0.39* 0.44* -0.04 0.36* 0.33* 0.06 1.00 12. Acq_Cumulative 0.16 0.51 0 3 0.02 0.11* -0.24* 0.32* 0.36* 0.25* 0.41* -0.01 0.17* -0.09* -0.08* 1.00
Note N=872; *p<0.05 ¹ international Strategic Alliance

94
Results of Hypothesis Testing
This section presents the results of testing Hypotheses 1 through 10, in which the
relationships between both domestic and foreign firm strategies and characteristics and
their likelihood of survival were examined. To test these hypotheses, maximum
likelihood (ML) continuous-time survival methods were utilized on both the domestic
and the foreign banks datasets. In treating the samples from both databases as panel data,
the robust specification was included to avoid heteroscedasticity problems. In other
words, the robust specification justifies the conventional variance estimate assumption
(the independence of observations).
Foreign Banks
The sample from the foreign banks dataset was used to test the first set of
hypotheses (1-3 and 1015). First, I ran the Weibull (distribution) method with only the
control variables as predictors (Table 6.3). The Weibull Table displays the Weibull
distribution shape parameter p, which has a value of 2.986 and is statistically significant
(p< 0.001). A p value > 1 indicates that the hazard increases with time, and that the
Gompertz distribution is the appropriate one to use (Cleves et al., 2004; Hamilton,
1998). After switching to the Gompertz method, I included the independent variables as
well. Therefore, the fully specified model (shown in Table 6.3) contains two control
15 Hypothesis 10 tests both datasets separately. I this instance hypothesis 10 is tested by using the foreign banks dataset.

95
variables (liberalization and Top 1000 banks of the world) and five independent
variables, namely: commercial distance, cultural distance, international strategic
alliances, international diversification and number of acquisitions.
Overall, the theoretical model of firm strategies and characteristics presented in
Figure 1.1 is generally supported by the data. I present the statistical evidence of each
hypothesis in turn.
Hypothesis 1: Among MNEs competing in an emerging host market, MNEs from
countries with stronger (closer) ties to that host market will outperform MNEs from
countries with weaker (more distant) ties to that host market.
Hypothesis 1 suggests a positive relationship between foreign firms from
countries with stronger (closer) ties to the host market (i.e., Mexico) and their
performance (survival). To test this hypothesis, I used two variables: commercial
distance and cultural distance. Commercial distance was measured as the total amount of
FDI from each of the nine countries of origin represented (i.e., USA, UK, Spain,
Netherlands, Germany, France, Japan, Switzerland, and Canada) divided by the total
amount of FDI received by Mexico. In other words, the higher the FDI by country of
origin X to Mexico, the stronger the commercial tie, and in turn, the higher the likelihood
of survival.
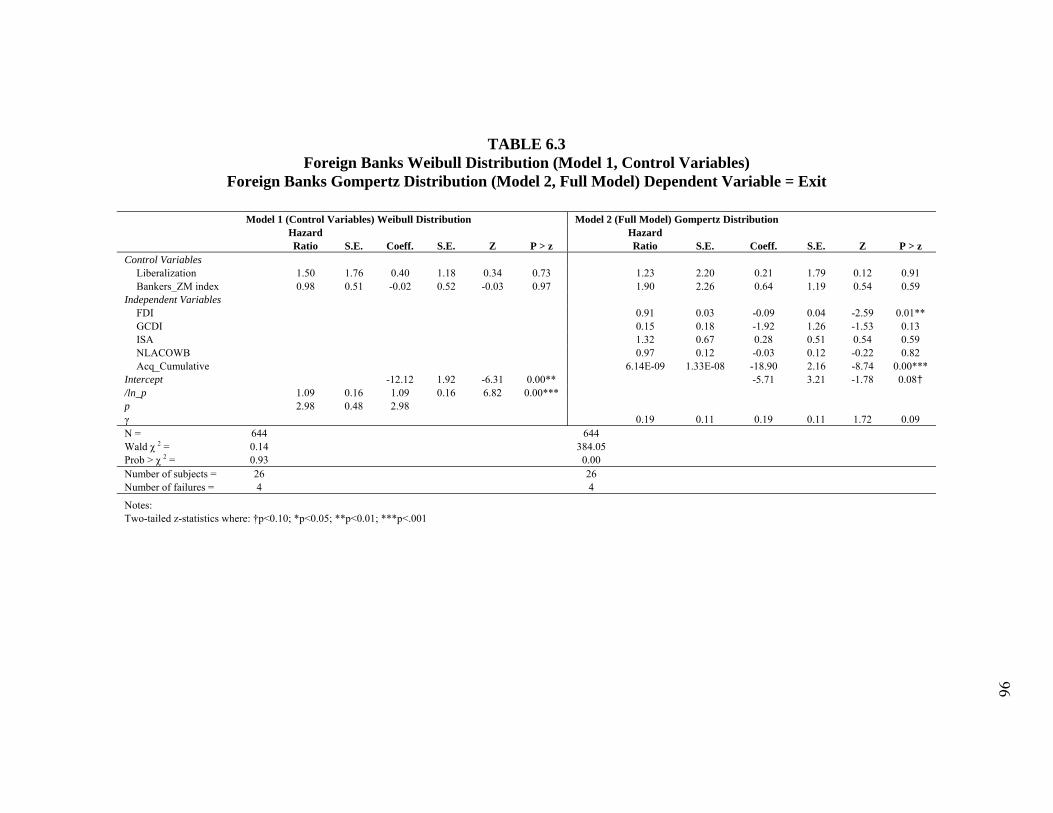
96
TABLE 6.3 Foreign Banks Weibull Distribution (Model 1, Control Variables)
Foreign Banks Gompertz Distribution (Model 2, Full Model) Dependent Variable = Exit Model 1 (Control Variables) Weibull Distribution Model 2 (Full Model) Gompertz Distribution
Hazard Ratio S.E. Coeff. S.E. Z P > z
Hazard Ratio S.E. Coeff. S.E. Z P > z
Control Variables Liberalization 1.50 1.76 0.40 1.18 0.34 0.73 1.23 2.20 0.21 1.79 0.12 0.91 Bankers_ZM index 0.98 0.51 -0.02 0.52 -0.03 0.97 1.90 2.26 0.64 1.19 0.54 0.59
Independent Variables FDI 0.91 0.03 -0.09 0.04 -2.59 0.01** GCDI 0.15 0.18 -1.92 1.26 -1.53 0.13 ISA 1.32 0.67 0.28 0.51 0.54 0.59 NLACOWB 0.97 0.12 -0.03 0.12 -0.22 0.82 Acq_Cumulative 6.14E-09 1.33E-08 -18.90 2.16 -8.74 0.00***
Intercept -12.12 1.92 -6.31 0.00** -5.71 3.21 -1.78 0.08† /ln_p 1.09 0.16 1.09 0.16 6.82 0.00*** p 2.98 0.48 2.98 γ 0.19 0.11 0.19 0.11 1.72 0.09 N = 644 644 Wald χ 2 = 0.14 384.05 Prob > χ 2 = 0.93 0.00 Number of subjects = 26 26 Number of failures = 4 4
Notes: Two-tailed z-statistics where: †p<0.10; *p<0.05; **p<0.01; ***p<.001

97
As shown in Table 6.3, the commercial distance variable (i.e., FDI) is statistically
significant. The FDI hazard ratio equals 0.913 (p<0.011), which means that for every
percentage point of FDI increase, the hazard of exiting the industry decreases by roughly
9% (i.e., 100 * (0.913-1.00) = -9%). Therefore the argument that banks from countries
with stronger commercial ties to Mexico are less likely to exit the Mexican banking
industry is supported.
For cultural distance, I used The Globe’s (House et al., 2004) nine scales of
country culture to calculate the cultural distance index for each of the nine foreign
countries represented in the banking industry. The Globe’s cultural distance index
(GCDI) variable was not statistically significant. The results of commercial and cultural
distance indicate partial support to hypothesis 1.
Hypothesis 2: Among MNEs competing in an emerging host market, MNEs
forming strategic alliances with local partners will outperform MNEs that do not.
Hypothesis 2 implies a positive relationship between firms that engage in
strategic alliances with local partners and firm survival. To measure international
strategic alliance activity, I use a dummy variable (0, 1) where the variable is 1 if the
foreign firm formed an alliance with a local bank during the time of the study16.
Unfortunately, Table 6.3 shows that the international strategic alliance variable has a
16 The international strategic alliance dummy variable regains a value of zero when the alliance dissolves. This includes acquisitions. That is, when foreign firms acquired their local partner, then the alliance regained the value of zero. Note: even without regained the value of zero after acquiring the local partner the variable was still statistically not significant.

98
hazard ratio of 1.32 and is not statistically significant (p < 0.59). These results provide
no support for hypothesis 2.
Hypothesis 3: Among MNEs competing in an emerging host market, more
internationally diversified MNEs will outperform less internationally diversified MNEs.
Hypothesis 3 suggests a positive relationship between international
diversification (number of Latin-American countries where the focal banks have other
banks) and firm survival. The hazard ratio for this variable (nlacowb) is 0.97 and it is not
statistically significant (p < 0.83). Even when using total number of: overall banks,
financial services firms (non-banks), and the combination of both, the variable remains
insignificant. Thus, the results provide no support for hypothesis 3.
Hypothesis 10: Among both MNEs and emerging market firms operating in an
emerging market, those that engage in more acquisition activity will outperform those
with less acquisition activity.
Hypothesis 10 suggests that there is a positive relationship between a foreign
firm’s acquisition activity and its likelihood of survival. The acquisition variable is a
count (cumulative) variable that reflects the number of domestic banks acquisitions
made by a foreign bank (ranging from 0-4). Table 6.3 shows the acquisition variable
with a hazard ratio of 6.14E-09 (p<0.001). In other words, the hazard of exiting the
industry, by a foreign bank, decreases by roughly 100% for every increase in the number
of acquisitions (i.e., 100 * (0.00 – 1.00) = 100%). Thus, the acquisition variable is highly
statistically significant. The results provide support for the hypothesis.

99
Domestic Banks
The sample from the domestic banks dataset was used to test the second set of
hypotheses (4-1017). First, I ran the Weibull (distribution) method with only the control
variables as predictors (Table 6.4). The Weibull Table displays the Weibull distribution
shape parameter p, which has a value of 1.33 and is marginally statistically significant
(p< 0.06). A p value of 1 indicates that the hazard is constant. This means that these
domestic banks are no more or less likely to fail late in the period of observation than
they were at its start. Thus, the appropriate distribution to use is the exponential
distribution (Cleves et al., 2002; Hamilton, 1998).
However, because of the border line p value (p<0.06) of the control variables
model, I re-ran the Weibull distribution with the full model (model 2). I obtained the
following values: parameter p = 1.26 (p<0.33). These results further support the
suitability of the exponential distribution (Table 6.4).
The fully specified model (model 3), shown in Table 6.5, uses the exponential
distribution. It contains two control variables (liberalization and Top 1000 banks of the
world) and nine independent variables, namely: grupo, (portfolio) entropy, international
diversification, aggressiveness, social capital (saturation, asymmetric information,
power), and number of acquisitions.
17 In this instance, hypothesis 10 is tested using the domestic banks sample.
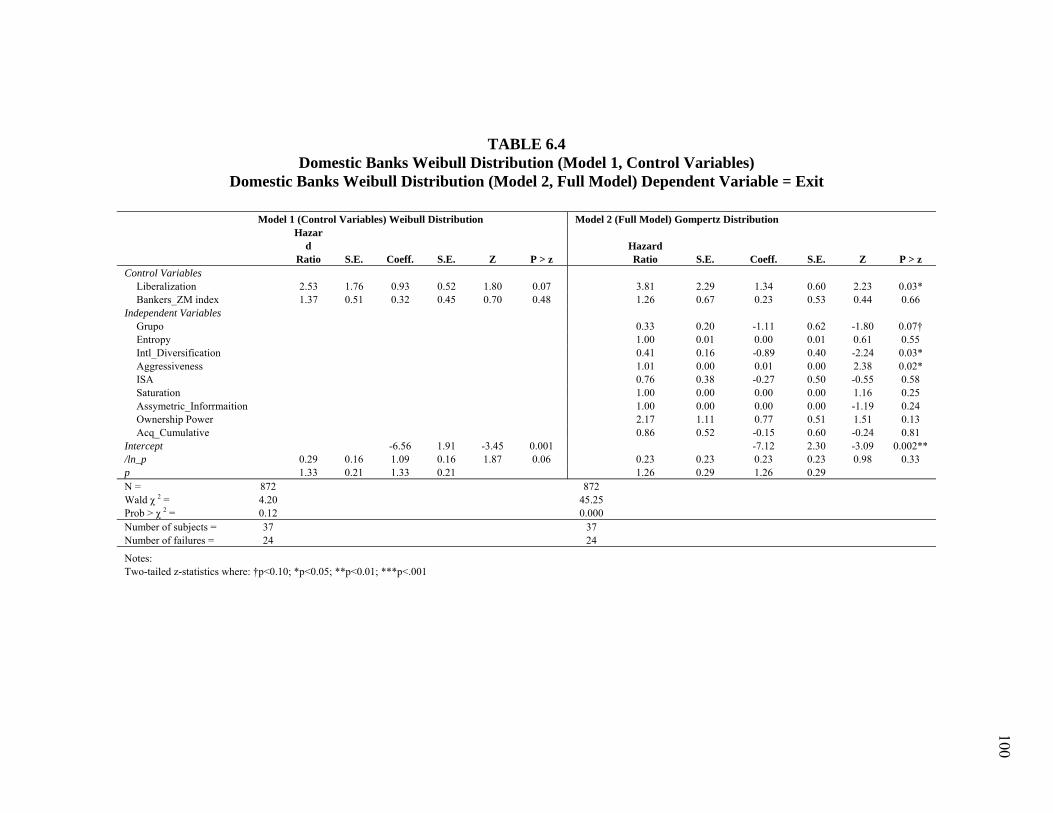
100
TABLE 6.4 Domestic Banks Weibull Distribution (Model 1, Control Variables)
Domestic Banks Weibull Distribution (Model 2, Full Model) Dependent Variable = Exit Model 1 (Control Variables) Weibull Distribution Model 2 (Full Model) Gompertz Distribution
Hazard
Ratio S.E. Coeff. S.E. Z P > z Hazard Ratio S.E. Coeff. S.E. Z P > z
Control Variables Liberalization 2.53 1.76 0.93 0.52 1.80 0.07 3.81 2.29 1.34 0.60 2.23 0.03* Bankers_ZM index 1.37 0.51 0.32 0.45 0.70 0.48 1.26 0.67 0.23 0.53 0.44 0.66
Independent Variables Grupo 0.33 0.20 -1.11 0.62 -1.80 0.07† Entropy 1.00 0.01 0.00 0.01 0.61 0.55 Intl_Diversification 0.41 0.16 -0.89 0.40 -2.24 0.03* Aggressiveness 1.01 0.00 0.01 0.00 2.38 0.02* ISA 0.76 0.38 -0.27 0.50 -0.55 0.58 Saturation 1.00 0.00 0.00 0.00 1.16 0.25 Assymetric_Inforrmaition 1.00 0.00 0.00 0.00 -1.19 0.24 Ownership Power 2.17 1.11 0.77 0.51 1.51 0.13 Acq_Cumulative 0.86 0.52 -0.15 0.60 -0.24 0.81
Intercept -6.56 1.91 -3.45 0.001 -7.12 2.30 -3.09 0.002** /ln_p 0.29 0.16 1.09 0.16 1.87 0.06 0.23 0.23 0.23 0.23 0.98 0.33 p 1.33 0.21 1.33 0.21 1.26 0.29 1.26 0.29 N = 872 872 Wald χ 2 = 4.20 45.25 Prob > χ 2 = 0.12 0.000 Number of subjects = 37 37 Number of failures = 24 24
Notes: Two-tailed z-statistics where: †p<0.10; *p<0.05; **p<0.01; ***p<.001

101
Overall, the theoretical model of firm strategies and characteristics presented in
Figure 1.1 is generally supported by the empirical results. I present the statistical
evidence of each hypothesis in turn.
Hypothesis 4: Among local firms competing in an emerging market, those local
firms that are members of a grupo will outperform local firms without such membership.
Hypothesis 4 implies a positive relationship between domestic firms that are part
of a grupo and their ability to survive. To measure the grupo variable, I use a dummy
variable (0, 1) where the variable is 1 if the domestic bank is part of a grupo firm.
According to Table 6.5, the variable grupo has a hazard ratio of 0.36 (p<0.071). Thus,
the idea that grupo affiliation enhances firm survival is marginally supported. Further,
the hazard ratio suggests that banks that belong to grupo firms are 64% less likely to exit
the industry (100 * (0.36-1) = -64%).
Hypothesis 5: Among local firms competing in an emerging market, local firms
with higher product diversification will outperform local firms with lower product
diversification.
Hypothesis 5 suggests that higher loan diversification, measured as loan portfolio
entropy, is positively related to firm survival. Table 6.5 presents the statistics for
entropy: hazard ratio 1.01 with p<.37, and therefore not statistically significant. Thus,
hypothesis 5 is not supported.

102
TABLE 6.5 Domestic Banks Exponential Distribution (Model 3, Full Model)
Dependent Variable = Exit Model 3 (Full Model) Exponential Distribution
Hazard Ratio S.E. Coeff. S.E. z P > z
Control Variables Liberalization 4.40 2.43 1.48 0.60 2.69 0.01** Bankers_ZM index 1.26 0.67 0.23 0.53 0.42 0.67
Independent Variables Grupo 0.36 0.20 -1.03 0.62 -1.81 0.07† Entropy 1.01 0.01 0.01 0.01 0.91 0.36 Intl_Diversification 0.41 0.16 -0.88 0.40 -2.27 0.023* Aggressiveness 1.01 0.00 0.01 0.00 2.47 0.013* ISA 0.80 0.39 -0.22 0.50 -0.45 0.65 Saturation 1.00 0.00 0.00 0.00 1.19 0.23 Assymetric_Information 1.00 0.00 0.00 0.00 -1.12 0.26 Ownwership Power 1.99 0.98 0.69 0.51 1.41 0.16 Acq_Cumulative 0.89 0.54 -0.11 0.60 -0.18 0.86
Intercept -6.49 2.25 -2.88 0.004** N = 872 Wald χ ² = 75.84*** Prob > χ ² = 0.000 Number of subjects = 37 Number of failures = 24 Two-tailed z-statistics where: †p<0.10; *p<0.05; **p<0.01; ***p<.001
Hypothesis 6: Among local firms competing in an emerging market, more
internationally diversified local firms will outperform less internationally diversified
local firms.
Hypothesis 6 suggests that international diversification is positively related with
firm survival. International diversification is a count variable (range 0-2), where 0 equals
no international diversification by the focal bank or any of its grupo firms. A count of 1
means that a bank, or any of its grupo firms, has at least one subsidiary in any Latin-
American country or in any developed market country. A count of 2 means that a bank,
or any of its grupo firms, has at least one subsidiary in any Latin-American country and

103
in any developed market country. According to Table 6.5, international diversification is
statistically significant. The hazard ratio is 0.41 (p<0.024), which means that for every
unit of international diversification increased (from 0-1, and from 1-2), the likelihood of
exiting the industry decreases by 59% (i.e., 100* (0.41-1.00) = -59%). These results
support hypothesis 6.
Hypothesis 7: Among local firms competing in an emerging market, local firms
following less aggressive (market-oriented) growth strategies will outperform local firms
following more aggressive (market-oriented) growth strategies.
Hypothesis 7 implies that market growth (aggressiveness), measured as the
bank’s share of the Mexican divided by the bank’s share of the Mexican equity market,
will be negatively related with survival. According to Table 6.5, the aggressiveness
index is statistically significant. The hazard ratio is 1.01 (p<0.014), which means that
every percentage point increase in the aggressiveness index increases the likelihood of
exiting the industry by 1% (that is, 100 * (1.01-1.00) = 1%). These results support
hypothesis 7.
Hypothesis 8: Among local firms competing in an emerging market, local firms
forming strategic alliances with international partners will outperform local firms that
did not.
Hypothesis 8 suggests a positive relationship between domestic firms that engage
in strategic alliances with foreign partners and firm survival. To measure ISA activity,18
18 The ISA dummy variable regains a value of zero when the ISA dissolves.

104
I use a dummy variable (0, 1) where the variable 1 if the domestic had an alliance with a
foreign bank. Unfortunately, Table 6.5 shows that the ISA variable is not statistically
significant. The hazard ratio is 0.80, p < 0.66. These results do not support hypothesis 8.
Hypothesis 9: Among local firms competing in an emerging market, local firms
with higher social capital will outperform local firms with lower social capital.
To measure social capital, I considered both the social capital of the bank itself
(e.g., reputation) and the social capital of its main shareholders (e.g., power). A bank’s
social capital is measured by the following variables: 1) saturation in the market place
(number of accounts divided by number of branches) and 2) asymmetric information
(total deposits divided by number of branches). The social capital of ownership is
measured by one variable: ownership power. To measure ownership power, I used a
dummy variable (0, 1) where the variable is 1 if at least one board member of a bank
belongs to the Mexican Businessmen Council.19 This club has approximately 30
members and according to Ortiz-Rivera (2000) is the most exclusive and influential
group of businessmen in Mexico.
According to Table 6.5, none of the variables is statistically significant. Hazard
ratios for the variables are as follows: saturation is 1.00 (p<0.24), asymmetric
information is also 1.00 (p<0.27), and ownership power is 1.99 (p<0.16). These results
provide no support for hypothesis 9.
19 The membership includes the years 1987-1997.

105
Hypothesis 10: Among both MNEs and emerging market firms operating in an
emerging market, those that engage in more acquisition activity will outperform those
with less acquisition activity.
Hypothesis 10 suggests that there is a positive relationship between a domestic
bank’s acquisition activity and its likelihood of survival. The acquisition variable is a
count (cumulative) variable that reflects the number of banks acquired by a domestic
bank within the Mexican banking industry (ranging from 0-3). Table 6.5 shows the
acquisition variable is not significant. The hazard ratio is 0.90, p<0.86. These results do
not support hypothesis 10.
Ex-Post Analysis of Results
To confirm the robustness of the results, I conducted several additional tests
using three alternative statistical models. The first statistical model is a cross section
time-series linear model using both random and fixed effects (within) regression
estimators.20 Certo and Semadeni (2006) present a good review on the use of these
particular models. The other two statistical methods are logistic regression and partial
likelihood survival analysis21. To conduct these tests both the foreign and domestic
databases were utilized. However, the time-series model was not used for the domestic
20 Please note that the cross sectional time-series linear model uses ROE as its dependent variable. Furthermore, to avoid confounding results, the return component of ROE is measured as the bank’s service revenue, not its net income.
21 Please note that both logistic regression and the partial likelihood survival analysis (Cox) use Exit (0,1) as their dependent variable.

106
database due to its high attrition (24 out of the 37 subjects exited the industry). Under
those conditions (65% exit rate), measuring performance using rates of return on equity
(ROE) or assets (ROA) would not be meaningful. In contrast, because of the
characteristics of the foreign banks database where only 4 out of the 26 subjects exited
the industry, using a time-series model is more logical.
Foreign Banks Database
First, I ran the fixed effects model with the proposed full model (see Table 6.3).
Not surprisingly the cultural distance index variable drops out because this variable does
not vary over time. Thus, I ran the random effects model without the GCDI variable
(Table 6.6). Immediately after, I ran the Hausman test to determine which of these
models was more appropriate to use (Table 6.6). The Hausman test indicates (albeit
weakly) there is no difference between these two models (p<.07).
While the fixed effects model is more restrictive (e.g., non-varying variables
drop), some researchers advocate its use when all members of a group are included in a
sample (Wooldridge, 2002). Fortunately, there is no reason to further explore the
advantages of one method over the other as the results are strikingly similar. Also,
adding the GCDI variable to the random effects model does not alter the results.

107
TABLE 6.6 Foreign Banks Database (Fixed Effects, Random Effects Regressions and Hausman Test)
Dependent Variable = ROE
Fixed Effects Model Random Effects Model Coeff. S.E. t P > t Coeff. S.E. z P > z Control Variables
Liberalization -6.31 2.24 -2.81 0.005** Liberalization -5.42 2.14 -2.53 0.011* Bankers_ZM index 7.96 5.94 1.34 0.18 Bankers_ZM index† 6.27 3.81 1.65 0.10
Independent Variables FDI 0.44 0.14 3.08 0.002** FDI 0.20 0.09 2.09 0.037* ISA -5.35 4.61 -1.16 0.25 ISA -5.25 3.30 -1.59 0.11 NLACOWB 1.85 0.77 2.41 0.016* NLACOWB 1.81 0.77 2.33 0.02* Acq_Cumulative 12.20 4.79 2.55 0.011* Acq_Cumulative 8.93 3.55 2.51 0.012*
Intercept -19.35 11.70 -1.65 0.099† -7.61 7.19 -1.06 0.29 N = 644 N = 644 F = 5.23 Prob > χ 2 = 29.04 Prob > F = 0.000*** Wald χ 2 = 0.000*** Dependent Variable: Return on Equity (service revenue) Number of groups: 26 26 Observations per group: 4038 4-38 Two-tailed z-statistics where: †p<0.10; *p<0.05; **p<0.01; ***p<.001 Hausman Test Coefficients
Fixed Random Difference
Sqrt (diag [V_fixed-V_
random]) S,E, Liberalization -6.31 -5.42 -0.89 0.76 Bankers_ZM index 7.96 6.27 1.69 1.83 FDI 0.44 0.20 0.24 0.13 ISA -5.35 -5.25 -0.10 1.59 NLACOWB 1.85 1.81 0.04 0.323 Acq_Cumulative 12.20 8.93 3.27 2.24 Test Ho: difference in coefficients not systematic; χ 2 = 11.76; Prob > χ 2 = .07†

108
More importantly though, these results are similar to those presented in the main
model (Table 6.7 compares these results.) In both cases the FDI and the ACQ-CUMUL
variables are statistically significant. In both cases the ISA and GCDI22 variables are not
statistically significant. The only difference is in the international diversification
variable. In the main model international diversification (NLACOWB) is not statistically
significant, whereas in both the fixed and random effects models hypothesis 3 is
supported.
Domestic Database
Table 6.8 compares the results obtained using logistic regression and Cox
survival analysis. The results are mostly similar to those presented in the main model. In
the case of the logistic regression all results are exactly the same: the coefficients on
INTL_DIV and AGS are statistically significant; the coefficient on GRUPO is
marginally significant; and all other variables are not statistically significant. For the
Cox model, the statistically significant variables became marginally significant and all
other variables have exactly the same interpretation as in the main model.
22 This is only true for the random effect model. However, in the fix effects model this variable drops.

109
TABLE 6.7 Foreign Banks Database (Ex-post Analysis Comparison: Gompertz, Fixed and
Random Effects) Dependent Variable = Exit, ROE, and ROE, Respectively Gompertz Model Fixed Effect Reg Random Effects Reg Coeff. P > z Coeff. P > z Coeff. P > z
Control Variables Liberalization 0.21 0.91 -6.31 0.005** -5.42 0.011* Bankers_ZM index 0.64 0.59 7.96 0.18 6.27 0.099†
Independent Variables FDI 0.09 0.01* 0.44 0.002** 0.20 0.037* GCDI -1.92 0.13 ISA 0.28 0.59 -5.35 0.25 -5.25 0.11 NLACOWB -0.03 0.82 1.85 0.016* 1.81 0.02* Acq_Cumulative -18.90 0.000*** 12.20 0.011* 8.93 0.012*
Note: Two-tailed z-statistics where: †p<0.10; *p<0.05; **p<0.01; ***p<.001
Summary
This chapter presents evidence regarding firm strategies and characteristics and
their effect on firm performance (survival and ROE). As predicted by the theoretical
arguments developed in Chapter III, evidence supports that commercial distance and
acquisition activity increase the likelihood of survival for foreign firms. For the domestic
firms’ sample, the findings suggest that grupo affiliation and international diversification
improve their likelihood of survival, whereas aggressiveness decreases their ability to
survive.

110
TABLE 6.8 Domestic Banks Database (Ex-post Analysis Comparison: Exponential Model,
Logistics Regression, and Cox Model) Dependent Variable = Exit
Exponential Model Logistic Regression Cox Model
Hazard Ratio Coeff. P > z
Odds Ratio Coeff. P > z
Hazard Ratio Coeff. P > z
Control Variables Liberalization 4.40 1.48 0.01* 4.81 1.57 0.013* 6.76 1.91 0.018* Bankers_ZM index 1.26 0.23 0.67 1.27 0.24 0.69 1.06 0.06 0.91
Independent Variables Grupo 0.36 -1.03 0.07† 0.33 -1.10 0.282† 0.26 -1.36 0.051† Entropy 1.01 0.01 0.36 1.01 0.01 0.41 1.01 0.01 0.22 Intl_Diversification 0.41 -0.88 0.023* 0.40 -0.92 0.018* 0.46 -0.77 0.057† Aggressiveness 1.01 0.01 0.013* 1.01 0.01 0.028* 1.01 0.01 0.07† ISA 0.80 -0.22 0.65 0.80 -0.22 0.67 0.91 -0.10 0.85 Saturation 1.00 0.00 0.23 1.00 0.00 0.29 1.00 0.00 0.23 Assymetric_Information 1.00 0.00 0.26 1.00 0.00 0.27 1.00 0.00 0.35 Ownership Power 1.99 0.69 0.16 2.04 0.71 0.18 1.83 0.61 0.30 Acq_Cumulative 0.89 -0.11 0.86 0.88 -0.12 0.85 0.82 -0.19 0.78
Dependent Variable: Exit Note: Two-tailed z-statistics where: †p<0.10; *p<0.05; **p<0.01; ***p<.001

111
CHAPTER VII
DISCUSSION AND CONCLUSIONS
Discussion
Corresponding to the structure of the preceding chapters, Chapter VII is divided
in three sections. The first section discusses the results regarding the performance of
both foreign and domestic banks in the presence of radical environment change (i.e.,
liberalization) in a host emerging market. This section includes explanations about the
lack of support for some hypotheses. The next section presents the overall conclusions of
this research by answering the three research questions put forth in the introductory
chapter. This section considers the present study’s research and practical implications.
Finally, the chapter concludes by stating this dissertation’s limitations and provides
some suggestions for future research.
Foreign Multinational Banks
Chapter III proposes that the performance of multinational banks will be
positively affected by the following strategies and characteristics: 1) the home country’s
commercial and cultural closeness to the host country; 2) the formation of strategic
alliances between the foreign bank and the host country’s domestic banks;
3) international diversification by the foreign bank (particularly in the region of the focal

112
host market); and 4) the acquisition of domestic banks by the foreign bank. Each of these
strategies and characteristics is further evaluated.
Commercial and Cultural Distance
Eden and Miller (2004) identify institutional forces as key drivers of liability of
foreignness. According to these authors, legitimacy and institutional distance explain
how MNEs adjust to the ‘rules of the game’ of a host-country. However, during a
regulatory punctuation (e.g., liberalization), emerging market institutions are in a state of
flux. According to Gersick (1991), during a revolutionary period (e.g., a regulatory
punctuation), firms try to adapt to a new set of environmental rules. Under these
circumstances of evolving institutionalization where new rules for economic exchange
are being developed, an MNE with prior knowledge about a host market’s institutions
should be better able to adapt to the new environmental rules. Thus, Eden and Miller’s
(2004) assertion that institutional distance explains the MNEs ability or inability to adapt
to the new ‘rules of the game’ of a host country, should become even more important
during regulatory punctuations.
The empirical evidence reported in Chapter VI strongly supports the argument
that there is a positive relationship between foreign firms from countries with closer
commercial ties to the host market (i.e., Mexico) and their performance (survival). The
liability of foreignness literature (e.g., Eden and Miller, 2004) suggests that compared to
domestic firms, foreign firms are at a disadvantage because of the unfamiliarity,
relational, and discriminatory costs that they must incur to do business in a host market.

113
However, these results suggest that not all foreign firms face the same liability of
foreignness. This study demonstrates that foreign banks from countries that are
commercially closer to the focal host country outperformed those from countries that are
commercially more distant to that host country. This is because the closer commercial
ties afford them to be better aligned to the host market’s business landscape.
Furthermore, because new institutions in emerging markets would evolve slowly after
regulatory punctuations and would not become exact replicas of those from developed
markets, MNEs from countries with closer ties to the target host market should be in a
better position to align with the evolving institutions.
In contrast, there was no statistical evidence of a positive relationship between
foreign firms from countries with closer cultural ties to the host market and their
performance (survival). Perhaps, firms from culturally closer countries cannot reap the
benefits of understanding the host market’s culture when that market is under a
regulatory punctuation. Conceivably, the belief that they understand the culture, and
because of it have an advantage, might have caused them to neglect the implications of
the host country’s radical environmental change. This alternative explanation is
congruent with O’Grady and Lane’s (1996) empirical evidence, which suggests that the
assumed “country closeness” can prevent executives from learning critical differences
among cultures.

114
Strategic Alliances
Particular to the context of emerging markets, Hitt et al. (2000) argue that when
forming strategic alliances, MNEs also seek to learn about the culture and idiosyncrasies
of the host market. Thus, they conclude that MNEs form strategic alliances with
emerging market firms mainly to gain knowledge about the local (emerging) market.
Congruent with these arguments, I proposed a positive relationship between foreign
firms that engage in strategic alliances with local partners and firm survival. However,
the empirical evidence does not support this argument.
It might be possible that strategic alliances are outcomes in their own right. For
instance, perhaps commercially closer foreign firms or more internationally diversified
foreign firms are more likely to engage in strategic alliances than more distant or less
diversified foreign firms. Thus, it might still be possible that strategic alliances have a
positive influence on foreign firm performance, albeit indirectly.
Also, the measure used to determine the effect of strategic alliances (i.e., dummy
variable) needs to be further evaluated. For instance, a categorization of alliances could
be developed. Perhaps there were at least two types of domestic firms willing to form an
alliance with a foreign partner: 1) healthy and proactive firms; and 2) desperate and
reactive firms. While both types of firms can subscribe to one or more of the reason
stated by Oliver (1990),23 the first type of domestic firm would enter an alliance to
23 1) asymmetry, to increase power and market share; 2) reciprocity, to obtain synergies in technology and information sharing; 3) efficiency, to achieve economies of scale; 4) stability, to share

115
enhance its already good or stable market position. On the other hand, the second type of
firms would form an alliance trying to overcome or correct a precarious position. In this
instance, the second type of firm would be almost obliged to enter the alliance.
Under the described scenario, domestic firms that enter an alliance for proactive
reasons should offer their foreign counterparts a better opportunity to adapt to the host
country environment. Conversely, domestic firms entering an alliance for corrective
purposes might not offer this advantage to their foreign counterparts. Thus, perhaps
omitting this distinction hides the positive effects of forming a strategic alliance for
either foreign or domestic firms.
International Diversification
According to Delios and Beamish (1999), the positive effect of international
diversification on firm performance comes as a result of both the possession of superior
resources (i.e., proprietary assets) and the acquired ability to develop new technological
expertise. For instance, Kim et al. (1993) argue that the more internationally diversified
a firm, the greater the opportunities to leverage its resources and increase its
performance. However, the extant literature has yet to test the link between the MNE’s
international diversification and the performance of its subsidiary in a focal emerging
market.24 To test this link, I proposed a positive relationship between international
risks when entering new markets, and 5) legitimacy, for enhancing the profile of the organization within the industry.
24 The extant literature claim only considers published journal articles.

116
diversification (e.g., number of Latin-American countries where the focal banks have
other banks) and firm survival.
The empirical results show no relationship when using event history modeling.
However, analyzing the data using cross-section time-series models (Chapter VI ex-post
analysis) the results show a statistical significant relationship. Thus, the results can be
interpreted as follows. International diversification does not positively affect firm
performance when performance is measured in terms of firm survival. However,
international diversification does have a positive effect on firm ROE.
Perhaps the conflicting results obtained by using a different statistical model
(cross section time-series instead of survival analysis) and a different way to measure
performance (i.e., ROE instead of Exit) can be explained by the extant liability of
foreignness literature. For instance, Zaheer and Mosakowski (1997) suggest that LOF
decreases after the first two years of operating in the host-country and last no more than
16 years. Accordingly, it might be possible that foreign firms entering a new market will
commit to that foreign market for a number of years (i.e., not exiting that market),
despite less than desirable results. In fact, the sample from the foreign banks dataset
includes roughly 10 years of study (12/1994-3/2004). Therefore, the possibility of a
“commitment period” gives an alternative explanation about the lack of relationship
between international diversification and survivability.
Also, Lu and Beamish (2001) demonstrate that after an initial negative
relationship between a firm’s FDI activity and its ROA, ROA markedly improves as
117
LOF decreases.25 Therefore, the present study’s finding (a positive relationship between
international diversification and ROE) is consistent with extant international business
literature. However, this finding further contributes to the literature because it
demonstrates that internalization has a positive effect on performance (ROE) at the
subsidiary level.
Acquisitions
In contrast to internationalization or strategic alliances, which help firms
understand how to better align with the new environment, acquiring a local competitor
does not necessarily improve the knowledge stock about the new environment. Also
important to mergers and acquisitions is the concept of growth, which generally
increases the probability of survival (Katz & Kahn, 1966). Thus, in congruence with this
argument, I expected a positive relationship between foreign firms’ acquisition activity
and their likelihood of survival.
The empirical evidence reported in Chapter VI strongly supports the argument
that acquisition activity (i.e., acquiring a local bank) has a statistically positive
relationship to firm performance (survival). In fact, the banks’ hazard of exiting the
industry decreases by roughly 100% for every local bank acquired.
Although the period studied is one of radical environmental change, aggressive
growth strategies (i.e., acquisition activity) had a positive effect on the performance of
25 They actually found evidence of an S curve relationship between a firm’s FDI activity (internationalization) and its performance. Explaining the whole aspect of the relationship is beyond the scope of the question of when LOF exist.

118
foreign firms. Interestingly, and although its effect was not hypothesized for foreign
firms, the aggressiveness variable (domestic firms hypothesis #7) also had a positive
effect on firm performance (albeit only marginally26). Thus, these findings suggest that
for foreign firms, aggressive growth strategies have a positive effect on performance.
Domestic Banks
Chapter III proposes that the performance of domestic banks will be positively
affected by the following strategies and characteristics: 1) grupo affiliation; 2) product
diversification (i.e., portfolio entropy); 3) international diversification; 4) non-aggressive
loan growth; 5) the formation of strategic alliances with foreign banks,27 5) social
capital; and 6) the acquisition of domestic or foreign banks. Each of these strategies and
characteristics is further evaluated.
Grupo Affiliation
Guillen (2000) argues that business grupos have been able to resist the threat of
international competition in their home market because of their superior informational
capabilities. Also, some researchers suggest that emerging market firms succeed with
grupo-like structures because they foster social ties with key stakeholders such as
government officials or bank officers (e.g., Wan, 2005). According to these arguments
superiority in local information exchange capabilities should give grupo firms an
advantage over non-grupo firms. In other words, grupo affiliation should result in a
26 Not shown. Hazard ration 0.79; coefficient -0.24; p<0.10. 27 Already discussed in the foreign bank section.

119
positive relationship between domestic firms that are part of a grupo and their ability to
survive.
The empirical evidence reported in Chapter VI provides at least marginal support
for a positive relationship between grupo affiliation and firm survival. The results are
noteworthy as they appear to suggest that information capabilities are more important
than focus strategies during liberalization. Thus, consistent with the resource-based view
of the firm, grupo affiliation provided local firms with a resource advantage that
outweighed the inefficiencies of this business structure.
Portfolio Entropy
Wan and Hoskisson (200) demonstrate that product diversification is positively
related to firm performance in the context of less munificent environments. Thus, it
follows that under emerging market contexts, ‘non-market capabilities’ (e.g. social ties)
should be more important than market capabilities (Wan, 2005). Accordingly, I expected
higher product diversification (portfolio entropy) to be positively related to firm
survival.
The empirical evidence reported in Chapter VI, however, shows no support for
this argument. A possible explanation of this finding is that perhaps it is not as relevant
to diversified by products, but rather, have more diverse sets of clients. Perhaps single-
clients had several types of loans, which indeed negated the benefits of diversification.
Under these conditions (bank-clients with several types of loans), the risk of default is
highly related to the client and not only the type of loan. Conceivably, loan portfolio

120
diversification could also be measured by calculating the variance or standard deviation
of each client outstanding loan balance.
It is also possible that diversification is of less value in an environment where an
environmental punctuation occurs. Thus, munificence may be of less importance than
the significant change brought about by the punctuation.
International Diversification
International business scholars argue that MNEs have two main motivations to
engage in international diversification: 1) exploiting their capabilities in international
environments (Hymer, 1976; Dunning, 1977), and 2) exploring or augmenting their
knowledge base (Cantwell, 1989). For local firms facing a new business landscape,
perhaps the motivation is not to exploit their capabilities, but rather, to learn how to
compete under a different set of rules. In this sense, I proposed a positive relationship
between international diversification and firm survival. Congruent with these arguments,
the empirical evidence reported in Chapter VI shows strong statistical support for these
claims. Indeed, international diversification increases the domestic firms’ ability to
survive.
Aggressive Growth (loan) Strategies
Sachs et al. (1996) find that countries experiencing lending booms, as a result of
liberalization, are more likely to suffer crises. These crises come as a result of financial
deregulation, which is likely to cause overlending (Kaminsky & Reinhart, 1998).

121
Interestingly, Sachs et al. (1996) find that countries in which financial institutions did
not engage in overlending did not experience crises.
Liberalization encourages greater risk taking by competitive banks to defend
their market share (Chang & Velasco, 2000). However, because of the evidence at the
country-level (i.e., overlending causing crises) and that emerging market firms’
competitive advantage rests on their non-market capabilities, I expected a negative
relationship between aggressive (loan) growth and firm survival.
The empirical evidence reported in Chapter VI strongly supports the argument
that there is a negative relationship between aggressive (loan) growth and firm survival.
Thus, these results demonstrate that domestic firms should favor less market aggressive
policies and perhaps further emphasize their non-market capabilities.
Social Capital
According to Powell and Smith-Doerr (1994), social capital is both the glue of
the network and the lubricant that enables network interaction. From this perspective,
emerging market firms seek to gain a competitive advantage through non-market
capabilities (Wan, 2005) by filling structural holes, that is, by developing their social
capital.
Congruent with these arguments, I proposed a positive relationship between
social capital and firm survival. However, the empirical evidence does not support this
argument. A possible explanation of these findings is that the value of social capital
diminishes once liberalization occurs. For instance, Uzzi (1997) states three reasons that

122
turn embeddedness into a liability. First, the unexpected loss of a core network member
might disrupt the benefits of network membership. Second, and related to the first, is a
change in the institutional arrangements that underscore the network. And third, is the
problem of having too high a proportion of embedded ties in a network, which leads to
too few links to outside members who might contribute innovative ideas.
Also, regulatory punctuations such as liberalization policies might turn
embeddedness into a liability for local firms such as grupo firms, which are embedded in
a network. Also, because liberalization requires a higher emphasis in market capabilities
the value of social ties could be lost (Wan, 2005). In this sense, following inertial
practices on how to transact (after the regulatory punctuation) might translate in a
liability for the embedded firms. In short, perhaps the benefits of social capital are offset
by the increased liability incurred by local firms once regulatory punctuation occurs.
Acquisitions
Congruent with the arguments espoused for the foreign banks, I also expected a
positive relationship between domestic firms’ acquisition activity and their likelihood of
survival. The empirical evidence presented in Chapter VI, however, does not support
these claims as the results are not statistically significant. While for foreign banks
acquisition strategies do increase their performance, for domestic banks this was not the
case.
Perhaps, the foreign banks were able to reduce their liability of foreignness by
acquiring local firms. Thus, domestic firms had less to gain from the acquisition of other

123
domestic banks than their foreign counterparts. Also, foreign banks might have had the
extra-benefit of being more selective when acquiring a local bank. Presumably, foreign
banks have more experience conducting mergers and acquisitions than domestic
competitors. In turn, the additional experience should yield the foreign banks a
competitive advantage over the local firm through acquisition cost.
Burt (1977: 70) states that “the most direct strategy for eliminating a source of
market constraint would be to purchase an establishment within the constraining sector.”
And Pfeffer and Salancik (1978) suggest that horizontal acquisitions reduce
commensalistic dependence by simultaneously reducing competition and increasing
power. However, it is not clear what would be effect for the firms operating in a
particular industry (i.e., Mexican banking industry) if there are several acquisitions
taking place (and especially by foreign banks). Under this scenario, it might be possible
that domestic banks receive only marginal benefits by acquiring one other bank. In
contrast, it might be possible that the positive relationship between a domestic bank’s
acquisition activity and its likelihood of survival is only effective after more than one
transaction.
Conclusions
While the importance of radical change has been recognized (e.g., Gersick,
1991), firm strategies and characteristics that affect firm performance, under radical
change, have not received the same attention (Keister, 2002). In particular, emerging

124
economies often have experienced a more radical change in their business landscapes.
Thus, examining (foreign and domestic) firms operating in these regions provided a
natural way to identify the causes (strategies and characteristics) behind successful or
failed adaptation.
For foreign multinational firms, the strategic management and international
business literatures have produced a wealth of research interpreting their actions and
strategic shifts (e.g., Ferrier, 2001; Luo & Peng, 1999; De Castro & Uhlenbruck, 1997).
However, this research has emphasized performance comparisons between foreign
multinational firms and their domestic counterparts, largely overlooking the performance
differences among foreign multinational firms competing in a third host market (Rangan
& Drummond, 2004).
Likewise, there has been a dearth of research determining how domestic firms in
emerging markets are adjusting to the radical environmental changes (e.g.,
globalization). For instance, Doh (2000) recognized the scarcity of studies on firm-level
responses to privatization, while Hoskisson et al. (2000) commented on the need to study
the effects of larger institutional context on individual firm responses.
Therefore, the present research is a first effort in studying the characteristics and
strategies of successful multinational and domestic firms attempting to adapt to
regulatory punctuations in an emerging market. Analyzing the foreign multinational
firms, this dissertation explores how the following firm strategies and characteristics
affect these firms ability to perform (survive).

125
Research Implications
From an academic perspective, it is worth noting that studies about strategic
responses of either multinational or domestic firms operating in emerging markets, when
the rules of business have changed so radically, have been scarce. Thus, the present
study contributes to the business literature by addressing these gaps. Particularly, this
research explains why, despite regulatory punctuations’ normally positive effects on
foreign firms, there are some foreign firms that perform poorly. Conversely, this study
also explains why, despite regulatory punctuations’ normally negative effects on
domestic firms, there are some domestic firms that manage to overcome the negative
effects and experience positive outcomes. Lastly, this research also explores whether
there are certain “universal” firm strategies or firm characteristics that enable either
MNEs or domestic firms to better align with the new business landscape after a
regulatory punctuation.
In other words, the study does answer the three research questions put forth in the
introductory chapter, namely:
1. Why are some MNEs more likely than other MNEs to survive regulatory
punctuations in an emerging host market?
2. Why are some domestic firms more likely than other domestic firms to
survive regulatory punctuations in their home emerging market? and
3. Are there any similarities between successful MNEs and successful domestic
firms in their strategic responses to regulatory punctuations in an emerging
market?

126
In answering the first research question, the present study demonstrates that
banks from countries with closer commercial ties to the host market (i.e., Mexico) and
banks that engage in acquisition strategies were more likely to survive regulatory
punctuations in an emerging host market. Because liability of foreignness research has
largely overlooked the performance differences among MNEs competing in a third host
market, the first finding contributes to the liability of foreignness literature by
identifying the existence of a country of origin liability (effect).
Also, while there has been a significant amount of research done on mergers and
acquisitions, there is a lack of sufficient research examining how acquisitions affect the
performance of foreign firms when environmental punctuations occur. Thus, another
major potential contribution about this first research question is that it addresses a gap in
the strategic management literature by identifying a positive relationship between
acquisition activity (a growth strategy) and firm performance during regulatory
punctuations.
By answering the second research question, the present study identifies grupo
affiliation, international diversification strategies and less aggressive (loan) growth
strategies as the characteristics and strategies that relate to domestic firm survival during
regulatory punctuations. The grupo affiliation and less aggressive growth strategies
findings contribute to the literature on emerging markets in the following aspects. First,
it confirms the arguments espoused by Khanna and Palepu (1997) in so far as grupo
affiliation and less market aggressive strategies, which emphasize the use of ‘non-
market’ capabilities, are successful strategies for emerging market firms. Also, the grupo

127
affiliation finding answers Toulan (2002: 559) call about “…the need of further research
in the impact of market liberalization on the horizontal scope of the firm.
The international diversification finding contributes to both the emerging market
literature and geographical diversification literatures by illustrating that emerging market
firms benefit from transferring back to their home country what they learn abroad.
About the third research question or the “universality” of firm strategies or firm
characteristics that enable either MNEs or domestic firms to better align with the new
business landscape, this dissertation suggests the following. Strategic alliances did not
have an effect on either MNEs or domestic firms’ ability to survive. However,
acquisition strategies and international diversification affected MNEs and domestic firms
differently. Acquisition strategies increased the MNEs ability to survive, whereas it did
not affect domestic firms’ ability to survive. On the contrary, international
diversification increased the domestic firms ability to survive, but did not affect the
survivability of the foreign entrants. An interesting aspect of international
diversification, though, is that when foreign firm performance is measured as ROE,
international diversification becomes statistically significant.
Essentially, the answer to research question three is that there is no “universal”
strategy that is more effective. Even if firms face the same business landscape, their
stock of resources demands the use of different strategies to take advantage of them.
This is even more evident in the opposite result obtained for the aggressive growth
variable. For the domestic firms, aggressive loan strategies increased the likelihood of

128
exiting the banking industry. For foreign banks, however, aggressive loan strategies
decreased the likelihood of exiting the banking industry.28
Several researchers have suggested that successful organizations will be those
with the ability to adapt to radical environmental change (e.g., Richardson, 1996;
Volberda, 1996). However, comprehensive studies about which firm strategies and
characteristics better help organizations to successfully adapt to radical change are
scarce.29 In this sense, this research contributes to the extant literature by extending
current theories when considering the effect of radical change. For instance, while
punctuated equilibrium provides a good “environmental” explanation about a firm’s
need to adapt to radical change, it does not suggest how firms should adapt to this
change. However, by providing an explanation on how firms suppose to adapt to this
radical change, this dissertation had expanded the theoretical implication of the
punctuated equilibrium model. Similarly, the present dissertation provides a theoretical
extension to liability of foreignness by finding that not all foreign firms face the same
liability of foreignness. Lastly, RBV is also extended by this dissertation research, as
RBV is found to have implications for emerging markets firms that are different from
foreign developed market firms.
28 As previously indicated, there was no hypothesis for this finding. And the result was marginally statistically significant at the 0.10 level
29 Notable exceptions are Hitt et al. (2004); Rangan and Drummond, (2004); Toulan (2002).
129
Practical Implications
One of the objectives of this work was to provide some answers to the new
business realities of our time. Particularly, the profound transformations of the business
landscape that have taken place as a result of globalization and technological advances
(Hitt et al., 1998). As expressed by Niccolo Machiavelli centuries ago: “There is nothing
more difficult than to take the lead in the introduction of a new order of things." To this
end, I believe this research has practical managerial implications for multinational firms
that want to enter new emerging markets, especially when these markets are in a state of
flux. For instance, by knowing that commercial distance has a negative relationship with
firm survival, foreign firm managers could be better prepare to device a more effective
(geographical) expansion.
Also, this research has practical implications for the managers of emerging-
market domestic firms, which are trying to implement strategies to defend their local
position from international competitors. For instance, because of liberalization, it
appears that domestic firms should be quick to internationalize in order to improve their
knowledge of their own business landscape. In contrast, it appears that domestic firms
should not be as quick to embrace focus strategies.
In short, the results show that certain strategies work better for domestic firms
than for foreigner firms and vice versa. Therefore, the present study provides helpful
guidelines to help managers of both foreign and domestic firms in their ever complex
decision-making process.
130
Limitations and Future Research
As with most studies, the present research has limitations that must be noted.
First, the degree to which these results can be generalizable to the experience of other
foreign and domestic firms operating in other emerging markets needs to be considered.
While emerging markets are not homogenous (Hoskisson et al., 2000), the regulatory
punctuations (e.g., liberalization, privatization) faced by foreign and emerging market
firms operating in them have commonalities. For instance, several streams of literature
(e.g., economics, political science, management) suggest that these regulatory
punctuations were widespread. Thus, it might be possible to conclude that these findings
can be generalizable to other emerging markets, or to the Latin-American region at the
very least, because this study is conducted in Mexico. For example, the present study
may have useful implications for the banking industry in the People’s Republic of China,
which is currently undergoing a similar regulatory punctuation involving deregulation,
privatization and liberalization.
Second, that all firms come from the banking industry might be a limitation.
However, it is also worth noting that several international business studies have been
conducted using financial institutions as their sample. This is particularly clear in those
studies testing liability of foreignness (Miller & Parkhe, 2002; Zaheer & Mosakowski,
1997). Moreover, regulatory punctuations in the 1980s and 1990s often took place at the
industry level as government deregulated, privatized and liberalized industries that
historically had been under strong government regulations, such as telecommunications,

131
banking and public sector utilities. Nonetheless, for both the first and second limitations,
future research should investigate more industries in more than one country.
Another limitation of this study is the measurement of some of the variables.
However, it is also worth mentioning that conducting empirical research in emerging
markets adds another degree of difficulty. These difficulties were apparent in the use of a
categorical variable (0-2) to measure international diversification for domestic banks.
Although, more fine-grained measures would have been preferred, the availability (or
lack of) archival sources made this task unattainable. Yet, I anticipate the potential effect
on the results to be even more positive had I attained a more-fine grain measures. This is
because the variable became more statistically significant when I changed the
measurement from a dummy variable (p>.041) to a categorical variable (p>0.024).
This study also brings out interesting issues that raise various other new
questions for future research. For instance, drawing from the underlying theories used,
this study identifies that liability of foreignness is not the same for all foreign firms. As
Eden and Miller (2004: 196) put it, the main disadvantage of an international firm when
going abroad is being a “stranger in a strange land.” However, this study shows that
some lands are more strange for some strangers. Thus, it would be interesting to explore
if this differences in liability of foreignness change with time. Does it necessarily
decrease with time? Or, are there certain conditions under which it can be enhanced? Are
these results different without a (regulatory) punctuation?
Besides finding that banks from countries with closer commercial ties to the host
market are more likely to survive, the present study finds that foreign banks that engage

132
in acquisition strategies and banks that lend more aggressively30 are more likely to
survive regulatory punctuations in an emerging host market. Thus, it follows that
aggressive growth strategies were successful for this set of banks. This is an interesting
finding because it is counterintuitive in that the results show that it pays to take desperate
(bold) measures in desperate (not so stable) times. However, it is unclear if other factors
facilitated the success of these aggressive strategies. In other words, perhaps for more
diversified banks it is easier to implement aggressive strategies. It might be that in so
doing, these banks are in fact reducing their company-wide risk. Thus, future research
should test for interaction effects. Likewise, it would be interesting to find how
aggressiveness affects other types of firms. Do aggressive strategies only benefit banks?
Should an aggressiveness index be developed?
In following with the topic of aggressive responses, this study finds that for
(emerging market) domestic firms, aggressive (loan) growth strategies relate negatively
to firm survival during regulatory punctuations. Sachs et al. (1996) find that (emerging
market) countries that experienced lending booms, as a result of liberalization, were
more likely to suffer currency crises. In this sense, it would be interesting to test if
aggressive growth strategies have a negative effect on firms from countries that
experience lending booms (e.g., Mexico). Do aggressive policies affect banks from
countries that did not experience lending booms? Future research should strive to obtain
answers to these questions.
30 See comment in footnote #26.

133
REFERENCES
Abrahamson, E., & Hambrick, D.C. 1997. Attentional homogeneity in industries: The effect of discretion. Journal of Organizational Behavior, 18: 513-532.
Ahlstrom, D., & Bruton, G.D. 2001. Learning from successful local private firms in
China: Establishing legitimacy, Academy of Management Executive, 15: 72-83. Aldrich, H. 1979. Organizations and environments. Englewood Cliffs, NJ: Prentice
Hall. Allison, P. 1984. Event history analysis: Regression for longitudinal event data
(quantitative applications in the social sciences). Philadelphia, PA: Sage Publications.
Allmendinger, J., & Hackman, J.R. 1996. Organizations in changing environments: The
case of East German symphony orchestras. Administrative Science Quarterly, 41(3): 337-369.
Anderson, P., & Tushman, M. L. 1990. Technological discontinuities and dominant
designs: A cyclical model of technological-change. Administrative Science Quarterly, 35(4): 604-633.
Ataullah, A., & Le, H. 2004. Financial repression and liability of foreignness in
developing countries. Applied Economics Letters, 11(9): 545-549.
Bae, K.H., Kang, J.K., & Lim, C.W. 2002. The value of durable bank relationships: Evidence from Korean banking shocks. Journal of Financial Economics, 64(2): 181-214.
Banco de México. 1991-2004. Comisión nacional bancaria. Boletín Estadístico de
Banca Múltiple, various issues from 1991-2004. Banker, The. 2005. The top one thousand world banks. Available:
http://www.thebanker.com/news/fullstory.php/aid/3063/THE_TOP_ONE_THOUSAND_WORLD_BANKS.html.
Barkema, H.G., & Vermeulen, F. 1998. International expansion through start-up or
acquisition: A learning perspective. Academy of Management Journal, 41(1): 7-26.

134
Barney, J.B. 2002. Gaining and sustaining competitive advantage (2nd edition). Paramus, NJ: Prentice Hall.
Baum, J.A.C. Korn, H.J., & Kotha, S. 1995. Dominant designs and population-dynamics
in telecommunications services founding and failure of facsimile transmission service organizations, 1965-1992. Social Science Research, 24(2): 97-135.
Beamish, P.W. 1994. Joint Ventures in LDCs: Partner selection and performance.
Management International Review, 34 (special issue): 60-74. Bettis, R.A., & Hitt, M.A. 1995. The new competitive landscape. Strategic Management
Journal, 16: 7-19. Biles, J.J. 2004. Globalization of banking and local access to financial resources: A case
from Southern Mexico, The Industrial Geographer, 2(2): 159-173. Blyler, M., & Coff, R.W. 2003. Dynamic capabilities, social capital, and rent
appropriation: Ties that split pies. Strategic Management Journal, 24(7): 677-686.
Boeker, W. 1997. Strategic change: The influence of managerial characteristics and
organizational growth. Academy of Management Journal, 40(1): 152-170. Brouthers, K.D., & Brouthers, L.E. 2001. Explaining the national cultural distance
paradox. Journal of International Business Studies, 32(1): 177-189. Burt, R.S. 1997. The contingent value of social capital. Administrative Science
Quarterly, 42(2): 339-365. Cantwell, J. 1989. Technological innovations and multinational corporation. Oxford:
Basil Blackwell. Carroll, G. 1984. Organizational ecology. Annual Review of Sociology, 10: 71-93. Certo, S.T., & Semadeni, M. 2006. Strategy research and panel data: Evidence and
implications. Journal of Management, 32(3): 449-471. Chang, R., & Velasco, A. 2000. Liquidity crises in emerging markets: Theory and
policy. Cambridge, MA: National Bureau of Economic Research. Chazan, G. 2000. New Gasprom head has never wrangled a beast as big as this-in his
favor: He’s got the ear of Russia’s leader, Wall Street Journal, 1 June, A13.

135
Christopherson, S., & Hovey, R. 1996. Fast money: Financial exclusion in the Mexican economic adjustment. Environmental and Planning A, 28(7): 1157-1177.
Cleves, M.A., Gould, W.W., & Gutierrez, R.G. 2004. An introduction to survival
analysis using Stata (Revised edition). College Station, TX: Stata Press. Cohen, W.M., & Levinthal, D.A. 1990. Absorptive-capacity: A new perspective on
learning and innovation. Administrative Science Quarterly, 35(1): 128-152. Cox, D.R. 1972. Regression models and life-tables. Journal of the Royal Statistical
Society Series B-Statistical Methodology, 34(2): 187-202. Crisp, B.F., & Kelly, M.J. 1999. The socioeconomic impacts of structural adjustment.
International Studies Quarterly, 43(3): 533-552. D’Aveni, R.A., & Macmillan, I.C. 1990. Crisis and the content of managerial
communications: A study of the focus of attention of top managers in surviving and failing firms. Administrative Science Quarterly, 35(4): 634-657.
Das, T.K., & Teng, S.B. 1996. Risk types and inter-firm alliance structures. Journal of
Management Studies, 33(6): 827-843. DeCastro, J.O., & Uhlenbruck, K. 1997. Characteristics of privatization: Evidence from
developed, less-developed, and former communist countries. Journal of International Business Studies, 28(1): 123-143.
Delios, A., & Beamish, P.W. 1999. Geographic scope, product diversification, and the
corporate performance of Japanese firms. Strategic Management Journal, 20(8): 711-727.
Diamond, M. 1978. Towards a change in economic paradigm through experience of
developing countries. Journal of Development Economics, 5(1): 19-53 1978. DiMaggio, P.J., & Powell, W.W. 1991. The iron cage revisited: Institutional
isomorphism and collective rationality in organization fields. In W.W. Powell & P.J. DiMaggio (Eds.), The new institutionalism in organizational analysis: 1-38. Chicago, IL: University of Chicago Press.
Doh, J. P. 2000. Entrepreneurial privatization strategies: Order of entry and local partner
collaboration as sources of competitive advantage. Academy of Management Review, 25(3): 551-571.

136
Doz, Y.L. 1996. The evolution of cooperation in strategic alliances: Initial conditions or learning processes? Strategic Management Journal, 17: 55-83.
Dunning, J.H. 1977. The location of economic activity and the multinational enterprise:
Search for an eclectic approach. In B. Ohlin, P. Hesselborn & P. Wiskman (Eds.), The international allocation of economic activity: 395-418. London: Macmillan.
Dunning, J.H., & McQueen, M. 1982. Multinational corporations in the international
hotel industry. Annals of Tourism Research, 9(1): 69-90. Eden, L., & Miller, S.R. 2004. Distance matters: Liability of foreignness, institutional
distance and ownership Strategy. In M.A. Hitt & J.L.C. Cheng (Eds.), Advances in international management, theories of mutinational enterprise: Diversity, complexity and relevance: 182-222. Boston: Elsevier.
Edwards, S. 1995. Crisis and reform in Latin America: From despair to hope. New
York: Oxford University Press. Eisenhardt, K.M., & Martin, J.A. 2000. Dynamic capabilities: What are they? Strategic
Management Journal, 21(10-11): 1105-1121. Eldredge, N., & Gould, S.J. 1972. Punctuated equilibria: An alternative to phyletic
gradualism. In T.J.M. Schopf (Ed.), Models in paleobiology: 82-115. San Francisco: W.H. Freeman.
Ferrier, W.J. 2001. Navigating the competitive landscape: The drivers and consequences
of competitive aggressiveness. Academy of Management Journal, 44(4): 858-877.
Fox-Wolfgramm, S.J., Boal, K.B., & Hunt, J.G. 1998. Organizational adaptation to
institutional change: A comparative study of first-order change in prospector and defender banks. Administrative Science Quarterly, 43(1): 87-126.
Franko, L.G. 2004. The death of diversification? The focusing of the world’s industrial
firms, 1980-2000. Business Horizons, 47(4): 41-50. Froot, K.A., & McBrady, M. 1996. The 1994-1995 Mexican Peso Crisis (Harvard
Business School Case #9-296-056). Boston, MA: Harvard Business School. Geringer, J.M., Beamish, P.W., & Dacosta, R.C. 1989. Diversification strategy and
internationalization - implications for MNE performance. Strategic Management Journal, 10(2): 109-119.

137
Geringer, J.M., Tallman, S., & Olsen, D.M. 2000. Product and international diversification among Japanese multinational firms. Strategic Management Journal, 21(1): 51-80.
Gersick, C.J.G. 1991. Revolutionary change theories: A multilevel exploration of the
punctuated equilibrium paradigm. Academy of Management Review, 16(1): 10-36.
Gersick, C.J.G. 1994. Pacing strategic change: The case of a new venture. Academy of
Management Journal, 37(1): 9-45. Gillespie, K., & Teegen, H.J. 1995. Market liberalization and international alliance
formation: The Mexican paradigm. Columbia Journal of World Business, 30(4): 58-69.
Glaister, K.W., & Buckley, P.J. 1996. Strategic motives for international alliance
formation. Journal of Management Studies, 33(3): 301-332. Glaser, L., Laibson, D., & Sacerdote, B. 2002. An economic approach to social capital.
Economic Journal, 112: F437-F458. Gold, B.A. 1999. Punctuated legitimacy: A theory of educational change. Teachers
College Record, 101(2): 192-219. Goldberg, L. Dages, B.G., & Kinney, D. 2000. Foreign and domestic bank participation
in emerging markets: Lessons from Mexico and Argentina. Federal Reserve Bank of New York Economic Policy Review, 6: 3.
Gould S.J., & Eldredge, N. 1977. Punctuated equilibria: The tempo and mode of
evolution reconsidered. Paleobiology, 3: 115-151. Granovetter, M. 1985. Economic-action and social-structure: The problem of
embeddedness. American Journal of Sociology, 91(3): 481-510. Grant, R.M. 1987. Multinationality and performance among British manufacturing
companies. Journal of International Business Studies, 18(3): 79-89. Greenwood, R., & Hinings, C.R. 1988. Organizational design types, tracks and the
dynamics of strategic change. Organization Studies, 9(3): 293-316. Greenwood, R., & Hinings, C.R. 1993. Understanding strategic change: The contribution
of archetypes. Academy of Management Journal, 36(5): 1052-1081.
138
Greenwood, R., & Hinings, C.R. 1996. Understanding radical organizational change: Bringing together the old and the new institutionalism. Academy of Management Review, 21(4): 1022-1054.
Gross, R. 2000. Citibank: The Confia acquisition in Mexico (A) (Case # A07-00-0022).
Available: http://www.thunderbird.edu/pdf/about_us/case_series/a07000022.pdf. Gruben, W.C, & McComb, R. 1997. Liberalization, privatization, and crash: Mexico’s
banking system in the 1990’s. Economic Review, 21-51 Gruben, W.C., & Welch, J.H. 1996. Default risk and dollarization in Mexico. Journal of
Money Credit and Banking, 28(3): 393-401. Guillen, M.F. 1997. Scientific management’s lost aesthetic: Architecture, organization,
and the taylorized beauty of the mechanical. Administrative Science Quarterly, 42(4): 682-715.
Guillen, M.F. 2000. Business groups in emerging economies: A resource-based view.
Academy of Management Journal, 43(3): 362-380. Guillen, M.F. 2002. Structural inertia, imitation, and foreign expansion: South Korean
firms and business groups in China, 1987-95. Academy of Management Journal, 45(3): 509-525.
Guillen, M.F, & Tschoegl, A.E. 1999. At last the internationalization of retail banking?
The case of the Spanish banks in Latin America, financial institution center. Philadelphia: Wharton School, University of Pennsylvania.
Haber, S., & Kantor, S. 2003. Getting privatization wrong: The Mexican banking
system 1991-2001. Unpublished paper, Stanford University, Stanford, CA. Haggard, S. 1990. The politics of growth in the newly industrialized countries. Ithaca,
NY: Cornell University. Hambrick, D.C., & Finkelstein, S. 1987. Managerial discretion: A bridge between polar
views of organizational outcomes. Research in Organizational Behavior, 9: 369-406.
Hambrick, D.C., & Finkelstein, S. 1995. The effects of ownership structure on
conditions at the top: The case of CEO pay raises. Strategic Management Journal, 16(3): 175-193.

139
Hamilton, L.C. 1998. Statistics with STATA 5. Pacific Grove, CA: Thomson Brooks/Cole.
Hannan, M.T., & Freeman, J. 1977. Population ecology of organizations. American
Journal of Sociology, 82(5): 929-964. Haveman, H.A. 1992. Between a rock and a hard place: Organizational-change and
performance under conditions of fundamental environmental transformation. Administrative Science Quarterly, 37(1): 48-75.
Haveman, H.A. 2001. Nonprofit organizations in an age of uncertainty: A study of
organizational change. Administrative Science Quarterly, 46(2): 367-369. Haveman, H.A., Russo, M.V., & Meyer, A.D. 2001. Organizational environments in
flux: The impact of regulatory punctuations on organizational domains, CEO succession, and performance. Organization Science, 12(3): 253-273.
Hill, C.W.L., & Rothaermel, F.T. 2003. The performance of incumbent firms in the face
of radical technological innovation. Academy of Management Review, 28(2): 257-274.
Hill, C.W.L., Hitt, M.A., & Hoskisson, R.E. 1992. Cooperative versus competitive
structures in related and unrelated diversified firms. Organization Science, 3(4): 501-521.
Hillman, A.J., & Hitt, M.A. 1999. Corporate political strategy formulation: A model of
approach, participation, and strategy decisions. Academy of Management Review, 24(4): 825-842.
Hitt, M.A., Ahlstrom, D., Dacin, A.T., Levitas, E., & Svobodina, L. 2004. The
institutional effects on strategic alliance partner selection in transition economies: China vs. Russia. Organization Science, 15(2): 173-185.
Hitt, M.A., Bierman, L., Shimizu, K., & Kochhar, R. 2001. Direct and moderating
effects of human capital on strategy and performance in professional service firms: A resource-based perspective. Academy of Management Journal, 44(1): 13-28.
Hitt, M.A., Dacin, M.T., Levitas, E., Arregle, J.L., & Borza, A. 2000. Partner selection
in emerging and developed market contexts: Resource-based and organizational learning perspectives. Academy of Management Journal, 43(3): 449-467.

140
Hitt, M.A., Hoskisson, R.E., & Ireland, R.D. 1994. A midrange theory of the interactive effects of international and product diversification and product diversification on innovation and performance. Journal of Management, 20(2): 297-326.
Hitt, M.A., Hoskisson, R.E., & Kim, H. 1997. International diversification: Effects on
innovation and firm performance in product-diversified firms. Academy of Management Journal, 40(4): 767-798.
Hitt, M.A., Ireland, R.D., & Hoskisson, R.E. 2002. Strategic management
competitiveness and globalization (5th edition). Cincinnati, OH: South-Western College Pub. Co.
Hitt, M.A., Keats, B.W., & DeMarie, S.M. 1998. Navigating in the new competitive
landscape: Building strategic flexibility and competitive advantage in the 21st century. Academy of Management Executive, 12(4): 22-42.
Hitt, M.A., Nixon, R.D., Clifford, P.G., & Coyne, K.P. 1999. The development and use
of strategic resources. In M.A. Hitt, P.G. Clifford, R.D. Nixon & K.P. Coyne (Eds.), Dynamic strategic resources: Development, diffusion and integration: 1-14. Chichestershire, England: Wiley.
Hofstede, G. 1980. Culture’s consequences: International difference in work related
values. Beverly Hills, CA: Sage Publications. Hoskisson, R.E., Eden, L., Lau, C.M., & Wright, M. 2000. Strategy in emerging
economies. Academy of Management Journal, 43(3): 249-267. Hoskisson, R.E., & Hitt, M.A. 1990. Antecedents and performance outcomes of
diversification: Review and critique of theoretical perspectives. Journal of Management, 16(2): 461-509.
Hoskisson, R.E., Hitt, M.A., Wan, W.P., & Yiu, D. 1999. Theory and research in
strategic management: Swings of a pendulum. Journal of Management, 25(3): 417-456.
House, R.J., Hanges, P.J., Javidan, M., Dorfman, P.W., & Gupta, V. 2004. Culture,
leadership, and organizations: The GLOBE study of 62 societies. Thousand Oaks, CA: Sage Publications.
Hovey, R. 1996. The Mexican commercial bank privatizations: Market reform,
economic power, and the transformation of public and private interest. Doctoral dissertation, Cornell University, Ithaca, NY.

141
Hymer, S.H. 1976. The international operations of national firms: A study of direct foreign investment (Original work published 1960). Cambridge, MA: The MIT Press.
Kaminsky, G.L., & Reinhart, C.M. 1998. Financial crises in Asia and Latin America:
Then and now. American Economic Review, 88(2): 444-448. Katz, D., & Kahn, R. 1966. The social psychology of organizations. New York: Wiley. Keister, L.A. 2002. Adapting to radical change: Strategy and environment in piece-rate
adoption during China’s transition. Organization Science, 13(5): 459-474. Khanna, T., & Palepu, K. 1997. Why focused strategies may be wrong for emerging
markets. Harvard Business Review, 75(4): 41-42. Khanna, T., & Rivkin, J.W. 2001. Estimating the performance effects of business groups
in emerging markets. Strategic Management Journal, 22(1): 45-74. Kim, W.C., Hwang, P., & Burgers, W.P. 1993. Multinationals diversification and the
risk-return trade-off. Strategic Management Journal, 14(4): 275-286. Kogut, B., & Zander, U. 1993. Knowledge of the firm and the evolutionary-theory of the
multinational-corporation. Journal of International Business Studies, 24(4): 625-645.
Kogut, B., & Zander, U. 1996. What firms do? Coordination, identity, and learning.
Organization Science, 7(5): 502-518. Kostova, T., & Zaheer, S. 1999. Organizational legitimacy under conditions of
complexity: The case of the multinational enterprise. Academy of Management Review, 24(1): 64-81.
Kraatz, M.S. 1998. Learning by association? Interorganizational networks and
adaptation to environmental change. Academy of Management Journal, 41(6): 621-643.
Krueger, A., & Tornell, A. 1999. The role of bank restructuring in recovering from
crises: Mexico 1995-98. NBER working paper series, No. 7042, National Bureau of Economic Research, Cambridge, MA.
Kuhn, T.S. 1970. The structure of scientific revolutions (3rd edition). Chicago: The
University of Chicago Press.

142
Lu, J.W., & Beamish, P.W. 2001. The internationalization and performance of SMEs. Strategic Management Journal, 22(6-7): 565-586.
Luo, Y.D., & Peng, M.W. 1999. Learning to compete in a transition economy:
Experience, environment, and performance. Journal of International Business Studies, 30(2): 269-295.
Luthans, F., & Ibrayeva, E.S. 2006. Entrepreneurial self-efficacy in Central Asian
transition economies: Quantitative and qualitative analyses. Journal of International Business Studies, 37(1): 92-110.
Mailander, C.J. 1999. Reshaping North American banking: The transformation effects
of regional market and policy shifts, policy papers on the Americas-Volume X, 1999. Washington, DC: Center for Strategic and International Studies.
Maskooki, K. 1994. Mexico’s 1994 peso crisis and its aftermath. European Business
Review, 14: 3-161. Mehra, A. 1996. Resource and market based determinants of performance in the US
banking industry. Strategic Management Journal, 17(4): 307-322. Mendoza, G., & Torre, L.E. 1999. El Programa de Rescate y Reestructuración Bancaria
en México, 1995-1998: ¿Éxito o Fracaso? Centro de Análisis y Difusión Económica, CADE. Documento de Investigación #4 (January).
Meyer, A.D. 1982. Adapting to environmental jolts. Administrative Science Quarterly,
27(4): 515-537. Meyer, A.D., Brooks, G.R., & Goes, J.B. 1990. Environmental jolts and industry
revolutions: Organizational responses to discontinuous change. Strategic Management Journal, 11: 93-110.
Meyer, J.W., & Rowan, B. 1977. Institutionalized organizations: Formal-structure as
myth and ceremony. American Journal of Sociology, 83(2): 340-363. Mezias, J.M. 2002. Identifying liabilities of foreignness and strategies to minimize their
effects: The case of labor lawsuit judgments in the United States. Strategic Management Journal, 23(3): 229-244.
Miller, S.R., & Parkhe, A. 2002. Is there a liability of foreignness in global banking? An
empirical test of banks’ X-efficiency. Strategic Management Journal, 23(1): 55-75.
143
Miner, A.S., Amburgey, T.L., & Stearns, T.M. 1990. Interorganizational linkages and population-dynamics: Buffering and transformational shields. Administrative Science Quarterly, 35(4): 689-713.
Mortimore, M. 2000. Corporate strategies for FDI in the context of Latin America’s new
economic model. World Development, 28(9): 1611-1626. Murillo, J.A. 2000. La banca en México: Privatización, crisis y reordenamiento, Banco
de México. Available: http://www.cemla.org/pdf/red/RED_VII_MEXICO-Jose-Murillo.PDF.
Nachum, L. 2003. Liability of foreignness in global competition? Financial service
affiliates in the City of London. Strategic Management Journal, 24(12): 1187-1208.
Newberry, W., & Yakova, N. 2006. Standardization preferences: A function of national
culture, work interdependence and local embeddedness. Journal of International Business Studies, 37(1): 44-60.
O’Grady, S., & Lane, H.W. 1996. The psychic distance paradox. Journal of
International Business Studies, 27(2): 309-333. Oliver, C. 1990. Determinants of interorganizational belationships: Integration and
future-directions. Academy of Management Review, 15(2): 241-265. Ortiz, G. 1994. La reforma financiera y la desincorporación bancaria. Mexico: Fondo
de Cultura Económica. Ortiz-Rivera, A. 2000. El Consejo Mexicano de Hombres de Negocios: Organo de
acción política de la elite empresarial. Paper presentado en el XXII Congreso Internacional de la Asociación de Estudios Latinoamericanos, Miami.
Osborn, R.N., & Hagedoorn, J. 1997. The institutionalization and evolutionary dynamics
of interorganizational alliances and networks. Academy of Management Journal, 40(2): 261-278.
Ouchi, W.G. 1980. Markets, bureaucracies, and clans. Administrative Science
Quarterly, 25(1): 129-141. Park, Y.C. 1996. East Asian liberalization, bubbles, and the challenge from China.
Brooking Papers on Economic Activity, 2: 357-371.

144
Peng, M.W. 2003. Institutional transitions and strategic choices. Academy of Management Review, 28(2): 275-296.
Peng, M.W., & Heath, P.S. 1996. The growth of the firm in planned economies in
transition: Institutions, organizations, and strategic choice. Academy of Management Review, 21(2): 492-528.
Peterson, M.F. 2004. Culture, leadership and organizations: The GLOBE study of 62
societies. Administrative Science Quarterly, 49(4): 641-647. Pfeffer, J., & Salancik, G. 1978. The external control of organizations: A resource
dependence perspective. New York: Harper & Row. Pollack, R. 1985. A transaction cost approach to families and households. Journal of
Economic Literature, 23, 581-608. Porter, M.E. 1990. Competitive strategy. New York: Free Press. Porter, M.E. 1998. Creating tomorrow’s advantage. In R. Gibson (Ed.), Rethinking the
future: 23-25. London: Nicholas Brealey Publishing Limited. Powell, W.W., & Smith-Doerr, L. 1994. Networks and economic life. In N. Smelser &
R. Swedberg (Eds.), Handbook of economic sociology: 368-402. Princeton, NJ: Princeton University Press.
Prahalad, C.K. 1999. Changes in the competitive battlefield. Mastering Strategy, 4: 2-4. Prahalad, C.K., & Bettis, R.A. 1986. The dominant logic: A new linkage between
diversity and performance. Strategic Management Journal, 7(6): 485-501. Putnam, R. 2000. Bowling alone: The collapse and revival of American community.
New York: Simon and Schuster. Rangan, S., & Drummond, A. 2004. Explaining outcomes in competition among foreign
multinationals in a focal host market. Strategic Management Journal, 25(3): 285-293.
Ranis, G. 1995. Challenges and opportunities posed by Asia’s superexporters:
Implications for manufactured exporters from Latin America. In J.L. Dietz (Ed.), Latin America’s economic development: Confronting crisis (2nd edition): 37-41. Boulder, CO: Lynne Rienner Publishers.

145
Ranson, S., Hinings, B., & Greenwood, R. 1980. Structuring of organizational structures. Administrative Science Quarterly, 25(1): 1-17.
Richardson, J. 1996. Vertical integration and rapid response in fashion apparel.
Organization Science, 7(4): 400-412. Rogozinski, J. 1998. High price for change: Privatization in Mexico. Washington, DC:
Inter-American Development Bank. Rugman, A. 1981. Inside the multinationals: The Economics of internal markets. New
York: Columbia University Press. Sabherwal, R., Hirschheim, R., & Goles, T. 2001. The dynamics of alignment: Insights
from a punctuated equilibrium model. Organization Science, 12(2): 179-197. Sachs, J., Tornell, A., & Velasco, A. 1996. The Mexican peso crisis: Sudden death or
death foretold? Journal of International Economics, 41(3-4): 265-283. Sanchez-Peinado, E. 2003. Internationalization process of Spanish banks: Strategic
orientation after the mergers. European Business Review, 15(4): 245-261. Schuler, D.A., Rehbein, K., & Cramer, R.D. 2002. Pursuing strategic advantage through
political means: A multivariate approach. Academy of Management Journal, 45(4): 659-672.
Scott, W.R. 1995. Institutions and organizations. Thousand Oaks, CA: Sage
Publications. Sheahan, J. 1987. External trade, industrialization, and economic growth in patterns of
development in Latin America: Poverty, repression and economic strategy (Chapter 4, pp. 74-98). Princeton, NJ: Princeton University Press.
Sheahan, J. 1997. Effects of liberalization programs on poverty and inequality: Chile,
Mexico, and Peru. Latin American Research Review, 32(3): 7-37. Simon, H.A. 1979. Information-processing models of cognition. Annual Review of
Psychology, 30: 363-396. Sirmon, D.G. 2004. Relative resource advantages, relative resource disadvantages,
strategy and performance: Exploring the effects of U.S. regional bank’s resource portfolios. Doctoral dissertation, Arizona State University, Tempe, AZ.

146
Small, D. 2004. Empire strikes back: Spanish banks recolonize Ibero-America. EIR Economics, July 2, 30-45.
Spicer, A., McDermott, G.A., & Kogut, B. 2000. Entrepreneurship and privatization in
Central Europe: The tenuous balance between destruction and creation. Academy of Management Review, 25(3): 630-649.
Stahl, G.K., & Caligiuri, P. 2005. The effectiveness of expatriate coping strategies: The
moderating role of cultural distance, position level, and time on the international assignment. Journal of Applied Psychology, 90(4): 603-615.
Steinfeld, J. 2004. Development and foreign investment: Lessons learned from
Mexican banking. Available: http://www.carnegieendowment.org/files/cp47.steinfeld.final.pdf.
Strandholm, K., Kumar, K., & Subramanian, R. 2004. Examining the interrelationships
among perceived environmental change, strategic response, managerial characteristics, and organizational performance. Journal of Business Research, 57(1): 58-68.
Sun Tzu (600 BC). 1988. The art of war (James Clavell, Ed.). New York: Delta. Teagarden, M.B. 2005. Culture, leadershop, and organizations: The GLOBE study of 52
societies. Academy of Management Executive, 19(2): 162-163. Teece, D.J., Pisano, G., & Shuen, A. 1997. Dynamic capabilities and strategic
management. Strategic Management Journal, 18(7): 509-533. Thompson, J.D. 1967. Organization in action (Chapters 1-5). New York: McGraw Hill. Toulan, O.N. 2002. The impact of market liberalization on vertical scope: The case of
Argentina. Strategic Management Journal, 23(6): 551-560. Tschoegl, A.E. 2003. Financial crisis and the presence of foreign banks. Available:
http://www1.worldbank.org/finance/assets/images/Tschoegl_Crises.pdf. Tushman, M.L., & Anderson, P. 1986. Technological discontinuities and organizational
environments. Administrative Science Quarterly, 31(3): 439-465. Tushman M.L., & Romanelli, E. 1985. Organizational evolution: A metamorphosis
model of convergence and reorientation. In L.L. Cummins & B.M. Staw (Eds.), Research in organizational behavior: 171-222. Greenwich, CT: JAI Press.

147
Unal, H., & Navarro, M. 1999. Policy paper: The technical process of bank privatization in Mexico. Journal of Financial Services Research, 16(1): 61-83.
Uzzi, B. 1996. The sources and consequences of embeddedness for the economic
performance of organizations: The network effect. American Sociological Review, 61(4): 674-698.
Uzzi, B. 1997. Social structure and competition in interfirm networks: The paradox of
embeddedness. Administrative Science Quarterly, 42(1): 35-67. Volberda, H.W. 1996. Toward the flexible form: How to remain vital in
hypercompetitive environments. Organization Science, 7(4): 359-374. Wake, D.B., Roth, G., & Wake, M.H. 1983. On the problem of the stasis organismal
evolution. Journal of Theoretical Biology, 101:211-224. Wan, W.P. 2005. Country resource environments, firm capabilities, and corporate
diversification strategies. Journal of Management Studies, 42(1): 161-182. Wan, W.P., & Hoskisson, R.E. 2001. Country resource environments, corporate
diversification strategies, and firm performance. Paper presented at the Academy of Management Best Paper Proceedings, Washington, DC.
Wan, W.P., & Hoskisson, R.E. 2003. Home country environments, corporate
diversification strategies, and firm performance. Academy of Management Journal, 46(1): 27-45.
Weidenbaum, M., & Hughes, S. 1996. The bamboo network. New York: Free Press. White, R. 1991. State, class, and the nationalization of the Mexican banks. New York:
Crane Russak. Williamson, O.E. 1975. Markets and hierarchies. New York: Free Press. Wilson, B. Saunders, A., & Caprio, G. 2000. Mexico’s financial sector crisis:
Propagative linkages to devaluation. Economic Journal, 110: 292-308. Wollin, A. 1999. Punctuated equilibrium: Reconciling theory of revolutionary and
incremental change. Systems Research and Behavioral Science, 16(4): 359-367. Woodstock Institute. 2001. Citigroup-banacci merger some information from Mexico.
Chicago: Author.

148
Wooldridge, J.M. 2002. Econometric analysis of cross section and panel data. Cambridge, MA: MIT Press.
Wright, M., Filatotchev, I., Hoskisson, R.E., & Peng, M.W. 2005. Strategy research in
emerging economies: Challenging the conventional wisdom (Introduction). Journal of Management Studies, 42(1): 1-33.
Wright, M., Hoskisson, R.E., Busenitz, L.W., & Dial, J. 2000. Entrepreneurial growth
through privatization: The upside of management buyouts. Academy of Management Review, 25(3): 591-601.
Yacaman, J.M. 2000. Competition and consolidation in the Mexican banking industry
after the 1995 Crisis. Available: http://www.bis.org/publ/bispap04j.pdf. Zaheer, S. 1995. Overcoming the liability of foreignness. Academy of Management
Journal, 38(2): 341-363. Zaheer, S. 2002. The liability of foreignness, redux: A commentary. Journal of
International Management, 8: 351-358. Zaheer, S., & Mosakowski, E. 1997. The dynamics of the liability of foreignness: A
global study of survival in financial services. Strategic Management Journal, 18(6): 439-463.
Zebadúa, E., & Kolari, J. 1997. The Mexican Banking System: A Historical Overview.
Unpublished paper, Mexican Congress, State of Chiapas.

149
APPENDIX A
MULTINATIONAL SUBSIDIARIES

150
(Rank) Bank’s Name/
Brief Explanation Other Remarks and Numbers
(1) BBVA Renamed BBVA-Bancomer
BBVA bought a minority stake in Probursa in 1993. After the crisis onset, Probursa was nearing. BBVA saw the acquisition of Probursa (1995) as an opportunity to increase its presence in Latin America. In 1999, the Spanish bank offered to buy a controlling interest of Bancomer (32.2%). After several months of discussion and a competing offer from Banamex, the board accepted BBVA’s offer in 2000. Currently (12/2004), BBVA hold more than 98% of Bancomer’s shares. BBVA had 8% of market share in Latin America (excluding Brazil) in 2003.
Probursa acquisition: $350 US Millions for 60% of its equity. Probursa had 146 branches, 3200 employees and 2.8% market share of the industry. Bancomer acquisition: BBVA invested $2.5 US billions for a controlling 32.2% of Bancomer. At the time, Bancomer had 1320 branches, 25,000 employees and a 19.7% market share of the industry. BBVA ended up paying about $8.3 US billions for 98% of Bancomer shares. Former shareholder groups include: The Mexican government (11%); and the Bank of Montreal (17%). In sum, BBVA invested roughly $8.6 US billions. BBVA led Banamex (Citibank) in both asset and loan portfolio by 2 and 7 percentage points, respectively.

151
(2) Citibank Renamed Banamex
America’s Citibank has been in Mexico since 1929. However, it was until 1994 that it established a subsidiary in this country. Citibank established an alliance with Confia in 1995. This alliance would allow Citibank’s clients to utilize Confia’s network of branches. Confia went bankrupt in 1997; the Mexican government retook and sold it to Citibank in 1998. Citibank lost its bid to acquire Serfin in 2000. In 2001, Citibank bid to acquire the largest Banamex, the largest Mexican bank with 20% of the industry’s assets. Citibank had 7% of market share in Latin America (excluding Brazil) in 2003.
Confia acquisition: $180 US Millions for 100% of the bank. Confia had 300 branches, and roughly 3.5% of the assets of the system. Banamex acquisition: $12.5 US Billion for 100% of the banks. Banamex had 1363 branches, roughly 20% of the assets of the system. Note: Citibank also acquired Banamex’s brokerage house and the rest of the financial group.
(3) Santander The Spanish bank Santander established a subsidiary office in 12/1994. Around those years, Santander bough 8% of Bital and eventually acquired 27% of it before selling its position to HSBC in 2002. Santander’s first big acquisition was Mexicano bank in 1996. Santander’s second acquisition was Serfin in 2000. Both banks (Mexicano and Serfin) are to form one entity in 2005. However, all the branches were renamed Santander Serfin. Santander had 9% of market share in Latin America (excluding Brazil) in 2003.
Mexicano acquisition: $379 US Millions for 70% of its equity. Mexicano had 236 branches, 7400 employees and 8.3% market share of the industry. Serfin acquisition: Santander bough Serfin in $1.56 US billions. Serfin had 8.5% of market share, 572 branches and 9150 employees. Bank of America bought 24.9% of Santander’s Mexican subsidiary, Santander Mexicano for 1.6 US billions. It is safe to say that Santander’s equity in Santander Serfin (75.1%) is

152
the result of profits obtained in Mexican operations. That is why, despite that Mexicano and Serfin (separately) had 16.8% of market share (when bought) and now only has 13.5%, Santander should still be considered a winner in this process.
(4) HSBC The English HSBC entered the Mexican market (in 2000) as it acquired the Republic Bank of New York, which had a subsidiary in Mexico since 1995. HSBC increase its presence in Mexico when it bought Bital in 2002, Mexico’s 4th largest bank. HSBC had 4% of market share in Latin-America (excluding Brazil) in 2003.
The Republic Bank of NY had only one office with 83 employees in Mexico, and 0.25% of market share. Bital was acquired in June 2002 for $1.1 US billions. Bital had 1,374 offices, 14,649 employees and 7.89% of market share.
(5) Bank of Nova Scotia (BNS) Renamed Scotiabank Inverlat
In 1994, Canada’s BNS purchased 8.1% of the shares of Inverlat for $154.1 US millions. After the crisis, Inverlat went bankrupt and BNS stock was valued at $0.00. However, the Mexican government hired BNS to manage the bankrupted Inverlat. In 1996, BNS bough 16% of stock and in 2000 an additional 39%. BNS had 1% of market share in Latin America (excluding Brazil) in 2003
At the time of the bankruptcy, Inverlat had 6.1% of market share. When BNS became the majority owner in 2000, its market share stand at 4.16%. Currently (3/2004), Scotiabank Inverlat, as Inverlat is now known, holds a market share of 4.71%
(6) Bank of America Bank of America (BOFA) initiated operations with one office and 83 employees in 2/1995. After almost 10 years, BOFA has still one office and 5 employees more (88). BOFA took over the Mexican operations of Nations Bank in 1998.
BOFA’s increase in market share (assets) from 0.8% (1995) to 1.7% (3/2004). Several news articles have suggested that BOFA bought 24.9% of Santander-Serfin to learn about the Mexican market and transfer that knowledge to

153
target the Hispanic market in the US. BOFA’s loan portfolio in Mexico is only $30 US millions or 0.03% of that market, but its market share of deposits stands at 0.43%. These numbers does not consider BOFA participation in Santander-Serfin.
(6) ING ING bough 17% of Serfin, but after less than a year sold its position to HSBC. ING does not have other alliances with Mexican banks, but it has been active forming alliances with other types of financial institutions (e.g., insurance, pension funds). (ING) is a global financial institution of Dutch origin that offers banking, insurance and asset management to more than 60 million clients in more than 50 countries
ING has only 62 employees. However, it has 1.51% of market participation (assets). Its loan portfolio is 10 times larger than that of BOFA; it stands at roughly $300 US million, 0.32% of that market. Its market share of deposits stands at 0.45%.
(8) GE Capital GE Capital, a subsidiary of GE Financial, was established in 9/1997 after acquiring Alianza Bank (0.02% market share). Alianza was a very small bank, but the acquisition allowed GE Capital to integrate other financial firms of group Alianza.
GE Capital started with only 0.02% of market share (assets), but after less than 6 years, GE Capital holds 0.31% of market share (assets). Its loan portfolio represents 0.54% of the Mexican market and has deposits for 0.33% of that market.
(9) Bank of Boston Bank of Boston established its Mexican subsidiary in 1995. As of April 2004, Bank of Boston became part of BOFA.
Bank of Boston started with only 0.01% of market share (assets), but after roughly 9 years, Bank of Boston holds 0.33% of market share (assets). Its loan portfolio represents 0.23% of the Mexican market and has

154
deposits for 0.23% of that market.
(10) Comerica Bank Comerica Bank established its Mexican subsidiary in 9/1997. Comerica Bank is owned by Comerica Incorporated, a financial services company, with business in banking, and personal financial services and wealth and institutional management divisions.The only other foreign subsidiary of this American company (besides Mexico) is in Canada.
Comerica started with 0.05% of market share (assets). After roughly 7 years, Comerica holds 0.18% market share (assets). Its loan portfolio represents 0.25% of the Mexican market, and has deposits for 0.19% of that market
(10) American Express
American Express established its Mexican subsidiary in mid-1996. American Express is in the business of providing travel-related services, financial advisory services and international banking services throughout the world.
American Express started with 0.01% of market share (assets). After roughly 8 years, Amex holds 0.18% market share (assets). Its loan portfolio represents 0.26% of the Mexican market, and has deposits for 0.17% of that market
(12) Bank of Tokyo Renamed Tokyo-Mitsubishi (TM)
The Japanese TM established its Mexican subsidiary in the first quarter on 1995. The bank provides a full range of domestic and international financial services, including commercial banking.
TM started with 0.07% of market share (assets). After roughly 9 years, TM holds 0.13% market share (assets). Its loan portfolio represents 0.15% of the Mexican market, and has deposits for 0.12% of that market
(12) JP Morgan JP Morgan established its presence in Mexico in early 1995. In 1997 bought 9% in Serfin, but later sold its position to Santander. JP Morgan and Chase Merge in December 2000. JP Morgan was elected as the name of the Mexican subsidiary. JP Morgan had 2% of market share in Latin America (excluding Brazil) in 2003.
JP Morgan has a market share of 1.03% in Mexico (3/2004). However, its loan portfolio equals zero. Its assets are mainly money market deposits in its name. Since the merger with Chase, JP Morgan has not only decreased its assets market share (from 1.51% to 1.03%) but also its

155
deposits market share from 0.17% to 0.07%.
(14) Deutsche Bank The German bank established its Mexican subsidiary 9/2000.
Deutsche Bank has a market share of 0.67% assets. However, its loan portfolio equals zero. Its market share on total deposits stands at 0.03%
(14) Bank One Bank One’s presence in Mexico is due to its acquisition of First Chicago in 1998, which entered the Mexican market in the first quarter of 1996.
America’s Bank One has a market share of 0.06% assets. Its loan portfolio represents exactly 0.06% of the market, while its deposits share of the market stand at 0.02%.
(16) ABN AMRO ABN AMRO established its Mexican subsidiary in 9/1995. The Dutch ABN AMRO is an international banking group offering a range of banking products and financial services on a global basis.
ABN AMRO has a market share of 0.03% (assets), second to last. Its loans portfolio and client deposits equals zero.
(17) Dresdner
Germany’s 3rd largest bank, Dresdner entered the Mexican market during the last quarter of 1995.
Dresdner’s performance in Mexico picked in the 3rd quarter of 1998. Dresdner had 0.28% of the loan portfolio market and 0.27% of the industry’s deposits. Dresdner sold its Mexican subsidiary to a group of Mexican investors (former members of Bital’s board) in July 2003. At the time of the sale, Dresdner had a market share of 0.02%, which garner it the last place in that category.
(18) BNP The French BNP entered the Mexican market 9/1995. In February 1999, BNP bid to acquire two French banks, Paribas and Societe General. It failed to acquire Societe General. In contrast, the
BNP’s performance in Mexico picked in the last quarter of 1998. BNP had 0.11% of the loan portfolio market and .014% of the industry’s deposits. By June

156
Paribas acquisition was confirmed by the respective boards and authorities in May of 2000.
2000, BPN-Paribas had only 0.04% of the loans and deposits of the industry. BNP-Paribas exited the Mexican market in the third quarter of 2001.
(19) Societe General France’s Societe General entered the Mexican market in the first quarter of 1996.
Societe General’s performance in Mexico picked in the 2nd quarter of 1998. Societe had 0.06% of the loan portfolio market and .014% of the industry’s deposits. By March 2000, Societe had only 0.01% of the loans and deposits of the industry. Societe General exited the Mexican market in the third quarter of 2000.
(20) Fuji The Japanese Fuji entered the Mexican market during the first quarter of 1995. In the autumn of 2000, Dai-Ichi Kangyo Bank, Fuji Bank and the Industrial Bank of Japan formed the Mizuho Financial Group. The Mizuho Financial Group is the #1 bank of the world in terms of assets.
Fuji’s performance in Mexico picked in the 3rd quarter of 1998. Fuji had 0.11% of the loan portfolio market and .09% of the industry’s deposits. Fuji decided to exit the Mexican market during the 3rd quarter of 1999.
Sources: Banco de México (1991-2004); Gruben & McComb (1997); The Banker (2005); Woodstock Institute (2001); Guillen and Tschoegl (1999); Goldberg et al., (2000); Gross (2000); Mailander (1999); Murillo (2000); Sanchez-Peinado (2003); Small (2004); Steinfeld (2004); Tschoegl (2003); Biles (2004.

157
APPENDIX B
ORIGINAL DOMESTIC BANKS
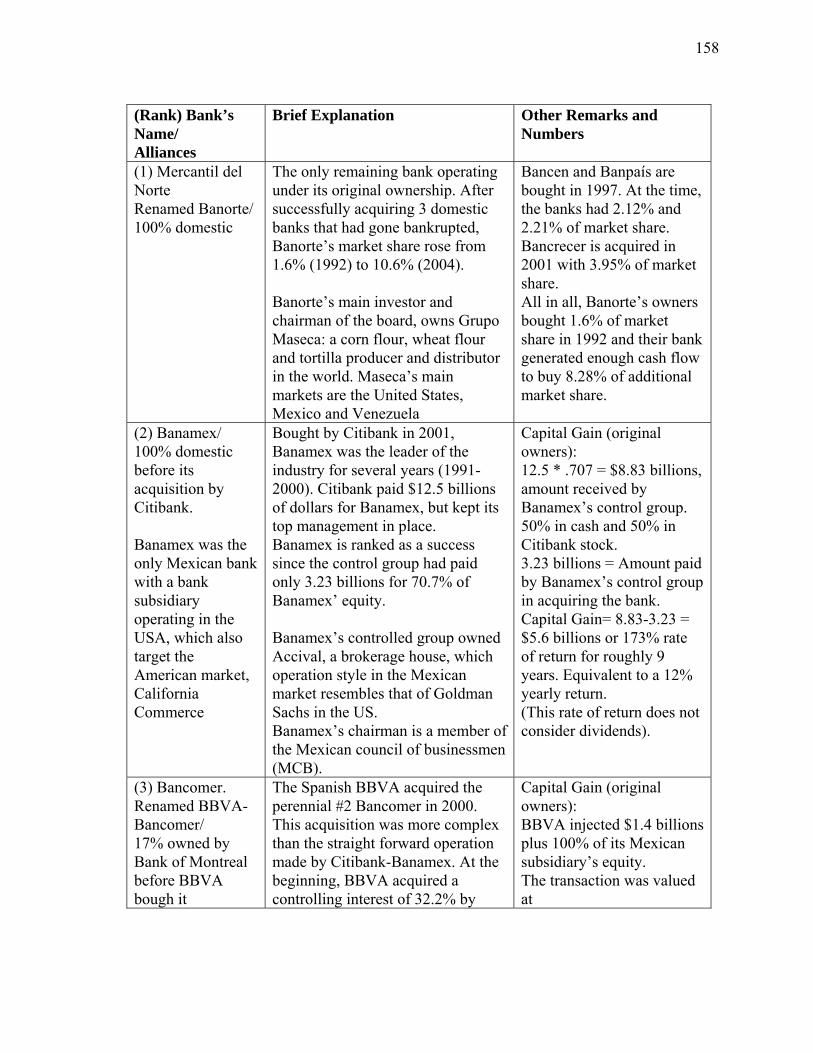
158
(Rank) Bank’s Name/ Alliances
Brief Explanation Other Remarks and Numbers
(1) Mercantil del Norte Renamed Banorte/ 100% domestic
The only remaining bank operating under its original ownership. After successfully acquiring 3 domestic banks that had gone bankrupted, Banorte’s market share rose from 1.6% (1992) to 10.6% (2004). Banorte’s main investor and chairman of the board, owns Grupo Maseca: a corn flour, wheat flour and tortilla producer and distributor in the world. Maseca’s main markets are the United States, Mexico and Venezuela
Bancen and Banpaís are bought in 1997. At the time, the banks had 2.12% and 2.21% of market share. Bancrecer is acquired in 2001 with 3.95% of market share. All in all, Banorte’s owners bought 1.6% of market share in 1992 and their bank generated enough cash flow to buy 8.28% of additional market share.
(2) Banamex/ 100% domestic before its acquisition by Citibank. Banamex was the only Mexican bank with a bank subsidiary operating in the USA, which also target the American market, California Commerce
Bought by Citibank in 2001, Banamex was the leader of the industry for several years (1991-2000). Citibank paid $12.5 billions of dollars for Banamex, but kept its top management in place. Banamex is ranked as a success since the control group had paid only 3.23 billions for 70.7% of Banamex’ equity. Banamex’s controlled group owned Accival, a brokerage house, which operation style in the Mexican market resembles that of Goldman Sachs in the US. Banamex’s chairman is a member of the Mexican council of businessmen (MCB).
Capital Gain (original owners): 12.5 * .707 = $8.83 billions, amount received by Banamex’s control group. 50% in cash and 50% in Citibank stock. 3.23 billions = Amount paid by Banamex’s control group in acquiring the bank. Capital Gain= 8.83-3.23 = $5.6 billions or 173% rate of return for roughly 9 years. Equivalent to a 12% yearly return. (This rate of return does not consider dividends).
(3) Bancomer. Renamed BBVA-Bancomer/ 17% owned by Bank of Montreal before BBVA bough it
The Spanish BBVA acquired the perennial #2 Bancomer in 2000. This acquisition was more complex than the straight forward operation made by Citibank-Banamex. At the beginning, BBVA acquired a controlling interest of 32.2% by
Capital Gain (original owners): BBVA injected $1.4 billions plus 100% of its Mexican subsidiary’s equity. The transaction was valued at

159
offering $2.5 US billions to the Mexican controlling group. Subsequently, BBVA increased its stake in Bancomer up to 98%. Bancomer’s control group had initially bought 56% of the bank’s equity for 2.85 US billions. Bancomer’s controlled group also owned FEMSA and Cerveceria, among other businesses. FEMSA produces markets and distributes Coca-Cola trademark beverages through standard bottler agreements with the Coca-Cola Company. FEMSA operates in some parts of Mexico, Central America, Colombia, Venezuela, Brazil and Argentina. Cerveceria holds roughly 50% of the beer market in Mexico and exports its beers to North America and Europe (e.g., XX, Tecate). Bancomer’s chairman of the board is an MCB member.
$2.5 billions, and in exchange, BBVA stockholders would received 32.2% of the new entity’s equity. In other words, the original stockholders of Bancomer would now have 67.8% of equity participation in the new firm. Bancomer‘s ownership paid $2.85 billions for 56% of its equity. 67.8% of 56% approximates 38%. This means that Bancomer’s original ownership would now control 38% instead of 56%. In February 2004, BBVA bought 38.4% for $3.88 billions increasing its ownership from 59.4% to 98% Prior to this transaction, BBVA had bought 16% and 11% stock packages from Bank of Montreal and the Mexican government, respectively. Capital Gain: 3.84 (38/38.4*3.88) – 2.85 = $0.99 billions or 35% rate of return for roughly 12 years. Around 2.5% annual yields. (This rate of return does not consider dividends).
(4) Internacional. Renamed Bital Renamed HSBC/ 26% owned by Santander and 17% by ING
Bital was the 4th largest bank of the industry at the time HSBC bought it for $1.14 US billions (2002). The original owners had paid $0.48 billions for 51% of Bital’s equity (1992).
Capital Gain (original owners): 1.14 * .51 = 0.58 billions, amount received by Bital’s control group. They bought it for 0.48 billions. Thus, the

160
before its sale to HSBC
Before the sale, the Berrondo family controlled 52% of Bital. The Berrondo’s also own Mabe, Mexico's biggest white goods manufacturer. Member of the board, Mr. Berrondo is also an MCB member, as well as Bital’s chairman of the board, for a number of years, Antonio Del Valle.
rate of return is marginal, only 21% in roughly ten years. That is a 2% rate of return a year. (This rate of return does not consider dividends).
(5) Mercantil de Mexico Renamed Probursa. Renamed BBV-Probursa. Now BBVA-Bancomer/ BBVA had bought a minority stake in Probursa before the Mexican crisis
Mercantil de Mexico, renamed Probursa, was the first bank reprivatized by the Mexican government (6/1991). Despite its early success, losses in money market operations along with the exchange rate crisis weakened the bank. Probursa’s ownership was force to sell due to capitalization problems. Ironically, Probursa became the first multinational bank subsidiary. However, the original control group kept a minority stake. Mercantil had been acquired by Probursa brokerage house, a top 5 brokerage house in Mexico and a group of investors. Among the investors, there was the CEO of Sidek, a Mexican steel company, which went bankrupted after the crisis. He was a member of the MCB for just 1 year.
Original ownership paid $202 millions for 77% of the bank. BBV capitalized the bank by injecting $350 millions in exchange for roughly 60% of Probursa’s equity. This meant that the original control group would now hold only 30%. In other words, by mid-1995 the original ownership had already lost 47 percentage points of the banks equity equivalent to $120 millions of their original investment (47 / 77 * 202).
(6) Mexicano Renamed Santander-Serfin/ 100% domestic before its sale to Santander
Formerly known as Somex, Mexicano also enjoyed early success. However, just as in the case of Probursa, Mexicano’s control group was forced to relinquish its controlling interest. Although, original ownership was able to keep a minority interest. Mexicano had been acquired by InverMexico brokerage house, a top
Original ownership paid $607 millions for 82% of the bank. Santander capitalized the bank by injecting $379 millions in exchange for roughly 70% of Mexicano’s equity. This meant that the original control group would now hold only 24.6%. In other words, by

161
5 brokerage house in Mexico and a group of investors. Among the investors, there was the CEO of Grupo Desc, a Mexican conglomerate with $2 US billions on annual sales (2203). He is also a member of the MCB
mid-1996 the original ownership has already lost 57.4 percentage points of the banks equity equivalent to $425 millions of their original investment (57.4 / 82 * 607).
(7) Serfin Renamed Santander-Serfin/ 20% owned by HSBC, 9% by JP Morgan in 1997
Despite having equity alliances with HSBC and JP Morgan, being capitalized over and over again by its original owners and its size (13% of market share), Serfin’s stockholder lost 100% of their original investment. Santander bought it from the Mexican government in 2000. Former Serfin’s chairman is a MCB member. He also is Vitro’s CEO, a glass manufacturer company with annual sales of $2.3 US billions.
It is ranked above others based on its longevity, seven years (1992-1999). Even though its original investors lost all their money, the bank was cleaned by the government and sold to Santander. Its name still lives.
(8) Banoro 100% domestic before the merger
By December 1996, Banoro had more than doubled its 1992 market share in the Mexican banking industry (from 0.9% to 2.2%). The bank did not have capitalization problems when it merged with Bancrecer. The new entity took the Bancrecer name. Unfortunately, just 9 months after the merger, Bancrecer was bankrupted.
Before the merger, Banoro was owned by Estrategia Bursatil brokerage house, a small broker. This brokerage house and the rest of its financial group went bankrupt due to fraud in 1996.
(9) Atlantico Bancrecer Promex All 100% domestic
All of these banks acquired or merged with another domestic bank. And all of them went technically bankrupted. Once the Mexican government “clean” them, their clients and branches were acquired by Bital, Banorte and Bancomer, respectively. In the beginning, Atlantico and Promex were acquired by GBM (and 2 MCB members) and Finamex, respectively, two middle
*Atlantico- last report 9/1997 Renamed Bital (3/2002) *Bancrecer- last report 9/1997 Renamed Banorte (3/2002) *Promex- last report 12/1997 Renamed BBVA-Bancomer (2000)

162
size Mexican brokerage houses. Bancrecer was acquired by private investors from Southern Mexico (Guanajuato and Mexico City).
(12) Confia Renamed Citibank/ Citibank owned a minority stake before the bank went bankrupt
Reasonably successful in the beginning. However, the exchange rate crisis forced its ownership to capitalize the bank. The owners would not consider a controlling interest offer made by Citibank (similar to what BBV and Santander did with Probursa and Mexicano, respectively). 6/1997 is Confia’s last quarter reported. Confia had been acquired by Abaco brokerage house, a middle size brokerage house from Northern Mexico.
In an incredible lack of judgment the ownership finance the bank’s capitalization with off-shore CD’s from their clients. When large deposits were called, the bank went bankrupted. Confia’s CEO was found guilty of fraud. Ironically, Citibank ended up buying Confia from the government. Had Confia’s ownership accepted Citibank’s offer, they could have salvage some of their initial investment
(13) Comermex Renamed Inverlat, Renamed Scotia Bank Inverlat/ Scotia Bank owned a minority stake before it finally took over the bank
Despite its early alliance with Canada’s Bank of Nova Scotia, Inverlat lost almost a point of market share within 15 months of being privatized. At the time of its bankruptcy (6/1995), Inverlat was the 4th largest bank in Mexico. Comermex had been acquired by Inverlat, one of the largest brokerage houses in Mexico, owned by Mr. Legorreta. Legorreta, main shareholder of Inverlat, had been the CEO of Banamex before the nationalization. Legorreta was a member of the MCB until 1997.
For all practical purposes, both Inverlat and Bank of Nova Scotia (BNS) had lost their investment. After the bankruptcy however, the Mexican government awarded Nova Scotia with a contract to operate the bank for the next 5 years. Eventually, Nova Scotia acquired the control of the bank. BNS bought 8.1% in 1994 for $154 US millions. In 1996, its equity was worth $10 US millions. In 1996 and 2000, BNS increased to 55% its participation in Inverlat’s equity for $175 US dollars.

163
(14) Cremi/ 100% domestic before going out of business
Cremi merged with Union in the last quarter of 1994. Similarly to what happened to Banoro, a balance healthy Cremi went bankrupted because of a bad partnership with Union bank. Cremi was out of business before the end of 1994. In the beginning, Cremi was acquired by Multivalores, a small brokerage house.
Branches acquired by BBV in 1996
(15) Bancen De Oriente/ 100% domestic before going out of business
Bancen and De Oriente were among the first victims of the exchange rate crisis. De Oriente was the smallest bank of those sold by the government, 0.3% market share, while Bancen was also among the smallest with 1% of market share. Both of these banks were acquired by very small financial groups.
The last quarter of 1994 was De Oriente’s last financial report. While the second quarter of 1995 was Bancen’s last report. Bancen’s branches were bough by Banorte in 1997, while De Oriente’s offices were bought by BBV in 1996
(18) Union Banpaís/ 100% domestic
Union and Banpaís went bankrupted before 1994’s end. In both cases, the banks’ CEOs were accused of fraud. In fact, both CEOs exited the country. Banpaís has been acquired by Mexival, one of the smallest brokerage houses in Mexico. Union by a private investor.
Sources: Banco de México (1991-2004); Gruben & McComb (1997); Woodstock Institute (2001); Guillen and Tschoegl, (1999); Goldberg et al. (2000); Murillo (2000); Sanchez-Peinado (2003); Tschoegl, (2003); Biles (2004); Mainlander (1999); Steinfeld (2004).

164
APPENDIX C
NEW DOMESTIC BANKS

165
(Rank) Bank’s Name/ Ownership-Alliances
Brief Explanation Other Remarks and Numbers
(1) Inbursa 100% domestic
Although a subsidiary of Inbursa financial group, Inbursa bank is also the financial arm of Telmex, Grupo Carso, and Grupos Sanborns. These companies have a 30% plus weight in the Mexican stock market index and are all controlled by Mr. Carlos Slim (MCB member).
Inbursa is the 8th largest bank in Mexico in terms of assets. In terms of equity, however, Inbursa is the 4th largest bank in Mexico. In fact, Inbursa’s equity has grown 23 times its initial investment, from 273 millions to 1.87 billions US dollars (3/2004)
(2) Del Bajio 10% owned by Spanish bank Sabadell
Banco del Bajio is owned by regional investors from the state of Guanajuato. These investors did not have previous experience in the banking or brokerage house industries. Del Bajio bought 12 branches from bank Industrial, after it went bankrupted
First Mexican bank that offered online FX trading (2001). Also, its equity has more than 5 folded its initial investment (in dollar terms). This growth is only second to that of Inbursa. Del Bajio holds 0.74% of market share, which ranks it as the 2nd largest bank among the newly established ones.
(3) Azteca 100% domestic
Azteca is part of Grupo Elektra. Elektra controls and operates an influential department store (Elektra), which targets low and middle income families. Elektra also owns Television Azteca, the 2nd largest broadcast company in Mexico. Although Grupo Elektra does have some experience in financial services, it does not have experience managing banks.
The Elektra network of stores effectively provided Azteca with a ready-made branch system. Because its branches are inside Elektra’s department stores, the bank began operations with 815 branches in 230 Mexican cities Azteca has immediate plans to expand to Central America.
(4) Ixe 100% domestic The financial group, however, has a broker dealer subsidiary in NY, in
Ixe was established by Mr. Rangel de Alba, a regional entrepreneur (car-dealerships) from the center of Mexico in 1994. In 2000, Rangel de Alba sold Ixe to a group of individual investors linked to influential public
The change of ownership has not stop Ixe’s growth. The new owners paid 86 US million for the bank in October 2000. The former owners made a

166
partnership with Deutsche
corporations such as Grupo Soriana, the largest retailer in Northern Mexico, which chairman is an MCB member. Grupo Gigante, among the top retailers in Southern Mexico. And Alejandro Burillo, former #2 executive and shareholder of Grupo Televisa, the largest broadcasting firm in Latin-America. Neither the current or former group of control had direct experience in the banking industry prior to establishing or buying Ixe.
profit of 56 US millions (86%) in less than 6 years. Ixe is the 4th largest bank (in assets) among the newly established domestic banks. The new owners have seen Ixe’s market share grew from 0.32% (12/00) to 0.55% (3/04).
(5) Banregio 100% domestic
Owned by regional investors from Monterey headed by the Rivero brothers, who are among the most prominent families of that city. Banregio’s owners did not have direct experience with the financial sector.
Had not been for the exchange rate devaluation, this bank’s growth would be second to that of Inbursa. In terms of pesos, Banregio’s equity more than 7 folded. Banregio is the 3rd largest banks in terms of equity, among the newly established ones.
(6) Afirme 100% domestic
Afirme’s owners had more than 5 years of experience offering financial services (e.g., financial leasing). Afirme is 1 of only 2 banks owned by investors linked mainly with the financial sector (but not brokerage house industry) and had survived (among new banks only).
Afirme is 1 of only 2 banks (the other being Ixe), that grew by acquisition. In 1997 Afirme bought the branches of Banco Obrero. Afirme is the 5th largest bank among newly established ones. However, it is only the 7th largest in terms of equity.
(7) Mifel 100% domestic
Mifel is the other bank whose investors are linked with the financial sector (but not brokerage house industry).
Mifel is the 9th largest bank among the newly established ones. Mifel’s has expanded its assets 30 times over. This growth is only second to that obtained by Ixe.
(8) Bansi 100% domestic
Headed by a small group of regional investors from the state of Jalisco, Bansi began operations with roughly $15.1 US millions worth of equity. This amount is the smallest initial investment for establishing a bank in
Bansi’s growth has been more than satisfactory. Bansi’s assets and equity have four folded in 9 years of operation.

167
Mexico since 1982. (9) Invex 100% domestic
Invex is 1 of 2 banks (among the newly established), in which its owners can be directly linked to the brokerage house industry.
When it started, Invex had an equity market share of 0.37%. After 10 years of operation, Invex has only 0.39% of it. In other words, its growth has only been marginal.
(10) Interacciones 100% domestic
The only other bank (among the newly established) whose owners can be directly linked to the brokerage house industry. Additionally, its chairman of the board owned the Laredo National Bank (LNB). The LNB was acquired by BBVA for 669 millions of Euros (9/2004).
In 1998, Interacciones had 0.94% of market share (assets). By the 1st quarter of 2004, its market share decreased to 0.33%.
(13) Alianza 100% domestic before its sale to GE Capital
Alianza operated less than 3 fiscal quarters. To its defense, the bank was sold to GE Mexico. According to Alianza’s CEO, the bank was sold without loans past due.
In three quarters the bank generated roughly $0.9 US millions in profit. The bank’s was established with an equity of $23 US millions
(13) Quadrum 100% domestic
Among Quadrum’s board of directors members (main investors), there are 3 big personalities. Mr. Ahumada Russek, its chairman and main shareholder of the second largest construction company in Mexico. Mr. Madero Bracho, chairman of Grupo San Luis. And Mr. Salinas Pliego, chairman of Grupo Elektra, who now has a bank of his own (Azteca).
Quadrum operated for roughly seven years. Its equity market share never increased its initial 0.49% of the industry.
(14) Capital Industrial 100% domestic
Group of small investors establishing banks.
Capital operated for roughly two years and managed to obtain 0.31% of the industry’s market share. Industrial operated for 3 and half years and obtained 0.26% of market share. Industrial lasted longer but started with less equity and never got to 0.31% of market share. In the end, both were small banks that fail.
(15) Interestatal Established by a (Mexican) pacific Interestatal operated for only

168
100% domestic coast group of investors, owners of a credit union.
6 quarters before being intervened by the government.
(15) Pronorte 100% domestic
Pronorte was established by a Mr. Diaz-Rivera, owner of a small brokerage house (Valburmex). Substantial loses in money market operations resulted in the demise of both the bank and the brokerage house.
Pronorte operated for 9 fiscal quarters before being intervened by the government.
(17) Del Sureste 100% domestic
The lead investor, Eduardo Creel, had won the bid to acquire Somex (now Santander Mexicano) from the government in 1992. It turns out he backed up, which cost him and his investor group around $17 US millions as a withdraw penalty. In that same year, he and his investor group purchased Bursamex, a medium size brokerage house for $34 US millions. A few months later this group received the authorization to established Del Sureste Bank. One of Creel’s main investor, Fernando Ponce, is a member of the Mexican Council of Businessmen. The members of this organization are among the 30 most influential businessmen in Mexico.
After just three months of operations, Del Sureste had decreased its assets and equity by 50%. It should not be a surprise that after such a difficult start, the banks and the brokerage house lasted 5 fiscal quarters more.
(19) Anahuac 100% domestic
Administered by the son and nephew of former Mexican president De la Madrid (1982-1988), the bank operated 5 quarter before being intervened by the government. The bank’s name was linked to fraudulent operations.

169
APPENDIX D
THE BANKER RANKING FACTORS

170
The factors considered for the rankings are strength, size, soundness, profits,
performance, capital ratio, and non performing loans to total loans.
Strength: tier one capital, as defined by Basel’s Bank for International
Settlements (BIS). The definition is stricter than total stockholder equity and covers only
the core of the banks’ strength (i.e., the shareholders’ equity available to cover actual or
potential losses). Tier 1 includes common stock, disclosed reserves and retained earnings
and in the case of consolidated accounts, minority interest in the equity of subsidiaries
that are less than wholly owned, but excluded cumulative preference shares, revaluation
reserves, hidden reserves, subordinated and other long term debt.
Strength is measure in dollars and percentage of change (from the previous year).
Size: size is measured in dollars’ worth of assets and asset change (from the
previous year).
Soundness: soundness is measured by calculating the bank’s capital assets ratio
(i.e., tier 1 capital / total assets). Current and previous percentages are ranked among the
top 1000 banks.
Profits: the figure refers to pre-tax profits in dollars and the percentage of change
from the previous year.
Performance: the performance measure is broke down in four categories,
namely: real profits growth, profits on average capital, ROA, and Cost/Income ratio.
Real profits growth considers inflation.
Profits on average capital, average capital is calculated as the average of the
current and previous years’ capital figure.

171
ROA / ROE
Cost/Income ratio- Cost/Income ratio
BIS Capital ratio: One of the objects of the survey is to show the banks’
soundness in relation to the Basel requirement of a minimum Tier 1 capital on risk-
weighted assets of 4%, and a minimum ratio of capital to risk weighted assets of 8%.
The BIS capital ratio is the latter, where the minimum ratio should be 8%.
Non-performing loans: Non performing loans as a percentage of the total loan
book.

172
VITA
Luis Antonio Perez Batres
EDUCATION
2006 Ph.D. in Management Major: Strategic Management Minor: International Business Texas A&M University 2000 M.S. in Finance University of Illinois at Urbana-Champaign 1990 B.S. in Accounting Tecnológico de Monterrey-Campus Laguna, México
ACADEMIC EMPLOYMENT
2006-present Assistant Professor of Management Walker College of Business Appalachian State University 2003-2006 Teaching Assistant, Strategic Management Mays Business School Texas A&M University 2001-2005 Research Assistant, Strategic Management/International Business
Mays Business School Texas A&M University
PERMANENT ADDRESS Management Department Walker College of Business Appalachian State University Boone, NC 28607