do college football games pay for themselves? the...
TRANSCRIPT

Working Paper Series, Paper No. 08-02
Do College Football Games Pay for Themselves? The Impact of
College Football Games on Local Sales Tax Revenue
Dennis CoatesH and Craig A. Depken, II
HH
June 2008
Abstract
This paper analyzes the net impacts of college football games on the sales tax revenues
and taxable sales of four mid-sized cities in Texas. The paper addresses the question in the title,
but also asks whether state policy makers might be justified in encouraging schools in their state
to play one another based on the local economic impact those games will have. In general, our
evidence suggests the answer to that question is no.
JEL Classification Codes: L83, H27
Keywords: tourism, economic impacts, special events
HDepartment of Economics, University of Maryland, Baltimore County, (410) 455-3243
(office), [email protected]
HHDepartment of Economics, Belk College of Business, University of North Carolina –
Charlotte, (704) 687-7484 (office), [email protected]
1 Introduction
Football game day in a college town can be frenetic, especially if the school plays football in Division
I, the top echelon of college sports. Thousands of visitors from around the state and region flock to
the host city, spending money in bars and restaurants, hotels and motels, and even inside the stadium.
All of this commercial activity carries with it sales tax revenues to the state and to the community. Of
course, the large crowds lead to more traffic in town, greater congestion in the streets and eating and
drinking establishments, and an increased need for police and emergency services relative to non-game
days. The important policy question is whether the tax revenues from all the activity pay for the
added services or if community budgets are put under pressure to meet these demands.
In this paper, we analyze monthly sales tax data for a period of several years from four small
to medium-sized cities in Texas: Austin, College Station, Lubbock, and Waco. Each is home to a
university that plays football in the Football Bowl Subdivision (FBS) of NCAA Division I (formerly
known as Division I-A). The institutions are the University of Texas at Austin (Austin), Texas Tech
University (Lubbock), Baylor University (Waco), and Texas A & M University (College Station).
Using these data, our goal is to assess the impact of FBS football games on the sales tax revenues of
the host jurisdiction and to assess whether conference games, games against teams from within the
state, or games against specific rivals are different from other games.
This project is linked in obvious ways to the literature on the demand for attendance at sporting
events. While numerous papers focus on attendance to professional football games, Kaempfer and
Pacey (1986), Fizel and Bennett (1989), DeSchriver and Jensen (2002), Price and Sen (2003), and
Leonard (2005) all address attendance at college football games. These papers are more directly
related to our project than the general attendance literature because attendance at college football
games, especially by out-of-town visitors, is presumed to be a source of extra commercial activity that
produces a boost in local sales tax collections.
Kaempfer and Pacey (1986) and Fizel and Bennett (1989) focus on the influence of television
broadcasts on attendance. The former find that attendance and broadcasts are complements, the
latter that complementarity exists for major programs but that overall broadcasting has reduced
attendance. Neither study examines the impact of a broadcast on attendance at a specific game but
1

rather explain how an additional broadcast this season or historically affects season attendance relative
to season long availability of seats.
Leonard (2005) focuses on Division I football and the importance of geographic proximity of the two
schools whose teams are playing. His approach is not a standard economic one, however, as he adapts
the “gravity model of social science” which “posits that there is an attractive force between two places
(their “masses” or geographic complementarity) that is mitigated by the cost of interaction between
the two places”. The costs of interaction are a function of the distance between the two schools, the
proximity of other nearby tourist attractions, the inherent interest in the game, the quality of the
opponents, and other reasons for travel to the game location.
Price and Sen (2003) investigate game day attendance to FBS football games in the 1997 season.
They find that the quality of both the home and the visiting team, whether or not the teams are
traditional rivals, and conference memberships significantly influence attendance. Furthermore, en-
rollment and the percentage of students living on campus also affect attendance. Finally, they find
that a nearby professional football team reduces a college team’s drawing power.
The importance of games against rivals has a policy dimension that does not feature prominently
in the evaluation of professional franchises and games. State politicians often express interest that
public colleges and universities in their state schedule football games against one another. Consider,
for example, an Associated Press story dated February 10, 2005: “It was only a passing reference,
but the ovation that interrupted Gov. Joe Manchin’s State of the State address was proof that some
of the first-term governor’s agenda had already hit home. Increasing state revenues? Better health
care? No. Manchin really wants Marshall and West Virginia universities to resume their in-state
football rivalry. The way they reacted, so do a lot of lawmakers.” A second example comes from
North Carolina. Two state legislators sponsored a 1995 bill that would have required the University of
North Carolina and North Carolina State University to schedule football games against East Carolina
University. While the bill was never passed, it wasn’t long before ECU was on the UNC and NCSU
schedules. Referring to the arrangement in an interview reported in the Raleigh News and Observer
on October 20, 2007, North Carolina state Senator Marc Basnight said, “There are no negatives to it.
It benefits the economy of Eastern North Carolina and benefits Raleigh. It fills up the stadiums. All
I’ve heard in the legislative building this week is ’Big game, big game.’ Why play some out-of-state
2

team when you can create this much interest?”
Obviously, Senator Basnight believes that college football games have meaningful economic benefits
to the host communities. While there has been little work done specifically on estimating the effects of
college sports on local economies, there is a larger literature measuring the effects of holding sporting
events of various types.1 This research is important because policy makers may wish to know how
valuable an event might be for their city before they advocate spending money on attempting to recruit
the event to their city (see, for example, Baade and Matheson, 2001, 2004a, 2004b; Matheson and
Baade, 2005; Coates and Humphreys, 2002; Porter, 1999; and Coates, 2006). The general consensus in
the academic literature that analyzes these issues ex post is that there is not a large return in terms of
permanent jobs or income. However, the literature focusing on the amount of tax revenue generated
while the event is taking place, which reflects the immediate net impact of the event on local spending,
is less developed.
Baade, Bauman and Matheson (2008) examine how events in the sports world or society more
generally impact sales taxes in Florida, focusing specifically on the effects of sports strikes and lock-
outs. In their analysis they also control for the effects of hurricanes and the opening of new stadiums
or arenas as well as the arrival of expansion franchises in baseball, football, basketball, and hockey.
Their intuition is that work stoppages are negative mega-events. Therefore, they test for any negative
impact of events not being held. Unfortunately, neither work stoppages, the opening of new facilities,
nor the arrival of a new team have a statistically significant effect on the host city’s share of state
taxable sales. One can infer that because the (missing) events had no effect on taxable sales, the
events have no meaningful effect on tax revenue when they are held.
Coates (2006) uses a time series of monthly sales tax revenues for Houston, Texas to estimate the
effects on local sales tax revenues of hosting the 2004 NFL Super Bowl and the 2004 Major League
Baseball All-Star game. He finds that hosting the Super Bowl may have generated an increase in the
sales tax revenues collected in Houston, but that the increment to revenues was possibly smaller than
the increased expenditures on security, sanitation, and other public services that the event required.
His findings show that sales tax revenues in Houston were smaller in July 2004, the month of the MLB
All Star Game, than in a typical July. This is not, of course, consistent with the effect proponents of1One example of this work is Baade, Baumann, and Matheson (2007) which focuses explicitly on college football’s
effects, finding little impact on host communities.
3
hosting such events advertise in their promotional materials.
Coates and Depken (2007) is the most similar previous research to the current analysis, but they
evaluate the impact of a wide array of professional and amateur, regular season, playoff, and cham-
pionship sporting events and a national political convention, on sales taxes in twenty-six Texas mu-
nicipalities. One of the event types investigated is college football games, but they do not control
for which teams were playing in any game. This paper focusses on game details. The questions we
ask include the broader one addressed by Coates and Depken (2007): whether an FBS football game
generates increases in local sales tax revenue. However, we collect more refined game-level data to
assess the impact of games against “rivals,” against teams within the conference, and against teams
from within Texas. Put differently, we use data from Texas to assess Senator Basnight’s belief about
the value to the local economy of games between in-state rivals.
Texas is a natural place to ask this question. First, the four universities located in the cities we
investigate all play Division I FBS football, the cities are all moderately sized, though Austin is much
larger than the others, and none are home to any major professional sports franchises which might
make it more difficult to identify the impact of a college football game on local sales tax revenues.
Three of the institutions, the University of Texas at Austin, Texas Tech University, and Texas A & M
University, are public, while Baylor University is private and religiously affiliated.
Second, consider that at one time there were 8 teams from Texas within the same conference,
the Southwest Conference, but now those same 8 teams are split among 3 conferences.2 Naturally,
being in different conferences means they play each other less often. If games against other teams
from Texas means greater local interest, more intense rivalry, and more out of town visitors, than
games against teams from outside of Texas, then having fewer games against the other Texas teams
will mean less sales tax revenues from the games. Indeed, during the 1990s, legislators in Texas took
positions on the rumored departure of the University of Texas at Austin and Texas A & M University
from the Southwest Conference. An Associated Press article dated August 17, 1990, reported that2The eight institutions include the four mentioned in the text, and the University of Houston, Rice University (Hous-
ton), Southern Methodist University (Dallas), and Texas Christian University (Ft. Worth). Previous to 1995, all eightteams played in the Southwest Conference. After 1995, the four we investigate herein joined the Big Eight Conferenceto form the Big XII Conference. The other four schools were left to find their own conference affiliations. For example,TCU played in the Western Athletic Conference from 1996-2001, then joined Conference USA from 2001-2005, and joinedthe Mountain West Conference starting in 2005. The conference affiliations of the other teams: Rice (WAC, 1996-2005;Conference USA, 2005-present), Houston (Conference USA, 1996-present), SMU (WAC, 1996-2005; Conference USA,2005-present).
4

“Texas House Speaker Gib Lewis says he strongly opposes the University of Texas or Texas A&M
University leaving the Southwest Conference. He vowed ‘to do everything in my power to prevent it
from happening’ - even slashing appropriations to the two universities. For fiscal 1991, the Legislature
appropriated $233 million to UT and $183 million to Texas A&M - none of it for athletics.” The
article also indicated “[a] common concern is that the smaller schools left in the conference would
lose too much income from television revenues and ticket sales without UT and Texas A&M on their
schedules.”
The issue did not go away, and in February of 1994, speculation that UT, Texas A&M, Baylor,
and Texas Tech were considering offers to enter the Big Eight Conference “prompted several Texas
legislators to hold hearings on the SWC’s future and to pledge legislative retaliation if any teams
flee the conference.” While these four teams did eventually leave the Southwest Conference and no
legislative retaliation occurred, these news accounts emphasize how the scheduling of college football
games and the organization of college conferences is an important policy issue for state legislators.
Consequently, analysis of the fiscal repercussions of intercollegiate football games is valuable for people
interested in effective and efficient government and in local economic development.
In the next section of the paper we describe the data and the empirical approach to assessing
the sales tax revenue impacts of college football games. We then turn to a section which describes
and interprets the results of estimating the revenue models. The paper ends with a summary of our
findings and suggestions for additional work.
2 Data and Empirical Model
In this section we first describe our data then outline the empirical methodology and hypothesis
testing.
2.1 Data
Our goal is to estimate the effects of college football games on the tax revenue in the actual cities
that host the events. To accomplish this, data on monthly sales tax allocations for 4 Texas cities from
January 1984 through February 2008 were obtained from the Texas Comptroller’s Office.
5

The state of Texas does not have a state income tax and raises a significant portion of the state
government’s revenues from a state sales tax, currently set at 6.5%. Local cities can charge up to
an additional 2% in sales taxes which can be dedicated to general city funds or to specific projects,
including mass transit, street maintenance, and stadium construction. Our data reflect the local
jurisdiction’s portion of the overall sales tax collected in the jurisdiction.
A primary concern is the length of the sample period given the nominal measure of sales tax
allocations. We convert the monthly sales tax allocations to real 2004 dollars using the monthly
Consumer Price Index as reported by the Bureau of Labor Statistics.3
2.2 Empirical Model
We assume a linear relationship between real tax revenues and the college football games played in
the city
RTaxit = αi + λiTIMEit + βEV ENTSit + εit, (1)
where i indexes the city, t indexes the month, and εit is a zero-mean error term. The dependent
variable, RTaxit, is real monthly tax revenues for city i in month t, measured in 2004 CPI adjusted
dollars. The parameters to be estimated include αi, a city-specific fixed effect constant over time, λi,
a city-specific time trend, and β, a vector of parameters that measure the net impact of additional
football games, additional conference games, additional games against instate opponents, and games
against the other three institutions in our data.
It is important to adequately control for the intra-year variability of tax revenues. A common
approach is to first-difference the data, which would measure the one-month change in tax revenues
throughout the year. However, for institutional and seasonal reasons, month-to-month differences are
unlikely to sufficiently de-trend the data. Rather than impose a seasonal adjustment procedure, such
as the Census Bureau’s X-12 seasonal adjustment, we use the twelve-month difference of the model
described in equation (1). In this approach the dependent variable is measured as the twelve-month
change in real sales tax revenue. The independent variables are also 12-month differenced. One3Specifically, we used the Consumer Price Index - All Urban Consumers available at www.bls.gov, last accessed April
2008.
6

advantage of this approach is that the fixed effect for city i in the estimated equation is actually the
growth rate for city i, λi in equation (1), while the city-specific fixed effects αi are differenced out of
the estimation.4
The model after 12-month differencing is:
∆RTaxit = λi + β∆EV ENTSit + εit, (2)
We further control for seasonality and general macroeconomic trends by including a year time
trend and month dummy variables. We recognize that general trends and dummy variables are not
ideal for this purpose. However, variables that might better control for temporal changes in local
economic conditions are difficult if not impossible to measure at the city level with the same frequency
by which the sales tax data are collected.5
We estimate a number of specifications in a specific to general approach. Model (1) is a baseline
specification wherein the explanatory variables include total games played in city i in month t, the total
in-conference opponents that played in city i in month t, and the total number of in-state opponents
that played in city i in month t. This model imposes the restrictions that the impact of an additional
game, an additional conference game, and an additional game against an in-state opponent have the
same impact on sales tax revenues in Austin, College Station, Waco, and Lubbock.
The second specification allows each city’s sales tax revenue to be differentially impacted by an
additional game against any type opponent, in-state opponents, and in-conference opponents. In other
words, Model (2) allows us to test the equality of the impact of an additional game on the sales tax
revenues collected in Waco, Lubbock, College Station, and Austin. Model (3) allows us to test for
differences in the impact of additional in-state opponents on the tax revenue collected in the four cities
in the sample. Model (4) allows us to test for differences in the impact of additional in-conference
opponents on the tax revenue collected in the four cities in the sample. Model (5) combines all of
these extensions.4This does require an adjustment to the standard errors. Specifically, the fixed effects estimator will calculate the
standard errors based on NT−N−k degrees of freedom whereas the correct degrees of freedom are actually NT−2N−k.5For example, population of a tax jurisdiction likely influences the sales tax revenue collected in that jurisdiction.
However, population is only available on an annual basis and it is not clear how to interpolate monthly population levelsfrom these annual observations. A similar problem arises when contemplating other potential explanatory variables suchas business startups, unemployment levels, or disposable income.
7

We next estimate specifications that allow us to assess the impact of a visit by any of the four
schools represented in the sample on the the sales tax revenues collected in any of the other three
cities. In Model (6) we estimate the impact of a UT-Texas A&M game on the tax revenues collected
in Austin, the impact on tax revenue in Waco of a Baylor-Texas A&M game played in Waco, and so
on. Given the position several Texas legislators held on possible conference realignment and of several
North Carolina legislators on the value of games played against in-state opponents, the results of this
estimation are of particular interest. We can ask whether there is a material boost in sales tax revenue
collected in Waco or Lubbock when UT or Texas A&M visits. Furthermore, we can address whether
an increase could justify legislative intrusion into the football schedules of the schools involved. That
is, we can evaluate North Carolina Senator Basnight’s assertion of the economic benefits of in-state
teams playing one another.
Our final generalization, Model (7), introduces variables that enable us to assess whether away
games have an impact on local sales tax revenues. One can think of this an analogous to the question
asked by Coates and Humphreys (2001) and Baade, Baumann, and Matheson (2006) concerning
the impact of strikes and lockouts; does the absence of home games affect the local economy? For
example, consider when Baylor plays UT in Austin. Given the proximity of these two institutions,
it is conceivable that large numbers of Baylor fans make the trip from Waco to Austin for the game.
Leonard’s (2005) gravity model, economic theory, and intuition, suggest more travel between cities
that are closer together. Therefore, does an exodus of Baylor supporters from Waco reduce sales tax
revenues collected in Waco? If the answer is yes, then it may be beneficial to encourage institutions
to not play games against opponents that are especially close to them.6
The descriptive statistics of our data are provided in Table 1. We convert nominal sales tax
revenues into 2004 dollars using the monthly Consumer Price Index as reported by the Bureau of
Labor Statistics. We gathered the dates and opponents of football games held in Austin, College
Station, Lubbock, and Waco from James Howell’s historical scores archive.7 The upper panel of Table6A similar issue might arise between Texas Christian University, located in Fort Worth, Texas, and Southern Methodist
University, located in Dallas; the two institutions are approximately 35 miles apart. In North Carolina, Duke, located inDurham, and UNC-Chapel Hill are within ten miles of each other. Amongst the Division I FBS teams, other proximatedyads include Houston and Rice (6 miles apart), Washington State and Idaho (8 miles apart), Stanford and California -Berkeley (45 miles apart), Southern California and UCLA (14 miles apart), Georgia and Georgia Tech (70 miles apart),Vanderbilt and Middle Tennessee State University (32 miles apart), Miami (FL) and Florida Interactional (7 miles apart),and the University of Central Florida and the University of South Florida (100 miles apart).
7Available on the Internet at www.jhowell.net/cf/cfindex.htm, last accessed May 2008.
8

1 reports descriptive statistics for the entire sample of 1106 observations describing the period from
January 1984 through February 2008 whereas the bottom panel reports those observations during
which football games were played (August, September, October, November, and December). We
report the level of real sales tax revenues and the 12-month difference of sales tax collections.
The upper panel of Table 1 reports the average real monthly sales tax revenue for the entire sample
was $3.305 million, with the greatest monthly average tax revenue being collected in Austin ($8.15m)
and the lowest monthly average tax revenue being collected in College Station ($0.89m). The lower
panel shows that the average sales tax collected during the last four months of the year was slightly
(but not statistically significantly) higher at $3.317 million. Therefore, without controlling for the
type or location of the opponent, there is no immediate evidence that NCAA college football games
materially impact local sales tax revenues.
The bottom panel of Table 1 reports that the average number of football games (during the months
of the football season) was roughly two games per month, of which one of these games was an in-state
opponent, and one game was an in-conference opponent (although these groups are not necessarily
mutually exclusive). Amongst the four teams in our sample, each team visits one of the other three
teams on a home-and-away rotating basis. For example, the University of Texas plays Texas A&M in
Austin in even-numbered years and in College Station in odd-numbered years. Therefore, each team
visiting one of the other cities represents about twelve percent of the observations during the football
season.
Table 2 provides a tabulation of how often each of the teams in our sample visits another team
in the sample during the months of the football season. As can be seen, none of the four teams visit
each other during the month of August. Primarily, visitors tend to be in-state non-conference rivals
and a mix of out-of-state (both in-conference and non-conference) opponents. It is common practice
for Division I FBS teams to schedule lower-tiered opponents or exotic out-of-state or out-of-conference
teams for early home games (an example of the latter would be the annual Colorado-Colorado State
game, which is typically the first game of the year for each team). Of the four teams in the sample, only
Baylor and Texas Tech visited one of the other teams during the month of September. Traditionally,
neither Baylor nor Texas Tech has been a football power and therefore might be scheduled by Texas
or Texas A&M relatively early in the conference schedule as preliminary “warm-up” games before the
9

larger games on the schedule, for example the annual “Red River Shootout” between UT and the
University of Oklahoma, played in Dallas in October.
3 Results and Discussion
Table 3 presents the estimation results for the specifications described in the previous section.8 As
mentioned, Model (1) is a baseline model that restricts the impact of total games, total in-state
opponents, and in-conference opponents to be the same across the four cities in the sample. As we
estimate the model using 12-month differences of both the dependent and independent variables, the
parameter estimates can be interpreted as the net marginal impact on sales tax collections in the
host city (rather than the metropolitan area) in which the home team plays for each i) NCAA football
game, and additionally for each ii) in-state opponent and iii) in-conference opponent. By controlling for
city specific effects, month-specific and year specific effects, city-specific heteroscedasticity, and city-
specific AR(1) error terms, we hope to have accounted for a substantial portion of any unobserved
heterogeneity inherent in the frequency of the data. We note that the data only measure sales tax
and thus do not not include any additional excise or user taxes, such as hotel, car-rental, airport, or
liquor taxes charged by the host city but collected by a different agency. In many cases these excise or
user taxes are already earmarked for specific projects, for example, to service debt on various public
projects, and do not flow into the general funds of the host city. To the extent that the host city
incurs marginal costs for an additional game, e.g., extra police or security enforcement, only sales tax
revenues to the city’s discretionary spending can be used to offset these marginal costs.
Model (1) indicates that, on average, an additional NCAA football game held in Austin, College
Station, Waco or Lubbock, during the sample period reduced local sales tax revenues but the parameter
estimate was not statistically different from zero. Thus, any increases in local sales tax revenue caused
by visitors and residents contributing new spending to attend the event, seems to be offset, on average,
by reductions in local spending in other areas. This reduction in other spending might be caused by
what we term the “hunker-down effect,” wherein local residents stay home rather than venture out to
spend money. Alternatively, the reduction in spending may be caused by what we term the “skedaddle8Because our data is a long panel, we were concerned about the potential for bias if it is not stationary. We tested
for non-stationary data using the Im, Pesharan, and Shin (2003) method and could easily reject the nully hypothesis ofunit roots.
10
effect,” where locals flee town to avoid the game day crowds and therefore spend money in some other
jurisdiction. If local spending is crowded out by spending on the event, the net effect on local sales
tax revenue could be zero; a result consistent with that found in the baseline model.
While an additional game itself does not influence sales tax revenues, Model (1) suggests that
sales tax collections vary depending on whom the opponent is. For instance, a generic football game
reduces net tax revenues collected in the host city by approximately $18,000, however the parameter
estimate is only significant at the 10.1% level and an in-state opponent reduces sales tax revenues by
an additional $16,000 (p = 0.11). While the individual parameters are not significant at conventional
levels, combining them indicates that an in-state opponent reduces sales tax revenues in the host
city by approximately $34,000 (p = 0.01). On the other hand, an in-conference opponent increases
tax revenues by approximately $29,000 (p = 0.02). Combining all three parameters suggests that
an in-state, in-conference opponent essentially has no impact on local sales tax revenues; the point
estimate is approximately -$5,000 with a p-value of 0.502. This suggests that in-conference opponents
generally bring sufficient new dollars to offset the reduction in tax revenues incurred by hosting a
generic football game against an in-state opponent. In other words, during these games the inflow
of new spending more than offsets the reduced spending caused by the “hunker-down effect” and the
“skedaddle effect.”
Model (2) differentiates the effects of a game by the city in which it is played, using Waco (home
of Baylor University) as the reference category, holding the impact of in-state opponents and in-
conference opponents the same across the four cities. The null that these effects are all zero is rejected
at the 5% level, (p = 0.01). During the sample period, an additional game held in Austin reduced
sales tax revenues by an average of $136,000 relative to Waco. Furthermore, an additional game in
College Station reduced sales tax revenue by an average of $31,000 and in Lubbock reduced sales tax
revenue by $67,000, relative to Waco. This suggests that the inflow of new spending in Austin, College
Station, and Lubbock, did not offset the reduction in spending caused by any “hunker-down effect”
and “skedaddle effect.” The results that in-state opponents had no significant impact on local sales
tax revenues but that in-conference games had a positive influence on local sales tax revenues carry
over from Model (1).
The null hypothesis that the parameters concerning where games are played are jointly equal to
11
zero is strongly rejected (χ2(3) = 11.20, p = 0.01). However, when combining the parameter estimates
in various scenarios, we once again find that for Austin and College Station an in-state, in-conference
game has no net impact on local sales tax revenues, suggesting that the inflow of new money spent
during the event is offset by other reductions in local spending. This is not the case in Lubbock, where
an in-state, in-conference game corresponds with an average reduction in sales tax revenues collected
in Lubbock of approximately $37,000 (p = 0.02). One explanation is the relative isolation of Lubbock;
the city is approximately 350 miles from Dallas, 425 miles from El Paso, and 575 miles from Houston.
Model (3) tests for differences across the host cities in the dimension of in-state opponents, again
using Waco as the reference category, holding the impact of additional games and in-conference oppo-
nents the same for the four cities in the sample. Testing the null that these separate city effects are
all zero is easily rejected (p = 0.004). The results suggest that on average, an in-state rival increases
tax revenues in Waco but might have no impact or reduce revenues by approximately $100,000 in
Austin (p = 0.19), might have no impact or reduce tax revenues by approximately $17,000 in College
Station (p = 0.11), but reduces local tax revenues by approximately $52,000 in Lubbock (p = 0.006).
These differential impacts might be explained by the transportation network in Texas. Waco is located
on Interstate 35, approximately 80 miles south of Dallas and 100 miles north of Austin. Thus, any
in-state rivals playing in Waco have a relatively shorter distance to travel and this distance is traveled
on interstate highway. Waco’s proximity to Austin and Dallas, both of which have relatively large
airports (Austin has 25 gates, Dallas-Fort Worth airport has 174 gates), might make it easier for fans
from further away (whether in-state or out-of-state residents) to attend a game in Waco. On the
other hand, as mentioned above, Lubbock is geographically distant from the majority of the larger
population centers in Texas and surrounding states and its airport, with only nine gates, is primarily
serviced by regional jet service.
Model (4) tests for differences across the host cities in the dimension of in-conference opponents,
again using Waco as the reference category, holding the impact of additional games and additional
in-state opponents the same across the four cities in the sample. The joint hypothesis that these
coefficients are all zero is rejected (p = 0.007). The results suggest that in Waco, an in-conference
opponent increases local tax revenues by $71,000. Combining the parameter estimates shows that
in-conference opponents have no additional impact on local sales tax revenues in Austin (p = 0.64)
12

and Lubbock (p = 0.43) but there is, on average, an increase in local sales tax revenue in College
Station of approximately $36,000 (p = 0.01) during a game between Texas A&M and a conference
opponent.
Model (5) introduces all of the city effects for total games, in-state games, and conference games.
Only one of these coefficients is individually significant, that of an instate game in College Station.
The nine coefficients are, however, jointly significant (p = 0.009). Interestingly, none of the groups,
total, conference, or in-state, when tested for joint significance, will reject the null. It is also possible
to test the null that the effects for a given city are all zero. For example, one can test the null that
the coefficients for total games, conference games and in-state games played in Austin are zero. This
hypothesis is rejected (p = 0.01). The analogous nulls for Lubbock and for College Station are not
rejected.
Model (6) restricts the marginal impacts of additional games, in-state opponents, and in-conference
opponents to be equal across the four cities but allows for differences in local sales tax revenues based
on which other Texas team visits a particular city. Specifically, we create a series of indicator variables
that take a value of one when a particular team, for instance Texas A&M, visits another city, say
Waco. Estimates from this model specification are reported in Table 4.9 The results suggest that
when Texas A&M visits Texas Tech in Lubbock or Baylor University in Waco, there is no significant
change in local tax revenues in those two cities. However, when Texas A&M visits Austin, sales tax
revenues in Austin fall by approximately $410,000. This result is somewhat surprising given the heated
rivalry between UT and Texas A&M but is robust to various specifications and sub-samples of the
four cities investigated here.
Model (6) suggests that when Baylor visits Austin, local sales taxes in Austin fall by approxi-
mately $237,000. However, when Baylor visits College Station, local sales tax revenues increase by
approximately $47,000. What is the difference between the Baylor Bears visiting Austin versus Col-
lege Station, especially when both cities are essentially equidistant from Waco? Perhaps more people
travel to College Station for the game against Baylor because Kyle Field in College Station is a bit
larger than Texas Memorial Stadium in Austin, thereby increasing the possibility that a Baylor Bear9The table does not include the coefficients for total games, instate games, or conference games. Both total games
and conference games are individually significant with p-values less than 0.05. Coefficients for these two variables are,respectively, −26.38 and 26.18.
13

fan might find a ticket to the game. On the other hand, perhaps the difference is due to city size;
Austin with a population of over 700, 000 is a much larger city than College Station whose population
is about 85, 000.
The results from Model (6) suggest that when Texas Tech visits Austin and College Station there
is no appreciable change in local sales tax revenues. However, when Texas Tech visits Baylor, local
sales tax revenues in Waco increase by approximately $100,000 on average. Finally, when UT-Austin
visits Baylor or Texas Tech, there is no change in local sales tax revenues in those cities, but when
UT-Austin visits Texas A&M there is a decrease in local sales tax revenues in College Station of
approximately $56,000.
The reciprocal relationship between Texas A&M and UT-Austin is interesting. Whenever that
particularly heated rivalry comes to town, local sales tax revenues decrease. Perhaps this is because a
sufficiently large number of people come to the game but bring their own tailgating supplies, thereby
reducing spending in the city relative to other games played during the season. Perhaps enough fans
live close enough to drive to the game on game day and return home that night, thereby reducing the
time during which any new spending might occur and reducing the net change in tax revenue relative
to other months of the year. Finally, we point out that in 2006 personal income in the Austin-Round
Rock MSA was approximately $55 billion whereas in the College Station-Bryan MSA personal income
was approximately $5.1 billion (Bureau of Economic Analysis, 2007). While the tax revenue data
describes the city, not the Metropolitan Statistical Area, if the relative size of College Station proper
to the College Station-Bryan MSA is similar to the relative size of Austin proper to the Austin-Round
Rock MSA, then the relative impacts of the Texas A&M-UT game are nearly the same in both cities.
The bottom row and the last column of Table 4 report the results of joint hypothesis tests. Consider
the last column for the row labeled Austin. The chi-square value is 10.94 for the test of the null that all
of the coefficients on the three visiting team variables are zero. This null is rejected, with a p-value of
0.01. In other words, the visiting teams do have a significant impact on sales tax revenues in Austin.
Likewise, teams visiting Waco and College Station have statistically significant effects on sales tax
revenues in those cities.
The bottom row tests the null hypothesis that a given team has effects on sales tax revenues in the
cities it visits. In the column headed UT, for example, the chi-square statistic is 8.66 with a p-value
14

of 0.03. This means that when the football team from the University of Texas at Austin goes on the
road the cities visited experience a change in their sales tax revenues. Reading across this bottom row
it is clear that each of the four teams affects revenues in at least some city it visits.
Model (7) is a very general specification including all of the variables included in Models (1)-(5)
except for the month dummies.10 Furthermore, we include variables that indicate the host city of the
visiting team. For example, when Baylor visits Texas Tech, we create an indicator variable that takes
a value of one for Waco in that month. Our intent is to test whether there are meaningful changes in
local sales tax revenues in the host city of a visiting team. We find that when UT visits Texas A&M
local tax dollars in Austin fall by approximately $369,000, which is significantly less than the decline
in tax revenues in Austin when Texas A&M visits UT. There are no statistically significant impacts
on Austin tax revenues when UT visits Baylor or Texas Tech, although the parameter estimates are
negative. The upper portion of Table 5 is analogous to Table 4, the bottom half of Table 5 shows the
effects on the home city of the visiting team.
The remainder of the city pairs carry insignificant parameter estimates except for College Station
when A&M visits Baylor and Waco when Baylor visits Texas Tech. College Station sales tax revenues
fall by about $60,000 and increase in Waco by about $79,000. The bottom row reports the test
statistics for the null hypothesis that each school visiting a specific other school has a harmful effect
on the sales tax revenues of the home city. For example, the last row under Baylor has a test statistic
of 8.01 and a p-value of 0.05. These results mean that in Austin, College Station, and Lubbock, sales
tax revenues are lower when UT, A&M, or Texas Tech, travel to Waco. This may be because of the
relative ease of traveling to Waco from each of the other cities, as Waco is the most centrally located
of the four or it may be because Baylor University is an easier place to get tickets for out of town fans,
or for some other reason. For whatever reason, it does suggest that when a team goes on the road it
may have harmful effects on that team’s home city.
The last column in the lower half of Table 5 shows similar results in a different way. This column
reports the results of the joint hypothesis test that all of the away games for a specific team have no
impact on revenues in the traveling team’s home city. Only for Austin can this null hypothesis be
rejected. The upshot is that Austin loses sales tax revenues when UT visits A&M, Baylor, or Texas10Inclusion of the month dummies with all the game specific dummies generated perfect collinearity among the regres-
sors.
15

Tech, but it loses even more if UT hosts those teams. The other cities do not generally experience lost
revenues when their institutions go on the road.
4 Conclusions and Discussion
This paper focuses on the impact of Division I Football Bowl Series (FBS) games on the local tax
revenues of the specific cities that host them. We narrow our focus to four cities in Texas that
host a single Division I FBS team, have no other major professional franchises, and play in a Bowl
Championship Series Conference: Austin, College Station, Waco, and Lubbock. These four cities host
“big-time” college football programs and have played in the same conference during the period we
investigate: either the Southwest Conference or the Big Twelve Conference.
Our question is whether there is a meaningful impact on local sales tax revenues when a football
game is played in a particular tax jurisdiction. The question is pertinent in at least three areas. First,
there is a small but growing literature that investigates the impact of sporting and cultural events on
local sales tax revenues in an attempt to test for whether an event has a meaningful immediate impact
on the local host economy. Second, there are several institutions of higher learning in the country
that are contemplating either starting a football program or upgrading their program to a higher
division. To the extent that officials at those schools and in the host towns are concerned about the
influence of new or bigger football games on local resources, the results presented herein are potentially
valuable. Finally, it has been suggested by at least two state legislatures that in-state games generate
considerable economic activity and therefore flagship institutions should try to schedule games with
lower-tiered institutions.
Our first contribution is to the wider literature concerning the economic impact of a mega-event on
the local host economy. We stress that our data only focus on the specific city that hosts the college
football game and not the surrounding area. We do not measure any spatial spill-overs, whether
positive or negative; while the question is valid and the results potentially important, it is beyond the
scope of the current project and must be addressed in future research. However, the results obtained
in this study are consistent with the other studies that focus on the influence of a mega-event on local
sales tax revenue, to wit, the effects vary in their magnitude and sign but are likely to be considerably
16

lower than politicians and local convention bureaus claim. The results here are also consistent with
those of Baade, Baumann, and Matheson (2007) that indicate that big time college football appears
to have no discernible impact on either employment or income in the cities where those teams play.
Our second contribution is in the arena of the public finance of mega-events. In many cases,
big-time football games put increased stress on local security and medical personnel, including fire
and rescue, emergency medical technicians, and police. For example, the U.S. Census estimates that
College Station, TX, had a resident population of 67,890 in 2000. On a given Saturday afternoon at
Kyle field, there might be more than 80,000 people in the stadium and an unmeasured number outside
of the stadium during the game. As witnessed by the localized bombing that occurred in Norman,
Oklahoma, during the 2005 game between the Oklahoma Sooners and the Kansas State Wildcats
(Associated Press, 2005), a cataclysmic event would put considerable strain on first responders and
the security-medical infrastructure of a relatively small town. In response, many smaller cities reach
out for reciprocity from neighboring towns, for example for additional emergency medical technician
teams, and other city and county police officers for traffic and crowd control. Some cities might appeal
to the state for additional state patrol officers to assist in traffic and crowd control. To the extent that
the host city can export the cost of additional medical, security, and traffic management, the influence
of the event on local tax revenues is of lesser concern. However, if the city cannot export all or any of
the additional costs incurred by new or larger football games, the net impact on sales tax revenues is
important. A net drain on local sales tax revenues requires the host city to determine if any increased
exposure of the town, stock of goodwill with current residents, stature with the state legislature, and
any other non-monetary benefits of hosting such events, is worth the financial costs involved.
Our final contribution concerns potential legislative interference in college football scheduling. If
the results from these four cities in Texas can be generalized to other, similarly sized and geographically
situated cities in the country, then they suggest that there is little economic reason for any interference
in college football scheduling. While political benefits might accrue to legislators who are able to
pressure flagship institutions to visit smaller, more isolated towns, such benefits are notoriously difficult
to measure and remain for future research.
17
References
Associated Press. 2005. “Explosion Kills One At Oklahoma Campus,” October 2.
Baade, Robert A. and Victor A. Matheson. 2001. “Home Run or Wild Pitch? The EconomicImpact of Major League Baseball’s All-Star Game on Host Cities,” Journal of Sports Economics,2(4):307-326.
Baade, Robert A. and Victor A. Matheson. 2004a. “The Quest for the Cup: Assessing the EconomicImpact of the World Cup,” Regional Studies, 38(4):343-354.
Baade, Robert A. and Victor A. Matheson. 2004b. “Padding Required: Assessing the Economic Im-pact of the Super Bowl,” College of the Holy Cross, Department of Economics, Faculty ResearchSeries, Working Paper No. 04-03.
Baade, Robert A., Robert Baumann and Victor A. Matheson. 2006. “The Economic Consequences ofSports Strikes and Lockouts: Revisited,” College of the Holy Cross, Department of Economics,Faculty Research Series, Working Paper No. 06-04.
Baade, Robert A., Robert Baumann and Victor A. Matheson. 2007. “Down, Set, Hike: The economicImpact of College Football Games on Local Economies,” International Association of SportsEconomists, Working paper 07-01.
Baade, Robert A., Robert Baumann and Victor A. Matheson. 2008. “Selling the Game: Estimatingthe Economic Impact of Professional Sports through Taxable Sales,” Southern Economic Journal,Vol. 74(3):794-810.
Bureau of Economic Analysis. 2007. “Personal Income for Metropolitan Areas, 2006,” BEA Bulletin0736.
Coates, Dennis. 2006. “The Tax Benefits of Hosting the Super Bowl and the MLB All-Star Game:The Houston Experience,” International Journal of Sport Finance, 1(4).
Coates, Dennis and Craig A. Depken, II. 2007. “Mega-Events: Is the Texas-Baylor game to Wacowhat the Super Bowl is to Houston?” mimeo, Department of Economics, University of NorthCarolina - Charlotte.
Coates, Dennis and Brad R. Humphreys. 1999. “The Growth Effects of Sports Franchises, Stadiaand Arenas,” Journal of Policy Analysis and Management, 18(4):601-624.
Coates, Dennis and Brad R. Humphreys. 2001. “The Economic Consequences of Professional SportsStrikes and Lockouts,” Southern Economic Journal, 67(3):737-747.
Coates, Dennis and Brad R. Humphreys. 2002. “The Impact of Post-season play in professionalsports,” Journal of Sports Economics, 3(3):291-299.
DeSchriver, T. D. and P. E. Jensen. 2002. “Determinants of spectator attendance at NCAA DivisionII football contests,” Journal of Sports Management, 16(4):311-330.
Fizel, J. L. and R. W. Bennett. 1989. “The impact of college football telecasts on college footballattendance,” Social Science Quarterly, 7(4):980-988.
18
Im, K.S, M. H. Pesharan, and Y. Shin. 2003. “Testing for Unit Roots in Heterogeneous Panels,”Journal of Econometrics, 115:53-74.
Kaempfer, W.H. and P.L. Pacey. “Televising College Football: The Complementarity of Attendanceand Viewing,” Social Science Quarterly, 67:176-85.
Leonard, J. M. 2005. “The geography of visitor attendance at college football games,” Journal ofSports Behavior, 28(3):231-252.
Matheson, Victor A. 2005. “Contrary Evidence on the Economic Effect of the Super Bowl on theVictorious City,” Journal of Sports Economics, 6: 420 - 428.
Matheson, Victor A. and Robert A. Baade. 2005. “A Fall Classic? Assessing the Economic Impactof the World Series,” College of the Holy Cross, Department of Economics, Faculty ResearchSeries, Working Paper No. 05-01.
Porter, Philip K. 1999. “Mega-Sports Events as Municipal Investments: A Critique of Impact Anal-ysis,” in Sports Economics: Current Research, edited by John Fizel, Elizabeth Gustafson, andLawrence Hadley, Praeger Publishers.
Price, D. I. and K. C. Sen. 2003. “The demand for game day attendance in college football: Ananalysis of the 1997 Division 1-A season,” Managerial and Decision Economics, 2:35-46.
19

Tale 1: Descriptive Statistics of the Data Sample
Full Sample: All ObservationsVariable Mean Std. Dev. Min MaxReal Tax Revenue (2004 dollars) 3,305,769.00 3,155,052.00 264,901.00 14,900,000.0012-month change in real tax revenue (000s) 107.20 431.27 -2365.97 2369.41Total Football Games 0.47 0.89 0.00 4.00In-state Opponents 0.25 0.59 0.00 3.00In-conference Opponents 0.31 0.72 0.00 3.00UT Visits 0.03 0.17 0.00 1.00Texas A&M Visits 0.03 0.17 0.00 1.00Baylor Visits 0.03 0.17 0.00 1.00Texas Tech Visits 0.03 0.17 0.00 1.00Observations 1160
Partial Sample: Includes Only Observations With NCAA Football GamesVariable Mean Std. Dev. Min MaxReal Tax Revenue (2004 dollars) 3,317,104.00 3,105,779.00 296,586.30 12,800,000.0012-month change in real tax revenue (000s) 87.32 443.51 -1959.86 1846.37Total Football Games 1.87 0.73 1.00 4.00In-state Opponents 0.97 0.83 0.00 3.00In-conference Opponents 1.22 0.95 0.00 3.00UT Visits 0.12 0.33 0.00 1.00Texas A&M Visits 0.12 0.32 0.00 1.00Baylor Visits 0.12 0.32 0.00 1.00Texas Tech Visits 0.12 0.32 0.00 1.00Observations 294Notes: Data describe Austin, Waco, College Station and Lubbock, Texas, from January 1984 throughFebruary 2008. Sales tax revenue obtained from the Texas Comptroller’s office. Football game datesand opponents collected by the authors.
20

Table 2: Count of Visits Amongst Four Sample Universities
School Home Town August September October November December TotalUniversity of Texas Austin 0 1 6 28 2 37Texas A&M College Station 0 0 23 11 2 36Texas Tech Lubbock 0 9 17 11 0 37Baylor University Waco 0 6 17 12 0 35
Notes: Counts indicate the number of times each university visited one of the other three universities ineach month of the college football regular season. For instance, the University of Texas played only oneaway game in the month of September against Texas A&M, Baylor, or Texas Tech during the sampleperiod.
21
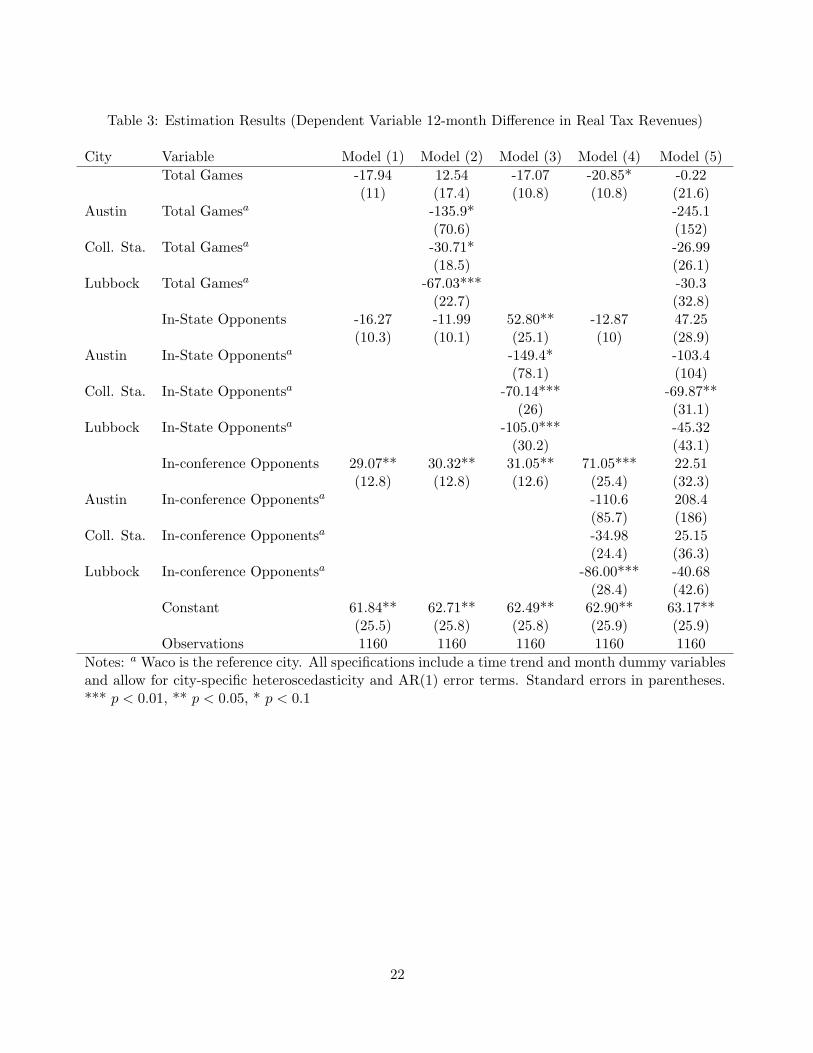
Table 3: Estimation Results (Dependent Variable 12-month Difference in Real Tax Revenues)
City Variable Model (1) Model (2) Model (3) Model (4) Model (5)Total Games -17.94 12.54 -17.07 -20.85* -0.22
(11) (17.4) (10.8) (10.8) (21.6)Austin Total Gamesa -135.9* -245.1
(70.6) (152)Coll. Sta. Total Gamesa -30.71* -26.99
(18.5) (26.1)Lubbock Total Gamesa -67.03*** -30.3
(22.7) (32.8)In-State Opponents -16.27 -11.99 52.80** -12.87 47.25
(10.3) (10.1) (25.1) (10) (28.9)Austin In-State Opponentsa -149.4* -103.4
(78.1) (104)Coll. Sta. In-State Opponentsa -70.14*** -69.87**
(26) (31.1)Lubbock In-State Opponentsa -105.0*** -45.32
(30.2) (43.1)In-conference Opponents 29.07** 30.32** 31.05** 71.05*** 22.51
(12.8) (12.8) (12.6) (25.4) (32.3)Austin In-conference Opponentsa -110.6 208.4
(85.7) (186)Coll. Sta. In-conference Opponentsa -34.98 25.15
(24.4) (36.3)Lubbock In-conference Opponentsa -86.00*** -40.68
(28.4) (42.6)Constant 61.84** 62.71** 62.49** 62.90** 63.17**
(25.5) (25.8) (25.8) (25.9) (25.9)Observations 1160 1160 1160 1160 1160
Notes: a Waco is the reference city. All specifications include a time trend and month dummy variablesand allow for city-specific heteroscedasticity and AR(1) error terms. Standard errors in parentheses.*** p < 0.01, ** p < 0.05, * p < 0.1
22

Table 4: Model (6) Visiting Effects
City Visiting UniversityUT Texas A&M Tex. Tech. Baylor H0 : All jointly zerob
[p− value]Austin -410.64*** -102.49 -237.04* 10.94
(131.21) (129.99) (128.18) [0.01]College Station -55.17*** 14.18 47.32** 17.25
(20.45) (21.27) (23.07) [0.00]Lubbock 11.82 -52.89 -64.81 2.91
(45.44) (50.35) (46.53) [0.41]Waco 24.35 20.91 99.54*** 8.00
(33.40) (33.31) (36.18) [0.05]H0 : All jointly zerob 8.66 11.23 8.44 11.17[p− value] [0.03] [0.01] [0.04] [0.01]Notes: a The specification includes a time trend, month dummy variables, and total games, in-stategames, and conference game variables. b The test statistic is distributed Chi-square with three degreesof freedom (χ2
c = 7.815 at α = 0.05). The analysis allows for city-specific heteroscedasticity and AR(1)error terms. Standard errors in parentheses, p-values in brackets. *** p < 0.01, ** p < 0.05, * p < 0.1
23
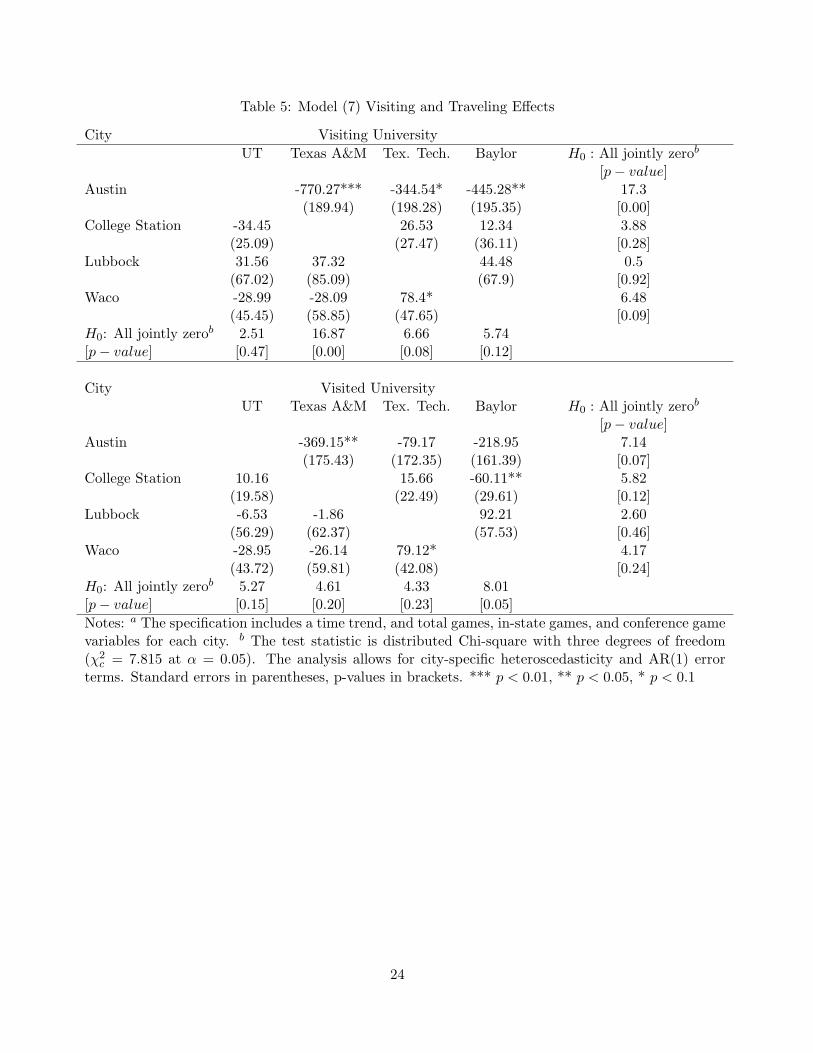
Table 5: Model (7) Visiting and Traveling Effects
City Visiting UniversityUT Texas A&M Tex. Tech. Baylor H0 : All jointly zerob
[p− value]Austin -770.27*** -344.54* -445.28** 17.3
(189.94) (198.28) (195.35) [0.00]College Station -34.45 26.53 12.34 3.88
(25.09) (27.47) (36.11) [0.28]Lubbock 31.56 37.32 44.48 0.5
(67.02) (85.09) (67.9) [0.92]Waco -28.99 -28.09 78.4* 6.48
(45.45) (58.85) (47.65) [0.09]H0: All jointly zerob 2.51 16.87 6.66 5.74[p− value] [0.47] [0.00] [0.08] [0.12]
City Visited UniversityUT Texas A&M Tex. Tech. Baylor H0 : All jointly zerob
[p− value]Austin -369.15** -79.17 -218.95 7.14
(175.43) (172.35) (161.39) [0.07]College Station 10.16 15.66 -60.11** 5.82
(19.58) (22.49) (29.61) [0.12]Lubbock -6.53 -1.86 92.21 2.60
(56.29) (62.37) (57.53) [0.46]Waco -28.95 -26.14 79.12* 4.17
(43.72) (59.81) (42.08) [0.24]H0: All jointly zerob 5.27 4.61 4.33 8.01[p− value] [0.15] [0.20] [0.23] [0.05]Notes: a The specification includes a time trend, and total games, in-state games, and conference gamevariables for each city. b The test statistic is distributed Chi-square with three degrees of freedom(χ2
c = 7.815 at α = 0.05). The analysis allows for city-specific heteroscedasticity and AR(1) errorterms. Standard errors in parentheses, p-values in brackets. *** p < 0.01, ** p < 0.05, * p < 0.1
24