dnb global technology investor presentation - 18 ... · 25/08/2015 · oracle 6.78 % google 6.01 %...
TRANSCRIPT

A global long only equity TMT fundSeptember 2015
DNB Technology
Sverre Bergland, Portfolio Manager

DNB Technology
• Long-only UCITS global equity fund which invests in technology, media and telecom sectors
• Strong and consistent performance record
• Dedicated and experienced investment team
• Compliant with DNB Asset Managements SRI policy
2
Agenda
3
1 DNB Asset Management
3 Investment Process
2 Portfolio Management Team & Track Record
4 Risk Management
5 Fund Facts

DNB Asset Management
DNB is among the largest Asset Manager in the Nordic Region
• Specialist approach to investing
• 76 portfolio managers and analysts
• € 61 billion under management
• Offices in Oslo, Bergen, Stockholm, Luxembourg, and Hong Kong
• 100% owned by Oslo-listed DNB Group
The DNB Group
• DNB is Norway's largest financial services group and one of the largest in the Nordic region in terms of market capitalization, represented in 21 countries worldwide
• The Group is among the world’s leading banks within shipping, energy and seafood
• The Group offers a full range of financial services, including loans, savings, advisory services, insurance and pension products for retail and corporate customers and the public sector
4

Agenda
5
1 DNB Asset Management
3 Investment Process
2 Portfolio Management Team & Track Record
4 Risk Management
5 Fund Facts

Experienced team
Anders Tandberg-Johansen – Head of Global TechnologyAnders joined DNB Asset Management in 1998 as a portfolio manager responsible for Norwegian technology portfolios.Since 2002 he serves as Head of Global Technology Equities within the Global Equity team. Between 1996 and 1998 Anderswas a technology analyst with Enskilda Securities. He holds a BA in Finance from the Norwegian School of Management (BI).
Sverre Bergland – Portfolio Manager, SoftwareSverre joined DNB Asset Management in 2001 as a technology equity analyst. He started out his professional career in 1995,working for ABG Securities as an IT analyst. Sverre holds a BA in Finance from the University of San Francisco, USA.
Erling Thune – Portfolio Manager, Telecom & MediaErling joined DNB Asset Management's global technology team in early 2008 and is responsible for telecommunicationscompanies and media. Erling started his career in 1993 as a financial journalist for the Norwegian Financial Daily and hassince worked as Investor Relations at Elkjøp ASA and Telenor ASA. Erling is a graduate of the Norwegian School ofEconomics and Business Administration (NHH).
Erling Haugan Kise – Analyst, Online Travel and eGamingErling joined DNB Asset Management’s global technology team in April 2014. Erling started his career as an intern in ourteam during the summer of 2011 and subsequently spent three years with Norges Bank Investment Management (NBIM) inLondon. Erling holds an honours degree in Finance from The University of Melbourne, Australia, and an MSc in FinancialMarkets from EDHEC Business School, France.
6

The best Global TMT fund last 5 years
7
18.0 % 17.6 %16.9 %
16.0 % 16.0 % 16.0 % 15.5 % 15.5 % 15.5 % 15.4 % 15.3 % 15.0 % 14.7 % 14.7 % 14.7 % 14.6 %14.1 %
Note: Returns as of August 26, 2015, source Morningstar Direct out of 178 Global Technology funds available for sale in Germany. Index is "MSCI World TMT" (66% MSCI Global IT, 22% MSCI Global Telecom Services, 12% MSCI Global Media). Inception of fund is August 16th 2007. Historical performance is no guarantee of future returns. Future returns will depend on market development, manager skill, portfolio / fund's risk exposure and the costs associated with the management / investment. The return can at times be negative.
Long only fund awarded best Global Technology Fund 5 year performance
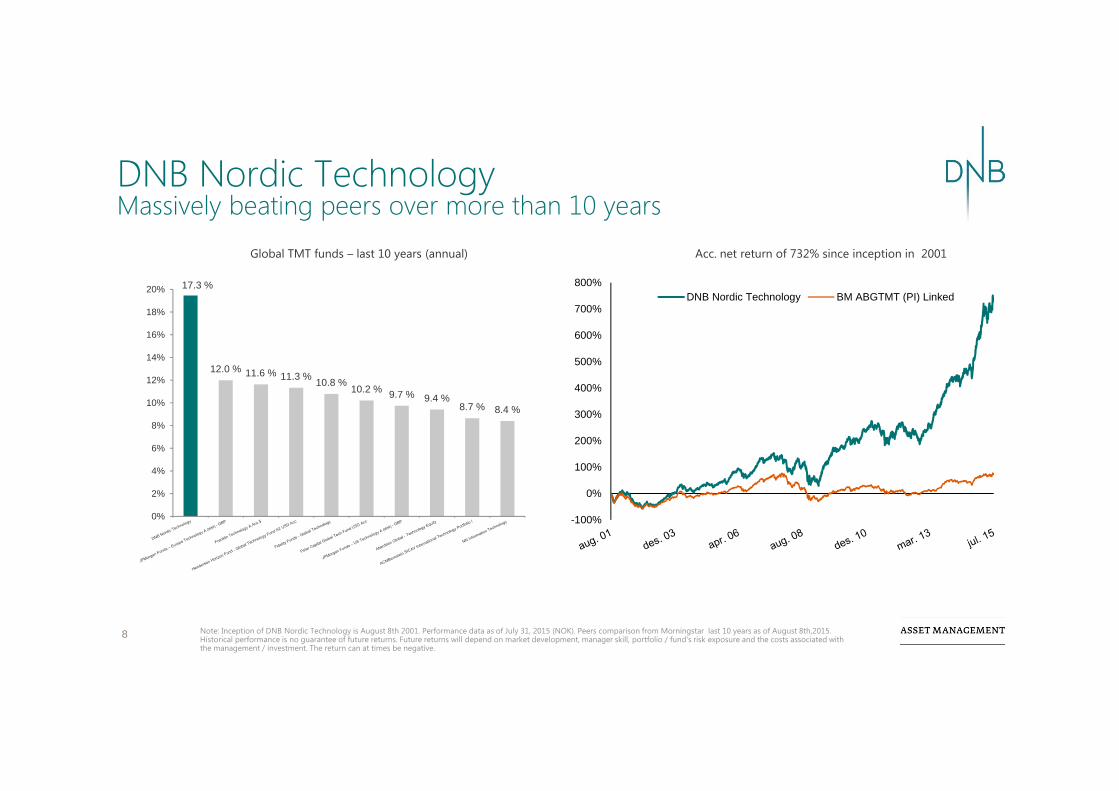
DNB Nordic Technology Massively beating peers over more than 10 years
8
Global TMT funds – last 10 years (annual) Acc. net return of 732% since inception in 2001
Note: Inception of DNB Nordic Technology is August 8th 2001. Performance data as of July 31, 2015 (NOK). Peers comparison from Morningstar last 10 years as of August 8th,2015. Historical performance is no guarantee of future returns. Future returns will depend on market development, manager skill, portfolio / fund's risk exposure and the costs associated with the management / investment. The return can at times be negative.
17.3 %
12.0 % 11.6 % 11.3 % 10.8 % 10.2 % 9.7 % 9.4 %8.7 % 8.4 %
0%
2%
4%
6%
8%
10%
12%
14%
16%
18%
20%
-100%
0%
100%
200%
300%
400%
500%
600%
700%
800%DNB Nordic Technology BM ABGTMT (PI) Linked
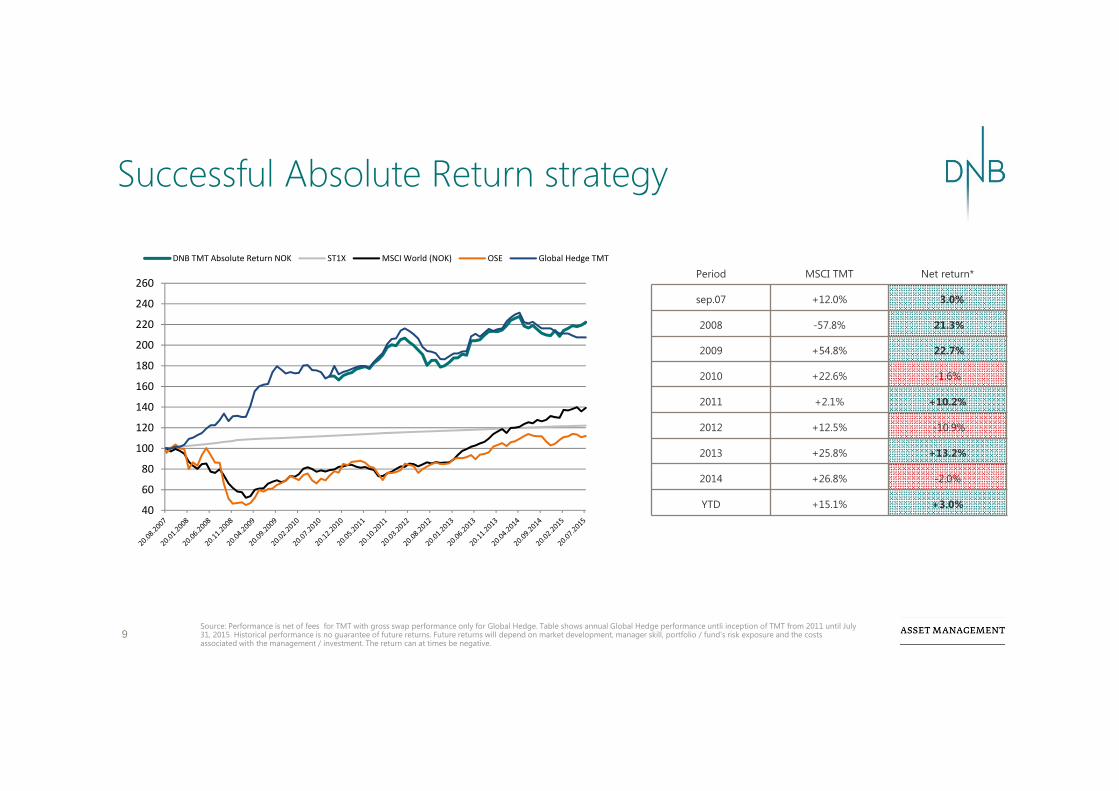
Successful Absolute Return strategy
Period MSCI TMT Net return*
sep.07 +12.0% 3.0%
2008 -57.8% 21.3%
2009 +54.8% 22.7%
2010 +22.6% -1.6%
2011 +2.1% +10.2%
2012 +12.5% -10.9%
2013 +25.8% +13.2%
2014 +26.8% -2.0%
YTD +15.1% +3.0%
9Source: Performance is net of fees for TMT with gross swap performance only for Global Hedge. Table shows annual Global Hedge performance untli inception of TMT from 2011 until July31, 2015. Historical performance is no guarantee of future returns. Future returns will depend on market development, manager skill, portfolio / fund's risk exposure and the costs associated with the management / investment. The return can at times be negative.
40
60
80
100
120
140
160
180
200
220
240
260
DNB TMT Absolute Return NOK ST1X MSCI World (NOK) OSE Global Hedge TMT

DNB Technology - Largest Holdings
10
Stock Holdings
Samsung Electronics 7.29 %
APPLE 6.84 %
ORACLE 6.78 %
GOOGLE 6.01 %
Playtech Plc 5.21 %
PRICELINE 4.97 %
CISCO SYSTEMS 3.57 %
Ctrip.Com 3.37 %
Mellanox Technologies 3.19 %
King Digital 3.08 %
INTEL CORP 3.00 %
YAHOO 2.89 %
Canadian Solar Inc 2.85 %
Adva Optical 2.62 %
As of August 28. 2015
Stock Overweight
Samsung Electronics 7.29 %
Playtech 5.21 %
PRICELINE 4.97 %
ORACLE CORP 4.69 %
Ctrip.Com 3.37 %
Mellanox 3.19 %
King Digital 3.08 %
Canadian Solar 2.85 %
Adva Optical 2.62 %
YAHOO 2.42 %
AVG Technologies 1.96 %
Lenovo Group 1.57 %
Finisar 1.57 %
Oclaro 1.47 %
Stock Underweight
MICROSOFT CORP -3.67 %
APPLE -3.46 %
AT&T -3.24 %
VERIZON -3.02 %
FACEBOOK -2.83 %
DISNEY -2.58 %
VISA A -2.24 %
COMCAST -1.90 %
MASTERCARD -1.48 %
IBM -1.25 %
TELEFONICA -1.01 %
ACCENTURE -0.96 %
TIME WARNER -0.96 %
BT GROUP -0.89 %
11
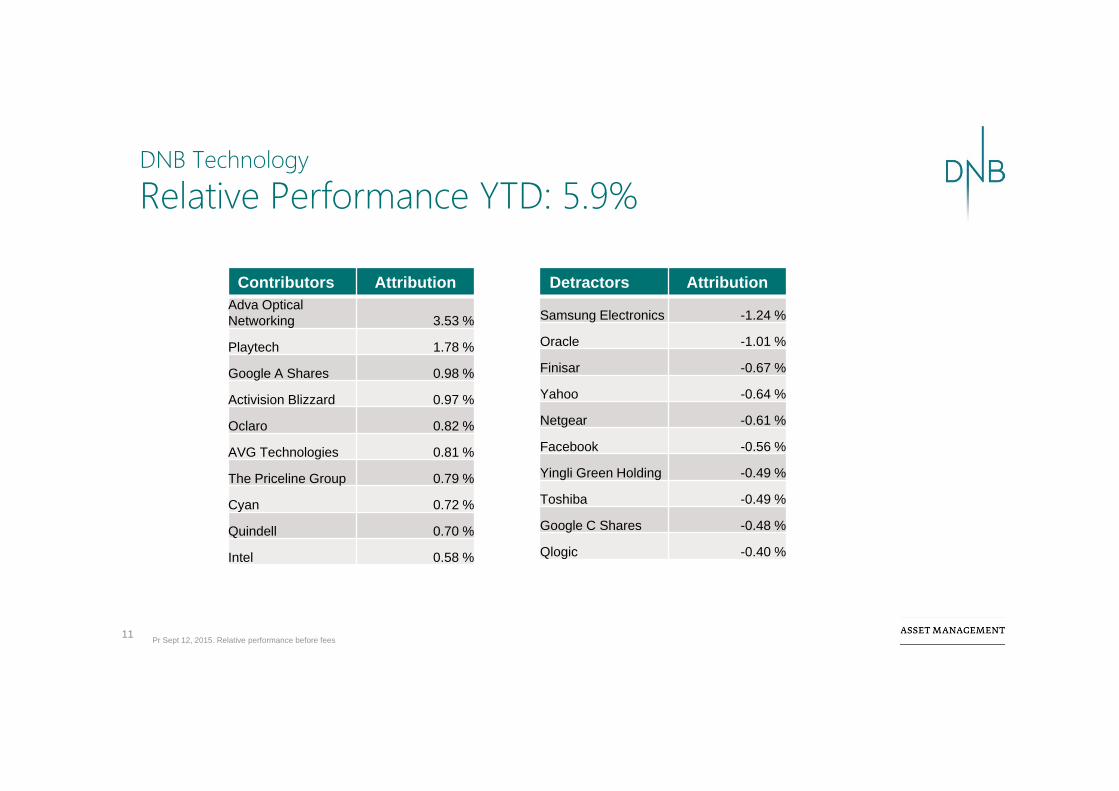
DNB Technology
Relative Performance YTD: 5.9%
Pr Sept 12, 2015. Relative performance before fees
Contributors AttributionAdva Optical Networking 3.53 %
Playtech 1.78 %
Google A Shares 0.98 %
Activision Blizzard 0.97 %
Oclaro 0.82 %
AVG Technologies 0.81 %
The Priceline Group 0.79 %
Cyan 0.72 %
Quindell 0.70 %
Intel 0.58 %
Detractors Attribution
Samsung Electronics -1.24 %
Oracle -1.01 %
Finisar -0.67 %
Yahoo -0.64 %
Netgear -0.61 %
Facebook -0.56 %
Yingli Green Holding -0.49 %
Toshiba -0.49 %
Google C Shares -0.48 %
Qlogic -0.40 %
12
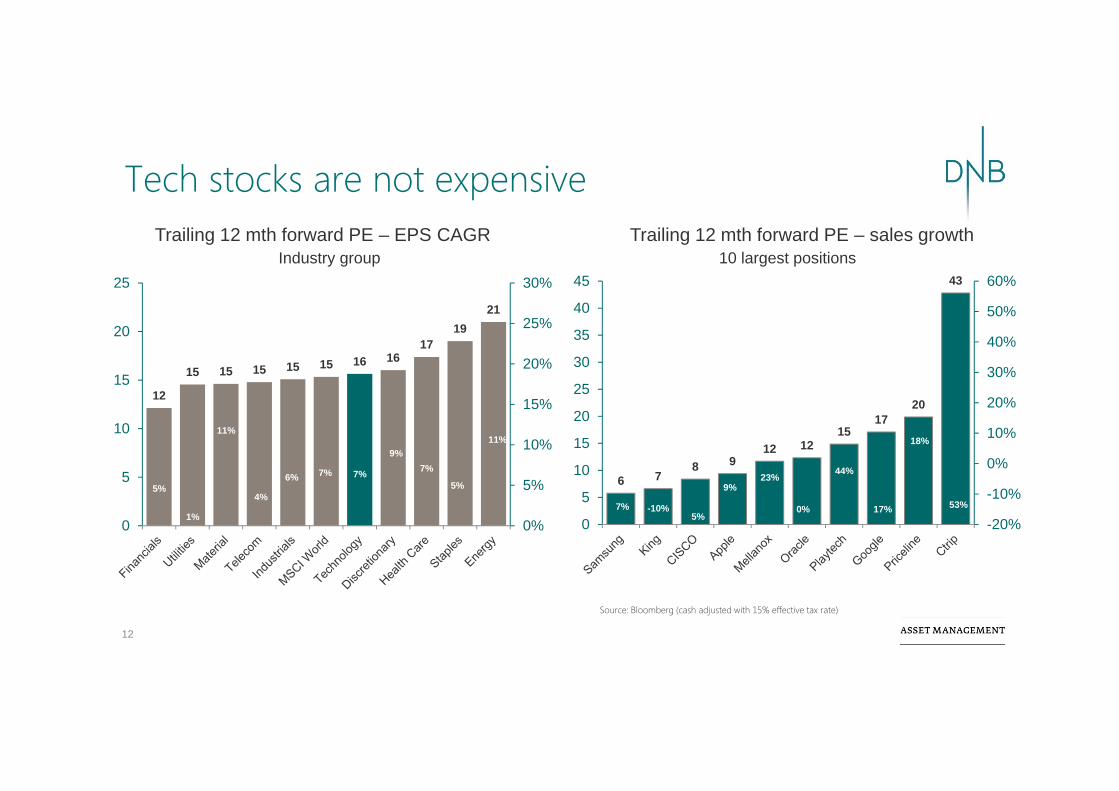
Source: Bloomberg (cash adjusted with 15% effective tax rate)
Trailing 12 mth forward PE – EPS CAGR Industry group
Trailing 12 mth forward PE – sales growth10 largest positions
12
15 15 15 15 15 16 1617
1921
5%
1%
11%
4%
6% 7% 7%
9%7%
5%
11%
0%
5%
10%
15%
20%
25%
30%
0
5
10
15
20
25
Tech stocks are not expensive
6 78 9
12 1215
1720
43
7% -10%5%
9%23%
0%
44%
17%
18%
53%
-20%
-10%
0%
10%
20%
30%
40%
50%
60%
0
5
10
15
20
25
30
35
40
45
Agenda
13
1 DNB Asset Management
3 Investment Process
2 Portfolio Management Team & Track Record
4 Risk Management
5 Fund Facts

Four key elements of stock selection
14
ValuationValuation Earnings rev/momentum
Earnings rev/momentum
Continously monitoring approx. 500 stocks Continously monitoring approx. 500 stocks
ValueCreation
ValueCreationThemesThemes

15
Themes - Six Important Megatrends
Internet for all Services moving to the cloud
Payments go mobileFragmentation of video
Internet of things
0
2,000
4,000
6,000
8,000
2005 2006 2007 2008 2009 2010 2011 2012 2013 2014
Internet Population
Big Data
Global Population

0
1,000
2,000
3,000
4,000
5,000
6,000
7,000
8,000
2005 2006 2007 2008 2009 2010 2011 2012 2013 2014
GamingGaming GamblingGambling AdvertisingAdvertising
PaymentsPayments Taxi centrals Taxi centrals Travel bookingTravel booking
Scalable business models that take share of wallet
Source: ITU (International Telecommunication Union)
16
Only 40% of the world population is online
Global Population
Internet Population
17
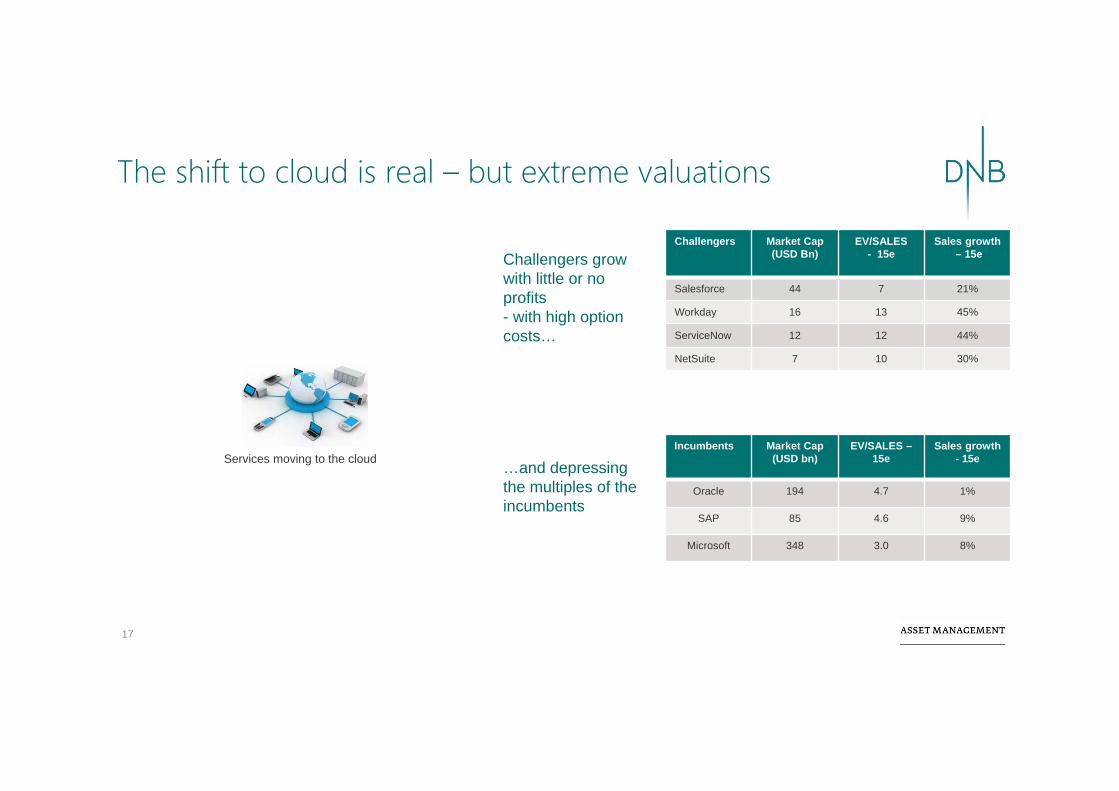
The shift to cloud is real – but extreme valuations
Incumbents Market Cap(USD bn)
EV/SALES –15e
Sales growth- 15e
Oracle 194 4.7 1%
SAP 85 4.6 9%
Microsoft 348 3.0 8%
Challengers Market Cap(USD Bn)
EV/SALES - 15e
Sales growth– 15e
Salesforce 44 7 21%
Workday 16 13 45%
ServiceNow 12 12 44%
NetSuite 7 10 30%
Services moving to the cloud
Challengers grow with little or no profits- with high option costs…
…and depressing the multiples of the incumbents
18
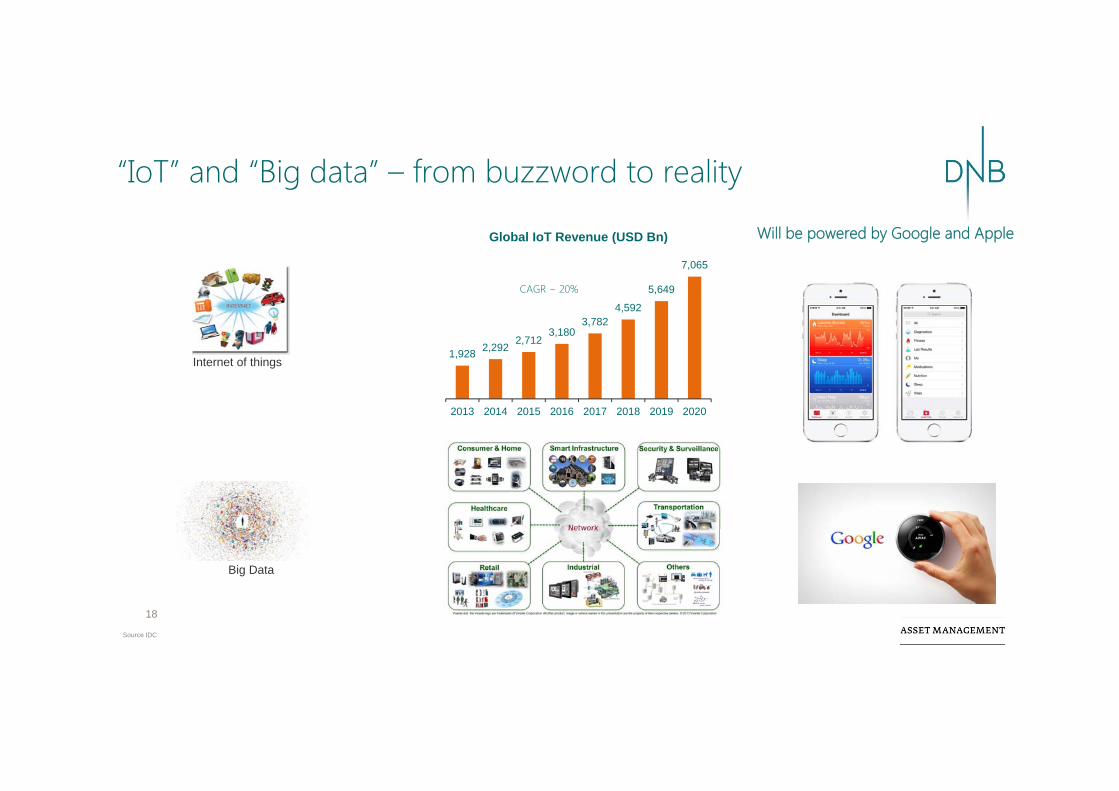
“IoT” and “Big data” – from buzzword to reality
1,928 2,2922,712
3,1803,782
4,592
5,649
7,065
2013 2014 2015 2016 2017 2018 2019 2020
Global IoT Revenue (USD Bn)
CAGR ~ 20%
Source IDC
Internet of things
Big Data
Will be powered by Google and Apple

19
The next couple of years will be transformational for TV
Source: Statstics Norway
0
20
40
60
80
100
120
140
160
180
Newspaper
TV
TV (16-25)
Radio
Books
Internet
Daily time spent (mins)
Fragmentation of video
5%
12%
38%
25%20%19%
10%
45%
22%
4%
0%
10%
20%
30%
40%
50%
Print Radio TV Internet Mobile
Time spent Ad share
Time spent on media - Norway
Ad spend on media - Norway
WinnersWinners
LosersLosers

20
Mobile payments – The jury is out… and confused
Payments go mobile
…. Banks most likely losers…. Banks most likely losers
…. PayPal’s position underestimated…. PayPal’s position underestimated
…. Mastercard & Visa networks look safe…. Mastercard & Visa networks look safe
…. Tech most likely winners…. Tech most likely winners
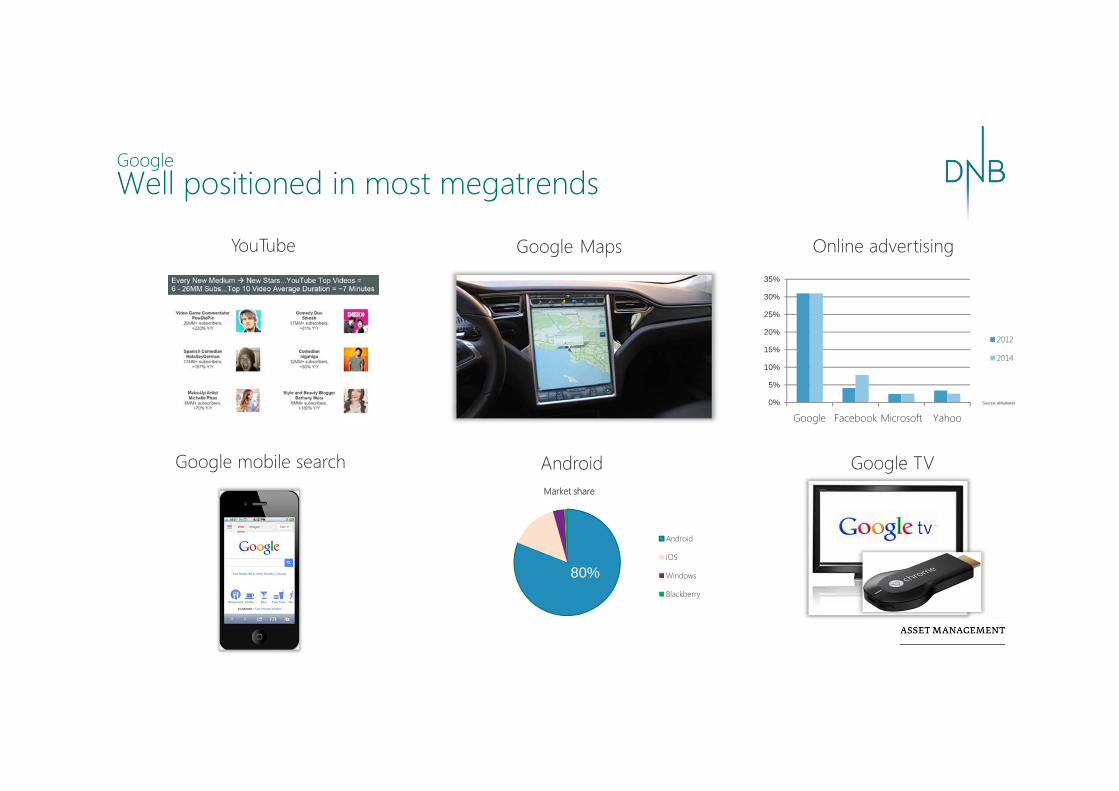
GoogleWell positioned in most megatrends
YouTube Google Maps Online advertising
Google mobile search Android Google TVMarket share
Android
iOS
Windows
Blackberry
80%
0%
5%
10%
15%
20%
25%
30%
35%
Google Facebook Microsoft Yahoo
2012
2014
Source: eMarketer
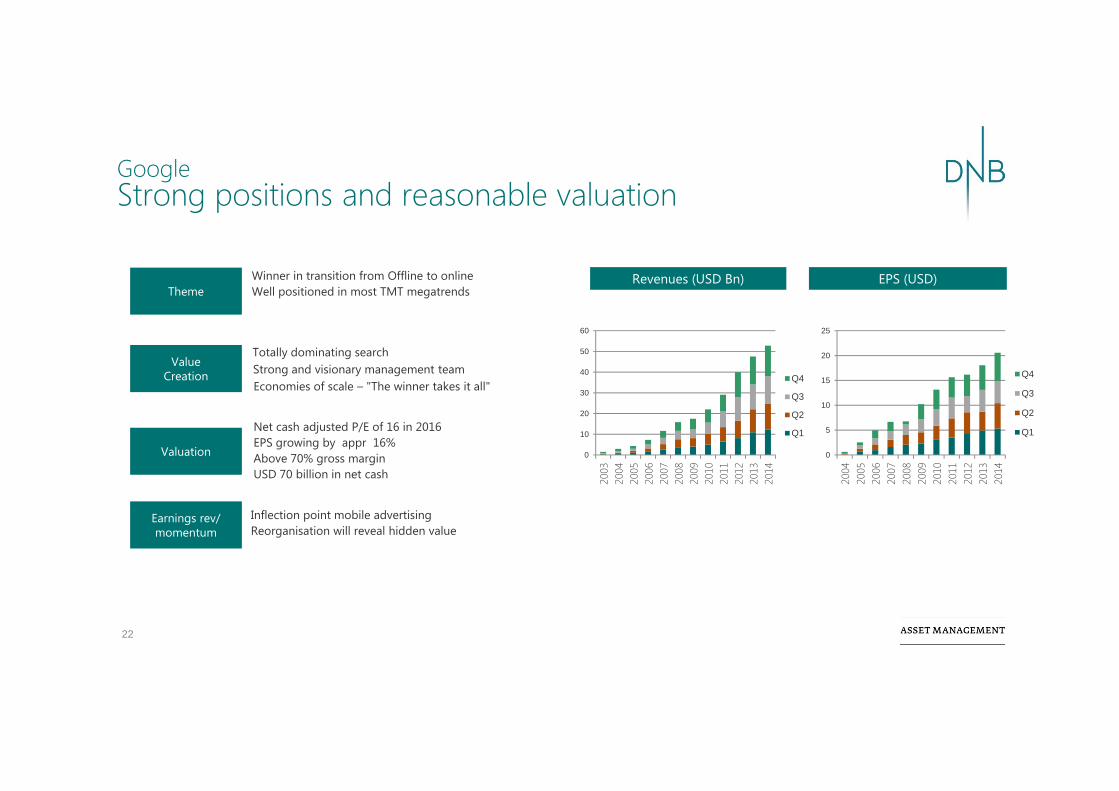
GoogleStrong positions and reasonable valuation
22
Totally dominating search Strong and visionary management teamEconomies of scale – "The winner takes it all"
Net cash adjusted P/E of 16 in 2016 EPS growing by appr 16%Above 70% gross marginUSD 70 billion in net cash
Inflection point mobile advertisingReorganisation will reveal hidden value
Winner in transition from Offline to onlineWell positioned in most TMT megatrends
Revenues (USD Bn) EPS (USD)
ValueCreation
Valuation
Earnings rev/momentum
Theme
0
10
20
30
40
50
60
2003
2004
2005
2006
2007
2008
2009
2010
2011
2012
2013
2014
Q4
Q3
Q2
Q1
0
5
10
15
20
25
2004
2005
2006
2007
2008
2009
2010
2011
2012
2013
2014
Q4
Q3
Q2
Q1

Ctrip.com InternationalChinese #1 in online travel booking
…but lagging in booking travel online
Travel spend is growing 6x that of US As the hotel mix improve, so will margins
China is leading the world in eCommerce…
85%63%
41%25%
-80%
-60%
-40%
-20%
0%
20%
40%
0%
20%
40%
60%
80%
100%
Priceline Expedia Ctrip Qunar
Hotel Air Other EBIT margin
$323 $358 $386 $408 $428
$5 $7
$10 $13 $17
11%8% 6% 5%
40%43%
30% 31%
0%5%10%15%20%25%30%35%40%45%50%
$1
$10
$100
$1,000
2010 2011 2012 2013 2014
US Bookings per capita China bookings per capita
US growth China growth
48% 45%
30%25% 26%
15%0%5%10%15%20%25%30%35%40%45%50%
-
50
100
150
200
250
300
350
400
Europe US EastEur LatAm MEA China
Bill
ion
USD
Online Total Online share (%)
15%
5% 5%4% 4%
3%
0%
2%
4%
6%
8%
10%
12%
14%
16%
China Japan UK Korea Taiwan US
Online spending per capita as % of GDP (2013)

Ctrip.com InternationalMarket not appreciating the scope for margin acceleration
24
Toll booth to internet visibility in a fragmented hotel marketReviews verify accuracy of information and hotel ratingsDetailed understand of the Chinese traveller
Chinese online travel booking at 10-20% vs 50% in westCtrip growing ~50% organically vs. 25% for Priceline5.5x EV/Sales vs. 6.7x for Priceline
Earnings revision positive following strong Q1 and Q2Market not pricing in the operating leverage as the model scalei) Priceline went from 5% EBIT margin in 2002 to 34% 2010ii) eLong purchase consolidates the high-end of the marketiii) Market #2 Qunar is running -60% EBIT margin and losing $500m year vs $450m
gross cash in a marketing push to gain scale in hotels
At current trajectory CTRIP is trading at <30x ’16 P/E growing sales 40-50% organically
China leading the world in transacting onlineLagging the world in booking travel online, but catching up
ValueCreation
ValueCreation
ValuationValuation
Earnings rev/momentum
Earnings rev/momentum
ThemeTheme
145 153187 177 187 203
252 238 254278
347308
373408
517
450
553
601
766
662
19% 17% 16%11%
14% 16%19%
13%
4% 5% 4%
-21%
-8%
2%
12%
-2%
12%
20%26%
14%
-30%
-10%
10%
30%
50%
70%
90%
-
100
200
300
400
500
600
700
800
900
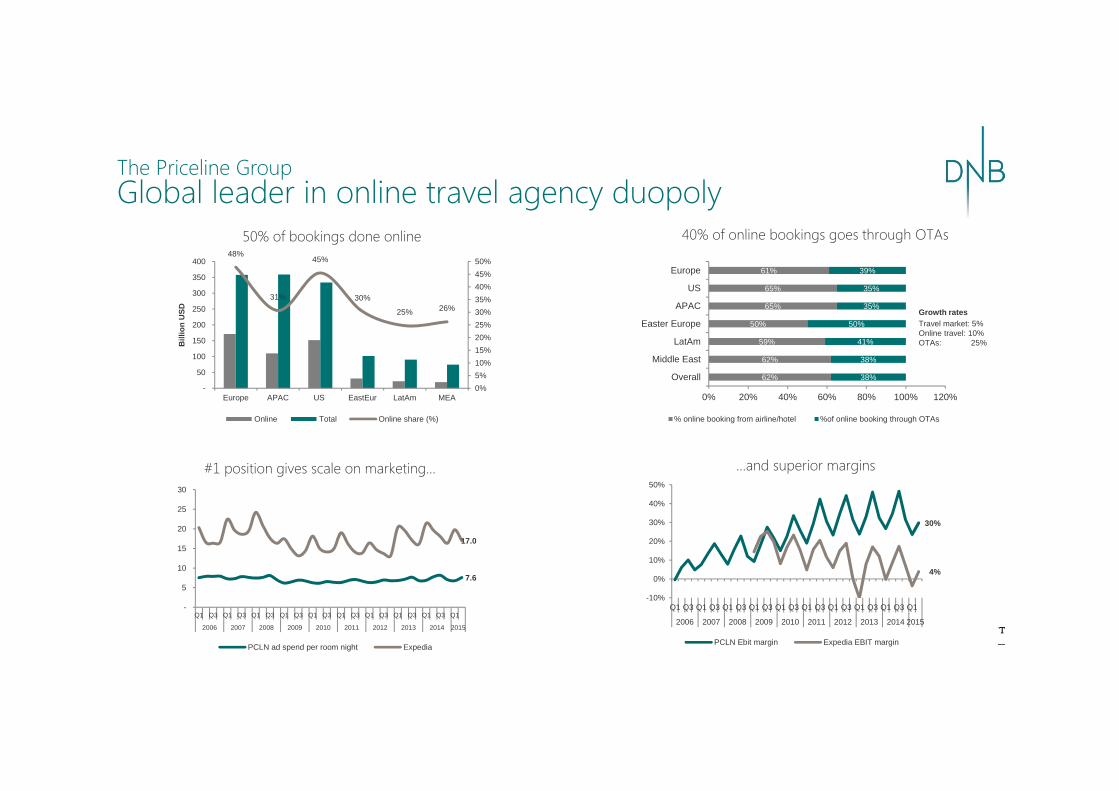
The Priceline GroupGlobal leader in online travel agency duopoly
40% of online bookings goes through OTAs
#1 position gives scale on marketing… …and superior margins
50% of bookings done online
62%
62%
59%
50%
65%
65%
61%
38%
38%
41%
50%
35%
35%
39%
0% 20% 40% 60% 80% 100% 120%
Overall
Middle East
LatAm
Easter Europe
APAC
US
Europe
% online booking from airline/hotel %of online booking through OTAs
48%
31%
45%
30%
25% 26%
0%5%10%15%20%25%30%35%40%45%50%
-
50
100
150
200
250
300
350
400
Europe APAC US EastEur LatAm MEA
Bill
ion
USD
Online Total Online share (%)
7.6
17.0
-
5
10
15
20
25
30
Q1 Q3 Q1 Q3 Q1 Q3 Q1 Q3 Q1 Q3 Q1 Q3 Q1 Q3 Q1 Q3 Q1 Q3 Q1
2006 2007 2008 2009 2010 2011 2012 2013 2014 2015
PCLN ad spend per room night Expedia
Growth ratesTravel market: 5%Online travel: 10%OTAs: 25%
30%
4%
-10%
0%
10%
20%
30%
40%
50%
Q1 Q3 Q1 Q3 Q1 Q3 Q1 Q3 Q1 Q3 Q1 Q3 Q1 Q3 Q1 Q3 Q1 Q3 Q1
2006 2007 2008 2009 2010 2011 2012 2013 2014 2015
PCLN Ebit margin Expedia EBIT margin
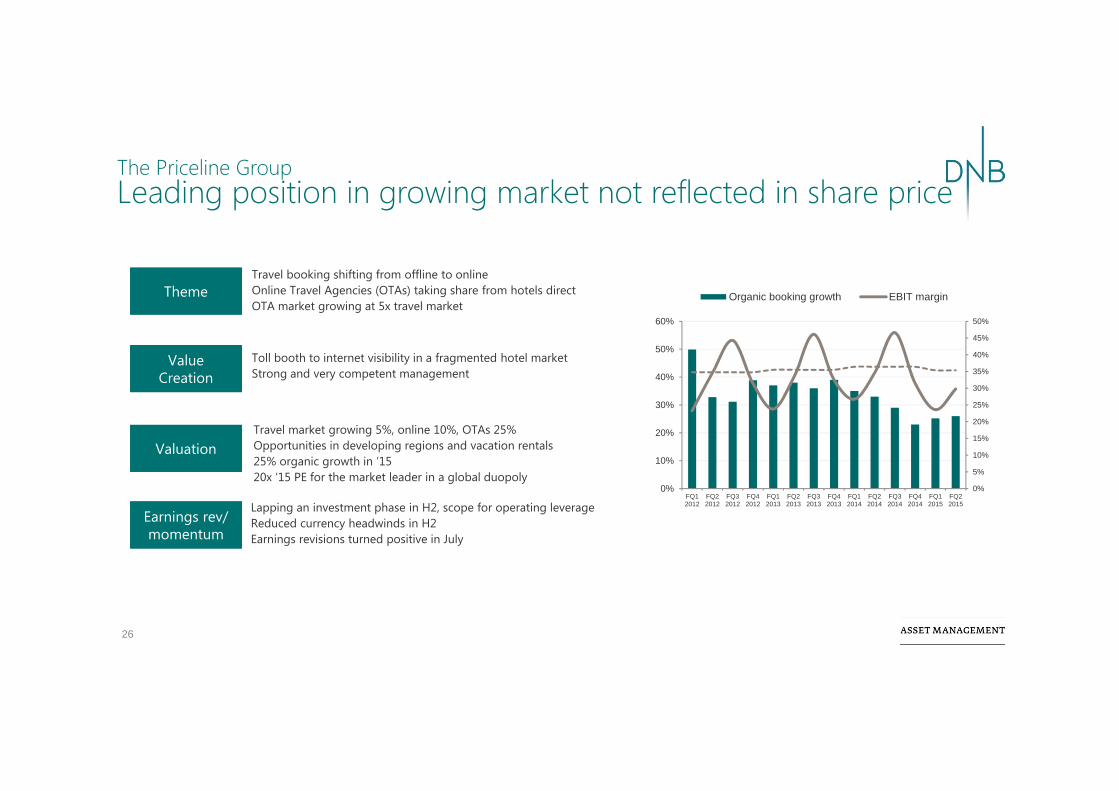
The Priceline GroupLeading position in growing market not reflected in share price
26
Toll booth to internet visibility in a fragmented hotel marketStrong and very competent management
Travel market growing 5%, online 10%, OTAs 25%Opportunities in developing regions and vacation rentals25% organic growth in ‘1520x ‘15 PE for the market leader in a global duopoly
Lapping an investment phase in H2, scope for operating leverageReduced currency headwinds in H2Earnings revisions turned positive in July
Travel booking shifting from offline to onlineOnline Travel Agencies (OTAs) taking share from hotels directOTA market growing at 5x travel market
ValueCreation
ValueCreation
ValuationValuation
Earnings rev/momentum
Earnings rev/momentum
ThemeTheme
0%
5%
10%
15%
20%
25%
30%
35%
40%
45%
50%
0%
10%
20%
30%
40%
50%
60%
FQ12012
FQ22012
FQ32012
FQ42012
FQ12013
FQ22013
FQ32013
FQ42013
FQ12014
FQ22014
FQ32014
FQ42014
FQ12015
FQ22015
Organic booking growth EBIT margin
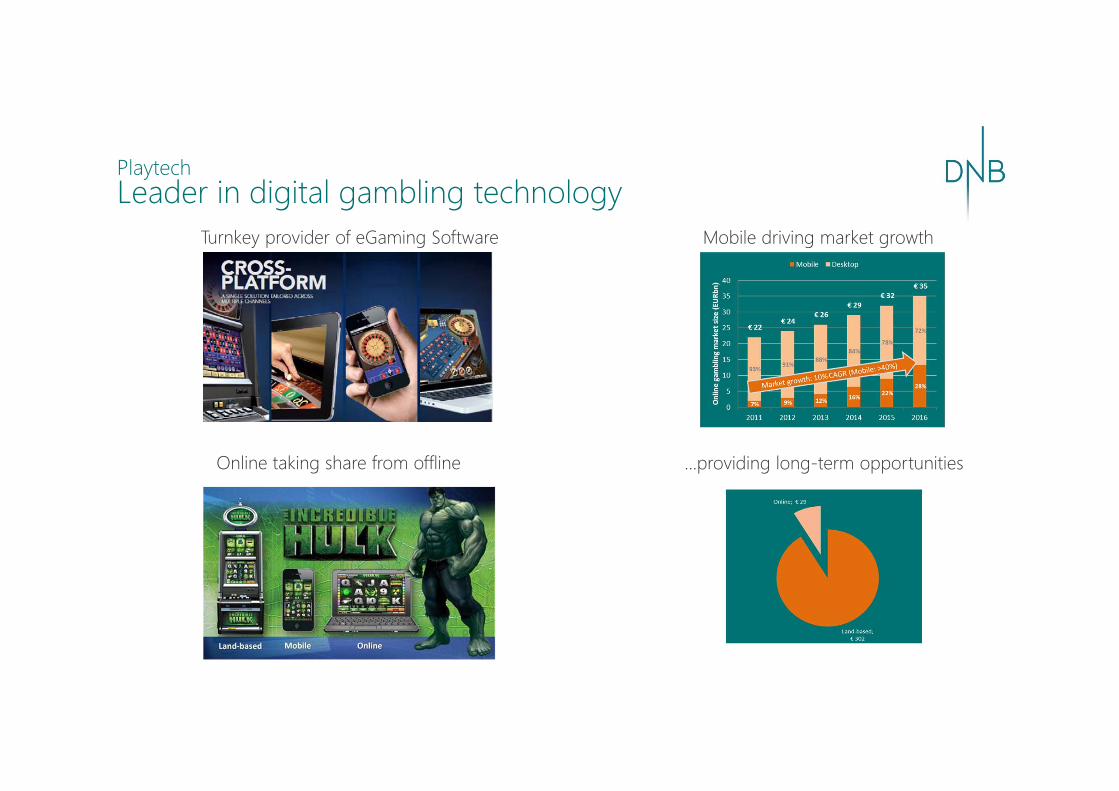
PlaytechLeader in digital gambling technology
Mobile driving market growth
Online taking share from offline …providing long-term opportunities
Turnkey provider of eGaming Software
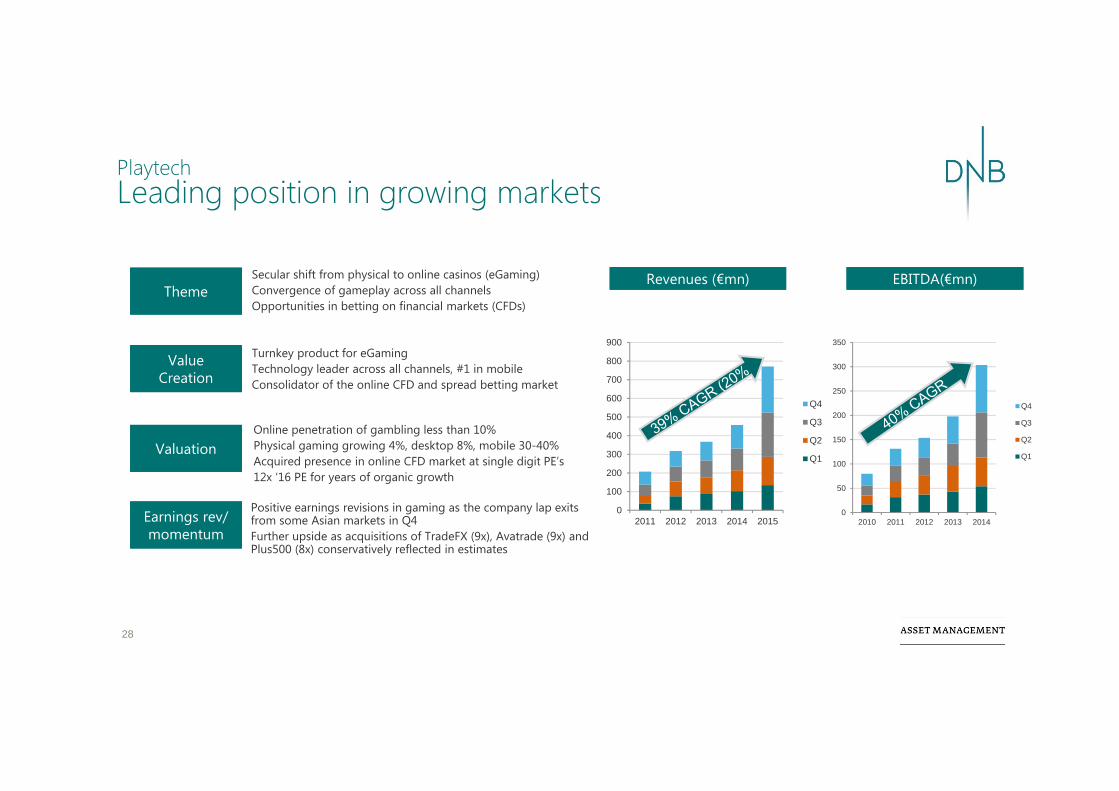
PlaytechLeading position in growing markets
28
Turnkey product for eGamingTechnology leader across all channels, #1 in mobileConsolidator of the online CFD and spread betting market
Online penetration of gambling less than 10%Physical gaming growing 4%, desktop 8%, mobile 30-40%Acquired presence in online CFD market at single digit PE’s12x ‘16 PE for years of organic growth
Positive earnings revisions in gaming as the company lap exits from some Asian markets in Q4 Further upside as acquisitions of TradeFX (9x), Avatrade (9x) and Plus500 (8x) conservatively reflected in estimates
Secular shift from physical to online casinos (eGaming)Convergence of gameplay across all channelsOpportunities in betting on financial markets (CFDs)
Revenues (€mn)Revenues (€mn) EBITDA(€mn)EBITDA(€mn)
ValueCreation
ValueCreation
ValuationValuation
Earnings rev/momentum
Earnings rev/momentum
ThemeTheme
0
50
100
150
200
250
300
350
2010 2011 2012 2013 2014
Q4
Q3
Q2
Q1
0
100
200
300
400
500
600
700
800
900
2011 2012 2013 2014 2015
Q4
Q3
Q2
Q1

7%
0%
5%
10%
15%
20%
0
5,000
10,000
15,000
20,000
2011 2012 2013 2014 2015e
FCF/yield%
ORACLE/SAPWell positioned in the Cloud – low valuation
29
Global domination in database and ERPVery profitable and huge R&D Successfully maneuvered technological shifts in the past
Oracle at 2016 P/E of 12x – ex cashSAP at 2016 P/E of 14x – ex cash
Improving trends in the cloudContinued FCF growth in the 5-10% range
Cloud threat exaggerated
Oracle
SAP
5%
0%
5%
10%
15%
20%
0
1,000
2,000
3,000
4,000
2011 2012 2013 2014 2015e
FCF/yield%
ValueCreation
ValueCreation
ValuationValuation
Earnings rev/momentum
Earnings rev/momentum
ThemeTheme

SamsungQuality company at a big discount
30
• Strong management • Scale leader in handset and memory
• Uniquely cheap vs own industry and universe
• Estimates slipping (like the industry), but minor compared to valuation
• Tailwinds from mobility growth and increased storage
Dominant in mobile memoryHistorical P/B
51%
25%
22%1%
Samsung Hynix Micron Other
ValueCreation
Valuation
Earnings rev/momentum
Theme

Agenda
31
1 DNB Asset Management
3 Investment Process
2 Portfolio Management Team & Track Record
4 Risk Management
5 Fund Facts
Risk management
• Standard deviation combined with stress tests and common sense
• Low concentration of portfolio - 5/10/40 - rule apply
• Structured process for "Approved Counterparty List"
• Low exposure to counterparties (according to UCITS)
- Maximum 10 % exposure towards "large European Financial institutions"
- 5 % towards others
• Low credit risk in interest bearing instruments
• Robust infrastructure for risk management and control called Worldport32

Controlling Liquidity Risks
33 "Worldport" extracts are examples only

Understanding Portfolio Sensitivities
• Risk system based on GRAM (Citi)
• Challenges the manager's fundamental bias
34

Agenda
35
1 DNB Asset Management
3 Investment Process
2 Portfolio Management Team & Track Record
4 Risk Management
5 Fund Facts

DNB Technology - Fund Profile
Fund managers: Anders Tandberg-Johansen, Sverre Bergland, Erling Thune
Strategy: Long only equity fund
Fund type UCITS: FCP - Long only equity fund
Benchmark: "MSCI World TMT" (66% MSCI Global IT, 22% MSCI Global Telecom Services, 12% MSCI Global Media)
Risk target: 6-10% TE
Number of holdings: 30-60
Country range: Flexible
Inception date: August 16, 2007
36

DNB Technology - Terms
37
ISIN: LU0302296495
Liquidity: Daily
Management fee: 1.5% p.a.
Performance fee: 20% (based on accumulated relative performance, no reset)
Front end fee: Up to 5%
Currency: EUR
Minimum investment: EUR 1000
Domiciled: Luxembourg

As portfolio managers our ambitions are clear
38
Identify winners and losers in changing landscape
Creating uncorrelated absolute returns for investors
Always keeping tight risk management

OsloDNB Asset Management ASDronning Eufemias gate 30N-0021 Oslo, Norway
StockholmDNB Asset Management ABRegeringsgatan 59SE-105 88 Stockholm, Sweden
LuxembourgDNB Asset Management S.A.13, rue GoetheL-1637 Luxembourg
Hong KongDNB Asset Management (Asia) Ltd.99 Queen's Road Central3305-3306, The Center, Hong Kong
The presentation has been prepared in accordance with DNB Asset Management’s General Business Terms. The presentation was prepared for internal use as information for our clients and is not intended for public use or distribution. The information contained herein may not be reproduced without DNB Asset Management’s prior consent.
This presentation was prepared on the basis of publicly available information. DNB Asset Management does not warrant that the information in the presentation is exact, correct or complete. The opinions expressed herein reflect the views of DNB Asset Management at the time. DNB Asset Management reserves the right to change its opinion without notice. Any written material distributed must be seen in the context of the oral presentation. DNB Asset Management will not accept responsibility for direct or indirect losses incurred as a result of the interpretation and/or use of information in this presentation.
This presentation is not an offer or recommendation to purchase or sell financial instruments. Investments in financial instruments are associated with risk, including the possibility that all or part of invested funds may be lost. Historical returns are no guarantee of future returns.
DNB Bank ASA and/or other entities in the DNB Group or employees and/or representatives of the DNB Group may trade in or hold positions in the presented or related financial instruments and may give financial advice or provide banking services linked to such financial instruments. Rules regarding confidentiality and other internal rules limit the exchange of information between different units and group companies in the DNB group. The employees in DNB who prepared this presentation may thus be prevented from using, or be unaware of, information held in other units/companies in the DNB Group that may be relevant to this presentation.
DNB Asset Management AS, a division within DNB Wealth Management, is an entity within the DNB Group registered in the Registry of Business Enterprises under Enterprise Number 880 109 162.
39
Disclaimer


41
Since inceptionDNB TechnologyBenchmark
Fund Market ValueReport Currency USDReturn Type Gross of Management FeeReport Period 2007-08-17 - 2015-08-25
Potential investors should carefully study the various risks associated with investing in the fund as detailed in the prospectus beforeinvesting. The most recent prospectus and the periodical reports may be obtained free of charge from the management company.Past performance is no guarantee for future performance.
MSCI World Global Information Technology / MSCI World Telecom / MSCI World Media (66/22/12)133 434 986
0
50
100
150
200
250
300
Aug.07
Jan.08
Jun.08
Nov.08
Apr.09
Sep.09
Feb.10
Jul.10
Dec.10
May.11
Oct.11
Mar.12
Aug.12
Jan.13
Jun.13
Nov.13
Apr.14
Sep.14
Feb.15
Jul.15
Fund Index
Yearly Returns, %Fund Index Relative
YTD -3,47 -6,26 2,802014 7,90 11,36 -3,46 2013 47,65 31,43 16,232012 9,56 14,27 -4,71 2011 -1,63 -1,23 -0,40 2010 23,28 14,63 8,642009 105,26 59,76 45,492008 -47,78 -59,86 12,08
Accumulated Returns, %Fund Index Relative
3 Years 54,48 35,44 19,045 Years 112,28 91,33 20,95
Report Period 140,56 35,45 105,11
Annualized Returns, %Fund Index Relative
3 Years 15,60 10,64 4,965 Years 16,25 13,86 2,39
Report Period 11,56 3,85 7,71
Annualized Risk Measures 3 Yrs, %Fund Index
Volatility 14,52 11,42Tracking Error 8,36

42
Last 7 yearsDNB TechnologyBenchmark
Fund Market ValueReport Currency USDReturn Type Gross of Management FeeReport Period 2008-08-25 - 2015-08-25
Potential investors should carefully study the various risks associated with investing in the fund as detailed in the prospectus beforeinvesting. The most recent prospectus and the periodical reports may be obtained free of charge from the management company.Past performance is no guarantee for future performance.
MSCI World Global Information Technology / MSCI World Telecom / MSCI World Media (66/22/12)133 434 986
0
50
100
150
200
250
300
Aug.08
Jan.09
Jun.09
Nov.09
Apr.10
Sep.10
Feb.11
Jul. 11 Dec.11
May.12
Oct.12
Mar.13
Aug.13
Jan.14
Jun.14
Nov.14
Apr.15
Fund Index
Yearly Returns, %Fund Index Relative
YTD -3,47 -6,26 2,802014 7,90 11,36 -3,46 2013 47,65 31,43 16,232012 9,56 14,27 -4,71 2011 -1,63 -1,23 -0,40 2010 23,28 14,63 8,642009 105,26 59,76 45,492008 -47,78 -59,86 12,08
Accumulated Returns, %Fund Index Relative
3 Years 54,48 35,44 19,045 Years 112,28 91,33 20,95
Report Period 129,73 55,73 74,00
Annualized Returns, %Fund Index Relative
3 Years 15,60 10,64 4,965 Years 16,25 13,86 2,39
Report Period 12,62 6,53 6,08
Annualized Risk Measures 3 Yrs, %Fund Index
Volatility 14,52 11,42Tracking Error 8,36

43
Last 5 yearsDNB TechnologyBenchmark
Fund Market ValueReport Currency USDReturn Type Gross of Management FeeReport Period 2010-08-25 - 2015-08-25
Potential investors should carefully study the various risks associated with investing in the fund as detailed in the prospectus beforeinvesting. The most recent prospectus and the periodical reports may be obtained free of charge from the management company.Past performance is no guarantee for future performance.
MSCI World Global Information Technology / MSCI World Telecom / MSCI World Media (66/22/12)133 434 986
0
50
100
150
200
250
300
Aug.10
Dec.10
Apr.11
Aug.11
Dec.11
Apr.12
Aug.12
Dec.12
Apr.13
Aug.13
Dec.13
Apr.14
Aug.14
Dec.14
Apr.15
Aug.15
Fund Index
Yearly Returns, %Fund Index Relative
YTD -3,47 -6,26 2,802014 7,90 11,36 -3,46 2013 47,65 31,43 16,232012 9,56 14,27 -4,71 2011 -1,63 -1,23 -0,40 2010 23,28 14,63 8,64
Accumulated Returns, %Fund Index Relative
3 Years 54,48 35,44 19,045 Years 112,28 91,33 20,95
Report Period 112,28 91,33 20,95
Annualized Returns, %Fund Index Relative
3 Years 15,60 10,64 4,965 Years 16,25 13,86 2,39
Report Period 16,25 13,86 2,39
Annualized Risk Measures 3 Yrs, %Fund Index
Volatility 14,52 11,42Tracking Error 8,36

44
Last 3 yearsDNB TechnologyBenchmark
Fund Market ValueReport Currency USDReturn Type Gross of Management FeeReport Period 2012-08-25 - 2015-08-25
Potential investors should carefully study the various risks associated with investing in the fund as detailed in the prospectus beforeinvesting. The most recent prospectus and the periodical reports may be obtained free of charge from the management company.Past performance is no guarantee for future performance.
MSCI World Global Information Technology / MSCI World Telecom / MSCI World Media (66/22/12)133 434 986
0
20
40
60
80
100
120
140
160
180
200
Aug.12
Oct.12
Dec.12
Feb.13
Apr.13
Jun.13
Aug.13
Oct.13
Dec.13
Feb.14
Apr.14
Jun.14
Aug.14
Oct.14
Dec.14
Feb.15
Apr.15
Jun.15
Aug.15
Fund Index
Yearly Returns, %Fund Index Relative
YTD -3,47 -6,26 2,802014 7,90 11,36 -3,46 2013 47,65 31,43 16,232012 9,56 14,27 -4,71
Accumulated Returns, %Fund Index Relative
3 Years 54,48 35,44 19,045 Years
Report Period 54,48 35,44 19,04
Annualized Returns, %Fund Index Relative
3 Years 15,60 10,64 4,965 Years
Report Period 15,62 10,65 4,96
Annualized Risk Measures 3 Yrs, %Fund Index
Volatility 14,52 11,42Tracking Error 8,36

45
Last 12 monthsDNB TechnologyBenchmark
Fund Market ValueReport Currency USDReturn Type Gross of Management FeeReport Period 2014-08-25 - 2015-08-25
Potential investors should carefully study the various risks associated with investing in the fund as detailed in the prospectus beforeinvesting. The most recent prospectus and the periodical reports may be obtained free of charge from the management company.Past performance is no guarantee for future performance.
MSCI World Global Information Technology / MSCI World Telecom / MSCI World Media (66/22/12)133 434 986
0
20
40
60
80
100
120
140
Aug. 14 Sep. 14 Oct. 14 Nov. 14 Dec. 14 Jan. 15 Feb. 15 Mar. 15 Apr. 15 May. 15 Jun. 15 Jul. 15 Aug. 15
Fund Index
Yearly Returns, %Fund Index Relative
YTD -3,47 -6,26 2,802014 7,90 11,36 -3,46
Accumulated Returns, %Fund Index Relative
3 Years5 Years
Report Period -2,18 -4,13 1,95
Annualized Returns, %Fund Index Relative
3 Years5 Years
Report Period -2,18 -4,13 1,95
Annualized Risk Measures 3 Yrs, %Fund Index
VolatilityTracking Error
46
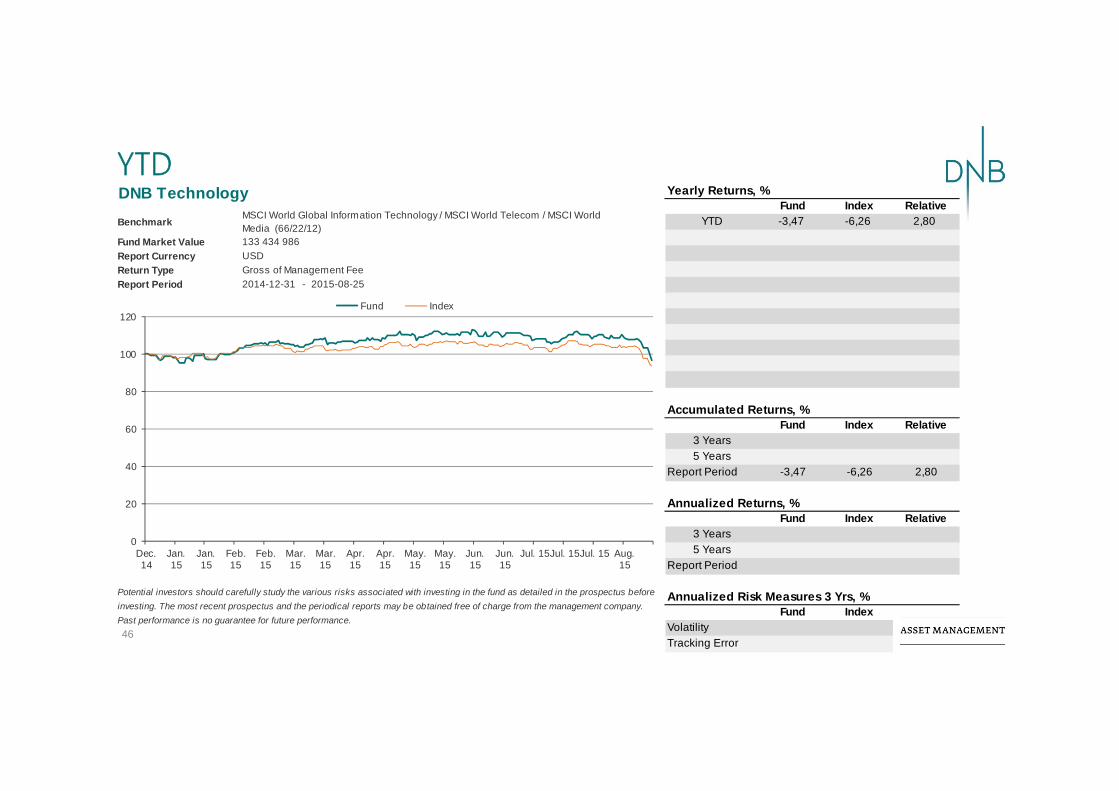
YTDDNB TechnologyBenchmark
Fund Market ValueReport Currency USDReturn Type Gross of Management FeeReport Period 2014-12-31 - 2015-08-25
Potential investors should carefully study the various risks associated with investing in the fund as detailed in the prospectus beforeinvesting. The most recent prospectus and the periodical reports may be obtained free of charge from the management company.Past performance is no guarantee for future performance.
MSCI World Global Information Technology / MSCI World Telecom / MSCI World Media (66/22/12)133 434 986
0
20
40
60
80
100
120
Dec.14
Jan.15
Jan.15
Feb.15
Feb.15
Mar.15
Mar.15
Apr.15
Apr.15
May.15
May.15
Jun.15
Jun.15
Jul. 15Jul. 15Jul. 15 Aug.15
Fund Index
Yearly Returns, %Fund Index Relative
YTD -3,47 -6,26 2,80
Accumulated Returns, %Fund Index Relative
3 Years5 Years
Report Period -3,47 -6,26 2,80
Annualized Returns, %Fund Index Relative
3 Years5 Years
Report Period
Annualized Risk Measures 3 Yrs, %Fund Index
VolatilityTracking Error