dnb boligkreditt as
TRANSCRIPT

1
1 DNB BOLIGKREDITT AS
DN
B BOLIG
KRED
ITT AS –
a company in the D
NB G
roup
First quarter 2013
– a company in the DNB Group First quarter report 2013(UNAUDITED)
For
per
sona
l use
onl
y

Key figures DNB Boligkreditt AS
Statement of comprehensive income 1st quarter 1st quarter Full year Amounts in NOK million 2013 2012 2) 2012 2)
Net interest income 1 456 627 4 031 Net other operating income (52) (3 141) (3 469) - net gains (losses) on financial instruments at fair value (70) (3 157) (3 543) Operating expenses 1 071 285 2 592 Impairments on loans and commitments (7) (2) 8 Pre tax operating profit 341 (2 798) (2 038) Taxes 96 (783) (571) Profit for the period 245 (2 014) (1 468)
Balance sheet 31 March 31 Dec. 31 March Amounts in NOK million 2013 2012 2) 2012 2)
Total assets 556 274 562 118 505 035 Loans to customers 525 702 519 362 480 113 Debt securities issued 404 385 382 531 366 029 Total equity 22 557 22 312 18 479
Key figures 1st quarter 1st quarter Full year Per cent 2013 2012 2) 2012 2)
Combined weighted total average spread for loans 1) 0.92 0.33 0.60 Return on equity, annualised 3) 4.5 (48.3) (3.5)
Tier 1 capital ratio at end of period 4) 10.3 8.4 10.3 Capital ratio at end of period 4) 11.2 9.4 11.2
Impairments relative to net loans to customers, annualised 0.00 0.00 0.00 Non-performing and impaired loans, per cent of gross loans 0.21 0.23 0.23 1) Based on nominal values excluding impaired loans, measured against actual funding cost. 2) Due to changes in principles, some comparative figures have been restated. See further details in note 1 Accounting principles. 3) Average equity is calculated on the basis of book value of equity. 4) The loss for the period is included in Tier 1 capital.
For
per
sona
l use
onl
y

DNB Boligkreditt first quarter report 2013 Unaudited 1
First quarter report 2013 Directors’ report ......................................................................................................................................... 2 Accounts Income statement and Statement of comprehensive income .............................................................................. 4
Balance sheet ..................................................................................................................................................... 5
Statement of changes in equity ........................................................................................................................... 6
Statement of cash flows ...................................................................................................................................... 7
Note 1 Accounting principles .................................................................................................................... 8
Note 2 Significant accounting judgements, estimates and assumptions ................................................... 8
Note 3 Capital adequacy .......................................................................................................................... 9
Note 4 Credit risk ................................................................................................................................... 10
Note 5 Market risk .................................................................................................................................. 10
Note 6 Liquidity risk ................................................................................................................................ 11
Note 7 Net interest income ..................................................................................................................... 11
Note 8 Net gains on financial instruments ............................................................................................... 12
Note 9 Operating expenses .................................................................................................................... 12
Note 10 Loans to customers ..................................................................................................................... 13
Note 11 Debt securities issued ................................................................................................................. 14
Note 12 Subordinated capital ................................................................................................................... 15
Note 13 Financial instruments at fair value ............................................................................................... 16
Note 14 Fair value of financial instruments at amortised cost ................................................................... 17
Note 15 Related parties ............................................................................................................................ 18
Note 16 Contingencies and post balance sheet events ............................................................................ 18 Additional information Key figures ....................................................................................................................................................... 19
Profit and balance sheet trends ........................................................................................................................ 20
Contact information ........................................................................................................................................... 21
For
per
sona
l use
onl
y

2 Unaudited DNB Boligkreditt first quarter report 2013
First quarter report 2013 Introduction DNB Boligkreditt AS is the DNB Group's vehicle for the issue of covered bonds based on residential mortgages. The company's offices are located in Oslo. DNB Boligkreditt is a wholly-owned subsidiary of DNB Bank ASA and is reported as part of the Retail Banking business area in DNB's consolidated accounts. Based on developments in international capital markets, DNB Boligkreditt has come to play a key role in ensuring long-term favourable funding for the Group. The rating agencies' assessments are of significance to the company’s funding terms, and the company has engaged Standard & Poor’s, Fitch Ratings and Moody’s. The bonds issued have an AAA rating from all three agencies. The market remained attractive for covered bonds issuers with strong credit ratings during the first quarter. The company issued covered bonds for a total of NOK 34.5 billion in the first quarter of 2013. Review of the first quarter 2013 results Statement of comprehensive income DNB Boligkreditt recorded a pre-tax operating profit of NOK 341 million in the first quarter of 2013, compared with a pre-tax operating loss of NOK 2 798 million in the first quarter of 2012. There was a profit of NOK 245 million for the period, compared with a loss of NOK 2 014 million in the first quarter of 2012. The company's operating income was NOK 1 405 million in the first quarter of 2013, while operating income totalled a negative at NOK 2 515 million in the first quarter of the previous year. Net interest income totalled NOK 1 456 million, up from NOK 627 million in the first quarter of 2012. The improvement was due to wider interest rate spreads. Net other operating income was negative at NOK 52 million for the first quarter of 2013, while operating income totalled a negative at NOK 3 141 million in the corresponding period in 2012. The figures reflect the negative effects of unrealised changes in the market value of covered bonds and financial instruments. DNB Boligkreditt will typically record a high level of unrealised gains when financial markets are volatile, and vice versa when markets stabilise. Gains and losses from such instruments tend to vary considerably from quarter to quarter and will typically be reversed in subsequent periods due to stabilising markets or because the maturity dates of the instruments are approaching. For the first quarter of 2012, DNB Boligkreditt recorded a high level of unrealised losses on financial instruments due to a reduction in market values. The markets stabilised in the first quarter of 2013, thus these effects showed a minimal change. The company's operating expenses totalled NOK 1 071 million in the first quarter of 2013, up from NOK 285 million the year before. Operating expenses are volatile due to the management fee paid to DNB Bank. The cooperation with DNB Bank is formalised through an extensive servicing agreement that ensures DNB Boligkreditt sound competence in key areas and cost-effective operations. The management fee calculation is based primarily on lending volume and the spreads achieved. The management fee to the bank amounted to NOK 1 057 million in the first quarter of 2013, up from NOK 269 million in the first quarter of 2012. The increase was mainly due to wider interest rate spreads.
The company recorded net recoveries on impaired loans of NOK 7.1 million in the first quarter of 2013, compared with net recoveries of NOK 1.7 million in the corresponding period in 2012. The Board of Directors considers the level of impairment to be satisfactory relative to the high quality of the loan portfolio. Balance sheet, assets under management and funding At end-March 2013, DNB Boligkreditt had total assets of NOK 556.3 billion under management, an increase of NOK 51.2 billion or 10.1 per cent from end-March 2012. Net loans to customers rose by 6,3 billion in the first quarter, standing at NOK 525.7 billion at end-March, rising by NOK 45.6 billion or 9.5 per cent over the preceding 12 months. The increase originates from the acquisition of residential mortgage portfolios from DNB Bank and the sale of new loans through the bank's distribution network. Debt securities issued by the company increased by a net NOK 21.9 billion during the quarter, to NOK 404.4 billion. DNB Boligkreditt issued covered bonds under existing programmes totalling NOK 34.5 billion during the first quarter of 2013, and total debt securities issued stood at NOK 404,4 billion as at 31 March 2013. The company had NOK 107.0.billion due to credit institutions at end-March, up from NOK 99.1 billion a year earlier. This reflects the amount drawn on the overdraft facility with DNB Bank. Risk and capital adequacy The company has established guidelines and limits for management and control of the different types of risk. Currency risk is eliminated through the use of financial derivatives. Interest rate and liquidity risk is managed in accordance with stipulations concerning covered bonds in the Financial Institutions Act and guidelines and limits approved by the Board of Directors. The company’s overall financial risk is considered to be low. Profit fluctuations resulting from changes in market values associated with the credit risk on the company's bond issues are neutralised in Tier 1 capital calculations for the company and thus do not affect the capital base. The servicing agreement with DNB Bank comprises administration, bank production, IT operations and financial and liquidity management. Operational risk is assessed to be low. The fee structure in the servicing agreement shall ensure a stable return on equity, but does not take the effects of unrealised changes in the value of financial instruments into consideration. Non-performing and impaired loans represented 0.21 per cent of total loans at end-March 2013, down from 0.23 per cent a year earlier. In the opinion of the Board of Directors, the loan portfolio is of high quality. A decline in housing prices will reduce the value of the company's cover pool relative to the statutory asset coverage requirement. Quarterly stress tests are carried out to estimate the effects of a negative development in housing prices. A short-term measure to meet a significant fall in housing prices will be to supply DNB Boligkreditt with more substitute collateral. The Board of Directors considers the company's total risk exposure to be low. As at 31 March 2013, the company's equity totalled NOK 22.6 billion, of which NOK 22.1 billion represented Tier 1 capital. Total primary capital in the company was NOK 24.0 billion. The Tier 1 capital ratio was 10.3 per cent, while the capital adequacy ratio was 11.2 per cent. The Board of Directors considers the company to be adequately capitalised relative to the risk level in the loan portfolios and other operations.
For
per
sona
l use
onl
y

DNB Boligkreditt first quarter report 2013 Unaudited 3
New regulatory framework The Basel III regulatory framework introduces stricter capital adequacy and liquidity requirements. The requirements will be implemented in the EU/EEA in the form of new capital requirements directives, CRR and CRD IV, during 2013. The Norwegian Ministry of Finance has prepared for the imple- mentation of CRR and CRD IV in Norway based on the EEA agreement and aims to approve changes in regulations during 2013, with full effect from 2019. The national authorities are granted a high degree of flexibility concerning the implementation of extra capital buffers in excess of the minimum capital requirements. The Norwegian financial supervisory authority has disclosed new proposed capital requirements. According to the proposal, the minimum Tier 1 capital ratio will be required to be 12 per cent by 1 July 2016, including a so-called capital conservation buffer. In addition, a counter-cyclical capital element of until 2,5 per cent will be introduced, determined by the national supervisory authority. Meanwhile, the Norwegian financial supervisory authority (Finanstilsynet) requires that risk-weighted volume must represent minimum 80 per cent of risk-weighted volume measured according to standard risk weights under the Basel I rules. In March 2013, the Ministry of Finance sent out a consultation paper, suggesting new risk weights on home mortgages ranging between 20 and 35 per cent. Today, Boligkreditt’s average risk weight on home mortgages is approximately 12 per cent according to Basel II without transitional rules. Macroeconomic development The weak development in the eurozone continued throughout the first quarter of 2013. Unemployment rates have risen every month since April 2011, reaching 12 per cent in March 2013, which is the highest observed level after World War II. Forecasts indicate a negative GDP growth rate of 0.3 per cent in 2013 and a positive growh rate of 1.0 per cent in 2014. The US economy showed moderate growth in the first quarter of 2013. However, high unemployment rates also create problems for the US economy. Housing prices in Norway continued to rise in the first quarter of 2013. Population growth, a moderate number of new resi-dential properties, a stable and low unemployment rate and
prospects of continuing low interest rate levels point towards a further stable upward trend in housing prices. However, relatively high housing prices and stricter equity requirements introduced by the financial supervisory authority dampened price growth during the first quarter. At end-March 2013, housing prices were approximately 7.0 per cent higher than at end-March 2012. Detached houses showed the most favourable price development in the first quarter. Towards the end of 2011, Finanstilsynet announced revised guidelines for prudent residential mortgage lending practices. The guidelines entail stricter rules for loan-to-value ratios, liquidity calculations and the basis for approving home equity credit lines and interest-only periods. During the second half of 2012 and the first quarter of 2013, this seemed to mitigate the increase in housing prices and market growth for residential mortgages. There was a positive market situation for covered bonds in the first quarter of 2013. Lower returns on more traditional investments seemed to have a positive impact on the demand for covered bonds from highly rated issuers, especially covered bond issues with a long term to maturity. Future prospects Covered bonds have gained a leading position as a funding vehicle for Norwegian banks. At the end of 2012, the Norwegian Ministry of Finance asked Finanstilsynet to investigate whether the implementation of qualitative rules on the transfer of loans to residential mortgage companies could contribute to lowering systemic risk. Finanstilsynet’s response was that an effective measure would be to monitor the banking groups on an individual basis by following up each bank’s transfer of home mortgages to mortgage companies. The Ministry of Finance has not yet considered the responses. In March 2013, DNB decided to raise home mortgage rates by up to 0.30 percentage points. The interest rate increase will be primarily reflected in the accounts as from second quarter and is part of the adjustment to the new and stricter capital requirements as outlined in the paragraph on new regulatory framework. Demand for Norwegian covered bonds is supported by the sound Norwegian economy. Thus, Norwegian covered bonds seem to be regarded as attractive investments with relatively low credit and market risk. This provides a good basis for DNB Boligkreditt’s funding activities in the capital markets in 2013.
Oslo, 25 April 2013 The Board of Directors of DNB Boligkreditt AS
Bjørn Erik Næss Ingrid Tjønneland (chairman) Stein Ove Steffensen Elisabeth Ege Rein Øsebak Øyvind Birkeland (chief executive officer)
For
per
sona
l use
onl
y

4 Unaudited DNB Boligkreditt first quarter report 2013
Income statement and Statement of comprehensive income
DNB Boligkreditt AS
1st quarter 1st quarter Full year Amounts in NOK 1 000 Note 2013 2012 2012 1)
Total interest income 7 4 820 150 4 636 661 18 960 566 Total interest expenses 7 3 363 762 4 009 859 14 929 763 Net interest income 7 1 456 387 626 802 4 030 802 Commission and fee income 15 880 14 722 70 365 Commission and fee expenses 479 459 1 814 Net gains (losses) on financial instruments at fair value 8 (70 003) (3 157 199) (3 542 632) Other income 2 776 1 616 5 394 Net other operating income (51 827) (3 141 319) (3 468 686) Total income 1 404 561 (2 514 517) 562 116 Salaries and other personnel expenses 9 10 154 5 459 19 233 Other expenses 9, 15 1 060 696 279 425 2 573 057 Total operating expenses 9 1 070 849 284 884 2 592 290 Impairments on loans and commitments 10 (7 126) (1 697) 8 074 Pre-tax operating profit 340 837 (2 797 705) (2 038 248) Taxes 95 626 (783 357) (570 775) Profit for the period 245 211 (2 014 347) (1 467 472) Other comprehensive income - - 6 305 Total comprehensive income for the period 245 211 (2 014 347) (1 461 167) 1) Due to changes in principles, some comparative figures have been restated. See further details in note 1 Accounting principles.
For
per
sona
l use
onl
y

DNB Boligkreditt first quarter report 2013 Unaudited 5
Balance sheet DNB Boligkreditt AS
31 March 31 Dec. 31 March Amounts in NOK 1 000 Note 2013 2012 1) 2012 1)
Assets
Due from credit institutions 15 1 379 957 13 098 740 398 140 Loans to customers 10 525 701 626 519 362 406 480 113 433 Financial derivatives 13,15 29 185 706 29 651 578 24 511 598 Other assets (378) 5 382 11 687 Deferred tax assets 7 494 Total assets 556 274 405 562 118 106 505 034 858 Liabilities and equity
Due to credit institutions 15 107 031 618 130 128 238 99 097 087 Financial derivatives 13,15 19 368 487 24 243 408 18 314 798 Debt securities issued 11 404 384 681 382 530 982 366 029 045 Payable taxes 507 187 285 527 286 373 Deferred taxes - 159 460 204 702 Other liabilities 333 126 374 143 230 577 Provisions 34 283 26 326 34 082 Subordinated loan capital 12 2 058 106 2 058 313 2 359 591 Total liabilities 533 717 488 539 806 398 486 556 255
Share capital 2 527 000 2 527 000 2 127 000 Share premium reserve 16 893 000 16 893 000 13 293 000 Retained earnings 3 136 918 2 891 707 3 058 605 Total equity 22 556 918 22 311 707 18 478 605 Total liabilities and equity 556 274 405 562 118 106 505 034 858 1) Due to changes in principles, some comparative figures have been restated. See further details in note 1 Accounting principles.
For
per
sona
l use
onl
y

6 Unaudited DNB Boligkreditt first quarter report 2013
Statement of changes in equity
DNB Boligkreditt AS
Share ActuarialShare premium profit Retained Total
Amounts in NOK 1000 capital reserve and loss earnings equity Balance sheet as at 31 December 2011 1 827 000 10 593 000 - 5 076 110 17 496 110 Implementation of the amended IAS 19 - Employee Benefits 1) - - (3 158) - (3 158) Balance sheet as at 1 January 2012 1 827 000 10 593 000 (3 158) 5 076 110 17 492 952 Profit for the period - - - (2 014 347) (2 014 347) Other comprehensive income - - 0 - - Total comprehensive income for the period - - 0 (2 014 347) (2 014 347) Share issue 21 March 2012 300 000 2 700 000 - - 3 000 000 Balance sheet as at 31 March 2012 2 127 000 13 293 000 (3 158) 3 061 763 18 478 605
Balance sheet as at 31 December 2012 2 527 000 16 893 000 0 2 888 559 22 308 560 Implementation of the amended IAS 19 - Employee Benefits 1) - - 3 147 - 3 147 Balance sheet as at 1 January 2013 2 527 000 16 893 000 3 147 2 888 559 22 311 707 Profit for the period - - - 245 211 245 211 Other comprehensive income - - 0 - - Total comprehensive income for the period - - 0 245 211 245 211 Balance sheet as at 31 March 2013 2 527 000 16 893 000 3 147 3 133 770 22 556 918 1) Changes in accounting principles due to changes in IAS 19, ref. note 1 Accounting principles. Share capital All shares and voting rights of the company are held by DNB Bank ASA. Share capital at the beginning of 2013 was NOK 2 527 million (25 270 000 shares at NOK 100).
For
per
sona
l use
onl
y

DNB Boligkreditt first quarter report 2013 Unaudited 7
Statement of cash flows DNB Boligkreditt AS
1st quarter 1st quarter Full year Amounts in NOK 1 000 2013 2012 2012
Operating activitiesNet receipts/payments on loans to customers (1 971 754) (5 273 490) (23 545 143) Interest received from customers 4 668 802 4 604 630 17 141 547 Net payments on sales of financial assets for investment or trading (16 797) - 1 003 271 Net receipts on commissions and fees 15 401 14 263 68 551 Payments for operating expenses (1 096 598) (114 701) (2 281 482) Taxes paid (39 695) (6 373) 12 536 Other receipts - 1 616 8 635 Net cash flow relating to operating activities 1 559 358 (774 055) (7 592 085)
Investing activitiesNet purchase of loan portfolio (4 121 598) (11 487 649) (31 675 875) Net cash flow relating to investment activities (4 121 598) (11 487 649) (31 675 875)
Financing activitiesNet receipts/payments on loans from credit institutions (12 333 200) 4 280 193 35 393 211 Receipts on issued bonds 34 471 183 33 712 755 61 719 388 Payments on redeemed bonds (19 687 616) (26 915 000) (50 588 388) Redemptions of subordinated loan capital - - (300 000) Share issue - 3 000 000 7 000 000 Group contribution paid - - (1 000 000) Interest payments on financing activities (843 490) (4 116 594) (2 556 000) Net cash flow from financing activities 1 606 876 9 961 354 49 668 211 Net cash flow (955 363) (2 300 349) 10 400 251 Cash at beginning of period 1 837 569 2 698 489 2 698 489 Net receipts/payments of cash (955 363) (2 300 349) 10 400 251 Cash at end of period 882 206 398 140 13 098 740 The statement of cash flows has been prepared in accordance with the direct method and shows receipts and payments of cash and cash equivalents during the year. Cash and cash equivalents is defined as cash and deposits with central banks and deposits with credit institutions with no agreed period of notice. Included in the cash balances at end of period, is restricted amounts of NOK 540 190 (NOK 797 751 for 2012) related to withholding employee taxes.
For
per
sona
l use
onl
y

8 Unaudited DNB Boligkreditt first quarter report 2013
Note 1 Accounting principles
The financial statements for the first quarter of 2013 have been prepared in accordance with IAS 34 Interim Financial Reporting. The interim financial statements do not include all the information and disclosures required in the annual financial statements, and should be read in conjunction with the company’s annual financial statements as at 31 December 2012. The company’s accounting principles and methods of estimates are consistent with those applied in the preparation of the annual financial statements for 2012. The following changes in accounting standards have effect for the interim report. IFRS 13 Fair Value Measurement entered into force as of 1 January 2013. The standard includes principles and guidance for fair value measurement of assets and liabilities when other IFRSs require or permit fair value measurements. The standard does not change what is required or permitted to be measured at fair value. IFRS 13 applies both at initial recognition and in subsequent measurements. IFRS 13 will require more detailed note information in both quarterly and annual accounts. The new rules will have no material impact on the company’s profit and loss or balance sheet, but will have an impact on the note information presented in the quarterly and annual accounts. This information is presented in note 13 and 14. Amendments to IAS 19 – Employee Benefits entered into force as of 1 January 2013. The amendments affect the recognition and presentation of the company’s defined benefit pension schemes. The main effect of the amendments is that the corridor approach for recognising actuarial gains and losses have been removed and actuarial gains and losses are recognised in other comprehensive income in the year in which they occur. The actuarial net losses per 31 December 2011 of NOK 3.2 million, have been booked directly to the company’s equity per 1 January 2012. 2012 figures have been restated. The accounts for the first quarter were approved by the Board of Directors on 25th of April 2013. Operating segments The company has operations within one operating segment only according to IFRS 8 Operating segments. The segment gave a positive return of NOK 0.2 billion for the first quarter of 2013. The company uses the information in the statement of comprehensive income and balance sheet also in its internal reporting.
Note 2 Significant accounting judgements, estimates and assumptions
The preparation of financial information in conformity with IFRS requires the use of estimates and assumptions about future conditions that affect reported income, expenses, assets and liabilities. Use of available information and applications of judgement are inherent in the information estimates. Actual results in the future may differ from such estimates, and the differences may be material to the financial statements. A more detailed description of important estimates and assumptions is presented in the annual report for 2012 in note 1 Significant accounting judgements, estimates and assumptions.
For
per
sona
l use
onl
y

DNB Boligkreditt first quarter report 2013 Unaudited 9
Note 3 Capital adequacy
Primary capital DNB Boligkreditt AS31 March 31 Dec.
Amounts in NOK 1 000 2013 2012 Share capital 2 527 000 2 527 000 Other equity 19 784 707 19 781 560 Total equity 22 311 707 22 308 560 Deductions 50 percent expected losses, IRB-portfolios (189 604) (210 084) Adjustments for unrealised losses/(gains) on liabilites recorded at fair value (8 468) (73 566) Allocated group contributions for payment - - Tier 1 capital 1) 22 113 635 22 024 910 Term subordinated loan capital 2 050 000 2 050 000 Deductions Remaining maturity of less than 5 years - - 50 percent expected losses, IRB-portfolios (189 604) (210 084) Tier 2 capital 1 860 396 1 839 916 Total eligible primary capital 23 974 031 23 864 826 Risk-weighted volume 214 968 090 213 870 241 Minimum capital requirement 17 197 447 17 109 619 Tier 1 capital ratio (%) 10.3 10.3 Capital ratio (%) 11.2 11.2 DNB Boligkreditt AS complies to the Basel II regulations. Due to transitional rules, the minimum capital requirement for 2013 cannot be reduced below 80 per cent in relation to the requirements according to Basel I rules. Capital adequacy for the first quarter is reported according to the transitional rules. The schedule below shows capital adequacy according to Basel II without regard to the rules of transition.
DNB Boligkreditt AS31 March 31 Dec.
Amounts in NOK 1 000 2013 2012 Risk-weighted volume, Basel II 81 483 443 86 460 613 Minimum capital requirement, Basel II 6 518 675 6 916 849 Tier 1 capital ratio (%) 27.1 25.5 Capital ratio (%) 29.4 27.6 1) The loss for the period is included in Tier 1 capital.
For
per
sona
l use
onl
y

10 Unaudited DNB Boligkreditt first quarter report 2013
Note 4 Credit risk
Credit risk is the risk that the company will incur a loss because its customers or counterparties fail to meet their contractual obligations. Credit risk arises from loans and loan commitments as well as from derivatives. The maximum exposure to credit risk, according to IFRS, is the gross carrying amount of the assets, net of any amounts offset in accordance with the standards and net of any recognised impairment losses. In addition, certain off-balance sheet items such as loan commitments represent credit risk. The maximum exposure of loan commitments is the irrevocable amount that may be drawn upon in the future. DNB Boligkreditt has adopted the credit risk policies as set by the DNB Group. The group manages and controls credit risk by setting limits on the amount of risk it is willing to accept for individual counterparties, and by monitoring exposures in relation to such limits. Collateral are taken to manage credit risk in the loan portfolios. According to the “Agreement relating to transfer of loan portfolio between DNB Bank ASA and DNB Boligkreditt AS”, the day to day monitoring of the loans are managed by DNB Bank on behalf of DNB Boligkreditt. DNB’s risk classification system is divided into ten risk classes where 1 represents the lowest and 10 the highest risk. The classification system is based on the probability of default (PD) which is an estimate of the likelihood of a counterparty defaulting on its contractual obligations. DNB Boligkreditt’s majority of credit risk is related to loans to customers with collateral security in residential property, holiday homes and housing associations. DNB Boligkreditt acquires the loans from DNB Bank. The loans are originally granted to customers by DNB Bank, based on the group’s policies and limits. At the time of transfer of loan portfolios from DNB Bank to DNB Boligkreditt, only loans that qualify as collateral for the issue of covered bonds according to the Financial Institutions Act, are accepted by the company. For all these loans, a mortgage over the property is taken and the value of the total loan balance per property should not exceed 75 per cent of the total value of the property. The collateral value is monitored on an ongoing basis. Credit risk also arises from derivative financial instruments. The maximum credit risk related to derivatives is limited to those with a positive fair value in the balance sheet. All derivative contracts, both those with a current positive value and current negative value, are entered into with DNB Bank ASA as counterparty.
Note 5 Market risk
Market risk is the risk that the fair value or future cash flows of financial instruments will fluctuate due to changes in market variables such as interest rates and foreign exchange rates. Market risk arises as a consequence of open positions in interest rates and foreign exchange rates. Changes in these rates may affect both the company’s total comprehensive income for the period as well as values in the balance sheet. Currency risk Currency risk may arise from DNB Boligkreditt’s debt securities that are denominated in foreign currencies. DNB Boligkreditt has minimized this currency risk through currency swap agreements with DNB Bank. All issued debt is swapped to NOK. In accordance with the bank’s policy, positions are monitored on a daily basis and hedging strategies are used to ensure positions are maintained within established limits. Interest rate risk The company is exposed to interest rate risk through its ordinary operations. The company’s strategy is to swap all interest risk exposure to short-term interest. The Board of Directors sets interest risk limits for various fixed-rate periods. The positions are monitored on a daily basis, and monthly exposure reports are prepared for the management and for The Board of Directors. Basis risk and basis swap spreads The company is exposed to basis risk, which is a type of market risk associated with imperfect hedging. The company enters into basis swaps to manage foreign currency risk and interest rate risk from it’s long-term borrowing in foreign currencies. However, the loans are hedged 1:1 through the use of basis swap contracts where there is a high correlation between the currencies and interest rate flows, and the hedging instrument. DNB Boligkreditt’s basis risk, as a result of imperfect hedging of positions in foreign currencies, is expected to be low. The basis swaps designated as hedging instruments are recorded at fair value. There may be significant variations in the value of the basis swaps from day-to-day due to increases or reductions in the spreads, which causes unrealized gains and losses in the income statement. Gains and losses from such instruments tend to vary considerably from quarter to quarter and will typically be reversed in subsequent periods due to stabilizing markets or because the maturity dates of the instruments are approaching. F
or p
erso
nal u
se o
nly

DNB Boligkreditt first quarter report 2013 Unaudited 11
Note 6 Liquidity risk
Liquidity risk is defined as the risk that the company will encounter difficulty in meeting obligations associated with financial liabilities that are settled by delivering cash or another financial asset. Liquidity risk arises because of the possibility that the company might be unable to meet its payment obligations when they fall due. The Board of Directors sets annual limits for the company's liquidity risk, which means preparing liquidity risk limits, contingency plans, organisational aspects and responsibilities, forecasts, stress tests, routines for monitoring limit utilisation and compliance with guidelines, management reporting and independent monitoring of management and control systems. Covered bonds are the company's primary source of funding. According to Section 2-32 of the Financial Institutions Act: "the mortgage institution shall ensure that payment flows from the cover assets at all times enable the mortgage institution to meet its payment obligations to the owners of bonds with preferential rights and counterparties in derivative agreements".The company's Board of Directors has decided that the company shall, at all times, have positive cash flows within the next 12 months. In a situation where the net cash flow from the lending and funding activities is negative, the company has a long-term overdraft facility in DNB ASA with a total limit of NOK 160 billion. According to Section 6 in the regulations on sound liquidity management, "the institution shall analyze the liquidity situation by means of stress tests, which must be adapted to the scope, complexity and risk of operations. Experience from the stress tests shall be used when the Board of Directors considers the liquidity strategy and approves liquidity risk limits". As part of its liquidity risk management, the company prepares liquidity stress tests with quarterly reporting to the Board of Directors. Important parameters in the stress tests are developments in non-performing volume and reductions in housing prices. DNB Boligkreditt AS's liquidity situation at the end of first quarter 2013 can be characterised as sound.
Note 7 Net interest income
DNB Boligkreditt AS
1st quarter 1st quarter Full year Amounts in NOK 1 000 2013 2012 2012 Interest on amounts due from credit institutions 15 921 17 808 33 769 Interest on loans to customers 4 753 068 4 571 037 18 728 736 Front-end fees etc. 2 244 4 817 16 948 Other interest income 48 918 42 999 181 113 Total interest income 4 820 150 4 636 661 18 960 566 Interest on amounts due to credit institutions 554 922 633 998 2 473 577 Interest on debt securities issued 2 467 269 2 828 123 10 540 298 Interest on subordinated loan capital 22 965 31 610 113 587 Net interest income/expenses, derivatives 318 605 516 128 1 802 301 Total interest expenses 3 363 762 4 009 859 14 929 763 Net interest income 1 456 387 626 802 4 030 802
For
per
sona
l use
onl
y

12 Unaudited DNB Boligkreditt first quarter report 2013
Note 8 Net gains on financial instruments
DNB Boligkreditt AS
1st quarter 1st quarter Full year Amounts in NOK 1 000 2013 2012 2012 Net gains on loans at fair value (fixed-rate loans) 1) 103 315 (298 116) 551 654 Net gains on financial liabilities (long-term borrowing in NOK) 2) (9 488) (915 290) (2 581 106) Total gains on financial instruments, designated as at fair value 93 827 (1 213 405) (2 029 452) Net gains on foreign exchange and financial derivatives, trading 3) (163 831) (1 943 794) (1 513 180) Net gains on financial derivatives, hedging 4) 5) (1 207 216) 78 878 6 061 808 Net gains on financial liabilities, hedged items 4) 5) 1 207 216 (78 878) (6 061 808) Net gains (losses) on financial instruments at fair value (70 003) (3 157 199) (3 542 632) 1) DNB Boligkreditt’s fixed-rate loans are measured at fair value. Increased interest rates, including credit margins, will reduce the fair value of already
originated loans. However, new loans granted with a higher interest rate, including credit margin, will over time lead to increased interest income. The fair value adjustments of the company’s fixed-rate loans are reversed over the loans’ remaining term to maturity.
2) DNB Boligkreditt’s long-term borrowing in Norwegian kroner is carried at fair value. The market value of such funding is impacted by the interest rate, including own credit risk premium. Reduced interest rates, including own credit risk premium, will increase the fair value of already issued Norwegian kroner liabilities. However, new funding issued at lower credit risk premiums will over time lead to decreased interest expenses. The fair value adjustments of the company’s Norwegian kroner debt are reversed over the loans’ remaining term to maturity. There was a NOK 90.4 million increase in market values in the first quarter of 2013 (negative effect on profits) due to such credit risk premium effects, compared with a NOK 1 079.4 increase in market values in the first quarter of 2012. Accumulated positive mark-to-market effects at the end of first quarter 2013 were NOK 11.7 million in underlying money market rates.
3) DNB Boligkreditt enters into swaps to manage interest-rate risk for the fixed-rate loans and bonds issued in Norwegian kroner. Such derivatives are recorded
at fair value. Additionally, the company enters into basis swaps to manage foreign currency risk and interest rate risk from DNB Boligkreditt’s long-term borrowing in
foreign currencies. DNB Boligkreditt’s long-term borrowing in foreign currencies is converted to Norwegian kroner by means of cross-currency basis swaps with the same maturities. For funding in Euro, basis swaps from Euro to Norwegian kroner are entered into. These derivatives are carried at fair value. There may be significant variations in the value of the basis swaps from day to day, due to changes in basis swap spreads. This unhedged risk causes unrealised gains and losses in the total comprehensive income for the period. The hedge relationships are set up at the time of issuing the bonds and are continuously monitored until maturity. There was a NOK 257.5 million decrease in market values in the first quarter of 2013 (negative effect on profits) due to such basis swap spread effects, compared with a NOK 1 731.2 decrease in the first quarter of 2012. Accumulated positive mark-to-market effects by the end of first quarter 2013 were NOK 977.4 million.
4) Derivatives that are designated as hedging instruments in hedging relationships are recorded at fair value. Changes in fair value arising from hedged risk are
presented under Net gains on financial derivatives, hedging. 5) DNB Boligkreditt uses hedge accounting with respect to long-term borrowing in foreign currencies. With respect to hedged liabilities, the change in fair value
of the hedged items due to the hedged risk is charged to profit or loss. Foreign currency borrowing is hedged with swaps ensuring a high correlation between currencies and interest rates in the hedged items and the hedging instruments. In the table, the interest rate exposure of the NOK leg of the interest rate swaps is included in changes in value of the hedging instrument. However, the NOK leg of the hedging transaction will be exposed to three-month interest rates. This effect is included as part of “net gains on foreign exchange and financial derivatives, trading”, together with basis swap spread effects.
Note 9 Operating expenses
DNB Boligkreditt AS
1st quarter 1st quarter Full year Amounts in NOK 1 000 2013 2012 2) 2012 2)
Ordinary salaries 2 927 3 122 12 221 Employer's national insurance contributions 488 457 1 778 Severance package 4 780 - - Pension expenses 1 508 1 360 3 305 Social expenses 450 493 1 928 Salaries and other personnel expenses 10 154 5 432 19 233
Fees 1) 1 060 354 279 121 2 569 695 Other operating expenses 342 304 3 362 Other expenses 1 060 696 279 425 2 573 057
Operating expenses 1 070 849 284 857 2 592 290 1) Fees are mainly management fees paid to DNB Bank ASA for services rendered according to the management agreement. See also note 15. 2) Due to changes in principles, some comparative figures have been restated. See further details in note 1 Accounting principles.
For
per
sona
l use
onl
y

DNB Boligkreditt first quarter report 2013 Unaudited 13
Note 10 Loans to customers
DNB Boligkreditt AS
31 March 31 Dec. 31 MarchAmounts in NOK 1 000 2013 2012 2012 Loans to customers at amortised cost, nominal amount 447 708 943 444 788 951 424 562 926 – Individual impairments 40 981 13 849 40 896 Loans to customers, net of impairment allowances 447 667 962 444 775 102 424 522 030 + Accrued interest 927 032 815 223 900 058 – Individual impairments on accrued interest 37 985 39 245 37 589 Loans to customers, at amortised cost 448 557 009 445 551 080 425 384 498
Loans to customers at fair value, nominal amount 75 897 676 72 729 028 54 507 090 – Individual impairments 3 811 31 631 105 Loans to customers, net of impairment allowances 75 893 865 72 697 397 54 506 985 + Accrued interest 170 787 147 169 117 806 + Adjustment to fair value 1 192 222 1 088 907 239 137 Loans to customers, at fair value 77 256 874 73 933 472 54 863 928
– Collective impairments 112 257 122 146 134 994 Total loans to customers 525 701 626 519 362 406 480 113 433
Impairment allowances DNB Boligkreditt AS
31 March 31 Dec. 31 March Amounts in NOK 1 000 2013 2012 2012 Individual impairments 44 792 45 480 41 001 Individual impairments on accrued interest 37 985 39 245 37 589 Collective impairments 112 257 122 146 134 994 Impairment allowances as at end of period 195 034 206 871 213 584
Impairment expenses for the period DNB Boligkreditt AS
1st quarter 1st quarter Full year Amounts in NOK 1 000 2013 2012 2012 Individual impairments 3 287 807 27 072 Collective impairments 1) (9 889) (1 592) (14 439) Recoveries of previous write-offs (524) (912) (4 559) Impairment expenses for the period (7 126) (1 697) 8 074 1) Based on the DNB Group’s calculation model and statistics. Further information about collective impairments can be found in note 1 Accounting principles.
For
per
sona
l use
onl
y
14 Unaudited DNB Boligkreditt first quarter report 2013
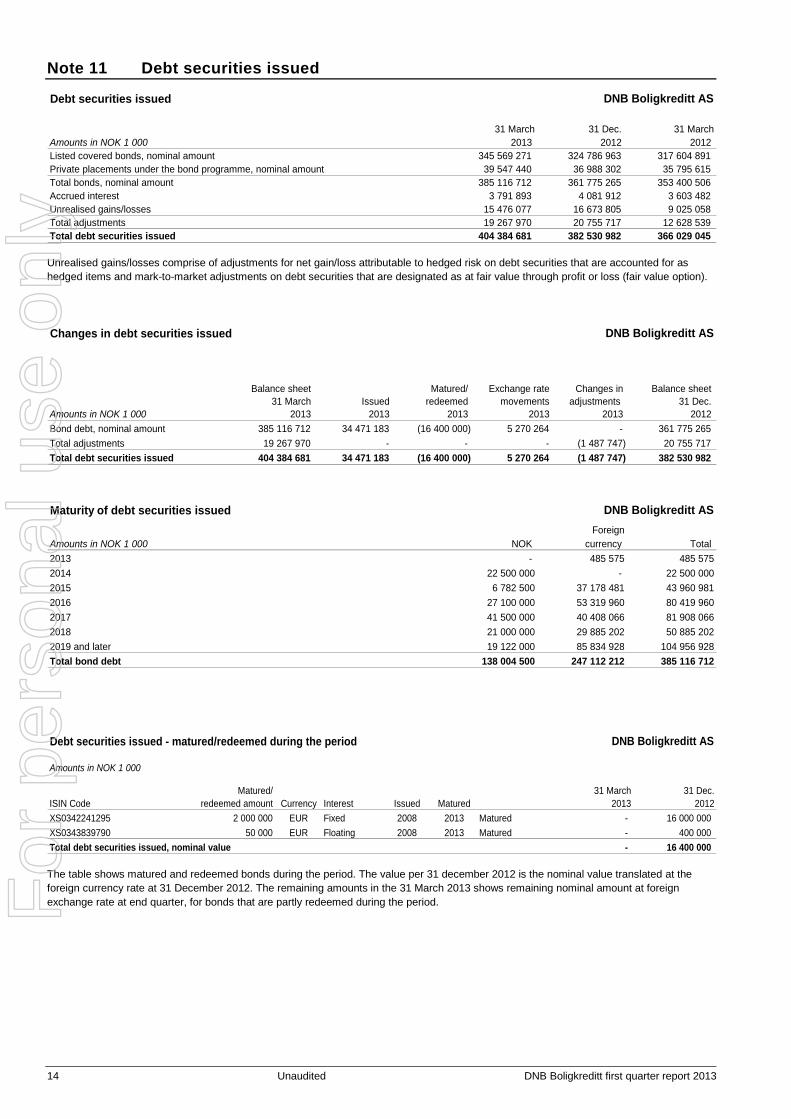
Note 11 Debt securities issued
Debt securities issued DNB Boligkreditt AS
31 March 31 Dec. 31 MarchAmounts in NOK 1 000 2013 2012 2012 Listed covered bonds, nominal amount 345 569 271 324 786 963 317 604 891 Private placements under the bond programme, nominal amount 39 547 440 36 988 302 35 795 615 Total bonds, nominal amount 385 116 712 361 775 265 353 400 506 Accrued interest 3 791 893 4 081 912 3 603 482 Unrealised gains/losses 15 476 077 16 673 805 9 025 058 Total adjustments 19 267 970 20 755 717 12 628 539 Total debt securities issued 404 384 681 382 530 982 366 029 045 Unrealised gains/losses comprise of adjustments for net gain/loss attributable to hedged risk on debt securities that are accounted for as hedged items and mark-to-market adjustments on debt securities that are designated as at fair value through profit or loss (fair value option). Changes in debt securities issued DNB Boligkreditt AS
Balance sheet Matured/ Exchange rate Changes in Balance sheet 31 March Issued redeemed movements adjustments 31 Dec.
Amounts in NOK 1 000 2013 2013 2013 2013 2013 2012 Bond debt, nominal amount 385 116 712 34 471 183 (16 400 000) 5 270 264 - 361 775 265 Total adjustments 19 267 970 - - - (1 487 747) 20 755 717 Total debt securities issued 404 384 681 34 471 183 (16 400 000) 5 270 264 (1 487 747) 382 530 982 Maturity of debt securities issued DNB Boligkreditt AS
ForeignAmounts in NOK 1 000 NOK currency Total 2013 - 485 575 485 5752014 22 500 000 - 22 500 0002015 6 782 500 37 178 481 43 960 9812016 27 100 000 53 319 960 80 419 9602017 41 500 000 40 408 066 81 908 0662018 21 000 000 29 885 202 50 885 2022019 and later 19 122 000 85 834 928 104 956 928Total bond debt 138 004 500 247 112 212 385 116 712 Debt securities issued - matured/redeemed during the period DNB Boligkreditt AS
Amounts in NOK 1 000
ISIN CodeMatured/
redeemed amount Currency Interest Issued Matured31 March
2013 31 Dec.
2012 XS0342241295 2 000 000 EUR Fixed 2008 2013 Matured - 16 000 000 XS0343839790 50 000 EUR Floating 2008 2013 Matured - 400 000 Total debt securities issued, nominal value - 16 400 000 The table shows matured and redeemed bonds during the period. The value per 31 december 2012 is the nominal value translated at the foreign currency rate at 31 December 2012. The remaining amounts in the 31 March 2013 shows remaining nominal amount at foreign exchange rate at end quarter, for bonds that are partly redeemed during the period. F
or p
erso
nal u
se o
nly

DNB Boligkreditt first quarter report 2013 Unaudited 15
Note 11 Debt securities issued (continued) Cover pool DNB Boligkreditt AS
31 March 31 Dec. 31 March Amounts in NOK 1 000 2013 2012 2012 Pool of eligible loans 521 837 810 514 748 331 472 851 702Market value of eligible derivatives 9 817 832 5 408 840 6 199 293Supplementary assets - - - Total collateralised assets 531 655 642 520 157 171 479 050 996
Debt securities issued, carrying value 404 384 681 382 530 982 366 029 045Less valuation changes attributable to changes in credit risk on debt carried at fair value (239 161) (158 896) 1 050 896 Debt securities issued, valued according to regulation 1) 404 145 520 382 372 086 367 079 941
Collateralisation (per cent) 131.6 136.0 131.0 1) The debt securities issued are bonds with preferred rights in the appurtenant cover pool. The composition and calculation of values in the cover pool are
defined in Sections 2-28 and 2-31 of the Financial Institutions Act with appurtenant regulations.
Note 12 Subordinated capital
DNB Boligkreditt AS
Issue Maturity 31 March 31 Dec. 31 MarchAmounts in NOK 1 000 Nominal Currency Interest rate date date 2013 2012 2012 Term subordinated loan capital 300 000 NOK 3 month Nibor + 75 bp 2007 2017 0 0 300 000Term subordinated loan capital 1 200 000 NOK 3 month Nibor + 152 bp 2008 2018 1 200 000 1 200 000 1 200 000Term subordinated loan capital 850 000 NOK 3 month Nibor + 400 bp 2009 2019 850 000 850 000 850 000Accrued interest 8 106 8 313 9 591Total 2 058 106 2 058 313 2 359 591
For
per
sona
l use
onl
y

16 Unaudited DNB Boligkreditt first quarter report 2013
Note 13 Financial instruments at fair value
The company uses the following hierarchy for determining and disclosing the fair value of financial instruments by valuation technique: Level 1 Valuation based on quoted, unadjusted prices in active markets for identical assets and liabilities. DNB Boligkreditt has no financial instruments in this category. Level 2 Other techniques for which all inputs that have a significant effect on the recorded fair value are observable, either directly or indirectly. Valuation of interest rate swaps and currency swaps is based on level 2 techniques. The valuation is based on swap curves that are based on observable market prices. Credit risk is considered to have an insignificant effect on the fair value. Debt securities issued in Norwegian kroner are also measured at fair value based on level 2 techniques. The valuation of the bonds is primarily based on observable market data in the form of interest rate curves and credit margins. Level 3 Techniques for which inputs that have a significant effect on the recorded fair value are not based on observable market data. Loans to customers at fixed interest rates are measured at fair value based on level 3 techniques. The credit margin constitutes a major part of adjustments to fair value. Financial instruments at fair value, by valuation technique (fair value hierarchy)
As at 31 March 2013 DNB Boligkreditt ASValuation Valuation based on Valuation based on
quoted prices based on other than in an activa observable observable
market market data market data Accrued Amounts in NOK 1 000 Level 1 Level 2 Level 3 interest 1) Total
AssetsLoans to customers - - 77 089 898 170 787 77 260 685 Financial derivatives - 29 185 706 - - 29 185 706
LiabilitiesDebt securities issued - 139 791 871 - 821 828 140 613 699 Financial derivatives - 19 368 487 - - 19 368 487 1) For financial derivatives, accrued interest on financial derivatives is included in the level 2- and level 3 amounts. Loans to customers The portfolio of loans carried at fair value consists primarily of fixed-rate loans in Norwegian kroner and a share of margin loans in Norwegian kroner. The value of fixed-rate loans is determined by discounting agreed interest flows over the term of the loan, using a discount factor adjusted for margin requirements. The assumptions underlying the calculation of the margin requirement are based on a review of the market conditions on the balance sheet date and on an assessment of the deliberations made by external investors when investing in a corresponding portfolio. A margin requirement is calculated for margin loans, and the difference between the margin requirement and the agreed margin is discounted over the average expected time to the repricing of the loan.
For
per
sona
l use
onl
y

DNB Boligkreditt first quarter report 2013 Unaudited 17
Note 14 Fair value of financial instruments at amortised cost
Most assets and liabilities in the DNB Boligkreditt's balance sheet are carried at amortised cost. Amortised cost is the historical cost of the asset or liability at initial recognition, adjusted for repayments of principal, amortisations based on the effective interest rate method and impairments. The value is not based on current market conditions, but rather accounted for based on the originally agreed terms, so in general there will be a difference between the amortised cost value and market value. The difference is mainly related to changes in interest rates and credit risk. Fair value includes both positive and negative value changes in interest- and credit risk while amortised cost is not adjusted for positive value changes and only to some extent adjusted for negative value changes through impairment. The table shows estimated fair values of items carried at amortised cost. Values are measured based on the valuation methods described in note 13. Fair value of financial instruments at amortised cost DNB Boligkreditt AS
Carryingvalue Fair value
Amounts in NOK 1 000 31 March 2013 31 March 2013 Due from credit institutions 1 379 957 1 379 957 Loans to customers 448 440 941 448 440 941 Total financial assets 449 820 898 449 820 898 Due to credit institutions 107 031 618 107 031 618 Debt securities issued 250 082 276 252 717 110 Subordinated loan capital 2 058 106 2 067 741 Total financial liabilities 359 172 001 361 816 469 For floating rate loans to customers, the interest rates and margins are changed when the market rates change. The customers have to be notified of all changes in advance of the changes being put into effect, so there is a short period of time where the terms of the loans diverge from market rates. However this delay in timing is considered to have an immaterial effect to the total value of the loans hence the carrying value of these loans are considered to be a relevant measure for fair value. Debt securities issued that are carried at amortised cost are subject to hedge accounting. The hedge relationships between the bonds and their designated cross currency interest rate swaps are considered to be effective and accounted for as fair value hedges. The amortised cost value is adjusted by the fair value change of the hedged risk. As the hedging is considered to change the terms related to interest and currency for the bonds to market terms at each reporting date, the carrying value in the balance sheet is considered being adjusted for changes in interest rates and currency. However, changes in credit risk are not accounted for. Subordinated loan capital is at floating interest rates and carried at amortised cost. Loans due to credit institutions are mainly at floating interest rates and carried at amortised cost, which is considered not to diverge significantly from fair value.
For
per
sona
l use
onl
y

18 Unaudited DNB Boligkreditt first quarter report 2013
Note 15 Related parties
DNB Boligkreditt AS is a subsidiary within the DNB Group. During the quarter many transactions, mostly related to the ordinary course of business, take place between DNB Boligkreditt and other group entities. All transactions are at markets terms. Major transactions with related parties: DNB Bank ASA DNB Bank ASA (the bank) is the parent of DNB Boligkreditt. As part of ordinary business transactions, a large number of banking transactions are entered into between DNB Boligkreditt and the bank, including loans, deposits and financial derivatives used in currency and interest rate risk management. All transactions are carried out at market terms, and regulated in the ”Agreement relating to transfer of loan portfolio between DNB Bank ASA and DNB Boligkreditt AS” (the transfer agreement) and the ”Contract concerning purchase of management services” (the management agreement). The transfer agreement regulates the transfer of loan portfolios qualifying as collateral for the issue of covered bonds. During the first quarter of 2013, portfolios of NOK 4.1 billion were transferred from the bank to DNB Boligkreditt. Pursuant to the management agreement, DNB Boligkreditt purchases services from the bank, including administration, bank production, distribution, customer contact, IT operations, financial and liquidity management. DNB Boligkreditt pays a monthly management fee for these services based on the lending volume under management and the achieved lending spreads. The management fee paid is recognised as “Other expences” in the statement of comprehensive income and amounted to NOK 1 057.2 million for the first quarter of 2013 (NOK 269.1 million for the first quarter of 2012). In the balance sheet ”Due from credit institutions” and “Due to credit institutions” are solely outstandings with DNB Bank. All derivative contracts are with DNB Bank as counterparty. At end-March, the bank had invested NOK 85.6 billion in covered bonds issued by DNB Boligkreditt. DNB Livsforsikring ASA As part of the company's ordinary investment activity, DNB Livsforsikring has subscribed for covered bonds issued by DNB Boligkreditt. At end-March 2013, DNB Livsforsikring's holding of listed DNB Boligkreditt bonds was valued at NOK 4.9 billion. DNB Næringskreditt AS DNB Næringskreditt has no employees and purchases administrative services from DNB Boligkreditt. The fee received for such services is recognised as “Other income” in the income statement and amounted to NOK 2.8 million for the first quarter of 2013.
Note 16 Contingencies and post balance sheet events DNB Boligkreditt is not involved in any legal actions
For
per
sona
l use
onl
y

DNB Boligkreditt first quarter report 2013 Unaudited 19
Key figures DNB Boligkreditt AS
1st quarter 1st quarter Full year 2013 2012 2) 2012 2)
1. Return on equity, annualised (%) 1) 4.5 (48.3) (3.5)
2. Core (Tier 1) capital ratio at end of period (%) 2) 10.3 3.8 4.63. Capital adequacy ratio at end of period (%) 2) 11.2 4.2 5.04. Core capital at end of period (NOK 1000) 22 113 635 16 397 484 22 024 9105. Risk-weighted volume at end of period (NOK 1000) 214 968 090 195 889 321 213 870 241
6. Impairment relative to net loans to customers, annualised (0.00) (0.00) 0.007. Non-performing and impaired loans, per cent of gross loans 0.21 0.23 0.238. Non-performing and impaired loans gross (NOK 1 000) 1 100 470 1 080 762 1 190 857
9. Number of full-time positions at end of period 11 12 12 1) Average equity is calculated on the basis of book value of equity. 2) Due to changes in principles, some comparative figures have been restated. See further details in note 1 Accounting principles.
For
per
sona
l use
onl
y

20 Unaudited DNB Boligkreditt first quarter report 2013
Profit and balance sheet trends Income statement and Statement of comprehensive income
DNB Boligkreditt AS
1st quarter 4th quarter 3rd quarter 2nd quarter 1st quarter Amounts in NOK 1 000 2013 2012 1) 2012 2012 2012 Total interest income 4 820 150 4 876 815 4 751 542 4 695 548 4 636 661 Total interest expenses 3 363 762 3 501 660 3 720 711 3 697 533 4 009 859 Net interest income 1 456 387 1 375 154 1 030 831 998 015 626 802 Commission and fee income 15 880 18 927 18 571 18 145 14 722 Commission and fee expenses 479 455 447 453 459 Net gains (losses) on financial instruments at fair value (70 003) (112 339) (765 249) 492 155 (3 157 199) Other income 2 776 1 200 1 268 1 310 1 616 Net other operating income (51 827) (92 667) (745 857) 511 157 (3 141 319) Total income 1 404 561 1 282 487 284 974 1 509 172 (2 514 517) Salaries and other personnel expenses 10 154 5 194 3 578 5 002 5 459 Other expenses 1 060 696 998 335 698 414 596 883 279 425 Total operating expenses 1 070 849 1 003 529 701 992 601 885 284 884 Impairments on loans and commitments (7 126) 9 823 (7 810) 7 758 (1 697) Pre-tax operating profit 340 837 269 136 (409 208) 899 529 (2 797 705) Taxes 95 626 75 292 (114 578) 251 868 (783 357) Profit for the period 245 211 193 844 (294 630) 647 661 (2 014 347) Other comprehensive income - 6 305 - - - Total comprehensive income for the period 245 211 200 149 (294 630) 647 661 (2 014 347) 1) Due to changes in principles, some comparative figures have been restated. See further details in note 1 Accounting principles.
Balance sheet DNB Boligkreditt AS
31 March 31 Dec. 30 Sept. 30 June 31 March Amounts in NOK 1 000 2013 2012 1) 2012 1) 2012 1) 2012 1)
AssetsDue from credit institutions 1 379 957 13 098 740 216 754 1 775 132 398 140 Loans to customers 525 701 626 519 362 406 512 111 624 496 659 687 480 113 433 Financial derivatives 29 185 706 29 651 578 29 469 666 28 471 729 24 511 598 Other assets (378) 5 382 8 745 9 225 11 687 Deferred tax assets 7 494 - - - Total assets 556 274 405 562 118 106 541 806 789 526 915 773 505 034 858
Liabilities and equityDue to credit institutions 107 031 618 130 128 238 122 663 187 104 432 485 99 097 087 Financial derivatives 19 368 487 24 243 408 23 454 955 20 791 713 18 314 798 Debt securities issued 404 384 681 382 530 982 370 254 176 380 152 780 366 029 045 Payable taxes 507 187 285 527 - - 286 373 Deferred taxes - 159 460 436 366 550 944 204 702 Other liabilities 333 126 374 143 493 958 188 565 230 577 Provisions 34 283 26 326 34 082 34 082 34 082 Subordinated loan capital 2 058 106 2 058 313 2 358 431 2 358 938 2 359 591 Total liabilities 533 717 488 539 806 398 519 695 155 508 509 508 486 556 255
Share capital 2 527 000 2 527 000 2 527 000 2 127 000 2 127 000 Share premium reserve 16 893 000 16 893 000 16 893 000 13 293 000 13 293 000 Retained earnings 3 136 918 2 891 707 2 691 635 2 986 265 3 058 605 Total equity 22 556 918 22 311 707 22 111 635 18 406 265 18 478 605 Total liabilities and equity 556 274 405 562 118 106 541 806 789 526 915 773 505 034 858 1) Due to changes in principles, some comparative figures have been restated. See further details in note 1 Accounting principles.
For
per
sona
l use
onl
y

DNB Boligkreditt first quarter report 2013 Unaudited 21
Contact information DNB Boligkreditt AS Mailing address P.O.Box 1600 Sentrum, NO-0021 Oslo Visiting address Dronning Eufemias gate 30, Oslo Telephone +47 915 03000 Internet dnb.no Organisation number 985 621 551 Chief executive officer Øyvind Birkeland Tel: +47 950 59 700 [email protected] Financial reporting Roar Sørensen Tel: +47 934 79 616 [email protected] Rating and investor information Håkon Røsand Tel: +47 906 16 892 [email protected]
DNB ASA Mailing address P.O.Box 1600 Sentrum, NO-0021 Oslo Visiting address Dronning Eufemias gate 30, Oslo Telephone +47 915 03000 Internet dnb.no Organisation number NO 981 276 957 DNB Bank ASA Mailing address P.O.Box 1600 Sentrum, NO-0021 Oslo Visiting address Dronning Eufemias gate 30, Oslo Telephone +47 915 03000 Internet dnb.no Organisation number NO 984 851 006
Other sources of information Annual and quarterly reports DNB Boligkreditt AS is part of the DNB Bank Group and the DNB Group. Annual and quarterly reports for DNB Boligkreditt AS, the DNB Bank Group and the DNB Group are available on www.dnb.no.
For
per
sona
l use
onl
y

1
DN
B P&D
WEI Q
ING
DN
B BOLIG
KRED
ITT AS –
a company in the D
NB G
roup
First quarter 2013
DNB Boligkreditt AS Mailing address:P.O.Box 1600 SentrumN-0021 Oslo Visiting address:Dronning Eufemias gate 30Bjørvika, Oslo dnb.no
For
per
sona
l use
onl
y