dmt measurement considerations
TRANSCRIPT
DMT Measurement Considerations
Test & Measurement of Multilevel Signals for 400 GbE Discrete Multi-Tone and PAM-X
Greg LeCheminant, Bernd Nebendahl, Rolf Steiner
Agilent Technologies (Keysight Technologies as of August 1)
July 9, 2014
IEEE802.3bs 400GbE Task Force
1

Contributors and Supporters
Greg LeCheminant Agilent
Bernd Nebendahl Agilent
Rolf Steiner Agilent
Patricia Bower Fujitsu Semiconductor
Paul Little Fujitsu Semiconductor
Ian Dedic Fujitsu Semiconductor
Markus Weber Fujitsu Semiconductor
Tomoo Takahara Fujitsu Limited
Beck Mason JDSU
David Lewis JDSU
Sacha Corbeil JDSU
July 9, 2014
IEEE802.3bs 400GbE Task Force
2

Principle of DMT (Recap)
July 9, 2014
IEEE802.3bs 400GbE Task Force
3
picture source: IEEE302.3 Norfolk interim meeting, Fujitsu presentation
• DMT (Discrete Multi-Tone) aka OFDM (Orthogonal Frequency Division Multiplex)
is widely used in wireline (ADSL, VDSL, G-fast) or wireless (DAB, DVB-T, WLAN,
3GPP LTE, WiMAX, ...)
• Effective usage of impaired channels by the use of orthogonal subcarriers with
individual bit and power allocation
• Test Solutions for standardized formats are available today

DMT Test Challenge
• Complete solution includes analysis of both the receiver and the transmitter
This presentation: Focus on characterization of the transmitter
• Either optical or electrical signals can be acquired using a real time scope (see
example below for a typical DMT time domain signal)
July 9, 2014
IEEE802.3bs 400GbE Task Force
4
picture source: IEEE302.3 Norfolk interim meeting, Fujitsu presentation
electrical
probe
optical
probe
electrical
stimulus
optical
stimulus
typical DMT signal
Conclusion: The raw measurement in time domain yields very limited
information aside from an upper-bound to the optical modulation amplitude!
Useful information is obtained through post processing the time record

DMT Test Receiver Requirements
• To receive the signals the bandwidth of the digitizer (real-time sampling scope) should be at least the Nyquist frequency of the DAC that was used to generate the DMT signal. For a 63 GS/s DAC (number from JDSU’s presentation) the bandwidth of the digitizer should be ≥ 31.5 GHz
• Scope vertical resolution equal to the resolution of the DAC generating the signals is considered to be sufficient (typically 8 bit)
• Sampling time to be able to decode nSym DMT symbols (nFFT = FFT size)
tsampling = 1/fDAC ∙ nSym ∙ nFFT
• required number of samples
nsampling = fADC ∙ tsampling
July 9, 2014
IEEE802.3bs 400GbE Task Force
5
DMT signal example:
nSym = 50
nFFT = 512
fDAC = 63 GS/s
tsampling = 406ns
fADC = 80GS/s
nsampling = 32480
DMT Analysis Software
• Physical layer testing and analysis of DMT signals requires
to know bit allocation, subcarrier allocation, FFT size, cyclic
prefix, system sampling frequency, and other parameters
• Without standardization any DMT link start sequence should
be excluded from physical layer testing
Because we are lacking a standard a general purpose
DMT (OFDM) decoder is required to be able to analyze
the signals
July 9, 2014
IEEE802.3bs 400GbE Task Force
6

DMT Analysis fundamentals
• Resample the data to the DMT system sample frequency
• Find the FFT frames using a suitable synchronization method (for non-bursted signals w/o preamble take advantage of cyclic prefixing of the FFT frame)
• FFT on raw waveform record, the resulting coefficients are the raw complex amplitudes of each subcarrier
• Add a linear phase (mathematically equal to adjusting the sampling phase) to correct the phase of the known pilots
• Equalize for amplitude and phase response, take advantage of the fact that the modulation is known for pilots and data subcarriers
• Extract quality metrics like EVM
• Virtually identical to methods used to analyze signals in LTE, WLAN 802.11, WiMAX 802.16
• Analysis tools already exist and require minor modification for DMT analysis
July 9, 2014
IEEE802.3bs 400GbE Task Force
7

DMT Analysis Results
Typical results available from T&M OFDM decoders
• constellation diagram per subcarrier (SC)
• channel response (amplitude and phase from equalizer)
• received spectrum and time domain waveform
• received data stream ( path to BER testing)
• error vector magnitude (EVM) vs. time
• EVM per SC
• ...
For physical layer testing EVM is a widely used metric
also in other OFDM based standards
July 9, 2014
IEEE802.3bs 400GbE Task Force
8
DMT Analysis Software Example
July 9, 2014
IEEE802.3bs 400GbE Task Force
9
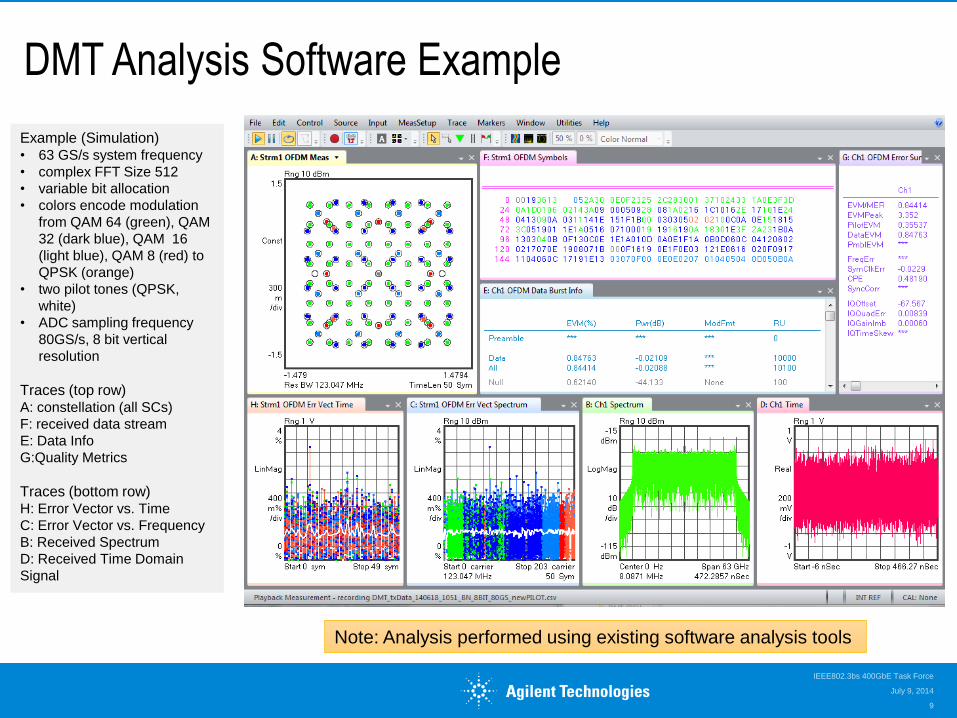
Example (Simulation) • 63 GS/s system frequency
• complex FFT Size 512
• variable bit allocation
• colors encode modulation
from QAM 64 (green), QAM
32 (dark blue), QAM 16
(light blue), QAM 8 (red) to
QPSK (orange)
• two pilot tones (QPSK,
white)
• ADC sampling frequency
80GS/s, 8 bit vertical
resolution
Traces (top row) A: constellation (all SCs)
F: received data stream
E: Data Info
G:Quality Metrics
Traces (bottom row) H: Error Vector vs. Time
C: Error Vector vs. Frequency
B: Received Spectrum
D: Received Time Domain
Signal
Note: Analysis performed using existing software analysis tools

DMT transmitter measurement conclusions
• DMT signals require different test and analysis methods
compared to more common optical communications signals
• Existing test solutions developed for similar technologies can
be leveraged for DMT analysis
• If 802.3bs employs DMT, analysis is simplified if specific test
modes are allowed that minimize or do not require link
training to achieve a specific transmitter state
July 9, 2014
IEEE802.3bs 400GbE Task Force
10

Extending DMT measurement process to PAM
• Physical layer testing and analysis of PAM-X signals requires
knowledge of the number of signal levels, symbol rate, and
possibly time domain pulse shaping if applicable
• Oscilloscopes will evolve to provide fundamental PAM-N
analysis as system and component designers along with
T&M providers determine essential metrics
DMT analysis process configured with available custom IQ
decoders allows PAM-X decoding
.
July 9, 2014
IEEE802.3bs 400GbE Task Force
11

PAM-X Analysis Results
Typical results available from T&M Custom IQ decoders
• channel response (amplitude and phase from equalizer)
• received spectrum and time domain waveform
• received data stream ( path to BER testing)
• magnitude error vs. time
• SNR
• Likely provides a complementary set of measurements to those provided
by sampling and real-time oscilloscopes
July 9, 2014
IEEE802.3bs 400GbE Task Force
12

PAM-4 Analysis Software Example
July 9, 2014
IEEE802.3bs 400GbE Task Force
13
Example (Measurement) • 10 GBaud symbol rate
• NRZ-OOK with no
pulse shaping
Traces (top row) A: Color coded eye
diagram
B: signal metrics and
received data stream
Traces (bottom row) C: Received signal
spectrum
E: Received Time Domain
Signal
Note: Using existing software tools

Conclusion
• Test and solutions for DMT signals are available today (and
can be extended to PAM-X)
• Support will be provided to the standard to ensure testability
of the signals.
July 9, 2014
IEEE802.3bs 400GbE Task Force
14