dms functions edits jim reilly alm vs proof jr 3nov chen ... · 2.24 dispatcher training simulator...
TRANSCRIPT


iii
FOUNDATIONAL REPORT SERIES
DISTRIBUTION MANAGEMENT SYSTEMS FOR GRID MODERNIZATION
This is one of seven reports on distribution management systems (DMS), their functions, implementation, and importance for grid modernization. The reports on DMS in this numbered series of Argonne reports are as follows:
1. Importance of DMS for Distribution Grid Modernization (ANL/ESD-15/16)
2. DMS Functions (ANL/ESD-15/17)
3. High-Level Use Cases for DMS (To Be Published)
4. Business Case Calculations for DMS (To Be Published)
5. Implementation Strategy for DMS (To Be Published)
6. DMS Integration of Microgrids and DER (To Be Published)
7. DMS Industry Survey (To Be Published)

iv
This page is intentionally left blank.

v
CONTENTS
ACKNOWLEDGMENT............................................................................................................... vii
LIST OF ACRONYMS AND ABBREVIATIONS .................................................................... viii
DISTRIBUTION MANAGEMENT SYSTEMS FOR GRID MODERNIZATION: DISTRIBUTION MANAGEMENT SYSTEM FUNCTIONS ...................................................... 1
1 INTRODUCTION ................................................................................................................... 1 1.1 What is a DMS? .............................................................................................................. 1
1.1.1 DMS Basic Building Blocks .............................................................................. 2 1.1.1.1 Distribution SCADA System .............................................................. 2 1.1.1.2 Advanced Distribution Applications ................................................... 4 1.1.1.3 Interfaces to External Systems ............................................................ 6
2 DMS APPLICATION FUNCTIONS ...................................................................................... 9 2.1 Data Acquisition and Control ......................................................................................... 9 2.2 State Estimation ............................................................................................................ 12 2.3 Graphical User Interface (GUI) .................................................................................... 13 2.4 Historical Information System (HIS) ............................................................................ 15 2.5 Distribution System Model ........................................................................................... 16
2.5.1 Modeling the Transmission System ................................................................. 19 2.5.2 Modeling the Substations ................................................................................. 19 2.5.3 Modeling the Distribution Secondary Circuits ................................................. 19
2.6 Load Models ................................................................................................................. 21 2.6.1 Electronic Map/Model Updates ........................................................................ 23
2.7 Topology Processor ...................................................................................................... 24 2.8 On-Line Distribution Power Flow ................................................................................ 26 2.9 Intelligent Alarm Processing ........................................................................................ 27 2.10 Tagging, Permits, and Clearances ................................................................................. 28 2.11 Short-Circuit Analysis .................................................................................................. 29 2.12 Switch Order Management ........................................................................................... 29 2.13 Volt-VAR Optimization ............................................................................................... 31 2.14 Fault Location, Isolation, and Service Restoration ....................................................... 33 2.15 Predictive Fault Location .............................................................................................. 34 2.16 Optimal Network Reconfiguration ............................................................................... 36 2.17 Short-Term Load Forecasting ....................................................................................... 37 2.18 Dynamic Equipment Rating .......................................................................................... 37 2.19 DMS Control of Protection Settings ............................................................................. 38 2.20 Distributed Energy Resource Management .................................................................. 38 2.21 Demand Response Management ................................................................................... 40 2.22 Emergency Load Shedding ........................................................................................... 41 2.23 Smart EV Charging ....................................................................................................... 41 2.24 Dispatcher Training Simulator ...................................................................................... 42
3 REFERENCES ...................................................................................................................... 45

vi
FIGURES
1 Distribution SCADA System .................................................................................................. 3
2 Separation of DSCADA and DERMS Functionality .............................................................. 4
3 Interaction between Advanced Distribution Applications and DSCADA .............................. 5
4 Corporate Enterprise System Integration ................................................................................ 7
5 Distribution SCADA Conceptual Diagram ........................................................................... 10
6 GUI Displays and DMS User Workstations .......................................................................... 13
7 DMS Graphical Displays ....................................................................................................... 14
8 Distribution System Model.................................................................................................... 16
9 Representative Load Profile .................................................................................................. 22
10 Hand-drawn Map Update ...................................................................................................... 24
11 Using Color to Differentiate Individual Feeders by Topology Processor ............................. 25
12 Voltage Violation Highlighting ............................................................................................. 27
13 Switching Order..................................................................................................................... 30
14 Geographic Versus Schematic View ..................................................................................... 30
15 Selecting an Area for Creation of an Automatic Switch Order ............................................. 31
16 VVO DMS-based, Model-driven Solution ............................................................................ 32
17 Predictive Fault Location ...................................................................................................... 35
18 Separation of DSCADA and DERMS Functionality ............................................................ 39

vii
ACKNOWLEDGMENT This report was prepared by UChicago Argonne, LLC, operator of Argonne National Laboratory. Argonne’s work was supported by the U.S. Department of Energy under contract DE-AC02-06CH11357. The author wishes to acknowledge the sponsorship and guidance provided by Dan Ton of the U.S. Department of Energy (DOE) Office of Electricity Delivery and Energy Reliability. He would also like to extend his special appreciation to James Reilly for his advice throughout the project, as well as to Xiaonan Lu and Chen Chen of Argonne’s Center for Energy, Environmental, and Economic Systems Analysis for their many helpful comments. Special thanks as well to Bob Uluski, Chair, Task Force on Distribution Management Systems, IEEE Power and Energy Society for his many contributions during the research for this report.

viii
LIST OF ACRONYMS AND ABBREVIATIONS AMI Advanced Metering Infrastructure AOR Area of Responsibility CVR Conservation Voltage Reduction DER Distributed Energy Resources DERMS DER Management System DG Distributed Generation DMS Distributed Management System(s) DR Demand Response DSCADA Distribution Supervisory Control and Data Acquisition DSE Distribution State Estimation DTS Distribution Training Simulator ELS Emergency Load Shedding EMS Energy Management System EPRI Electric Power Research Institute ESB Enterprise Service Bus EV Electric Vehicle EVMS Electric Vehicle Management System FCI Faulted Circuit Indicator FLISR Fault Location Isolation and Service Restoration GIS Geographic Information System GUI Graphical User Interface HIS Historical Information System IED Intelligent Electronic Device IEEE Institute of Electrical and Electronics Engineers IPP Independent Power Producer KVAR Kilovolt-ampere reactive KW Kilowatt(s) LTC Load Tap Changer MDMS Meter Data Management System MW/MX Real/reactive Output of a Generator

ix
OLPF On-Line Power Flow OMS Outage Management System ONR Optimal Network Reconfiguration PEV Plug-in Electric Vehicle PFL Predictive Fault Location RDBMS Relational Database Management System RTU Remote Terminal Unit SAIDI System Average Interruption Duration Index SCA Short-Circuit Analysis SCADA Supervisory Control and Data Acquisition SOM Switch Order Management STLF Short-Term Load Forecasting TP Topology Processor VAR Volt Amps Reactive (Reactive Power) VVO Volt-VAR Optimization

x
This page is intentionally left blank.

1
DISTRIBUTION MANAGEMENT SYSTEMS FOR GRID MODERNIZATION:
DISTRIBUTION MANAGEMENT SYSTEM FUNCTIONS 1 INTRODUCTION This report describes the application functions for distribution management systems (DMS). The application functions are those surveyed by the IEEE Power and Energy Society’s Task Force on Distribution Management Systems. The description of each DMS application includes functional requirements and the key features and characteristics in current and future deployments, as well as a summary of the major benefits provided by each function to stakeholders — from customers to shareholders. Due consideration is paid to the fact that the realizable benefits of each function may differ by type of utility, whether investor-owned, cooperative, or municipal. This report is sufficient to define the functional requirements of each application for system procurement (request-for-proposal [RFP]) purposes and for developing preliminary high-level use cases for those functions. However, it should not be considered a design document that will enable a vendor or software developer to design and build actual DMS applications. 1.1 What Is a DMS? Although there is no widely accepted industry definition for a distribution management system, the one adopted by the IEEE Power and Energy Society’s Task Force on DMS is sufficient for the purposes of this report, as follows:
A DMS is a decision support system that is intended to assist the distribution system operators, engineers, technicians, managers and other personnel in monitoring, controlling, and optimizing the performance of the electric distribution system without jeopardizing the safety of the field workforce and the general public and without jeopardizing the protection of electric distribution assets.
Here are several key points pertinent to this definition:
The DMS should be viewed as a tool that assists the distribution system operators in the control center and service technicians in the field in performing their duties. The DMS is not intended to replace human judgment and decision making.
DMS users are not limited to distribution system operators in the control center and in the
field. Stakeholders also include engineers who use the DMS for engineering analysis and studies; technicians who use it for troubleshooting and maintenance; and managers who use it for oversight and overall decision-making support.

2
The DMS plays a key role in improving (optimizing) the efficiency, reliability, and
overall performance of the electric distribution system. Optimizing distribution system performance is often the primary driver for DMS deployment; advanced applications that assist in determining operating actions for performance improvement are key distinguishing features.
The two most fundamental operating objectives — safety and asset protection — must
never be compromised by the desire to improve performance. Indeed, improving safety and asset protection are the major driving forces behind DMS deployment.
1.1.1 DMS Basic Building Blocks The DMS concept is best described by looking at its component parts — the basic building blocks that comprise the DMS. According to a report by the Electric Power Research Institute (EPRI),1 these building blocks include distribution supervisory control and data acquisition (distribution SCADA or DSCADA) systems, advanced distribution applications, and interfaces to external systems.
1.1.1.1 Distribution SCADA System The foundation on which DMS is built is the DSCADA system (see Figure 1). The DSCADA system provides the “field-facing” interface that enables the DMS to monitor distribution field equipment in real-time (measurements made and reported in one minute or less on average) or near-real-time (measurements made and reported every 10 to 15 minutes on average). DSCADA also enables the DMS to initiate and execute remote control actions for controllable field devices in response to operator commands or application function control actions. Examples of control actions are opening/closing a medium voltage line switch, raising/lowering a voltage regulator tap-setting, and switching a capacitor bank on or off.
1 EPRI (Electric Power Research Institute), 2013a, Distribution Management Systems Planning Guide, Palo Alto,
Calif., 1024385.

3
FIGURE 1 Distribution SCADA System The degree to which distribution field devices are monitored and controlled by DSCADA varies widely from utility to utility. Many utilities have implemented DSCADA facilities for their electric distribution substations. However, far fewer utilities have implemented continuous monitoring and control of power apparatus that is installed out on the feeders themselves (outside the substation fence). A growing number of electric distribution utilities are currently implementing DSCADA for feeder devices as part of their grid modernization strategy. To improve the overall performance of distribution systems, these abilities are regarded as essential: (1) monitoring and controlling feeder devices such as automated line switches and reclosers, switched capacitor banks, and voltage regulators; and (2) continuously monitoring stand-alone distribution sensors (faulted circuit indicators [FCIs]), current/voltage sensors, etc.). As the penetration level of distributed energy resources (DER, i.e., distributed generators, energy storage devices, etc.) continues to grow, these devices will have a significant impact on overall distribution system performance. As a result, continuous monitoring and control of these DER may be needed. An approach to DER monitoring and control that is being researched by the EPRI is the concept of a DER management system (DERMS), which handles the direct interface to DER for monitoring and control purposes rather than DSCADA. The DMS will obtain DER-related information as needed via enterprise system integration techniques, such as an enterprise service bus (ESB). Figure 2 illustrates the separation of DSCADA and DERMS functionality for field device monitoring and control.

4
FIGURE 2 Separation of DSCADA and DERMS Functionality Field-facing interfaces to other grid modernization devices, such as plug-in electric vehicles (PEVs) and advanced metering infrastructure (AMI), are expected to be handled in much the same manner as DER. The interface to advanced customer meters will most likely be handled by a meter data management system (MDMS), which exchanges data as needed with a DMS via ESB or other integration technique. Similarly, the interface to PEV charging infrastructure may be handled by an electric vehicle management system (EVMS) exchanging data with a DMS. The DSCADA building block may also include some basic functionality, such as simple alarm checking, graphical user interface (GUI) for viewing data (tabular and schematic displays), and data archiving. However, more advanced functionality such as geographic displays and distribution system modeling are usually not considered part of DSCADA.
1.1.1.2 Advanced Distribution Applications The next major DMS building block consists of the advanced distribution applications, which use the information acquired by DSCADA to improve overall distribution system performance.

5
Advanced applications build on DSCADA monitoring and control capabilities to provide electronic decision making and automatic control capabilities for system optimization. Advanced distribution system applications that determine control actions execute them via DSCADA. The addition of advanced distribution applications provides a clear distinction between DMS and DSCADA. Figure 3 shows the interaction between the advanced applications and DSCADA building blocks.
FIGURE 3 Interaction between Advanced Distribution Applications and DSCADA Examples of advanced distribution applications that are often included in this DMS building block are listed below. Note that this is just a partial list of the DMS advanced application suite. Somewhat more detailed descriptions of these application functions are provided later in this report.
Distribution System Model. This application is an electrical representation of the physical characteristics and topology (connections between devices) of the electric distribution system. The distribution system model may also include representation of the customer loading characteristics. The distribution system model is a key application that enables many of the other DMS applications.
Geographical User Interface. The DMS application suite almost always includes a
geographically correct graphical user interface. For example, the DMS is usually able to

6
show feeder map style displays with information that is dynamically updating in real time and near real time and is superimposed on the map displays.
On-Line Power Flow. The on-line power flow (OLPF) advanced application uses the
distribution system model and available DSCADA data to compute the electrical conditions at any point on the feeder, including points that are not equipped with physical monitoring facilities. The OLPF is one of the most important DMS application functions because it enables numerous other applications, such as switch order management, to operate.
Switch Order Management. Switch order management (SOM) enables the distribution
system operators and operations support staff to create and validate the switching order needed to isolate portions of the distribution system that are being repaired or maintained while providing electrical service to as many customers as possible.
Volt-VAR Optimization. This application identifies a coordinated set of control actions
for distribution voltage regulating and VAR control devices that are needed to achieve utility-specified operating objectives (improve voltage profile, reduce electrical losses, lower demand, promote energy conservation, etc.).
Optimal Network Reconfiguration. This application identifies a set of line-switching
actions that can be used to achieve better load balance between interconnected feeders, an improved voltage profile, or other utility-specified objective function.
Predictive Fault Location. This application uses fault magnitude from substation
intelligent electronic devices (IEDs), along with the distribution system model, to predict the probable fault location, thus enabling more precise dispatching of field crews and faster service restoration.
1.1.1.3 Interfaces to External Systems Another important DMS characteristic is the integration of advanced distribution applications and DSCADA facilities with other corporate enterprise systems, such as the geographic information system (GIS) and the outage management system (OMS). Figure 4 shows the addition of corporate enterprise integration facilities to the set of DMS building blocks.

7
Distribution Management System ComponentsInteractions with Operational Support Systems
Field Devices
DistributionSCADA
Advanced Applications
Substation Devices
Advanced Metering System (AMI)
Outage Management System (OMS)
Geographic Information System (GIS)
ExternalInterfaces
FIGURE 4 Corporate Enterprise System Integration The purpose of each interface is summarized briefly below:
Geographic Information System. The GIS is a data repository containing detailed information about the electric distribution “physical” assets (poles, conductors, transformers, line switches, capacitor banks, voltage regulators, etc.). The detailed information typically includes information about the physical and electrical characteristics (electrical impedance, efficiency, etc.) of each device, along with the geographic location (latitude and longitude) of each device. This information is used to construct and maintain the distribution system model used by many advanced DMS functions. The GIS is also used to build and maintain a similar model used by the OMS. Note that the OMS version of the model usually only contains the feeder topology, not the electrical impedance and other information needed to run a load flow.
Outage Management System. The OMS performs many essential functions needed to
assist distribution system dispatchers when customers are experiencing service interruptions. One of the key OMS functions is “fault location prediction.” The OMS applies individual customer outage telephone calls (or, more recently, “last gasp”

8
messages from AMI meters) to its distribution system model to determine which calls/messages appear to be related to the same outage event. After the calls/messages have been grouped, the OMS uses the model to search “upstream” (closer to the substation) to determine which fault-interrupting device operates for this event. This information is used to direct field crews to the approximate location of the root cause of the outage event. OMS often includes facilities for dispatching first responder and field crews to the outage location for fault investigation, damage assessment, and repairs.
Meter Data Management System. The MDMS is responsible for acquiring and
processing readings from AMI meters. MDMS is primarily intended to support the revenue billing process. However, MDMS may support a myriad of additional functions such as theft detection, outage detection (“last gasp” messages), service restoration verification, and transformer load management. DMS advanced applications have many potential uses for AMI data, such as accurate determination of customer loading on a near-real-time basis. The AMI system may also be used to implement demand response actions and execute other customer load control actions. Note, however, that to date, AMI data resources are for the most part a largely untapped resource for advanced application beyond revenue billing.
Note that GIS, OMS, and MDMS are just a few of the corporate enterprise systems that are included in the DMS architecture.

9
2 DMS APPLICATION FUNCTIONS The following DMS application functions are included in this report:
1. Data Acquisition and Control 2. State Estimation 3. Graphical User Interface (GUI) 4. Historical Information System (HIS) 5. Distribution System Model 6. Load Models 7. Topology Processor 8. On-Line Distribution Power Flow (OLDPF) 9. Intelligent Alarm Processing 10. Tagging, Permits and Clearances 11. Short-Circuit Analysis (SCA) 12. Switch Order Management (SOM) 13. Volt-VAR Optimization (VVO) 14. Fault Location Isolation and Service Restoration (FLISR) 15. Predictive Fault Location (PFL) 16. Optimal Network Reconfiguration (ONR) 17. Short-Term Load Forecasting (STLF) 18. Dynamic Equipment Rating 19. DMS Control of Protection Settings 20. DER Management 21. Demand Response Management 22. Emergency Load Shedding 23. EV Charging 24. Dispatcher Training Simulator
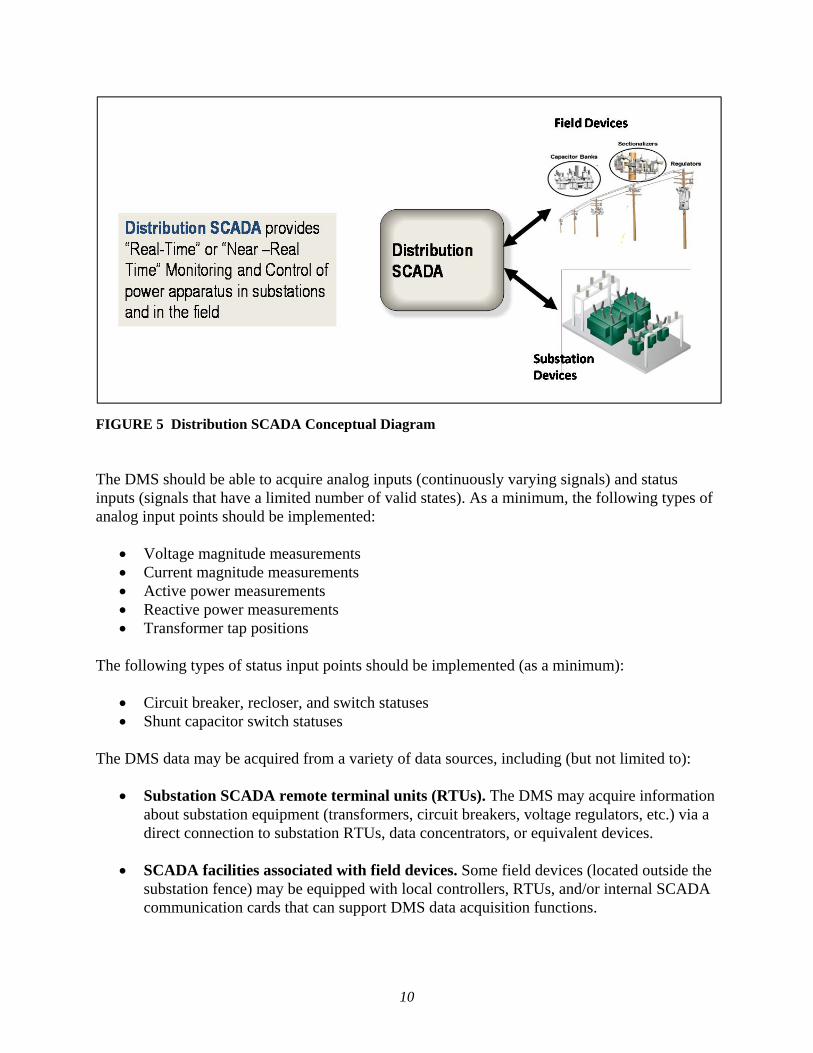
2.1 Data Acquisition and Control The foundation on which DMS is based is the DSCADA system (see Figure 5). The DSCADA system provides the “field-facing” interface that enables the DMS to monitor the distribution field equipment in real time (where measurements are made and reported in one-minute increments or less, on average) or near real time (where measurements are made and reported every 10 to 15 minutes, on average). DSCADA also enables the DMS to initiate and execute remote control actions for controllable field devices in response to operator commands or application function control actions. Examples of control actions include opening/closing a medium voltage line switch, raising/lowering a voltage regulator tap-setting, and switching a capacitor bank on or off.
10
FIGURE 5 Distribution SCADA Conceptual Diagram The DMS should be able to acquire analog inputs (continuously varying signals) and status inputs (signals that have a limited number of valid states). As a minimum, the following types of analog input points should be implemented:
Voltage magnitude measurements Current magnitude measurements Active power measurements Reactive power measurements Transformer tap positions
The following types of status input points should be implemented (as a minimum):
Circuit breaker, recloser, and switch statuses Shunt capacitor switch statuses
The DMS data may be acquired from a variety of data sources, including (but not limited to):
Substation SCADA remote terminal units (RTUs). The DMS may acquire information about substation equipment (transformers, circuit breakers, voltage regulators, etc.) via a direct connection to substation RTUs, data concentrators, or equivalent devices.
SCADA facilities associated with field devices. Some field devices (located outside the
substation fence) may be equipped with local controllers, RTUs, and/or internal SCADA communication cards that can support DMS data acquisition functions.

11
Distributed line sensors. The DMS should be able to acquire real-time information from stand-alone sensors located out on the distribution circuits. Examples of stand-alone sensors include faulted circuit indicators, line post sensors, and bellwether meters.
AMI meters. Some DMS information may be acquired from AMI meters installed at
selected field locations (such as the substation end of the feeder) and selected customer premises.
The DMS should use a report-by-exception philosophy. Only the specified data that has changed by a specified amount should be transferred at any given time. The DMS should also include an “integrity check” feature that transfers the entire dataset at specified intervals. The DMS should be able to control power system apparatus located at distribution substations and field locations (out on distribution feeders). The controlled power apparatus should include substation circuit breakers and reclosers, field reclosers, switched capacitor banks, voltage regulators, and other primary and secondary voltage equipment. The DMS should also be able to initiate load shedding of selected customers via the AMI system. The degree to which distribution field devices are monitored and controlled by DSCADA varies widely from utility to utility. Many utilities have implemented DSCADA facilities for their electric distribution substations. However, DSCADA is often not available at small (single transformer, single feeder) substations — especially substations that are very remote and lack suitable communication facilities. Far fewer utilities have implemented continuous monitoring and remote control of power apparatus that is installed out on the feeders themselves (i.e., outside of the substation fence). To improve the overall performance of the distribution system, these abilities are regarded as essential: (1) monitoring and controlling feeder devices such as automated line switches and reclosers, switched capacitor banks, and voltage regulators; and (2) continuously monitoring stand-alone distribution sensors (e.g., FCIs, current/voltage sensors). As a result, a growing number of electric distribution utilities are currently implementing DSCADA for feeder devices as part of their grid modernization strategies. Real-time or near-real-time monitoring and control of distribution assets are essential for implementing many of the advanced DMS functions, so DSCADA should be added to most (if not all) of the distribution substations. Furthermore, monitoring and control of assets located out on the feeders themselves will be needed by many applications. Phased implementation of these facilities is recommended because it is not practical to deploy DSCADA at all locations all at once owing to limited technical and financial resources. To maximize payback of the investment, many electric distribution utilities implement DSCADA facilities first on “worst performing” feeders (highest loses, less-than-average reliability, etc.), followed by the remaining feeders. The AMI system is also expected to be a key source of near-real-time data, such as voltage measurements and alarms, which will supply valuable feedback to DMS applications such as VVO/CVR (conservation voltage reduction). Load measurements will also be needed to build

12
and maintain load profiles that are used for load allocation and estimation; however, these data are not required on a near-real-time basis. Implementing the necessary facilities for data acquisition and control is essential for realizing DMS implementation success and will be an important element of the DMS Roadmap. 2.2 State Estimation An accurate insight into the distribution network’s current state under normal and emergency (outage) conditions is essential for managing the distribution networks. Typical DSCADA cover only the high voltage/medium voltage (HV/MV) substations. As stated in the previous section of this report, few (if any) measurements are available far out on the feeders themselves (i.e., outside of the substation fence). The lack of distribution data is the primary motivation for the application of distribution state estimation (DSE). Utilities use DSE for assessing (estimating) the loads at all network nodes and for assessing all other state variables, including voltage and current phasors (magnitude and angle) for all distribution circuit buses, sections, and transformers; active and reactive power losses in all sections and transformers; and other such electrical quantities. The load estimation or calibration DMS application function evaluates the symmetrical (per phase) and asymmetrical (three-phase) load of all nodes in the distribution network that are not remotely monitored by the DSCADA system. Then a standard load flow calculation can be performed. DSE is a basic (“enabling”) DMS function, because practically all other DMS analytical functions are based on the results of DSE to perform their calculations. DSE computes the “unobservable” load of the actual network, which is not directly covered by the SCADA system. The DSE function should use an algorithm specifically designed for distribution networks, which have low redundancy of real-time, remotely monitored data. In addition to the physical and electrical parameters of network elements, the real-time data required by the DSE function should include the following:
Feeder topology, transformer, and voltage regulator tap changer position.
Voltage magnitudes at the head end (substation end) of the feeder.
Current magnitudes (active and reactive power) at the head end of the feeder and at mid-line points along the feeder.
Because real-time measurements are not available at all points on the feeder, historical data can be used to compensate for the lack of real-time data. Historical data consists of:

13
Daily load profiles (current magnitudes and power factors, or active and reactive powers) for all load classes (or types, i.e., industrial, commercial, residential), seasons (winter, spring, summer, autumn), and four types of days (i.e., weekdays, Saturdays, Sundays, and holidays).
Peak loads for all distribution transformers and/or consumers (peak currents and/or peak
power). The DSE function should be available in both the real-time and study mode. In real-time mode, the function is used for estimation of the current state. In the study mode, the function is used for estimation of the desired state (e.g., any state selected from the saved cases). 2.3 Graphical User Interface (GUI) Distribution system operators and other authorized personnel should be able to interact with the DMS via PC-based workstations installed at the system control centers and various offices. Typical control center workstations and GUI displays are depicted in Figure 6.
FIGURE 6 GUI Displays and DMS User Workstations The DMS user interface should allow authorized personnel to view measured and calculated real-time, near-real-time, and historical data values; initiate control actions (with suitable security limits and controls); and interact with the DMS applications as needed. The DMS should also include facilities to enable secure, view-only capability to authorized users located outside of the control center. The DMS user interface should be a workstation-based, full-graphics display product. Full-graphics features of the user interface should include panning, zooming, and declutter levels to allow users to control the viewable area of the “world space” on display. The DMS should include areas of responsibility (AORs) that should provide the means to route alarms and restrict supervisory control and data entry to those personnel having the associated responsibility and authority. It should be possible to assign responsibility for portions of the distribution system to individual consoles by predefining groups of AORs and assigning them to different consoles in the control room.
14
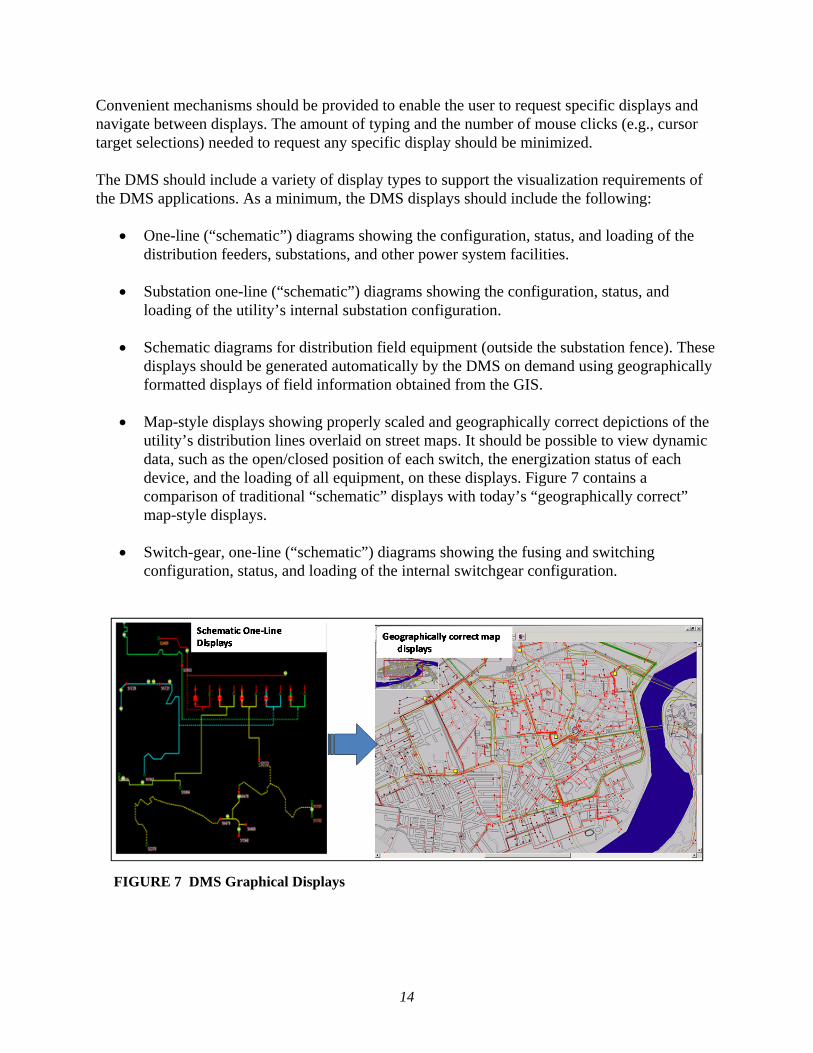
Convenient mechanisms should be provided to enable the user to request specific displays and navigate between displays. The amount of typing and the number of mouse clicks (e.g., cursor target selections) needed to request any specific display should be minimized. The DMS should include a variety of display types to support the visualization requirements of the DMS applications. As a minimum, the DMS displays should include the following:
One-line (“schematic”) diagrams showing the configuration, status, and loading of the distribution feeders, substations, and other power system facilities.
Substation one-line (“schematic”) diagrams showing the configuration, status, and
loading of the utility’s internal substation configuration.
Schematic diagrams for distribution field equipment (outside the substation fence). These displays should be generated automatically by the DMS on demand using geographically formatted displays of field information obtained from the GIS.
Map-style displays showing properly scaled and geographically correct depictions of the
utility’s distribution lines overlaid on street maps. It should be possible to view dynamic data, such as the open/closed position of each switch, the energization status of each device, and the loading of all equipment, on these displays. Figure 7 contains a comparison of traditional “schematic” displays with today’s “geographically correct” map-style displays.
Switch-gear, one-line (“schematic”) diagrams showing the fusing and switching
configuration, status, and loading of the internal switchgear configuration.
FIGURE 7 DMS Graphical Displays

15
2.4 Historical Information System (HIS) The DMS should include a HIS to store and retrieve system variable values, alarm and event messages, power system disturbance reports, and other calculated or acquired information. Real-time information is stored in the HIS on a periodic basis at user-specified intervals and also on an “exception” basis when a variable changes by a user-specified amount since the last time it was stored. Information associated with events, such as an alarm or power system disturbances, is stored whenever such events occur. As a minimum, the following types of data are stored in the HIS:
A complete set of all system variables stored at least once per hour and on exception.
All supervisory and automatic control actions initiated via the DMS.
All alarm messages and return-to-normal messages.
Sequence-of-events logs.
DMS event messages, such as processor restarts and communication error messages.
System journals that record security-related events, including changes in permissions as defined by the system administrator.
The stored data should be time/date stamped to enable the historical retrieval functions to select the desired subset of data. Data quality and alarm condition tags should also be stored, along with the value of each system variable. The DMS should include two storage media for historical data: on-line data storage and off-line (archive) storage. Data retrieval functions should be capable of accessing the data from on-line and archive storage. All historical data should initially be accessible in on-line storage. Data should be transferred automatically from on-line storage to archive storage on a periodic basis at a user-specified interval. It should also be possible to transfer the contents of on-line storage to archive storage on demand. The DMS should be capable of archiving at least one year’s worth of HIS data. The HIS should enable users to access the database via ad hoc queries and produce reports using standard relational database management system software. Users should be able to retrieve selected data items for specified time/date intervals and display the retrieved data in a variety of formats, including in tabular reports and trend charts. It should be possible to perform user-specified calculations on any historical data item that has been retrieved from the HIS database. The DMS vendor is often able to furnish its own HIS. However, it is common industry practice to use a commercially available software package (e.g., OSIsoft PI) for this purpose.

16
2.5 Distribution System Model Many of the advanced DMS applications require an accurate three-phase electrical model of the distribution system that represents the exact physical and load characteristics of the distribution grid. This model allows the DMS to compute electrical conditions at feeder locations that do not have any instrumentation. The model should encompass the entire distribution system from the point of connection to the transmission system all the way to the customer meter.
FIGURE 8 Distribution System Model The distribution system model should accurately represent the unbalanced characteristic of electric distribution systems (i.e., different impedance, load, and generation on each phase of the three-phase distribution system). This model also should enable analysis of radial (single-source) and networked (multi-source) distribution systems. Several variations of the model are needed:
As-built. A model that represents the normal configuration of the system.
As-operated. A model that represents the current configuration of the system, including any temporary modifications (e.g., temporary switching, cuts, and jumpers).
As-planned. A version of the model to ensure that planned facilities are quickly added to
the model when the utility company energizes these devices. The DMS should include facilities for seamlessly importing this model from corporate GIS data. The incremental update process to bring model changes into the DMS should be handled via electronic transfers with no manual copying and hand-drawn updates. In addition, the model

17
changes should be brought into the DMS with no downtime for the system in a manner that is transparent to the distribution system operator. The DMS should include a detailed, up-to-date electrical and connectivity model of the electric distribution system as required by the DMS applications. There should be only one DMS model of the system used by all DMS advanced applications, such as on-line power flow and short-circuit analysis. The DMS distribution system model should represent the entire distribution network that includes distribution feeders and distribution substation devices from the high-voltage side of the substation transformer (including the high side circuit breaker) down to the low-voltage (secondary) side of the distribution service transformers. The DMS distribution system model should be a three-phase model that fully represents the unbalanced nature of the distribution system. The electrical model should include the entire distribution primary circuit, including mainline portions of the circuit, feeder laterals, and underground loops that are tapped off the main trunk of the feeder. The distribution system model should accommodate three-phase portions of the feeder, as well as single-phase and two-phase line segments and laterals. The distribution model should include the “physical” characteristics of the circuit and the loading characteristics, as described below. The DMS provides proper handling of “underbuilds” identified by GIS. Underbuilds occur when:
Distribution lines are on the same poles as transmission wires (which are not modeled in the same distribution GIS database).
Two distribution primary lines are on the same pole (parallel circuits).
Although most feeders are radial in nature (i.e., there is one and only one path leading from a single feeder source to any point on the feeder), the DMS distribution system model and associated application software are able to handle looped and weakly meshed feeder configurations, circuits operating in parallel, and secondary networks. Some electric distribution utilities have considered modelling the secondary portion of the distribution circuit between the distribution transformer and the customer meter. By explicitly modeling the secondary (120-/240-V) circuits, the electric utility is able to accurately determine the voltage drop from the load side of the distribution transformer to the load. Most DMS vendors estimate the voltage drop based on the estimated loading of the distribution transformer and then look up the voltage drop using an optional predefined schedule (for each load category). For example, if the distribution transformer is currently loaded to 80.0% and a voltage drop schedule has been provided, the voltage drop schedule may indicate that the voltage at the customer service entrance (load) is 1.5% lower than the OLPF solved transformer secondary voltage. The ability to calculate voltage down to the meter/service entrance of the customer is most important with respect to not overstepping VVO voltage reduction for demand minimization or CVR.

18
The transmission or sub transmission source(s) at each distribution substation may be represented by an infinite bus with dynamic source voltage angle and magnitude supplied by the state estimator function used by the transmission operator. The equivalent impedance of the external network as seen from the high-voltage buses of distribution substation buses should be provided. Note that the equivalent impedance of the transmission grid is not a fixed number, but rather it varies with generating unit commitment and status of key transmission system components. Therefore, in order to obtain accurate short-circuit analysis results (required for predictive fault location), the equivalent impedance of the external network should be dynamically updated as system conditions vary. Generators such as co–generators (cogens), non–utility generators (NUGs), independent power producers (IPPs), and other similar units should be modeled. Generators should be designated as either constant real power/constant voltage units (PV units) or constant real power/constant power factor units (PQ units). Generator active and reactive power limits should be modeled by generator capability curve. In addition to synchronous reactance, the generator model should also include sub-transient and transient reactance required for short-circuit analysis. To the fullest extent possible, the distribution system model should be created and maintained with little or no manual intervention. The primary source of field (outside the fence) information for the model should be GIS. The sources of information for the distribution substation portion of the distribution system model may include other non-GIS sources. Manual entry may be needed to build the necessary substation models if this information is not available via an accessible electronic mechanism. The GIS should provide some basic “physical” information about each circuit, such as wire size and type, arrangement of conductors, height of conductors above ground, and section length. The DMS, in turn, should calculate resistance and reactance (including all significant mutual impedances) from these basic physical parameters. The GIS should also provide information about the sizing and physical characteristics of other field components, such as line capacitor banks, voltage regulators, and distribution service transformers. Underground cables should be modeled to include the cable impedance as well as charging admittance. The position of the individual cable in the ducts and manholes should be provided from GIS. The DMS should support incremental model changes. That is, when a small permanent change to the distribution system occurs, it should be possible to update only those portions of the distribution system model that are affected by the change. It should not be necessary to rebuild the entire model for each change in equipment and configuration. The DMS should be able to perform incremental builds on a per-feeder basis. The DMS should provide a convenient mechanism for installing temporary changes to the electrical model. It should be possible to change the open/closed position of a switch whose status is not automatically telemetered (a “pseudo” point). In addition, the DMS should support temporary cuts and jumpers (including jumpers between individual phases) and be able to attach or “jumper” temporarily between conductors that are normally connected to different phases. The DMS should allow an operator to change the network model to show a feeder being cut, grounded, or “jumpered” to another feeder or phase.

19
When the repair is completed, it should be possible to back the change out and return the network model to its original state. All such changes should be automatically reflected in the DMS model. The DMS should provide information about all such temporary changes to the utility’s OMS. 2.5.1 Modeling the Transmission System A portion of the transmission grid that supplies each substation may also be modeled, especially if the utility company that owns and operates the substation and distribution resources also owns and operates the supply lines. However, in most cases, the transmission grid is not modeled to any great extent. Typically, the transmission grid is modeled with an impedance that represents the Thevenin equivalent of the transmission grid including all generators that are currently connected to the grid and running. The accuracy of the transmission equivalent impedance is very important because it is needed to compute the short-circuit current for faults that occur on the distribution system. Short-circuit current is (in turn) used by the predictive fault location. The equivalent impedance is not a fixed value, but rather it is different for every point of connection to the transmission system. The transmission system equivalent impedance at any point of connection may vary with time as central generators are committed and taken off line. When a large central generator is taken off line, the equivalent impedance will increase because the short-circuit contribution of that large generator is removed and as major transmission line switching occurs. The distribution system model should include an equivalent impedance for each transmission point of connection that is obtained from the transmission operator. The equivalent impedance values should be dynamically updated to reflect changes in major generator status and transmission line status. 2.5.2 Modeling the Substations The electrical characteristics of each substation component and the connections between components should be accurately represented in the electric distribution model. Substation assets are usually not in the electric utility’s GIS. Therefore, the substation models required by DMS should be obtained from a different source, such as the electric utility’s EMS, or be built from scratch using the DMS vendor’s model building software. Fortunately, changes to substation assets are much less frequent than distribution feeder changes, so it is usually practical to manually build and maintain the substation models. 2.5.3 Modeling the Distribution Secondary Circuits Most electric distribution utilities elect not to model the secondary portion of their electric distribution feeders from the low side of the distribution service transformer down to the

20
customer meters. This practice arises mostly because of the lack of accurate information about this portion of the circuit. Despite the lack of an accurate model of the secondary portion of the circuit, performing analysis of the secondary circuit is important, especially for utilities that are planning to implement CVR. To gain the maximum possible CVR benefit without causing low-voltage violations for customers, it is necessary to determine the service delivery voltage at each meter. Ideally, voltage feedback would be provided in the form of instantaneous voltage measurement provided by smart meters. However, it may not be practical to obtain near-real-time voltage measurements from every meter because of the enormous burden this would place on the AMI meters and associated communication infrastructure. It is possible to obtain near-real-time measurements from a subset of meters that are located at sites that are likely to have the lowest voltage on the feeder. These locations include feeder extremities that are furthest from the substation, end points of heavily loaded branches, and the source side of midline voltage regulators. However, research has shown that the lowest voltage along a feeder varies widely with time, and that the number of meters that have the lowest voltage on the feeder at least once during the course of a year are in the hundreds. Although monitoring the number of metered points takes less time than monitoring all meters in near real time, this approach still places an enormous burden on the AMI meters and associated communication infrastructure. Furthermore, if the feeder is reconfigured for any reason, hundreds of different metered locations may suddenly become candidates for the lowest voltage on the feeder. Without having an accurate measurement or calculation of the lowest feeder voltage at any time, the utility company will need to provide more operating margin to ensure that the voltage does not go below the minimum at any location on the feeder. From the standpoint of CVR, this practice will limit the amount of voltage reduction that can be performed and therefore reduce the maximum possible savings. Many electric utilities have elected to approximate the voltage drop between the modeled portion of the distribution feeder and the customer meter. The simplest approach is to assume a default voltage drop on the secondary circuit. However, the assumed value of voltage drop can be very approximate — the voltage drop may vary between 2 volts and 6 volts (on a 120-volt basis). So once again the method is not that accurate. Accordingly, a wider operating margin must be used to prevent violating the minimum voltage level. A refinement of this approach is to estimate the voltage drop based on the OLPF calculated loading of the distribution transformer and then look up the voltage drop using a predefined voltage drop schedule (for each load category). For example, if the distribution transformer is currently loaded to 80.0% and a voltage drop schedule has been provided, the voltage drop schedule may indicate that the voltage at the customer service entrance (load) is 1.5% lower than the OLPF solved transformer secondary voltage. This approach improves the voltage drop calculation but is still only an approximation that requires a larger operating margin.

21
Because it is not practical to measure and report instantaneous voltage at every smart meter, the next best level of accuracy can be obtained by modeling the secondary portion of the distribution circuit from the low side of the distribution service transformer down to each customer meter. By explicitly modeling the distribution circuits, the voltage drop from the load side of the distribution transformer to the load is more accurate, and the operating margin on voltage reduction can be smaller, resulting in more voltage reduction benefits. Calculation of voltages on the secondary circuit will provide a clear view of the effects any volt or Volt/VAR control. The secondary circuit model will enable the utility to analyze the effects of performing load control applications through AMI, such as turn-on/-off air conditioners, water heaters, and pool pumps. Modeling the secondary portion of the distribution feeder can significantly improve the accuracy of fault location following trouble calls. The benefit in this case is the reduction in fault investigation time, which, in turn, translates to reliability improvement and labor savings. Another possible benefit of modeling the secondary circuit is to analyze the effects of rooftop solar on power flow and secondary circuit voltage. Although many utilities do not expect a high penetration of distributed generation on their distribution feeders in the near future, it is possible to have clusters of distributed generation (DG) units in certain areas that can produce unacceptable electrical effects that can be detected by modeling the secondary circuit. Modeling the secondary circuit will also provide more accurate calculation of electrical losses. This information can be used to target the worst-performing feeders for circuit improvements. More accurate loss calculations can also help identify feeders where a significant amount of electricity theft is occurring. As a minimum, the utility company should model the secondary circuit in areas where high penetration levels of rooftop solar are expected and also in areas where high deployment of electric vehicle charging is expected. 2.6 Load Models The DMS should include a mechanism to estimate the load on each distribution service transformer at a particular point in time. The Load Allocation and the Load Estimation functions should provide the best estimate of kilowatt (KW) and kilovolt-ampere reactive (KVAR) load levels to the OLPF program. It should be possible to use the Load Allocation and the Load Estimation function in both the real-time and study modes. The DMS Load Allocation function should support the use of historical load curves (load “profiles”) that represent the characteristics of load types served by the utility. The load profile for each load type should include the percentage of peak load at 15-minute intervals throughout the day plus a peak load value for this customer type. Figure 9 shows a representative load profile. To calculate the estimated load at any time of day, the percentage of peak load at that time of day taken from the load profile is multiplied by peak load.

22
FIGURE 9 Representative Load Profile For the sample load profile shown in Figure 9, to determine the load at 10 AM, the percentage of peak load at that time (0.650) should be multiplied by the peak load for the day (1.753 KW) to determine an estimated load of 1.14 KW. Load types supported by the DMS should include different “conforming” loads (i.e., loads with a profile that matches the utility’s load survey data) and “non-conforming” loads (i.e., loads with a unique profile that is significantly different from the utility’s “standard” load profiles). Conforming load classes should include numerous load types that go well beyond the basic residential, commercial, and industrial load types. For example, supported load types may include these:
Agriculture – Commercial Agriculture – Residential Mining Educational Service Residential – High-Rise Apartment Common (Electric Heat) Residential – High-Rise Apartment Common (Non-Electric Heat) Residential – High-Rise Apartment Suites (Electric Heat) Residential – High-Rise Apartment Suites (Non-Electric Heat)
Load profiles should consist of a pair of real power and power factor (or reactive power) for each load interval (15 minutes). Load interval size should be configurable (e.g., 5, 15, or 30 minutes). The DMS should interpolate between load survey points to determine load values at intermediate points between points on the curves. For example, with 1-hour load survey data, half-hourly data points should be the average of the two adjacent hourly points. The DMS should include a different set of load profiles for each season (winter, spring, summer, and fall) and for different types of days (weekdays, weekends, holidays). The number of seasons and types of days should be configurable to satisfy the utility’s specific needs.
Hour
of
Day
Fraction
of peak
load Peak Load 1.753 kW
0 0.549
1 0.487
2 0.455
3 0.427
4 0.405
5 0.394
6 0.429
7 0.523
8 0.561
9 0.590
10 0.650
11 0.729
12 0.807
13 0.826
14 0.886
15 0.930
16 0.983
17 1.000
18 0.995
19 0.938
20 0.921
21 0.871
22 0.784
23 0.714
0.000
0.100
0.200
0.300
0.400
0.500
0.600
0.700
0.800
0.900
1.000
0 5 10 15 20
Fraction of peak load
Representative Load Profile

23
Traditionally, load profiles have been built by performing statistical load surveys for each rate class, and these load profiles remain fixed until the next load survey. Utilities that have implemented AMI should use actual billing data from AMI meters to construct load profiles that will be considerably more accurate than the traditional load profiles. The DMS should update its load profiles on a monthly basis or more often using AMI data. The DMS should be capable of using actual near-real-time distribution transformer loading measurements acquired from an AMI system or a transformer load management (TLM) system in place of allocated values. The power flow algorithm should treat each load value as voltage dependent. Load active and reactive powers should be determined as a function of voltage at the bus where the load is connected. A polynomial representation, which is a combination of constant power, constant current, and impedance characteristics, should be used. The load estimation application should determine the best estimate of each distribution transformer load (KW and KVAR) based on the available real-time measurements, load profiles, and real-time network topology. Load estimation should use the accuracy class information assigned to each real-time measurement to discriminate between measurements based on the measurements’ errors. Thus, load estimation should match more closely the measurements that are more accurate (smaller errors assigned) then those measurements deemed less accurate (have larger errors defined in the assigned accuracy class) while determining the KW and KVAR values of each load. Load estimation should also perform measurement consistency checks and validation by fully exploring measurements’ redundancy wherever available in order to identify potentially poor-quality measurements. 2.6.1 Electronic Map/Model Updates Having an up-to-date “as operated” representation (maps and models) of the electric distribution system is essential for safe and efficient operation of the electric distribution system. Many electric utilities still invest a considerable amount of manual effort to updating the existing records. So there is a significant amount of delay in updating the maps, displays, and other records used by operating personnel. Hand-drawn markups (see Figure 10) are often used as the main source of information until the official map updating is completed.

24
FIGURE 10 Hand-drawn Map Update (red lines)
Some changes to the electric distribution system are made only in a single system (e.g., the OMS) and are therefore not available to other applications. This practice will become even more of a problem as the DMS is introduced owing to the number of model-driven applications that are contained in the DMS. The DMS should include suitable mechanisms to streamline the records update process by eliminating manual copying between systems and hand-drawn updates to maps. The one distribution system model should be accessible by all computing systems that require this information (i.e., should not have to duplicate information on multiple systems). 2.7 Topology Processor The DMS should include a topology processor (TP) for performing various analyses of the distribution network configuration. The DMS TP function should maintain static and dynamic connectivity models. Static connectivity defines relationships such as the static node-device relationship and organizational entities’ groupings. Dynamic connectivity accounts for switch status, device energization status, and loops. The DMS TP function is able to:
Locate an element of the distribution network (transformer, section, etc.) by name or ID.
Locate and mark the supply paths of network elements.
Determine and highlight the energization status of network elements.
Locate and highlight networks loops.
Locate and highlight all network elements downstream of a selected element.
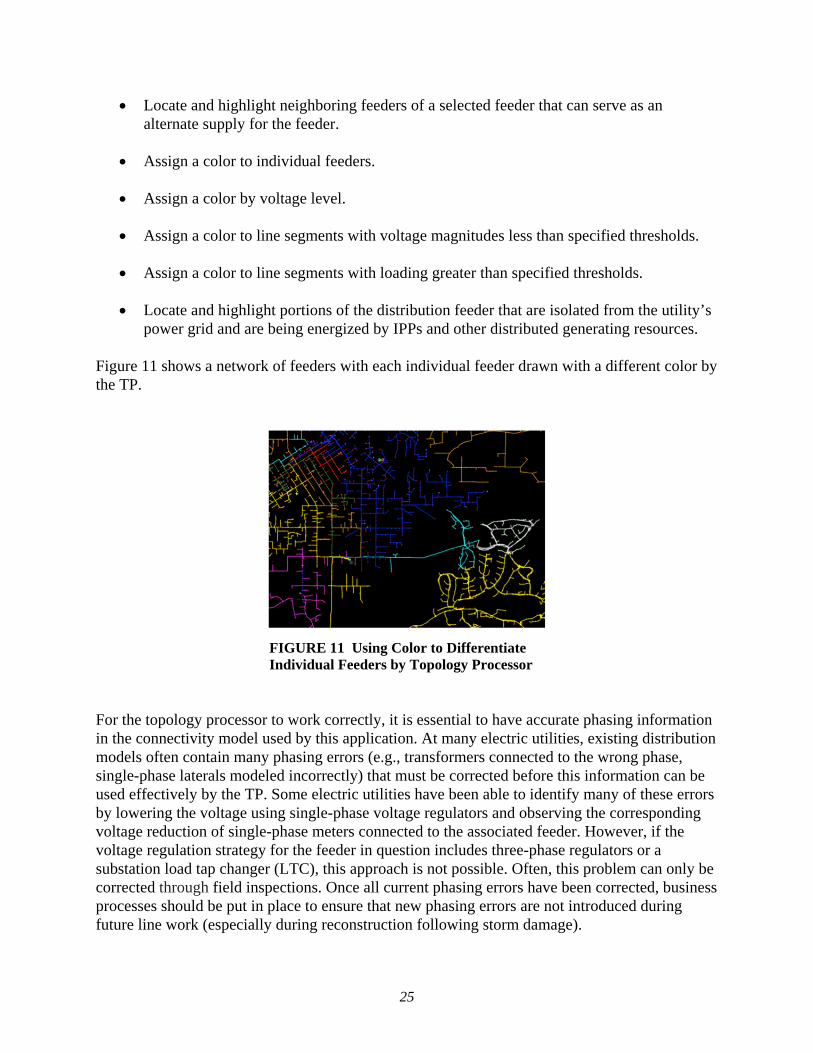
25
Locate and highlight neighboring feeders of a selected feeder that can serve as an alternate supply for the feeder.
Assign a color to individual feeders.
Assign a color by voltage level.
Assign a color to line segments with voltage magnitudes less than specified thresholds.
Assign a color to line segments with loading greater than specified thresholds.
Locate and highlight portions of the distribution feeder that are isolated from the utility’s
power grid and are being energized by IPPs and other distributed generating resources. Figure 11 shows a network of feeders with each individual feeder drawn with a different color by the TP.
FIGURE 11 Using Color to Differentiate Individual Feeders by Topology Processor
For the topology processor to work correctly, it is essential to have accurate phasing information in the connectivity model used by this application. At many electric utilities, existing distribution models often contain many phasing errors (e.g., transformers connected to the wrong phase, single-phase laterals modeled incorrectly) that must be corrected before this information can be used effectively by the TP. Some electric utilities have been able to identify many of these errors by lowering the voltage using single-phase voltage regulators and observing the corresponding voltage reduction of single-phase meters connected to the associated feeder. However, if the voltage regulation strategy for the feeder in question includes three-phase regulators or a substation load tap changer (LTC), this approach is not possible. Often, this problem can only be corrected through field inspections. Once all current phasing errors have been corrected, business processes should be put in place to ensure that new phasing errors are not introduced during future line work (especially during reconstruction following storm damage).

26
2.8 On-Line Distribution Power Flow The DMS should include an OLPF program that is able to determine the electrical conditions on the utility’s distribution feeders in near real time. The OLPF should provide the control center personnel with calculated current and voltage values in place of actual measurements and should alert the operators to abnormal conditions out on the feeders, such as low voltage at the feeder extremities and overloaded line sections. In addition, other DMS application functions, such as SOM, VVO, and FLISR, should be able to use the OLPF results to accomplish their specified functionality. The OLPF should use the distribution system model and load estimate provided by the load estimation function in its calculations. The OLPF should also use the available real-time statuses from the substation and feeder devices, as well as voltages and phase angles obtained from the EMS state estimator that the transmission operator used at the injection points (usually placed on a high-voltage transformer bus in distribution substations). The OLPF program should calculate current and voltage magnitudes and phase angles, as well as real and reactive power flows and injections for the entire distribution system and should present the results in various formats both automatically and on demand. Convenient mechanisms should be provided for viewing power flow summaries for a large area of the distribution system. It should also be possible to view (on demand) the power flow results for a single point or section of the power distribution system. The OLPF should calculate all technical electrical losses (load and no-load losses) and real and reactive power flows and consumption in the distribution system. The OLPF should be designed specifically for electric distribution systems. It should provide a full three-phase unbalanced calculation, accommodating single-phase, two-phase, and three-phase circuits and loads (balanced and unbalanced). The OLPF solution method should be able to handle both radial and weakly meshed configurations and the wide range of X/R ratios encountered on distribution networks where mixtures of overhead lines and underground cables are commonplace. Convenient mechanisms should be provided for viewing the OLPF power flow results on schematic and geographic displays. As a minimum, the following display mechanisms should be provided for viewing OLPF results:
Automatically highlighting sections of the feeder that are overloaded or experiencing under/over voltage conditions by using color coding (e.g., sections of the feeder that are overloaded are color-coded red) or equivalent highlighting technique.
Positioning the cursor on any feeder section (“mouse over”), which should result in the
display of current flow and phase-neutral voltage at that point on the feeder. Figure 12 illustrates how voltage violations identified by OLPF can be shown on a feeder map display. Areas where voltage violations exist are highlighted with a violet “halo.”

27
FIGURE 12 Voltage Violation Highlighting 2.9 Intelligent Alarm Processing The DMS should include intelligent alarm processing functions to alert system users to abnormal conditions on the power system. The alarm processing function should also alert system users to DMS and communication equipment failures and other abnormal DMS conditions requiring attention. The DMS should include a variety of distinct alarm priorities that should determine the manner and priority in which each alarm is announced, acknowledged, and recorded. The DMS should perform intelligent alarm processing to assist the operator in managing “bursts” of alarms that may occur during an emergency or combinations of alarms related to a single event. As a minimum, intelligent alarm processing should include the following:
Dependent alarms for which alarming of specified points should be enabled or disabled based on the status or values of another related data point.
Preventing repetitive alarms for the same alarm condition.
Combining related alarm messages (e.g., a single alarm message “feeder ABC tripped”)
may be provided instead of multiple messages that convey the same information (breaker tripped, loss of voltage, loss of current).

28
Prioritizing alarm messages and highlighting the most urgent messages.
Combining the alarm states of two or more alarms to produce a higher-priority alarm message. For example, the DMS should be able to generate a single major alarm if two or more specified minor alarms exist at the same time.
Suppressing alarms based on related conditions (i.e., suppressing or enabling the alarm
based on the value or state of another system variable). For example, if equipment associated with a voltage measurement is de-energized and that voltage value is approximately 0.0 KV, the DMS should consider that to be normal and should not raise any alarm. If the same equipment is energized and that voltage value is approximately 0.0 KV, the DMS should produce an alarm to indicate the possibility of a measurement failure.
The intelligent alarm function should include “time-sensitive alarming.” The DMS should monitor and alarm track time-sensitive ratings on substation transformers, cables, and other pieces of equipment. The time-sensitive alarm function should track the amount of time the short-term (e.g., four-hour) emergency loading on a substation transformer or cable has been exceeded and should alert the operator when the time limits are being approached. For example, if a substation transformer has exceeded its four-hour emergency rating for a user-specified period (e.g., 3.5 hours), the system operator should be alerted. 2.10 Tagging, Permits, and Clearances Maintaining the safety of the electric utility workforce and the general public is a fundamental and essential business objective that applies to all electric distribution utilities. The DMS should strictly enforce safety rules (tagging, permits, clearances, etc.), improve operator awareness and facilitate rapid detection of potential safety hazards, provide mechanisms to enable rapid detection of potential safety rules, and provide mechanisms such as remote monitoring and control to perform some hazardous operations from a safe distance. Maintaining the safety of the workforce and the general public is of utmost importance. The DMS will manage the business processes for issuing, tracking, and enforcing all safety tags, permits, and clearances in accordance with established safety procedures and will help to ensure that all users and systems are aware of all such operating restrictions. The DMS should use tagging to call the system operator’s attention to exception conditions for field devices and to inhibit supervisory control actions. As such, special precautions can be taken to ensure that no supervisory control action can be performed using a control-inhibited device. In addition, special precautions can be taken to ensure that tags are not lost during system failover or switchover, even when these events occur simultaneously with tag application or removal. The tag application can only be confirmed to the user applying the tag after it has been committed to the standby processor of the active control system.

29
2.11 Short-Circuit Analysis The DMS should include a short-circuit analysis (SCA) function that should enable users to calculate the three-phase voltages and currents on the distribution system resulting from postulated fault conditions with due consideration of pre-fault loading conditions. The SCA function should be able to calculate and compare fault currents against switchgear breaking capabilities or device fault-current limits. The SCA function should also enable users to identify estimated fault location using measured fault magnitude, pre-fault loading, and other information available at the time of the fault. The results of SCA should be used for other applications like predictive fault location (PFL), which uses the SCA results to identify fault locations that could produce the fault current magnitude measured by protective relay IEDs during a fault. 2.12 Switch Order Management The DMS should include a SOM function to assist the system operators in preparing and executing switching procedures for various elements of the power system, including both substation and field devices (outside the substation fence). The DMS SOM function should assist the user in generating switching orders that comply with applicable safety policies and work practices. Figure 13 provides an example of a paper switching order — the DMS should include an electronic version of this switching order. The SOM function should support the creation, execution, display, modification, maintenance, and printing of switching orders containing lists of actions that are needed to perform the switching, such as opening/closing various types of switches, implementing cuts and jumpers, blocking, grounding, and tagging. A valuable feature that should be included in the DMS to support creation of switching orders is the ability to view a portion of the feeder being worked on in either geographic form or schematic form. Figure 14 shows a geographically correct display alongside a schematic view of the same distribution feeder. The system should be able to create a schematic view automatically from the geographic view — it should not be necessary to build a separate schematic view of a feeder manually.
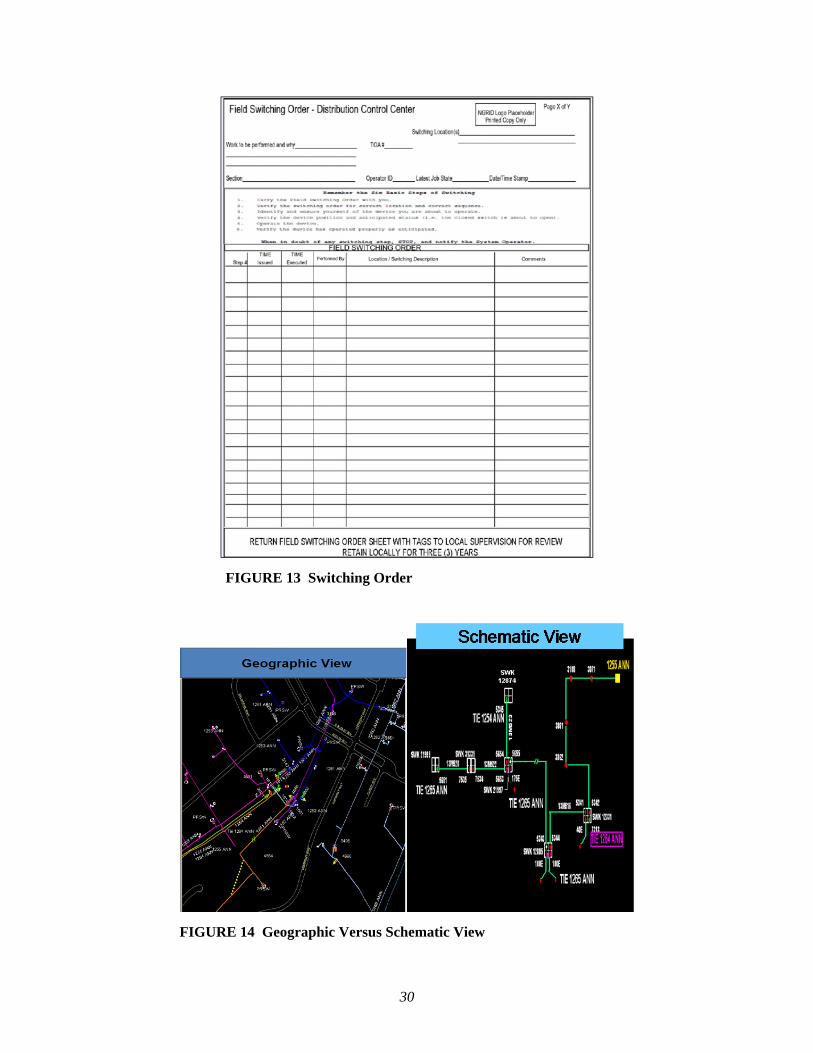
30
FIGURE 13 Switching Order
FIGURE 14 Geographic Versus Schematic View

31
In addition to the computer-assisted switch order generation facility described above, the DMS should be able to generate switching orders automatically. With this auto-generate feature, the dispatcher should select the power system device or portion of the system (“large area restoration”) to be isolated and worked on. Figure 15 shows a typical DMS display screen that is used to select the area for which a switching order is needed.
FIGURE 15 Selecting an Area for Creation of an Automatic Switch Order
It should be possible to execute defined switching orders in real time and in study mode. Real-time execution should be provided for switching orders that involve supervisory control commands. Study mode execution should allow the dispatcher to check out the switching order’s potential impact on the power system, including possible current and voltage violations, at a specified time and date using the DMS OLPF program prior to actual execution. The DMS should alert the dispatcher if any violations are detected during study mode execution of the switching order. 2.13 Volt-VAR Optimization (VVO) The DMS should include a VVO function that should automatically determine optimal control actions for volt and VAR control devices (e.g., substation LTC, midline voltage regulator, switched capacitor banks) to achieve specified volt/VAR “operating objectives” while maintaining acceptable voltage and loading at all feeder locations. In addition to the basic voltage and loading constraints, the VVO function should not violate other constraints established by the utility, such as daily limits on the number of voltage regulator and capacitor bank operations. The VVO application should include a set of displays for managing the operation of VVO, viewing VVO results, viewing a tabulation of estimated benefits and other such purposes. Figure 16 depicts a representative DMS model-driven VVO solution.

32
VVO should include the following utility-selectable operating objectives of:
Reducing electric demand Reducing energy consumption Improving feeder voltage profile Maximizing revenue Minimizing energy loss/improving power factor Achieving a weighted combination of the above
FIGURE 16 VVO DMS-based, Model-driven Solution The VVO function should operate either in closed-loop or advisory (open-loop) mode. In advisory mode, the VVO function should generate advisory control actions that may then be implemented by the dispatcher. In closed-loop mode, the VVO program should automatically execute the optimal control actions without operator verification. The VVO should be executed periodically at a user-adjustable interval, upon occurrence of a specified event (e.g., significant change in the distribution system such as significant load transfer, topology change) or manually by the user.
33
The DMS should obtain near-real-time voltage measurements from a small number (between 10 and 20) of AMI meters. These voltage measurements should be continuously monitored by the DMS to verify that voltage constraints are not violated at these locations and to determine whether a feeder outage has occurred. The VVO function should have a “failsafe” design. That is, no control action that would produce unacceptable voltage or loading conditions should be requested by the DMS as a result of the failure of any DMS component or for any other reason. IEDs used on feeder devices should possess a “heart beat” function in their communication capability to detect loss of communication with the master station within 10 minutes — this time period should be programmable. The VVO application should periodically check that the feeder IEDs are under VVO monitoring using the “heart-beat” functionality of the controller. If the local controller fails to communicate with the VVO central processor for a specified time period, the controller should revert to local (stand-alone) control. When a VVO component is out of service for any reason (e.g., controller failure, loss of communications, controller manually bypassed, blown capacitor fuse), the DMS should continue to operate in these abnormal situations —if possible without producing unacceptable voltage and loading conditions — using the remaining DMS components. 2.14 Fault Location, Isolation, and Service Restoration The DMS should include a FLISR function that should be used to reduce outage duration (i.e., improve the system average interruption duration index [SAIDI]). FLISR may also improve system average interruption frequency index (SAIFI) because some customers will be restored to service in less time than the threshold for permanent outages (usually 1 minute). FLISR should provide SAIDI improvement benefits for a wide variety of feeder configurations with various levels of protection and automation, ranging from feeders in which the substation circuit breaker is the only controllable device and source of information to feeders that are equipped with automated line switches, ties switches, fault detectors, and other facilities for monitoring and control. The FLISR main logic should:
Automatically detect faults,
Automatically determine the approximate location of the fault (i.e., the faulted section of the feeder between two feeder switches),
Automatically isolate the faulted section of the feeder, and
Automatically restore service to as many customers as possible in less than one (1)
minute following the initial circuit breaker or recloser tripping. The DMS should analyze all available real-time information acquired from field devices, including fault detector outputs, fault magnitude at various locations on the feeder, feeder

34
segment and customer meter energization status, and protective relay targets, to detect faults and other circuit conditions for which service restoration actions are required. All control actions identified by centralized FLISR should be executed by issuing supervisory control commands to substation circuit breakers and reclosers and various feeder switching devices (reclosers, load breaker switches, and sectionalizers that are equipped with supervisory control capabilities). The DMS FLISR function should only operate for permanent faults occurring out on the main three-phase portion of the feeder and for substation faults that cause the sustained loss of one or more feeders at the substation. Temporary faults that are cleared without sustained loss of service by standard automatic reclosing schemes do not result in execution of FLISR control actions. The FLISR function does not attempt to perform control actions to restore service loss resulting from blown fuses on feeder laterals, emergency load-shedding activities, and manual feeder tripping. Before executing any downstream service restoration actions, the DMS should confirm that the alternative source is energized (available) and able to accommodate the additional load being switched. Service restoration actions performed or recommended by the DMS should not produce undesirable electrical conditions, such as low voltage or equipment overloads, on any of the utility’s feeders. The DMS should analyze pre-fault loading on the faulted feeder and available capacity on the alternative source feeders to determine whether such undesirable electrical conditions would occur on the backup feeder if proposed switching actions are performed. The available capacity on alternative source feeders can be determined by comparing the pre-fault loading on the alternative source feeder with the feeder rating. The DMS should consider all possible ways to restore as much of the load as possible without creating such undesirable conditions. The preferred service restoration strategy is a switching strategy that:
1. Does not cause undesirable electrical conditions on any distribution feeder. 2. Restores electrical service to the maximum number of customers. 3. Requires the fewest number of switching actions.
If any portion of the interrupted load cannot be restored by the DMS because of loading or other undesirable electrical effects, the DMS informs the operator of this condition via an alarm/event message on the existing DMS. 2.15 Predictive Fault Location When a short circuit occurs on the distribution feeder, modern protective relay IEDs are able to capture the fault current magnitude and the voltage magnitude at the time of the fault. Dividing the voltage magnitude by the current magnitude at the time of the fault yields the impedance to fault (in ohms) seen by the relay. Dividing the impedance to fault seen by the relay by the conductor ohms-per-mile yields the approximate distance in miles from the distribution substation to the fault. Although electric distribution utilities have had some success in using this

35
approach, the distance-to-fault method supplied by the protective relay IED has several limitations that usually lower the overall accuracy of the approach:
The relay usually assumes homogeneous wire size/arrangement. If the wire or cable size is not uniform across the feeder, the calculations will be inaccurate.
The fault impedance is unknown. Fault impedance increases the apparent distance to the
fault, so if not properly accounted for, the results will be inaccurate. This missing element is less of a problem for underground feeders, because fault impedance is often negligible for underground cable circuits. On overhead lines, it is a common approach to determine the reactive ohms’ distance to fault because fault impedance tends to be resistive in nature. Alternatively, default fault impedance may be assumed.
The protective relay IED does not account for in-feeder fault current from distributed
generating units. Failure to account for in-feeder DG will result in a predicted fault location that is further downstream than the actual fault location.
The DMS should include a PFL application that uses SCA and an as-operated short-circuit model of the electric distribution system to determine feeder locations where a fault might produce the current magnitude observed at the head end on the feeder by protective relay IEDs. The distance-to-fault software repeatedly executes the SCA program with simulated faults at all plausible fault locations for the given fault current. Fault locations that result in fault current that matches the measured fault current are “candidate” fault locations (Figure 17).
FIGURE 17 Predictive Fault Location This approach has several advantages compared to the protective relay distance-to-fault information:

36
It is not necessary to assume homogeneous conductor sizing, because the calculations use an as-operated short-circuit model of the electric distribution. As a result, the conversion of fault impedance to actual distance yields a far more accurate result than the relay IED approach.
It is possible to account for the short circuit in-feed from distributed generating units if
these units are properly modeled in the as-operated short-circuit model of the electric distribution system. The short-circuit calculations used in this method will properly account for the short-circuit contributions of DG units.
The effects of fault impedance are handled in a manner similar to that used in protective relay IEDs (use of a default value for fault impedance, use of short-circuit reactance to determine distance to fault, etc.) Predictive fault location may identify multiple candidate fault locations on branched (bifurcated) feeders. The electric utility should be able to narrow down the possible fault locations by combining distance-to-fault data with OMS fault-interrupting device predictions and AMI voltage measurements at the time of the fault. 2.16 Optimal Network Reconfiguration The DMS should include an Optimal Network Reconfiguration (ONR) function that should identify ways in which the utility can reconfigure a user-selected, interconnected set of distribution feeders to accomplish a user-specified objective function without violating any loading or voltage constraints on the feeders. The entity to be used in ONR should be selected by the user (e.g., division [area of a few substations], one substation). As a minimum, the DMS ONR function should enable the user to achieve the following objective functions:
Minimize total electrical losses on the selected group of feeders over a specified time period;
Minimize the largest peak demand among the selected group of feeders over a specified
time period;
Balance the load between the selected group of feeders (i.e., transfer load from heavily loaded feeders to lightly loaded feeders); or
Realize results using a combination of the first three objectives with a weighting factor
for each. The ONR functional output should include a list of recommended switching actions and a switching plan to accomplish these actions, along with a summary of the expected benefits (e.g., amount of loss reduction).

37
2.17 Short-Term Load Forecasting The DMS should include an STLF function that should use historical load and weather data to forecast the system load automatically every hour for a 168-hour (7-day) rolling forecast. Weather data should be used to support the STLF function. The STLF results should be available for viewing and outage planning and should also be used by other DMS application functions that require an estimate of expected peak loading in the near term, such as FLISR, SOM, network reconfiguration, and large area restoration. STLF should use both a weather-adaptive and a similar-day forecast methodology to obtain the most accurate prediction. It should be possible to assign weighting factors to the results of each methodology to obtain a weighted average forecast. The load forecast should be based on historical load measurements or, in the future, actual meter readings obtained from AMI for the specified feeder on a “similar day” during the most recent past years. As a minimum, “similar” days should be selected based on day of week (weekend, holiday) and month or season. 2.18 Dynamic Equipment Rating The DMS should include a dynamic equipment rating function that calculates thermal ratings (real-time ampacities) of substation transformers and distribution feeders (underground cables and overhead lines) on a real-time basis. The objective of this function should be to calculate variable ratings based on actual loading and ambient conditions rather than worst-case weather and load assumptions. Weather data should be used to support the dynamic equipment rating function. Substation transformer ratings should be based on:
Recent loading history
Internal temperature measurements (e.g., top oil, bottom oil, and hot spot temperatures for substation transformers)
Status of forced cooling systems (e.g., pumps and fans on substation transformers)
Ambient temperature
Season.
Underground cable ratings should be based on duct temperature measurements (where available) and position in the duct bank.

38
2.19 DMS Control of Protection Settings (Adaptive Protection) The DMS should include application functions to assist the operators in switching between pre-established setting groups that are currently installed in the utility’s protective relays and reclosers when the need arises. Several potential uses of this application are summarized below:
Fuse Saving Enable/Disable. Circuit breaker reclosing relays and line reclosers used by many electric utilities include user-selectable setting groups for “fuse saving” and “fuse blowing.” The DMS should include a function that should enable the user to switch between the “fuse saving” setting group and the “fuse blowing” setting group for user-selected circuit breaker reclosing relays located in substations and reclosers located in substations and out on the distribution feeder.
Cold Load Pickup Enable/Disable. Circuit breaker protective relays and reclosers may
include user-selectable setting groups for handling normal service restoration and “cold load” pickup. Cold load pickup settings include additional time delays and higher pickup settings to prevent re-tripping when re-energizing the feeder or a portion of the feeder following a lengthy (sustained) outage. The DMS should include a function that should enable the user to switch between the normal setting group and the “cold load pickup” setting group for user-selected circuit breaker protective relays and reclosers located in substations and reclosers located out on the distribution feeder.
2.20 Distributed Energy Resource Management As the penetration level of DER (distributed generators, energy storage devices, and controllable loads) continues to grow on the electric distribution system, these devices will have a significant impact on overall distribution system performance. As a result, continuous monitoring and control of these DER may be needed. The DERs, such as solar photovoltaic and battery storage, do not connect to the distribution grid directly but often connect to the distribution grid at point of common coupling via a smart inverter. The DMS can be used to manage the smart inverter to increase distribution system reliability, efficiency, and performance.2 The current industry direction for DER monitoring and control is a DER management system (DERMS), which handles the direct interface to DER for monitoring and control purposes rather than DSCADA.3 The DMS will obtain DER-related information as needed via enterprise system integration techniques such as ESB. Figure 18 illustrates the separation of DSCADA and DERMS functionality for field device monitoring and control.
2 EPRI, 2013b, Smart Distribution Application for Distributed Energy Resources: Distribution Management
System Use Cases, Palo Alto, Calif., 3002002464. 3 EPRI, 2013c, Smart Distribution Applications for Distributed Energy Resources, Palo Alto, Calif., 070625.

39
FIGURE 18 Separation of DSCADA and DERMS Functionality The DMS should use available DER, owned by both customers and utility companies, to help control real and reactive power requirements on the distribution system.4 The DMS requests DG power factor modifications and remote generation disconnection. The DMS monitors in real time the actions taken by the IPPs, such as verification that requested load reduction has actually taken place. The DMS also enables the utility to monitor the performance of customer-owned power generators. The DMS should include facilities to enable the utility to incorporate IPPs into real-time generation dispatch and control. The DMS can use a customer’s DG unit to help control real or reactive power imbalance on a distribution circuit. The DMS (or AMI system) monitors energy flow at the metering point to determine customer response. The DMS controls the generation of MW/MX output using SCADA in a manual mode and performs power balancing and generation dispatch in an automatic mode. In manual mode, the dispatcher should be able to specify the amount of MW/MX and send it through SCADA. In automatic mode, the generator control is placed in AUTO, and the DMS application dispatches through SCADA.
4 EPRI, 2012, Integrating Smart Distributed Energy Resources with Distribution Management Systems: An EPRI
Overview on Managing Distributed Energy Resources, Technical Report, Palo Alto, Calif.

40
The DMS should include monitoring and control of temporarily isolated (“islanded”) portions of the distribution system powered by distributed generating resources owned by IPPs and the utility company. This activity is commonly referred to as “microgrid” operation — the intentional islanding of selected portions of the distribution system to enhance reliability and maintain power supply to customers with critical loads. Industry activities to create DER standards have thus far focused almost exclusively on the behaviour of individual DER units and the communication protocols over the field networks that connect directly to these devices.5 The functions include:
Intelligent Volt-VAR control
Intelligent Volt-Watt control
Reactive power/power factor
Low-voltage ride through
Load and generation following
Storage systems charge/discharge management
Connect/disconnect dynamic reactive current injection (responding to changes in voltage dV/dt)
Maximum generation limiting
Intelligent frequency-Watt control
Peak limiting function for remote points of reference
In Figure 18, the function of managing the DER devices is shown as an enterprise application called a DERMS. In actual implementations, DERMS functionality may or may not be a dedicated software product. Stand-alone DERMS products could be developed and deployed, or DERMS functionality could be integrated into DMS, EMS, SCADA, or other applications. Nevertheless, it is beneficial at this early stage of industry consideration to think of a DERMS as a separate logical entity so that the interactions between DER and other utility systems can be identified and supporting information standards developed. 2.21 Demand Response Management One of the key challenges for today’s electric utilities is mitigating the demand growth before it has to be met with heavy investments in new infrastructure capacity. The primary mitigating
5 EPRI, 2013c, Smart Distribution Applications for Distributed Energy Resources. Palo Alto, Calif., 070625.

41
measures are considered to be energy efficiency and demand reduction (EEDR) programs. Demand response (DR, also known as load response) enables end-use customers to reduce their use of electricity in response to power grid needs, economic signals from a competitive wholesale market, or special retail rates. Wholesale electricity markets provide opportunities for end-use customers to realize value for reducing their demand for electricity. Demand response is an integral part of markets for energy, ancillary service, and capacity. Demand response may compete equally with generation in these markets. Achieving demand response goals will require additional metering and communication facilities that will enable the utility to send signals about electricity prices and system grid reliability directly to the customers over networks such as the Internet. Facilities are also needed to enable measurement and verification (M&V) of the end customer’s response to a DR event (call for demand reduction). The DMS should be able to use these DR facilities for implementing “surgical” load reduction when needed. For example, if a load transfer operation by the FLISR application is blocked because of high load, then the DMS should be able to call upon DR where possible to reduce the load and therefore enable the load transfers to go through. 2.22 Emergency Load Shedding The DMS should include an emergency load shedding (ELS) function that can execute upon request in real time. This function should be synchronized with load shedding functions that are executed in EMS (under frequency, under voltage load shedding). The objective of ELS is to minimize the manual effort that is required to shed a specified amount of load and restore the previously shed load when the initiating problem is corrected. Then the user can initiate load shedding only for loads that are included in the user’s assigned AOR. When emergency load shedding is required, the user activates the ELS function and enters the amount of load to be shed. Then the ELS determines which switching devices to operate to accomplish the load-shedding objective. 2.23 Smart EV Charging Widespread deployment of electric vehicles is not expected to affect the electric distribution systems of many utility companies in the near term. However, there may be some areas with pockets of high EV deployment. Even low levels of EV adoption will have a significant impact on utilities and the grid — a single EV plugged into a fast charger can double a home’s peak electricity demand. The DMS should include suitable mechanisms for managing EV charging in a manner that is optimized for grid load while guaranteeing that drivers’ schedules and range requirements are met. EV charging should be scheduled intelligently in order to avoid overloading the grid’s peak hours and take advantage of off-peak charging benefits. With a DMS, the utility can manage

42
when and how EV charging occurs while still adhering to customer preferences, collect EV-specific meter data, apply specific rates for EV charging, engage consumers with information on EV charging, and collect data for greenhouse gas abatement credits. 2.24 Dispatcher Training Simulator The DMS should include a distribution training simulator (DTS) that provides a realistic environment for hands-on dispatcher training under simulated normal, emergency, and restorative operating conditions. The training should be based on interactive communication between instructor and trainee. The DMS training simulator should include a complete replica of the real-time DMS user interface plus the operating model that simulates the real-time analog telemetry and status changes (elements’ models are the same). The DMS training simulator serves two main purposes:
Allows utility personnel to become familiar with the DMS system and its user interface without impacting actual substation and feeder operations.
Allows utility personnel to become familiar with the dynamic behavior of the electric
distribution system in response to manual and automatic actions by control and protection systems during normal and emergency conditions.
The DTS should be considerably more than a simple data “playback” facility. The DTS predicts (computes) the behavior of the power system under normal load circumstances and during simulated disturbances. For example, when a switch is opened by the instructor, the current through the switch automatically goes to zero. The event is reflected on the trainee’s screen as an open switch and the coloring is for a non-energized state. In other words, the distribution system model at the trainee’s console responds to all dynamic changes directed by the instructor. The DTS should fully emulate all monitoring and control capabilities of the real-time system, such as alarming, tagging, and AOR functionalities. To support this sophisticated functionality, the DMS training simulator should include a dynamic model of the distribution system that simulates the expected behavior of the electric distribution system in response to disturbances introduced by a training supervisor. The DMS training simulator should include either the same real-time model of the distribution system as it is in the control center or from selected saved cases that represents the distribution system at a specific date and time. The training simulator should include dynamic load models (profiles) together with forecast total feeder load that determines current and voltage values along the feeder during normal conditions. This information is displayed on the simulator operator consoles as though the simulated values were actual field measurements. The training simulator should enable the user (instructor) to introduce equipment and control failures to the system, and the simulator should calculate and present the expected result to the trainee. Thus, the instructor can place simulated single- and multiphase faults at any location along the feeder using the simulator’s supervisor console, and the simulator can (in turn)

43
calculate and display the expected fault current magnitude and resultant protective device operation(s). It should be possible to introduce events into the DTS to simulate equipment failures, faults, or other anomalies. Following the introduction of an event, the DTS would automatically simulate the operation of the actual automatic control equipment, such as protective relays and reclosers, which are installed in distribution substations and in the field (outside the substation fence).

44
This page is intentionally left blank.

45
3 REFERENCES EPRI (Electric Power Research Institute), 2012, Integrating Smart Distributed Energy Resources with Distribution Management Systems: An EPRI Overview on Managing Distributed Energy Resources, Palo Alto, Calif., Technical Report. EPRI, 2013a, Distribution Management Systems Planning Guide, Palo Alto, Calif., 1024385. EPRI, 2013b, Smart Distribution Application for Distributed Energy Resources: Distribution Management System Use Cases, Palo Alto, Calif., 3002002464. EPRI, 2013c, Smart Distribution Applications for Distributed Energy Resources. Palo Alto, Calif., 070625.

46
This page is intentionally left blank.

