dmd 39:1131–1138, 2011 printed in u.s.a. cytochrome...
TRANSCRIPT
Cytochrome P450-Dependent Metabolism in HepaRG CellsCultured in a Dynamic Three-Dimensional Bioreactor
Malin Darnell, Thomas Schreiter, Katrin Zeilinger, Thomas Urbaniak, Therese Soderdahl,Ingrid Rossberg, Birgitta Dillner, Anna-Lena Berg, Jorg C. Gerlach, and Tommy B. Andersson
Drug Metabolism & Pharmacokinetics Centre of Excellence (M.D., T.B.A.) and Global Safety Assessment (T.So., B.D., A.-L.B.),AstraZeneca R&D, Molndal, Sweden; Division of Experimental Surgery, Berlin Brandenburg Center for Regenerative Therapies,
Charite Universitatsmedizin Berlin, Berlin, Germany (T.Sc., K.Z., T.U., I.R.); McGowan Institute for Regenerative Medicine,University of Pittsburgh, Pittsburgh, Pennsylvania (J.C.G.); and Department of Physiology and Pharmacology, Karolinska
Institutet, Stockholm, Sweden (M.D., T.B.A.)
Received January 4, 2011; accepted March 24, 2011
ABSTRACT:
Reliable and stable in vitro cellular systems maintaining specificliver functions important for drug metabolism and disposition areurgently needed in preclinical drug discovery and developmentresearch. The cell line HepaRG exhibits promising properties suchas expression and function of drug-metabolizing enzymes andtransporter proteins, which resemble those found in freshly iso-lated human hepatocytes. In this study, HepaRG cells were cul-tured up to 68 days in a three-dimensional multicompartment cap-illary membrane bioreactor, which enables high-density cellculture under dynamic conditions. The activity of drug-metaboliz-ing cytochrome P450 (P450) enzymes was investigated by a cock-tail of substrates for CYP1A1/2 (phenacetin), CYP2C9 (diclofenac),CYP2B6 (bupropion), and CYP3A4 (midazolam). The model P450substrates, which were introduced to the bioreactor system mim-
icking in vivo bolus doses, showed stable metabolism over theentire experimental period of several weeks with the exception ofbupropion hydroxylase, which increased over time. Ketoconazoletreatment decreased the CYP3A4 activity by 69%, and rifampicininduced the CYP3A4- and CYP2B6-dependent activity 6-fold,which predicts well the magnitude of changes observed in vivo.Moreover, polarity of transporter expression and formation of tis-sue-like structures including bile canaliculi were demonstrated byimmune histochemistry. The long-lasting bioreactor system usingHepaRG cells thus provides a promising and stable liver-like invitro model for continuous investigations of the hepatic kinetics ofdrugs and of drug-drug interactions, which well predict the situa-tion in vivo in humans.
Introduction
Drug-metabolizing enzymes and drug transporters in the liver play acritical role in the clearance and in drug-drug interactions of manymedicinal products. Freshly isolated human hepatocytes represent a goodmodel of the liver because they are able to perform the full range ofknown in vivo drug biotransformation pathways and retain many of theuptake and efflux functions of the liver cells (De Bartolo et al., 2006).
However, the use of primary human hepatocytes has several draw-backs such as scarce and unpredictable availability, huge variation incell functions, especially cytochrome P450 (P450) activities, as wellas a variable response to P450 inducers (Luo et al., 2002; Madan et al.,2003; Abadie-Viollon et al., 2010). The large variation in cell func-tions can be explained in part by interdonor variability. However, thevariable loss of liver-specific functions during cell preparation and instandard in vitro culture conditions over time may cause additionalvariation of hepatocyte performance not related to the normal inter-individual differences found in a population (Rodríguez-Antona et al.,2002).
In vivo, the liver cells are located in a perfused organ where theyare arranged in three-dimensional (3D) structures forming cell-cellcontacts, which are important for the intracellular function and alsofor maintaining their specific polarity. It has been shown that porcineor human liver cells retain in vivo-like properties and are arranged intissue-like structures including formation of biliary canalicular net-works and neo-sinusoids when cultured in a perfused 3D bioreactor(Zeilinger et al., 2004; Schmelzer et al., 2009). More importantly,liver-specific functions such as urea and albumin synthesis, glucosemetabolism, and P450 activities were all maintained for at least 14
Part of this work was previously presented at the following meetings: DarnellM, Schreiter T, Soderdahl T, Rossberg I, Zeilinger K, Gerlach JC, and AnderssonTB (2009) Cytochrome P450 induction in HepaRG cells cultured in a dynamic 3Dbioreactor. Biotransformation and Disposition of Xenobiotics, 11th European Re-gional ISSX Meeting; 2009 May 17–20; Portugal, Lisbon. Official Journal of theInternational Society for the Study of Xenobiotics, Washington, DC; Darnell M,Schreiter T, Soderdahl T, Rossberg I, Zeilinger K, Gerlach JC, and AnderssonTB (2009) Cytochrome P450 induction in HepaRG cells cultured in a dynamic3D bioreactor. 2009 AAPS Annual Meeting and Exposition; 2009 Nov 8–12;Los Angeles, CA. American Association of Pharmaceutical Scientists, Arling-ton, VA.
Article, publication date, and citation information can be found athttp://dmd.aspetjournals.org.
doi:10.1124/dmd.110.037721.
ABBREVIATIONS: P450, cytochrome P450; 2D, two-dimensional; 3D, three-dimensional; AST, aspartate aminotransferase; CK19, cytokeratin 19;DMSO, dimethyl sulfoxide; IHC, immunohistochemical staining; LDH, lactate dehydrogenase; MDR, multidrug resistance; P-gp, P-glycoprotein.
0090-9556/11/3907-1131–1138$25.00DRUG METABOLISM AND DISPOSITION Vol. 39, No. 7Copyright © 2011 by The American Society for Pharmacology and Experimental Therapeutics 37721/3692648DMD 39:1131–1138, 2011 Printed in U.S.A.
1131
at ASPE
T Journals on June 25, 2018
dmd.aspetjournals.org
Dow
nloaded from

days in this type of bioreactor (Zeilinger et al., 2002). The multicom-partment bioreactor technology initially described by Gerlach et al.(1994) was developed as a large-scale 800-ml clinical bioartificialliver support system. The technology is based on the use of interwo-ven hollow fiber capillary membranes that provide independent, de-centralized medium and gas supply to the cells located between thecapillaries (Fig. 1. In this study, an analytical scale bioreactor with acell compartment volume of 2 ml was used for drug metabolismstudies.
HepaRG cells are an attractive alternative to primary human hepa-tocytes because they exhibit important functions for drug metabolismand disposition such as P450, UDP glucuronosyltransferase, andtransporter activities (Aninat et al., 2006; Le Vee et al., 2006; Kane-bratt and Andersson, 2008a; Hart et al., 2010). Recently, HepaRGcells in two-dimensional (2D) cultures were evaluated as a valuable invitro model for prediction of P450 induction in vivo in humans(Kanebratt and Andersson, 2008b).
In the present study, HepaRG cells cultured in the analytical scale3D bioreactor system were used to study the function of four majordrug-metabolizing enzymes, CYP1A1/2, CYP2C9, CYP2B6, andCYP3A4. In particular, the long-term stability of P450 enzyme ex-pression and function was assessed by repeating P450 activity studiesover several weeks. Furthermore, the ability to induce and inhibitP450 activities by the well characterized model inducer rifampicinand the inhibitor ketoconazole was sequentially investigated in thesame bioreactor culture. The results were also compared with pub-lished in vivo results to evaluate the predictive value of the observedeffects.
Materials and Methods
Bioreactor Technology. The bioreactor technology is based on three inde-pendent interwoven capillary systems integrated into a polyurethane housing(Fig. 1). Two of the capillary systems serve for countercurrent mediumperfusion, and a third set of capillaries serves for direct, decentralized gasexchange via diffusion. The cells reside in the cell compartment between thecapillaries, which form a 3D scaffold. A port enables substance injection,mimicking bolus administration, and sampling from the recirculating medium.Fresh medium is continuously supplied from the medium bottle, and excessmedium flows out into the outflow bottle (Fig. 1C). A detailed description ofthe bioreactor structure is given elsewhere (Schmelzer et al., 2009). In thisstudy, a downscaled bioreactor with a cell compartment volume of 2 ml wasused (Fig. 1B).
Proliferation and Differentiation of HepaRG Cells. The cells were firstproliferated in 2D flasks before bioreactor inoculation. The enriched HepaRGmedium (Biopredic International, Rennes, France) composed of Williams’medium E with GlutaMAX-I (Invitrogen, Darmstadt, Germany), supplementedwith 10% fetal bovine serum, 100 IU/ml penicillin, 100 �g/ml streptomycin,5 �g/ml bovine insulin, and 50 �M hydrocortisone hemisuccinate, waschanged five times in 2 weeks during 2D culture. The cells were trypsinated,
and 83 � 40 million cells were inoculated into the cell compartment of thebioreactor (n � 3). The cells had a viability above 90% as determined bytrypan blue staining. The proliferation phase was continued in the bioreactorfor 1 to 2 weeks using enriched HepaRG medium (Biopredic International).The differentiation of the cells was induced by changing the recirculatingmedium to high-DMSO HepaRG medium (Biopredic International) composedof enriched medium with the addition of 2% DMSO. The cells were allowedto differentiate for 2 weeks, then the high-DMSO medium was washed out andchanged back to enriched HepaRG medium (Fig. 2). Because the cells wereboth expanded and differentiated in the bioreactor, an initial long lead time wasneeded before the first experiments could be performed. However, we arecurrently designing a bioreactor model in which fully differentiated cryopre-served HepaRG cells are inoculated into the bioreactor, which will signifi-cantly shorten the lead time.
Immunostaining. Samples from cell culture material were taken fromdifferent locations within the bioreactor capillary network upon culture termi-nation. After fixation in 5% paraformaldehyde, the material was dehydrated,embedded in paraffin, and cut into approximately 5-�m sections. The immu-nohistochemical staining (IHC) was performed on the staining module Dis-covery XT (Ventana Medical Systems Inc., Tucson, AZ). Antibodies in usewere MDR1 [P-glycoprotein (P-gp), clone F4; Sigma-Aldrich, St. Louis, MO],multidrug resistance-associated protein 2 (MRP2; clone M2 III-6; Abcam,Cambridge, UK), and CYP3A4 (Cypex, Scotland, UK). All solutions fordeparaffinization, pretreatment, detection, counterstaining, and rinsing stepswere supplied by Ventana Medical Systems Inc. Heat (20 min for MDR1 in acitrate buffer, pH 6, or 40 min for MRP2 in a Tris/borate/EDTA buffer, pH 8,at 98°C) or enzyme (protease, 8 min at 37°C, for CYP3A4) was used asantigen-retrieval pretreatment. Both primary and secondary antibodies werediluted in Discovery Ab Diluent. The IHC was visualized with diaminoben-zidine chromogen, and the counterstaining was performed with hematoxylin.
For immunofluorescence staining of cytokeratin 19 (CK19), sections weredeparaffinized with xylene and rehydrated with a series of decreasing concen-trations of alcohol. Antigens were retrieved by boiling sections for 25 min incitrate buffer (0.01 citric acid monohydrate, pH 6.0; Merck, Darmstadt, Ger-many) followed by incubation for 20 min in 5% Triton/phosphate-bufferedsaline. Sections were blocked with 5% skimmed milk followed by incubationwith monoclonal mouse anti-CK19 IgG1 (Santa Cruz Biotechnology, Inc.,Santa Cruz, CA) for 30 min. Cy2-conjugated polyclonal goat anti-mouse IgG(Dianova, Hamburg, Germany) was used as the secondary antibody. Fornonspecific staining of the nuclei, sections were incubated with 4�,6-diamidino-2-phenylindole (Molecular Probes, Carlsbad, CA). Subsequently,the sections were mounted with Aqua Polymount solution (Polysciences Inc.,Warrington, PA).
Determination of Clinical Chemistry Parameters. Biochemical parame-ters related to the cell integrity and to the synthesis capability of HepaRG cellswere measured daily in samples from the culture perfusate and/or the mediumoutflow. Concentrations of lactate were determined by means of an automatedcell culture analyzer (Bioprofile analyzer 100plus; IUL Instruments GmbH,Konigswinter, Germany). Activities of lactate dehydrogenase (LDH) and as-partate aminotransferase (AST) were measured with an automated clinicalchemistry analyzer (Modular P800; Roche Diagnostics, Mannheim, Germany)using the corresponding assay kits from Roche/Cobas). Human albumin was
FIG. 1. Multicompartment perfusion bioreactor with a volume of 2 mlused for 3D culture of HepaRG cells. A, arrangement of capillaries inthe bioreactor; two independently perfused capillary systems (red andblue) serve for culture medium perfusion of the cells located in theextracapillary space (cell compartment), and the third capillary system(yellow) serves for oxygen/CO2 exchange. B, bioreactor with connec-tions for medium perfusion, gas supply, and cell inoculation into thecell compartment. C, bioreactor perfusion system with tubing for me-dium recirculation, feeding, and outflow. The recirculation pump con-trols the speed of medium perfusion through the bioreactor, and thefeed pump supplies the system with fresh medium from the mediumbottle. The sampling port enables substance injection and sampling.The cells in the bioreactor are continuously supplied with air and CO2.
1132 DARNELL ET AL.
at ASPE
T Journals on June 25, 2018
dmd.aspetjournals.org
Dow
nloaded from
quantified using ready-to-use enzyme-linked immunosorbent assay test kits(Exocell, Philadelphia, PA).
The daily production of biochemical parameters in the bioreactors wascalculated on the basis of concentrations measured in the outflow bottle and inthe perfusion circuit (Fig. 1), according to the following formula:
P/�t � �CO�CM) � VO/�t � (Cd � Cd�1� � VR/�t (1)
where P is the total production rate, �t is the time interval between twosampling time points, CO is concentration in the outlet vessel, CM is mediumblank concentration, VO is volume of medium in the outlet vessel, Cd isconcentration in perfusate at the time point of sample taking, Cd-1 is concen-tration in the previously taken sample from the perfusate, and VR is recircu-lating volume.
The average daily production was calculated for the proliferation phase(8–14 days), the differentiation phase (14 days), and the experimental phase(26–37 days) by dividing the total production during the whole phase by thenumber of days the phase lasted. Subsequently, the mean values and S.D.swere calculated for the three bioreactors. The parameters are presented asmilligrams per day per bioreactor or unit per day per bioreactor.
P450 Activity Measurements. P450 activity was assessed by adding aP450 cocktail through the sampling port close to the bubble trap (Fig. 1C). Themedium in the bubble trap was mixed a few times before starting the recircu-lation of the medium (t � 0 h), allowing the substrate to reach the cells in thebioreactor. The P450 cocktail consisted of phenacetin (CYP1A1/2), midazo-lam (CYP3A4), diclofenac (CYP2C9), and bupropion (CYP2B6). The metab-olites were measured in the medium over a period of 6 h. The parent drugsphenacetin and diclofenac (both from Sigma-Aldrich, Deisenhofen, Germany)were prepared as 20 mM stock solutions in DMSO and diluted in culturemedium to achieve final concentrations of 26 and 9 �M in the bioreactorcircuit. Midazolam was provided as an aqueous solution (Dormicum; RochePharma, Grenzach-Wyhlen, Germany) at 13.8 mM (5 mg/ml) and diluted to afinal concentration of 3 �M. Bupropion (Toronto Research Chemicals Inc.,Toronto, ON, Canada) was prepared as a 50 mM aqueous stock solution anddiluted to a final concentration of 100 �M.
Analysis of the P450 metabolism was performed at continuous mediumperfusion, but without feeding medium into the perfusion circuit (closed-system perfusion). Samples (200 �l) were taken at 0, 0.25, 0.5, 1, 2, 4, and 6 h.After each experiment, the bioreactor circuit was rinsed with 75 ml of culturemedium (single-pass perfusion) and was then reset to the standard operationmode with continuous medium feed (open-system perfusion). Samples werefrozen until further processing. The activities were measured as an increase inmetabolite concentration in the medium. No attempts were made to relate theactivities to the total amount of protein or number of cells, because this isdifficult to assess in the bioreactor. However, the effects on P450 activities byketoconazole and rifampicin are presented as relative changes in the bioreac-
tors containing differentiated cells; thus, the absolute amount of proteins orcells are not important for interpretation of the results.
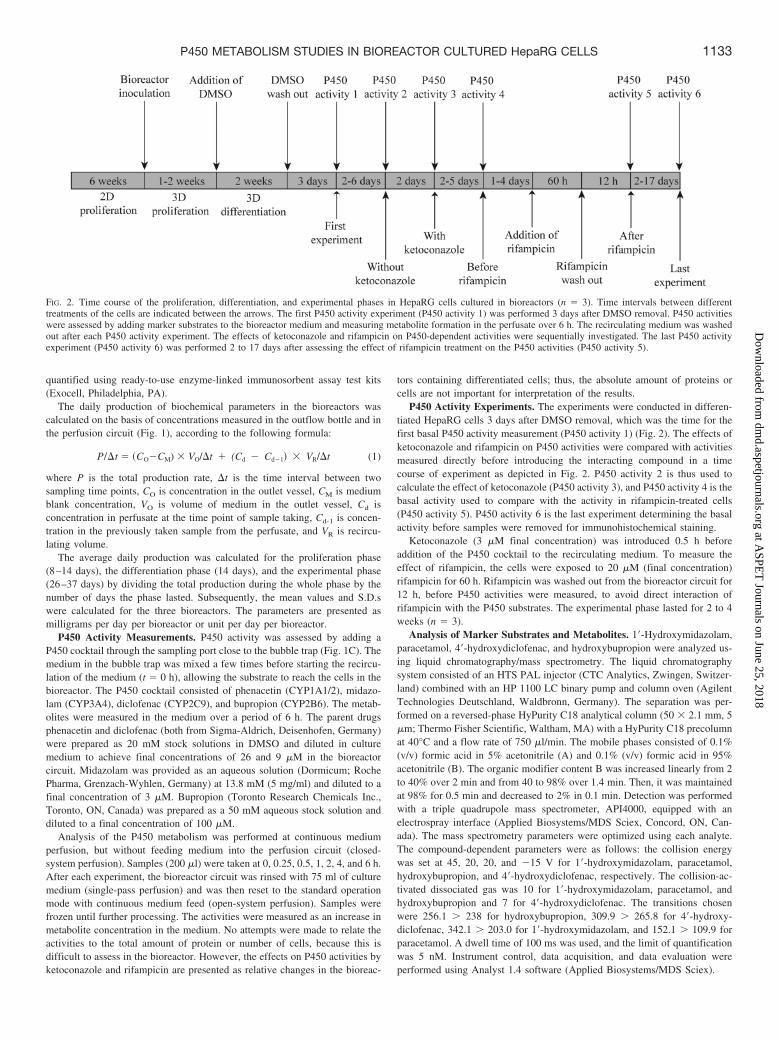
P450 Activity Experiments. The experiments were conducted in differen-tiated HepaRG cells 3 days after DMSO removal, which was the time for thefirst basal P450 activity measurement (P450 activity 1) (Fig. 2). The effects ofketoconazole and rifampicin on P450 activities were compared with activitiesmeasured directly before introducing the interacting compound in a timecourse of experiment as depicted in Fig. 2. P450 activity 2 is thus used tocalculate the effect of ketoconazole (P450 activity 3), and P450 activity 4 is thebasal activity used to compare with the activity in rifampicin-treated cells(P450 activity 5). P450 activity 6 is the last experiment determining the basalactivity before samples were removed for immunohistochemical staining.
Ketoconazole (3 �M final concentration) was introduced 0.5 h beforeaddition of the P450 cocktail to the recirculating medium. To measure theeffect of rifampicin, the cells were exposed to 20 �M (final concentration)rifampicin for 60 h. Rifampicin was washed out from the bioreactor circuit for12 h, before P450 activities were measured, to avoid direct interaction ofrifampicin with the P450 substrates. The experimental phase lasted for 2 to 4weeks (n � 3).
Analysis of Marker Substrates and Metabolites. 1�-Hydroxymidazolam,paracetamol, 4�-hydroxydiclofenac, and hydroxybupropion were analyzed us-ing liquid chromatography/mass spectrometry. The liquid chromatographysystem consisted of an HTS PAL injector (CTC Analytics, Zwingen, Switzer-land) combined with an HP 1100 LC binary pump and column oven (AgilentTechnologies Deutschland, Waldbronn, Germany). The separation was per-formed on a reversed-phase HyPurity C18 analytical column (50 � 2.1 mm, 5�m; Thermo Fisher Scientific, Waltham, MA) with a HyPurity C18 precolumnat 40°C and a flow rate of 750 �l/min. The mobile phases consisted of 0.1%(v/v) formic acid in 5% acetonitrile (A) and 0.1% (v/v) formic acid in 95%acetonitrile (B). The organic modifier content B was increased linearly from 2to 40% over 2 min and from 40 to 98% over 1.4 min. Then, it was maintainedat 98% for 0.5 min and decreased to 2% in 0.1 min. Detection was performedwith a triple quadrupole mass spectrometer, API4000, equipped with anelectrospray interface (Applied Biosystems/MDS Sciex, Concord, ON, Can-ada). The mass spectrometry parameters were optimized using each analyte.The compound-dependent parameters were as follows: the collision energywas set at 45, 20, 20, and �15 V for 1�-hydroxymidazolam, paracetamol,hydroxybupropion, and 4�-hydroxydiclofenac, respectively. The collision-ac-tivated dissociated gas was 10 for 1�-hydroxymidazolam, paracetamol, andhydroxybupropion and 7 for 4�-hydroxydiclofenac. The transitions chosenwere 256.1 238 for hydroxybupropion, 309.9 265.8 for 4�-hydroxy-diclofenac, 342.1 203.0 for 1�-hydroxymidazolam, and 152.1 109.9 forparacetamol. A dwell time of 100 ms was used, and the limit of quantificationwas 5 nM. Instrument control, data acquisition, and data evaluation wereperformed using Analyst 1.4 software (Applied Biosystems/MDS Sciex).
FIG. 2. Time course of the proliferation, differentiation, and experimental phases in HepaRG cells cultured in bioreactors (n � 3). Time intervals between differenttreatments of the cells are indicated between the arrows. The first P450 activity experiment (P450 activity 1) was performed 3 days after DMSO removal. P450 activitieswere assessed by adding marker substrates to the bioreactor medium and measuring metabolite formation in the perfusate over 6 h. The recirculating medium was washedout after each P450 activity experiment. The effects of ketoconazole and rifampicin on P450-dependent activities were sequentially investigated. The last P450 activityexperiment (P450 activity 6) was performed 2 to 17 days after assessing the effect of rifampicin treatment on the P450 activities (P450 activity 5).
1133P450 METABOLISM STUDIES IN BIOREACTOR CULTURED HepaRG CELLS
at ASPE
T Journals on June 25, 2018
dmd.aspetjournals.org
Dow
nloaded from

Calculations. Linear regression was used to describe data for 4�-hydroxy-diclofenac, 1�-hydroxymidazolam, paracetamol, and hydroxybupropion (seeFigs. 6–8) using GraphPad Prisma 4.0.3 (GraphPad Software, Inc., La Jolla,CA). The data for 1�-hydroxymidazolam after rifampicin treatment weredescribed by nonlinear regression using a polynomial second-order equation(see Fig. 8).
Formation rates of the metabolites were calculated over the 6-h experimentfor paracetamol, 1�-hydroxymidazolam, 4�-hydroxydiclofenac, and hydroxy-bupropion using the slope of the amount (nanomoles) versus time (hours)graph. Only the first 2 h of the experiment were used to calculate the formationrate of 1�-hydroxymidazolam after rifampicin treatment (GraphPad Prism4.0.3). The change in enzyme activities by rifampicin treatment was calculatedby dividing formation rate values after rifampicin treatment by the correspond-ing values before rifampicin treatment.
Statistical Analysis. The possible significance of the effect of rifampicin orketoconazole on the formation rate values of 1�-hydroxymidazolam or hy-droxybupropion was calculated using the two-tailed Student’s t test. The sametest was used to calculate the significance of differences between the first andlast P450 activity experiment.
Results
Immunostaining of CYP3A4, P-gp, MRP2, and CK19. Cellmaterial was removed from the bioreactor cell compartment after theP450 activity measurements and used for staining of P-gp (ABCB1),MRP2 (ABCC2), CYP3A4, and CK19 by monoclonal antibodies.
Histological pictures showed the formation of tissue-like cell aggre-gates between the capillaries (Fig. 3). As indicated in Fig. 3, CYP3A4and the apical efflux transporters P-gp and MRP2 were all present inthe bioreactor tissue. CYP3A4 was found to be expressed in thehepatocyte-like cells, and both P-gp and MRP2 were located to oneside of the hepatocyte-like cells forming bile canaliculi-like structures.The biliary marker CK19 was detected in strand-like structures withinthe cell aggregates as shown in Fig. 4.
Clinical Chemistry Parameters. Clinical chemistry analyses of themedium perfusate were performed daily during the culture period.The mean values (n � 3) of the daily medium values are shown for theproliferation, differentiation, and experimental phases in Fig. 5. Lactateproduction significantly (p 0.01) decreased by 34% during the differ-entiation phase compared with the proliferation phase, whereas no sig-nificant change was observed in albumin production (Fig. 5A). Thelactate and albumin production in the bioreactor inoculated with HepaRG
FIG. 3. IHC (brown) of apical efflux transporters P-gp (A) and MRP2 (B) and themetabolic enzyme CYP3A4 (C) in HepaRG bioreactor tissue using monoclonalantibodies. Both P-gp and MRP2 are located to one side of the hepatocyte-like cellsshowing bile canaliculi-like structures. The distribution of the HepaRG cells be-tween two capillaries is shown in A.
FIG. 4. Left, immunofluorescence staining of the biliary canaliculicell marker CK19 (green) in HepaRG bioreactor tissue using mono-clonal antibodies. Nuclei are counterstained with 4�,6-diamidino-2-phenylindole (blue). Right, corresponding phase-contrast image.
FIG. 5. The average daily production of lactate and albumin and release of LDHand AST in HepaRG bioreactors during the proliferation (white bar), differentiation(black bar), and experimental (patterned bar) phases. Lactate and albumin produc-tion (A) and LDH and AST release (B) are shown. The bars represent the meanvalues � S.D. of the average daily production or release in HepaRG bioreactors(n � 3). The levels of significance of changes between the differentiation andexperimental phases, respectively, compared with the proliferation phase are pro-vided. ��, p 0.01.
1134 DARNELL ET AL.
at ASPE
T Journals on June 25, 2018
dmd.aspetjournals.org
Dow
nloaded from

cells was comparable to what has been observed in bioreactors inoculatedwith human hepatocytes (Zeilinger et al., 2011). The release of LDH andAST was low and stable over the whole culture period (Fig. 5B).
Basal Levels and the Effect of Ketoconazole and Rifampicin onP450 Activities. The CYP2C9-, CYP1A1/2-, or CYP3A4-mediated activ-ities, calculated as the formation rates of the metabolites over the 6-h exper-iment, showed no difference between the first (Fig. 2, P450 activity 1) and thelast (Fig. 2, P450 activity 6) P450 experiment (Fig. 6, A–C). However, therate of CYP2B6-dependent hydroxybupropion formation increased 3.6-foldbetween the first and last experiment (Fig. 6D).
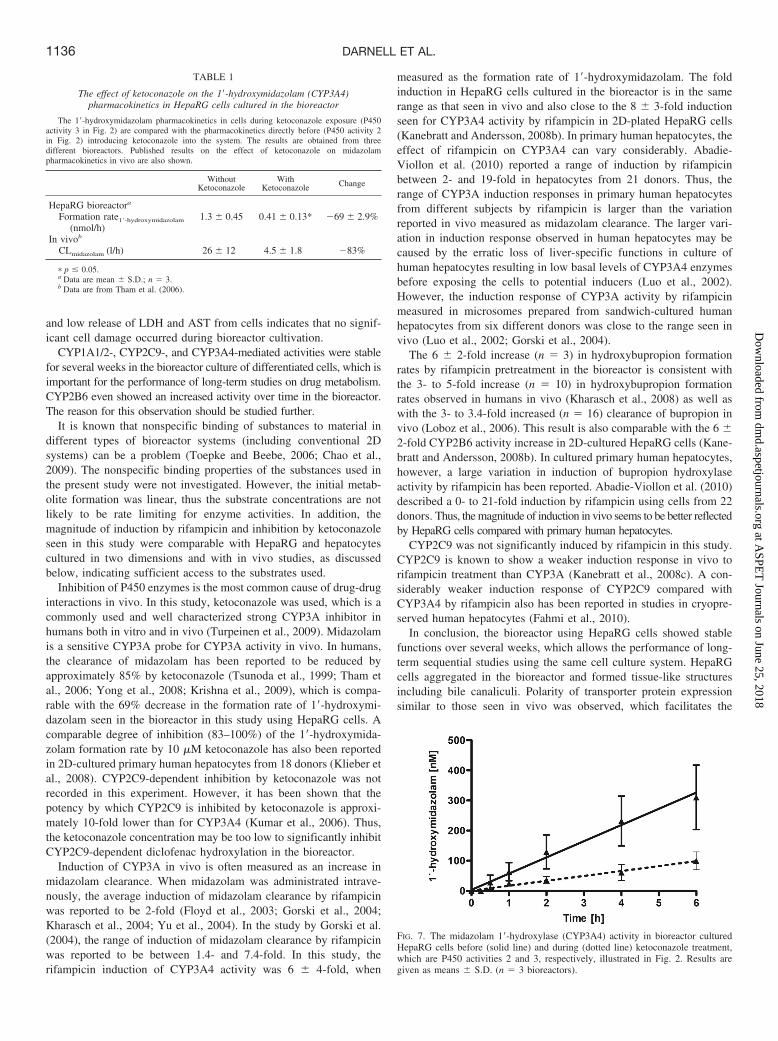
Ketoconazole and rifampicin were introduced into the bioreactor asdepicted in Fig. 2. The effects of ketoconazole and rifampicin on P450activities were compared with the activities measured directly beforeintroducing the interacting compounds. Ketoconazole was introducedinto the system, and the direct effects on the P450-mediated activitieswere investigated. The 1�-hydroxymidazolam formation rate de-creased by 69% (p 0.05) (Table 1; Fig. 7) upon ketoconazoletreatment, whereas the CYP2C9-, CYP2B6-, and CYP1A1/A2-dependent activities were not affected (data not shown).
The cell culture was exposed to rifampicin for 60 h and washed outfor 12 h before investigating P450 activities to avoid direct interactionof rifampicin with enzyme activity measurements. The CYP3A4-dependent 1�-hydroxymidazolam formation increased 6-fold uponrifampicin treatment (p � 0.05) (Table 2; Fig. 8A). Furthermore,CYP2B6-dependent bupropion hydroxylase activity was 6-fold higherafter rifampicin treatment (p 0.01) (Table 2; Fig. 8B), whereasphenacetin O-dealkylase (CYP1A1/2) and diclofenac 4�-hydroxylase(CYP2C9) activities were unaffected by rifampicin (data not shown).
Discussion
HepaRG cells represent a highly differentiated cell line that exhibitsseveral important human liver functions such as drug metabolism anddrug transporter activities (Aninat et al., 2006; Le Vee et al., 2006). Inthe present study, HepaRG cells were cultured in a dynamic 3Dbioreactor system to evaluate the suitability of this experimental set upas a human hepatic in vitro model for drug metabolism and dispositionstudies.
Confluent HepaRG cells are known to differentiate into both hep-atocyte-like and biliary epithelial-like cells (Aninat et al., 2006; Guil-louzo et al., 2007). Both cell types were present in the bioreactor, andthe proportion between the two cell types was presumed to remainconstant in the differentiated state when experiments were performed.The relative effects on P450 activities caused by ketoconazole andrifampicin that were evaluated in this study could thus reliably becalculated and compared with effects reported in other in vitro and invivo studies. The hepatocyte-like cells were polarized as revealed byimmunostaining of the transporter proteins P-gp and MRP2, whichwere located on one side of the cell. The P-gp- and MRP2-positivesides of the cells were also facing each other, which resembles thesituation in vivo where these transporters are located at the apicalmembranes of hepatocytes forming bile canaliculi-like structures.Strand-like formations of CK19-positive cells indicate the formationof biliary structures. Thus, the HepaRG cells in the bioreactor seem todevelop structures that resemble liver tissue in vivo. Studies areongoing to characterize in more detail the biliary structures and thefunction of transporters in the bioreactor.
The stable albumin production observed over the whole cultureperiod further implies a liver-like function of HepaRG cells whencultured in the bioreactor. Lactate production decreased significantlyduring differentiation, which can be explained by decreasing glucosemetabolism due to a decrease in proliferation associated with ongoing
differentiation. Furthermore, the albumin and lactate production wereat the same level as observed for primary human hepatocyte culturedin the same bioreactor prototype (Zeilinger et al., 2011). The stable
FIG. 6. Comparison of P450-specific activities in bioreactors housing differentiatedHepaRG cells 3 days after DMSO removal (solid line) and 2 to 4 weeks later (dottedline), which are P450 activities 1 and 6, respectively, illustrated in Fig. 2. The P450cocktail was added to the bioreactor recirculation at t � 0 h. The graphs show theconcentration-time profiles over 6 h and the formation rates of the formed metab-olites in HepaRG cells cultured in the bioreactor: A, paracetamol (CYP1A1/2activity); B, 4-hydroxydiclofenac (CYP2C9 activity); C, 1�-hydroxymidazolam(CYP3A4 activity); D, hydroxybupropion (CYP2B6 activity). Results are given asmeans � S.D. (n � 3 bioreactors).
1135P450 METABOLISM STUDIES IN BIOREACTOR CULTURED HepaRG CELLS
at ASPE
T Journals on June 25, 2018
dmd.aspetjournals.org
Dow
nloaded from
and low release of LDH and AST from cells indicates that no signif-icant cell damage occurred during bioreactor cultivation.
CYP1A1/2-, CYP2C9-, and CYP3A4-mediated activities were stablefor several weeks in the bioreactor culture of differentiated cells, which isimportant for the performance of long-term studies on drug metabolism.CYP2B6 even showed an increased activity over time in the bioreactor.The reason for this observation should be studied further.
It is known that nonspecific binding of substances to material indifferent types of bioreactor systems (including conventional 2Dsystems) can be a problem (Toepke and Beebe, 2006; Chao et al.,2009). The nonspecific binding properties of the substances used inthe present study were not investigated. However, the initial metab-olite formation was linear, thus the substrate concentrations are notlikely to be rate limiting for enzyme activities. In addition, themagnitude of induction by rifampicin and inhibition by ketoconazoleseen in this study were comparable with HepaRG and hepatocytescultured in two dimensions and with in vivo studies, as discussedbelow, indicating sufficient access to the substrates used.
Inhibition of P450 enzymes is the most common cause of drug-druginteractions in vivo. In this study, ketoconazole was used, which is acommonly used and well characterized strong CYP3A inhibitor inhumans both in vitro and in vivo (Turpeinen et al., 2009). Midazolamis a sensitive CYP3A probe for CYP3A activity in vivo. In humans,the clearance of midazolam has been reported to be reduced byapproximately 85% by ketoconazole (Tsunoda et al., 1999; Tham etal., 2006; Yong et al., 2008; Krishna et al., 2009), which is compa-rable with the 69% decrease in the formation rate of 1�-hydroxymi-dazolam seen in the bioreactor in this study using HepaRG cells. Acomparable degree of inhibition (83–100%) of the 1�-hydroxymida-zolam formation rate by 10 �M ketoconazole has also been reportedin 2D-cultured primary human hepatocytes from 18 donors (Klieber etal., 2008). CYP2C9-dependent inhibition by ketoconazole was notrecorded in this experiment. However, it has been shown that thepotency by which CYP2C9 is inhibited by ketoconazole is approxi-mately 10-fold lower than for CYP3A4 (Kumar et al., 2006). Thus,the ketoconazole concentration may be too low to significantly inhibitCYP2C9-dependent diclofenac hydroxylation in the bioreactor.
Induction of CYP3A in vivo is often measured as an increase inmidazolam clearance. When midazolam was administrated intrave-nously, the average induction of midazolam clearance by rifampicinwas reported to be 2-fold (Floyd et al., 2003; Gorski et al., 2004;Kharasch et al., 2004; Yu et al., 2004). In the study by Gorski et al.(2004), the range of induction of midazolam clearance by rifampicinwas reported to be between 1.4- and 7.4-fold. In this study, therifampicin induction of CYP3A4 activity was 6 � 4-fold, when
measured as the formation rate of 1�-hydroxymidazolam. The foldinduction in HepaRG cells cultured in the bioreactor is in the samerange as that seen in vivo and also close to the 8 � 3-fold inductionseen for CYP3A4 activity by rifampicin in 2D-plated HepaRG cells(Kanebratt and Andersson, 2008b). In primary human hepatocytes, theeffect of rifampicin on CYP3A4 can vary considerably. Abadie-Viollon et al. (2010) reported a range of induction by rifampicinbetween 2- and 19-fold in hepatocytes from 21 donors. Thus, therange of CYP3A induction responses in primary human hepatocytesfrom different subjects by rifampicin is larger than the variationreported in vivo measured as midazolam clearance. The larger vari-ation in induction response observed in human hepatocytes may becaused by the erratic loss of liver-specific functions in culture ofhuman hepatocytes resulting in low basal levels of CYP3A4 enzymesbefore exposing the cells to potential inducers (Luo et al., 2002).However, the induction response of CYP3A activity by rifampicinmeasured in microsomes prepared from sandwich-cultured humanhepatocytes from six different donors was close to the range seen invivo (Luo et al., 2002; Gorski et al., 2004).
The 6 � 2-fold increase (n � 3) in hydroxybupropion formationrates by rifampicin pretreatment in the bioreactor is consistent withthe 3- to 5-fold increase (n � 10) in hydroxybupropion formationrates observed in humans in vivo (Kharasch et al., 2008) as well aswith the 3- to 3.4-fold increased (n � 16) clearance of bupropion invivo (Loboz et al., 2006). This result is also comparable with the 6 �2-fold CYP2B6 activity increase in 2D-cultured HepaRG cells (Kane-bratt and Andersson, 2008b). In cultured primary human hepatocytes,however, a large variation in induction of bupropion hydroxylaseactivity by rifampicin has been reported. Abadie-Viollon et al. (2010)described a 0- to 21-fold induction by rifampicin using cells from 22donors. Thus, the magnitude of induction in vivo seems to be better reflectedby HepaRG cells compared with primary human hepatocytes.
CYP2C9 was not significantly induced by rifampicin in this study.CYP2C9 is known to show a weaker induction response in vivo torifampicin treatment than CYP3A (Kanebratt et al., 2008c). A con-siderably weaker induction response of CYP2C9 compared withCYP3A4 by rifampicin also has been reported in studies in cryopre-served human hepatocytes (Fahmi et al., 2010).
In conclusion, the bioreactor using HepaRG cells showed stablefunctions over several weeks, which allows the performance of long-term sequential studies using the same cell culture system. HepaRGcells aggregated in the bioreactor and formed tissue-like structuresincluding bile canaliculi. Polarity of transporter protein expressionsimilar to those seen in vivo was observed, which facilitates the
FIG. 7. The midazolam 1�-hydroxylase (CYP3A4) activity in bioreactor culturedHepaRG cells before (solid line) and during (dotted line) ketoconazole treatment,which are P450 activities 2 and 3, respectively, illustrated in Fig. 2. Results aregiven as means � S.D. (n � 3 bioreactors).
TABLE 1
The effect of ketoconazole on the 1�-hydroxymidazolam (CYP3A4)pharmacokinetics in HepaRG cells cultured in the bioreactor
The 1�-hydroxymidazolam pharmacokinetics in cells during ketoconazole exposure (P450activity 3 in Fig. 2) are compared with the pharmacokinetics directly before (P450 activity 2in Fig. 2) introducing ketoconazole into the system. The results are obtained from threedifferent bioreactors. Published results on the effect of ketoconazole on midazolampharmacokinetics in vivo are also shown.
WithoutKetoconazole
WithKetoconazole Change
HepaRG bioreactora
Formation rate1�-hydroxymidazolam
(nmol/h)1.3 � 0.45 0.41 � 0.13* �69 � 2.9%
In vivob
CLmidazolam (l/h) 26 � 12 4.5 � 1.8 �83%
� p � 0.05.a Data are mean � S.D.; n � 3.b Data are from Tham et al. (2006).
1136 DARNELL ET AL.
at ASPE
T Journals on June 25, 2018
dmd.aspetjournals.org
Dow
nloaded from

development of an in vivo-like liver model. In general, the P450activities were stable over the entire experimental period, and theeffects of rifampicin and ketoconazole on P450 activities in thebioreactor predict well the effects observed in vivo. These findingsusing HepaRG cells in the bioreactor are promising, and the modelcould potentially be developed into a long-lasting liver-like model forinvestigations of the contribution of the liver to the kinetics of drugsin vivo and for predictive studies of drug-drug interactions in humans.
Acknowledgments
We thank Wolfgang Mudra for graphical illustration.
Authorship Contributions
Participated in research design: Andersson, Darnell, Schreiter, Zeilinger,Gerlach, and Berg.
Conducted experiments: Schreiter, Darnell, Urbaniak, Dillner, and Soderdahl.Contributed new reagents or analytic tools: Gerlach.Performed data analysis: Darnell, Schreiter, Urbaniak, Rossberg, Dillner,
and Berg.Wrote or contributed to the writing of the manuscript: Andersson, Darnell,
Zeilinger, Schreiter, Dillner, and Urbaniak.
References
Abadie-Viollon C, Martin H, Blanchard N, Pekthong D, Bachellier P, Mantion G, Heyd B,Schuler F, Coassolo P, Alexandre E, et al. (2010) Follow-up to the pre-validation of aharmonised protocol for assessment of CYP induction responses in freshly isolated andcryopreserved human hepatocytes with respect to culture format, treatment, positive referenceinducers and incubation conditions. Toxicol In Vitro 24:346–356.
Aninat C, Piton A, Glaise D, Le Charpentier T, Langouet S, Morel F, Guguen-Guillouzo C, andGuillouzo A (2006) Expression of cytochromes P450, conjugating enzymes and nuclearreceptors in human hepatoma HepaRG cells. Drug Metab Dispos 34:75–83.
Chao P, Maguire T, Novik E, Cheng KC, and Yarmush ML (2009) Evaluation of a microfluidicbased cell culture platform with primary human hepatocytes for the prediction of hepaticclearance in human. Biochem Pharmacol 78:625–632.
De Bartolo L, Salerno S, Morelli S, Giorno L, Rende M, Memoli B, Procino A, Andreucci VE,Bader A, and Drioli E (2006) Long-term maintenance of human hepatocytes in oxygen-permeable membrane bioreactor. Biomaterials 27:4794–4803.
Fahmi OA, Kish M, Boldt S, and Obach RS (2010) Cytochrome P450 3A4 mRNA is a morereliable marker than CYP3A4 activity for detecting pregnane X receptor-activated induction ofdrug-metabolizing enzymes. Drug Metab Dispos 38:1605–1611.
Floyd MD, Gervasini G, Masica AL, Mayo G, George AL Jr, Bhat K, Kim RB, and WilkinsonGR (2003) Genotype-phenotype associations for common CYP3A4 and CYP3A5 variants inthe basal and induced metabolism of midazolam in European- and African-American men andwomen. Pharmacogenetics 13:595–606.
Gerlach JC, Encke J, Hole O, Muller C, Ryan CJ, and Neuhaus P (1994) Bioreactor for a largerscale hepatocyte in vitro perfusion. Transplantation 58:984–988.
Gorski JC, Huang SM, Pinto A, Hamman MA, Hilligoss JK, Zaheer NA, Desai M, Miller M, andHall SD (2004) The effect of echinacea (Echinacea purpurea root) on cytochrome P450activity in vivo. Clin Pharmacol Ther 75:89–100.
Guillouzo A, Corlu A, Aninat C, Glaise D, Morel F, and Guguen-Guillouzo C (2007) The humanhepatoma HepaRG cells: a highly differentiated model for studies of liver metabolism andtoxicity of xenobiotics. Chemico-Biol Interact 168:66–73.
Hart SN, Li Y, Nakamoto K, Subileau EA, Steen D, and Zhong XB (2010) A comparison ofwhole genome gene expression profiles of HepaRG cells and HepG2 cells to primary humanhepatocytes and human liver tissues. Drug Metab Dispos 38:988–994.
Kanebratt KP and Andersson TB (2008a) Evaluation of HepaRG cells as an in vitro model forhuman drug metabolism studies. Drug Metab Dispos 36:1444–1452.
Kanebratt KP and Andersson TB (2008b) HepaRG cells as an in vitro model for evaluation ofcytochrome P450 induction in humans. Drug Metab Dispos 36:137–145.
Kanebratt KP, Diczfalusy U, Backstrom T, Sparve E, Bredberg E, Bottiger Y, Andersson TB, andBertilsson L (2008c) Cytochrome P450 induction by rifampicin in healthy subjects: determi-nation by the Karolinska cocktail and the endogenous marker for 4beta-hydroxycholesterol.Clin Pharmacol Ther 84:589–594.
Kharasch ED, Walker A, Hoffer C, and Sheffels P (2004) Intravenous and oral alfentanil as invivo probes for hepatic and first-pass cytochrome P450 3A activity: noninvasive assessmentby use of pupillary miosis. Clin Pharmacol Ther 76:452–466.
Kharasch ED, Mitchell D, and Coles R (2008) Stereoselective bupropion hydroxylation as an in
FIG. 8. The midazolam 1�-hydroxylase (CYP3A4) activity (A) and bupropionhydroxylase (CYP2B6) activity (B) in bioreactor cultured HepaRG cells before(solid line) and directly after (dotted line) rifampicin treatment, which are P450activities 4 and 5, respectively, illustrated in Fig. 2. Results are given as means �S.D. (n � 3 bioreactors).
TABLE 2
The effect of rifampicin on 1�-hydroxymidazolam (CYP3A4) and hydroxybupropion (CYP2B6) pharmacokinetics in HepaRG cells cultured in the bioreactor
The 1�-hydroxymidazolam and hydroxybupropion pharmacokinetics in cells treated with rifampicin (P450 activity 5 in Fig. 2) are compared with the pharmacokinetics directly before (P450activity 4 in Fig. 2) introducing rifampicin into the system. The results are obtained from three different bioreactors. Published results on the effect of rifampicin in vivo on midazolam andhydroxybupropion pharmacokinetics are also shown.
Before Rifampicin Treatment After Rifampicin Treatment Fold Change
CYP3A4HepaRG bioreactora
Formation rate1�-hydroxymidazolam (nmol/h) 0.93 � 0.25 4.4 � 2.2* 5.5 � 4.0In vivob
CLmidazolam (l/h � 70 kg) 33 � 10 62 � 36 1.9CYP2B6
HepaRG bioreactora
Formation rateHydroxybupropion (nmol/h) 0.062 � 0.017 0.38 � 0.085** 6.3 � 1.5In vivoc
Formation CLHydroxybupropion (ml/min) 62 � 47 249 � 189 3.8
� p � 0.05; �� p 0.01.a Data are mean � S.D.; n � 3.b Data are from Yu et al. (2004).c Data are from Kharasch et al. (2008).
1137P450 METABOLISM STUDIES IN BIOREACTOR CULTURED HepaRG CELLS
at ASPE
T Journals on June 25, 2018
dmd.aspetjournals.org
Dow
nloaded from

vivo phenotypic probe for cytochrome P4502B6 (CYP2B6) activity. J Clin Pharmacol48:464–474.
Klieber S, Hugla S, Ngo R, Arabeyre-Fabre C, Meunier V, Sadoun F, Fedeli O, Rival M, BourrieM, Guillou F, et al. (2008) Contribution of the N-glucuronidation pathway to the overall invitro metabolic clearance of midazolam in humans. Drug Metab Dispos 36:851–862.
Krishna G, Moton A, Ma L, Savant I, Martinho M, Seiberling M, and McLeod J (2009) Effectsof oral posaconazole on the pharmacokinetic properties of oral and intravenous midazolam: aphase I, randomized, open-label, crossover study in healthy volunteers. Clin Ther 31:286–298.
Kumar V, Wahlstrom JL, Rock DA, Warren CJ, Gorman LA, and Tracy TS (2006) CYP2C9inhibition: impact of probe selection and pharmacogenetics on in vitro inhibition profiles.Drug Metab Dispos 34:1966–1975.
Le Vee M, Jigorel E, Glaise D, Gripon P, Guguen-Guillouzo C, and Fardel O (2006) Functionalexpression of sinusoidal and canalicular hepatic drug transporters in the differentiated humanhepatoma HepaRG cell line. Eur J Pharm Sci 28:109–117.
Loboz KK, Gross AS, Williams KM, Liauw WS, Day RO, Blievernicht JK, Zanger UM, andMcLachlan AJ (2006) Cytochrome P450 2B6 activity as measured by bupropion hydroxyla-tion: effect of induction by rifampin and ethnicity. Clin Pharmacol Ther 80:75–84.
Luo G, Cunningham M, Kim S, Burn T, Lin J, Sinz M, Hamilton G, Rizzo C, Jolley S, GilbertD, et al. (2002) CYP3A4 induction by drugs: correlation between a pregnane X receptorreporter gene assay and CYP3A4 expression in human hepatocytes. Drug Metab Dispos30:795–804.
Madan A, Graham RA, Carroll KM, Mudra DR, Burton LA, Krueger LA, Downey AD,Czerwinski M, Forster J, Ribadeneira MD, et al. (2003) Effects of prototypical microsomalenzyme inducers on cytochrome P450 expression in cultured human hepatocytes. Drug MetabDispos 31:421–431.
Rodríguez-Antona C, Donato MT, Boobis A, Edwards RJ, Watts PS, Castell JV, and Gomez-Lechon MJ (2002) Cytochrome P450 expression in human hepatocytes and hepatoma celllines: molecular mechanisms that determine lower expression in cultured cells. Xenobiotica32:505–520.
Schmelzer E, Mutig K, Schrade P, Bachmann S, Gerlach JC, and Zeilinger K (2009) Effect ofhuman patient plasma ex vivo treatment on gene expression and progenitor cell activation ofprimary human liver cells in multi-compartment 3D perfusion bioreactors for extra-corporealliver support. Biotechnol Bioeng 103:817–827.
Tham LS, Lee HS, Wang L, Yong WP, Fan L, Ong AB, Sukri N, Soo R, Lee SC, and Goh BC
(2006) Ketoconazole renders poor CYP3A phenotype status with midazolam as probe drug.Ther Drug Monit 28:255–261.
Toepke MW and Beebe DJ (2006) PDMS absorption of small molecules and consequences inmicrofluidic applications. Lab Chip 6:1484–1486.
Tsunoda SM, Velez RL, von Moltke LL, and Greenblatt DJ (1999) Differentiation of intestinaland hepatic cytochrome P450 3A activity with use of midazolam as an in vivo probe: effectof ketoconazole. Clin Pharmacol Ther 66:461–471.
Turpeinen M, Tolonen A, Chesne C, Guillouzo A, Uusitalo J, and Pelkonen O (2009) Functionalexpression, inhibition and induction of CYP enzymes in HepaRG cells. Toxicol In Vitro23:748–753.
Yong WP, Wang LZ, Tham LS, Wong CI, Lee SC, Soo R, Sukri N, Lee HS, and Goh BC (2008)A phase I study of docetaxel with ketoconazole modulation in patients with advanced cancers.Cancer Chemother Pharmacol 62:243–251.
Yu KS, Cho JY, Jang IJ, Hong KS, Chung JY, Kim JR, Lim HS, Oh DS, Yi SY, Liu KH, et al.(2004) Effect of the CYP3A5 genotype on the pharmacokinetics of intravenous midazolamduring inhibited and induced metabolic states. Clin Pharmacol Ther 76:104–112.
Zeilinger K, Holland G, Sauer IM, Efimova E, Kardassis D, Obermayer N, Liu M, Neuhaus P,and Gerlach JC (2004) Time course of primary liver cell reorganization in three-dimensionalhigh-density bioreactors for extracorporeal liver support: an immunohistochemical and ultra-structural study. Tissue Eng 10:1113–1124.
Zeilinger K, Sauer IM, Pless G, Strobel C, Rudzitis J, Wang A, Nussler AK, Grebe A, Mao L,Auth SH, et al. (2002) Three-dimensional co-culture of primary human liver cells in biore-actors for in vitro drug studies: effects of the initial cell quality on the long-term maintenanceof hepatocyte-specific functions. Altern Lab Anim 30:525–538.
Zeilinger K, Schreiter T, Darnell M, Soderdahl T, Lubberstedt M, Dillner B, Knobeloch D,Nussler AK, Gerlach JC, and Andersson TB (2011) Scaling down of a clinical three-dimensional perfusion multicompartment hollow fiber liver bioreactor developed for extra-corporeal liver support to an analytical scale device useful for hepatic pharmacological in vitrostudies. Tissue Eng Part C Methods 17:549–556.
Address correspondence to: Tommy B. Andersson, DMPK Centre of Ex-cellence, AstraZeneca R&D Molndal, S-431 83 Molndal, Sweden. E-mail:[email protected]
1138 DARNELL ET AL.
at ASPE
T Journals on June 25, 2018
dmd.aspetjournals.org
Dow
nloaded from