dmd 38:431–440, 2010 printed in u.s.a....
TRANSCRIPT

Glucuronidation of Dihydrotestosterone and trans-Androsteroneby Recombinant UDP-Glucuronosyltransferase (UGT) 1A4:
Evidence for Multiple UGT1A4 Aglycone Binding Sites
Jin Zhou, Timothy S. Tracy, and Rory P. Remmel
Departments of Medicinal Chemistry (J.Z., R.P.R.) and Experimental and Clinical Pharmacology (T.S.T.), University ofMinnesota, Minneapolis, Minnesota
Received June 12, 2009; accepted December 3, 2009
ABSTRACT:
UDP-glucuronosyltransferase (UGT) 1A4-catalyzed glucuronidation is animportant drug elimination pathway. Although atypical kinetic profiles(nonhyperbolic, non-Michaelis-Menten) of UGT1A4-catalyzed glucu-ronidation have been reported occasionally, systematic kinetic studiesto explore the existence of multiple aglycone binding sites in UGT1A4have not been conducted. To this end, two positional isomers, dihy-drotestosterone (DHT) and trans-androsterone (t-AND), were used asprobe substrates, and their glucuronidation kinetics with HEK293-expressed UGT1A4 were evaluated both alone and in the presence of aUGT1A4 substrate [tamoxifen (TAM) or lamotrigine (LTG)]. Coincubationwith TAM, a high-affinity UGT1A4 substrate, resulted in a concentration-dependent activation/inhibition effect on DHT and t-AND glucuronida-tion, whereas LTG, a low-affinity UGT1A4 substrate, noncompetitively
inhibited both processes. The glucuronidation kinetics of TAM were thenevaluated both alone and in the presence of different concentrations ofDHT or t-AND. TAM displayed substrate inhibition kinetics, suggestingthat TAM may have two binding sites in UGT1A4. However, the substrateinhibition kinetic profile of TAM became more hyperbolic as the DHT ort-AND concentration was increased. Various two-site kinetic modelsadequately explained the interactions between TAM and DHT or TAMand t-AND. In addition, the effect of TAM on LTG glucuronidation wasevaluated. In contrast to the mixed effect of TAM on DHT and t-ANDglucuronidation, TAM inhibited LTG glucuronidation. Our results suggestthat multiple aglycone binding sites exist within UGT1A4, which mayresult in atypical kinetics (both homotropic and heterotropic) in a sub-strate-dependent fashion.
Glucuronidation, catalyzed by UDP-glucuronosyltransferases (UGTs),is an important elimination pathway of various endogenous compoundssuch as steroid hormones, bile acids, and bilirubin, as well as a largenumber of xenobiotics including drugs and their metabolites (Tukey andStrassburg, 2000). Of the 21 functional human UGT isoforms that havebeen characterized to date (Mackenzie et al., 2008), human UGT1A4 isoften considered as the primary catalyst for N-glucuronidation because ofits efficiency in catalyzing the glucuronidation of primary, secondary,tertiary, and aromatic amines (Kiang et al., 2005). In addition to differentamines, steroidal compounds with hydroxyl groups such as diosgenin andhecogenin are also UGT1A4 substrates (Green and Tephly, 1996).
Human UGTs are integral membrane proteins, with the majority ofthe protein, including the substrate binding sites (both aglycone andUDPGA), on the luminal side of the endoplasmic reticulum mem-brane (Radominska-Pandya et al., 1999). Although an apo crystalstructure of the cofactor UDP-glucuronic acid (UDPGA) binding
domain of human UGT2B7 has recently been published (Miley et al.,2007), the three-dimensional structures of the aglycone binding sitesof UGTs are unknown, and the interactions between their aglyconesubstrates and the substrate binding sites are poorly understood.
Similar to the cytochromes P450 such as CYP3A4, some UGT iso-forms also exhibit atypical (non-Michaelis-Menten) kinetic features(Fisher et al., 2000; Uchaipichat et al., 2004; Iwuchukwu and Nagar,2008; Ohno et al., 2008). Although the molecular mechanism(s) ofatypical kinetics is still not fully established, numerous studies with thecytochromes P450 support the hypothesis that simultaneous binding ofmultiple molecules to the enzyme is involved (Shou et al., 1994; Kor-zekwa et al., 1998; Kenworthy et al., 2001; Shou et al., 2001; Galetin etal., 2002). Such detailed studies with UGTs are less prevalent. Uchaipi-chat et al. (2008) recently examined 4-methylumbelliferone, 1-naphthol,and zidovudine glucuronidation by UGT2B7. These authors concludedthat the kinetic data provided evidence for the existence of multipleaglycone binding sites in UGT2B7. Rios and Tephly (2002) also pro-posed that two or more aglycone binding sites may exist within UGT1A1,based on evaluations of the interactions of UGT1A1-catalyzed buprenor-phine and bilirubin glucuronidation.
Atypical kinetics of UGT1A4-catalyzed glucuronidation have alsobeen reported (Chouinard et al., 2006; Hashizume et al., 2008; Hylandet al., 2009). However, systematic kinetic studies to explore the
This work was supported in part by the National Institutes of Health NationalInstitute of General Medical Sciences [Grant GM063215] (to T.S.T.); Bristol-MyersSquibb (to R.P.R.); and a grant from Shimadzu was awarded for the purchase ofthe Shimadzu LCMS-2010A instrument used in this study.
Article, publication date, and citation information can be found athttp://dmd.aspetjournals.org.
doi:10.1124/dmd.109.028712.
ABBREVIATIONS: UGT, UDP glucuronosyltransferase; UDPGA, UDP-glucuronic acid; DHT, dihydrotestosterone; t-AND, trans-androsterone,epiandrosterone; TAM, tamoxifen; LTG, lamotrigine; HPLC, high-performance liquid chromatography; ESI, electrospray ionization; MS, massspectrometry; DMSO, dimethyl sulfoxide; LC, liquid chromatography; RF, radiofrequency; AICc, second-order Akaike information criterion.
0090-9556/10/3803-431–440$20.00DRUG METABOLISM AND DISPOSITION Vol. 38, No. 3Copyright © 2010 by The American Society for Pharmacology and Experimental Therapeutics 28712/3560030DMD 38:431–440, 2010 Printed in U.S.A.
431
at ASPE
T Journals on July 7, 2018
dmd.aspetjournals.org
Dow
nloaded from
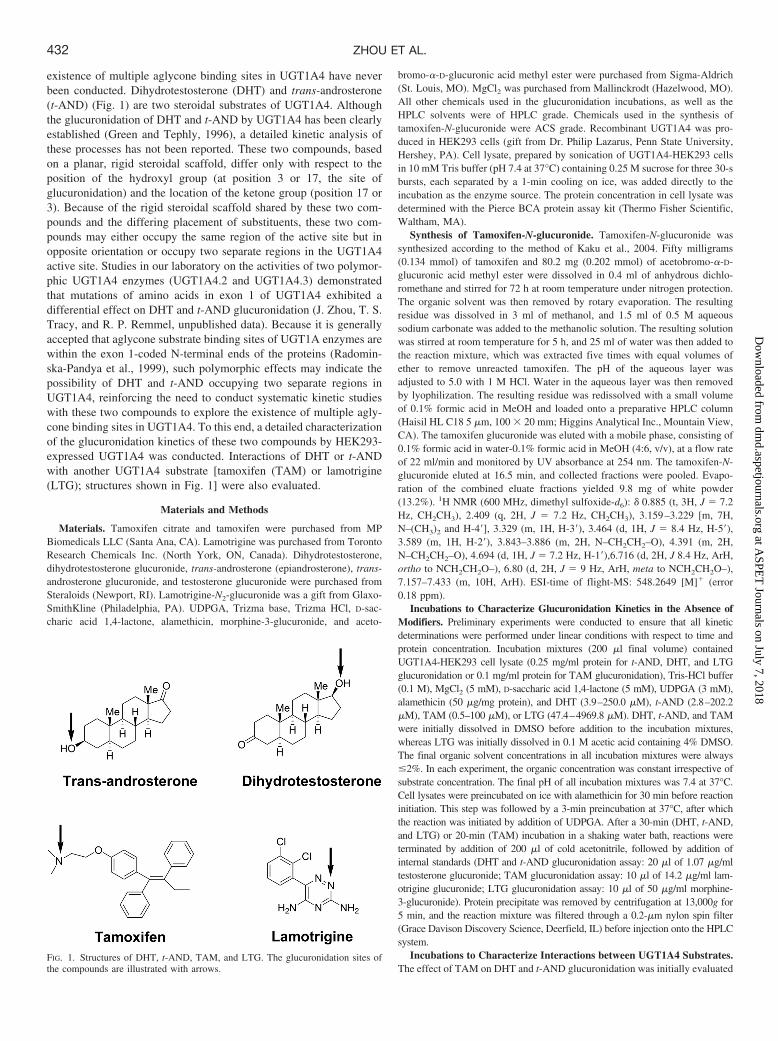
existence of multiple aglycone binding sites in UGT1A4 have neverbeen conducted. Dihydrotestosterone (DHT) and trans-androsterone(t-AND) (Fig. 1) are two steroidal substrates of UGT1A4. Althoughthe glucuronidation of DHT and t-AND by UGT1A4 has been clearlyestablished (Green and Tephly, 1996), a detailed kinetic analysis ofthese processes has not been reported. These two compounds, basedon a planar, rigid steroidal scaffold, differ only with respect to theposition of the hydroxyl group (at position 3 or 17, the site ofglucuronidation) and the location of the ketone group (position 17 or3). Because of the rigid steroidal scaffold shared by these two com-pounds and the differing placement of substituents, these two com-pounds may either occupy the same region of the active site but inopposite orientation or occupy two separate regions in the UGT1A4active site. Studies in our laboratory on the activities of two polymor-phic UGT1A4 enzymes (UGT1A4.2 and UGT1A4.3) demonstratedthat mutations of amino acids in exon 1 of UGT1A4 exhibited adifferential effect on DHT and t-AND glucuronidation (J. Zhou, T. S.Tracy, and R. P. Remmel, unpublished data). Because it is generallyaccepted that aglycone substrate binding sites of UGT1A enzymes arewithin the exon 1-coded N-terminal ends of the proteins (Radomin-ska-Pandya et al., 1999), such polymorphic effects may indicate thepossibility of DHT and t-AND occupying two separate regions inUGT1A4, reinforcing the need to conduct systematic kinetic studieswith these two compounds to explore the existence of multiple agly-cone binding sites in UGT1A4. To this end, a detailed characterizationof the glucuronidation kinetics of these two compounds by HEK293-expressed UGT1A4 was conducted. Interactions of DHT or t-ANDwith another UGT1A4 substrate [tamoxifen (TAM) or lamotrigine(LTG); structures shown in Fig. 1] were also evaluated.
Materials and Methods
Materials. Tamoxifen citrate and tamoxifen were purchased from MPBiomedicals LLC (Santa Ana, CA). Lamotrigine was purchased from TorontoResearch Chemicals Inc. (North York, ON, Canada). Dihydrotestosterone,dihydrotestosterone glucuronide, trans-androsterone (epiandrosterone), trans-androsterone glucuronide, and testosterone glucuronide were purchased fromSteraloids (Newport, RI). Lamotrigine-N2-glucuronide was a gift from Glaxo-SmithKline (Philadelphia, PA). UDPGA, Trizma base, Trizma HCl, D-sac-charic acid 1,4-lactone, alamethicin, morphine-3-glucuronide, and aceto-
bromo-�-D-glucuronic acid methyl ester were purchased from Sigma-Aldrich(St. Louis, MO). MgCl2 was purchased from Mallinckrodt (Hazelwood, MO).All other chemicals used in the glucuronidation incubations, as well as theHPLC solvents were of HPLC grade. Chemicals used in the synthesis oftamoxifen-N-glucuronide were ACS grade. Recombinant UGT1A4 was pro-duced in HEK293 cells (gift from Dr. Philip Lazarus, Penn State University,Hershey, PA). Cell lysate, prepared by sonication of UGT1A4-HEK293 cellsin 10 mM Tris buffer (pH 7.4 at 37°C) containing 0.25 M sucrose for three 30-sbursts, each separated by a 1-min cooling on ice, was added directly to theincubation as the enzyme source. The protein concentration in cell lysate wasdetermined with the Pierce BCA protein assay kit (Thermo Fisher Scientific,Waltham, MA).
Synthesis of Tamoxifen-N-glucuronide. Tamoxifen-N-glucuronide wassynthesized according to the method of Kaku et al., 2004. Fifty milligrams(0.134 mmol) of tamoxifen and 80.2 mg (0.202 mmol) of acetobromo-�-D-glucuronic acid methyl ester were dissolved in 0.4 ml of anhydrous dichlo-romethane and stirred for 72 h at room temperature under nitrogen protection.The organic solvent was then removed by rotary evaporation. The resultingresidue was dissolved in 3 ml of methanol, and 1.5 ml of 0.5 M aqueoussodium carbonate was added to the methanolic solution. The resulting solutionwas stirred at room temperature for 5 h, and 25 ml of water was then added tothe reaction mixture, which was extracted five times with equal volumes ofether to remove unreacted tamoxifen. The pH of the aqueous layer wasadjusted to 5.0 with 1 M HCl. Water in the aqueous layer was then removedby lyophilization. The resulting residue was redissolved with a small volumeof 0.1% formic acid in MeOH and loaded onto a preparative HPLC column(Haisil HL C18 5 �m, 100 � 20 mm; Higgins Analytical Inc., Mountain View,CA). The tamoxifen glucuronide was eluted with a mobile phase, consisting of0.1% formic acid in water-0.1% formic acid in MeOH (4:6, v/v), at a flow rateof 22 ml/min and monitored by UV absorbance at 254 nm. The tamoxifen-N-glucuronide eluted at 16.5 min, and collected fractions were pooled. Evapo-ration of the combined eluate fractions yielded 9.8 mg of white powder(13.2%). 1H NMR (600 MHz, dimethyl sulfoxide-d6): � 0.885 (t, 3H, J � 7.2Hz, CH2CH3), 2.409 (q, 2H, J � 7.2 Hz, CH2CH3), 3.159–3.229 [m, 7H,N–(CH3)2 and H-4�], 3.329 (m, 1H, H-3�), 3.464 (d, 1H, J � 8.4 Hz, H-5�),3.589 (m, 1H, H-2�), 3.843–3.886 (m, 2H, N–CH2CH2–O), 4.391 (m, 2H,N–CH2CH2–O), 4.694 (d, 1H, J � 7.2 Hz, H-1�),6.716 (d, 2H, J 8.4 Hz, ArH,ortho to NCH2CH2O–), 6.80 (d, 2H, J � 9 Hz, ArH, meta to NCH2CH2O–),7.157–7.433 (m, 10H, ArH). ESI-time of flight-MS: 548.2649 [M]� (error0.18 ppm).
Incubations to Characterize Glucuronidation Kinetics in the Absence ofModifiers. Preliminary experiments were conducted to ensure that all kineticdeterminations were performed under linear conditions with respect to time andprotein concentration. Incubation mixtures (200 �l final volume) containedUGT1A4-HEK293 cell lysate (0.25 mg/ml protein for t-AND, DHT, and LTGglucuronidation or 0.1 mg/ml protein for TAM glucuronidation), Tris-HCl buffer(0.1 M), MgCl2 (5 mM), D-saccharic acid 1,4-lactone (5 mM), UDPGA (3 mM),alamethicin (50 �g/mg protein), and DHT (3.9–250.0 �M), t-AND (2.8–202.2�M), TAM (0.5–100 �M), or LTG (47.4–4969.8 �M). DHT, t-AND, and TAMwere initially dissolved in DMSO before addition to the incubation mixtures,whereas LTG was initially dissolved in 0.1 M acetic acid containing 4% DMSO.The final organic solvent concentrations in all incubation mixtures were always�2%. In each experiment, the organic concentration was constant irrespective ofsubstrate concentration. The final pH of all incubation mixtures was 7.4 at 37°C.Cell lysates were preincubated on ice with alamethicin for 30 min before reactioninitiation. This step was followed by a 3-min preincubation at 37°C, after whichthe reaction was initiated by addition of UDPGA. After a 30-min (DHT, t-AND,and LTG) or 20-min (TAM) incubation in a shaking water bath, reactions wereterminated by addition of 200 �l of cold acetonitrile, followed by addition ofinternal standards (DHT and t-AND glucuronidation assay: 20 �l of 1.07 �g/mltestosterone glucuronide; TAM glucuronidation assay: 10 �l of 14.2 �g/ml lam-otrigine glucuronide; LTG glucuronidation assay: 10 �l of 50 �g/ml morphine-3-glucuronide). Protein precipitate was removed by centrifugation at 13,000g for5 min, and the reaction mixture was filtered through a 0.2-�m nylon spin filter(Grace Davison Discovery Science, Deerfield, IL) before injection onto the HPLCsystem.
Incubations to Characterize Interactions between UGT1A4 Substrates.The effect of TAM on DHT and t-AND glucuronidation was initially evaluated
FIG. 1. Structures of DHT, t-AND, TAM, and LTG. The glucuronidation sites ofthe compounds are illustrated with arrows.
432 ZHOU ET AL.
at ASPE
T Journals on July 7, 2018
dmd.aspetjournals.org
Dow
nloaded from

with three DHT or t-AND concentrations (approximately 0.5 Km, Km, and 2Km) and six TAM concentrations (0, 1.25, 2.5, 5, 10, and 20 �M). Because weobserved a significant activation effect of TAM on DHT glucuronidation inthis initial study, the effect of TAM on DHT glucuronidation was furtherevaluated with seven DHT concentrations (2.5–100 �M) in the absence orpresence of five TAM concentrations (2.5–40 �M). The effect of LTG onDHT and t-AND glucuronidation was also evaluated with three DHT or t-ANDconcentrations (approximately 0.5 Km, Km, and 2 Km) and six LTG concen-trations (0, 0.375, 0.75, 1.5, 3, and 4.5 mM), and the effect of TAM on LTGglucuronidation was studied with three LTG concentrations (0.75, 1.5, and 3mM) and six TAM concentrations (0, 1.25, 2.5, 5, 10, and 20 �M). Theincubation conditions were as described above. To quantify dihydrotestoster-one glucuronide by LC-MS, a liquid-liquid procedure was applied after reac-tion termination and protein precipitation. Fifty microliters of 2.4 mol/l HClsolution were added to the incubation supernatants, and the sample wasextracted twice with 500 �l of ethyl acetate. The ethyl acetate extracts werethen combined and dried under N2 gas. Residues were reconstituted with 50 �lof water-acetonitrile (3:7, v/v) and 25 �l of the sample were injected onto theHPLC system for quantification. The recovery of the liquid-liquid extractionprocess was 100.2 � 6.5% for dihydrotestosterone glucuronide and 96.9 �9.5% for the internal standard testosterone glucuronide. To study the effect ofDHT or t-AND on TAM glucuronidation, preliminary experiments were con-ducted at three concentrations of TAM (1.51, 7.57, and 15.14 �M). Detailedkinetic studies on TAM (1.0–100 �M) glucuronidation were conducted in thepresence of six DHT or t-AND concentrations (25–250 �M). The incubationconditions were as described previously.
Chromatographic Analysis of Glucuronides. Two methods were devel-oped to quantify trans-androsterone glucuronide and dihydrotestosterone gluc-uronide. To characterize the glucuronidation kinetics of DHT and t-AND in theabsence of a modifier, trans-androsterone glucuronide and dihydrotestosteroneglucuronide were quantified by an LC-tandem mass spectrometry method withan Agilent 1100 series capillary LC system coupled with a Thermo FinniganTSQ quantum triple quadrupole mass spectrometer (Thermo Fisher Scientific).Separation was performed on a Thermo BetaBasic-18 column (150 � 0.5 mm,3 �m; Thermo Fisher Scientific). The mobile phase consisted of 10 mMammonium formate (A) and methanol (B) and was delivered at a flow rate of12 �l/min. A linear gradient elution program, beginning with 50% of mobilephase B and then increasing mobile phase B linearly from 50 to 90% over 1min and holding at 90% of B for 9 min was used. The column was thenreequilibrated at initial conditions for 10 min. Both trans-androsterone gluc-uronide and dihydrotestosterone glucuronide eluted at 7.10 min, and theinternal standard testosterone glucuronide eluted at 6.71 min. The mass spec-trometer was equipped with an ESI interface operated in negative ion mode.Quantification was accomplished in multiple reaction monitoring mode bymonitoring a transition pair of m/z 4653287 for trans-androsterone glucuro-nide and dihydrotestosterone glucuronide and 4633285 for the internal stan-dard, testosterone glucuronide. Argon was used as the collision gas. The MSoperating conditions were optimized as follows: for transandrosterone gluc-uronide: spray voltage 4000 V, sheath gas pressure 19 mTorr, auxiliary gaspressure 22 mTorr, capillary temperature 355°C, tube lens offset �95, colli-sion pressure 2.2 mTorr, and collision energy 46 V; and for dihydrotestoster-one glucuronide: spray voltage 3200 V, sheath gas pressure 19 mTorr, auxil-iary gas pressure 5 mTorr, capillary temperature 355°C, tube lens offset �95,collision pressure 1.9 mTorr, and collision energy 44 V. When coincubatedwith a modifier, trans-androsterone glucuronide and dihydrotestosterone gluc-uronide were quantified by a LC-MS method with an LC-MS 2010A system(Shimadzu, Columbia, MD). Chromatographic separation was accomplishedon a Haisil C8 column (5 �m, 100 � 2.1 mm; Higgins Analytical Inc.). Forquantitation of dihydrotestosterone glucuronide, the mobile phase consisted of0.1% of formic acid in water (A) and acetonitrile (B) delivered at a flow rateof 0.25 ml/min with a linear gradient elution program of 30 to 67.5% of B over5 min, followed by an isocratic hold at 95% of B for 5 min and a 4-min columnreequilibration at the initial conditions. The retention times were 4.23 min fordihydrotestosterone glucuronide and 3.87 min for testosterone glucuronide.For the quantitation of trans-androsterone glucuronide, the same mobile phasewas used, and a similar gradient elution program was applied: 30 to 60% Bover 5 min, followed by an isocratic hold at 95% B for another 5 min and a4-min column reequilibration at the initial conditions. The retention times for
trans-androsterone glucuronide and testosterone glucuronide were 3.60 and3.23, respectively. The mass spectrometer was equipped with an ESI sourceoperated in negative ion mode. Quantitation was accomplished in selected ionmonitoring mode by monitoring the respective [M � H]� ions: m/z � 465 fortrans-androsterone glucuronide and dihydrotestosterone glucuronide andm/z � 463 for testosterone glucuronide. The MS parameters were as follows:nebulizing gas flow 1.5 l/min; interface bias �3.50 kV; interface current�9.20 �A; heating block temperature 200°C; focus lens �2.5V; entrance lens50.0 V; RF gain 5660; RF offset 5210; prerod bias �4.2 V; main rod bias �3.5V; aperture �20.0 V; conversion dynode �7.0 kV; detector �1.9 kV; curveddesolvation line voltage �25.0 kV; Q-array DC �35.0 V; and Q-array RF�150.0V.
Both tamoxifen-N-glucuronide and lamotrigine-N2-glucuronide were quan-tified by LC-MS methods (LCMS-2010A; Shimadzu). Chromatographic sep-aration was accomplished on a Haisil column (C18 5 �m, 100 � 2.1 mm;Higgins Analytical Inc.). The mobile phase, 0.1% formic acid (A) and 0.1%formic in methanol (B), was delivered at a flow rate of 0.25 ml/min with thefollowing linear gradient elution programs: for lamotrigine-N2-glucuronide, 5to 40% B for 5 min, 40 to 80% B for 3 min, an isocratic hold at 95% B for 3min, and column reequilibration for 4 min (lamotrigine glucuronide eluted at6.92 min and the internal standard morphine-3-glucuronide eluted at 2.90 min);for tamoxifen-N-glucuronide, 5 to 40% B for 5 min, 40 to 90% B for 10 min,an isocratic hold at 95% B for 3 min and, column re-equilibration for 4 min(tamoxifen-N-glucuronide eluted at 15.68 min and internal standard lam-otrigine glucuronide eluted at 5.96 min). The mass spectrometer was operatedin positive ion mode with an ESI interface. Quantification was performed insingle ion monitoring mode by monitoring m/z � 432 ([M]�) for lamotrigine-N2-glucuronide, m/z � 548 ([M]�) for tamoxifen-N-glucuronide, and m/z �462 ([M � H]�) for morphine-3-glucuronide. The MS parameters were set asfollows: nebulizing gas flow 1.5 l/min; interface bias �4.50 kV; interfacecurrent 11.60 �A; heating block temperature 200°C; focus lens �2.5V; en-trance lens �50.0 V; RF gain 5620; RF offset 5060; prerod bias �4.2 V; mainrod bias �3.5 V; aperture �20.0 V; conversion dynode �8.0 kV; detector�1.5 kV; curved desolvation line voltage �25.0 kV; Q-array DC �35.0 V;and Q-array RF �150.0 V.
Estimation of Nonspecific Protein Binding. Free fractions of DHT,t-AND, TAM, and LTG in incubation were estimated with the Hallifax-Houston model (eq. 1) (Hallifax and Houston, 2006), where C is proteinconcentration in milligrams per milliliter and the logP values of DHT, t-AND,TAM, and LTG are 3.428, 3.428, 6.064, and 2.04, respectively, and werecalculated with the Molinspiration-Interactive logP calculator (http://www.molinspiration.com/services/logp.html).
fu �1
1 � C � 100.072�logP2�0.067�logP�1.126 (1)
Data Analysis. Glucuronidation kinetic data for each substrate in theabsence of modifiers were analyzed by fitting the Michaelis-Menten equation(eq. 2) or an empirical uncompetitive substrate inhibition equation (eq. 3) tothe data with Sigma Plot 9.0 (Systat Software Inc., San Jose, CA) and bynonlinear regression:
V0 �Vmax � �S�
Km � �S�(2)
V0 �Vmax
1 �Km
�S��
�S�
Ksi
(3)
Vmax and Km in eq. 2 were defined as the maximum velocity and substrateconcentration at which velocity is equal to half of the maximum velocity. Vmax
and Km in eq. 3 have the same definitions as in eq. 2, and Ksi is the substrateinhibition constant. The appropriate model was selected by visual inspection ofthe Eadie-Hofstee plots and comparison of the second-order Akaike informa-tion criterion and the residual sum of squares. Kinetic parameters were esti-mated by nonlinear regression analysis with Sigma Plot 9.0.
Glucuronidation kinetics in the presence of modifiers were analyzed initially bycalculating the percent rate of control (in the absence of modifiers). Modifiers thatincreased or decreased glucuronidation rate by greater than 20% were considered
433ATYPICAL KINETICS AND MULTIPLE BINDING SITES OF UGT1A4
at ASPE
T Journals on July 7, 2018
dmd.aspetjournals.org
Dow
nloaded from
to exhibit activation or inhibition effects, respectively. One-site competitive (eq. 4),noncompetitive (eq. 5), and mixed inhibition (eq. 6) models were applied toanalyze the kinetic data, when only inhibition was observed. Vmax and Km in eqs.4, 5, and 6 have the same definitions as above. Ki is the inhibition constant, and theparameter � reflects changes in the inhibition constant Ki. The appropriate modelwas selected by visual inspection of the Dixon plots and comparison of thesecond-order Akaike information criterion.
V0 �Vmax � �S�
Km � �1 ��I�
Ki�� �S�
(4)
V0 �Vmax � �S�
Km � �1 ��I�
Ki�� �S� � �1 �
�I�
Ki� (5)
V0 �Vmax � �S�
Km � �1 ��I�
Ki�� �S� � �1 �
�I�
�Ki� (6)
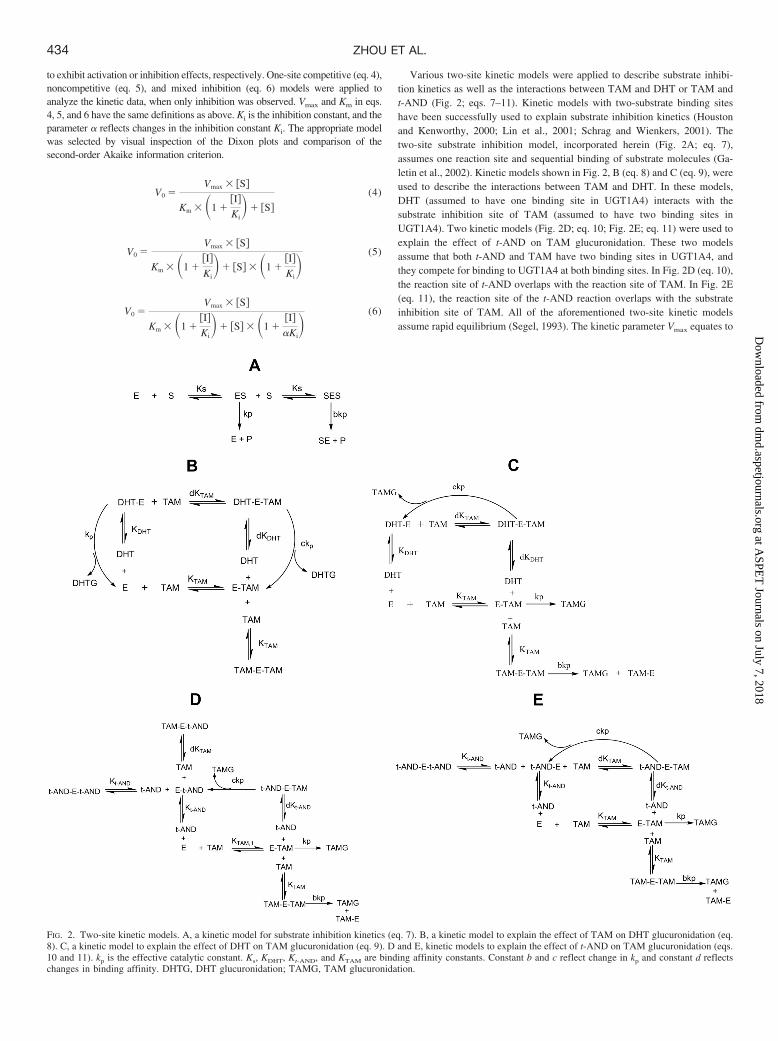
Various two-site kinetic models were applied to describe substrate inhibi-tion kinetics as well as the interactions between TAM and DHT or TAM andt-AND (Fig. 2; eqs. 7–11). Kinetic models with two-substrate binding siteshave been successfully used to explain substrate inhibition kinetics (Houstonand Kenworthy, 2000; Lin et al., 2001; Schrag and Wienkers, 2001). Thetwo-site substrate inhibition model, incorporated herein (Fig. 2A; eq. 7),assumes one reaction site and sequential binding of substrate molecules (Ga-letin et al., 2002). Kinetic models shown in Fig. 2, B (eq. 8) and C (eq. 9), wereused to describe the interactions between TAM and DHT. In these models,DHT (assumed to have one binding site in UGT1A4) interacts with thesubstrate inhibition site of TAM (assumed to have two binding sites inUGT1A4). Two kinetic models (Fig. 2D; eq. 10; Fig. 2E; eq. 11) were used toexplain the effect of t-AND on TAM glucuronidation. These two modelsassume that both t-AND and TAM have two binding sites in UGT1A4, andthey compete for binding to UGT1A4 at both binding sites. In Fig. 2D (eq. 10),the reaction site of t-AND overlaps with the reaction site of TAM. In Fig. 2E(eq. 11), the reaction site of the t-AND reaction overlaps with the substrateinhibition site of TAM. All of the aforementioned two-site kinetic modelsassume rapid equilibrium (Segel, 1993). The kinetic parameter Vmax equates to
FIG. 2. Two-site kinetic models. A, a kinetic model for substrate inhibition kinetics (eq. 7). B, a kinetic model to explain the effect of TAM on DHT glucuronidation (eq.8). C, a kinetic model to explain the effect of DHT on TAM glucuronidation (eq. 9). D and E, kinetic models to explain the effect of t-AND on TAM glucuronidation (eqs.10 and 11). kp is the effective catalytic constant. Ks, KDHT, Kt-AND, and KTAM are binding affinity constants. Constant b and c reflect change in kp and constant d reflectschanges in binding affinity. DHTG, DHT glucuronidation; TAMG, TAM glucuronidation.
434 ZHOU ET AL.
at ASPE
T Journals on July 7, 2018
dmd.aspetjournals.org
Dow
nloaded from
kp[E]t, where [E]t is the total enzyme concentration and kp is the effectivecatalytic rate constant. Ks, KDHT, Kt-AND, and KTAM are binding affinityconstants. Constants b and c reflect changes in kp. Constant d reflects changesin binding affinity. Surface plots were generated by fitting various two-sitemodels to the kinetic data. Kinetic parameters were estimated with nonlinearregression. Goodness of fit was determined by the residual sum of squares,second-order Akaike information criterion, S.E.s of the parameter estimatesand R2.
V0 �
Vmax � ��S�
Ks�
b � �S�2
Ks2 �
1 ��S�
Ks�
�S�2
Ks2
(7)
V0 �
Vmax � ��DHT�
KDHT�
c � �TAM� � �DHT�
d � KTAM � KDHT�
1 ��DHT�
KDHT�
�TAM�
KTAM�
�TAM�2
KTAM2 �
�TAM� � �DHT�
d � KTAM � KDHT
(8)
V0 �
Vmax � ��TAM�
KTAM�
b � �TAM�2
KTAM2 �
c � �TAM� � �DHT�
d � KTAM � KDHT�
1 ��DHT�
KDHT�
�TAM�
KTAM�
�TAM�2
KTAM2 �
�TAM� � �DHT�
d � KTAM � KDHT
(9)
V0 �
Vmax � ��TAM�
KTAM�
b � �TAM�2
KTAM2 �
c � �TAM� � �t-AND�
d � KTAM � Kt-AND�
1 ��t-AND�
Kt-AND�
�t-AND�2
Kt-AND2 �
�TAM�
KTAM�
�TAM�2
KTAM2 �
2 � �TAM� � �DHT�
d � KTAM � Kt-AND
(10)
V0 �
Vmax � ��TAM�
KTAM�
b � �TAM�2
KTAM2 �
c � �TAM� � �t-AND�
d � KTAM � Kt-AND�
1 ��t-AND�
Kt-AND�
�t-AND�2
Kt-AND2 �
�TAM�
KTAM�
�TAM�2
KTAM2 �
�TAM� � �DHT�
d � KTAM � Kt-AND
(11)
Results
Nonspecific Binding of DHT, t-AND, TAM, and LTG. Theestimated free fractions of DHT and t-AND were both 81.2% inincubations with 0.25 mg/ml protein and 91.8% at a protein concen-tration of 0.1 mg/ml protein. The free fraction of LTG (0.25 mg/mlprotein) was estimated to be 95.2%, which is consistent with thenegligible binding of LTG to HEK293 cell lysate reported by Row-land et al. (2006). Because the estimated nonspecific binding of DHT,t-AND, and LTG under the incubation conditions used was less than20%, the concentration of DHT, t-AND, and LTG added to theincubation mixtures was not corrected for nonspecific protein bindingin calculations of kinetic parameters. However, the estimated freefraction of TAM was 11.4% (0.1 mg/ml protein) or 4.5% (0.25 mg/mlprotein). TAM concentrations added to the incubation mixtures werecorrected for binding when kinetic parameters were estimated.
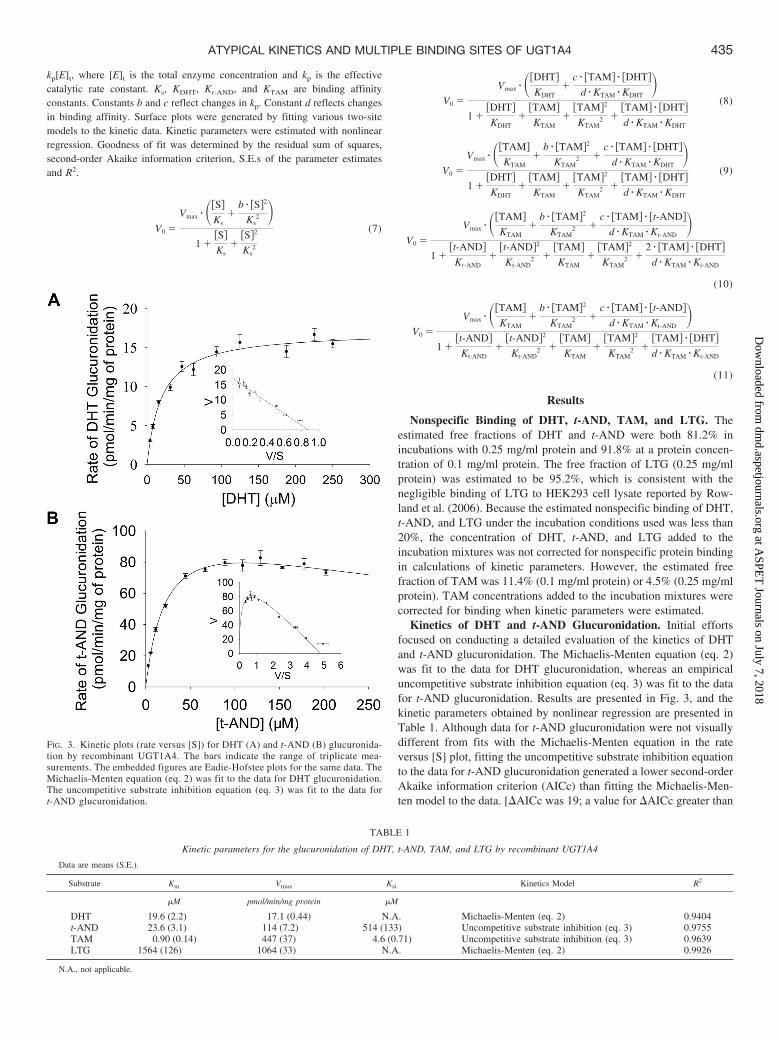
Kinetics of DHT and t-AND Glucuronidation. Initial effortsfocused on conducting a detailed evaluation of the kinetics of DHTand t-AND glucuronidation. The Michaelis-Menten equation (eq. 2)was fit to the data for DHT glucuronidation, whereas an empiricaluncompetitive substrate inhibition equation (eq. 3) was fit to the datafor t-AND glucuronidation. Results are presented in Fig. 3, and thekinetic parameters obtained by nonlinear regression are presented inTable 1. Although data for t-AND glucuronidation were not visuallydifferent from fits with the Michaelis-Menten equation in the rateversus [S] plot, fitting the uncompetitive substrate inhibition equationto the data for t-AND glucuronidation generated a lower second-orderAkaike information criterion (AICc) than fitting the Michaelis-Men-ten model to the data. [AICc was 19; a value for AICc greater than
FIG. 3. Kinetic plots (rate versus [S]) for DHT (A) and t-AND (B) glucuronida-tion by recombinant UGT1A4. The bars indicate the range of triplicate mea-surements. The embedded figures are Eadie-Hofstee plots for the same data. TheMichaelis-Menten equation (eq. 2) was fit to the data for DHT glucuronidation.The uncompetitive substrate inhibition equation (eq. 3) was fit to the data fort-AND glucuronidation.
TABLE 1
Kinetic parameters for the glucuronidation of DHT, t-AND, TAM, and LTG by recombinant UGT1A4
Data are means (S.E.).
Substrate Km Vmax Ksi Kinetics Model R2
�M pmol/min/mg protein �M
DHT 19.6 (2.2) 17.1 (0.44) N.A. Michaelis-Menten (eq. 2) 0.9404t-AND 23.6 (3.1) 114 (7.2) 514 (133) Uncompetitive substrate inhibition (eq. 3) 0.9755TAM 0.90 (0.14) 447 (37) 4.6 (0.71) Uncompetitive substrate inhibition (eq. 3) 0.9639LTG 1564 (126) 1064 (33) N.A. Michaelis-Menten (eq. 2) 0.9926
N.A., not applicable.
435ATYPICAL KINETICS AND MULTIPLE BINDING SITES OF UGT1A4
at ASPE
T Journals on July 7, 2018
dmd.aspetjournals.org
Dow
nloaded from
10 indicates essentially no support for the unfavorable model (Collomet al., 2008).] In addition, Eadie-Hofstee plots of each data set (Fig. 3)clearly demonstrated differences between the kinetic profiles of DHTand t-AND glucuronidation. A two-site substrate inhibition model(Fig. 2A; eq. 7) was also used to describe the data for t-ANDglucuronidation. The estimated kinetic parameters with this model arepresented in Table 2.
Effect of TAM on DHT and t-AND Glucuronidation. To testwhether differential inhibition can be observed, DHT or t-AND was
coincubated with a high-affinity UGT1A4 substrate, TAM. TAM, atertiary amine, forms a quaternary ammonium glucuronide uponUGT1A4-catalyzed N-glucuronidation. The reported Km for TAMglucuronidation with recombinant UGT1A4 is 2.0 � 0.51 �M (un-corrected for nonspecific binding) (Sun et al., 2006), which wasapproximately 10-fold lower than the Km values for glucuronidationon t-AND and DHT observed in the present study, suggesting thatTAM may serve as a good competitive inhibitor. However, in contrastwith the expected competitive inhibition, TAM caused concentration-
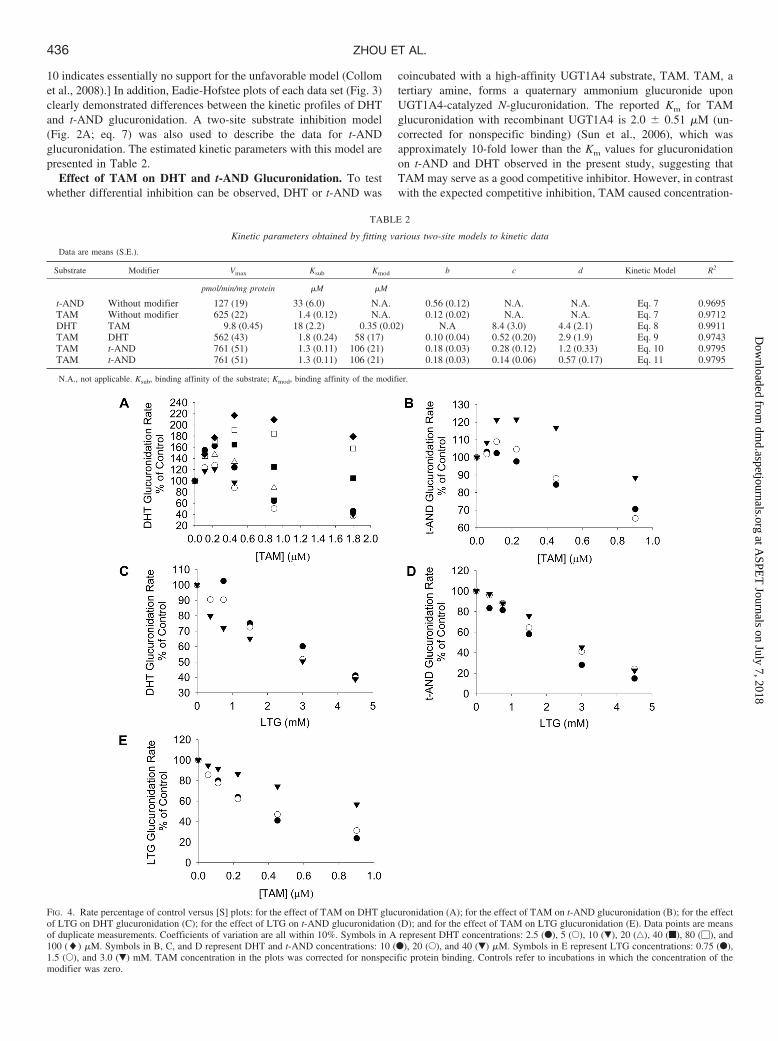
FIG. 4. Rate percentage of control versus [S] plots: for the effect of TAM on DHT glucuronidation (A); for the effect of TAM on t-AND glucuronidation (B); for the effectof LTG on DHT glucuronidation (C); for the effect of LTG on t-AND glucuronidation (D); and for the effect of TAM on LTG glucuronidation (E). Data points are meansof duplicate measurements. Coefficients of variation are all within 10%. Symbols in A represent DHT concentrations: 2.5 (F), 5 (E), 10 (�), 20 (‚), 40 (f), 80 (�), and100 (�) �M. Symbols in B, C, and D represent DHT and t-AND concentrations: 10 (F), 20 (E), and 40 (�) �M. Symbols in E represent LTG concentrations: 0.75 (F),1.5 (E), and 3.0 (�) mM. TAM concentration in the plots was corrected for nonspecific protein binding. Controls refer to incubations in which the concentration of themodifier was zero.
TABLE 2
Kinetic parameters obtained by fitting various two-site models to kinetic data
Data are means (S.E.).
Substrate Modifier Vmax Ksub Kmod b c d Kinetic Model R2
pmol/min/mg protein �M �M
t-AND Without modifier 127 (19) 33 (6.0) N.A. 0.56 (0.12) N.A. N.A. Eq. 7 0.9695TAM Without modifier 625 (22) 1.4 (0.12) N.A. 0.12 (0.02) N.A. N.A. Eq. 7 0.9712DHT TAM 9.8 (0.45) 18 (2.2) 0.35 (0.02) N.A 8.4 (3.0) 4.4 (2.1) Eq. 8 0.9911TAM DHT 562 (43) 1.8 (0.24) 58 (17) 0.10 (0.04) 0.52 (0.20) 2.9 (1.9) Eq. 9 0.9743TAM t-AND 761 (51) 1.3 (0.11) 106 (21) 0.18 (0.03) 0.28 (0.12) 1.2 (0.33) Eq. 10 0.9795TAM t-AND 761 (51) 1.3 (0.11) 106 (21) 0.18 (0.03) 0.14 (0.06) 0.57 (0.17) Eq. 11 0.9795
N.A., not applicable. Ksub, binding affinity of the substrate; Kmod, binding affinity of the modifier.
436 ZHOU ET AL.
at ASPE
T Journals on July 7, 2018
dmd.aspetjournals.org
Dow
nloaded from
dependent activation/inhibition of both DHT and t-AND glucuronida-tion (Fig. 4, A and B). For DHT glucuronidation (Fig. 4A), themaximum velocities occurred at concentrations below the highestTAM concentration; i.e., the velocities of DHT glucuronidation ini-tially increased but later decreased as the TAM concentration wasincreased. In addition, the extent of the activation effect increased asthe DHT concentration increased, and the greatest activation wasobserved at the highest substrate concentration. Statistical comparisonof DHT glucuronidation in the presence and absence of 10 �M TAM(uncorrected concentration) at 40 �M DHT indicated that the degreeof activation by TAM was statistically significant (Student’s t test,P 0.001, n � 6). With respect to t-AND glucuronidation (Fig. 4B),the activation effect of TAM was less pronounced, but features similarto those described above were noted (Fig. 4B). The velocity of t-ANDglucuronidation initially increased but later decreased with increasingTAM concentration and the extent of activation increased as thet-AND concentration was increased.
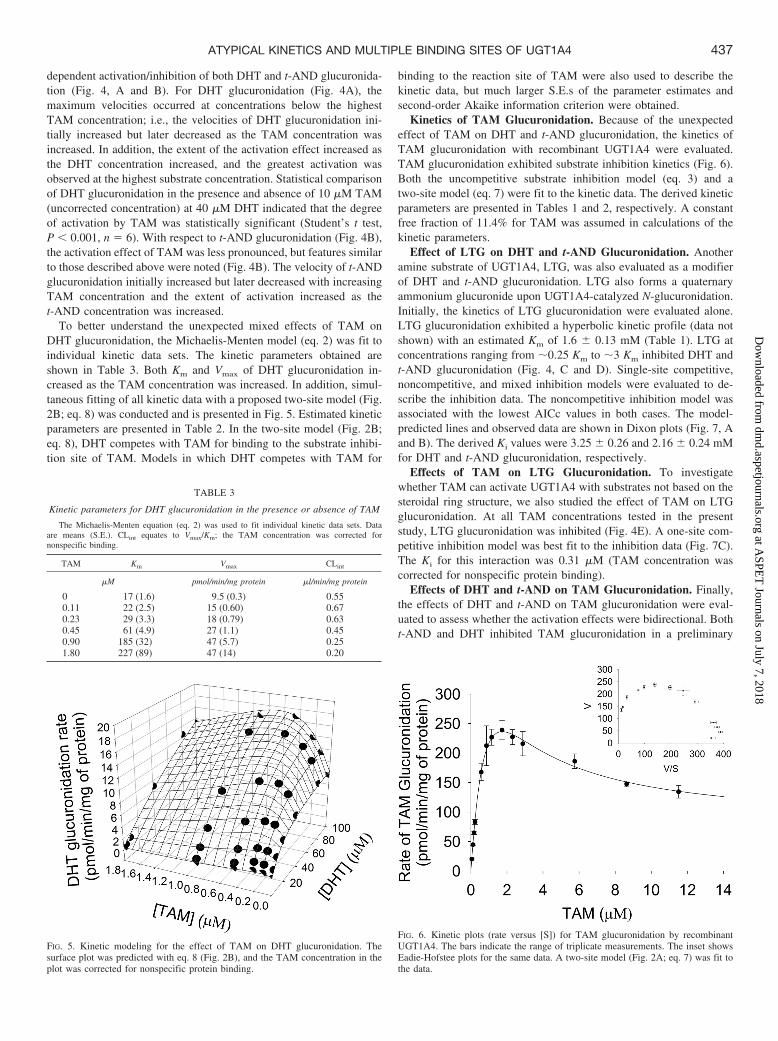
To better understand the unexpected mixed effects of TAM onDHT glucuronidation, the Michaelis-Menten model (eq. 2) was fit toindividual kinetic data sets. The kinetic parameters obtained areshown in Table 3. Both Km and Vmax of DHT glucuronidation in-creased as the TAM concentration was increased. In addition, simul-taneous fitting of all kinetic data with a proposed two-site model (Fig.2B; eq. 8) was conducted and is presented in Fig. 5. Estimated kineticparameters are presented in Table 2. In the two-site model (Fig. 2B;eq. 8), DHT competes with TAM for binding to the substrate inhibi-tion site of TAM. Models in which DHT competes with TAM for
binding to the reaction site of TAM were also used to describe thekinetic data, but much larger S.E.s of the parameter estimates andsecond-order Akaike information criterion were obtained.
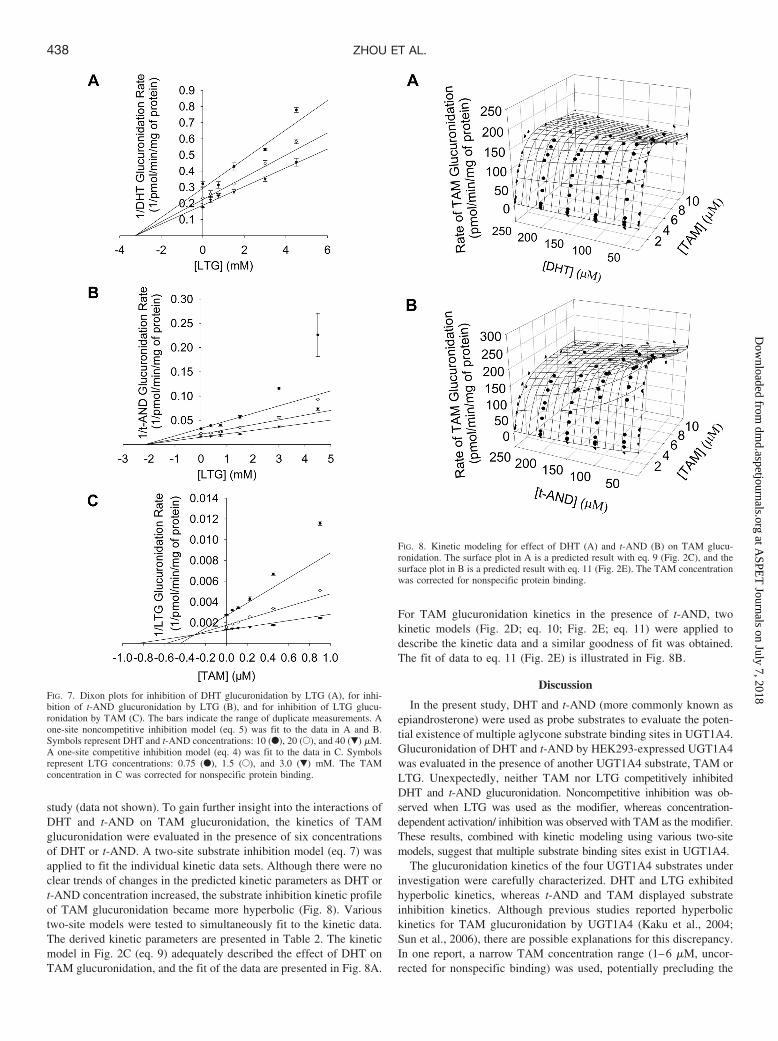
Kinetics of TAM Glucuronidation. Because of the unexpectedeffect of TAM on DHT and t-AND glucuronidation, the kinetics ofTAM glucuronidation with recombinant UGT1A4 were evaluated.TAM glucuronidation exhibited substrate inhibition kinetics (Fig. 6).Both the uncompetitive substrate inhibition model (eq. 3) and atwo-site model (eq. 7) were fit to the kinetic data. The derived kineticparameters are presented in Tables 1 and 2, respectively. A constantfree fraction of 11.4% for TAM was assumed in calculations of thekinetic parameters.
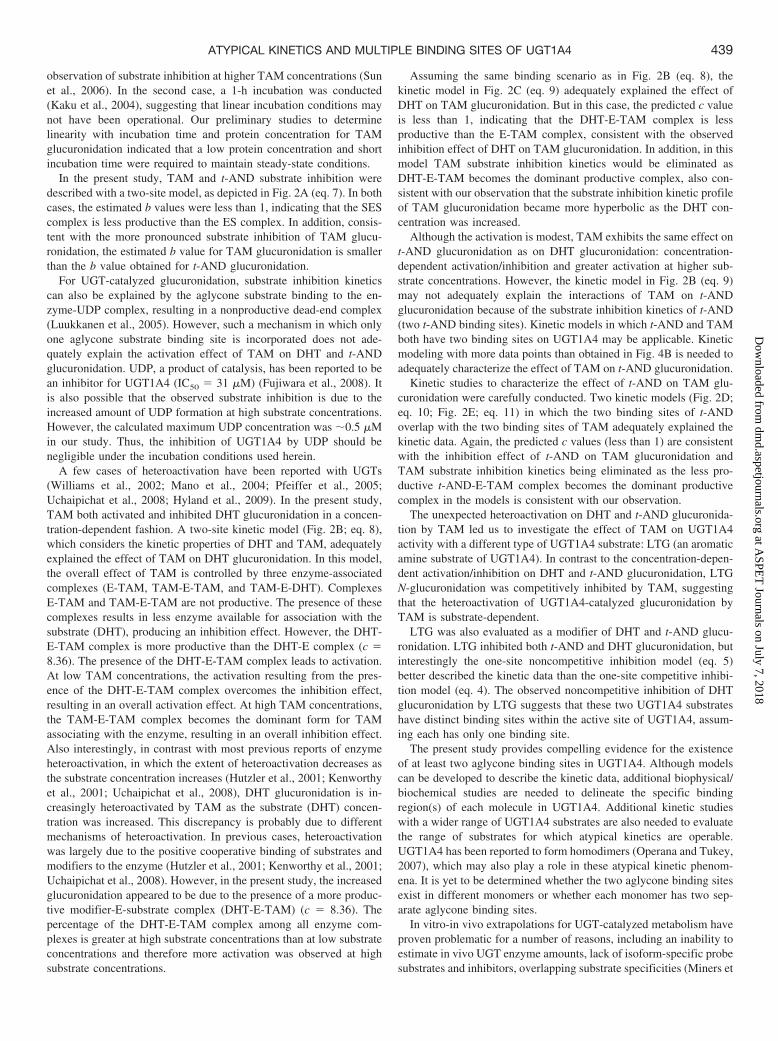
Effect of LTG on DHT and t-AND Glucuronidation. Anotheramine substrate of UGT1A4, LTG, was also evaluated as a modifierof DHT and t-AND glucuronidation. LTG also forms a quaternaryammonium glucuronide upon UGT1A4-catalyzed N-glucuronidation.Initially, the kinetics of LTG glucuronidation were evaluated alone.LTG glucuronidation exhibited a hyperbolic kinetic profile (data notshown) with an estimated Km of 1.6 � 0.13 mM (Table 1). LTG atconcentrations ranging from �0.25 Km to �3 Km inhibited DHT andt-AND glucuronidation (Fig. 4, C and D). Single-site competitive,noncompetitive, and mixed inhibition models were evaluated to de-scribe the inhibition data. The noncompetitive inhibition model wasassociated with the lowest AICc values in both cases. The model-predicted lines and observed data are shown in Dixon plots (Fig. 7, Aand B). The derived Ki values were 3.25 � 0.26 and 2.16 � 0.24 mMfor DHT and t-AND glucuronidation, respectively.
Effects of TAM on LTG Glucuronidation. To investigatewhether TAM can activate UGT1A4 with substrates not based on thesteroidal ring structure, we also studied the effect of TAM on LTGglucuronidation. At all TAM concentrations tested in the presentstudy, LTG glucuronidation was inhibited (Fig. 4E). A one-site com-petitive inhibition model was best fit to the inhibition data (Fig. 7C).The Ki for this interaction was 0.31 �M (TAM concentration wascorrected for nonspecific protein binding).
Effects of DHT and t-AND on TAM Glucuronidation. Finally,the effects of DHT and t-AND on TAM glucuronidation were eval-uated to assess whether the activation effects were bidirectional. Botht-AND and DHT inhibited TAM glucuronidation in a preliminary
FIG. 5. Kinetic modeling for the effect of TAM on DHT glucuronidation. Thesurface plot was predicted with eq. 8 (Fig. 2B), and the TAM concentration in theplot was corrected for nonspecific protein binding.
FIG. 6. Kinetic plots (rate versus [S]) for TAM glucuronidation by recombinantUGT1A4. The bars indicate the range of triplicate measurements. The inset showsEadie-Hofstee plots for the same data. A two-site model (Fig. 2A; eq. 7) was fit tothe data.
TABLE 3
Kinetic parameters for DHT glucuronidation in the presence or absence of TAM
The Michaelis-Menten equation (eq. 2) was used to fit individual kinetic data sets. Dataare means (S.E.). CLint equates to Vmax/Km; the TAM concentration was corrected fornonspecific binding.
TAM Km Vmax CLint
�M pmol/min/mg protein �l/min/mg protein
0 17 (1.6) 9.5 (0.3) 0.550.11 22 (2.5) 15 (0.60) 0.670.23 29 (3.3) 18 (0.79) 0.630.45 61 (4.9) 27 (1.1) 0.450.90 185 (32) 47 (5.7) 0.251.80 227 (89) 47 (14) 0.20
437ATYPICAL KINETICS AND MULTIPLE BINDING SITES OF UGT1A4
at ASPE
T Journals on July 7, 2018
dmd.aspetjournals.org
Dow
nloaded from
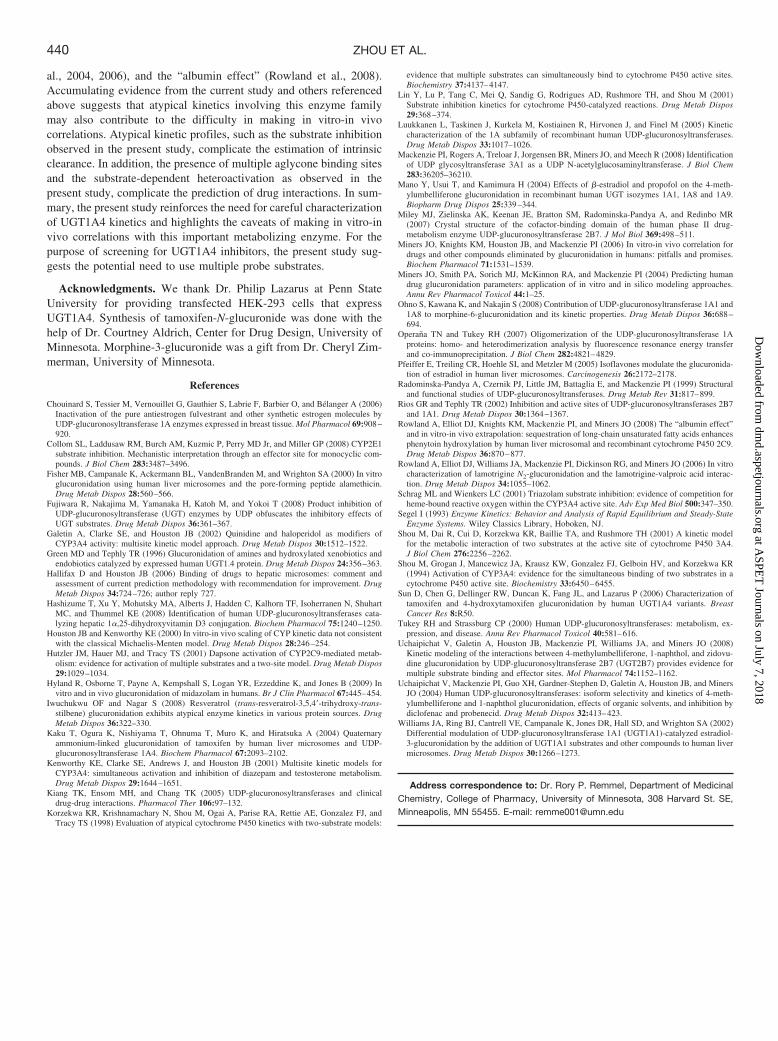
study (data not shown). To gain further insight into the interactions ofDHT and t-AND on TAM glucuronidation, the kinetics of TAMglucuronidation were evaluated in the presence of six concentrationsof DHT or t-AND. A two-site substrate inhibition model (eq. 7) wasapplied to fit the individual kinetic data sets. Although there were noclear trends of changes in the predicted kinetic parameters as DHT ort-AND concentration increased, the substrate inhibition kinetic profileof TAM glucuronidation became more hyperbolic (Fig. 8). Varioustwo-site models were tested to simultaneously fit to the kinetic data.The derived kinetic parameters are presented in Table 2. The kineticmodel in Fig. 2C (eq. 9) adequately described the effect of DHT onTAM glucuronidation, and the fit of the data are presented in Fig. 8A.
For TAM glucuronidation kinetics in the presence of t-AND, twokinetic models (Fig. 2D; eq. 10; Fig. 2E; eq. 11) were applied todescribe the kinetic data and a similar goodness of fit was obtained.The fit of data to eq. 11 (Fig. 2E) is illustrated in Fig. 8B.
Discussion
In the present study, DHT and t-AND (more commonly known asepiandrosterone) were used as probe substrates to evaluate the poten-tial existence of multiple aglycone substrate binding sites in UGT1A4.Glucuronidation of DHT and t-AND by HEK293-expressed UGT1A4was evaluated in the presence of another UGT1A4 substrate, TAM orLTG. Unexpectedly, neither TAM nor LTG competitively inhibitedDHT and t-AND glucuronidation. Noncompetitive inhibition was ob-served when LTG was used as the modifier, whereas concentration-dependent activation/ inhibition was observed with TAM as the modifier.These results, combined with kinetic modeling using various two-sitemodels, suggest that multiple substrate binding sites exist in UGT1A4.
The glucuronidation kinetics of the four UGT1A4 substrates underinvestigation were carefully characterized. DHT and LTG exhibitedhyperbolic kinetics, whereas t-AND and TAM displayed substrateinhibition kinetics. Although previous studies reported hyperbolickinetics for TAM glucuronidation by UGT1A4 (Kaku et al., 2004;Sun et al., 2006), there are possible explanations for this discrepancy.In one report, a narrow TAM concentration range (1–6 �M, uncor-rected for nonspecific binding) was used, potentially precluding the
FIG. 7. Dixon plots for inhibition of DHT glucuronidation by LTG (A), for inhi-bition of t-AND glucuronidation by LTG (B), and for inhibition of LTG glucu-ronidation by TAM (C). The bars indicate the range of duplicate measurements. Aone-site noncompetitive inhibition model (eq. 5) was fit to the data in A and B.Symbols represent DHT and t-AND concentrations: 10 (F), 20 (E), and 40 (�) �M.A one-site competitive inhibition model (eq. 4) was fit to the data in C. Symbolsrepresent LTG concentrations: 0.75 (F), 1.5 (E), and 3.0 (�) mM. The TAMconcentration in C was corrected for nonspecific protein binding.
FIG. 8. Kinetic modeling for effect of DHT (A) and t-AND (B) on TAM glucu-ronidation. The surface plot in A is a predicted result with eq. 9 (Fig. 2C), and thesurface plot in B is a predicted result with eq. 11 (Fig. 2E). The TAM concentrationwas corrected for nonspecific protein binding.
438 ZHOU ET AL.
at ASPE
T Journals on July 7, 2018
dmd.aspetjournals.org
Dow
nloaded from
observation of substrate inhibition at higher TAM concentrations (Sunet al., 2006). In the second case, a 1-h incubation was conducted(Kaku et al., 2004), suggesting that linear incubation conditions maynot have been operational. Our preliminary studies to determinelinearity with incubation time and protein concentration for TAMglucuronidation indicated that a low protein concentration and shortincubation time were required to maintain steady-state conditions.
In the present study, TAM and t-AND substrate inhibition weredescribed with a two-site model, as depicted in Fig. 2A (eq. 7). In bothcases, the estimated b values were less than 1, indicating that the SEScomplex is less productive than the ES complex. In addition, consis-tent with the more pronounced substrate inhibition of TAM glucu-ronidation, the estimated b value for TAM glucuronidation is smallerthan the b value obtained for t-AND glucuronidation.
For UGT-catalyzed glucuronidation, substrate inhibition kineticscan also be explained by the aglycone substrate binding to the en-zyme-UDP complex, resulting in a nonproductive dead-end complex(Luukkanen et al., 2005). However, such a mechanism in which onlyone aglycone substrate binding site is incorporated does not ade-quately explain the activation effect of TAM on DHT and t-ANDglucuronidation. UDP, a product of catalysis, has been reported to bean inhibitor for UGT1A4 (IC50 � 31 �M) (Fujiwara et al., 2008). Itis also possible that the observed substrate inhibition is due to theincreased amount of UDP formation at high substrate concentrations.However, the calculated maximum UDP concentration was �0.5 �Min our study. Thus, the inhibition of UGT1A4 by UDP should benegligible under the incubation conditions used herein.
A few cases of heteroactivation have been reported with UGTs(Williams et al., 2002; Mano et al., 2004; Pfeiffer et al., 2005;Uchaipichat et al., 2008; Hyland et al., 2009). In the present study,TAM both activated and inhibited DHT glucuronidation in a concen-tration-dependent fashion. A two-site kinetic model (Fig. 2B; eq. 8),which considers the kinetic properties of DHT and TAM, adequatelyexplained the effect of TAM on DHT glucuronidation. In this model,the overall effect of TAM is controlled by three enzyme-associatedcomplexes (E-TAM, TAM-E-TAM, and TAM-E-DHT). ComplexesE-TAM and TAM-E-TAM are not productive. The presence of thesecomplexes results in less enzyme available for association with thesubstrate (DHT), producing an inhibition effect. However, the DHT-E-TAM complex is more productive than the DHT-E complex (c �8.36). The presence of the DHT-E-TAM complex leads to activation.At low TAM concentrations, the activation resulting from the pres-ence of the DHT-E-TAM complex overcomes the inhibition effect,resulting in an overall activation effect. At high TAM concentrations,the TAM-E-TAM complex becomes the dominant form for TAMassociating with the enzyme, resulting in an overall inhibition effect.Also interestingly, in contrast with most previous reports of enzymeheteroactivation, in which the extent of heteroactivation decreases asthe substrate concentration increases (Hutzler et al., 2001; Kenworthyet al., 2001; Uchaipichat et al., 2008), DHT glucuronidation is in-creasingly heteroactivated by TAM as the substrate (DHT) concen-tration was increased. This discrepancy is probably due to differentmechanisms of heteroactivation. In previous cases, heteroactivationwas largely due to the positive cooperative binding of substrates andmodifiers to the enzyme (Hutzler et al., 2001; Kenworthy et al., 2001;Uchaipichat et al., 2008). However, in the present study, the increasedglucuronidation appeared to be due to the presence of a more produc-tive modifier-E-substrate complex (DHT-E-TAM) (c � 8.36). Thepercentage of the DHT-E-TAM complex among all enzyme com-plexes is greater at high substrate concentrations than at low substrateconcentrations and therefore more activation was observed at highsubstrate concentrations.
Assuming the same binding scenario as in Fig. 2B (eq. 8), thekinetic model in Fig. 2C (eq. 9) adequately explained the effect ofDHT on TAM glucuronidation. But in this case, the predicted c valueis less than 1, indicating that the DHT-E-TAM complex is lessproductive than the E-TAM complex, consistent with the observedinhibition effect of DHT on TAM glucuronidation. In addition, in thismodel TAM substrate inhibition kinetics would be eliminated asDHT-E-TAM becomes the dominant productive complex, also con-sistent with our observation that the substrate inhibition kinetic profileof TAM glucuronidation became more hyperbolic as the DHT con-centration was increased.
Although the activation is modest, TAM exhibits the same effect ont-AND glucuronidation as on DHT glucuronidation: concentration-dependent activation/inhibition and greater activation at higher sub-strate concentrations. However, the kinetic model in Fig. 2B (eq. 9)may not adequately explain the interactions of TAM on t-ANDglucuronidation because of the substrate inhibition kinetics of t-AND(two t-AND binding sites). Kinetic models in which t-AND and TAMboth have two binding sites on UGT1A4 may be applicable. Kineticmodeling with more data points than obtained in Fig. 4B is needed toadequately characterize the effect of TAM on t-AND glucuronidation.
Kinetic studies to characterize the effect of t-AND on TAM glu-curonidation were carefully conducted. Two kinetic models (Fig. 2D;eq. 10; Fig. 2E; eq. 11) in which the two binding sites of t-ANDoverlap with the two binding sites of TAM adequately explained thekinetic data. Again, the predicted c values (less than 1) are consistentwith the inhibition effect of t-AND on TAM glucuronidation andTAM substrate inhibition kinetics being eliminated as the less pro-ductive t-AND-E-TAM complex becomes the dominant productivecomplex in the models is consistent with our observation.
The unexpected heteroactivation on DHT and t-AND glucuronida-tion by TAM led us to investigate the effect of TAM on UGT1A4activity with a different type of UGT1A4 substrate: LTG (an aromaticamine substrate of UGT1A4). In contrast to the concentration-depen-dent activation/inhibition on DHT and t-AND glucuronidation, LTGN-glucuronidation was competitively inhibited by TAM, suggestingthat the heteroactivation of UGT1A4-catalyzed glucuronidation byTAM is substrate-dependent.
LTG was also evaluated as a modifier of DHT and t-AND glucu-ronidation. LTG inhibited both t-AND and DHT glucuronidation, butinterestingly the one-site noncompetitive inhibition model (eq. 5)better described the kinetic data than the one-site competitive inhibi-tion model (eq. 4). The observed noncompetitive inhibition of DHTglucuronidation by LTG suggests that these two UGT1A4 substrateshave distinct binding sites within the active site of UGT1A4, assum-ing each has only one binding site.
The present study provides compelling evidence for the existenceof at least two aglycone binding sites in UGT1A4. Although modelscan be developed to describe the kinetic data, additional biophysical/biochemical studies are needed to delineate the specific bindingregion(s) of each molecule in UGT1A4. Additional kinetic studieswith a wider range of UGT1A4 substrates are also needed to evaluatethe range of substrates for which atypical kinetics are operable.UGT1A4 has been reported to form homodimers (Operana and Tukey,2007), which may also play a role in these atypical kinetic phenom-ena. It is yet to be determined whether the two aglycone binding sitesexist in different monomers or whether each monomer has two sep-arate aglycone binding sites.
In vitro-in vivo extrapolations for UGT-catalyzed metabolism haveproven problematic for a number of reasons, including an inability toestimate in vivo UGT enzyme amounts, lack of isoform-specific probesubstrates and inhibitors, overlapping substrate specificities (Miners et
439ATYPICAL KINETICS AND MULTIPLE BINDING SITES OF UGT1A4
at ASPE
T Journals on July 7, 2018
dmd.aspetjournals.org
Dow
nloaded from
al., 2004, 2006), and the “albumin effect” (Rowland et al., 2008).Accumulating evidence from the current study and others referencedabove suggests that atypical kinetics involving this enzyme familymay also contribute to the difficulty in making in vitro-in vivocorrelations. Atypical kinetic profiles, such as the substrate inhibitionobserved in the present study, complicate the estimation of intrinsicclearance. In addition, the presence of multiple aglycone binding sitesand the substrate-dependent heteroactivation as observed in thepresent study, complicate the prediction of drug interactions. In sum-mary, the present study reinforces the need for careful characterizationof UGT1A4 kinetics and highlights the caveats of making in vitro-invivo correlations with this important metabolizing enzyme. For thepurpose of screening for UGT1A4 inhibitors, the present study sug-gests the potential need to use multiple probe substrates.
Acknowledgments. We thank Dr. Philip Lazarus at Penn StateUniversity for providing transfected HEK-293 cells that expressUGT1A4. Synthesis of tamoxifen-N-glucuronide was done with thehelp of Dr. Courtney Aldrich, Center for Drug Design, University ofMinnesota. Morphine-3-glucuronide was a gift from Dr. Cheryl Zim-merman, University of Minnesota.
References
Chouinard S, Tessier M, Vernouillet G, Gauthier S, Labrie F, Barbier O, and Belanger A (2006)Inactivation of the pure antiestrogen fulvestrant and other synthetic estrogen molecules byUDP-glucuronosyltransferase 1A enzymes expressed in breast tissue. Mol Pharmacol 69:908–920.
Collom SL, Laddusaw RM, Burch AM, Kuzmic P, Perry MD Jr, and Miller GP (2008) CYP2E1substrate inhibition. Mechanistic interpretation through an effector site for monocyclic com-pounds. J Biol Chem 283:3487–3496.
Fisher MB, Campanale K, Ackermann BL, VandenBranden M, and Wrighton SA (2000) In vitroglucuronidation using human liver microsomes and the pore-forming peptide alamethicin.Drug Metab Dispos 28:560–566.
Fujiwara R, Nakajima M, Yamanaka H, Katoh M, and Yokoi T (2008) Product inhibition ofUDP-glucuronosyltransferase (UGT) enzymes by UDP obfuscates the inhibitory effects ofUGT substrates. Drug Metab Dispos 36:361–367.
Galetin A, Clarke SE, and Houston JB (2002) Quinidine and haloperidol as modifiers ofCYP3A4 activity: multisite kinetic model approach. Drug Metab Dispos 30:1512–1522.
Green MD and Tephly TR (1996) Glucuronidation of amines and hydroxylated xenobiotics andendobiotics catalyzed by expressed human UGT1.4 protein. Drug Metab Dispos 24:356–363.
Hallifax D and Houston JB (2006) Binding of drugs to hepatic microsomes: comment andassessment of current prediction methodology with recommendation for improvement. DrugMetab Dispos 34:724–726; author reply 727.
Hashizume T, Xu Y, Mohutsky MA, Alberts J, Hadden C, Kalhorn TF, Isoherranen N, ShuhartMC, and Thummel KE (2008) Identification of human UDP-glucuronosyltransferases cata-lyzing hepatic 1�,25-dihydroxyvitamin D3 conjugation. Biochem Pharmacol 75:1240–1250.
Houston JB and Kenworthy KE (2000) In vitro-in vivo scaling of CYP kinetic data not consistentwith the classical Michaelis-Menten model. Drug Metab Dispos 28:246–254.
Hutzler JM, Hauer MJ, and Tracy TS (2001) Dapsone activation of CYP2C9-mediated metab-olism: evidence for activation of multiple substrates and a two-site model. Drug Metab Dispos29:1029–1034.
Hyland R, Osborne T, Payne A, Kempshall S, Logan YR, Ezzeddine K, and Jones B (2009) Invitro and in vivo glucuronidation of midazolam in humans. Br J Clin Pharmacol 67:445–454.
Iwuchukwu OF and Nagar S (2008) Resveratrol (trans-resveratrol-3,5,4�-trihydroxy-trans-stilbene) glucuronidation exhibits atypical enzyme kinetics in various protein sources. DrugMetab Dispos 36:322–330.
Kaku T, Ogura K, Nishiyama T, Ohnuma T, Muro K, and Hiratsuka A (2004) Quaternaryammonium-linked glucuronidation of tamoxifen by human liver microsomes and UDP-glucuronosyltransferase 1A4. Biochem Pharmacol 67:2093–2102.
Kenworthy KE, Clarke SE, Andrews J, and Houston JB (2001) Multisite kinetic models forCYP3A4: simultaneous activation and inhibition of diazepam and testosterone metabolism.Drug Metab Dispos 29:1644–1651.
Kiang TK, Ensom MH, and Chang TK (2005) UDP-glucuronosyltransferases and clinicaldrug-drug interactions. Pharmacol Ther 106:97–132.
Korzekwa KR, Krishnamachary N, Shou M, Ogai A, Parise RA, Rettie AE, Gonzalez FJ, andTracy TS (1998) Evaluation of atypical cytochrome P450 kinetics with two-substrate models:
evidence that multiple substrates can simultaneously bind to cytochrome P450 active sites.Biochemistry 37:4137–4147.
Lin Y, Lu P, Tang C, Mei Q, Sandig G, Rodrigues AD, Rushmore TH, and Shou M (2001)Substrate inhibition kinetics for cytochrome P450-catalyzed reactions. Drug Metab Dispos29:368–374.
Luukkanen L, Taskinen J, Kurkela M, Kostiainen R, Hirvonen J, and Finel M (2005) Kineticcharacterization of the 1A subfamily of recombinant human UDP-glucuronosyltransferases.Drug Metab Dispos 33:1017–1026.
Mackenzie PI, Rogers A, Treloar J, Jorgensen BR, Miners JO, and Meech R (2008) Identificationof UDP glycosyltransferase 3A1 as a UDP N-acetylglucosaminyltransferase. J Biol Chem283:36205–36210.
Mano Y, Usui T, and Kamimura H (2004) Effects of �-estradiol and propofol on the 4-meth-ylumbelliferone glucuronidation in recombinant human UGT isozymes 1A1, 1A8 and 1A9.Biopharm Drug Dispos 25:339–344.
Miley MJ, Zielinska AK, Keenan JE, Bratton SM, Radominska-Pandya A, and Redinbo MR(2007) Crystal structure of the cofactor-binding domain of the human phase II drug-metabolism enzyme UDP-glucuronosyltransferase 2B7. J Mol Biol 369:498–511.
Miners JO, Knights KM, Houston JB, and Mackenzie PI (2006) In vitro-in vivo correlation fordrugs and other compounds eliminated by glucuronidation in humans: pitfalls and promises.Biochem Pharmacol 71:1531–1539.
Miners JO, Smith PA, Sorich MJ, McKinnon RA, and Mackenzie PI (2004) Predicting humandrug glucuronidation parameters: application of in vitro and in silico modeling approaches.Annu Rev Pharmacol Toxicol 44:1–25.
Ohno S, Kawana K, and Nakajin S (2008) Contribution of UDP-glucuronosyltransferase 1A1 and1A8 to morphine-6-glucuronidation and its kinetic properties. Drug Metab Dispos 36:688–694.
Operana TN and Tukey RH (2007) Oligomerization of the UDP-glucuronosyltransferase 1Aproteins: homo- and heterodimerization analysis by fluorescence resonance energy transferand co-immunoprecipitation. J Biol Chem 282:4821–4829.
Pfeiffer E, Treiling CR, Hoehle SI, and Metzler M (2005) Isoflavones modulate the glucuronida-tion of estradiol in human liver microsomes. Carcinogenesis 26:2172–2178.
Radominska-Pandya A, Czernik PJ, Little JM, Battaglia E, and Mackenzie PI (1999) Structuraland functional studies of UDP-glucuronosyltransferases. Drug Metab Rev 31:817–899.
Rios GR and Tephly TR (2002) Inhibition and active sites of UDP-glucuronosyltransferases 2B7and 1A1. Drug Metab Dispos 30:1364–1367.
Rowland A, Elliot DJ, Knights KM, Mackenzie PI, and Miners JO (2008) The “albumin effect”and in vitro-in vivo extrapolation: sequestration of long-chain unsaturated fatty acids enhancesphenytoin hydroxylation by human liver microsomal and recombinant cytochrome P450 2C9.Drug Metab Dispos 36:870–877.
Rowland A, Elliot DJ, Williams JA, Mackenzie PI, Dickinson RG, and Miners JO (2006) In vitrocharacterization of lamotrigine N2-glucuronidation and the lamotrigine-valproic acid interac-tion. Drug Metab Dispos 34:1055–1062.
Schrag ML and Wienkers LC (2001) Triazolam substrate inhibition: evidence of competition forheme-bound reactive oxygen within the CYP3A4 active site. Adv Exp Med Biol 500:347–350.
Segel I (1993) Enzyme Kinetics: Behavior and Analysis of Rapid Equilibrium and Steady-StateEnzyme Systems. Wiley Classics Library, Hoboken, NJ.
Shou M, Dai R, Cui D, Korzekwa KR, Baillie TA, and Rushmore TH (2001) A kinetic modelfor the metabolic interaction of two substrates at the active site of cytochrome P450 3A4.J Biol Chem 276:2256–2262.
Shou M, Grogan J, Mancewicz JA, Krausz KW, Gonzalez FJ, Gelboin HV, and Korzekwa KR(1994) Activation of CYP3A4: evidence for the simultaneous binding of two substrates in acytochrome P450 active site. Biochemistry 33:6450–6455.
Sun D, Chen G, Dellinger RW, Duncan K, Fang JL, and Lazarus P (2006) Characterization oftamoxifen and 4-hydroxytamoxifen glucuronidation by human UGT1A4 variants. BreastCancer Res 8:R50.
Tukey RH and Strassburg CP (2000) Human UDP-glucuronosyltransferases: metabolism, ex-pression, and disease. Annu Rev Pharmacol Toxicol 40:581–616.
Uchaipichat V, Galetin A, Houston JB, Mackenzie PI, Williams JA, and Miners JO (2008)Kinetic modeling of the interactions between 4-methylumbelliferone, 1-naphthol, and zidovu-dine glucuronidation by UDP-glucuronosyltransferase 2B7 (UGT2B7) provides evidence formultiple substrate binding and effector sites. Mol Pharmacol 74:1152–1162.
Uchaipichat V, Mackenzie PI, Guo XH, Gardner-Stephen D, Galetin A, Houston JB, and MinersJO (2004) Human UDP-glucuronosyltransferases: isoform selectivity and kinetics of 4-meth-ylumbelliferone and 1-naphthol glucuronidation, effects of organic solvents, and inhibition bydiclofenac and probenecid. Drug Metab Dispos 32:413–423.
Williams JA, Ring BJ, Cantrell VE, Campanale K, Jones DR, Hall SD, and Wrighton SA (2002)Differential modulation of UDP-glucuronosyltransferase 1A1 (UGT1A1)-catalyzed estradiol-3-glucuronidation by the addition of UGT1A1 substrates and other compounds to human livermicrosomes. Drug Metab Dispos 30:1266–1273.
Address correspondence to: Dr. Rory P. Remmel, Department of MedicinalChemistry, College of Pharmacy, University of Minnesota, 308 Harvard St. SE,Minneapolis, MN 55455. E-mail: [email protected]
440 ZHOU ET AL.
at ASPE
T Journals on July 7, 2018
dmd.aspetjournals.org
Dow
nloaded from