dksa guards elongating rna polymerase against …€¦ · · 2015-01-26molecular cell, volume 53...
TRANSCRIPT

Molecular Cell, Volume 53
Supplemental Information
DksA Guards Elongating RNA Polymerase against Ribosome-Stalling-Induced Arrest
Yan Zhang, Rachel A. Mooney, Jeffrey A. Grass, Priya Sivaramakrishnan, Christophe Herman,
Robert Landick, and Jue D. Wang
- 1 -
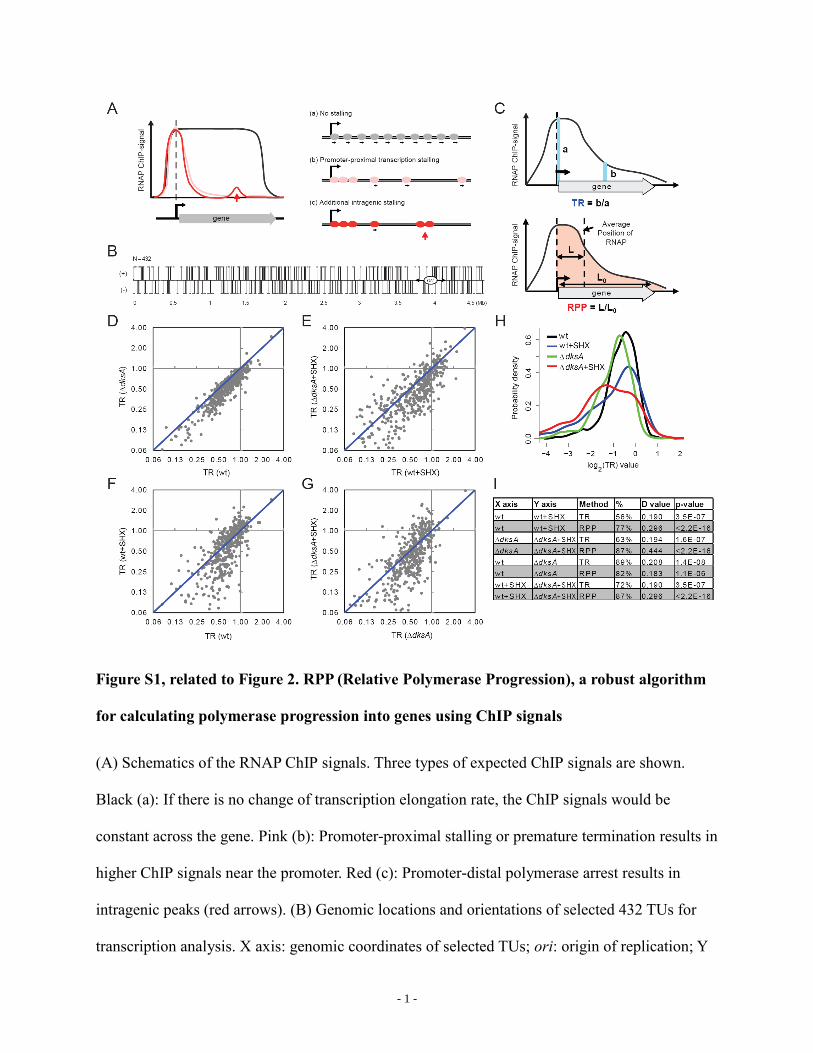
Figure S1, related to Figure 2. RPP (Relative Polymerase Progression), a robust algorithm
for calculating polymerase progression into genes using ChIP signals
(A) Schematics of the RNAP ChIP signals. Three types of expected ChIP signals are shown.
Black (a): If there is no change of transcription elongation rate, the ChIP signals would be
constant across the gene. Pink (b): Promoter-proximal stalling or premature termination results in
higher ChIP signals near the promoter. Red (c): Promoter-distal polymerase arrest results in
intragenic peaks (red arrows). (B) Genomic locations and orientations of selected 432 TUs for
transcription analysis. X axis: genomic coordinates of selected TUs; ori: origin of replication; Y
2

- 2 -
axis: transcription orientation (+ or -). (C) Sampling windows for calculating RNAP processivity
with Traveling Ratio (TR; blue) or Relative Polymerase Progression (RPP; red) algorithms. (D-
G) Scatter plots of TR values (shown in log2 scale) calculated from ChIP signals of 432 TUs
from indicated samples. Values were averages of two independent replicates. (H) Distributions of
log2(TR) values of 432 TUs from untreated (black), starved (blue) wild-type cells and untreated
(green), starved (red) dksA cells. (I) Statistics of TR and RPP comparison between indicated
samples. X, Y axis: two samples compared; Method: TR or RPP values; %: percentage of TUs
(out of 432) having lower TR/RPP values in sample Y than sample X (below diagonal lines); D-
values and p-values were calculated from K-S test (see Experimental Procedures).
- 3 -
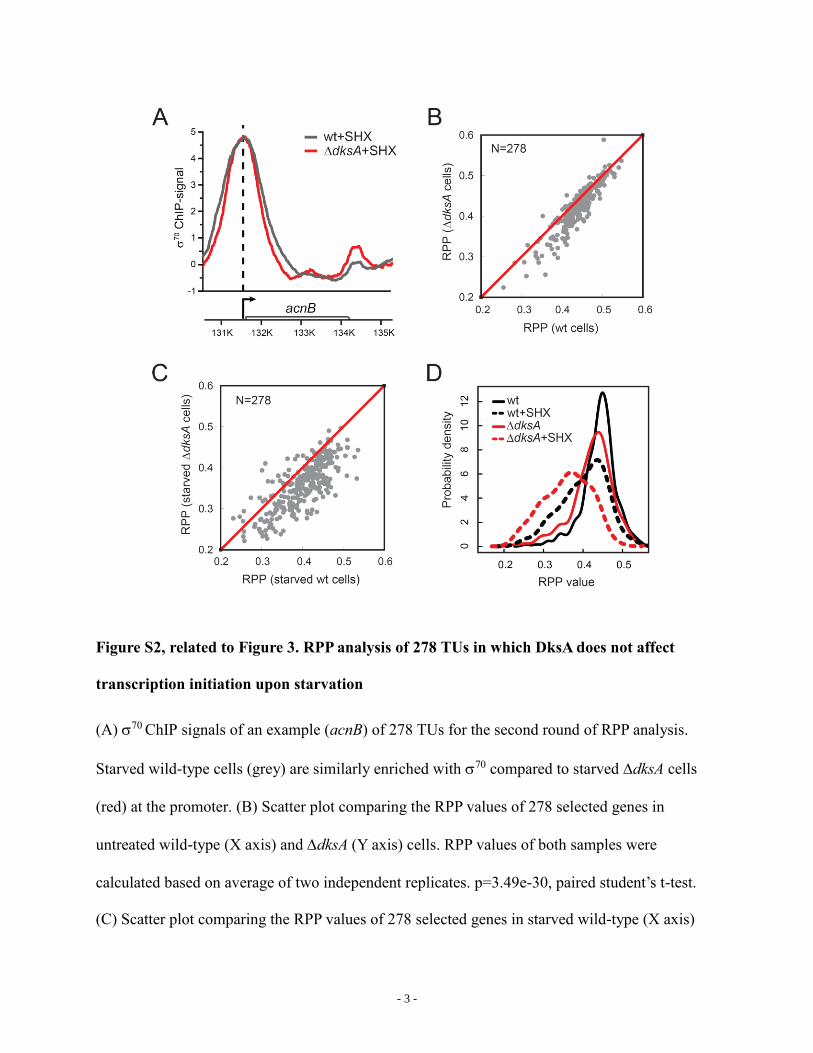
Figure S2, related to Figure 3. RPP analysis of 278 TUs in which DksA does not affect
transcription initiation upon starvation
(A) 70 ChIP signals of an example (acnB) of 278 TUs for the second round of RPP analysis.
Starved wild-type cells (grey) are similarly enriched with 70 compared to starved dksA cells
(red) at the promoter. (B) Scatter plot comparing the RPP values of 278 selected genes in
untreated wild-type (X axis) and dksA (Y axis) cells. RPP values of both samples were
calculated based on average of two independent replicates. p=3.49e-30, paired student’s t-test.
(C) Scatter plot comparing the RPP values of 278 selected genes in starved wild-type (X axis)

- 4 -
and dksA (Y axis) cells. p=1.26e-45, paired student’s t-test. (D) Distributions of RPP values of
untreated (solid black), starved (dashed black) wild-type cells and untreated (solid red), starved
(dashed red) dksA cells. N=278.
- 5 -
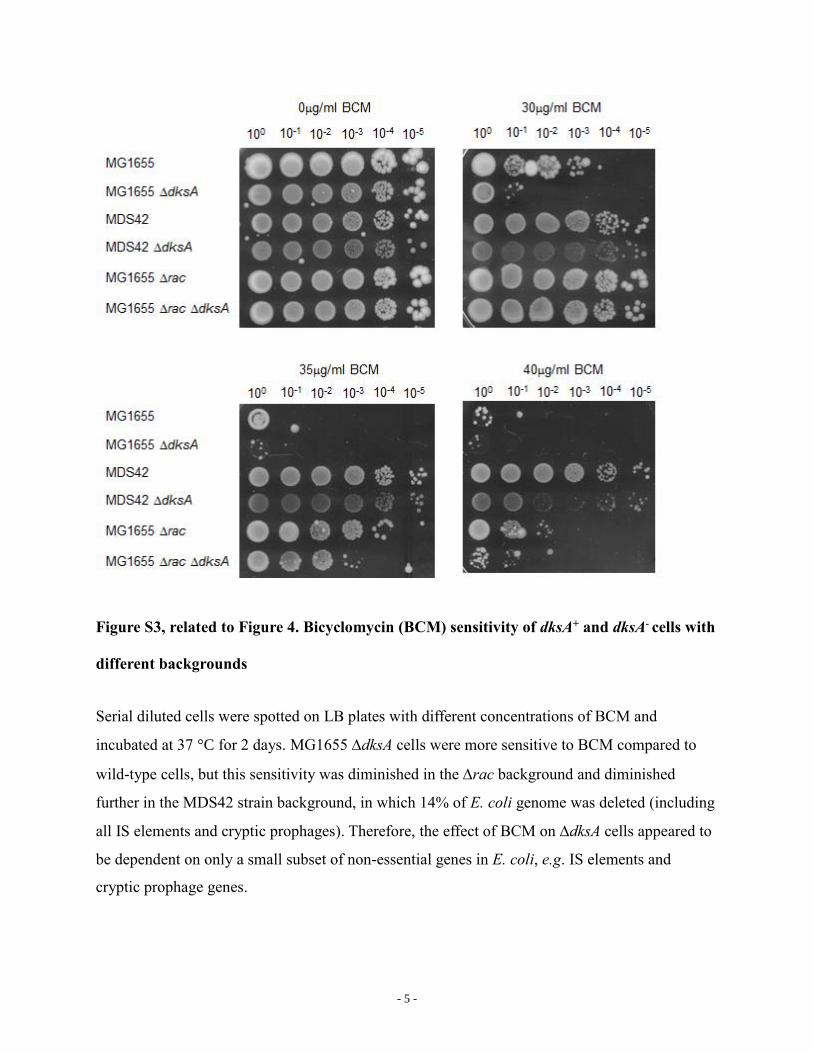
Figure S3, related to Figure 4. Bicyclomycin (BCM) sensitivity of dksA+ and dksA- cells with
different backgrounds
Serial diluted cells were spotted on LB plates with different concentrations of BCM and
incubated at 37 °C for 2 days. MG1655 dksA cells were more sensitive to BCM compared to
wild-type cells, but this sensitivity was diminished in the rac background and diminished
further in the MDS42 strain background, in which 14% of E. coli genome was deleted (including
all IS elements and cryptic prophages). Therefore, the effect of BCM on dksA cells appeared to
be dependent on only a small subset of non-essential genes in E. coli, e.g. IS elements and
cryptic prophage genes.

- 6 -
Table S1, related to Figure 2. 432 TUs selected from the E. coli genome for RPP analysis
(Excel file)
Table S2, related to Figure 3. 278 TUs selected from the 432 TUs satisfying an additional
criterion that DksA has no effect on 70 enrichment at promoters upon starvation, for a second
round of RPP analysis (Excel file)
- 7 -
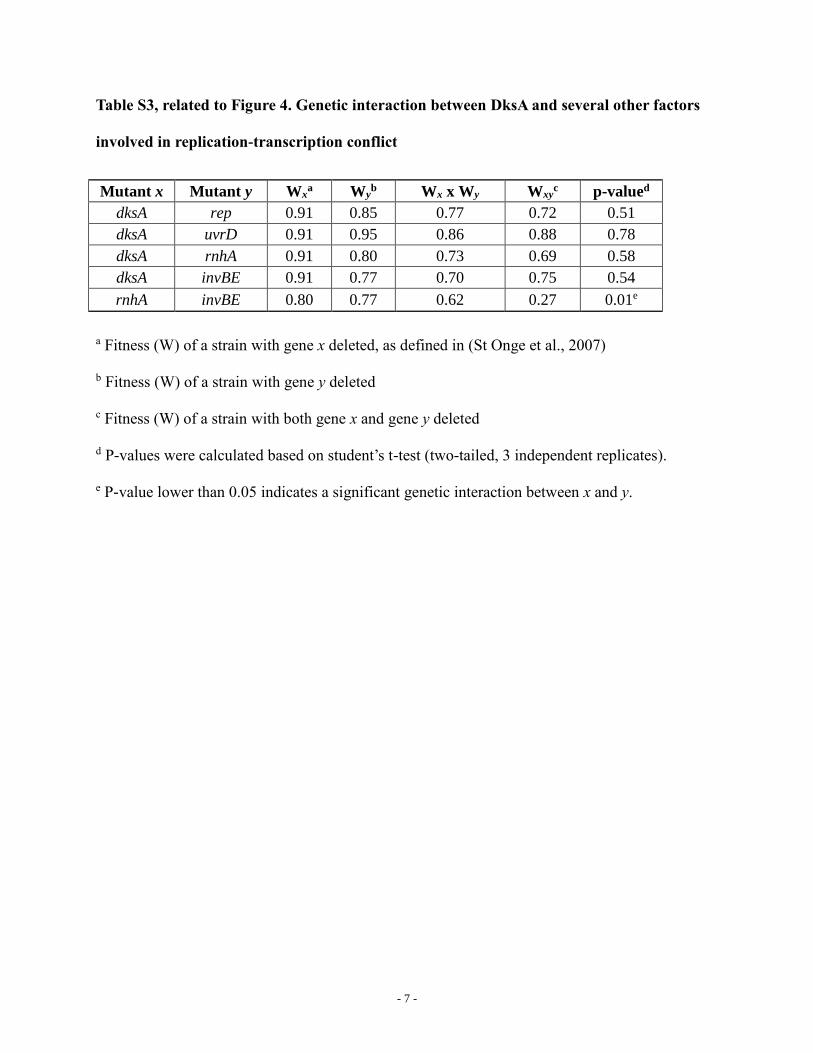
Table S3, related to Figure 4. Genetic interaction between DksA and several other factors
involved in replication-transcription conflict
Mutant x Mutant y Wxa Wy
b Wx x Wy Wxyc p-valued
dksA rep 0.91 0.85 0.77 0.72 0.51
dksA uvrD 0.91 0.95 0.86 0.88 0.78
dksA rnhA 0.91 0.80 0.73 0.69 0.58
dksA invBE 0.91 0.77 0.70 0.75 0.54
rnhA invBE 0.80 0.77 0.62 0.27 0.01e
a Fitness (W) of a strain with gene x deleted, as defined in (St Onge et al., 2007)
b Fitness (W) of a strain with gene y deleted
c Fitness (W) of a strain with both gene x and gene y deleted
d P-values were calculated based on student’s t-test (two-tailed, 3 independent replicates).
e P-value lower than 0.05 indicates a significant genetic interaction between x and y.

- 8 -
Table S4. Strains and Plasmids
Strain Genotype Reference
MG1655 F- - ilvG- rfb-50 rph+ (Blattner et al., 1997)
CH580 MG1655 lacZ-U118 dksA::FRTKanRFRT (Tehranchi et al.)
CH2137 MG1655 rpsD12 acrF::Tn10 lacA::gfp
FRTCmRFRT
this study
CH2139 MG1655 rpsL141 lacA::gfp FRTCmRFRT this study
CH3643 MG1655 att::PsulAgfp-mut2 rpsL[SmP]
tet
this study
CH4250 MG1655 att::PsulAgfp-mut2 rpsL[SmP]
tet dksA::FRTKanRFRT
this study
CH4341 MG1655 rpsD12 acrF::Tn10 lacA::gfp
FRTCmRFRT dksA::FRTKanRFRT
this study
CH4343 MG1655 rpsL141 lacA::gfp FRTCmRFRT
dksA::tet
this study
JDW610 MG1655 lacZ-U118 (Brooker and Wilson,
1985)
JDW618 MG1655 lac dksA::tet (Blankschien et al.,
2009)
JDW902 MG1655 lac (Blankschien et al.,
2009)
JDW1011 MG1655 lac [pBR322] (Tehranchi et al.)
JDW1012 MG1655 lac [pDNL278] (Tehranchi et al.)
JDW1013 MG1655 lac dksA::tet [pBR322] (Tehranchi et al.)
JDW1014 MG1655 lac dksA::tet [pDNL278] (Tehranchi et al.)
JDW1067 MG1655 lac rnhA::cat this work
JDW1070 MG1655 lac rnhA::cat dksA::tet this work
JJC4349 InvBE CmR (Boubakri et al.)
JDW1113 InvBE CmR dksA::tet this work
JDW1163 MDS42 (Posfai et al., 2006)
JDW1164 MDS42 nusG with KanR insertion (Cardinale et al., 2008)
JDW1165 MDS42 dksA::tet this work
JDW1270 MG1655 lac tolC::KanR dksA::tet this work
JDW1271 MG1655 lac tolC::KanR this work
JDW1390 InvBE CmR rnhA::cat this work
JDW1526 MG1655 dksA::tet this work
JDW1527 MG1655 lac rep::KanR this work
JDW1528 MG1655 lac uvrD::KanR this work
JDW1545 MG1655 lac rep::KanR dksA::tet this work
JDW1546 MG1655 lac uvrD::KanR dksA::tet this work

- 9 -
Plasmid Genotype Reference
pBR322 ApR (Bolivar et al., 1977)
pDNL278 pTrc99/greA, ApR (Feng et al., 1994)
- 10 -
Supplemental Experimental Procedures
Strains and growth condition
To prepare cells for ChIP-chip experiments, MG1655 and MG1655 dksA cells were
grown overnight to stationary phase (OD600~1.5) in MOPS medium supplemented with 0.2%
glucose and 0.4% casamino acid, and diluted back to OD600~0.01 in MOPS medium with 0.2%
glucose, leucine, isoleucine, valine, glycine, phenylalanine, threonine (40 g/ml) and uracil (50
g/ml) the next day. Cells were grown with vigorous shaking at 37 °C to mid-log phase
(OD600~0.4) and each culture was split into two flasks, one treated with SHX (0.5 mg/ml) and
the other left untreated. After growing for another 20 min, sodium phosphate (1/100 vol. of 1M,
pH 7.6; 10mM final) was added to the cultures followed by formaldehyde to 1% final, and
shaking was continued for 5 min. To stop the crosslinking, 2.5M cold glycine was added to
100mM and the mixture was kept at 4°C for 30 min. Cells were spun at 5000 x g for 10min,
washed with ice-cold PBS twice and flash-frozen in liquid nitrogen.
Preparation of DNA for ChIP-chip
Cell pellets were thawed and resuspended in 500 μl of IP buffer (100 mM Tris pH 8, 300
mM NaCl, 2% TritonX-100) and sonicated using a Misonix sonicator (S-4000) with a cup horn
(431C) set at 60% output, 10 sec ON and 10 sec OFF, for a total sonication time of 16 min. Cells
were then treated for one hour at 4 °C with RNase A (2 ng/ml; USB, Inc.) and the samples were
centrifuged at 20,000 x g for 10 min at 4˚C to remove cell debris. The lysate was then incubated
with a 50/50 slurry of Sepharose protein A beads (Upstate; now Millipore) and protein G beads
(GE Healthcare) in IP buffer for 3 hours at 4 °C. The beads were removed by centrifugation
(1000 x g for 2 min at 4 ˚C) and antibodies were added to the pre-cleared lysate for an overnight
- 11 -
incubation. For ChIP, we used anti-RNAP subunit NT63 monoclonal antibodies (Neoclone
W0002), anti-RNAP 70 subunit monoclonal antibodies (Neoclone W0004), or anti-DksA rabbit
polyclonal antisera (a kind gift from Diana Downs). The next day, 30 μl of a 50/50 slurry of
Sepharose protein A and G beads in 250 μl IP buffer was added to the lysate to capture antibody-
protein-DNA complex for one hour at 4 °C. Beads were then washed once with 1 ml of 250 mM
LiCl wash buffer (100 mM Tris pH 8, 250 mM LiCl, 2% Triton X-100), twice with 1 ml 600 mM
NaCl wash buffer (100 mM Tris pH 8, 600 mM NaCl, 2% SDS), twice with 1 ml 300 mM NaCl
wash buffer (100 mM Tris pH 8, 300 mM NaCl, 2% SDS), and twice with 1 ml TE (10 mM Tris
pH 8, 1 mM EDTA). Elution buffer (50 mM Tris pH 8, 10 mM EDTA, 1% SDS) was added after
the final wash step, and beads were incubated at 65 °C for 30 minutes to remove the crosslinked
protein-DNA complexes from the beads. After centrifugation (1000 x g for 2 min at 25˚C) to
remove the beads, the samples were incubated overnight at 65 °C to reverse the protein-DNA
formaldehyde crosslinks. DNA was purified using Qiagen’s PCR Purification kit and eluted in a
final volume of 65 μl with 10 mM Tris pH 8.
Array hybridization and data analysis
Both the immunoprecipitated (IP) DNA and input DNA (chromosomal DNA purified prior
to IP) were amplified by ligation-mediated PCR (LM-PCR) as described previously (Mooney et
al., 2009). IP samples were compared to control samples of input DNA by labeling with Cy5 and
Cy3 dyes and hybridizing to a tiling microarray. The custom microarray (Nimblegen) contained
378,238 Tm-matched ~50mer oligonucleotides that tile the E. coli K-12 chromosome (Genbank
accession NC_000913.2) on alternated strands with ~12-bp spacing designed by Y. Dufour using
chipD (Dufour et al., 2010).
The Cy5 (for IP DNA) and Cy3 (for input DNA) signal intensities for all probes were
- 12 -
converted to log2(IP/input) values that represent the ChIP signals. Each ChIP signal was
associated with a genome position of the midpoint of the corresponding probe. To smooth the
association curve across the genome and eliminate the bias due to different hybridization
efficiency of probes, the rolling average of ChIP signals within a 300bp window was calculated.
We utilized the smoothed log2 (IP/input) curves of RNAP, σ70 or DksA for data analysis. ChIP
signals across the genome were visually compared using the viewing software MochiView
(http://johnsonlab.ucsf.edu/mochi.html). Gene annotation and promoter locations were identified
based on the databases RegulonDB (http://regulondb.ccg.unam.mx/) and EcoCyc (http://ecocyc.org/).
- 13 -
Supplemental references
Blankschien, M.D., Lee, J.H., Grace, E.D., Lennon, C.W., Halliday, J.A., Ross, W., Gourse, R.L.,
and Herman, C. (2009). Super DksAs: substitutions in DksA enhancing its effects on
transcription initiation. The EMBO journal 28, 1720-1731.
Blattner, F.R., Plunkett, G., 3rd, Bloch, C.A., Perna, N.T., Burland, V., Riley, M., Collado-Vides,
J., Glasner, J.D., Rode, C.K., Mayhew, G.F., et al. (1997). The complete genome sequence of
Escherichia coli K-12. Science (New York, N.Y 277, 1453-1462.
Bolivar, F., Rodriguez, R.L., Greene, P.J., Betlach, M.C., Heyneker, H.L., Boyer, H.W., Crosa,
J.H., and Falkow, S. (1977). Construction and characterization of new cloning vehicles. II. A
multipurpose cloning system. Gene 2, 95-113.
Boubakri, H., de Septenville, A.L., Viguera, E., and Michel, B. The helicases DinG, Rep and
UvrD cooperate to promote replication across transcription units in vivo. The EMBO journal 29,
145-157.
Brooker, R.J., and Wilson, T.H. (1985). Isolation and nucleotide sequencing of lactose carrier
mutants that transport maltose. Proceedings of the National Academy of Sciences of the United
States of America 82, 3959-3963.
Cardinale, C.J., Washburn, R.S., Tadigotla, V.R., Brown, L.M., Gottesman, M.E., and Nudler, E.
(2008). Termination factor Rho and its cofactors NusA and NusG silence foreign DNA in E. coli.
Science (New York, N.Y 320, 935-938.
Dufour, Y. S., Wesenberg, G. E., Tritt, A. J., Glasner, J. D., Perna, N. T., Mitchell, J. C., and
Donohue, T. J. (2010). chipD: a web tool to design oligonucleotide probes for high-density tiling
arrays. Nucleic Acids Res 38, W321-W325.
Feng, G.H., Lee, D.N., Wang, D., Chan, C.L., and Landick, R. (1994). GreA-induced transcript
cleavage in transcription complexes containing Escherichia coli RNA polymerase is controlled
by multiple factors, including nascent transcript location and structure. The Journal of biological
chemistry 269, 22282-22294.
Mooney, R. A., Davis, S. E., Peters, J. M., Rowland, J. L., Ansari, A. Z., and Landick, R. (2009).
Regulator trafficking on bacterial transcription units in vivo. Mol Cell 33, 97-108.
Posfai, G., Plunkett, G., 3rd, Feher, T., Frisch, D., Keil, G.M., Umenhoffer, K., Kolisnychenko,
V., Stahl, B., Sharma, S.S., de Arruda, M., et al. (2006). Emergent properties of reduced-genome
Escherichia coli. Science (New York, N.Y 312, 1044-1046.
St Onge, R.P., Mani, R., Oh, J., Proctor, M., Fung, E., Davis, R.W., Nislow, C., Roth, F.P., and
Giaever, G. (2007). Systematic pathway analysis using high-resolution fitness profiling of
combinatorial gene deletions. Nature genetics 39, 199-206.
Tehranchi, A.K., Blankschien, M.D., Zhang, Y., Halliday, J.A., Srivatsan, A., Peng, J., Herman,
C., and Wang, J.D. The transcription factor DksA prevents conflicts between DNA replication
and transcription machinery. Cell 141, 595-605.