dividend policy and wealth maximisation: the effect
TRANSCRIPT

DIVIDEND POLICY AND WEALTH
MAXIMISATION: THE EFFECT OF MARKET
MOVEMENTS ON DIVIDEND-INVESTING
RETURNS
by
Nicol Eduan du Toit
Thesis presented in fulfilment of the requirements for the degree
Masters of Commerce
at the
Faculty of Economic and Management Sciences
Stellenbosch University
Supervisor: Prof. P.D. Erasmus
March 2013

ii | P a g e
DECLARATION
By submitting this thesis electronically, I declare that the entirety of the work
contained therein is my own, original work, that I am the sole author thereof (save to
the extent explicitly otherwise stated), that reproduction and publication thereof by
Stellenbosch University will not infringe any third party rights and that I have not
previously in its entirety or in part submitted it for obtaining any qualification.
March 2013
Copyright © 2013 Stellenbosch University
All rights reserved
Stellenbosch University http://scholar.sun.ac.za

iii | P a g e
ABSTRACT
This study sets out to evaluate the possible influence of increasing and declining
markets on the returns of dividend-investing strategies. This study’s objective,
therefore, was to evaluate the possible influence dividend pay-out policy has on
share return. Secondary objectives serve to investigate how the size of cash dividend
payments, measured in dividend yield (DY), influence share value, especially during
bull and bear markets respectively.
In order to address the stated objectives of this study and prevent possible
survivorship bias, the sample included listed and delisted shares for the period 1995
to 2010. Initially, all firms that were listed on the Johannesburg Stock Exchange
(JSE) during the period under review were considered, both that were listed at the
end as well as firms that delisted. However, due to the nature of the financial
structures of firms in the financial and basic industries, the study did not include their
data. The final sample consisted of 291 firms, providing 22 927 monthly
observations. Dividend-investing strategies were constructed using non-dividend-
paying (Portfolio one) and dividend-paying firms (Portfolio two). Portfolio one and two
were then further deconstructed into four groups based on monthly DY rankings.
Portfolio one was represented by Group 1, whilst Portfolio two was grouped into the
lowest, medium, and highest DYs and classified as Group 2 to Group 4 accordingly.
The results obtained from statistical analyses performed in this study indicate that the
level of DY appears to influence returns positively. Furthermore, after investigating
the results obtained during opposing market scenarios, some important findings
resulted. During bear markets no significant difference in abnormal risk-adjusted
returns was observed for the portfolios and four groups, however, in bull markets the
return for Portfolio two, specifically Group 4, was more than double the result for the
non-dividend payers. This study, therefore proposes that firms should have a DY in
the range of the highest market DY average for bull markets specifically. From the
perspective of the potential investors, the study suggests that dividend-investing
could allow for the generation of positive risk-adjusted returns during bull markets.
Stellenbosch University http://scholar.sun.ac.za

iv | P a g e
OPSOMMING
Hierdie studie evalueer die moontlike invloed van stygende en dalende markte
aangaande opbrengs op dividend-investerings strategieё. Die studie se primêre
doelwit is om die invloed van dividend uitbetalings op aandeel opbrengste te
bestudeer. Sekondêre doelwitte ondersoek hoe die grootte van ‘n kontant dividend,
soos gemeet in dividend opbrengs, die aandeel-waarde beïnvloed, spesifiek tydens
bul en beer markte.
Om oorlewingsydigheid te voorkom, sluit die steekproef genoteerde sowel as
gedenoteerde firmas in vir ‘n tydperk van 1995 tot 2010. Aanvanklik was alle sektore
van die Johannesburg Aandele-beurs (JSE) ondersoek, maar weens die komplekse
kapitaal struktuur van finansiёle en die basiese nywerheid sektore was hul aandeel
inligiting uitgesluit. Die finale steekproef het ‘n totaal van 291 firmas ingesluit en 22
927 maandelike waarnemings verskaf. Dividend-investerings strategieё was
saamgestel deur nie-dividend-betalende firmas (Portefeulje een) teenoor dividend-
betalende firmas (Portefeulje twee) te vergelyk. Die twee portefeuljes was ook verder
onderdeel in vier groepe volgens maandelikse dividend opbrengstes. Portefeulje een
was verteenwoordig deur Groep 1, terwyl Portfeulje twee opgedeel was volgends
laag, medium, en hoë dividend opbrengstes en geklasifiseer as Groep 2 tot 4
onderskeidelik.
Die resultate van die statististiese ontleding van hierdie studie dui moontlik daarop
dat die vlak van dividend opbrengs aandeel waarde positief beïnvloed. Nadat die
spesifieke bul en beer markte ontleed is, was belangrike resultate waargeneem.
Tydens beer markte was daar geen beduidende verskil tussen die risiko-aangepaste
opbrengstes van die twee portefeuljes en vier groepe nie, maar tydens bul markte
het die opbrengstes van Portefeulje twee, spesifiek Groep 4, meer as dubbel dié van
die nie-dividend betalers getoon. Die studie stel dus voor dat ‘n firma tydens bul
markte moet poog om ‘n dividend opbrengs te handhaaf wat die hoogste gemiddeld
van die mark verteenwoordig. Vanuit die belegger se oogpunt, stel die studie voor
dat dividend investering stategieё moontlik gebruik kan word om positiewe risiko-
aangepaste opbrengstes te genereer, veral tydens bul markte.
Stellenbosch University http://scholar.sun.ac.za

v | P a g e
TABLE OF CONTENTS
DECLARATION ........................................................................................................ ii
ABSTRACT ............................................................................................................. iii
OPSOMMING .......................................................................................................... iv
TABLE OF CONTENTS............................................................................................ v
LIST OF FIGURES ................................................................................................ viii
LIST OF TABLES .................................................................................................... ix
Chapter 1 : INTRODUCTION TO THE STUDY .................................... 1
1.1 INTRODUCTION .................................................................................... 1
1.2 BACKGROUND OF THE STUDY ........................................................... 2
1.3 THE RESEARCH PROCESS ................................................................. 5
1.3.1 IDENTIFYING THE RESEARCH PROBLEM .......................................... 6
1.3.1.1 Primary research objective ............................................................... 7
1.3.1.2 Secondary objectives ....................................................................... 8
1.3.2 DATA COLLECTION AND RELEVANCE OF DATA ............................... 8
1.4 IMPORTANCE OF THE STUDY ........................................................... 11
1.5 ORIENTATION OF THE STUDY .......................................................... 12
Chapter 2 : CAPITAL BUDGETING .................................................. 16
2.1 INTRODUCTION .................................................................................. 16
2.2 FIRM VALUE AND THE FINANCIAL FUNCTION ................................. 17
2.2.1 THE CAPITAL BUDGETING PROCESS .............................................. 18
2.2.2 CAPITAL BUDGETING PRINCIPLES .................................................. 20
2.3 THE INVESTMENT DECISION ............................................................ 23
2.3.1 THE HURDLE RATE ............................................................................ 23
2.3.2 INVESTMENT ANALYSIS TECHNIQUES ............................................ 28
2.4 CONCLUSION ...................................................................................... 33
Chapter 3 : CAPITAL STRUCTURE .................................................. 34
3.1 INTRODUCTION .................................................................................. 34
Stellenbosch University http://scholar.sun.ac.za

vi | P a g e
3.2 CAPITAL STRUCTURE AND THE DIVIDEND DECISION ................... 35
3.3 TRADITIONAL CAPITAL STRUCTURE THEORIES ............................ 36
3.4 MARKET IMPERFECTIONS AND CAPITAL STRUCTURE THEORY . 41
3.4.1 AGENCY COST AND PREVENTATIVE MEASURES .......................... 41
3.4.2 FINANCIAL DISTRESS AND TRADE-OFF THEORY .......................... 44
3.4.3 ASYMMETRIC INFORMATION AND PECKING-ORDER THEORY .... 46
3.5 CONCLUDING REMARKS ON THE FINANCIAL STRUCTURE .......... 49
Chapter 4 : THE DIVIDEND DECISION ............................................. 51
4.1 INTRODUCTION .................................................................................. 51
4.2 BACKGROUND TO THE DIVIDEND DECISION AND POLICY ........... 52
4.2.1 TYPES OF DIVIDEND PAYMENTS ..................................................... 53
4.2.2 THE CASH DIVIDEND PAYMENT CHRONOLOGY ............................. 55
4.2.3 MEASURES OF DIVIDEND POLICY AND VALUATION ...................... 56
4.3 THE DIVIDEND POLICY DECISION .................................................... 60
4.3.1 DIVIDEND IRRELEVANCE VERSUS RELEVANCE ............................ 60
4.3.2 MODERN THEORIES ON DIVIDEND PAYMENTS .............................. 65
4.4 DIVIVDEND POLICY OBSERVATIONS ............................................... 69
4.4.1 DIVIDEND PAYMENTS ARE MAINTAINED ......................................... 69
4.4.2 DIVIDENDS ARE LESS VOLATILE THAN EARNINGS ....................... 70
4.5 DIVIDEND-INVESTING AND MARKET MOVEMENTS ........................ 71
4.5.1 DIVIDEND-INVESTING PORTFOLIOS ................................................ 72
4.6 CONCLUSION ...................................................................................... 73
Chapter 5 : RESEARCH METHODOLOGY ....................................... 75
5.1 INTRODUCTION .................................................................................. 75
5.2 RESEARCH DATA ............................................................................... 75
5.2.2 TIME PERIOD OF THE STUDY ........................................................... 80
5.3 RESEARCH OBJECTIVES AND HYPOTHESIS .................................. 83
5.4 STATISTICAL ANALYSIS TECHNIQUES ............................................ 84
5.4.1 DESCRIPTIVE STATISTICS ................................................................ 84
5.4.2 INFERENTIAL STATISTICS ................................................................. 88
5.5 VALIDITY AND RELIABILITY ............................................................... 91
5.6 CONCLUSION ...................................................................................... 93
Stellenbosch University http://scholar.sun.ac.za

vii | P a g e
Chapter 6 : EMPIRICAL RESULTS ................................................... 94
6.1 INTRODUCTION .................................................................................. 94
6.2 DESCRIPTIVE STATISTICS ................................................................ 95
6.2.1 CENTRAL TENDENCY ........................................................................ 97
6.2.2 DEGREE OF DISPERSION .................................................................. 99
6.2.3 SHAPE OF THE DATA SET ............................................................... 101
6.2.4 MARKET MOVEMENTS ANALYSIS .................................................. 102
6.3 INFERENTIAL STATISTICS ............................................................... 106
6.3.1 COMPARATIVE ANALYSIS OF INFERENTIAL RESULTS ................ 106
6.3.2 COMPARATIVE ANALYSIS FOR MARKET MOVEMENTS ............... 109
6.4 CONCLUSION .................................................................................... 111
Chapter 7 : CONCLUSION AND RECOMMENDATIONS ............... 112
7.1 INTRODUCTION ................................................................................ 112
7.2 SUMMARY.......................................................................................... 113
7.3 CONCLUSIONS AND DIVIDEND POLICY IMPLICATIONS ............... 117
7.4 LIMITATIONS AND FUTURE RESEARCH POSSIBILITIES .............. 121
REFERENCES ................................................................................. 123
Stellenbosch University http://scholar.sun.ac.za

viii | P a g e
LIST OF FIGURES
Figure 1.1: Interactions of the financial functions ........................................................ 3
Figure 1.2: The research process ............................................................................... 6
Figure 1.3: The literature review framework ............................................................. 13
Figure 2.1: The capital budgeting process ................................................................ 18
Figure 2.2: Capital budgeting principles ................................................................... 20
Figure 2.3: Optimal investment decision ................................................................... 24
Figure 3.1: Cost of capital with zero taxes ................................................................ 38
Figure 3.2: Cost of capital if there are taxes ............................................................. 40
Figure 3.3: Cost of capital considering financial distress .......................................... 44
Figure 4.1: The dividend payment timeline ............................................................... 55
Figure 4.2: Life cycle analysis of earnings and revenue ........................................... 59
Figure 4.3: DY of major S&P's industry groups September 2004 ............................. 66
Figure 5.1: Relevance of dividend payments investigated ........................................ 77
Figure 5.2: Comparative analysis of various DY groups ........................................... 78
Figure 5.3: Volume traded on the JSE in Million 1990-2005 ..................................... 81
Figure 5.4: Earnings and DY growth 1990-2005 ....................................................... 82
Figure 5.5: Closing values for the JSE ALSi 1990-2005 ........................................... 82
Figure 5.6: Shape of the data ................................................................................... 85
Figure 5.7: Kurtosis in a data set .............................................................................. 87
Figure 6.1: Relative annual TSR for the two portfolios ............................................. 98
Figure 6.2: Relative TSR for dividend-investing groups ............................................ 99
Stellenbosch University http://scholar.sun.ac.za

ix | P a g e
LIST OF TABLES
Table 2.1: Factors that affect the MCC ..................................................................... 26
Table 4.1: STC rates on dividends declared ............................................................. 63
Table 4.2: STC versus a classical taxation system ................................................... 63
Table 4.3: Comparison of STC and the withholding tax ............................................ 64
Table 6.1: Descriptive statistics for Portfolio one and Portfolio two .......................... 96
Table 6.2: Descriptive statistics for DY groups ......................................................... 96
Table 6.3: Comparative market analysis for the two portfolios ............................... 103
Table 6.4: Comparative market analysis for the dividend-investing groups ............ 104
Table 6.5: Regression results for the two portfolios ................................................ 107
Table 6.6: Regression results for dividend-investing groups .................................. 108
Table 6.7: Regression results for the four groups during bear markets .................. 109
Table 6.8: Regression results for groups during bull markets ................................. 110
Stellenbosch University http://scholar.sun.ac.za
1 | P a g e
Chapter 1 : INTRODUCTION TO THE STUDY
1.1 INTRODUCTION
The relevance (or irrelevance) of dividend payments has been the topic of much
discussion for the past eight decades, ever since Graham and Dodd (1934)
established that the payment of a liberal portion of earnings as dividends adds to the
attractiveness of a share. Statements such as this caused academics to investigate
a new field of finance, focusing on dividend policy, as more and more researchers
started to question the role of dividends and its supposed effect on share values
(Henne, Ostrowski, and Reichling, 2008). This study specifically aims to analyse the
relevance of dividend information during bull and bear markets and the potential
influence it has on share returns. Focus is placed on the perspective of an investor
seeking to utilise a dividend-investing strategy to enhance return on investment.
From a firm’s perspective, the study can potentially assist its management in their
formulation of dividend policy during market movements.
It can be argued that through the greater integration of capital markets, the effects of
economic changes and the way it influences dividend policies have managed to
influence a far greater audience than it ever did before. This is particularly the case
in the South African capital markets with the Johannesburg Stock Exchange (JSE)
and the enhanced liquidity in the market (Gidlow, 2009). Considering the interwoven
network of investors and corporate entities present on the JSE, this study will
investigate how two portfolios and four representative groups, based on pre-
determined dividend-investing strategies using dividend yield (DY) information,
performed over the 192 month period of 1995 to 2010. Dividend-investing strategies,
a.k.a. “dividend-investing” (Knowles and Petty, 1992:29), are accordingly evaluated
during market increases and declines to determine if dividend policy has an effect on
share returns.
Stellenbosch University http://scholar.sun.ac.za

2 | P a g e
Before investigating the performance of the DY portfolios and groups, it is important
that the variables that could influence a firm’s dividend policy are considered. These
include the influence of the capital budgeting and capital structure decisions,
taxation, traditional and modern theories pertaining to dividend policy formulation
and the effect of market sentiment.
To set the scope for the rest of the study, the remainder of this chapter consists of
four sections. The first provides for the background of the study and introduces the
foundation of the dividend decision when the role of the financial function is provided.
The next section then provides the research design, which specifies the type of
research performed and the research objectives of the study. These objectives
provide the foundation for the penultimate section, which serves to formally identify
the importance and need for the study. The chapter is concluded with an overview of
important topics discussed, and provides guidelines for the following chapters of this
study.
1.2 BACKGROUND OF THE STUDY
“A firm seeking to maximise wealth has to invest wisely, find the right kind and mix of
financing to fund these investments and return cash to the owners if there are not
enough good investments in order to increase shareholders’ wealth” (Damodaran,
2011:1).
Considering the value of analysing the dividend decision of firms in line with capital
markets conditions, the role of the optimal financial structure needs to be introduced.
By providing an overview of the various functions performed and how they can
interact, the opportunity to utilise dividend information will be better understood.
An optimal financial structure constitutes three elements, namely the investment,
financing and dividend decisions financial managers take in order to increase firm
and share value (Bierman and Smidt, 2007:5). How these various functions interact,
in relation to the quote above, is depicted in figure 1.1.
Stellenbosch University http://scholar.sun.ac.za

3 | P a g e
Figure 1.1: Interactions of the financial functions
Source: Brealey, Myers, and Allan (2008:117)
Figure 1.1 indicates how a firm needs to balance future growth requirements against
shareholders’ demands for returns over the short term. The purpose of the
investment or capital budgeting decision is to invest in projects that will generate
returns. However, in order to maximise shareholders’ wealth the return must be
greater than a risk-adjusted, firm-specific hurdle rate after considering all positive
and negative side-effects of the investment and timing of incremental cash flows
(Damodaran, 2011:2). The investment decision specifically includes the identification
and selection of investable opportunities to maximise value to the firm and
shareholders. The purpose of the financing decision is then to find the right mix of
financing to fund the investments selected in the capital budget, which further
contributes to the shareholders’ value management.
At the centre of these interactions the hurdle rate serves as an important benchmark
when deciding on how beneficial financing from various sources can possibly be, if
investments are advisable, or if earnings should be redistributed to shareholders
(Brealey et al., 2008:117; Correia, Flynn, Uliana, and Wormald, 2007:1-20). If
reinvestment provides a rate of return lower than the hurdle rate, a firm must
determine whether to keep the earnings as reserves for future investment funding, or
distribute it as dividends to the shareholders.
Dividend
distributions Reinvest
Shareholders
invest for
themselves
Stellenbosch University http://scholar.sun.ac.za

4 | P a g e
Many academics have, however, questioned if the dividend policy has any real effect
on share prices and as Clayman, Fridson, and Troughton (2008) state “It is one of
the longest and most contended debates in finance.” Accordingly, many dividend
theories have been conceived, starting with the more traditional, which ultimately
provided the foundation of modern believes. Clayman et al. (2008) posit that three
traditional schools of thought can be traced regarding the relevance of dividends and
policy formulation. These are briefly identified next, but discussed in greater detail
later in the study.
The first school of thought believed that dividends are irrelevant to the value of a
share. This school of thought was propositioned in studies performed by Modigliani
and Miller (1963; 1961; 1958). They based their arguments on the assumptions of
zero taxes, symmetrical markets and no transaction costs (to name but a few). They
came to the conclusion that since the cost of equity does not affect a firm’s value,
only debt financing should be used. Thus, dividends would not be of any concern.
These assumptions were seen as extreme in any economy and created the basis of
arguments for the second school of thought, which state that dividends do matter
since higher dividend payments are likely to improve a firm’s market value.
Traditionalists in this second school included Gordon (1963; 1959), Lintner (1962;
1956), and Graham and Dodd (1962). Graham and Dodd’s (1962:480) viewpoint was
that “the typical dollar of reinvestment has less economic value to the shareholder
than a dollar paid in investments.”
Stemming from the above arguments, the third school believed that dividends do
matter (Pettit, 1977). However, this school of thought propositioned that high
dividend pay-out ratios will lead to a lower share price, because dividend income is
usually taxed at a higher rate than capital gains. The modern beliefs regarding
dividend policy build from the traditional schools. Mostly, the theories see dividend
information to be very valuable in the analysis of shares, as they are able to
influence value through signalling, or other channels that affect the share price. As
stated previously, all of these are discussed in greater detail throughout the study.
Stellenbosch University http://scholar.sun.ac.za

5 | P a g e
What needs to be understood at this point is that there is a great variety of beliefs
and theories regarding the use of dividend information. These stem from a myriad of
contrasting studies that indicate different conclusions regarding the relevance of
dividends, or even how they influence share value. This study seeks to improve on
this current body of knowledge by considering DY levels in times of bull and bear
markets and the possible effect thereof on share prices. Accordingly, for the firms
analysed in this study, the relevant measure of shareholder wealth centres on the
risk-adjusted returns generated from dividend-investing strategies. These returns are
measured in relation to respective total share return (TSR) values of a publically
traded firm’s ordinary shares on the JSE during 1995 to 2010. In this manner,
dividend-investing strategies will be investigated to determine whether positive risk-
adjusted returns can be generated during both bull and bear markets.
A holistic overview of each of the financial functions, i.e. the investment, financing
and dividend decisions, is provided in Chapter two, three and four respectively.
However, before the literature review is presented, the next section of this chapter
provides the research process followed in this study.
1.3 THE RESEARCH PROCESS
According to Collis and Hussey (2009:3) research can be defined as “a systematic
and methodical process of enquiry and investigation with a view to increase
knowledge.” The authors state that the objectives of research should be as follows:
• To review and synthesise existing knowledge.
• To investigate, and provide a solution for some existing situation or problem.
• To generate new knowledge.
• A combination of any of the above.
Collis and Hussey (2009:10) further state that in performing research, “several
fundamental stages in the research process exist that are common to all scientifically
Stellenbosch University http://scholar.sun.ac.za

6 | P a g e
based investigations.” Figure 1.2 illustrates an adapted version of a traditional
research process identified by the authors noted previously and utilised in this study.
Figure 1.2: The research process
Source: Collis and Hussey (2009:10)
The steps involved in designing a study depend to some extent on the nature of the
specific research. Stated differently, a study’s research design should always
consider the specific needs of the type of research being performed. The stages
identified above and how they were tailored for the research performed in this study
is discussed in the next two sections. Stages one to three identify the research
problem, followed by a section on the relevant data collected for the research to be
performed and how it was utilised through stages five and six.
1.3.1 IDENTIFYING THE RESEARCH PROBLEM
Opportunities to enhance shareholder wealth stem from many sources. By
identifying the source of such an opportunity and specifying the problem, a
researcher is able to gain greater direction and purpose for the study that needs to
be performed (De Vries, 2010:87). Cant, Gerber-Nel, Nel, and Kotze (2005:40)
indicate the importance of performing an accurate in-depth analysis of possible gaps
Stellenbosch University http://scholar.sun.ac.za

7 | P a g e
in knowledge by stating that “if the diagnosis of the problem or opportunity is weak,
the research may also lead to an insufficient solution.”
Previously, it was stated that the purpose of the financial function, performed by a
firm’s management, should be to maximise the shareholders’ wealth (Bierman and
Smidt, 2007:5). Thus the financial function seeks to not only enhance value, but also
correct a manager’s shortcomings when value is not being maximised. It was also
stated that the financial function consisted out of the investment, financing and
dividend decisions managers make (Brealey et al., 2008:117; Correia et al., 2007:1-
20). Moreover, in Chapter two and three it is indicated how the various components
interact and provide for the dividend decision discussed in Chapter four.
Chapter four presents some of the past studies performed to investigate the effect of
the dividend decision. However, as indicated previously, the impact that bull and
bear markets can have on the dividend policies of firms does not seem to have
received the same level of attention in South Africa. This study is specifically
performed in order to address this apparent gap in knowledge when considering
local markets. The next stage in the research process is to formulate the research
objectives necessary to address the research problem identified.
Cant et al. (2005:42) state that by adequately specifying the primary and secondary
objectives, the purpose of the research to be conducted can be crystallised, which
guides the research in the right direction. This study’s research objectives are
therefore formally specified next.
1.3.1.1 Primary research objective
• To evaluate the possible influence dividend pay-out policy has on share
return.
Stellenbosch University http://scholar.sun.ac.za

8 | P a g e
1.3.1.2 Secondary objectives
• To determine whether returns on shares differ between dividend-paying firms
and non-dividend-paying firms.
• To determine whether the various dividend pay-out policies regarding the size
of dividend payments, as per DY, affect share returns.
• To evaluate the possibility of using dividend-investing strategies during market
movements to earn a higher than market return on a risk-adjusted basis.
Considering these specific research objectives, and as depicted in figure 1.2, the
methodology of the research is identified in stage three by stating the type of data to
be collected, the type of research that will be performed, how the sample is identified
and represented, as well as how data is measured (Coldwell and Herbst, 2004:36).
The following section explains these topics further.
1.3.2 DATA COLLECTION AND RELEVANCE OF DATA
Research can be classified as being exploratory or descriptive (Collis and Hussey,
2009:5). In this study the research performed is in the form of a descriptive study
and, to a degree explanatory. According to Blumberg, Cooper and Schindler
(2008:14) “a descriptive study tries to discover answers to questions such as who,
what, where, and sometimes how.” Explanatory research, also known as analytical
research, is a continuation of descriptive research (Collis and Hussey, 2009:6).
According to the authors descriptive research is performed in order to describe a
phenomenon as it exists. Explanatory research attempts to understand the
phenomenon further by discovering and measuring causal relationships found
between variables. Within these relationships dependent and independent variables
are identified to test a hypothesis.
A hypothesis describes the relationship or differences among variables (Cooper and
Schindler, 1998:448). The authors further state that a good hypothesis is one that
can explain what it claims to explain, is testable, and has greater range, probability
and simplicity than its rivals. Cooper and Schindler (1998:449) state the null
Stellenbosch University http://scholar.sun.ac.za

9 | P a g e
hypothesis (��) is used to test statistical significance and is valid when no difference
exists between a population parameter and a sample statistic being compared to it.
Alternatively, the alternative hypothesis (��� is valid when differences do exist.
O’Leary (2005:236-237) stated that the dependent variable is the variable that the
researcher wants to study and possibly measure. The independent variable is then
the variable that might be causing an effect on the dependent variable. Accordingly,
for this study the independent variables used are dividend distributions during bull
and bear markets. The dependent variable is the monthly risk-adjusted returns
measured for the two portfolios and four groups. These are represented by using the
following financial properties throughout the study: firm-specific dividend distribution
measured via DY, market return and movements as changes in the All Share index
(ALSi) on the JSE.
Based on the before-mentioned research objectives and these variables the null
hypothesis and alternative hypothesis of the study can be stipulated as follows:
�� : Dividend distributions have no significant influence on share returns.
�� : Dividend distributions have significant influence on share returns.
Therefore, statistical analysis performed in this study will review the relationships, or
differences, between the dependent and independent variables to determine whether
the null hypothesis can be rejected.
Using these hypotheses, the relevant data applicable to the study needs to be
collected and processed into a usable format. In this study the sample included listed
and delisted shares for the period 1995 to 2010. Therefore, all firms that were listed
during the period under review were initially considered, both those that were listed
at the end as well as firms that delisted during it, in order to reduce survivorship bias.
Eventually the financial and basic material firms were excluded from the sample data
due to the nature of the balance sheets of these firms, specifically their capital
structures. Financial firms are usually highly regulated in terms of capital
requirements, which can influence dividend policy. Basic material firms on the other
Stellenbosch University http://scholar.sun.ac.za

10 | P a g e
hand are also heavily biased due to the amount of assets and nature of operations.
The final sample consisted of 291 firms providing 22 927 monthly observations.
In order to ensure consistency in data analysis all financial data was finally sourced
from the McGregor BFA (2010) database. Information was collected and imported
into Excel (2007), and further analysed and tested with the statistical analysis
software, Statistica Version 9 (2009). Through the use of these programs, data
analysis could be performed. Expanding on the previous stages depicted in figure
1.2, stage five is central to achieving the objectives of the study as it provides the
answers to the research problem. According to Blumberg et al. (2008:75) “data
analysis involves the reducing of accumulated data into meaningful amounts,
developing summaries, looking for patterns and applying statistical techniques.”
The statistical techniques referred to are classified as descriptive and inferential
statistics. Collis and Hussey (2009:221) define descriptive statistics as “a group of
statistical methods used to summarise, describe or display quantitative data.”
Inferential statistics on the other hand, is defined as “a group of statistical methods
and models used to draw conclusions about a population from quantitative data
relating to a sample” (Collis and Hussey, 2009:222).
If data is carefully collected and methodically structured for optimal data analysis,
then descriptive and inferential statistics provide for meaningful information on the
research problem identified. However, the statistical analysis performed should also
be checked for validity and reliability. These topics are discussed in greater depth in
Chapter five before being applied in Chapter six. Finally, building from all the
previous stages, the final stage of the research process involves reporting the results
found after all the preceding stages have been completed.
The following sections provide an explanation of the importance of the study
performed, before the chapter is concluded with an overview of the chapters
presented throughout the rest of this study.
Stellenbosch University http://scholar.sun.ac.za

11 | P a g e
1.4 IMPORTANCE OF THE STUDY
As mentioned previously, this study’s objective is to evaluate the possible influence
dividend pay-out policy has on share return. This is performed by using DY as a
measure of cash dividends distributed by a firm to shareholders. Secondary
objectives serve to investigate how the size of DY levels influence share value and
whether there is a possibility of using dividend-investing, especially in times of
market movements, to earn positive risk-adjusted returns. From the perspective of
the firm, by analysing the performance of dividend-investing strategies over time, a
possibility exists that dividend policy formulation might be used to maximise share
value.
According to investors and management who believe dividends to be relevant, the
dividend policy serves as the middle ground between the management of a firm and
its shareholders. Management should apply sound financial theories in order to
maximise shareholders’ wealth, and investors evaluate their performance by using
valuation models that incorporate dividends. The issue, however, that contributes to
the need for the analysis of dividend-investing, is that South African firms has been
found to be very conservative and sensitive towards dividend payments (Firer,
Gilbert, and Maythan (2008). These authors further found that, at times, many South
African managers have paid out a negative dividend simply to maintain their market
value of shares at the time. A negative dividend is defined as the situation where a
larger amount of dividends is paid out to shareholders than the earnings for the
period, by issuing new ordinary shares to fund the dividend payments. Naturally, this
action does not make economic sense, yet it is sometimes occurring in the South
African economy.
This investigation is also of particular significance in the South African markets, since
the most common dividend policy used by firms listed on the JSE remains the
constant-paying dividend policy (Van der Merwe, 2010:29). Accordingly, firms
appear not only to be conservative regarding dividend payments, but have also built
up large reserves of cash for a variety of reasons, spanning from financial crises to
the various leverage strategies employed by firms (Bates, Kahle, and Stultz,
Stellenbosch University http://scholar.sun.ac.za

12 | P a g e
2009:1985). These cash reserves have the potential to influence capital budgeting
and financing decisions significantly. Therefore, the role of dividend distributions may
become increasingly important in time to come. Wolmarans (2003:243) stated that “it
is generally accepted that the payments of dividends is the most important and most
widely used instrument for the distribution of value to shareholder.” Furthermore, as
stated by Firer et al. (2008:10):
“An argument can be made that dividends are more important than ever before,
since it is the one number that a shareholder can trust. Earnings per share and even
cash flow per share can be manipulated by management, but dividend cheques can
be cashed.”
Therefore, this study seeks to investigate whether there is a possibility that investors
are able to maximise returns from investments after considering the effect of market
movements and firm dividends on share value. As a result, market movements in
particular, and the way they can be used to manage dividend policy, could possibly
be scrutinised in greater detail in future as to ensure value enhancement of
investment portfolios.
The two portfolios and four DY groups that are constructed to test the dividend-
investing strategies are explained in greater detail later in the study. The next section
concludes this chapter by providing an overview of the chapters discussed in this
study.
1.5 ORIENTATION OF THE STUDY
The investment decision, financing decision and dividend decisions should be made
with great care and consideration. Figure 1.3, which is adapted from Damodaran
(2011:9), depicts how each function serves to maximise value and how the following
chapters of the study interact.
Stellenbosch University http://scholar.sun.ac.za
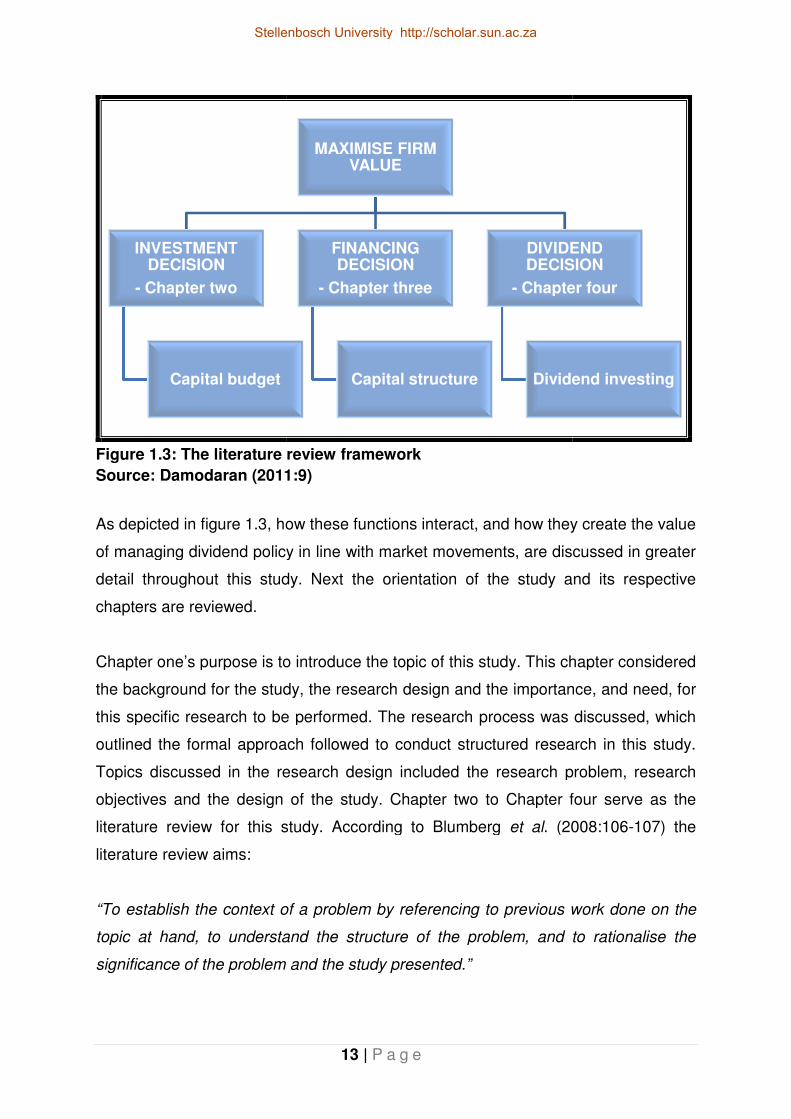
Figure 1.3: The literature review framework
Source: Damodaran (2011
As depicted in figure 1.3, how these functions interact, and how they create the value
of managing dividend policy in line with market movements, are discussed in greater
detail throughout this study. Next
chapters are reviewed.
Chapter one’s purpose is to
the background for the study, the research
this specific research to be performed. The research
outlined the formal approach
Topics discussed in the research design included
objectives and the design of the study
literature review for this study. According to Blumberg
literature review aims:
“To establish the context of a problem by referenci
topic at hand, to understand the structure of the problem, and to rationalise the
significance of the problem and the study presented.”
INVESTMENT DECISION
- Chapter two
Capital budget
13 | P a g e
ature review framework
Source: Damodaran (2011:9)
ow these functions interact, and how they create the value
of managing dividend policy in line with market movements, are discussed in greater
detail throughout this study. Next the orientation of the study and its r
’s purpose is to introduce the topic of this study. This chapter considered
the background for the study, the research design and the importance, and need, for
this specific research to be performed. The research process was
the formal approach followed to conduct structured research in this study.
Topics discussed in the research design included the research pr
the design of the study. Chapter two to Chapter four
literature review for this study. According to Blumberg et al. (2008:106
“To establish the context of a problem by referencing to previous work done on the
topic at hand, to understand the structure of the problem, and to rationalise the
significance of the problem and the study presented.”
MAXIMISE FIRM VALUE
FINANCING DECISION
- Chapter three
Capital structure
DIVIDEND DECISION
- Chapter four
Dividend investing
ow these functions interact, and how they create the value
of managing dividend policy in line with market movements, are discussed in greater
the orientation of the study and its respective
. This chapter considered
importance, and need, for
discussed, which
followed to conduct structured research in this study.
the research problem, research
to Chapter four serve as the
. (2008:106-107) the
ng to previous work done on the
topic at hand, to understand the structure of the problem, and to rationalise the
DIVIDEND DECISION
Chapter four
Dividend investing
Stellenbosch University http://scholar.sun.ac.za

14 | P a g e
Thus, the literature review of this study establishes the role of the optimal capital
structure and how it potentially influence dividend pay-out and share value. As
discussed previously, the optimal capital structure consists of two sections that
involve the investment and financing decisions. Accordingly, Chapter two will review
the capital budget and investment decision and discuss key components of it.
Chapter three then considers the financing decision and the role that leverage can
play. How these financial functions influences the dividend decision and share
returns will be explained throughout the chapters, in order to establish the required
foundation for the role of the dividend decision and dividend-investing discussed in
Chapter four.
Chapter four encompasses the dividend decision and the potential role market
movements can play in dividend policy formulation. It provides for an accurate
definition of dividends and the dividend payment chronology before providing an
extended, in-depth background on dividend policy and the dividend decision. Trends
in dividend policies and theories are also identified. Understanding these tenets of
the dividend decision should provide for a holistic understanding of how DY can
affect share value, and more specifically how investors and firm management can
use dividend information to potentially enhance value.
Chapter five contains the research methodology of the study, which considers the
two DY portfolios and four groups constructed and evaluated. Specifically, how data
collection was performed in order to perform statistical analyses is also explained in
this chapter. Furthermore, the data analysis methods regarding descriptive and
inferential statistics are formally introduced which serve to provide for the data
findings portrayed in Chapter six.
All the relevant findings regarding the descriptive statistics and inferential statistical
analyses are examined in great depth in Chapter six, through the use of illustrative
figures and tables. Both statistically significant and insignificant results are
highlighted in order to establish the findings of the study and to provide possible
solutions to the research problem identified.
Stellenbosch University http://scholar.sun.ac.za

15 | P a g e
Finally, in Chapter seven several integral topics discussed in the study are
summarised and together with the results obtained from previous chapters ensure
that the entire study is rounded and concluded. Limitations to the study performed
are also specified and future research opportunities proposed. The next chapter
serves to introduce the capital budgeting decision, and reviews how it can influence
the dividend decision and share value.
Stellenbosch University http://scholar.sun.ac.za

16 | P a g e
Chapter 2 : CAPITAL BUDGETING
2.1 INTRODUCTION
In the previous chapter it was mentioned that the financial function consists of three
decisions. How these decisions interact and provide for the foundation of effective
dividend policy management is discussed in this chapter and Chapter three. This
chapter serves to identify the importance and role that the investment decision and
capital budgeting can have in the determination of current and future dividend
payments by a firm.
Capital budgeting is a multi-faceted activity. It includes searching for new and more
profitable investment opportunities, investigating possible consequences of such
investments if accepted, and performing economic analyses. These activities are
performed in order to determine the profit potential of each investment proposal, and
should be compared to the expected rate of return demanded by shareholders
(Bierman and Smidt, 2007:3). Naturally, due to the inherent uncertainty inextricably
involved in predicting the future, capital budgeting decisions need to be performed
with great care. This balance between investing for the future of the firm and
maintaining dividend payouts is discussed in this chapter.
The remainder of this chapter consists out of four sections. Firm value and how the
financial function, specifically the capital budgeting decision influence it is discussed
next. Afterwards, capital budgeting tenets are discussed, providing for a section on
the investment decision. In this third section various capital budgeting techniques
and the rationale for them are explained. Before the chapter is concluded some
evidence of how capital budgeting and the investment decision is made in practice is
elaborated upon. How these topics influence the dividend decision is addressed
throughout the chapter.
Stellenbosch University http://scholar.sun.ac.za

17 | P a g e
2.2 FIRM VALUE AND THE FINANCIAL FUNCTION
Lambrechts (1992:165) stated that the capital budget plays a key role in the future
capacity and earnings power of a firm, as it integrates the investment and financing
decisions. This importance can also be observed in how the capital budget
influences the dividend decision, since if there are no viable long-term investments
identified in the capital budget, more dividends would be expected by the
shareholders of the firm (Cleary, 1999). The marginal cost of capital (MCC) plays an
integral part in these interactions and ultimately in the determination of the dividend
pay-out policy.
It is accepted (according to Brealey et al., 2008:258; Clayman et al., 2008:128;
Bierman and Smidt, 2007:7; and Brigham and Daves, 2007:331) that the MCC is the
most appropriate cost-of-capital rate to use for the evaluation of these incremental
cash flows. The reason for this is that the MCC represents the marginal cost of using
one more unit of financing in the firm’s current capital structure, and therefore, also
represents the incremental costs associated with new investments (Clayman et al.,
2008:128). Brigham and Daves (2007:438) defined expected cash flow or
incremental cash flow, as the cash flow that is realised if, and only if, the project is
accepted. It is therefore good practice to use incremental cash flows and the MCC to
conduct feasibility analyses on investments. However, before the investment
decision and the MCC impacts on dividends are discussed more formally, it is first
necessary to discuss various capital budgeting tenets. A proper understanding of
these concepts will serve as an invaluable foundation when making decisions aimed
at increasing shareholders’ wealth.
In order to better reflect the value and importance of the capital budget on the
dividend decision, this chapter next discusses the process of creating an optimal
capital budget briefly, and reference is made to some challenges that might be
faced.
Stellenbosch University http://scholar.sun.ac.za

18 | P a g e
2.2.1 THE CAPITAL BUDGETING PROCESS
The goal of the capital budgeting process is to prevent costly mistakes, especially
when considering the long-term nature of capital investments. In most instances
these investments are made to ensure profitable returns to fund further investments
or to provide returns to shareholders in the forms of dividend payments. Naturally
capital budgeting is a dynamic and intricate function performed on a firm-specific
basis. Firms’ capital budgets should therefore vary over industries due to factors
such as the size of the firm’s management team, size of the organisation,
diversification of investments and other industry-specific factors, which are inimitable
to every individual firm (Verbeeten, 2006:109). Furthermore, a capital budget should
not be created from year to year from scratch, but should rather be an ongoing
concern. Mintzberg, Raisinghani, and Theoret (1976:248) created a four-stage model
to capital budgeting. This model is depicted in figure 2.1.
Figure 2.1: The capital budgeting process
Source: Mintzberg et al. (1976:248)
Since the first step is considered to be the most important in the capital budgeting
process, Mintzberg et al. (1976:248) assert that management must utilise all
departments of the organisation in generating ideas. Creativity at this stage is of the
utmost importance, as many of the ideas that are generated could potentially
increase shareholder wealth. The second stage, as per figure 2.1, involves gathering
information and forecasting the incremental cash flows of various projects proposed.
Stellenbosch University http://scholar.sun.ac.za

19 | P a g e
Furthermore, screening processes, discussed later in the investment analysis
section, are used in this stage so as to eliminate non-value adding projects as well
as projects that are inconsistent with the strategic direction of the firm.
Topics of interest in the selection stage include risk assessment, the extent of capital
rationing, and the use of cost of capital measures such as the MCC. This stage
involves the interaction between the investment and financing decisions more
formally, as this is where the capital is raised and allocated. Chapter three
elaborates upon this in greater detail when the literature is expanded to consider the
financial decision. Finally, stage four represents controlling estimation biases. Here
post-audits are used, which compare actual results to planned or predicted results.
Brigham and Daves (2007:417) state that the post-audit has three main purposes:
first, it can improve forecasts as managers can learn from their mistakes as past
biases are indicated and eliminated, and forecasting models are improved upon.
Secondly, it can improve operations by holding decision-makers responsible for the
decisions they make. Thirdly, the post-audit can seek to identify termination
opportunities. The need for the post-audit becomes clear as illustrated by the
numerous studies conducted to identify capital budgeting problems.
Bierman and Smidt (2007:64-65) present a series of studies showing that overly
optimistic forecasts are regarded as a serious problem by financial officers of
Fortune 500 corporations. Ross (1986:21) found that over 80% of the respondents in
his survey felt that revenue forecasts are typically overestimated. Also Statman and
Tyebjee (1985:28) state that managers are usually very optimistic in forecasts and
thus above-normal returns seem achievable. In order to resolve such problems in the
process of creating an optimal capital budget, a number of capital budgeting
principles should always be followed. The heuristic tendencies of South African
managers have been found to be similar to these studies, and are elaborated upon
later in the study. It is important to consider these tendencies when evaluating
investment decisions, especially how the dividend policy is impacted when managers
attempt to maximise shareholder wealth by implementing capital budgeting.
Again, it must be emphasised that only when an optimal capital budget is used a
dividend policy’s influence on firm value and shareholder wealth can be truly
Stellenbosch University http://scholar.sun.ac.za

understood. This is simply because firms need to understand their growth, as well as
shareholder requirements, in order to ensure sustainable profitability. The next
section briefly identifies which principles have been proposed to implement an
optimal budget. The section serves furthermore as a summary of concepts identified
already such as incremental cash flows and the MCC.
2.2.2 CAPITAL BUDGETING
According to Clayman et al.
principles. These principles serve as a foundation of the investment decision, and if
utilised properly can result in more realistic projections
principles are indicated below in
Figure 2.2: Capital budgeting principles
Source: Clayman et al. (2008
The first principle states that
accounting income. As identified in the previous section
consider is the incremental cash flow
special considerations need to be
cash flows to prevent problems in the project analysis stage
opportunity cost, the effect of externalities and the effect of non
flows (Clayman et al., 2008
Principle 1: DECISIONSCASH
Principle 2: CASHTIME
Principle 3: CASH
Principle 4: THE
FINANCING
20 | P a g e
understood. This is simply because firms need to understand their growth, as well as
shareholder requirements, in order to ensure sustainable profitability. The next
section briefly identifies which principles have been proposed to implement an
optimal budget. The section serves furthermore as a summary of concepts identified
as incremental cash flows and the MCC.
BUDGETING PRINCIPLES
et al. (2008:50) optimal capital budgeting involves four crucial
These principles serve as a foundation of the investment decision, and if
properly can result in more realistic projections of risks and reward
re indicated below in figure 2.2, and discussed accordingly.
: Capital budgeting principles
(2008:50)
The first principle states that decisions must be based on cash flows
As identified in the previous section, the relevant cash flow to
consider is the incremental cash flow. Although not discussed in
special considerations need to be taken into account when analysing incremental
cash flows to prevent problems in the project analysis stage. They are s
effect of externalities and the effect of non-conventi
, 2008:9).
DECISIONS ARE BASED ON INCREMENTALCASH FLOWS
CASH FLOW MUST INCORPORATETIME VALUE OF MONEY
CASH FLOW MUST BE AFTER-TAX
DISCOUNT RATE MUST REFLECT
FINANCING COST AND PROJECT RISK
understood. This is simply because firms need to understand their growth, as well as
shareholder requirements, in order to ensure sustainable profitability. The next
section briefly identifies which principles have been proposed to implement an
optimal budget. The section serves furthermore as a summary of concepts identified
capital budgeting involves four crucial
These principles serve as a foundation of the investment decision, and if
of risks and rewards. These
, and discussed accordingly.
based on cash flows, as opposed to
, the relevant cash flow to
. Although not discussed in this study, four
account when analysing incremental
. They are sunk costs,
conventional cash
INCREMENTAL
REFLECT
RISK
Stellenbosch University http://scholar.sun.ac.za

21 | P a g e
The second principle of the investment decision states that by identifying the exact
times where cash flows occurs, the value of money can be fully appreciated, since
earlier cash flows contribute greater value to projects than later cash flows. This
principle is also particularly relevant to the dividend decision in terms of preferences
exhibited by shareholders for the timing of dividend payments. Some investors might
prefer a cash dividend, while others prefer a capital dividend in the form of share
appreciation. Another important principle is that cash flows should be analysed on an
after-tax basis. This is because of the fact that the tax revenue is not a benefit to the
firm itself, but the governmental authority. These last two principles are, however,
discussed in Chapter four, where it will be illustrated how they can have significant
effects on the dividend decision.
Finally, the fourth principle identified by Clayman et al. (2008) state that financing
costs must also be considered when determining the required rate of return needed
to compensate for a project’s risk. Financing costs are included in the discount rate
simply to prevent double counting of costs. As indicated, this discount rate is the
MCC and is used in determining the net present value (NPV) of projects as well as in
the dividend decision. The investment analysis section will reflect that if the firm’s
rate of return does not exceed the MCC, the proposed investment should not be
undertaken. In these cases the cash should rather be paid to shareholders in the
form of a dividend or possibly retained as internal reserves.
Unfortunately, even if these principles are followed and applied stringently, some
challenges still do arise in the incremental cash flow analysis when projects interact.
Clayman et al. (2008:51) identify the following interactions of cash flows that
complicate the capital budgeting process: independent versus mutually exclusive
projects; project sequencing; and unlimited funds versus capital rationing.
As indicated by Brigham and Daves (2007:339), independent projects do not
compete for the same resources, whereas mutually exclusive projects do. This can
become a complex problem when mutually exclusive projects look attractive but only
one can be selected. Project sequencing can, however, be utilised to address this
problem arising from mutually exclusive projects. Unfortunately, it can also create an
Stellenbosch University http://scholar.sun.ac.za

22 | P a g e
unwanted interaction between projects since funds that are predetermined for
implementation have been known to create capital rationing in some severe cases.
Capital rationing occurs when management places a constraint on the size of the
firm’s capital budget during a particular period (Brigham and Daves, 2007:423). This
practice goes against conventional finance theory, where it is believed that all value-
adding projects should be accepted. In the competitive economy, however, it occurs
seldom that managers have unlimited funds and for this reason the practice of
capital rationing is quite common especially during bear markets (Brealey et al.,
2008:131). The occurrence of capital rationing can have severe effects on the
dividend decision. Since the firm might not be capable of distributing dividends at the
time of rationing, it could possibly affect share values through the dividend pay-out
policy of the firm. Consider for example if a firm implements more debt financing to
its capital structure as a measure of rationing. This would result in less equity being
used and therefore shareholders will have less influence on the dividend pay-out
policy. According to Brigham and Daves (2007:423), a factor influencing capital
rationing is controlling estimation biases.
Controlling estimation bias is performed to limit overconfident and overly optimistic
managers when they perform cash flow estimations. This is prevalent in the studies
by Statman and Tyebjee (1985:28), Bierman and Smidt (2007:64-65), and Ross
(1986:21). Firms have been found to counter over-optimistic biases by increasing the
cost of capital and thus making the perceived risks greater than what they are in
reality (Brealey et al., 2008:270-271). This is known as adding fudge factors to the
cost of capital and many studies, as indicated above, indicate that adding fudge
factors to the hurdle rate has been proven to critically affect the appeal of projects.
This is because it penalises longer-lived projects by favouring quick-payback
projects. Accordingly, from a dividend policy perspective, this practice might result in
favourable dividend payments in the short-term, but not necessarily sustainable in
nature. Another method to control biases is to limit the capital budgets of managers
who have proven a tendency to over-eagerness. These two methods are in reality
not as effective as they seem in theory (Mukherjee and Henderson, 1987). Managers
quickly learn how to counteract them and again increase their own estimates, which
may have been biased upward to begin with (Brigham and Daves, 2007:423). This is
Stellenbosch University http://scholar.sun.ac.za

23 | P a g e
where the before-mentioned post-audit plays such a crucial role, as it can link the
accuracy of forecasts to the compensation that the managers apply.
As mentioned earlier, the investment decision incorporates the capital budgeting
process and principles in order to identify which projects are worthy of investment. It
serves a valuable function in the screening of proposed projects and maximising
shareholder value (Hirshleifer, 1958). The next section of this chapter provides an
overview of various investment analysis techniques and the interaction between the
MCC and return on investment, which allows for the role of the dividend decision.
2.3 THE INVESTMENT DECISION
“The result of the investment decision is measured by the improvement in the cash
flow and eventually in the market price of the ordinary shares. In this manner, the
attempt to satisfy the primary objective of the financial management function, to
maximise shareholder wealth is also served” (Lambrechts, 1992:65).
In this chapter reference was made to the MCC as the most appropriate hurdle rate
to use in the investment decision. The following topic of discussion elaborates on this
rate by considering the factors that influence it, its role in creating the optimal capital
budget, and the effect it has on the investment and dividend decision.
2.3.1 THE HURDLE RATE
As mentioned previously, the hurdle rate or MCC can potentially play an important
role in the determination of dividend payments and investment decisions. It is
generally accepted that when the return on additional investments is greater than
what shareholders could generate on their own, a firm should reinvest cash flow
rather than paying a dividend. Figure 2.3 depicts this theory by indicating an
hypothetical relationship between MCC and the investment opportunity schedule
(IOS).
Stellenbosch University http://scholar.sun.ac.za

24 | P a g e
Figure 2.3: Optimal investment decision
Source: Researcher’s own construction
“The MCC increases as additional capital is raised, whereas returns to a firm’s
investment opportunities are generally believed to decrease as the firm makes
additional investment, greater than the optimal” (Courtios et al., 2008:42).
The figure thus illustrates that an optimal capital budget occurs where the MCC
intersects the IOS of the capital budget. Firms finding themselves on the left side of
this intersection are under-invested and should invest in those projects identified in
the IOS. This is because the rate of return is greater than the MCC at that stage, and
wealth is not being maximised. In this scenario investors would expect to receive
fewer dividends since the funds would be better utilised to enabling long-term growth
and profitability. Firms that fall to the right of this intersection, however, are over-
invested and should instead pay out dividends to shareholders.
The MCC represents the rate associated with using one more unit of a financing
source to fund investments. However, even though the MCC is accepted as the
hurdle rate, the exact method of calculating it is not perfect. One method to calculate
the MCC that is used extensively by firms is known as the weighted-average cost of
capital (WACC) method. The WACC is usually estimated as follows:
Rate of
return IRR
MCC
Amount of new capital
Optimal capital budget
Stellenbosch University http://scholar.sun.ac.za

25 | P a g e
���� � �� ���1 � �� � �� ��
Where:
D = represents the optimal target weight of outstanding debt;
E = represents the optimal target weight of shareholders equity;
r = represents the cost of capital when using debt and equity;
V = total firm value = (D + E);
From this method the WACC is defined as the average rate of return required by a
firm’s capital providers, such as debt, equity, retained earnings and mezzanine
securities (Brealey et al., 2008:258). The reason why firms use an optimal target
weight for these capital components stems from the principle of maximising
shareholders’ wealth. Another measure that is sometimes used to quantify capital
structure is market values but the volatile nature of such values makes accurate
forecasts very troublesome. When managers are able to identify what the optimal
weights are, they can adjust the capital structure accordingly. This is discussed
further in Chapter three. As can be seen in the WACC equation, all the capital
components of a firm are analysed to calculate their component costs. Unfortunately,
these component costs are not always easy to calculate and thus the optimal capital
budget cannot always be used since its exact level is difficult to find (Correia et al.,
2007:7-24; Pocock, Correia, and Wormald, 1991:28).
It has been found that many business managers tend to under-invest in order to be
conservative (Harris and Raviv, 1996:1139). These authors cited Porter (1992:14),
which stated that U.S. firms have in the past used hurdle rates that were higher than
the estimated MCC to evaluate investment projects. Accordingly Correira et al.
(2007:8-3) state that the balance between over- and under-investment is very difficult
to strike, and the consequences of each can be severe. This is especially the case
when maximising share values since managers need to compare the benefit of
making further capital investments to meet future demand, or rather distribute
dividends to shareholders in the short term. Over-investment can lead to higher
capital costs and reduced flexibility (as indicated by Brigham and Daves (2007:397)).
Under-investment, however, may result in the firm losing market share due to not
having sufficient capacity to meet the demand (Correira et al., 2007:8-3).
Stellenbosch University http://scholar.sun.ac.za

26 | P a g e
The use of the MCC is, however, not only complicated by the estimation processes
followed, but also in the manner it is affected by other variables. Table 2.1 attempts
to illustrate some of these, by indicating over which variables a firm’s management
does have a degree of control and over which variables it does not. The latter is
explained first.
Table 2.1: Factors that affect the MCC
FACTORS THE FIRM CANNOT CONTROL FACTORS THE FIRM CAN CONTROL
Level of interest rates Investment policy
Market risk premium Capital structure policy
Tax rates Dividend policy
Source: Brigham and Daves (2007:335)
According to Brigham and Daves (2007:335), when interest rates increase in an
economy the MCC usually also increases, since firms have to pay higher interest
rates to new bondholders to obtain debt financing. Correia et al. (2007:7-20) define
the market risk premium as the amount of return necessary to compensate investors
for the increased risk of investing their funds in the firm. They state that it can be
measured by simply deducting the risk-free rate of a market from the cost of equity
for ordinary shares. Correia et al. (2007:7-20) further state that an increase in the
market risk premium results in an increase in the MCC. The final factor which the
firm cannot control is taxation. The effect of taxation depends on a wide variety of
factors, including, but not limited to, the current tax rate, the market preferences
between debt and equity, and investor preference between DY and capital gains. A
full explanation is provided in Chapter four in order to achieve a better
conceptualisation of the effect of tax on the dividend policy of a firm.
When the factors that a firm does have control over are identified, the financial
structure is highlighted yet again. According to Brigham and Daves (2007:335) the
investment policy affects the MCC to the degree to which project risks differ from the
firm’s risk profile in general. They state that if a firm invests in similar risk-profile
projects as its existing assets, the effects can be small, but if the investment policy
Stellenbosch University http://scholar.sun.ac.za

27 | P a g e
changes drastically the effect might be larger. The authors state that the capital
structure policy affects the MCC through the manner in which projects are funded.
Furthermore, the capital structure also determines the weighting of the capital
components used to finance investments. If a firm has a greater weighting of equity
in the capital structure, the shareholders have greater influence and would expect
the dividend pay-out policy to be scrutinised carefully. The balance between these
capital components has always been a controversial topic. This will be discussed in
Chapter three, which explains the role of the financing decision in the financial
structure. Finally, dividend policies can affect the MCC by means of the magnitude of
dividend payments, frequency of issuing dividends, and pay-out policy among
others. This is because the amount of dividends that are not paid out in cash forms
part of retained earnings in a firm. These retained earnings then serve as internal
financing and can then be used to re-invest in the firm in order to increase value (as
will be illustrated in the financing section later). If dividends do increase, it can lead
to a change in the cost of equity, which will ultimately affect the MCC as well, and
result in less retained earnings available for internal financing.
Considering the broad range of influencing variables on the MCC, it becomes clear
how optimal capital budgets are difficult to apply. Not only must managers follow
stringent capital budgeting principles and understand how the financial function is
inter-connected to maximise shareholder value, they must also be able to identify the
correct level of the MCC and accurately identify investment opportunities. These
investment opportunities should, furthermore, generate returns greater than the
shareholders’ required rate of return and the firm’s MCC. According to Brealey et al.
(2008:258) in a perfect market, and assuming that investment opportunities have the
same risk profiles as the firm’s existing assets, these two hurdle rates used for
deciding on investments by shareholders and the firm would be identical. Stated
differently when a proposed project has the same perceived risk as the firm’s
perceived risk of all its assets, the firm’s MCC will be the same as the shareholders’
required rate of return. Unfortunately, the markets are not perfect and this causes
distortions in actual hurdle rates and what they are perceived to be, which allows for
biased expectations (Miller and Rock, 1985:1031).
Stellenbosch University http://scholar.sun.ac.za

28 | P a g e
In order to prevent such expectations and to protect the shareholders, managers
must perform steadfast investment analysis. The investment analysis section
discussed next attempts to explain how this can be done by using various capital
budgeting techniques that incorporate all the capital budgeting principles mentioned
previously.
2.3.2 INVESTMENT ANALYSIS TECHNIQUES
The previous sections have identified the need for effective capital budgeting
principles and the critical components that should be managed in order to create an
optimal capital budget. More specifically, the need for the MCC and incremental cash
flows were highlighted. These two components allow for the maximisation of
shareholders’ wealth when using appropriate investment analysis techniques. These
techniques represent the investment decision and incorporate screening and
selection criteria of potential investments that could enhance firm value.
The next two topics of discussion provides for a summary of basic capital budgeting
techniques and more modern approaches used in business practice. These
techniques influence the valuation of ordinary shares, and therefore should be used
to compare the benefit of enabling future growth through investments or growth
through shareholders preferences to dividend payments.
2.3.2.1 Capital budgeting techniques
Basic techniques represent the NPV, internal rate of return (IRR), payback period
(PP), discounted payback period (DPP), accounting rate of return (ARR) and the
profitability index (PI) techniques (Stow, Robinson, Pinto, and McLeavey, 2007).
The NPV technique incorporates the time value of money as it is the present value of
the future after-tax cash flows minus the investment outlay. The decision rule for the
NPV technique states that projects with positive NPVs should be accepted as it
increase firm value and shareholders’ wealth, and negative NPV projects should be
discarded as it will decrease shareholders’ wealth (Clayman et al., 2008:54). Brealey
Stellenbosch University http://scholar.sun.ac.za
29 | P a g e
et al. (2008:118) posits that the money invested today is worth more than the same
amount invested tomorrow due to the time value of money. Naturally, from the
perspective of dividend policy, it can be argued that if a firm cannot generate a return
on investments greater than the expected return required by shareholders, the
investors should be enabled to invest for themselves.
Another well-known capital budgeting technique that is very similar to the NPV
technique is the IRR. The IRR is one of the most frequently used concepts in capital
budgeting and security analysis (Clayman et al., 2008:55). It is defined as the rate
that would ensure that the NPV of a project is equal to zero (Brealey et al.,
2008:121). The IRR is determined after incorporating timing and size of cash flows,
where the MCC is determined by the firm-specific characteristics such as risk and
capital structure. Again, as can be seen in figure 2.1, these two rates are compared
in the investment decision in order to determine if the project would add benefit
through investing or if distributing dividends would better contribute to the creation of
shareholders’ wealth. The decision rule for the IRR is to invest in a project if the IRR
exceeds the required rate of return, or MCC for a project (Clayman et al., 2008:56).
Finally, other basic investment analysis techniques used to analyse proposed
investment viability are the PP, DPP, ARR, and the PI. These measures are referred
to as rule of thumb techniques as they are easy to follow and understand.
Unfortunately they all have severe limitations when used in the investment decision if
used alone and accordingly it is recommended that they should accompanied by
NPV, IRR, or more modern techniques. Ryan and Ryan (2002:3) quote Pike
(1996:82), Schall, Sundem, and Geijsbeek (1978:287), and Miller (1960:76), who
identify PP as the most preferred technique at the time, whilst Istvan (1961:45) found
preference for the ARR. According to these studies DCF techniques were not
popular and not used by most survey respondents. Mao (1970:359) and Schall et al.
(1978:286) specifically indicate that DCF was the least popular method at the time.
Later studies performed by Pike (1996:83) and Jog and Srivastava (1995:38)
indicate decreased acceptance for the ARR.
Preferences for non-DCF methods, which mostly cannot provide economical
decision rules, have always been seen as a puzzle by academics. Thus, many
Stellenbosch University http://scholar.sun.ac.za

30 | P a g e
academics such as Brounen, De Jong, and Koedijk (2004), Graham and Harvey
(2002), and Ryan and Ryan (2002) re-examined these findings to identify if this
puzzle has changed. They found that modern management now utilise NPV and IRR
more frequently and it is also found to be superior to previous non-DCF methods.
Furthermore, global trends seem to indicate that modern techniques incorporating
the DCF analysis techniques are definitely becoming more evident (Ryan and Ryan,
2002:13). They state that the increased computational power available to managers
in the modern technological era has created a greater following of more
sophisticated capital budgeting methods and DCF techniques. Even though the NPV
is considered the most conservative and realistic technique to use, Graham and
Harvey (2002:3) state that NPV has always trailed IRR in popularity.
From these studies it can be seen that there still exists great controversy over which
method is used the most, and provides for the most accurate estimates. Global
trends do, however, indicate that the NPV technique has been growing in popularity
and that other methods such as the ARR has been decreasing in popularity and
made way for EVA and real-option analysis. Accordingly, the role of modern
techniques has become more evident. Verbeeten (2006:107) quotes a study
performed by Chatterjee, Wiseman, Fiegenbaum, and Devers (2003), which suggest
that modern, more sophisticated capital budgeting practices must be considered in a
wider context than merely assisting the traditional DCF analyses of the IRR and
NPV. By improving the decision-making process, modern techniques also increase
managers’ ability to increase shareholders’ value. The next section of this chapter
provides for a brief overview of modern analyses.
2.3.2.2 Modern capital budgeting techniques
Verbeeten’s (2006:107) empirical results indicate that sophisticated techniques
appear to augment rather than replace the traditional capital budgeting techniques
indicated earlier. These sophisticated techniques include the use of economic value
added (EVA), market value added (MVA), real option analysis and risk analysis
techniques such as sensitivity analysis, scenario analysis, and simulation analysis.
EVA has been used increasingly over the past decades to measure firm
performance in terms of maximising wealth or, more specifically, managers’
Stellenbosch University http://scholar.sun.ac.za
31 | P a g e
performance through MVA (Correia et al., 2007:8-16). Recently it has, however, also
been implemented in capital budgeting decisions as EVA has a close connotation to
NPV (Clayman et al., 2008:105). EVA is defined by Correia et al. (2007:8-15) as the
economic profit for a period. MVA is closely related to EVA as it also calculates the
value added with the only difference being that it is calculated from a specific point of
time onwards. According to the MVA theory, if a firm’s return on capital (ROC) is
greater than its WACC, it has added value to shareholders (Correia et al., 2007:8-
15). This is equivalent to a positive NPV. Accordingly, a ROC which is less than
WACC will result in a loss of value, similar to a negative NPV. Shareholders
frequently use the components of EVA in decision-making since it can be analysed
with ease due to its accounting data nature (Correia et al., 2007:8-16). From a
managerial perspective, in order to increase EVA they have to either increase ROC,
reduce invested capital, or decrease the firm’s cost of capital.
Another modern approach to capital budgeting investment decision-making is the
use of real-option analysis. Brealey et al. (2008:283) state that “the value of real-
option analysis is due to the fact that the projects can, and often do lose their
economic value due to changes in competitive market forces.” Real options refer to
budgeting options that allow managers to make decisions in the future, and thereby
alter the original NPV of a project, as more flexibility is granted to the option holder
(Clayman et al., 2008:95; Amran and Kulatilaka, 1999; Trigeorgis, 1986). In this
sense, should a firm decide on an investment and due to adverse market conditions
find that it will not be profitable, they can terminate it and rather consider a dividend
distribution to shareholders. This technique of investment analysis was usually used
for projects where the uncertainty of the cash flows involved made it very difficult to
apply the DCF techniques (Brown and Eisenhardt, 1995:343). Studies, however,
indicate that the use of such real options in the investment decision has been
growing rapidly, even for projects whose risks can be determined with a relative
degree of certainty (Verbeeten, 2006:110). The importance of such options can also
be seen in studies such as Myers (1987), Trigeorgis and Mason (1987), Mason and
Merton (1985), and Kester (1984) amongst others, who suggest the use of option-
based techniques to value the managerial flexibility implicit in investment
opportunities.
Stellenbosch University http://scholar.sun.ac.za

32 | P a g e
In South Africa, many studies have attempted to identify the most favourable capital
budgeting method. Correia et al. (2007:9-29) indicate that the global trend regarding
the increased use of DCF techniques is similar in South Africa. This can be seen in
studies performed by Gilbert (2003:13), Parry and Firer (1990:52), and Andrews and
Butler (1986:33). The puzzle regarding the use of PP is also present in South Africa.
Coltman (1995) identified the PP as the most commonly used technique in the
1990s, followed by the IRR, NPV, and ARR. This might, however, have been the
result of a majority of smaller firms in the author’s samples. Smaller firms tend to use
rule-of-thumb capital budgeting methods in order to identify projects (Tyrrall, 1998).
To determine if this were in fact the case, Gilbert (2003) performed a study on
manufacturing firms in South Africa between 1997 and 2003, with differing levels of
annual sales. His results indicated similar findings to Coltman (1995), since PP was
still at the top of the list. Gilbert’s (2003:14) study did, however, indicate greater
acceptance of NPV in relation to the IRR method.
The question of which of the NPV and IRR techniques are used the most, however,
is still not resolved as some studies indicate mixed results. Andrews and Butler
(1986:33) and Parry and Firer (1990:56) found that respondents to their surveys
used the IRR over NPV, and increasingly from the period of 1971 to 1982 as its use
grew from 27% to 45.3%. Studies performed by Coltman (1995) indicate a
preference for NPV over IRR as well. A more recent study performed by Du Toit and
Pienaar (2005:23) indicate equal usage between IRR and NPV, with PP this time in
the last place. According to the authors, however, IRR was still preferred as the
primary capital budgeting method with 37.1% of the firms using it, compared to the
27.4% who used NPV as the primary technique. Unsurprisingly, studies indicate the
common principle that the varieties of capital budgeting techniques complement one
another (Chenhall and Langsfield-Smith, 1998:18).
An important consideration is that when investors and firms apply such investment
analysis techniques, the goal of maximising shareholder value must be maintained.
This chapter has therefore indicated the trade-off between the MCC and IOS, as well
as explained how the investment decision and dividend decision interacts. The next
section of this chapter serves to conclude this discussion.
Stellenbosch University http://scholar.sun.ac.za

33 | P a g e
2.4 CONCLUSION
As has been stated throughout this chapter, there are many interactions between the
components of the financial function, defined as the investment, financing and
dividend decisions. Up to this point, this chapter has focused on which investments
should be accepted and how the analysis is performed to identify those projects that
add to shareholders’ wealth. If prudent financial analysis is not performed when
deciding on investable opportunities the dividend decision might be made on biased
information. Furthermore, how the capital budget influences the dividend decision
was also explained, since if there are no viable long-term investments identified in
the capital budget, more dividends would be expected by the shareholders of the
firm.
In order to fully explain the role of the optimal financial structure, which balances the
investment, financing, and dividend decisions, the capital structure needs to be
discussed. Thus, the study now turns to the role of the capital structure and how the
accepted investments are financed in order to further maximise shareholders’ value.
A firm’s capital structure refers to the type, and degree of capital components to
finance its investments. Detailed financing components and their specific
characteristics are not elaborated upon, but their effect on dividend policy and share
prices is rather explained.
Therefore, the goal of Chapter three is to indicate the effect leverage can have on
firm value and how an optimal capital structure affects dividends. The potential
influence market movements might have on leverage is also investigated.
Stellenbosch University http://scholar.sun.ac.za
34 | P a g e
Chapter 3 : CAPITAL STRUCTURE
3.1 INTRODUCTION
“The ultimate goal of the financing, or capital structure decision, is to determine the
degree of financial leverage in the capital structure that maximises the value of the
firm by minimising the MCC” (Clayman et al., 2009:121).
The term “leverage” is used in this study to describe the proportion of fixed-obligation
financial component costs present in a firm’s capital structure, where fixed costs
refer to the interest component of financing such as bonds, preference shares and
debentures. Leverage could have a profound effect on the MCC of a firm and
ultimately the value of its shares. This is because the MCC is often calculated by
using the WACC method, which is directly influenced by all the capital components.
Recall that in the previous chapter the equation for WACC was provided, and how
the MCC and IOS interact also depicted. An improper balance between the capital
components can create increased risk, which in turn increases the MCC and
decreases firm value. From a dividend pay-out perspective, shareholders would
expect to be compensated for the increased risk and increase their minimum
expected rate of return (De Haan, 1996). The effect of such an increase, as indicated
in the previous chapter, can be significant.
Before the effect of leverage on the MCC is discussed further, it is necessary to
identify how a firm’s capital structure can affect the dividend policy or share price of a
firm. Following this section, traditional capital structure theories are identified.
Modern approaches that incorporate the basic underlying principles next provide
further explanation on how firm value is influenced by the use of leverage. Finally,
the chapter is then concluded with a discussion of important topics addressed in the
capital structure and how it influence the dividend decision of a firm.
Stellenbosch University http://scholar.sun.ac.za
35 | P a g e
3.2 CAPITAL STRUCTURE AND THE DIVIDEND DECISION
By following a predetermined dividend pay-out policy a firms needs to be very
cognisant of the extent of equity financing it utilises in its financial structure. This
importance can be observed in the significant demand shareholders can have to be
compensated for any change in a firm’s risk profile of its debt to equity ratios. Two
important characteristics need to be considered in the interaction of the capital
structure and the dividend decision.
Firstly, when equity is used in the capital structure of a firm, the demand for
dividends may arise. For this reason, greater equity financing will usually lead to the
dividend decisions being of greater importance, and topics such as investors’
preferences between DYs and capital gains become relevant. Secondly, the dividend
field of study was initiated due to the influential work done by Lintner (1962; 1956),
Gordon (1963) and Modigliani and Miller (1963; 1961; and 1958). These academics
played a significant part in formulating the traditional capital structure theories. In
these authors proposed and argued over the dividend irrelevance theorem, which at
the time created great controversy and caused many academics to study the impact
of dividends more meticulously. From their later studies, many of the modern capital
structure theories have been found to have a direct relationship to the dividend
decision, which is the topic of discussion in Chapter four.
This chapter discusses capital structure formally in order to better explain the
potential role dividend policy can have during market movements. Most of these
theories attempt to propose how shareholder value can be maximised by identifying
an optimal capital structure. The purpose, therefore, of the financial structure is to
find the right proportions of debt and equity financing to fund investments and
maintain shareholders’ expectations of return. The capital structure is thus of vital
importance during the decision-making process of the investment and dividend
decision (Clayman et al., 2009:130).
As stated previously, the theories relating to the importance of leverage as a
determinant of firm value partly originate from Modigliani and Miller (1958), who
Stellenbosch University http://scholar.sun.ac.za
36 | P a g e
stated their capital structure irrelevance proposition. Their infamous propositions
caused researchers during the past half century to study whether their assumptions
held, in order to identify whether firm value was, in fact, dependent on the capital
structure as previously believed (Stern and Chew, 2003:125). Stern and Chew
(2003:126) posit that researchers particularly focused on market imperfections such
as the proposed effect of taxation, transaction costs and the effect of signalling that
was present in the market. The results of the studies indicated that large costs were
associated in creating and maintaining capital structures. These costs are
categorised as indirect market costs, which include agency costs, cost of asymmetric
information, bankruptcy-related costs, and direct transaction-related costs such as
taxation costs and brokerage.
In order to explain how these costs affect firm value, the following section discusses
the traditional capital structure theories by focusing on the Modigliani and Miller
propositions. The section following then considers market-related costs and their
effect on the capital structure more formally. Chapter four build upon these traditional
and modern theories further by discussing how they affect dividend policy
formulation. Therefore, in this chapter the capital structure and its influence on the
dividend pay-out policy needs to be considered from a holistic view. Most investors
select shares based on key characteristics such as risk profile, DYs and the debt to
equity ratios. If the proportions between debt and equity changes all of the
mentioned characteristics will be affected to some extent.
3.3 TRADITIONAL CAPITAL STRUCTURE THEORIES
The effect of leverage on the capital structure has been a topic of discussion for the
last 60 years, ever since Modigliani and Miller published their propositions in 1958.
Modigliani and Miller’s (1958:268) proposition 1 states: “The market value of a firm is
not affected by its capital structure.” This proposition, known as the separation
theorem, originated from a set of strict assumptions that in the modern economy
would be difficult to apply (Brigham and Daves, 2007:550). Never the less, in the
above proposition, Modigliani and Miller (1958) proved that as long as their
Stellenbosch University http://scholar.sun.ac.za

37 | P a g e
assumptions held true, the value of an unlevered firm will equal the value of a
levered firm. Proposition 1 therefore posits that the capital structure of a firm is of no
relevance, since the value of a firm using 100% leverage should be equal to a firm
using 100% equity. Accordingly, the value of a firm is calculated as the value of debt
and equity combined. Modigliani and Miller (1958:269) also formulated a second
proposition in order to explain how the WACC or MCC could be calculated.
Proposition II states that:
“The cost of equity to a levered firm is equal to the cost of equity of an unlevered firm
in the same risk class plus a risk premium whose size depended on both the
difference between the unlevered cost of debt and equity and the amount of debt
used.”
With this proposition Modigliani and Miller (1958) argued that the total return
distributable to the providers of the firm’s capital will not be affected by a changing
risk level from the use of a specific capital source. They proved this assertion using
arbitrage principles and believed that increased leverage will only result in greater
risk that would have to be compensated for to the shareholders. To be compensated
for this increased risk a greater portion of the operating earnings are allocated to
them, which is exactly the same size as the amount of operating earnings taken
away from debt holders (Clayman et al., 2009:123). Thus, the one component simply
makes up for the other and the net effect is a zero change in the MCC.
In these propositions no reference was made to the influence of taxation, since it
was thought to have no bearing. Later studies, however, improved upon this shortfall
in theory. The methodology in the estimations of the WACC and its relation to the
cost of equity and debt is depicted according to Modigliani and Miller (1958) in figure
3.1.
Stellenbosch University http://scholar.sun.ac.za

38 | P a g e
Figure 3.1: Cost of capital with zero taxes
Source: Clayman et al. (2009:126)
From the figure it can be seen how the MCC is calculated as the WACC indicated in
the previous chapter but without considering the effect of taxation. Furthermore, it
can be seen that the cost of equity increases as the amount of debt, or leverage,
increases and that the cost of debt remains constant. Modigliani and Miller’s (1958)
WACC had important implications for management since it stated that management
could not simply change or cleverly manage the capital structure in order to affect
the value of the firm (Clayman et al., 2009:122).
As mentioned previously, Modigliani and Miller (1963:434) later improved on the first
proposition when they incorporated corporate taxes, yet keeping all previous
assumptions constant. With this second paper they stated that with corporate taxes
the use of leverage will increase the value of the firm. This is due to the added tax
benefit, or tax shield, that is created when using debt financing due to the interest-
payable characteristic of debt that is tax-deductible. Accordingly, a leveraged firm’s
value was now the sum of the value of an identical risk class unleveraged firm plus a
tax shield as seen in the equation below:
�� � �� � ��
Cost of equity capital
Cost of debt capital
WACC
Debt to equity
Cost of capital
Stellenbosch University http://scholar.sun.ac.za

39 | P a g e
�� in this equation represents the tax shield debt financing provides, which is a
significant component in the capital structure theories discussed in this chapter. In
most countries interest is tax-deductible, whereas dividends are not. Contributing
even more to this benefit that debt receives is that in some countries a double
taxation principle is imposed on dividends. This is because firms who pay out
dividends to shareholders have to pay a dividend withholding tax (DWT) on behalf of
their shareholders, and then the shareholders are taxed on their personal assets as
well, which include the dividends received. In South Africa however, things were a
quite different up to April 2012, since dividends were taxed with a secondary tax on
companies (STC), instead of a withholding tax. Dividends in the hands of the South
African shareholders were then exempt from income tax according to Section 10
(1)(k)(i) of the South African tax legislation 2010 (SAICA, 2010). Considering this
double taxation effect and the relevance of dividends, a popular theory, the clientele
theory in dividend policy, has been proven to some extent in the international arena
(Pettit 1977:420). This theory in relation to the implementation of a DWT is discussed
in greater detail in Chapter four, especially its effect on South African firms.
Again it is possible to see the influence of the use of leverage on the dividend
decision as taxes impose multiple facets in the determination of a firm’s capital
structure. Modigliani and Miller (1963) stated that since the cost of equity does not
share in such tax benefit that the cost of equity is a linear function of the firm’s debt
to equity ratio. More specifically they believed that the effect of the increased use of
debt would be directly offset by the change in the cost of equity resulting in the same
risk profile for the firm, but which now had a benefit due to taxation. Thus, the MCC
of the firm will decrease as more debt is used. The estimation of WACC under
Modigliani and Miller (1963) after incorporating the effect of taxation is indicated in
figure 3.2.
Stellenbosch University http://scholar.sun.ac.za

40 | P a g e
Figure 3.2: Cost of capital if there are taxes
Source: Clayman et al. (2009:126)
From figure 3.2 it can be seen that firms should use 100% debt financing. Naturally,
using 100% debt financing would result in no dividend decision at all since zero
equity financing would be used. In practice, however, these assumptions do not
seem to hold true. Accordingly, the results of the Modigliani and Miller studies forced
sceptics to identify which of their assumptions could be rejected or modified (Stiglitz,
1988:122). Studies have consequently identified errors with some assumptions as
costs came to light that challenged them, and therefore modern theories that
incorporate the other direct and indirect costs into the capital structure decision were
formulated.
These specific market-related costs are discussed in the next section. Firstly, agency
costs are considered and the implications of controlling measures on dividends
explained. Secondly, bankruptcy-related costs and the static trade-off theory are
explained. Finally, the cost of asymmetric information and the pecking-order
hypothesis are discussed. These modern theories provide for a possible explanation
why firms have predetermined dividend pay-out policies. Furthermore, by
understanding the rational for these theories investors can potentially make informed
decisions when they apply dividend-investing strategies.
Cost of equity capital
WACC
Debt to equity
Cost of capital
Stellenbosch University http://scholar.sun.ac.za
41 | P a g e
3.4 MARKET IMPERFECTIONS AND CAPITAL STRUCTURE THEORY
The previous section introduced traditional capital structure theories propositioned by
Modigliani and Miller (1963; 1961; and 1958) which posits that only debt financing
should be used in a firm’s capital structure. Market related costs discussed in this
section, however, indicate that a firm can use equity capital to offer greater value to
shareholders (Hubbard, 1998). In the next section the topic of agency costs is
introduced which explains the interaction between providers of capital and firm
management. Following the discussion of agency costs, the trade-off and pecking
order hypothesis and their implications on the dividend decision is briefly discussed.
3.4.1 AGENCY COST AND PREVENTATIVE MEASURES
Agency costs arise from the market imperfection that not all parties in the market
have homogeneous expectations, and originate from the conflict of interests between
the owners and the management of a firm (Jensen and Meckling, 1976:305). The
owners, or the shareholders and debt holders of a firm, are referred to as the
principals, and the managers are known as the agents. Owners want their value
maximised, which requires the agents to perform accurate investment analysis and
then responsibly invest in value-added projects, whilst financing the projects in a
manner that does not destroy the expected benefit. Agents, however, could have
different goals, such as to increase their own wealth by investing in prerequisites and
unnecessarily expanding the size of the firm to ensure job safety (Jensen, 2010:33).
In order to keep the interest of management and capital owners in line, agency costs
can be incurred.
According to Harris and Raviv (1990:321) managers do not always behave in the
best interest of their investors and, therefore, need to be disciplined. They state that
leverage can be used to achieve this and minimise agency cost. Even when dividend
policy can be affected severely by using more leverage, it has been found that the
use of debt can restrict managers’ unwanted actions, since the use thereof deprives
Stellenbosch University http://scholar.sun.ac.za
42 | P a g e
the managers of the practice of spending on prerequisites (Firer et al., 2008:10; Lie,
2000). By restricting the reinvestment of earnings, however, managers need to
approach the suppliers of capital and thus the shareholders have more control over
the funding of new projects and they are provided with greater information on the
current operation of the firm (Harris and Raviv, 1990:322; Jensen, 1986:324). This
leads to greater involvement of shareholders, which can positively affect dividend
decisions, and lead to greater value projects (Jensen and Meckling, 1976:351).
Unfortunately, as stated before, there can also be conflicts of interest between the
owners of a firm.
A conflict of interest between principals is quite serious and occurs often when
capital structures are implemented or changed. Shareholders receive the residual
cash flows after bondholders have been paid. Shareholders also have no claims on
any assets, whereas debt holders do. This means that shareholders are more willing
to accept risks so that the value of their shares can increase, even if it is at the cost
of the debt holders’ welfare (Childs, Mauer, and Ott, 2005). If the risk profile is
rewarded in returns they also receive further compensation in the form of dividends.
Debt holders, on the other hand, want to preserve their claim on assets and increase
the security thereof (Damodaran, 2011:367).
According to Damodaran (2011:368) the conflict between debt holders and
shareholders can affect all three aspects of the financial function in corporate
finance. Firstly, in the investment decision risky investments can be selected by the
shareholders in order to increase firm value at greater risk. Secondly, during the
financing decision, new projects could be financed with a variety of sources that
again affect the risk faced by the parties involved. Finally, during the dividend
decision, if the firm chooses to pay dividends, it might be sacrificing potential value-
adding investments. As can be seen, if there is mismanagement in any of these
areas of corporate finance, a misalignment can be created between the shareholders
and management. Not only will greater risks to debt holders create greater interest
costs, but it can also result in more preventative measures being insisted upon by
the new debt holders in order to shift these additional risks. These preventative
measures include restrictions on managers’ actions by using covenants and
indentures, which then result in even more direct and indirect costs.
Stellenbosch University http://scholar.sun.ac.za

43 | P a g e
Restrictions placed on managers could result in them not being able to perform at
their optimum level. According to Bernanke (1989:11), by adding such restrictions
the shareholders are “putting a dagger on the steering wheel of a car.” The dagger
motivates the managers to drive more carefully, “but you may be stabbed if someone
drives into you.” Damodaran (2011:369) states that this reduction in managerial
flexibility can result in serious consequences for shareholders. This is supported by a
study performed by Graham and Harvey (2002:10) where financial flexibility was
identified as the most important factor that managers consider when making capital
budgeting and financing decisions. Damodaran (2011:369) identifies two possible
reasons for this. Firstly, the value of a firm may be maximised by keeping the option
to invest in projects that are not anticipated, but that add value. Also, the flexibility
allows managers more breathing space and power. However, as Graham and
Harvey (2002) warn, the reasons why firms never fully utilise debt may be based on
sound financial principles, but it may also serve as camouflage for managers
pursuing their own interests.
Ultimately, the best defence against agency costs is perceived to be proper
corporate governance (Gompers, Ishii, and Metrick, 2003:107). By implementing a
corporate governance programme, managers can be held responsible for wasteful
spending and unethical behaviour, which was found to be the case in the 2008 sub-
prime crisis when firms utilised excessive levels of leverage (Duchin, Ozbas and
Sensoy, 2010:418). Leverage needs to be in balance in order to reap the benefits,
but, as previously stated, when the management is too conservative, the firm could
forgo wealth, and when too eager, they might create financial distress.
In summary, when managers use too much leverage they tend to magnify the
outcome of earnings performance (Clayman et al., 2009:127). Correia et al.
(2007:18-2) state that if agency costs are managed, the shareholders will benefit
from the fact that management can raise financing at a cheaper rate. Harris and
Raviv (1990:323) state that the use of leverage can offer greater promised yields to
investors as earnings can be compounded during robust growth periods due to high
levels of leverage. Unfortunately, poor performance can lead to extreme losses,
which can place the management of firms in great financial distress. Managers can
then expect a variety of costs, such as possibly bankruptcy, because of this.
Stellenbosch University http://scholar.sun.ac.za
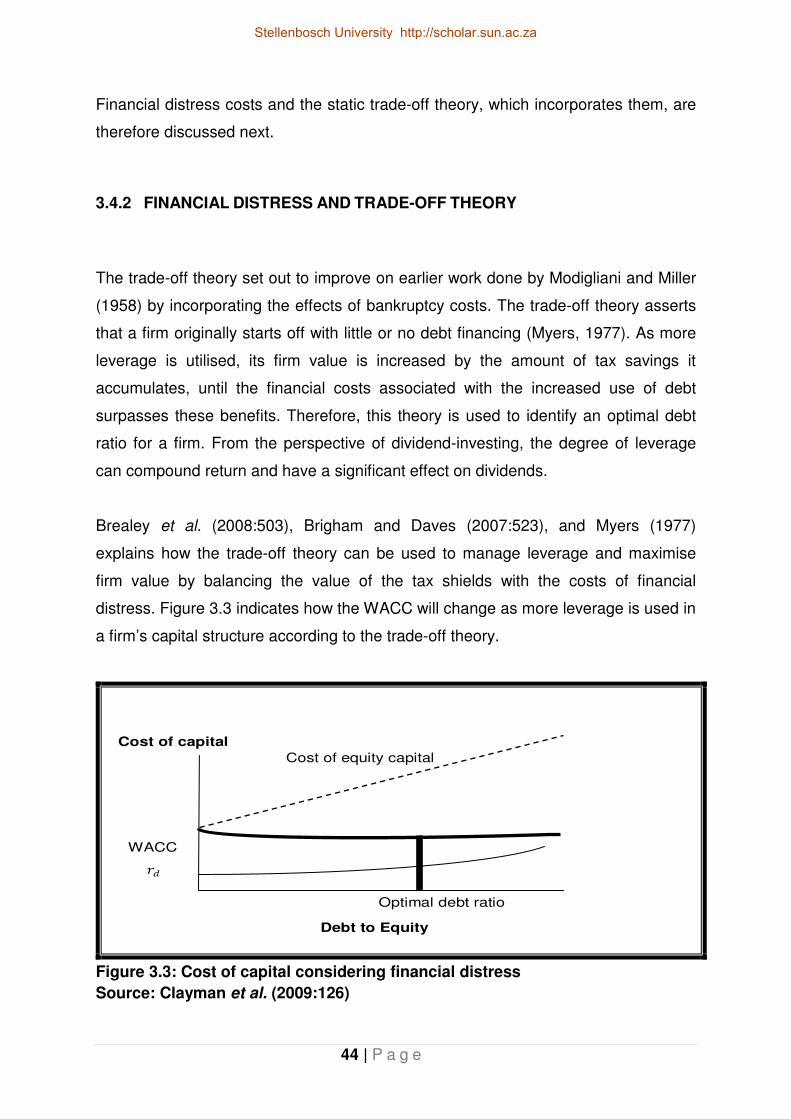
44 | P a g e
Financial distress costs and the static trade-off theory, which incorporates them, are
therefore discussed next.
3.4.2 FINANCIAL DISTRESS AND TRADE-OFF THEORY
The trade-off theory set out to improve on earlier work done by Modigliani and Miller
(1958) by incorporating the effects of bankruptcy costs. The trade-off theory asserts
that a firm originally starts off with little or no debt financing (Myers, 1977). As more
leverage is utilised, its firm value is increased by the amount of tax savings it
accumulates, until the financial costs associated with the increased use of debt
surpasses these benefits. Therefore, this theory is used to identify an optimal debt
ratio for a firm. From the perspective of dividend-investing, the degree of leverage
can compound return and have a significant effect on dividends.
Brealey et al. (2008:503), Brigham and Daves (2007:523), and Myers (1977)
explains how the trade-off theory can be used to manage leverage and maximise
firm value by balancing the value of the tax shields with the costs of financial
distress. Figure 3.3 indicates how the WACC will change as more leverage is used in
a firm’s capital structure according to the trade-off theory.
Figure 3.3: Cost of capital considering financial distress
Source: Clayman et al. (2009:126)
Cost of equity capital
WACC
Debt to Equity
Optimal debt ratio
Cost of capital
Stellenbosch University http://scholar.sun.ac.za

45 | P a g e
As can be seen from figure 3.3, a value-maximising firm would want to be on the top
of the curve where the two sides balance out and the optimum debt ratio can be
found. In comparing figure 3.2 with figure 3.3, the difference that bankruptcy-related
costs can have on firm value becomes clear. In figure 3.3 it can be seen how the
cost of debt increases due to increased risk associated with the use of leverage over
the target debt ratio, and how the WACC is ultimately adjusted upward due to the
threat of financial distress that materialises.
The probability of financial distress is an important component in the cost of the
distress. This probability is mostly a function of the leverage used by a firm and the
degree of marketability of their assets (Wruck, 1990; Altman, 1984). Generally, the
greater the leverage of a firm, the greater the risk will be, and the more marketable
the assets the less chance there is for financial distress (Weiss and Wruck,
1998:56). One must not forget, however, that the greater the risk, the greater the
potential reward of using leverage. This reward can be in the form of both capital
growth and dividend distributions to shareholders willing to accept such risks.
Andrade and Kaplan (1998:1443) studied 31 highly leveraged transactions that
became financially distressed and found that managers increased the value of their
firms by using leverage in the period of 1988 to 1996. Considering this possible
benefit, Graham (2002:1903) found that large firms at the time did not, however,
capitalise on potential interest tax shields, since firms could on average increase
their firm value by 7.5 % by leveraging up and still be considered to be conservative.
The trade-off theory has received mixed support for its proposition to enhance firm
value. For example, Brealey et al. (2008:516) quote studies performed by Graham
and Harvey (2001), Wald (1999), Fama and French (1998), and Mackie-Mason
(1990), which indicate that firms rarely make major shifts in their capital structure just
because of taxes, since it is inherently difficult to calculate the present value of
interest tax shields in a firm’s market value. Brealey et al. (2008:516) further state
that some highly profitable firms usually use very low levels of debt. Recent studies
by Leary and Roberts (2010), Fama and French (2005), and Frank and Goyal (2003)
suggest that equity issues can be more attractive than debt issues even for firms
with ample debt capacity.
Stellenbosch University http://scholar.sun.ac.za

46 | P a g e
However, studies performed by Shyam-Sunder and Myer (1999:220), Smith and
Watts (1992), Mackie-Mason (1990), Long and Malitz (1985), and even Modigliani
and Miller (1966) form part of the majority of academics who supports the trade-off
theory. Bradley, Jarrell, and Kim (1984:885) state for example that the debt ratio is
“negatively related with the volatility in annual operating earnings, as predicted by
the bankruptcy cost component of optimal capital structure trade-off.”
Contrasting the trade-off theory, which implies an optimal debt range, Majluf and
Myers (1984) introduce the pecking-order theory. This theory originates from the cost
borne from asymmetric information present in the market. Asymmetric information is
another violation of the Modigliani and Miller (1958) assumption of all parties
involved having the same information. In practice, this is seldom the case as
managers are usually privy to information to which other parties are not.
Asymmetrical information has given rise to many diverging theories relating to capital
structure and dividend decisions. The signalling theory is in all probability the most
famous, due to managers having access to private information, as opposed to the
public, who does not (Brickley, 1983). Managers can therefore influence firm value
by strategically releasing information or taking certain actions. The next part of this
chapter discusses asymmetric information and the pecking-order theory in more
detail.
3.4.3 ASYMMETRIC INFORMATION AND PECKING-ORDER THEORY
Asymmetric information is the final violation of the Modigliani and Miller (1958)
assumptions covered in this chapter. It lies at the heart of many theories regarding
dividend and capital structure decisions. One of these, for example, is market timing.
It asserts that management uses economic cycles and trends as indicators of when
to take action when they want to change the firm’s capital structure or decide on
dividends (Baker and Wurgler, 2002:2). Market timing explains why firms tend to
issue shares after run-ups in share prices and why aggregate share issues are
concentrated in bull markets and fall sharply in bear markets (Brealey et al.,
2008:521). For this reason, this study investigates how dividend-investing can be
Stellenbosch University http://scholar.sun.ac.za

47 | P a g e
used to generate positive risk-adjusted returns during market movements. How this
is done is elaborated upon in the next chapters. In this chapter the use of
asymmetric information and its influence on the capital structure is explained using
the pecking-order theory.
According to Brigham and Daves (2007:525) the pecking-order hypothesis states
that when firms need financing for investments they will firstly use internal sources of
funding such as retained net income, or selling off its short-term marketable
securities. When the internal financing is depleted, managers then turn to debt
issues or even to issue preference shares instead of using equity. The last resort for
obtaining financing is to issue equity capital. Internal financing is also referred to as
cash flow generated by a firm’s existing assets, whilst external financing is cash flow
that is generated from the financial markets or private financing (Brealey et al.,
2008:517). The pecking-order theory holds important implications for dividend
policies, as well as firm value.
Brealey et al. (2008:519-520) name four such implications. Firstly, there is a natural
tendency to rely heavily on internal financing, which creates greater reserves than
what would ordinarily be necessary. This means some capital is not optimally utilised
to enhance shareholder value. Secondly, firms adapt their target dividend pay-out
ratios to their investment opportunities, whilst trying to avoid sudden changes in
dividends. This goes hand in hand with the third implication. This is that sticky
dividend policies and unpredictable fluctuations in profitability and investment
opportunities create the possibility of cash flow generated by operations that can
exceed capital expenditures, or not cover it fully. When there is a deficit, firms have
to sell marketable securities or alternatively use cash reserves, which can increase
the business risk of the firm and negatively impact on firm value. Finally, when
external financing is required, firms will issue the safest security first, being debt,
followed by hybrid securities, and finally ordinary shares. This trend complicates the
dividend decision since financially strong firms who pursue a pecking order will
ultimately have relatively few ordinary shares to which dividends can be paid.
Damodaran (2011:340) alleges that firms usually prefer internal financing for several
reasons. The author states that when firms use external financing they have to
Stellenbosch University http://scholar.sun.ac.za
48 | P a g e
relinquish a degree of control, especially in the case of smaller firms. For large firms,
signalling theory asserts that the market can perceive share offers as a negative
signal and adjust the value of shares detrimentally, but this is not the case with debt
financing. Therefore, by using debt financing first the firms are hoping to send a
signal to the market that they are in a stronger position, since weak firms would not
be able to do the same. The author secondly asserts that managers might perceive
share issuing costs to be too high when issuing ordinary shares and that internal
financing is generally safer. The use of internal financing should, however, not imply
that managers are to be less concerned with the firm value, since internal financing
has limitations as well. There is an inherent limit to availability, as well as the
consideration that projects financed with internal financing are nonetheless subject to
performance standards, as identified in the investment analysis techniques, just as is
the case with external financing. Furthermore, when managers use internal financing
for reinvestments, as opposed to paying dividends or building reserves, they run the
risk of losing shareholder confidence if investments do not perform and market
prices fall.
Shyam-Sunder and Myers (1999:220) suggest that another reason for firms applying
the pecking-order theory is because debt financing is normally the easiest to use for
short-term deficits. They further argue that it is an excellent first-order descriptor of
corporate financing behaviour for mature firms since they found that debt levels
change when there is an imbalance of internal cash flows, net of dividends, and real
investment opportunities. They further state that the pecking-order theory explains
why successful firms generally borrow less than distressed firms, as they do not
require outside financing as often. According to Rajan and Zingales (1995:1430),
the level of leverage of individual firms is dependent on four factors: size of the firm,
tangible assets on the balance sheets, profitability of the firm, and the firm’s market-
to-book ratio. Larger firms, firms with greater fixed assets, unprofitable firms, and low
market-to-book ratio firms all had greater use of debt financing and vice versa
(Gomes, 2001:1264, Ross, Westerfield, and Bradford, 1993, Jensen and Meckiling,
1976). Booth, Aivazian, Demirguc-Kunt, and Maksimovic (2001) found similar results
for developing countries. The next section serves to conclude this chapter by
discussing important topics raised thus far.
Stellenbosch University http://scholar.sun.ac.za
49 | P a g e
3.5 CONCLUDING REMARKS ON THE FINANCIAL STRUCTURE
Throughout this chapter, reference was made to the role the financial structure has
on the financial function performed by managers. In this financial function managers
decide where to invest funds to generate profitable returns over the long run
(investment decision and capital budget). Financing to fund these investments is
then collected from either internal or external capital sources of the firm (financing
decision and the capital structure). If the return of the proposed investments does not
exceed the hurdle rate (MCC), or when returns are greater than expected from past
investment, the financial managers must decide if funds should be reinvested into
real assets or distributed to shareholders (the dividend decision).
Specifically, the use and the influence that leverage can have on the capital
budgeting, financing and dividend decision was discussed in this chapter. In
summary, there are two broad benefits of using debt in the capital structure
(Damodaran, 2011:360). The first is that the use of debt financing provides a tax
benefit over the use of equity financing. According to Firer et al. (2008:10), Harris
and Raviv (1990:322), Bernanke (1989:11), Jensen (1986:324), and Jensen and
Meckling (1976:351) to name but a few, the second benefit of using debt in the
capital structure is that it can be used to discipline managers. Debt financing
improves managers’ efficiency in generating higher returns on investments, and is
portrayed in the examples of leveraged buy-outs, leveraged recapitalisations and
acquisitions of low-leveraged targets (Kaplan 1994:192, Denis and Denis 1993:63,
Palepu, 1990:247; Smith, 1990:143). The benefits of leverage, however, can be
counteracted by the costs of using debt financing. When the firm incurs these direct
or indirect costs the equity providers face increased risk to the value of their shares.
Accordingly they require greater returns in relation to the perceived risk as indicated
in their expected rate of return.
Market-related costs, such as agency costs, bankruptcy-related costs due to
financial distress, and asymmetric information costs were highlighted. These costs
allow for the development of modern capital structure theories, which further
Stellenbosch University http://scholar.sun.ac.za

50 | P a g e
expanded the available knowledge of the effect of leverage on firm value and
dividends. The overall purpose of these modern theories, as indicated, have been to
improve on the Modigliani and Miller studies by incorporating market imperfections
encountered in practice into capital structure theories. These traditional and modern
capital structure theories can be used to understand why firms have predetermined
dividend pay-out ratios and whether dividend policy can be used to generate firm
value. When managers implement these theories they do so for the benefit of the
shareholders of the firm. The theories are unique in many ways, but also have the
attribute of being complementary to one another.
By using a predetermined dividend pay-out policy a firm can possibly send signals to
the market and shareholders. Shareholders can also use such information to make
investment decisions, and use the cash flow to increase their personal wealth. Only
by using such information in a holistic view can they attempt to analyse the
dividends, and using dividend-investing strategies can possibly identify how to select
investments. This is the topic of discussion in Chapter four.
Stellenbosch University http://scholar.sun.ac.za

51 | P a g e
Chapter 4 : THE DIVIDEND DECISION
4.1 INTRODUCTION
“The framework for allocating cash is built around the ideal capital structure of the
firm and the sustainability of cash flows. If cash flow generation is constant, one has
much more flexibility on the balance sheet” (Van der Merwe, 2010:23).
Chapter three provided for an overview of the capital structure and how it influences
the dividend decision. It was stated that an optimal capital structure is one that
balances the future growth demand of the firm and short term shareholders’ demand
for returns. Damodaran (2011:5) states that at some point, firms reach a stage where
the cash flow generated by existing investments is greater than the funds required to
make value-enhancing investments. From that point, the managers must decide on
the appropriate dividend policy, which determines the amount, type and frequency of
distributions to the shareholders. The firm then has three basic choices to make
regarding its earnings for any given year:
• It can reinvest the earnings for future growth.
• It can build up its internal financing reserves.
• It can pay out earnings in the form of dividends.
Chapter two and Chapter three related to the first two options, while this Chapter –
the last in the discussion of the financial function – considers the latter.
This chapter focuses on the possible effect dividend payments have on share value
and provides a basis for the analysis performed in the next chapters. The purpose of
this chapter is, therefore, to conclude the discussion of the financial function and its
components. Furthermore this chapter introduces the possibility of using dividend
information in conjunction with market movements (bull and bear markets) to
generate positive risk-adjusted share returns. The influence that investor
preferences, especially during bull and bear markets, have on the dividend decision
Stellenbosch University http://scholar.sun.ac.za

52 | P a g e
is discussed and serves as the basis for the analysis of dividend-investing strategies
used in the following chapters of analysis.
The remainder of this chapter is structured into four parts: the first provides a
background of dividend decisions and policy by considering the type of dividend paid
to shareholders and the dividend payment chronology, i.e. how dividends are paid
out to shareholders. The second part provides for a discussion on three prominent
schools of thought on dividend policy and the dividend decisions firms make. The
third part identifies various patterns that have been observed with dividend policies
over the past decades. Before the chapter is concluded by means of a summary, the
penultimate part discusses dividend-investing and market movements. Dividend-
investing strategies are identified, which serve to clarify whether dividend information
and certain market conditions could be used to enhance shareholder value during
market movements. Based on South African literature reviewed it would appear as if
this aspect had received relatively little attention in previous years of studies. This
study seeks to provide more clarity.
4.2 BACKGROUND TO THE DIVIDEND DECISION AND POLICY
“Managers who do not have good investment opportunities and do not pay dividends
quickly create a situation where they have very little debt and enormous cash
balances. These managers can then easily use their cash balances to benefit
themselves at the expense of the shareholders” (DeAngelo, DeAngelo, and Stulz,
2006:227).
As discussed in Chapter three, debt is used by many firms to limit managers’
financial freedom in the hope of protecting shareholder wealth. However, following
the financial crisis that hit global markets in 2008 many firms have attempted to de-
leverage their debt, resulting in large cash reserve balances in most firms
internationally. Van der Merwe (2010:24) also states that the excessive cash
balances in South African firms at the time were as a result of the financial crisis the
South African market experienced. Internationally, Bates et al. (2009:1985) identified
Stellenbosch University http://scholar.sun.ac.za
53 | P a g e
new trends in increased cash-to-asset ratios over the past couple of years, indicating
that firms have been increasing cash balances even before the financial crises.
It can thus be argued that the dividend decision has become critical in order to
manage shareholders’ wealth by distributing dividends, when appropriate. The
questions which then arise are which type of dividend should be paid, how it should
be paid and how to measure its relevance. Unfortunately, deciding on this has never
been an easy undertaking. The next three sections of this chapter are dedicated to
each of these pertinent questions.
4.2.1 TYPES OF DIVIDEND PAYMENTS
Dividend payments can either be in the form of cash dividends or capital
appreciation on the shares owned by investors. Cash dividends include regular,
special, extra, or liquidating dividends (Damodaran, 2011:547). Dividends in the form
of capital gains include share dividends, splits, as well as share repurchases.
Studies by Brav, Graham, Harvey, and Michealy (2005), and a subsequent study by
Firer et al. (2008), indicate that many firms use a combination of the above methods
of payments. There are, however, some noteworthy consequences of using the
various forms of dividends and managers must balance the benefits with the
negative side-effects in order to add value to shareholders.
Both cash dividends and share repurchases reduce the overall market value of firms’
shares, but the way they affect market value is different. Damodaran (2011:548)
states that cash dividends reduce the market price per share on ex-dividend day and
do not change the amount of shares outstanding. A share repurchase reduces the
amount of shares and may cause an increase in share prices. Furthermore, unlike a
cash dividend a share repurchase returns cash selectively to investors who choose
to sell their shares back to the firm. The remaining shareholders only gain from the
repurchases when there is a gain in the market price of the remaining shares.
Van der Merwe (2010:25) identifies cash dividends as the most common type of
dividends in use in South Africa when she states that most often South African firms
Stellenbosch University http://scholar.sun.ac.za

54 | P a g e
do not have access to cheap debt to fund repurchases. Furthermore, she states that
due to empowerment deals done in South Africa, the use of cash dividends is more
preferable since “many empowerment structures rely on predictable dividend flows to
pay off debt.” Share repurchases have also caused the decline of many share prices
over the past years, which evince the criticism of its use. Van der Merwe (2010:25)
illustrates this by quoting Kooyman (2010) when he says:
”Managers need to behave as investors and value the shares appropriately in order
to purchase shares below their fair value. Unfortunately, in my experience,
management at firms are poor judges of share valuation.”
An appropriate South African example of such a decline in share value subsequent
to a share repurchase is that of Anglo American who initiated a scheme prior to the
financial crisis in 2008 and whose share value plummeted, which in turn dried up
cash reserves and forced the firm’s management to interrupt its proud dividend-
paying history (Van der Merwe, 2010:24). Saville (2010) argues Kooyman’s (2010)
point and states that “empirical evidence from South African firms suggests that, on
average, firms have a better sense of their own value than the market.” However,
Kooyman (2010) argues further that the practice of share repurchases goes against
the grain of investing since investors’ decisions are being made for them and that
“investors would prefer to be the ones choosing how to apply this cash.” He goes on
to argue against the use of share repurchases by asserting that managers can use
this method to manipulate the value of shares for their own benefit. Both Kooyman
(2010) and Saville (2010) state that cash dividends have great signalling power since
firms with good track records of dividend payments usually have higher (share)
valuations (Van der Merwe, 2010:29). Furthermore, both posit that dividends and
dividend growth contribute about three quarters of total investment returns over five-
to 10-year periods across countries, over time, and across a given firm’s history (Van
der Merwe, 2010:30). These signals are elaborated on in sections to come.
Considering these arguments, the lack of availability of share repurchases data, and
the difficulty in the accounting thereof (Bester, Wesson, and Hamman, 2010:17), the
rest of this study’s focus will be placed on cash dividends and its possible influence
on share price.
Stellenbosch University http://scholar.sun.ac.za
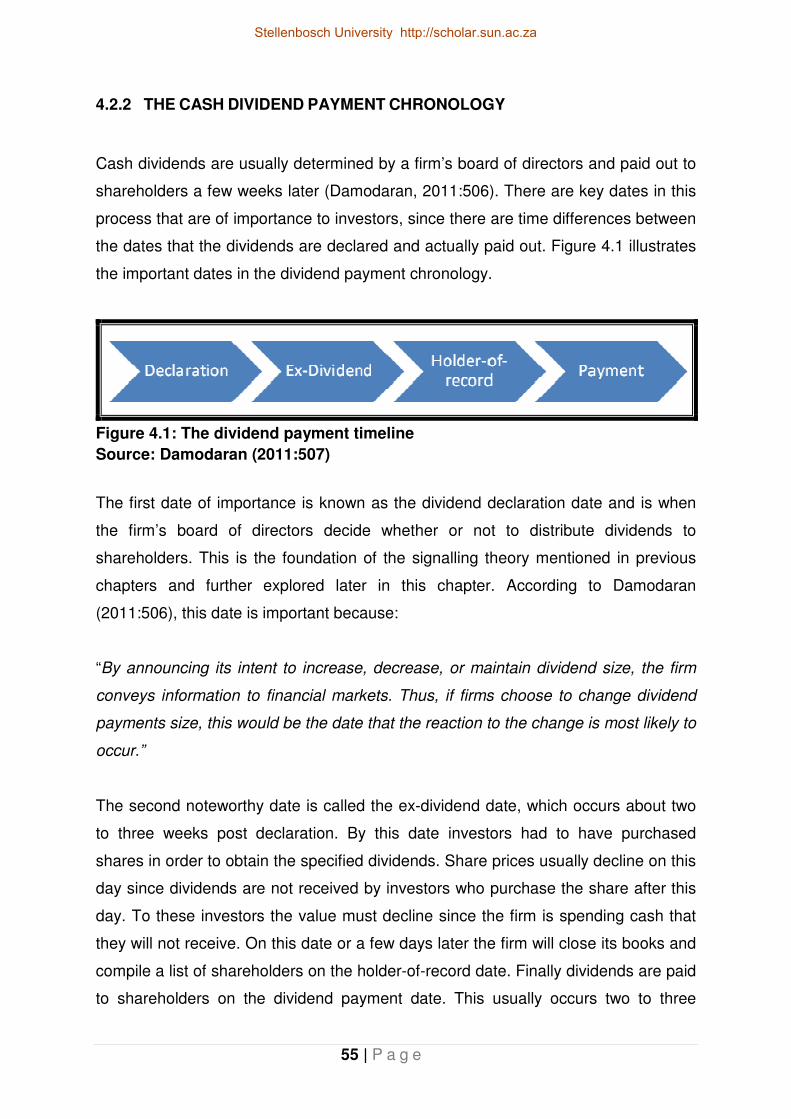
55 | P a g e
4.2.2 THE CASH DIVIDEND PAYMENT CHRONOLOGY
Cash dividends are usually determined by a firm’s board of directors and paid out to
shareholders a few weeks later (Damodaran, 2011:506). There are key dates in this
process that are of importance to investors, since there are time differences between
the dates that the dividends are declared and actually paid out. Figure 4.1 illustrates
the important dates in the dividend payment chronology.
Figure 4.1: The dividend payment timeline
Source: Damodaran (2011:507)
The first date of importance is known as the dividend declaration date and is when
the firm’s board of directors decide whether or not to distribute dividends to
shareholders. This is the foundation of the signalling theory mentioned in previous
chapters and further explored later in this chapter. According to Damodaran
(2011:506), this date is important because:
“By announcing its intent to increase, decrease, or maintain dividend size, the firm
conveys information to financial markets. Thus, if firms choose to change dividend
payments size, this would be the date that the reaction to the change is most likely to
occur.”
The second noteworthy date is called the ex-dividend date, which occurs about two
to three weeks post declaration. By this date investors had to have purchased
shares in order to obtain the specified dividends. Share prices usually decline on this
day since dividends are not received by investors who purchase the share after this
day. To these investors the value must decline since the firm is spending cash that
they will not receive. On this date or a few days later the firm will close its books and
compile a list of shareholders on the holder-of-record date. Finally dividends are paid
to shareholders on the dividend payment date. This usually occurs two to three
Stellenbosch University http://scholar.sun.ac.za
56 | P a g e
weeks after the previously mentioned date. On this day no effect on share prices
should occur since nothing has changed at the firm and the markets have already
had ample time to respond to the dividend announcement (Asquinth and Mullins,
1983).
Reactions to dividend announcements have been studied for many years, and many
academics and practitioners have proposed theories regarding the information
content of dividend payments. However, in order to introduce and explain the various
dividend theories the next section identifies several dividend measures used to
analyse the effect dividend payments might have on share value.
4.2.3 MEASURES OF DIVIDEND POLICY AND VALUATION
Three widely used measures of dividend policy are identified and explained in this
part, namely the DY, dividend stability, and the dividend pay-out ratio (DPR).
The first dividend measure of importance is the DY, which relates the dividend
amount paid in relation to the share price (Damodaran, 2011:507). According to the
author, many investors used the DY as a measure of risk and as an investment
screen. In support of the use of such a screen, studies do indicate that higher-than-
usual DY shares tend to outperform lower DY shares in value over time, as
previously stated by Kooyman (2010) and Saville (2010).
Fuller and Goldstein (2003) studied the effects of market movement on dividend
policies and whether signalling was indeed observed in the market when selecting
shares for investing. Their study revealed that dividend-paying firms provided better
returns than non-dividend-paying firms during both scenarios of market movements
– bull and bear markets - and that the level of dividend payments was not the
influencing factor, but rather whether the firm made any payments at all.
Another study of dividend relevance was performed by Erasmus (2011), who built on
previous studies of Wolmarans (2003; 2000), Ap Gwilym, Morgan, and Thomas
(2000), and Kleim (1985), to name a few. An important result obtained by Kleim
Stellenbosch University http://scholar.sun.ac.za
57 | P a g e
(1985) was that an U-shaped non-linear relationship was observed between DY and
share returns. This relationship dictates that the highest returns were found for firms
with the highest and zero DYs. The results of Erasmus (2011) and Ap Gwilym et al.
(2000), however, do not indicate that such an U-shaped relationship exists. This is of
specific relevance for the current study since the Erasmus (2011) study was based
on South African firms. Erasmus (2011) also indicate that share value can potentially
be influenced by not only the size of dividend payment, but also its stability. In
support of these findings, the DeAngelo and DeAngelo (2012) and Fuller and
Goldstein (2003) studies provide empirical evidence that during financial distress,
commonly associated with bear markets, managers were more willing to reduce
dividend payments, but not to stop them in their entirety.
From these previous studies, some of the major factors pertaining to the dividend
decision appear to be the size of the payments, measured in terms of DY, the form
of the payments and the recent stability of payments (Erasmus, 2011:3). This study
uses the methodology incorporated by Erasmus (2011), Ap Gwilym et al. (2000) and
Kleim (1985) who used DYs as an indicator of dividend size. DY is calculated on a
monthly basis as follows:
��� � 1���� �!�����
"#���$
Where ��� is the DY in month t, DIV( is the dividend paid during month t, and ���� is
the share price in month t-1. This methodology enabled the construction of various
dividend-investing groups based on DY levels discussed later in the chapter.
The second measure of dividend policy pertains to the stability of cash dividends.
Hobbs (2006:5) found that “permanent [cash dividend] payers enjoy significantly
higher earnings in the years subsequent to initiation than temporary payers do.”
Hobbs (2006:5) states that even though it appears that permanent payers enjoy
greater earnings, investors at the time did not differentiate between the constantly
paying firms and the temporary dividend-paying firms.
Stellenbosch University http://scholar.sun.ac.za

58 | P a g e
Previously, in the South African market, Gevers and Hamman (1988), and Du
Plessis, Archer, and Affect-Graves (1986) found support that dividend payments are
usually very stable, through the discovery that during periods of high inflation firms
paid dividends in excess of their real earnings. Firer et al. (2008) revealed supporting
evidence that South African firms and their managers appear to be conservative with
dividend payments, and seemed to maintain stable levels of pay-outs.
The third measure of dividend policy is known as the DPR. This measure relates to
the amount of dividends paid in relation to earnings of a firm, or:
��) � �*+*��,�-./0,*,1- � �23245647 8924 85� 85�2:4/ �9�626<7 85� 85�2:4;
The DPR is used in a number of different settings. Firstly, it is used in valuations as a
method of predicting future dividends. Secondly, it allows for greater analysis of
earnings by using the retention ratio to predict future growth in earnings. The
retention ratio is the proportion of earnings not paid out as dividends. The third use
of the DPR is to identify where a firm is in its life cycle, since firms tend to follow a
certain pay-out policy dependent on its age and historical growth.
According to life cycle analysis – a possible source of clientele theory – if an investor
can determine the age and growth potential of a firm it is possible to identify what
type of dividend payments the firm could make in the future. The dividend policy,
however, is not the only financial component that can be analysed with a firm’s life
cycle analysis. Capital structures and investment decisions also interact in this
model. Figure 4.2 illustrates how this analysis can be used in order to identify what
dividend policy growing firms might use.
Stellenbosch University http://scholar.sun.ac.za

59 | P a g e
Figure 4.2: Life cycle analysis of earnings and revenue
Source: Researchers own construction
Firms follow various stages of growth ranging from start-up to decline. In the start-up
stage firms tend to not have any dividend payments as most earnings realised are
reinvested in order to facilitate greater growth in assets. In this stage internal
financing is almost impossible. As the firm becomes more successful it becomes
more capable of making dividend payments as their need for making further
investments for growth declines.
In analysing DPRs Damodaran (2011:509-510) found that many firms in the U.S.
paid out dividends to shareholders in excess of their earnings in January 2009. In
South Africa this was also found to be the case for certain periods (Gevers and
Hamman, 1988; Du Plessis et al., 1986). When firms pay out dividends in excess of
earnings, it loses value in two ways (Damodaran, 2011:571). It creates a cash
shortfall that has to be made up by issuing more securities, and the cash shortfall in
turn creates capital-rationing constraints that limit new investments in value-adding
projects. Clearly this practice destroys firm value, so the question is why is it being
done and to what extent.
In order to provide a possible rationale for such behaviour the next part of the
chapter explains the reasoning and beliefs relevant to dividend policy formulation in
Start-up Low growth High growth Mature Decline
Revenue
Earnings
Time / Stages
Earnings
Stellenbosch University http://scholar.sun.ac.za

60 | P a g e
a firm. Historic theories and modern improvements in policy formulation are
explained before the most recent trends are identified in the following part of the
chapter.
4.3 THE DIVIDEND POLICY DECISION
It is understandable that the dividend decision is not an easy decision to make. Many
factors influence the decision and the effect it has on all parties affected by the
decision must be considered. In order to do so this section identifies the various
schools of thought regarding the dividend decision. Reference is made to capital
dividends (for example share repurchases) but this is only done in order to fully
reflect the complexity of this decision. The next section firstly discusses the
traditional three schools of dividend policy, before modern theories are identified.
4.3.1 DIVIDEND IRRELEVANCE VERSUS RELEVANCE
The dividend irrelevance theorem was developed by Modigliani and Miller (1961)
who stated that the dividend policy has no significant effect on a firm’s share price or
cost of capital – its MCC. Recalling from chapter three, this first school of thought
argued that as the amount of debt financing increased, the MCC will decrease.
Accordingly, dividends could not be used to enhance firm value as there would
almost not be any equity capital in the firm.
Modigliani and Miller’s (1961) arguments, however, were contradictory to Lintner
(1956:98) who conducted a series of interviews with finance managers and
examined the dividend policies of the firms they managed. Lintner’s (1956:98)
findings are summarised, as interpreted by Marsh and Merton (1987:5):
“Firms have long-term target dividend pay-out ratios. Secondly, managers focus
more on dividend changes than on absolute levels and that dividend changes follow
shifts in long-term sustainable earnings. This trend implies that managers tend to
“smooth” dividends so that changes in transitory earnings are unlikely to affect
Stellenbosch University http://scholar.sun.ac.za
61 | P a g e
dividend payments over the short term. Finally, managers are reluctant to make
changes to dividends that might have to be revised. They are particularly concerned
about having to rescind a dividend increase.”
Major debates followed between academics who argued dividends to be irrelevant
like Modigliani and Miller (1961) and others such as Lintner (1962) and Gordon
(1963, 1959), who believed dividends to be relevant to a firm’s market value. Gordon
and Lintner, who propositioned the second school of thought, argued that the cost of
equity will decrease as dividend pay-outs are increased, resulting in a lower MCC.
The reason for this is that investors are less certain to benefit from capital gains and
potential future growth from reinvestments, than they are of receiving dividend
payments. Lintner (1962) and Gordon (1963; 1959) therefore believed investors
prefer DYs over and above capital gains as DYs are less risky. Academics
supporting the first school of thought disagreed with these assertions and viewed the
Gordon-Lintner argument as a “bird-in-the-hand” fallacy. In Modigliani and Miller’s
(1961) view most investors plan to reinvest their dividends in the shares of the same
or similar firms, and in any event, the risk of cash flows to investors in the long run is
determined by the risk of the operating cash flow, and not by the dividend pay-out
policy (Brigham and Daves, 2007).
Finally, the third school of thought, based on tax preferences, differs from the
previous schools. It recognises the relevance of dividends and that it can be used to
influence shareholders’ value. Thus, it partly supports the second school of thought
in the sense that equity financing can enhance shareholder value, but it opposes the
idea that investors prefer DYs over capital gains. This is due to differential tax
treatments for the two scenarios and the fact that capital gains tax (CGT) rates in
many countries are lower than dividend taxes. Pettit (1977:419) states that even at
identical tax rates, a CGT can still be preferred over a dividend tax for two reasons.
Firstly, the time value of money causes the cost of the tax to be lower for capital
gains than for dividends, since CGTs are only paid at some future date when the
sale of the share is brought about. As long as this time period is longer than the
period until the next dividend payment, the equal rates would not result in equal
monetary costs. Secondly, if a share is held until maturity by a South African
Stellenbosch University http://scholar.sun.ac.za

62 | P a g e
investor, some tax advantages would come into play since an annual tax exemption
can be enforced up until a specified value for the assets, which will decrease the tax
liability (Vanek, 2009).
Taxation holds particular significance for South African investors and there have
been many changes regarding the taxation of dividends and capital gains in South
Africa. The next part of this section provides a summary explaining various taxation
trends South African investors have been exposed to before modern approaches to
dividend policy formulation are introduced.
4.3.1.1 Taxation in the South African market
According to Firer et al. (2008) the dividend taxing systems worked on a withholding
basis where only the final declaration of dividends to the shareholders was taxed up
until March 1990. The responsibility of settling the liability rested on the receiver of
the dividends, but was paid by the distributing firm (Vanek, 2009). Between the
periods of 1990 to 1993 there did not exist any form of tax, be it a DWT or CGT. In
the 1993 budget speech, things changed yet again, as the Minister of Finance
announced that STC will be implemented. This subsequently became effective as of
1 April 1993. More recently the STC methodology has also been replaced by a DWT
system effective as of 1 April 2012.
In Chapter three references was made to STC, and CGT (Correia et al., 2007:1-10).
STC was different to taxation levied in most other countries that use a DWT. For
South African shareholders this meant that they were privileged in that no taxation
was paid on ordinary dividends received from local firms, as can be seen in Section
10 (1)(k)(i) of the South African Institute of Chartered Accountants (SAICA)
legislation handbook (2010). Local firms were, however, burdened with a double
taxation, since they had to pay corporate taxes in general and additional STC when
they wanted to pay dividends (Correia et al., 2007:1-11).
The implementation of STC, according to Ellis (2001), was to encourage the
reinvestment of profits into the firm in the hope that the firm could grow further and
contribute more to the growth in gross domestic production (GDP). It was believed,
Stellenbosch University http://scholar.sun.ac.za

63 | P a g e
at the time of implementation, that dividend payments would decline drastically,
since STC places greater emphasis on such payments. Table 4.1 indicates the STC
rates that were paid by firms who declared dividends during the different time
periods since its inception in 1993.
Table 4.1: STC rates on dividends declared
From Until Rate 17-Mar-93 21-Jun-94 15%
22-Jun-94 13-Mar-96 25%
14-Mar-96 30-Sep-01 12.50%
1-Oct-01 31-March-12 10%
Source: Researchers own construction
Table 4.2 illustrates how firms would be taxed under STC, and how it also created a
lower total effective tax rate. In the table, an example is used of a firm that pays out
all net income as cash dividends and does not hold any internal reserves.
Table 4.2: STC versus a classical taxation system
Tax rate Classical STC
Taxable income 100,000 100,000
Taxation 28% (28,000) (28,000)
72,000 72,000
STC [10% of total dividends paid by the firm] 10% 0 (7,200)
Dividends paid by the firm 72,000 64,800
Source: Correia et al. (2007:1-11)
Under the classical system, firms only paid a corporate income tax, and
shareholders paid personal income tax on the dividends acquired. Under STC, the
firm had to pay both portions but because of this double taxation, fewer taxes were
paid in total since the STC rate of 10% is much less than the personal income tax
rate of 40%. The table also indicates how fewer dividends became available for
distribution, and why firms should possibly consider to reinvest in their own firm. In
the March 2007 budget speech, Trevor Manuel, then Minister of Finance proposed
the phasing out of STC, and the subsequent implementation of a withholding tax at
10% to South African individuals, and a discounted rate of 5% to 10% to foreign
Stellenbosch University http://scholar.sun.ac.za

64 | P a g e
investors. This was scheduled to commence in 2009, as written in the Revenue laws
and Amendment Act, 60 of 2008, but was only introduced in the 2012 budget year
and at a rate of 15% instead of 10%. The phasing out of STC and eventual
implementation of the new tax structure would be enacted to make the South African
capital market more attractive and competitive, and bring South Africa in line with
international tax regimes (Vanek, 2009).
The full effect of the implementation of a new withholding tax is as of yet too difficult
to determine as there are many criticisms, as well as support for the tax. It is
believed that the benefits will be predominantly to the firms, as they no longer are
liable for the payment of the taxes, and at some instance do not have to pay it at all
(Vanek, 2009). Examples include firms such as public benefit organisations (PBOs),
and tax exempt organisations. Another example is inter-firm dividend distributions,
which will not be taxed as only the final recipient is liable and not the firm passing on
the dividends (Brislin, 2009).
Table 4.3 indicates how the implementation of the withholding tax can affect
shareholders and firms, as the difference between the current STC structures is
compared with firms using the different rates of withholding tax.
Table 4.3: Comparison of STC and the withholding tax
Firm with
10% STC
Firm with a
5% DWT
Firm with a
10% DWT
Firm with a
15% DWT
Income 100 100 100 100
Normal tax (28) (28) (28) (28)
Distributable income 72 72 72 72
STC (10/110) (6.55) 0 0 0
Withholding 0 (3.6) (7.2) (10.8)
Paid to shareholder 65.45 68.4 64.8 61.2
Source: Brislin (2009)
By comparing the scenarios of a firm paying STC, and a firm with a 15% DWT, it can
be seen how the shareholders receive less cash. The precise implications for
Stellenbosch University http://scholar.sun.ac.za

65 | P a g e
shareholders and other firms will only be apparent when the tax is implemented fully
and the relevant stakeholders have had enough time to react. For the purpose of this
study, however, the question arises whether the corporate income tax or STC has
had any effect on South African dividend decisions in the past.
According to Ellis (2001) STC did not have much impact on the cash dividend
payments of South African firms in early years, as many firms followed international
trends and did not incorporate STC into their dividend policies. Studies performed by
Firer et al. (2008), Wolmarans (2003; 2000) and Marx (2001) also indicate that
taxation did not affect dividend policy by as much as would be expected. Finally,
Correia et al. (2007:1-11) state that “surveys of practice indicate that firms use their
corporate tax rate when accounting for tax in the financing and investment
decisions.” Thus the corporate tax rate is of importance, but not necessarily STC.
Considering the various dividend policy beliefs discussed thus far, modern dividend
theories originate from statements such as the following from an unnamed
stockbroker (Firer et al., 2008:10):
“Just what was De Beers playing at? With one dividend cut to save less than R90
million cash it has destroyed the market rating it has been building for over 50
years.”
These market reactions and efforts by managers in managing dividends are the
preceding factors of the modern theories and are the topic of the next discussion.
4.3.2 MODERN THEORIES ON DIVIDEND PAYMENTS
Modern dividend policy theory provides for extended reasoning on the relevance of
dividends. In this section three specific theories are explained. They are the clientele,
catering and signalling theory.
Stellenbosch University http://scholar.sun.ac.za

66 | P a g e
4.3.2.1 Clientele theory
The clientele effect is justified by the preference some investors have for shares that
exhibit certain characteristics that favour their taxable income (Clayman et al., 2009).
Examples of such clienteles are individuals who are tax exempt and thus would
prefer high DY firms, as opposed to higher capital gains (Pettit, 1977:420). Studies
indicate that the clientele effect has much to do with the age of the investors, as well
as the tax status of the investor. For example, many retired investors prefer higher
current income than capital gains since they prefer to use the dividends for daily
expenditures. Accordingly, Clayman et al. (2009), state that age and tax status
cause certain investors to prefer different types of industries as the industries have
differing characterises. Figure 4.3 below represents the different DYs for industries
on the Standard & Poor’s 500 Index for 2004, and highlights the difference in
dividend policy observed between sectors.
Figure 4.3: DY of major S&P's industry groups September 2004
Source: Clayman et al. (2009)
Damodaran (2011:585) states that one of the consequences of the clientele effect is
that changes in dividends, even if entirely justified by the firm’s cash flow, may not be
well received by the shareholders. He states that this is particularly evident when
firms have unhappy shareholders as a result of a cut in dividends. Also, when firms
have not paid any dividends in the past and suddenly initiate them, shareholders
may also be dissatisfied.
Technology
Health Care
Energy
Financial
Utilities
0 0.5 1 1.5 2 2.5 3 3.5
DY (%)
Stellenbosch University http://scholar.sun.ac.za
67 | P a g e
4.3.2.2 Catering theory
Another modern theory that is very similar to the clientele theory is the catering
theory (Baker and Wurgler, 2004). Where the clientele theory posits that investors
select shares based on predetermined firm characteristics, the catering theory
proposes that firms formulate dividend policy based on its respective shareholders’
demands. Both of these theories share the key characteristic of shareholder
importance and market conditions, and posit that the dividend decision should be
actively used to manage firm value (Erasmus, 2011). This element of market
sentiment is the main tenet of the signalling theory discussed next.
4.3.2.3 The signalling theory
Recalling from the previous chapter, signalling theory suggests that firms with good
future prospects regarding their earnings should undertake actions to illustrate this
as investors will react positively to these actions. The rationale behind this is that
firms with poor prospects would not be able to replicate these actions especially
when the dividends are relatively large (Hobbs, 2006:2). The origins of the signalling
hypothesis can be found in the study performed by Lintner (1956). Recalling the
findings mentioned previously, Lintner found that not only were dividend payments
dependent upon the amount of cash needed to finance projects in the short term, but
that they also represented management’s belief in the sustainability of firm earnings
over the long term (Hobbs, 2006:1).
Empirical evidence provides support for the signalling theory as it indicates that
investors respond favourably to dividend increases and initiations, and negatively
when dividends are decreased (Van der Merwe, 2010:24; Grullon, Michealy, and
Swaminathan, 2002; Benartzi, Michealy, and Thaler, 1997; Michealy, Thaler, and
Womack, 1995; Healy and Palepu, 1988; and Knight and Affect-Graves, 1987, to
name a few). Hobbs (2006:27) on the other hand did not find any support for the
signalling theory as dividend initiations were not found to be significant. According to
him, the more important variable was long-term commitment to dividend payments
and not the dividend itself. This might be the reason why investors’ reactions to
Stellenbosch University http://scholar.sun.ac.za

68 | P a g e
dividend changes are not always the same, since negative signals are perceived as
more severe.
Brav et al. (2005) argue that managers are “conservative with dividends” as they are
reluctant to increase payments if there is a chance that long-term earnings will not be
able to sustain those payments. This finding is supported by several studies
performed on South African firms listed on the JSE. One of the most important
surveys was performed by Seneque and Gourlay (1983), who established that
management pursued dividend policy as an active variable. They state that
management strongly believed in the continuity of payments and that a stable pay-
out ratio was crucial for the preservation of shareholder value. When setting dividend
policy, respondents were chiefly influenced by “recorded earnings and the prospect
of future earnings” (Firer et al., 2008). Marx (2001) found supporting evidence for
this. According to his survey, just over 70% of respondents agreed that a firm should
avoid making changes in its dividend policy when the risk may arise of reversing the
decision at a future date.
As mentioned previously, Gevers and Hamman (1988), and Du Plessis et al. (1986)
found support that dividend payments are being maintained at almost any cost,
through the discovery that during periods of high inflation firms paid dividends in
excess of their real earnings. Firer et al. (2008) reveal supporting evidence that
South African firms and their managers appear to be conservative with dividend
payments, and seemed to maintain the level of pay-outs. They used a questionnaire
designed by Brav et al. (2005), who performed the same studies on firms listed on
the New York Stock Exchange (NYSE). Results indicate that the evidence for the
signalling approach was more nuanced, with managers clearly recognising that
dividends convey information to the market, but that they did not use this as a tool of
communicating to the market.
The current study seeks to illustrate the implications of the signalling theory further
by indicating how market movements affect this over- and under reaction by
investors. However, before dividend-investing strategies are introduced, the next
section of this chapter provides a brief summary of some noteworthy dividend policy
observations discussed thus far.
Stellenbosch University http://scholar.sun.ac.za

69 | P a g e
4.4 DIVIVDEND POLICY OBSERVATIONS
Previous studies have reported that dividends and earnings are positively correlated
over time (Damodaran, 2011:511). This correlation is not surprising, since earnings
are used to pay out dividends; however, from this correlation some noteworthy
trends have been noticed. Firstly, dividends appear to be sticky in the sense that
dividend changes seem to be trailing earnings changes. Secondly, the dividend
series appears to be much smoother than earnings, or in other words less volatile.
Both of these trends are discussed in the following to sections.
4.4.1 DIVIDEND PAYMENTS ARE MAINTAINED
“Managers dread cutting dividends, which might explain why this happens so
infrequently” (Van der Merwe, 2010).
There are several reasons why firms tend to be conservative with dividend
payments. One is that firms might be concerned about future capabilities of
maintaining the level of payments. Another is that markets tend to dislike any
dividend cuts that might occur. As indicated previously, South African firms have
apparently been hesitant to cut the level of dividends. However, even when there are
sound reasons for cutting dividends, there are reasons why firms delay doing so.
Firstly, indiscriminate investors tend to treat firms that cut dividends due to
operational difficulties the same way as firms that cut dividends due to lucrative
investment opportunities (Benatzi et al,, 1997). The second reason is known as
share price drift. Michealy et al. (1995) analysed 887 dividend omissions between
1964 and 1987 in the U.S. market and found evidence that share prices continue to
drift downward in the weeks after the announcement of a dividend cut. For firms who
do need to reduce dividends, it is important that they frame dividend decreases in
terms that appeal to shareholders (Bulan, Subramaniam, and Tanlu, 2005). They
found that firms who confront dividend omissions and deal with them accordingly by
Stellenbosch University http://scholar.sun.ac.za

70 | P a g e
retiring debt have share prices that recover faster than firms who do not manage the
situation and misuse cash from dividend omissions.
Hobbs (2006:5) suggests that dividends have become less sticky in U.S. markets, as
originally believed by Fama and French (2002). However, Van der Merwe (2010)
states that this is not the case for South African firms. Thus, it appears that dividend
policies might be influenced by preferences in various markets, since investors on
the JSE most probably differ from investors on the S&P 500.
4.4.2 DIVIDENDS ARE LESS VOLATILE THAN EARNINGS
Ambarish and Williams (1987) suggest that dividends are less volatile than earnings
due to the impact dividends have on share prices. Investors see dividend
announcements as indications of the firm’s future performance, since they believe
that management is privy to information that they do not have. Ambarish and
Williams (1987) further state that:
“In a repeated game with reputations, dividends might reveal corporate
characteristics, with or without dissipative costs. In a sequential equilibrium,
outsiders would recognise the relationship between current dividends and future
returns, pay higher prices for stocks with historically higher dividends, other things
equal, and thereby induce to smooth dividends over time relative to corporate cash
inflows.”
As previously indicated many studies reveal that firms do attempt to smooth dividend
payments over time in order to maintain a stable dividend policy (Firer et al., 2008;
Brav et al., 2005). Cyert and March (1993) also state that managers generally
attempt to prevent drastic changes in the level of dividends. They believe managers
analyse industry-wide norms of dividend payments in relation to earnings and then
use heuristics to apply conservative adjustments to the dividend payments. These
predictions are also in line with Lintner’s (1956) findings discussed previously. These
two observations pertaining to dividend observations highlight the importance of the
stability of dividend payments, and whether it can influence share prices over time.
Stellenbosch University http://scholar.sun.ac.za

71 | P a g e
As mentioned previously in this chapter the Erasmus (2011) study analysed a
sample of firms on the JSE during the period of 1990 to 2010. His findings supported
previous studies in that the level of dividend payments influenced share returns, but
furthermore the stability of payments seemed to share the same relationship.
These findings regarding dividend policies over the years are meant to provide for
better understanding of the different schools of thought. They serve as basic building
blocks of dividend policy theory and have allowed the creation of more modern
theories that seek to explain the role and influence dividends have on share value.
The next part of the chapter specifically looks at how the dividend policy might be
influenced by market movements. It formally provides for the research topic of the
study, and the data used for statistical analysis performed later.
4.5 DIVIDEND-INVESTING AND MARKET MOVEMENTS
The term “dividend-investing” was coined by Knowles and Petty (1992:29) when they
showed that focusing on the top five DY firms resulted in a portfolio which
outperformed the Dow Jones Industrial Average (DJIA) between 1957 and 1990.
Arguably, the use of dividend-investing strategies are derived from statements
similar to those of Kooyman (2010) and Saville (2010), mentioned earlier, who stated
that “firms with good track records of dividend payments usually have higher [share]
valuations.” Furthermore, “dividends and dividend growth contribute about three
quarters of total investment returns over five- to 10-year periods across countries,
over time, and across a given firm’s history” (Van der Merwe, 2010:25).
Previous studies performed to test the use of dividend-investing include Fuller and
Goldstein (2003), Wolmarans (2003, 2000), Bhana (1991), and Seneque and
Gourlay (1983) to name a few. Using the findings obtained in previous studies, this
study seeks to update and enhance results obtained. How this is done is discussed
briefly in the next section, before being elaborated upon further in the next chapter.
Stellenbosch University http://scholar.sun.ac.za

72 | P a g e
4.5.1 DIVIDEND-INVESTING PORTFOLIOS
In this study the Wolmarans (2000) study is adapted in the sense that the dividend-
paying portfolio has been subdivided according to a firm’s DY level. Wolmarans
(2000) considered the share returns for 20 shares included in the then Top 30 JSE
shares, and ranked them according to DY and EY. The analysis performed on the
portfolios suggested that using dividend-investing on the JSE did not yield better-
than-market returns over the period of 1979 to 1999. From his findings Wolmarans
(2000) suggests that the DY could not be used to outperform the market. The
Wolmarans (2003; 2000) studies, however, reported higher share returns for South
African firms with higher dividend payments than for the lower-dividend-paying firms.
In the Wolmarans (2000) study the data analysed was for a different time period and
did not consider major changes in the capital market since. This study also broadens
the scope of the Wolmarans (2000) study by considering a greater selection of firms,
including delisted firms that were not included in the previous study and furthermore
analysing their returns over both bull and bear markets specifically.
Another study of particular significance is the Fuller and Goldstein (2003) study. As
previously mentioned, Fuller and Goldstein (2003) studied the effects of market
movement on dividend policies. Their aim was to determine the extent to which
signalling was observed in the market when selecting shares for investing. Their
study revealed that dividend-paying firms provided better returns than non-dividend-
paying firms during periods covering both market movements, and that the level of
dividend payments was not the influencing factor, but rather if the firm made any
payments at all.
The next chapter will introduce how each portfolio was constructed using market
data and why the specific time period of the study was chosen. Using the dividend
measures introduced in this chapter, statistical analysis tools are identified to
address the research objectives of the study. Next, the final part of this chapter
serves to summarise important topics discussed thus far and its implication for data
analysis.
Stellenbosch University http://scholar.sun.ac.za
73 | P a g e
4.6 CONCLUSION
This chapter served the concluding remarks on the financial function performed by a
firm’s management and how the financial components – the investment decision, the
financial decision, and the dividend decision – interact.
As mentioned in Chapter one, this study’s objective is to investigate the possibility of
using dividend information, especially over various bull and bear markets, to
enhance investment returns. From the perspective of the firm, by analysing the
performance of dividend-investing strategies over time a possibility exists that
dividend policy formulation might be used to maximise share value. This
investigation is of particular significance in the South African market, since the most
common dividend policy used by firms listed on the JSE remains the constant-
paying-dividend policy (Van der Merwe, 2010:29; Gidlow, 2009; Firer et al., 2008).
Accordingly, firms appear to be conservative regarding dividend payments and
considering the recent financial crisis and other cash-to-asset ratio trends, have built
up large reserves of cash (Bates et al., 2009).
In summary, this chapter discussed the different types of dividends that firms pay.
The three fundamental schools of thought pertaining to the dividend decision were
discussed and introduced unique differences to the various theories pertaining to the
dividend decision. Naturally, these differences in theories provided for the formation
of modern finance theories regarding dividend policies such as the clientele and
signalling theories.
In order to set the scope for dividend policy formulation during bull and bear markets
various patterns and trends in dividend policies were highlighted. Considering these
observations and specifically the implication of the signalling and catering theories,
the next chapter provides insight into the research methodology identified in Chapter
one.
As previously mentioned, the methodologies of the Erasmus (2011), Fuller and
Goldstein (2003), Wolmarans (2000), and Ap Gwilym et al. (2000) studies are
Stellenbosch University http://scholar.sun.ac.za

74 | P a g e
replicated and adapted in part. Specific results of these previous studies are updated
and potentially improved by focusing on an additional element, being the effect of
market sentiment during bull and bear markets on the JSE. The result of such
analyses could indicate whether the signalling theory does have support in the South
African market. Furthermore, whether dividend-investing can be used to generate
positive risk-adjusted returns is investigated to determine which dividend payment
strategy delivers the best returns to shareholders.
Stellenbosch University http://scholar.sun.ac.za

75 | P a g e
Chapter 5 : RESEARCH METHODOLOGY
5.1 INTRODUCTION
Chapter one established the research design utilised throughout this study, and
provided for the framework of research performed thus far. This chapter specifically
builds on the foundation established by the previous chapters. The purpose of the
research methodology is to set the guidelines on how relevant information is
acquired for research. Accordingly, this chapter’s objective is to illustrate how
relevant information was gathered, grouped, processed and used in order to achieve
the stated objectives of this study. Furthermore, statistical techniques used to
analyse the data are introduced before the next chapter provides the empirical
results thereof.
The remainder of this chapter consist of five sections. The next section establishes
the orientation of the research performed. The timeline of the study is also
discussed, and its relevance explained. Then the research objectives and
hypotheses are provided, which serve to introduce the statistical techniques. Both
descriptive and inferential statistical analysis techniques are introduced, which serve
to identify common descriptive features of the data gathered and to test relationships
between dependent and independent variables. Before the chapter is concluded, a
brief discussion on the validity and reliability of the data is provided.
5.2 RESEARCH DATA
This study used the McGregor BFA (2010) database for ex-dividend payments
sourced for both listed and delisted firms on the JSE. Some rules were enforced in
the data collection. In this study the sample included listed and delisted shares for
the period 1995 to 2010. Therefore, all firms that were listed during the period under
review were considered, both those that were listed at the end of the period as well
as firms that delisted during it, in order to reduce survivorship bias. Initially all sectors
Stellenbosch University http://scholar.sun.ac.za
76 | P a g e
on the JSE were considered, but eventually the financial and basic material firms
were excluded. The reasons for the exclusions are due to the nature of the financial
statements of these firms, specifically their capital structures. Financial firms are
usually highly regulated in terms of capital requirements, which can also influence
dividend policy. Basic material firms on the other hand are heavily biased due to the
amount of assets required and the nature of their operations. The final sample
consisted of 291 firms providing 22 927 monthly observations. However, as with
most financial data analysed over time, extreme outliers that could have allowed for
the data to be skewed and non-representative of its true nature were initially evident.
Accordingly, the process of winsorizing was utilised in order to ensure that the
outliers did not invalidate the study, nor discard any key characteristics or
observations of the data set.
According to Kokic and Bell (1994) “if by chance several unusually large
observations should fall in the data set then the data analysis findings of the
estimator may grossly overestimate population totals.” Winsorizing is a technique
used to resolve this problem by reducing sampled observations greater than a
specified cut-off limit, and then calculating the estimators for the transformed data
set. The resulting estimator is called the winsorized estimator of a total. Naturally, if a
data set is adjusted inappropriately by winsorizing it, the data can become biased,
potentially invalidating the study. Therefore, careful consideration should be placed
on the extent of transformation when determining the limits for cut-off. Kokic and Bell
(1994) further state that a winsorized estimator may considerably improve the
accuracy and validity of statistical analysis results. They further posit that different
winsorizing cut-offs should be used for different strata to find the most relevant
result, while not compromising the nature of the observations. Therefore, in this
study the data was originally analysed to identify and remove extreme outliers.
Observations in excess of eight standard deviations were identified as extreme
outliers and discarded, which allowed for the remaining top and bottom five per cent
of the data set’s observations to be winsorized.
Recalling from Chapter one, the primary objective of this study was to evaluate the
possible influence dividend pay-out policy has on share returns. The secondary
objectives were also formulated as the following:
Stellenbosch University http://scholar.sun.ac.za

77 | P a g e
• To determine whether returns on shares differ between dividend-paying firms
and non-dividend-paying firms.
• To determine whether the various dividend pay-out policies regarding the size
of dividend payments, as per DY, affect share returns.
• To evaluate the possibility of using dividend-investing strategies during market
movements to earn a higher than market return on a risk-adjusted basis.
Considering the data set utilised and the research objectives stated above, two
portfolios were constructed in this study. They were created based on monthly DY
levels. Portfolio one contained non-dividend-paying firms and was compared against
the second portfolio containing dividend-paying firms (Portfolio two). Figure 5.1
provides for a graphical depiction of the two portfolios constructed.
Figure 5.1: Relevance of dividend payments investigated
Source: Researcher’s own construction
In total 22 927 monthly observations were analysed over the 192 months in the
study. Of this total amount, 24.774% of the observations were found to be non-
dividend-paying and the resulting 75.226% dividend-paying observations, identified
by zero and positive DYs accordingly.
Stellenbosch University http://scholar.sun.ac.za

78 | P a g e
In the next step Portfolio two, representing the dividend-paying firms, were further
sub-categorised to further compare share returns over various DY levels. The
creation of the sub-portfolios, or groups, provided the opportunity to investigate
whether dividend-investing strategies based on DY levels can allow for abnormal
returns, especially during market movements. Therefore, Portfolio one and two were
further analysed by deconstructing the portfolios into four groups. As previously
specified the non-dividend payers were represented by Group 1 and Portfolio two
was grouped into the lowest, medium, and highest DYs for monthly relative DY
rankings and classified as Group 2 to Group 4 accordingly. Figure 5.2 summarises
the classification into the four groups.
Figure 5.2: Comparative analysis of various DY groups
Source: Researcher’s own construction
On a monthly basis, all DYs for listed and delisted firms were ranked according to
size and allocated to the various groups. In this manner, a firm might have been
allocated to various groups over the time period of the study, but will never have
been allocated to more than one group at the same time. These groups collectively
represent the various dividend-investing strategies, which investors can use to
identify with in terms of DY. Their share returns over time provides for the statistical
results provided in the next chapter. Firstly, each DY observation was used to
Stellenbosch University http://scholar.sun.ac.za

79 | P a g e
calculate a TSR in order to provide descriptive data for analysis. Inferential analysis
provided the opportunity to measure risk-adjusted returns for all portfolios and
groups accordingly.
The reason why DY, and not the absolute size of dividend is used, is to prevent size
bias in the study as larger firms can afford to make larger dividend payments yet in
relation to its price will actually be smaller than other smaller firms’ dividend
payments. In order to observe the effect of market movements the JSE ALSi is used
as a proxy for market return. If the return of the market during a month was negative
in relation to the previous month’s value, the month is classified as a bear market. If
the ALSi’s monthly closing level is higher than the previous month, it is classified as
a bull market. By using these classifications, monthly data was captured from the
McGregor BFA (2010) database.
As previously mentioned, the TSRs of each of the portfolios and groups were
calculated for the monthly observations to evaluate the relative performance of the
firms’ shares over time. The descriptive results are discussed later in this chapter,
but used these TSR values to identify key characteristics of the data set. The
equation for the TSR calculation is as follows:
�=)� � ���2>5� � ��2>5��� � �23245647����2>5�
Where:
��2>5� = Share price at the end of the month;
��2>5��� = Share price at the beginning of the month;
�23245647 = Dividends paid out to investor during the month;
t = months.
Using the results obtained from the average TSR and incorporating dividend stability,
measured as the standard deviation of monthly DY observations, provided for the
inputs required to estimate the Sharpe ratio (1966). Sharpe (1966) formulated a
reward-to-variability ratio, which served to provide an estimate of returns over and
above the stated risk associated in returns. This ratio has had a variety of names
over the years such as the Sharpe index, the Sharpe measure, and the reward-to-
Stellenbosch University http://scholar.sun.ac.za

80 | P a g e
variability ratio (Sharpe, 1966). However, the most recent term used is the “Sharpe
ratio”, and it is calculated using the previously mentioned average TSR and dividend
stability as follows:
=� � )"?@A � )B=��
Where =� represents the Sharpe ratio for the time period t, )"?@A the return on the
specified portfolio, or group being investigated, )B the return on a risk-free short-term
South African bond, and =�� the dividend stability measure as explained previously.
This ratio was applied in the descriptive analysis of data in order to compare the
performances of the various portfolios and groups during bull and bear markets.
These descriptive results are then further tested and analysed using inferential
analyses discussed later in the study when risk-adjusted returns are calculated.
As mentioned, data was collected on a monthly basis over the period of 16 years,
ranging from 1995 to 2010. The reasons why no observations were taken from
previous periods are briefly explained in the following part of the chapter before
statistical analysis techniques are introduced.
5.2.2 TIME PERIOD OF THE STUDY
There are a couple of noteworthy reasons for the choice of the period under review
in this study. Firstly, a vast array of trade sanctions was imposed on South African
firms before 1994, which created severe market conditions not conducive for healthy
trade. Prior to 1994, listed firms on the JSE were unable to invest unrestrictedly in
foreign markets. The sanction’s impact on the JSE firms was worsened due to the
exchange controls that were in place at the time, and as a result listed firms had no
other choice but to invest only in the domestic market. This subsequently caused
severe “in-breeding” in the capital market as the majority of shares were owned by a
select few firms (Du Toit, 2009; Msweli-Mbanga and Mkhize, 2006). Figure 5.3
illustrates this notion.
Stellenbosch University http://scholar.sun.ac.za
Figure 5.3: Volume traded on the JSE in Million
Source: Du Toit (2009)
As depicted in the figure, these sanctions
in years prior to 1995. To illustrate
JSE comprised roughly 80% of the capitalised value of
2009). In this figure, increased trading activity post the sanction
from 1994 onwards in terms of volume traded on the JSE
improve reliability of the data findings, only years
considered in this study.
A second reason for the time period is due to signif
the JSE in 1994, which would
implementation. Figures 5.4
period when the volatility in the DY
1994 onwards. Prior to 1995, it can be observed that the data did
significantly.
81 | P a g e
Volume traded on the JSE in Million 1990-2005
As depicted in the figure, these sanctions caused the market to be very thinly traded
To illustrate this, it was found that the top four firms on the
roughly 80% of the capitalised value of the JSE at the
this figure, increased trading activity post the sanctions
from 1994 onwards in terms of volume traded on the JSE. Therefore, in order to
improve reliability of the data findings, only years from 1995 and onwards were
A second reason for the time period is due to significant infrastructure changes
which would have compromised data prior and post t
4 and 5.5 provide for further support for the
volatility in the DY and EY, and growth in value are
1995, it can be observed that the data did
aused the market to be very thinly traded
this, it was found that the top four firms on the
the JSE at the time (Du Toit,
can be observed
Therefore, in order to
1995 and onwards were
icant infrastructure changes on
data prior and post the
for the selected time
are illustrated from
1995, it can be observed that the data did not fluctuate
Stellenbosch University http://scholar.sun.ac.za

Figure 5.4: Earnings and
Source: Du Toit (2009)
Figure 5.5: Closing values for the
Source: Du Toit (2009)
Accordingly, only 1995 onwards
be seen from the figures that
This time frame is expected to improve pri
(2000), and make the study more representative of the
investing in South Africa. In comparison to the
also include the implementation of STC, CGT, th
2008, and new trends in cash
%
82 | P a g e
Earnings and DY growth 1990-2005
Closing values for the JSE ALSi 1990-2005
onwards to 2010 were considered in this study
that this is when trade and activity increased significantly.
expected to improve prior information gathered by Wolma
the study more representative of the possible use of dividend
n comparison to the Wolmarans (2000) study
include the implementation of STC, CGT, the effects of the financial crisi
2008, and new trends in cash-to-asset ratios identified by Bates et al.
in this study, since it can
when trade and activity increased significantly.
or information gathered by Wolmarans
possible use of dividend-
study, simulations
e effects of the financial crisis of
et al. (2009:1985).
Stellenbosch University http://scholar.sun.ac.za

83 | P a g e
Chapter four previously identified valuation measures used in this study. Reference
was made to how DY and dividend stability is calculated in this study. In this chapter
the TSR and Sharpe ratio have been introduced. However, in order to convert these
data inputs into useful information, the use of statistical analysis techniques are
introduced. The analysis serves to formally address the research objectives and
hypothesis identified next.
5.3 RESEARCH OBJECTIVES AND HYPOTHESIS
As indicated in previous chapters, for this study the independent variables used are
dividend distributions measured in DY during bull and bear markets. The dependent
variable is the monthly risk-adjusted share return measured for the various DY
groups.
Based on the before-mentioned research objectives and these variables the null
hypothesis and alternative hypothesis of the study were stipulated in Chapter one as
follows:
�� : Dividend distributions have no significant influence on share returns.
�� : Dividend distributions have significant influence on share returns.
Cooper and Schindler (1998:449) state that the null hypothesis is valid when no
difference or relationship exists between a population parameter and a sample
statistic being compared to it. The alternative hypothesis is valid when differences or
relationships do exist. Therefore, inferential statistical analysis conducted in this
study will determine whether statistically significant positive risk-adjusted returns can
be generated in order to reject the null hypothesis.
In line with the stated hypothesis the need for statistical analysis becomes clear. In
the following section of this chapter, statistical analysis techniques are introduced.
Descriptive statistics will consider basic characteristics inherent in the data set,
before the inferential analyses determine the degree of differences or relationships
Stellenbosch University http://scholar.sun.ac.za

84 | P a g e
between observations (O’Leary 2005:238). The results of these statistics are then
portrayed and discussed in Chapter six.
5.4 STATISTICAL ANALYSIS TECHNIQUES
5.4.1 DESCRIPTIVE STATISTICS
Descriptive statistics can be broken into three main components, consisting of the
spread, location and shape of the data set (Blumberg et al., 2008). O’Leary (2005)
provides for a similar description when he refers to the measures of central
tendency, dispersion, and shape of the data. These descriptive statistics are
introduced next, and the results when applied to TSRs and DY provided in Chapter
six.
5.4.1.1 Measuring central tendency
Central tendency can be evaluated by means of the mean, median and mode of a
data set. The mode of a data set is the most common observation, but not always
the most significant. Given the size of the data set, this study does not consider the
mode further. On the other hand the mean and median can provide for valuable
information. The mean of a data set can be referred to as the mathematical average
(O’Leary, 2005:239). It is calculated by adding the observations and dividing it by the
number of observations (Keller, 2005:90).
The median identifies the mid-point of a range (Coldwell and Herbst, 2004:103).
According to the authors it is calculated by rearranging the data in ascending, or
descending order and then to find the middle value. Figure 5.6 illustrates how these
measures can be distributed in relation to one another.
Stellenbosch University http://scholar.sun.ac.za

85 | P a g e
Figure 5.6: Shape of the data
Source: Researcher’s own construction
As illustrated in figure 5.6, the measures of central tendency can be used to
determine whether or not a data set is normally distributed. When the mean of the
data set is larger than the median the data set can be described as positively
skewed. On the other hand, if the median is found to be larger than the mean, the
data set is negatively skewed. The skewness of a data set can have significant
implications on data analysis, but this topic is discussed later when the shape of the
data set is discussed.
5.4.1.2 Measuring dispersion
While measures of central tendency are useful for data descriptions in general they
need to be complemented with information on response variability. The methods
used in this study to indicate dispersion around the mean and median are the range,
variance and standard deviation (O’Leary, 2005:240-241).
The range defines the spread of the data and is the distance between the largest
and smallest values of a sample frequency distribution (Hair, Money, Samouel, and
Page, 2007:319). Hair et al. (2007:319) further state that it can be used to identify
the end-points of the sample distribution. The shortcoming of this measure is that it is
a very rough indicator as it only considers two values – the minimum and maximum
(Blumberg et al., 2008). Accordingly the range may indicate homogeneity (small
standard deviations) or heterogeneity (large standard deviations) of the distribution
Mode, median, mean Mode median mean
Normal Skewed
Stellenbosch University http://scholar.sun.ac.za

86 | P a g e
(Cooper and Schindler, 1998:467). Therefore, the range is useful but a limited
measure of all the data in the distribution.
The other measures used to identify dispersion are variance and standard deviation.
These are known as measures of variability, and are used to characterise the
dispersion of a set of data points around its mean (Blumberg et al., 2008). O’Leary
(2005:240) states that it represents the average squared deviation from the mean.
This can be illustrated in the equation:
C � DC$ � ∑�F � FG�6 � 1
Where:
C = historic standard deviation;
C$ = variance;
F = each value in the data set;
FG = mean of all the values in the data set; and
6 = total number of values in the data set.
Unfortunately the problem with using the variance is that it can provide for large
values that complicate analysis. To address this problem the standard deviation is
used, which is the square root of variance. As previously specified standard
deviation could be used in financial analysis, and this study, as an indication of
riskiness since it provides an indication of the degree of variation around the mean.
Hence if the variation is large, inherent risk is present that returns can deviate
substantially from the expected return. Lastly, the shape of the data set can also be
assessed with descriptive statistics.
5.4.1.3 Measuring the shape of the data
The final component of descriptive statistics relates to the shape of the data. This
also complements the previous measures by identifying how data is distributed. Two
measures considered in this study are skewness and kurtosis.
Stellenbosch University http://scholar.sun.ac.za

87 | P a g e
Skewness measures the departure from a symmetrical (or balance) distribution (Hair
et al., 2007:320). Figure 5.6 identified in the previous part of the section provided for
an illustration of when data is symmetrical. Specifically, this was when the median,
mean and mode were equal to one another. If the data is skewed, then the estimated
values will differ. Hair et al. (2007) further state that when the tail of the curve
stretches left it is said to be negatively skewed. If it stretches to the right it is then
positively skewed. If the kurtosis estimator is greater than +1, or less than -1 the data
exhibits a substantially skewed distribution. The skewness of a distribution is
relevant to researchers as it indicates whether a given value in the data set will be
more or less than the mean and will allow the researcher to see if the data is
parametric or non-parametric. These observations can influence the data analysis as
relevant techniques must be utilised for data to produce relevant findings. Kurtosis is
a measure of a distribution’s peakedness or flatness. This is illustrated in figure 5.7.
Positive kurtosis
Negative kurtosis
Kurtosis
Figure 5.7: Kurtosis in a data set
Source: Researcher’s own construction
Kurtosis is used in relation to a normally distributed data set and is implemented to
identify by how much the distribution deviates from the standard normal distribution.
If the curve is more peaked than the normal distribution curve, it indicates positive
kurtosis. On the other hand, if it is flatter in comparison, it illustrates negative
kurtosis. A curve is too peaked when the kurtosis exceeds +3 and too flat when it is
below -3 (Hair et al., 2007:321). As previously mentioned, these two measures allow
the researcher to identify the effect of outliers and the nature of the data set. A data
Stellenbosch University http://scholar.sun.ac.za
88 | P a g e
set containing excessive flatness will indicate many outliers to the left and right of the
mean; whereas a peaked shape indicates that most observations are close to the
mean of the study.
As previously mentioned, these descriptive statistics are applied to TSRs calculated
for the DY observations to identify key characteristics of the data set. In order to
measure the significance of these the study requires inferential analysis to be
performed. The inferential statistics, therefore, serve the function of confirming
results found in descriptive statistics.
5.4.2 INFERENTIAL STATISTICS
Inferential statistics are used to test relationships and differences between
dependent and independent variables. According to McDaniel and Gates (2001:413)
the basic principle of statistical inference is that it is possible for numbers to be
different in a mathematical sense (as identified in the descriptive statistics), but not
significantly different in a statistical sense. Statistical differences are identified by a
chosen level of significance or alternatively, a confidence level (Blumberg et al.,
2008). This level of significance identifies how probable a result is due to chance. In
this study a 5% level of significance was used, which means that the confidence
level would be stated as 95%.
Cant et al. (2005:223) posit that the level of significance should always be compared
with the p-value of a test statistic. This p-value, according to them, is the “probability
of obtaining a test statistic value equal or greater than the value actually obtained if
the null hypothesis is actually true.” Accordingly the p-value represents the level of
significance where the null hypothesis can be rejected. Since this study uses a 5%
level of significance, any p-value smaller than 0.05 is significant. Blumberg et al.
(2008) furthermore state that the lower the p-value, the stronger the evidence
against the null hypothesis and vice versa.
The inferential statistic used in this study relates to regression analyses. These tests
are referred to as inferential statistics, because they analyse relationships between
Stellenbosch University http://scholar.sun.ac.za

89 | P a g e
variables as per the properties of the target population. In order to understand the
relationships between the independent and dependent variables four concepts must
be understood (Hair et al., 2007:356). They are the presence and nature of the
relationship, and then the direction and strength of association.
According to Hair et al. (2007) presence assesses whether a systematic relationship
exists between two variables. This is measured in terms of the level of statistical
significance mentioned previously. The chosen level of significance in a study is an
inverse function of the risk the researcher is willing to accept. In other words, a large
level of significance will require a low level of risk, and vice versa. The second
important concept is how variables are related to one another. Usually it would be
either linear (a straight line), or non-linear (curvilinear). The strength and nature of
the relationship will be the same over the range of variables if the relationship is
linear. Alternatively, the relationships vary according to the curvature present. The
direction of a relationship can be positive or negative. Positive relationships indicate
that the variables move in the same direction and negative relationships the
opposite. The direction has great impact on the data finding, especially for financial
data as it has been found in previous studies that financial data and economic data
are closely linked (Fuller and Goldstein, 2003). Finally, the strength of the
relationship measures the association between the variables (Hair et al., 2007:357).
This is where correlation analysis becomes most valuable in the sense that when
variables are linked together, they exhibit covariation. The correlation coefficient
measures the degree of covariation between two variables. It indicates the
relationship and strength. Unfortunately, sometimes these answers do not provide
enough information for managers to make proper decisions and this is why
regression analysis is performed (Hair et al., 2007:367).
As indicated, this study does not consider correlation analysis, but rather regression
analysis. More specifically an ordinary least squares (OLS) regression was applied
based on the capital asset pricing model (CAPM) using risk-adjusted share returns.
The next section discusses this inferential statistic further.
Stellenbosch University http://scholar.sun.ac.za
90 | P a g e
5.4.2.1 Regression analysis
Previously, the independent variables used in this study were identified as dividend
distributions during bull and bear markets. They are estimated by firm-specific DY
and market movements as changes in the ALSi on the JSE respectively. The
dependent variable is the monthly risk-adjusted share return measured for the
various DY groups.
Hair et al. (2007:177) state that the objective of regression analysis is to predict a
single dependent variable by using the independent variables. These regressions
are either identified as being simple or multiple, depending on the number of
independent variables present. If a regression model considers only one
independent variable, it is classified as a simple regression.
In simple regressions the regression coefficient identifies the variation in the
dependent variable in terms of the one independent variable (Blumberg et al., 2008).
The regression model used in this study can be expressed as follows:
H)I� � )B�J � KL� ML H)N� � )B�J � O� Where:
H)I� � )B�J = represents the risk-adjusted return on a portfolio or group;
KL = represents the intercept;
ML = represents the regression coefficient;
H)N� � )B�J = represents the market-risk premium;
t = time;
O� = a random-error term.
The intercept and the regression coefficient represent the y-axis intercept and the
slope of the regressions trend line. They are both calculated using the OLS model.
Given that the CAPM holds, α and β values represent risk-adjusted returns and
systematic risk for both portfolios and four groups respectively. From the equation
)I� equals the average monthly )"?@A as per sub-portfolio or group specified in the
portfolios. )B represent the monthly risk-free rate, and )N� the monthly return
Stellenbosch University http://scholar.sun.ac.za

91 | P a g e
available in the market. This market rate is the corresponding monthly return on the
ALSi as specified earlier in the chapter.
This regression is conducted on both portfolios and respective DY groups to
investigate whether or not α and β can be positive and statistically significant, which
will indicate that using dividend-investing can result in positive risk-adjusted returns.
Chapter six is devoted to performing the data analysis, but to ensure that the findings
are relevant, validity and reliability need to be assured.
5.5 VALIDITY AND RELIABILITY
As a general rule, truly scientific statements should be both reliable and valid
(Coldwell and Herbst, 2004:17). Research performed in this study was analysed in
great depth to ensure validity. Care was taken in deciding on the data used for
analysis and how the results were portrayed in an ethical manner. As all data used
were from public sources and as such in the public domain, the research had
minimal ethical risks and as such no ethical clearance was needed. Standardised
financial reports were used in order to ensure that the information of firms was in
uniform accounting formats. Usually different databases have different rules in the
processing of information and thus, by using only one database, the reliability of the
information is improved. Accordingly, the data for this study was finally sourced from
the McGregor BFA database (2010), as to ensure consistent information.
By considering both listed and delisted firms in the analysis any level of survivorship
should be maintained. As previously mentioned, the study also only considered
financial data post 1995 in order to limit the effect of any external factors and
unsystematic risks present in the market prior to this date.
In order to ensure that the regression model applied was valid assumptions were
required. The assumptions used for the OLS regression include the following Hair et
al. (2007):
Stellenbosch University http://scholar.sun.ac.za

92 | P a g e
• Observations are independently distributed.
• The regression error for one period is uncorrelated with the regression error
for all other periods.
• The time series analysed is covariance stationary.
• Seasonality in the observations is not present.
• There is no random walk, unit root or drift present in the time series data.
For a data set to be covariance stationary it must satisfy three principal requirements
(Clayman et al., 2009:404). Firstly, the expected value of the time series must be
constant and finite over all periods. Secondly, the variance of the time series must be
constant and finite in all periods. Lastly, the covariance of the time series with itself
for a number of periods in the past or future must be constant and finite over all
periods. As long as these assumptions are held, an autoregressive (AR) model could
be estimated using OLS.
Generally, auto-correlation can significantly influence the inferential statistics used in
a study. It refers to the observance of error terms correlated over time. In other
words, one observation will have an influence on the next value. In order to test for
auto-correlation the Durbin Watson value can be used. If this value is estimated as
two, then auto-correlation is not significance and the OLS assumptions held.
Accordingly, preliminary regression results based on the data used in the two
portfolios and four groups indicated that the Durbin Watson statistic for the data set
was found to appropriate. Hence, auto-correlation was not significant and OLS
regression could be applied.
The next section serves to conclude this chapter by referring to important topics
discussed thus far, and also introduces Chapter six more formally.
Stellenbosch University http://scholar.sun.ac.za

93 | P a g e
5.6 CONCLUSION
The research performed in this study attempts to provide more clarity on the
influence dividend distributions have on share value. Shareholders and investors
should be able to use the information gathered from this study to actively manage
their expectations of dividend information. Similarly, management of firms could
make more informed decisions regarding their dividend pay-out decision by taking
into consideration the effect of market movements on share returns. Academics
could possibly use this study as a benchmark, specifically for analysing South
African dividend pay-out policies of firms listed on the JSE.
This chapter in particular identified how all relevant data was acquired and analysed
using descriptive and inferential statistics. It was also mentioned that in order to
standardise the data set, a single primary source was used – McGregor BFA (2010).
Due to the nature of listed and delisted firms on the JSE for the period 1995 to 2010
and the volatility in their share data some coding was required on the data set.
Firstly, observations exceeding eight standard deviations were omitted, before the
process of winsorizing was utilised to the top and bottom five per cent of the data.
Finally, following the appropriate transformations two portfolios and DY groups were
constructed and ultimately analysed over both bull and bear markets.
Various descriptive and inferential statistics were introduced and explained. How
these statistics test the data, and why the various statistical techniques are applied
was explained. Regarding the descriptive statistics, the spread, location and shape
were discussed. The inferential statistics discussed four crucial concepts and
identified the applicable OLS regression used in this study.
This data analysis, of which the empirical results are provided for in the next chapter,
will provide the relevant information needed to make concluding comments and
remarks for the study. Chapter seven will conclude the study by providing for a
summary of important issues identified and resolved throughout the study.
Stellenbosch University http://scholar.sun.ac.za

94 | P a g e
Chapter 6 : EMPIRICAL RESULTS
6.1 INTRODUCTION
This penultimate chapter discusses results found after descriptive and inferential
data analyses have been performed. Findings are presented with the use of
explanatory tables and figures, and are discussed in line with stated research
objectives.
In order to provide any results obtained from the statistical analysis on a data set, the
data first need to be sourced, coded, and prepared. Recalling from Chapter five,
Blumberg et al. (2008) state that “data analysis involves the reducing of accumulated
data into meaningful amounts, developing summaries, looking for patterns, and
applying statistical techniques.”
The previous chapter explained that by using a standardised data set, two portfolios
were constructed using DY information of 22 927 monthly observations. These
observations were then ranked according to their relative DY level for each month
and analysed in terms of their respective returns. For the descriptive analyses TSRs
were estimated and compared. For the inferential analyses, the OLS regression
based on the CAPM provided for estimates representing risk-adjusted returns (α)
and indication of systematic risk (β). In both statistical analyses the effects of
dividend distributions were investigated by comparing two portfolios and four DY
groups. These four groups were specifically created in order to investigate the
influence of dividend distributions during bull and bear markets and to test the results
of dividend-investing strategies. The results obtained after performing the statistical
analyses are discussed in this chapter.
The structure for the rest of the chapter is organised based upon the two portfolios
and groups accordingly. Firstly, the results of descriptive statistical analysis are
provided for each portfolio and respective groups before the findings of the inferential
statistical analyses are presented. These results for the entire time span of the study
Stellenbosch University http://scholar.sun.ac.za

95 | P a g e
are discussed first, before elaborating upon the effect of market movements on the
various groups alone. Based on the results obtained for the portfolios it should be
possible to address the primary and secondary research objectives of the study.
Finally, the chapter is concluded with a summary of important topics discussed.
6.2 DESCRIPTIVE STATISTICS
Collis and Hussey (2009:221) define descriptive statistics as “a group of statistical
methods used to summarise, describe, or display quantitative data.” In this section of
the chapter the descriptive results for the measures of central tendency, dispersion,
and shape are specified. Furthermore, the Sharpe ratio’s result, as introduced in the
previous chapter is also specified.
As mentioned, the basic descriptive statistical results pertaining to the TSRs for the
time period under review are discussed for each portfolio before the discussion turns
to the results obtained from the four DY groups. The results obtained from the
portfolios and groups serves as the prelude to the inferential results, discussed later
on.
In table 6.1 the results of the descriptive statistics pertaining to TSRs for the two
portfolios containing non-dividend-payers (Portfolio one) and dividend-payers
(Portfolio two) are provided and compared against the risk-free rate and market
return. Table 6.2 also provides the TSR descriptive statistics for the four DY groups
used to investigate dividend-investing, and analyse the effect of market movements
later in this chapter. These tables are referred to throughout the descriptive results
and explained accordingly.
Stellenbosch University http://scholar.sun.ac.za

96 | P a g e
Table 6.1: Descriptive statistics for Portfolio one and Portfolio two
Portfolio one
(Non-dividends)
Portfolio two
(Dividends) Risk-free rate Market return
Average DY (%) 0.000 3.850 - -
Average (%) 0.783 1.599 0.945 1.372
Median (%) 1.199 1.949 0.867 1.775
Minimum (%) -16.302 -20.620 0.593 -19.573
Maximum (%) 21.508 11.888 1.525 12.330
Range (%) 37.810 32.508 0.932 31.903
Variance (%) 31.830 23.248 0.069 21.719
Std deviation (%) 5.642 4.822 0.263 4.660
Sharpe -0.029 0.136 - 0.092
Skewness 0.149 -0.813 0.354 -0.718
Kurtosis 1.136 1.994 -1.360 1.951
Table 6.2: Descriptive statistics for DY groups
Portfolio one Portfolio two Risk-free
rate
Market
return Group 1 (Zero) Group 2 (Low) Group 3 (Med) Group 4 (High)
Average DY (%) 0.000 1.901 3.519 6.148 - -
Average (%) 0.783 1.309 1.573 1.909 0.945 1.372
Median (%) 1.199 1.967 1.482 2.186 0.867 1.775
Minimum (%) -16.302 -24.601 -19.991 -17.287 0.593 -19.573
Maximum (%) 21.508 13.477 18.148 11.903 1.525 12.330
Range (%) 37.810 38.078 38.139 29.190 0.932 31.903
Variance (%) 31.830 27.595 27.944 26.295 0.069 21.719
Std deviation (%) 5.642 5.253 5.286 5.128 0.263 4.660
Sharpe -0.029 0.069 0.119 0.188 - 0.092
Skewness 0.149 -0.900 -0.383 -0.753 0.354 -0.718
Kurtosis 1.136 2.644 1.305 1.131 -1.360 1.951
Stellenbosch University http://scholar.sun.ac.za

97 | P a g e
In both tables the first section identifies the average monthly DY found observed for
the two portfolios and four DY groups. Naturally, the non-dividend payers average
DY was found to be zero, indicating no data errors were made in the categorisation
of non-dividend payers. Portfolio two, which is further sub-categorised into low,
medium, and high DY firms, indicated an average monthly DY of 3.854%. These
values are useful in the sense that it provides for a relative benchmark in identifying
the average level of dividend payers. The remaining descriptive results, however,
focus on the results pertains to TSR.
The descriptive results provided in table 6.1 and 6.2 contribute to meaningful
inferential analysis, since the descriptive findings plays an important role when
determining the relevant inferential analysis techniques to be applied. Next, these
findings for central tendency, degree of dispersion, and shape of the data set as
represented in table 6.1 and table 6.2 are discussed in line with the results found.
6.2.1 CENTRAL TENDENCY
As stipulated in Chapter five, for the purpose of this study, central tendency is
measured in terms of the data set’s mean and median. Individually, these measures
can provide for valuable information, but when they are considered collectively the
most meaningful data is provided. For example, when a data set is parametric, or
normally distributed, the measures of central tendency for the data set will be equal.
Alternatively, the data will be non-parametric - the measures of central tendency
differ. The average or mean is usually the most commonly used measure of central
tendency.
As mentioned previously, the mean TSR of each portfolio and group is depicted in
table 6.1 and 6.2. Figure 6.1 contributes to the discussion of results obtained by
providing a graphical depiction of the annualised TSR performances for Portfolio one
compared to Portfolio two.
Stellenbosch University http://scholar.sun.ac.za

Figure 6.1: Relative annual
From figure 6.1 it can be seen that
firms, performed better than
1.599% versus 0.783%. From table 6.1 and 6.2 th
risk-free rate and ALSi market
average TSR (1.599%) was greater than
of the market return of 1.37
found to be less than the risk
indication of the relative outperformance of dividend
In table 6.1 the average TSR
indication of negatively skewed data.
1.199%, versus its average
1.949%, in relation to the average
the data set discusses this negative shape in more detail.
From the results reported
Group 4 with an average TSR of
are not entirely surprising and support
payments and its supposed influence on share values
each DY group is depicted
relative performances over the 192 months.
98 | P a g e
annual TSR for the two portfolios
it can be seen that Portfolio two, representing the dividend
than Portfolio one with an average annualised
From table 6.1 and 6.2 the average TSRs,
ALSi market return provided important results. Portfolio
was greater than the risk-free rate of 0.945%
of the market return of 1.372%. On the other hand, the returns of Port
found to be less than the risk-free rate and the market return. The result provides an
indication of the relative outperformance of dividend payers over the research period
TSR values was smaller than the median
indication of negatively skewed data. This is illustrated by Portfolio one’s
versus its average TSR of 0.783%. Also, the dividend-payers
in relation to the average TSR of 1.599%. Later in this section the shape of
the data set discusses this negative shape in more detail.
in table 6.2, the best performing group
with an average TSR of 1.909%. Similar to previous results
surprising and support studies performed on the level of dividend
payments and its supposed influence on share values. The annualised TSR’s for
is depicted in figure 6.2 and serves as a graphical depiction of
formances over the 192 months.
the dividend-paying
annualised TSR of
average TSRs, in relation to the
results. Portfolio two’s
%, as well as that
of Portfolio one was
e result provides an
payers over the research period.
was smaller than the medians, providing an
Portfolio one’s median of
payers median was
Later in this section the shape of
was found to be
previous results, these results
studies performed on the level of dividend
annualised TSR’s for
a graphical depiction of
Stellenbosch University http://scholar.sun.ac.za
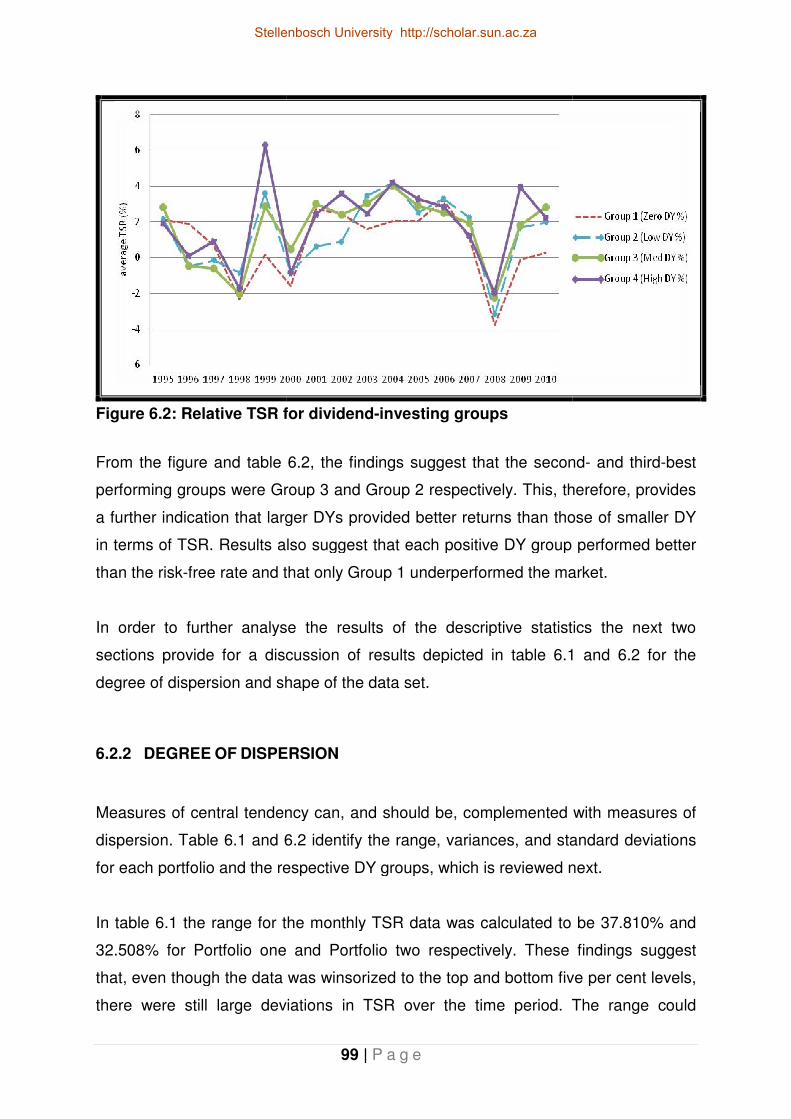
Figure 6.2: Relative TSR for
From the figure and table 6.2, t
performing groups were Group 3
a further indication that larger DYs provided better returns than th
in terms of TSR. Results also suggest that each positive DY
than the risk-free rate and that o
In order to further analyse the results of the descriptive
sections provide for a discussion of
degree of dispersion and shape of the data set.
6.2.2 DEGREE OF DISPERSION
Measures of central tendency can, and should be, complemented with measures of
dispersion. Table 6.1 and 6.2 identify the range, variances, and standard deviations
for each portfolio and the respective DY groups, which is
In table 6.1 the range for the monthly
32.508% for Portfolio one
that, even though the data was winsorized to the top and bottom five per cent
there were still large deviations in
99 | P a g e
TSR for dividend-investing groups
From the figure and table 6.2, the findings suggest that the second
roup 3 and Group 2 respectively. This, therefore,
that larger DYs provided better returns than those
Results also suggest that each positive DY group performed better
and that only Group 1 underperformed the market.
In order to further analyse the results of the descriptive statistics
for a discussion of results depicted in table 6.1 and 6.2
rsion and shape of the data set.
DISPERSION
Measures of central tendency can, and should be, complemented with measures of
dispersion. Table 6.1 and 6.2 identify the range, variances, and standard deviations
for each portfolio and the respective DY groups, which is reviewed next.
range for the monthly TSR data was calculated to be 37.8
08% for Portfolio one and Portfolio two respectively. These findings suggest
even though the data was winsorized to the top and bottom five per cent
large deviations in TSR over the time period. The range could
that the second- and third-best
. This, therefore, provides
ose of smaller DY
group performed better
underperformed the market.
statistics the next two
depicted in table 6.1 and 6.2 for the
Measures of central tendency can, and should be, complemented with measures of
dispersion. Table 6.1 and 6.2 identify the range, variances, and standard deviations
reviewed next.
data was calculated to be 37.810% and
. These findings suggest
even though the data was winsorized to the top and bottom five per cent levels,
. The range could
Stellenbosch University http://scholar.sun.ac.za

100 | P a g e
therefore indicate that the data set illustrates a degree of heterogeneity. However,
the range is not seen as the most useful indicator of dispersion and thus the variance
and standard deviation were also considered. The variance and standard deviations
for Portfolio one were calculated as 31.830% and 5.642% respectively. Portfolio two,
on the other hand, yielded results of 23.248% and 4.822% for variance and standard
deviation. As stated previously, due to the size of the variance, this study uses the
standard deviations for risk estimates as it represents the data set more accurately
when heterogeneity (large standard deviations) is present.
Considering the descriptive results obtained thus far, the findings suggest that
Portfolio one contained greater risk, as per standard deviation, and less TSR
compared to Portfolio two. Clearly, Portfolio two outperformed in relation, and this
was proven with the use of a risk-adjusted return measure, namely the Sharpe ratio.
This ratio indicated a return of 13.560% for positive DYs against a negative -2.870%
return for the non-dividend-payers. In summary, the risk of Portfolio one in relation
to Portfolio two was not found to be appropriately compensated for by the TSR’s.
In table 6.2 the various DY groups were analysed and the descriptive statistics
provided further explanation why Group 1 and Group 2 provided for the poorest
results. These groups were found to exhibit the greatest degree of variability in
relation to their respective returns. In other words, these groups had the greatest
degree of risk, yet the lowest level of TSR. The standard deviation for Group 1 was
the highest (5.642%), and for Group 4 the lowest (5.128%). Further indication of this
weak relative performance between these two groups can be seen in the results
indicated by the Sharpe ratio. Group 1 had a negative estimate (-2.870%) versus the
positive Group 4 result (18.800%). The only groups to outperform the market
average were, not surprisingly, Group 3 and Group 4.
In conclusion, for the results obtained from table 6.2 for the degree of dispersion,
only Group 1 provided a negative Sharpe ratio. Again it was found that the larger DY
sub-portfolios outperformed the non-dividend-payers, with Group 3 and Group 4 both
outperforming the reference market-return on a risk-adjusted basis. These results
support the previous results that the dividend-paying group outperformed the non-
dividend-paying group, even on a risk-adjusted basis.
Stellenbosch University http://scholar.sun.ac.za

101 | P a g e
The final measure of descriptive analysis included the shape of the data set and this
is discussed in the next section.
6.2.3 SHAPE OF THE DATA SET
The shape of the data set is the final aspect in the descriptive analysis and also
complements the previous measures by identifying how the data is distributed. As
explained in the previous chapter, skewness and kurtosis are the two measures
used in this study to investigate the shape of the data set.
In table 6.1 it can be seen that the portfolios indicated both positive skewness
(0.149) for Portfolio one and negative skewness (-0.813) for Portfolio two. These
findings suggest that Portfolio one’s distribution has been found to be relatively close
to a normal distribution, but that Portfolio two’s distribution indicates a negatively
shaped distribution. This finding is supported by the previous findings for the average
and median, explaining why the distribution stretches to the left. The analysis
indicated a relatively flat kurtosis (1.136) for Portfolio one, and a slightly more
peaked shape for Portfolio two (1.994), indicating that there was no severe peakness
or flatness.
In comparing the four groups, not surprisingly, similar findings were found, indicating
negative skewness and a relatively flat kurtosis, but still not excessive for the overall
data set. In this analysis, the medians were also found to be greater than the
averages, substantiated with the negative finding for skewness. The kurtosis for all
the groups do indicate that the shape of the distribution is slightly flatter than usual,
hence the effect of outliers on the outer range of the curve. Most importantly, no
excessive kurtosis or skewness was found in any of the groups.
In conclusion, the descriptive statistics for both portfolios, and the respective DY
groups, indicate that the distributions of the TSR observations are negatively
skewed. However, the distribution is not at an excessive level. Portfolio one
underperformed against Portfolio two and this result was substantiated by the
outperformance of positive DY groups in relation to Group 1. Non-dividend payers
Stellenbosch University http://scholar.sun.ac.za

102 | P a g e
not only had a lower return in comparison, but also presented a higher level of risk.
This could be interpreted as an indication that on average, dividend payment
enhanced share returns. This finding links to the primary objective of the study.
Furthermore, by comparing the different DY groups, the best performing group on a
risk-adjusted basis was found to be the highest DY group (Group 4). This finding
suggests that in order to capture the most value from dividend payments, a firm
needs to consider making large dividend payments. Inferential analysis results,
provided later on, will address how significant this supposed relationship is.
An important secondary objective of this study, however, was to determine the extent
to which market movements influence share returns when regarding dividend
payments. Accordingly, the next section of the descriptive statistics considers the
impact of bull and bear market movements. First the two portfolios are compared to
understand what the differences are in results obtained during the two market
movements, before analysing the four groups of dividend-investing strategies in
greater detail.
6.2.4 MARKET MOVEMENTS ANALYSIS
In this section the two portfolios are evaluated by considering the descriptive results
obtained during market movements. In order to compare their performances over
bull and bear markets, the data set comprising of 192 months were separated into
subsets. Bear markets were classified in terms of a decline in the ALSi from the
previous month’s level, and bull markets when the ALSi increased.
An important consideration for financial markets is that market cycles tend to
increase and decline over time, but not necessarily in that order. Therefore, the bull
and bear markets are not necessarily sequential, and the results might not be based
upon consecutive months, but rather collective monthly observations for the market
classifications. In total the 192 months provided for 113 bull months, and 79 bear
months. These subsets where then applied to the portfolios and groups to
investigate any differences in TSR performance over the two market conditions.
Stellenbosch University http://scholar.sun.ac.za

103 | P a g e
Table 6.3 provides the descriptive statistics for central tendency and dispersion for
portfolio one and two, split between bull and bear markets.
Table 6.3: Comparative market analysis for the two portfolios
Market movements
Bear Bull
Portfolio one Portfolio two Portfolio one Portfolio two
Average DY (%) 0.000 3.910 0.000 3.820
Average (%) -1.861 -1.485 2.632 3.755
Median (%) -1.639 -1.150 2.396 4.114
Minimum (%) -16.302 -20.620 -8.730 -5.270
Maximum (%) 8.109 9.557 21.508 11.888
Range (%) 24.411 30.177 30.239 17.159
Variance (%) 28.281 21.638 26.205 13.180
Std deviation (%) 5.318 4.652 5.119 3.630
Sharpe
-0.526 -0.520
0.328 0.772
In terms of central tendency, Portfolio one again underperformed with average TSR
values of -1.861% and 2.632% for bear and bull markets respectively. In
comparison, Portfolio two provided an average TSR of -1.485% during bear markets
and 3.755% during bull markets. Similar results previously found for the degree of
dispersion around the mean were also found for the two portfolios. Portfolio two
provided a lower degree of risk, measured in terms of standard deviation, with
4.652% and 3.630% for bear and bull markets respectively. Portfolio one, on the
other hand, had higher standard deviations with 5.318% and 5.119% for the two
market conditions.
Collectively, these measures of central tendency and dispersion are used again to
calculate the Sharpe ratio. The resulting values indicate that on a risk-adjusted basis
Portfolio two’s return provided better results compared to Portfolio one, the risk-free
rate and the market rate. In comparing the Sharpe ratio over bull and bear markets,
an important finding was observed. This ratio provided very similar results for both of
Stellenbosch University http://scholar.sun.ac.za
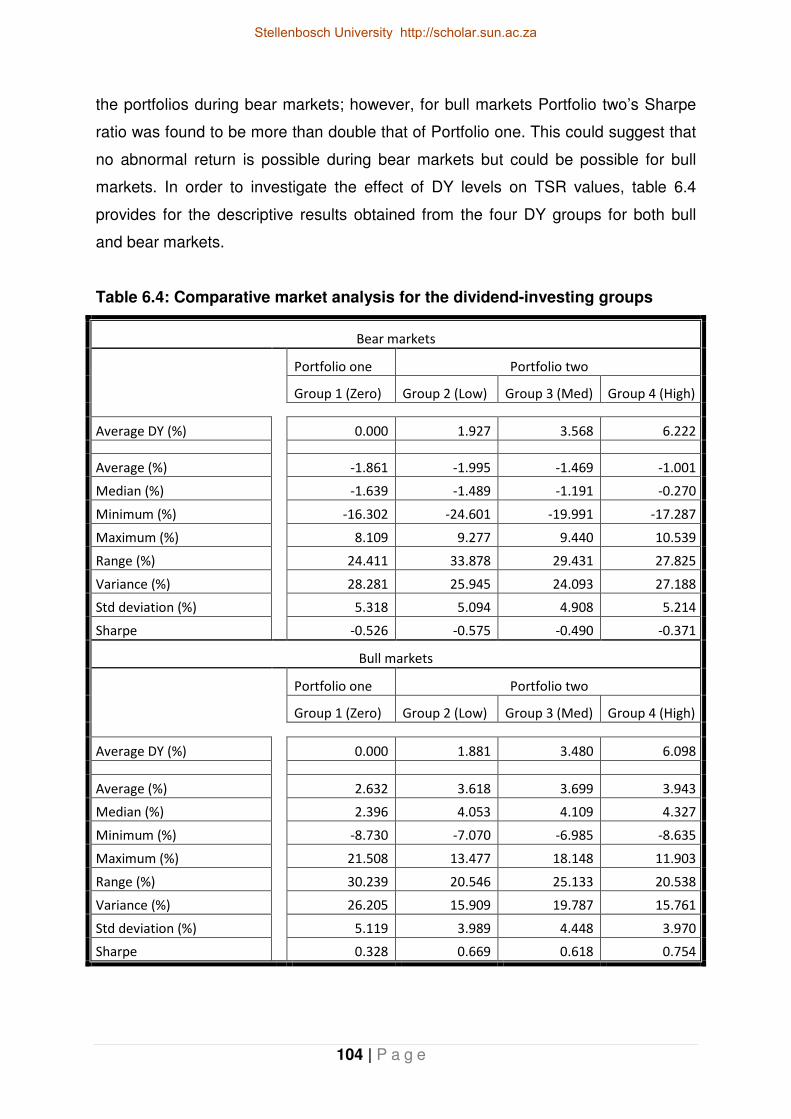
104 | P a g e
the portfolios during bear markets; however, for bull markets Portfolio two’s Sharpe
ratio was found to be more than double that of Portfolio one. This could suggest that
no abnormal return is possible during bear markets but could be possible for bull
markets. In order to investigate the effect of DY levels on TSR values, table 6.4
provides for the descriptive results obtained from the four DY groups for both bull
and bear markets.
Table 6.4: Comparative market analysis for the dividend-investing groups
Bear markets
Portfolio one Portfolio two
Group 1 (Zero) Group 2 (Low) Group 3 (Med) Group 4 (High)
Average DY (%) 0.000 1.927 3.568 6.222
Average (%) -1.861 -1.995 -1.469 -1.001
Median (%) -1.639 -1.489 -1.191 -0.270
Minimum (%) -16.302 -24.601 -19.991 -17.287
Maximum (%) 8.109 9.277 9.440 10.539
Range (%) 24.411 33.878 29.431 27.825
Variance (%) 28.281 25.945 24.093 27.188
Std deviation (%) 5.318 5.094 4.908 5.214
Sharpe
-0.526 -0.575 -0.490 -0.371
Bull markets
Portfolio one Portfolio two
Group 1 (Zero) Group 2 (Low) Group 3 (Med) Group 4 (High)
Average DY (%) 0.000 1.881 3.480 6.098
Average (%) 2.632 3.618 3.699 3.943
Median (%) 2.396 4.053 4.109 4.327
Minimum (%) -8.730 -7.070 -6.985 -8.635
Maximum (%) 21.508 13.477 18.148 11.903
Range (%) 30.239 20.546 25.133 20.538
Variance (%) 26.205 15.909 19.787 15.761
Std deviation (%) 5.119 3.989 4.448 3.970
Sharpe
0.328 0.669 0.618 0.754
Stellenbosch University http://scholar.sun.ac.za
105 | P a g e
Table 6.4 firstly reports the relative DYs for each group in the data set. These values
can potentially be used as a benchmark in evaluating DYs. Accordingly, by analysing
the results for the different groups, the outperformance of the dividend-paying groups
in relation to the non-dividend-paying group becomes evident again. During bear
markets, Group 4 was found to provide the highest TSR in comparison to the other
groups. Regarding the results for central tendency, the least-dispersed group was
found to be Group 3 for bear markets, and Group 4 for bull markets. Therefore, the
findings suggest that not only do the highest DY levels provide for the highest
average TSR, but also the lowest amount of risk measured in terms of standard
deviation. The highest level of risk was again found, unsurprisingly, for Group 1,
which supported previous findings. The Sharpe ratio again indicated that the different
market conditions can provide abnormal returns, as any positive DY group
outperformed the non-dividend-paying group during bull markets.
In summary, the best-performing group in terms of average TSR was found to be the
highest-dividend-paying group during both bull and bear markets (Group 4).
Consistently the medium DY sub-portfolio (Group 3) illustrated that it is the second-
best portfolio in terms of average monthly TSR. In both market scenarios Group 1
performed the worst. Accordingly, the results suggest that not making a dividend
payment could result in poor share performance as measured by TSR. Therefore,
the descriptive statistics could possibly suggest that dividend payments do affect
share value, and that the level of DYs further provides for an influencing value in
share returns. The significance of this finding will be evaluated in the inferential
results provided later.
In this section some key characteristics have been identified by considering the
descriptive statistics. However, the statistical significance of the proposed
relationships between dividend information and share return needs to be
investigated with the use of inferential statistical analysis. This chapter, therefore,
introduces the inferential analyses findings next.
Stellenbosch University http://scholar.sun.ac.za

106 | P a g e
6.3 INFERENTIAL STATISTICS
In this section emphasis is placed on the relationship between the dependent and
independent variables inherent in the sample. As mentioned in Chapter five, for this
study the independent variables used are dividend distributions over bull and bear
markets. The dependent variable is the monthly risk-adjusted share return measured
for the various DY groups. Therefore, based on the before-mentioned research
objectives and these variables the null hypothesis and alternative hypothesis of the
study was stipulated as follows:
�� : Dividend distributions have no significant influence on share returns.
�� : Dividend distributions have significant influence on share returns.
Therefore, the inferential analysis attempted to determine whether positive market
adjusted returns can be generated in order to reject the null hypothesis. The next two
sections provide for the results obtained. Again these following sections are
structured in a similar manner to the descriptive statistical sections, in the sense that
Portfolios one and two are discussed first. Secondly, for the four DY groups
inferential statistical findings are presented and analysed. Finally, the potential effect
of market movements is analysed over bull and bear markets.
6.3.1 COMPARATIVE ANALYSIS OF INFERENTIAL RESULTS
Chapter five specified the assumptions used to apply the OLS model. It was also
stated that all assumptions held when the data set was evaluated. Accordingly, the
regressions for each portfolio and group were based on the following OLS model
specified in the previous chapter.
What is important to consider is that this regression is conducted to investigate
whether or not risk-adjusted returns (α) and estimates of systematic risk (β) can be
statistically significant, which will indicate that using dividend-investing can result in
positive risk-adjusted returns.
Stellenbosch University http://scholar.sun.ac.za

The following sections contain summarised tables discussing the results obtained for
both portfolios and DY groups
mentioned inputs to the OLS model such as
the goodness of fit for re
substantial autocorrelation is prevalent, there is no need to consider the adjusted
goodness of fit value. The l
used to determine if the relation
provides the results for the first analysis
Table 6.5: Regression results
Portfolios
Portfolio one (Non-dividends)
Portfolio two (Dividends)
The first two columns in Table 6.5 indicate the market model esti
risk-adjusted returns (α) and systematic risk
table to identify statistically significant results at
obtained, it was noted that
0.582), even though its systematic risk (0.983) was very similar to that of
two (1.009). The dividend payers’ abnormal return (0.223), in relation to its
systematic risk, would therefore suggest that i
have provided better returns than investing
The last column of table 6.5 indicates the goodness of fit
and as can be see for the dividend payers
the market model was significant at
of the research objectives to determine whether
dividend-paying firms and non
significance holds true for different DY levels, the various DY groups are
next in table 6.6.
107 | P a g e
s contain summarised tables discussing the results obtained for
and DY groups. Key characteristics addressed include the previously
mentioned inputs to the OLS model such as α and β as well as estimates indicating
the goodness of fit for regressions (Cant et al., 2005). Furthermore, since no
autocorrelation is prevalent, there is no need to consider the adjusted
. The level of significance, measured by the
used to determine if the relationships between the variables are significant.
provides the results for the first analysis conducted for Portfolio one and two
: Regression results for the two portfolios
Market model
estimate of α
Market model
estimate of β
-0.582* 0.983*
0.223* 1.009*
The first two columns in Table 6.5 indicate the market model estimates for
) and systematic risk (β). The asterisk symbol is used in the
table to identify statistically significant results at five per cent. In analysing the res
that Portfolio one did not have a positive abnormal return (
systematic risk (0.983) was very similar to that of
(1.009). The dividend payers’ abnormal return (0.223), in relation to its
systematic risk, would therefore suggest that investing in the dividend
d better returns than investing in the non-dividend payers
The last column of table 6.5 indicates the goodness of fit values for the regressions,
and as can be see for the dividend payers it is high (0.951). All estimates for
the market model was significant at a 5% level. These findings address an element
of the research objectives to determine whether returns on shares differ between
paying firms and non-dividend-paying firms. In order to analyse if this
e holds true for different DY levels, the various DY groups are
s contain summarised tables discussing the results obtained for
. Key characteristics addressed include the previously
as well as estimates indicating
2005). Furthermore, since no
autocorrelation is prevalent, there is no need to consider the adjusted
the p-value, is finally
ships between the variables are significant. Table 6.5
Portfolio one and two.
0.668
0.951
mates for abnormal
The asterisk symbol is used in the
In analysing the results
did not have a positive abnormal return (-
systematic risk (0.983) was very similar to that of Portfolio
(1.009). The dividend payers’ abnormal return (0.223), in relation to its
nvesting in the dividend-payers would
dividend payers.
values for the regressions,
estimates for β using
These findings address an element
shares differ between
. In order to analyse if this
e holds true for different DY levels, the various DY groups are investigated
Stellenbosch University http://scholar.sun.ac.za

Table 6.6: Regression results for dividend
DY groups
Group 1 (Zero)
Group 2 (Low)
Group 3 (Med)
Group 4 (High)
From the table it can be seen that Group 4 (0.547) was found to present the largest
abnormal return, followed by the Group 3 (0.189), then Group 2 (
Group 1 (-0.582). These results support previous findings and indicate that the
higher the DY was, the larger the abnormal returns. In other words, the risk
returns decrease in line with the corresponding decline in DY.
values for each group, it can be seen that the estimates of abnormal return for Group
1 and Group 4 are statistically significant.
Table 6.6 also provides for support of Ap Gwilym
systematic risk. For the high DY shares, the systematic risk was found to be very
similar to that of the non-dividend shares. This would suggest
linear relationship between the abnormal return and systematic risk for dividend
payers and non-dividend payers. The goodness of fit results was also found to be
relatively good for all the groups.
These results are consistent with the Erasmus (2011) and Ap Gwilym
findings where statistically significant findings were only found for the highest DY
group and the non-dividend group for estimates of
For the estimates of systematic risk
Up to this point of the chapter the two portfolios and four DY
been portrayed for the entire 192 month time period of the study. The next section
considers the comparative analysis for both bull and bear markets for the four DY
groups.
108 | P a g e
: Regression results for dividend-investing groups
Market model
estimate of α
Market model
estimate of β
-0.582* 0.983*
-0.072 1.022*
0.189 1.029*
0.547* 0.978*
From the table it can be seen that Group 4 (0.547) was found to present the largest
abnormal return, followed by the Group 3 (0.189), then Group 2 (-
0.582). These results support previous findings and indicate that the
e DY was, the larger the abnormal returns. In other words, the risk
returns decrease in line with the corresponding decline in DY. Considering the
values for each group, it can be seen that the estimates of abnormal return for Group
4 are statistically significant.
Table 6.6 also provides for support of Ap Gwilym et al. (2000) regarding the
systematic risk. For the high DY shares, the systematic risk was found to be very
dividend shares. This would suggest that there is a non
linear relationship between the abnormal return and systematic risk for dividend
dividend payers. The goodness of fit results was also found to be
relatively good for all the groups.
are consistent with the Erasmus (2011) and Ap Gwilym
findings where statistically significant findings were only found for the highest DY
dividend group for estimates of abnormal risk-
systematic risk all results were statistically significant.
Up to this point of the chapter the two portfolios and four DY group’s
been portrayed for the entire 192 month time period of the study. The next section
considers the comparative analysis for both bull and bear markets for the four DY
0.951
0.824
0.824
0.793
From the table it can be seen that Group 4 (0.547) was found to present the largest
-0.072) and lastly
0.582). These results support previous findings and indicate that the
e DY was, the larger the abnormal returns. In other words, the risk-adjusted
Considering the p-
values for each group, it can be seen that the estimates of abnormal return for Group
(2000) regarding the
systematic risk. For the high DY shares, the systematic risk was found to be very
that there is a non-
linear relationship between the abnormal return and systematic risk for dividend-
dividend payers. The goodness of fit results was also found to be
are consistent with the Erasmus (2011) and Ap Gwilym et al. (2000)
findings where statistically significant findings were only found for the highest DY
-adjusted returns.
all results were statistically significant.
group’s results have
been portrayed for the entire 192 month time period of the study. The next section
considers the comparative analysis for both bull and bear markets for the four DY
Stellenbosch University http://scholar.sun.ac.za

6.3.2 COMPARATIVE ANALYSIS
Thus far in this chapter an attempt has been made
objectives pertaining to the influence of dividend payments on share returns. In order
to address the secondary objectives of this study, this section investigates the
possible influence of market movem
variables. In order to do so, the four DY groups that represent the dividend
strategies are used. First, the results for the bear market are provided in table 6.7,
followed by the analysis for the bull market
two markets is discussed later.
Table 6.7: Regression results for the four groups
DY groups
Group 1 (Zero)
Group 2 (Low)
Group 3 (Med)
Group 4 (High)
Recalling from the previous descriptive results, although no group provided a
positive TSR during bear markets,
this market scenario (-1.006
dividend paying group provided the best return in comparison
previous descriptive statistics also indicated that
dividends as measured in the lowest market average for DY
dividends available, they actually performed worse in terms of TSR. This result coul
potentially provide contradicting views for the signalling hypothesis
performing the inferential analysis
Group 1 to 3 during the bear markets
hypothesis states that any payment of dividends is usually taken as a positive si
by investors, resulting in a
2010:24; Hobbs, 2006:1; Grullon
1995; Healy and Palepu, 1988
indicated significant findings for both positive estimates of
109 | P a g e
ANALYSIS FOR MARKET MOVEMENTS
pter an attempt has been made to address the research
objectives pertaining to the influence of dividend payments on share returns. In order
to address the secondary objectives of this study, this section investigates the
possible influence of market movements on the dependent and independent
variables. In order to do so, the four DY groups that represent the dividend
strategies are used. First, the results for the bear market are provided in table 6.7,
followed by the analysis for the bull market in table 6.8. A comparison between the
two markets is discussed later.
: Regression results for the four groups during bear markets
Market model
estimate of α
Market model
estimate of β
-0.407 0.948*
-0.389 1.008*
0.101 0.993*
0.691* 1.041*
Recalling from the previous descriptive results, although no group provided a
positive TSR during bear markets, Group 4 did provide the highest average TSR in
1.006%). Therefore, during declining markets the highest
dividend paying group provided the best return in comparison to other groups
previous descriptive statistics also indicated that if a firm paid the lowest amount of
dividends as measured in the lowest market average for DY, instead of making no
dividends available, they actually performed worse in terms of TSR. This result coul
potentially provide contradicting views for the signalling hypothesis
performing the inferential analysis the p-values for α indicated no significance
Group 1 to 3 during the bear markets. Recalling from Chapter four, the signalling
thesis states that any payment of dividends is usually taken as a positive si
by investors, resulting in a favourable increase in share price (
24; Hobbs, 2006:1; Grullon et al., 2002; Benartzi et al., 1997; Michealy
y and Palepu, 1988, to name but a few). Group 4, on the other hand,
indicated significant findings for both positive estimates of abnormal risk
to address the research
objectives pertaining to the influence of dividend payments on share returns. In order
to address the secondary objectives of this study, this section investigates the
ents on the dependent and independent
variables. In order to do so, the four DY groups that represent the dividend-investing
strategies are used. First, the results for the bear market are provided in table 6.7,
. A comparison between the
bear markets
0.644
0.781
0.815
0.801
Recalling from the previous descriptive results, although no group provided a
Group 4 did provide the highest average TSR in
%). Therefore, during declining markets the highest
to other groups. The
paid the lowest amount of
instead of making no
dividends available, they actually performed worse in terms of TSR. This result could
potentially provide contradicting views for the signalling hypothesis. However, in
no significance for
. Recalling from Chapter four, the signalling
thesis states that any payment of dividends is usually taken as a positive sign
favourable increase in share price (Van der Merwe,
, 1997; Michealy et al.,
Group 4, on the other hand,
abnormal risk-adjusted
Stellenbosch University http://scholar.sun.ac.za

returns (0.691) and systematic risk (1.041). Again, consistent with the two portfolios
and the various groups, all estimates for
significant at 5%.
Considering bull markets alone, the descriptive statistics previously indicated that
Group 4 provided the largest TSR during bull markets and that, of all the groups
except Group 1, provided a positive risk
ratio. The risk inherent in Group 1 was found to be larger than that of Group 4. Table
6.8 provides the inferential results obtained for the bull market.
Table 6.8: Regression results for groups during
DY groups
Group 1 (Zero)
Group 2 (Low)
Group 3 (Med)
Group 4 (High)
The non-linear trend previously observed between
during the bull markets results obtained from
the four DY groups. Group 4
also the lowest level of systematic risk
that not making dividend payments resulted in the highest level of systematic risk
and the lowest rate of return
somewhat lower than for previous regressions, but still relatively high. Considering
the level of significance, results are statistically
results are, however, only statistically significant for
Group 4 (p=0.007). These findings
DYs not only in terms of share returns, but also in terms of the riskiness of the
investment made.
110 | P a g e
returns (0.691) and systematic risk (1.041). Again, consistent with the two portfolios
ll estimates for systematic risk using the market model was
Considering bull markets alone, the descriptive statistics previously indicated that
Group 4 provided the largest TSR during bull markets and that, of all the groups
except Group 1, provided a positive risk-adjusted return as measured by the Sharpe
ratio. The risk inherent in Group 1 was found to be larger than that of Group 4. Table
6.8 provides the inferential results obtained for the bull market.
results for groups during bull markets
Market model
estimate of α
Market model
estimate of β
-1.045* 1.094*
0.272 0.963*
0.090 1.067*
0.745* 0.903*
linear trend previously observed between return and variability
results obtained from the regression analyse
. Group 4 yielded the highest abnormal risk-adjusted return
systematic risk. The inverse was true for Group 1, suggesting
that not making dividend payments resulted in the highest level of systematic risk
lowest rate of return. For this regression, the goodness of fit estimate was
somewhat lower than for previous regressions, but still relatively high. Considering
the level of significance, results are statistically significant for all estimates
statistically significant for α in both Group 1 (
=0.007). These findings suggest that high DY firms will outperform lower
DYs not only in terms of share returns, but also in terms of the riskiness of the
returns (0.691) and systematic risk (1.041). Again, consistent with the two portfolios
using the market model was
Considering bull markets alone, the descriptive statistics previously indicated that
Group 4 provided the largest TSR during bull markets and that, of all the groups
adjusted return as measured by the Sharpe
ratio. The risk inherent in Group 1 was found to be larger than that of Group 4. Table
0.589
0.739
0.736
0.660
return and variability continued
the regression analyses conducted for
adjusted return and
. The inverse was true for Group 1, suggesting
that not making dividend payments resulted in the highest level of systematic risk
or this regression, the goodness of fit estimate was
somewhat lower than for previous regressions, but still relatively high. Considering
significant for all estimates of β. The
in both Group 1 (p=0.007) and
will outperform lower
DYs not only in terms of share returns, but also in terms of the riskiness of the
Stellenbosch University http://scholar.sun.ac.za

111 | P a g e
6.4 CONCLUSION
In the beginning of this chapter it was mentioned that the results obtained from
descriptive and inferential data analyses will be discussed. Various tables and
figures were used to present these statistical results.
Throughout this chapter various descriptive and inferential analyses where
performed on the two portfolios and subsequent DY groups in order to address the
study’s research objectives. The descriptive analyses identified mathematic
relationships between the dependent and independent variables. The inferential
analysis served to investigate how significant these relationships or differences were
and whether positive risk-adjusted returns could be generated.
The purpose of constructing the four DY groups was to investigate the possible
influence of increasing and declining markets on the returns of dividend-investing
strategies. The portfolios were rebalanced monthly and ranked according to DY, and
evaluated according to their respective risk-adjusted returns to identify if the
performance of the strategies significantly differed during the market scenarios.
In the next chapter, a summary of the study is provided. The chapter will provide an
overview of the results obtained in this chapter. It will specifically address the
research objectives of the study, explain possible limitations to the study performed
and identify future research opportunities originating from the results obtained.
Stellenbosch University http://scholar.sun.ac.za

112 | P a g e
Chapter 7 : CONCLUSION AND RECOMMENDATIONS
7.1 INTRODUCTION
Wolmarans (2003) stated that “it is generally accepted that the payments of
dividends is the most important and most widely used instrument for the distribution
of value to shareholder.” Furthermore, as stated at the onset of this study by Firer et
al. (2008:10):
“An argument can be made that dividends are more important than ever before,
since it is the one number that a shareholder can trust. Earnings per share and even
cash flow per share can be manipulated by management, but dividend cheques can
be cashed.”
Considering this supposed influence that dividends can have on shareholder value,
this study set out to evaluate the possibility of using dividend pay-out policy to
enhance share return, especially during increasing and declining markets. The aim
was to investigate if there is a possibility that investors could maximise share returns
by using predetermined dividend-investing strategies based on DY levels during bull
and bear markets. In order to perform the required research the study considered a
sample of both listed and delisted firms for the period 1995 to 2010. Two portfolios
were first constructed, distinguishing between zero and positive DYs. Next the two
portfolios were further categorised into four DY groups based on the level of DYs. By
using these strategies, the study was able to investigate how dividend distributions
influence share returns. A summary of how the various portfolios and groups were
constructed is provided later in this chapter.
The issue, however, and the subsequent need for the analysis of dividend-investing,
is that South African firms have been found to be very conservative and sensitive
towards the level of dividend payments (Van der Merwe, 2010:29; Firer et al., 2008).
It was mentioned that at times, many South African managers borrowed funds in the
market in order to make a dividend payment in the attempt to maintain the market
Stellenbosch University http://scholar.sun.ac.za

113 | P a g e
value of their shares (Firer et al., 2008). Furthermore, considering the more recent
financial crisis and international trends, firms have built up large reserves of cash,
which provides for abundant resources to make dividend payments. It can thus be
argued that the dividend decision has become critical in order to manage wealth by
distributing dividends, when appropriate.
The rest of this chapter is structured as follows. The next section provides an
overview of the chapters discussed. Throughout important dividend related topics
are reviewed. The chapter then elaborates upon important results from Chapter six
and implications it might have for dividend-investing and dividend policy formulation
in the South African market. The chapter is finally concluded with a discussion of
limitations identified in the study, and potential future research opportunities
provided.
7.2 SUMMARY
Chapter one introduced the background and role of the dividend decision, when it
introduced the three elements of an optimal financial function. Recalling from
Damodaran (2011:1):
“A firm seeking to maximise wealth has to invest wisely, find the right kind and mix of
financing to fund these investments, and return cash to the owners if there are not
enough good investments in order to increase shareholders’ wealth.”
It was stated that the dividend decision stems from the interaction between the
financing and investment decision, through the MCC (Damodaran, 2011:2). The
MCC is at the centre of these interactions as it serves as an important benchmark
when deciding on how beneficial financing from various sources can possibly be, if
investments are advisable, or if earnings should be redistributed to shareholders
(Brealey et al., 2008:117; Correia et al., 2007:1-20). If a reinvestment provides a rate
of return lower than the MCC or hurdle rate, a firm must determine whether to keep
the earnings as reserves for future investment funding, or distribute it as dividends to
Stellenbosch University http://scholar.sun.ac.za

114 | P a g e
the shareholders. Ultimately, the dividend decision should be based on whether
shareholder value is being maximised or not (Bierman and Smidt, 2007:5). Chapter
two to four served as the literature review on the role and origin of dividends by
identifying the key characteristics of both the investment and financing decisions
firms make to maximise shareholder value. Chapter two, specifically, introduced the
capital-budgeting process and principles used in the investment decision to identify
value-adding investment opportunities. It was stated that capital budgeting is
performed in order to determine the profit potential of each investment proposal,
which should then be compared to the expected rate of return demanded by
shareholders (Bierman and Smidt, 2007:3). In this chapter investment analysis
techniques, traditional and modern, used to evaluate investment options were also
reviewed and discussed. Naturally, due to the inherent uncertainty inextricably
involved in predicting the future, capital budgeting decisions need to be performed
with great care. According to Lambrechts (1992:65):
“The result of the investment decision is measured by the improvement in the cash
flow and eventually in the market price of the ordinary shares. In this manner, the
attempt to satisfy the primary objective of the financial management function, to
maximise shareholder wealth is also served.”
Chapter three next introduced the role of leverage, and how it could influence the
capital structure.
“The ultimate goal of the financing, or capital structure decision, is to determine the
degree of financial leverage in the capital structure that maximises the value of the
firm by minimising the MCC” (Clayman et al., 2009:121).
By following a predetermined dividend pay-out policy a firm needs to be very
cognisant to the extent of equity financing it utilises in its financial structure. This
importance can be observed in the significant demand shareholders can have to be
compensated for any change in a firm’s risk profile of its debt to equity ratios.
Various theories regarding the interaction between debt and equity, and their
influence on the dividend decision were explained. It was also indicated how the
MCC can be derived by specifying which factors can influence it. In this chapter, the
Stellenbosch University http://scholar.sun.ac.za
115 | P a g e
signalling hypothesis was also introduced. Signalling power, according to this theory,
is managed by firms when they financed their investments. Also, this signalling
power was proposed to provide added value when making dividend payments to
shareholders, ultimately enhancing returns. The role that debt restrictions can have
on a firm’s management was elaborated upon, and the risk of building up excessive
cash reserved explained.
Chapter four shed light on some of the extensive studies previously performed based
on the dividend decision. However, the impact that market movements can have on
the dividend policies of firms did not seem to have received the same level of
attention to date in South Africa. Studies indicate that higher-than-usual DY shares
tend to outperform lower DY shares in value over time, as previously stated by
Kooyman (2010) and Saville (2010). The signalling hypothesis, and its applicability to
dividends, explained that investors tend to react favourably to firms that pay
dividends, especially when the dividend payments were not expected. Chapter four
also indicated that the clientele and catering theories would appear to have gained a
greater following over the past years (Baker and Wurgler, 2004). These theories are
based on market sentiment towards firm characteristics, such as DY. Firer et al.
(2008) found that in the South African market firms are very hesitant to reduce
dividend payments, as they fear destroying shareholder value. Therefore, one can
argue that the hurdle rate used when determining the dividend decision is being
influenced by both external factors as well as internal interactions between the
investment and financing decisions.
Chapter four also reviewed Fuller and Goldstein (2003) who studied the effects of
bull and bear markets on dividend policies and whether signalling was indeed
observed in the market when selecting shares for investing. Their study revealed that
dividend-paying firms provided better returns than non-dividend-paying firms during
both periods of market movements. Furthermore, their study indicated that the level
of dividend payments was not the influencing factor, but rather whether the firm
made any payments at all. This chapter also reviewed a local study of dividend
relevance performed by Erasmus (2011), who built on previous studies of
Wolmarans (2003; 2000), Ap Gwilym et al. (2000), and Kleim (1985), to name a few.
The results of Erasmus (2011) indicate that share value can potentially be influenced
Stellenbosch University http://scholar.sun.ac.za

116 | P a g e
by not only the size of a dividend payment, but also its stability. In support of these
findings, and those of the Fuller and Goldstein (2003) study, DeAngelo and
DeAngelo (2012) provide empirical evidence that during financial distress, commonly
associated with bear markets, managers were more willing to reduce dividend
payments, but not to stop them in their entirety.
This study finally reviewed and adapted the Wolmarans (2000) study in order to
determine whether dividend-investing could be used to capture positive risk-adjusted
returns in the South African context, by considering the effect of market movements
on the performance of a number of DY portfolios.
Chapter five specified the research methodology applied in this study. How the
research data was obtained and the time-period applicable to this study was also
discussed. Using data sourced from McGregor BFA (2010) database, analysis
techniques were introduced. It was also stated that since all the data used was
sourced from public sources and as such in the public domain, the research had
minimal ethical risks and as such no ethical clearance was needed. Due to the
nature of listed and delisted firms on the JSE for the period 1995 to 2010 and the
volatility in their share data some coding was required on the data set. Firstly,
observations exceeding eight standard deviations were omitted, before the process
of winsorizing was utilised to the top and bottom five per cent of the data. Finally,
following the appropriate transformations, two portfolios and DY groups were
constructed and ultimately analysed with descriptive and inferential statistics.
The primary research objective of this study was to evaluate the possible influence
dividend payout policy has on share returns. The null and alternative hypotheses
were stated as follows:
�� : Dividend distributions have no significant influence on share returns.
�� : Dividend distributions have significant influence on share returns.
In terms of the above-mentioned hypotheses, the secondary objectives of the study
were stipulated as:
Stellenbosch University http://scholar.sun.ac.za

117 | P a g e
• To determine whether returns on shares differ between dividend-paying firms
and non-dividend-paying firms.
• To determine whether the various dividend pay-out policies regarding the size
of dividend payments, as per DY, affect share returns.
• To evaluate the possibility of using dividend-investing strategies during market
movement to earn a higher than market return on a risk-adjusted basis.
In order to address the stated objectives and hypotheses two portfolios were used in
the statistical analyses. These portfolios represented the non-dividend payers
(Portfolio one), and the dividend payers (Portfolio two). In total, 22 927 monthly
observations were analysed over the 192 months in the study. Of this total amount,
24.774% of the observations were found to be non-dividend-paying and the resulting
75.226% dividend-paying observations, accordingly identified by zero and positive
DYs. Next, the dividend-paying observations were further sub-categorised to further
compare share returns over various DY levels. The creation of the four groups
provided the opportunity to investigate whether dividend-investing strategies based
on DY levels can allow for positive risk-adjusted returns, especially during bull and
bear markets respectively.
The empirical results of the statistical analyses were then provided in the form of
various tables and figures in Chapter six and discussed accordingly over the entire
time period under review, as well as during bull and bear markets respectively. The
next section of this chapter elaborates further on the empirical results obtained from
Chapter six and the implications it might hold for dividend policy formulation as well
as dividend-investing possibilities.
7.3 CONCLUSIONS AND DIVIDEND POLICY IMPLICATIONS
This section of the chapter provides for an overview of the most significant findings
and their possible implications by first reviewing the descriptive results before
considering the inferential statistics obtained.
Stellenbosch University http://scholar.sun.ac.za

118 | P a g e
Descriptive results for both portfolios indicate that the distribution of the DY
observations of the data set is negatively skewed, but not excessively so. In all
analyses performed, Portfolio one underperformed relative to Portfolio two over the
entire time period of the study. Non-dividend payers not only had a lower TSR in
comparison, but also had more risk present as measured in terms of the standard
deviation of TSR. Therefore, on a risk-adjusted basis, non-dividend-paying firms
underperformed any positive DY firm, as measured by the Sharpe ratio. These
descriptive results potentially indicate that, on average, dividend payments could
enhance share performance. This finding partly addresses the first secondary
objective of the study. Furthermore, when comparing the different DY groups, the
two best performing groups on a risk-adjusted basis were found to be the highest DY
group (Group 4) and the second highest (Group 3) respectively. This finding
supports previous research since it suggests that in order to capture the most value
from dividend payments, a firm not only needs to make a dividend payment, but
should attempt to pay as large a dividend as possible. This observation relates to the
second secondary objective of the study in the sense that the size of a dividend
payment would appear to be influencing the value of a share.
After investigating the results obtained during opposing market movements, the best-
performing group was found to be Group 4 for both bull and bear markets.
Consistently, the medium DY sub-portfolio (Group 3) illustrated that it is the second-
best portfolio in terms of average monthly TSR. In both market scenarios Group 1
performed the worst and Group 4 the best on a risk-adjusted basis. A remarkable
finding for the market scenarios was that during bear markets no significant
difference in TSR was observed between the dividend-payers’ Sharpe ratio and that
of Group 1. However, during bull markets the ratio indicated that the risk-adjusted
return for the dividend-payers was more than double the result obtained for the non-
dividend payers.
In summary, the descriptive statistics suggest that not making a dividend payment
could result in lower share performance as measured in TSR during any market
condition. On the other hand, making large dividend payments in relation to share
price could, especially during bull markets, enhance share returns. Therefore, the
descriptive statistics appear to suggest that dividend payments may affect share
Stellenbosch University http://scholar.sun.ac.za

119 | P a g e
returns, and that the level of DYs further provides for an influencing value in share
returns. At the same time, there could exist an opportunity to maximise returns by
considering market conditions, given that dividend information is available. Inferential
analyses were performed to test these findings.
During the inferential statistical analysis, the data set was also found to be negatively
distributed, but no substantial auto-correlation was found to be present in the data.
Accordingly, an OLS regression was applied based on the market CAPM. Results for
the regression analyses indicate support for the Erasmus (2011) and Ap Gwilym et
al. (2000) studies. For the high DY shares the systematic risk was found to be very
similar to that of the zero-dividend shares. Yet, the risk-adjusted returns for the
dividend-paying groups were significantly higher in comparison. This would suggest
that there is a non-linear relationship between the abnormal return and systematic
risk for dividend-payers and non-dividend payers. The goodness of fit value also
indicated a relatively good result for the regression conducted on all portfolios and
groups. Considering the statistical significance for risk-adjusted returns (α) and
systematic risk (β), the results suggest that Portfolios one and two provided for
statistical significant results for both estimates. In the analyses performed on the
various dividend-investing strategies, the p-values indicated that the results for
Group 1 and Group 4 are statistically significant for estimates of α. For estimates of β
all p-values were found to be statistically significant.
In comparing the results obtained for the bull markets, the same results held for
Group 1 and Group 4. Only in bear markets the results for Group 4 proved to be
statistically significant for α. Again all estimates of β during both bull and bear
markets were statistically significant. In both markets a non-linear trend between α
and β was observed. The results obtained for the low and medium DY groups
suggest that no statistically significant results for estimates of α could be obtained.
Therefore, the research cannot prove whether a low- or medium DY strategy could
outperform the zero-dividend group.
From the inferential statistic results obtained the null hypothesis and alternative
hypothesis could finally be addressed. Chapter five indicated that the null hypothesis
is used to test statistical significance. The null hypothesis is valid when no difference
Stellenbosch University http://scholar.sun.ac.za

120 | P a g e
exists between a population parameter and a sample statistic being compared to it.
The alternative hypothesis is valid when differences do exist. In the analyses
focusing on Portfolio one and two, the null hypothesis can be rejected, and the
alternative hypothesis accepted. This can be seen in the findings for the level of
significance, since it indicated that both p-values were smaller than five per cent.
Therefore, DY would appear to be an influencing factor on share values in
comparing dividend payers to non-dividend payers.
For the analysis of the various DY groups, the null hypothesis can be rejected for
Group 1 and for Group 4 during bull markets and for Group 4 during bear markets.
These results serve as a meaningful finding, since it supports the descriptive results
of differences in the Sharpe ratio observed for bear and bull markets that were
mentioned previously.
The implications of these findings are two-fold. From the firm’s perspective, this
study provides support for the signalling hypothesis since it appears as if dividend
payments could influence share returns. Possible reasoning for this finding might be
that firms who do not pay any dividends for a specific period might be indicating that
the management do not have the resources available to do so and thus a signal
might be that there is no value in the shares. The results obtained from this study
would suggest that a firm should attempt to maintain its DY in lines of the highest DY
average for the market during bull markets, which would provide significant risk-
adjusted share performance. However, during bear markets the benefits of making
the largest dividend distributions would not be as remarkable. Therefore, the study
supports the catering theory for dividend policy formulation in the sense that dividend
policy would appear to be influenced by market movements. In order to capitalise on
this finding and maximise shareholder wealth, management should manage
shareholder expectations and adjust the level of dividend payments during bull and
bear markets accordingly.
From the investor’s perspective, dividend-investing strategies would appear to
identify value-enhancing investment opportunities. The results indicate that even if
an investment was made in the highest DY group during a bear market, no positive
returns would be possible. Alternatively, identifying the relevant groups in the market
Stellenbosch University http://scholar.sun.ac.za
121 | P a g e
by using the average DY sizes could have provided positive risk-adjusted returns
over the period under review in this study. Considering these findings, the next
section summarises limitations identified in the research performed, as well as future
research opportunities.
7.4 LIMITATIONS AND FUTURE RESEARCH POSSIBILITIES
Initially many obstacles and limitations were present in this study. By performing in-
depth research, many of these limitations were overcome. Some of the remaining
limitations are provided in this section before future research opportunities are
highlighted.
• As mentioned previously this study included listed and delisted firms on the
JSE for the period 1995 to 2010. Initially all sectors on the JSE were
considered, but eventually the financial and basic material firms were
excluded. The study also excluded private firms not listed publically since their
financial performance and data was not readily available.
• Data analysis for the various months was limited to an accumulation of either
bull or bear markets, as defined by a market index change from month to
month. This monthly classifications might, therefore, contain performance lags
from previous months.
• Due to the accounting complexities involved with non-cash dividends such as
share distributions, share splits, and share repurchases, this study only
considered cash dividend payments.
• Considering the taxation transition from STC to the new DWT this study could
not fully analyse the latest tax implications. The tax transformations were, at
the time of writing this study, too new to observe any significant implications
on the financial markets and dividend payments.
Stellenbosch University http://scholar.sun.ac.za

122 | P a g e
Following the results obtained from the data analysis, the following are
recommended as future research possibilities:
• A significant finding of the study was that during bear markets no significant
difference in risk-adjusted returns was present between Portfolio one and
Portfolio two. This held true even between the lowest and the highest ranking
DY groups. However, for bull markets, Group 4 significantly outperformed
Group 1. Future research might consider an efficient portfolio strategy for
capitalising on high-ranking DY shares during bull markets and risk-free or
non-cyclical shares during bear markets accordingly.
• Since the latest tax structure and its supposed impact on dividend payments
is not included in this study, a future study might need to consider the
difference between STC and DWT on share values. The latest DWT
methodology was implemented to make the South African market more
attractive to foreign investors. An investigation could be made into the
relevance of this notion and how dividend policy formulation has been
impacted.
Stellenbosch University http://scholar.sun.ac.za

123 | P a g e
REFERENCES
Altman, E. 1984. A further investigation of the bankruptcy cost question. Journal of
Finance, 39(1):1067-1089.
Ambarish, R.J.K. and Williams, J. 1987. Efficient signalling with dividends and
investments. Journal of Finance, 42(2):321-343.
Amram, A. and Kulatilaka, N. 1999. Real options: Managing strategic investment in
an uncertain world. Boston: Harvard Business School Press.
Andrade, G. and Kaplan, S.N. 1998. How costly is financial and not economic
distress? Evidence from highly leveraged transactions that became
distressed. Journal of Finance, 53(5):1443-1493.
Andrews, G.S. and Butler, F. 1986. Criteria for major investment decisions.
Investment Analysts Journal, 27(1):31-37.
Ap Gwilym, O., Morgan, G. and Thomas, S. 2000. Dividend stability, dividend yield
and stock returns. Journal of Business Finance and Accounting, 27(3-4):261-
281.
Asquinth, P. and Mullins, D. 1983. The impact of initiating dividends on shareholders
wealth. Journal of Finance, 56(1):77-96.
Baker, M. and Wurgler, J. 2002, Market timing and capital structure. Journal of
Finance, 57(1):1–30.
Baker, M. and Wurgler, J. 2004. A catering theory of dividends. Journal of Finance,
59(3):1125–1165.
Bates, T.W., Kahle, K.M. and Stulz, R.M. 2009. Why do U.S. firms hold so much
more cash than they used to? Journal of Finance, 64(5):1985-2021.
Stellenbosch University http://scholar.sun.ac.za

124 | P a g e
Bernanke, B. 1989. Is there too much corporate debt? [Online]. Available:
http://www.philadelphiafed.org/research-and-data/publications/business-
review/1989/brso89bb.pdf [06 June 2010].
Benartzi, S., Michealy, R. and Thaler, R. 1997. Do dividends signal the past or the
future? Journal of Finance, 52(3):1007-1034.
Bester, P.G., Wesson, N. and Hamman, W.D. 2010. Share buy-backs for a selection
of JSE listed companies: an exploratory study. South African Journal of
Business Management, 41(4):47–58.
Bhana, N. 1991. Reaction on the Johannesburg stock exchange to major shifts in
dividend policy. South African Journal of Business Management, 22(3):33-40.
Bierman, H. and Smidt, J.R. 2007. The capital budgeting decision: Economic
analysis of investment projects. Ninth edition. London: Routledge.
Blumberg, B. Cooper, D.R. and Schindler, S. 2008. Business research methods.
Second European edition. London: McGraw-Hill Irwin.
Booth, L., Aivazian, V., Demiguc-Kunt, A. and Maksimovic, V. 2001. Capital structure
in developing countries. Journal of Finance, 56(1):87-130.
Bradley, M., Jarrell, G.A. and Kim, E. 1984. On the existence of an optimal capital
structure: Theory and evidence. American Finance Association, 39(3):857-
878.
Brav, A., Graham, J.R., Harvey, C.R. and Michealy, R. 2005. Payout policy in the
21st century. Journal of Financial Economics, 77(3):483-527.
Brealey, R.A., Myers, S.C. and Allan, F. 2008. Principles of corporate finance. Ninth
edition. London: McGraw-Hill Irwin.
Stellenbosch University http://scholar.sun.ac.za

125 | P a g e
Brickley, J. 1983. Shareholder wealth, information signalling, and the specially
designated dividend: An empirical study. Journal of Financial Economics,
12(2):187-210.
Brigham, E.F. and Daves, P.R. 2007. Intermediate financial management. Ninth
edition. New York: McGraw-Hill Irvin.
Brislin, T. 2009. Dividend tax: A sheep in wolves clothing? [Online]. Available:
http://www.moneywebtax.co.za/moneywebtax/view/moneywebtax/en/page266
?oid=39425&sn=Detail [01 March 2010].
Brounen, D., De Jong, A. and Koedijk, K. 2004. Corporate finance in Europe
confronting theory with practice. Financial Management, 33(1):71-101.
Brown, S.L. and Eisenhardt, M.K. 1995. Product development: Past research,
present findings, and future directions. Academy of Management Review,
20(2):343-378.
Bulan, L., Subramanian, N. and Tanlu, L. 2005. When are dividend omissions good
news? Harvard Business working paper. Harvard University.
Cant, M.C., Gerber-Nel, C., Nel, N. and Kotze, T. 2005. Marketing research. Second
edition. Cape Town: New Africa Education.
Chatterjee, S., Wiseman, R.M., Fiegenbaum, A. and Devers, C.E. 2003. Integrating
behavioural and economic concepts of risk into strategic management: The
twain shall meet. Long Range Planning, 36(1):61-79.
Chenhall, R.H. and Langfield-Smith, K. 1998. Adoption of benefits of management
accounting practices: An Australian study. Management Accounting Review,
9(1):1-19.
Stellenbosch University http://scholar.sun.ac.za

126 | P a g e
Childs, P.D., Mauer, D.C. and Ott, S.H. 2005. Interactions of corporate financing and
investment decision: The effect of agency conflicts. Journal of Financial
Economics, 76(3):667-690.
Clayman, M.R., Fridson, M.S. and Troughton, G.H. 2008. Corporate finance: A
practical approach. Boston: Pearson.
Clayman, M.R., Fridson, M.S. and Troughton, G.H. 2009. Corporate finance: A
practical approach. Boston: Pearson. In CFA Program curriculum. 2009.
Corporate finance and portfolio management level one. Boston: Pearson.
Cleary, S. 1999. The relationship between firm investment and firm status. Journal of
Finance, (2):673-692.
Coldwell, D. and Herbst, F. 2004. Business research. Cape Town: Juta.
Collis, J. and Hussey, R. 2009. Business research. Ninth edition. New York:
Palgrave Macmillan.
Coltman, G. 1995. The capital asset pricing model. Unpublished technical report.
University of Cape Town.
Cooper, D.R. and Schindler, P.S. 1998. Business research methods. Sixth edition.
New York: McGraw-Hill.
Correia, C., Flynn, D., Uliana, E. and Wolmald, M. 2007. Financial management.
Sixth edition. Cape Town: Juta.
Courtios, Y., Lai, G.C., and Peterson, P.P. 2008. Cost of capital. In CFA Program
curriculum. Corporate finance and portfolio management level one. Boston:
Pearson.
Cyert, R. and March, J. 1993. A behavioural theory of the firm. Englewood Cliffs:
Prentice-Hall.
Stellenbosch University http://scholar.sun.ac.za

127 | P a g e
Damodaran, A. 2011. Applied corporate finance. Third edition. New York: Willey
Publishing.
DeAngelo, H. and DeAngelo, L. 2012. Dividend policy and financial distress: An
empirical investigation of troubled NYSE firms. Journal of Finance,
45(5):1415-1431.
DeAngelo, H., DeAngelo, L. and Stulz, R. 2006. Dividend policy and the
earned/contributed capital mix: A test of the lifecycle theory. Journal of
Financial Economics, 81(1):227-254.
De Haan, L. 1996. The empirical relationship between investment, dividend and
financing decisions of Dutch firms. DNB - Staff reports, 1(1):1-17.
Denis, D.J. and Denis, D.K. 1993. Leveraged recaps in the curbing of corporate
over-investment. Journal of Applied Corporate Finance, 6(1):60-71.
De Vries, A. 2010. The effect of firm characteristics and economic factors on the
capital structure of South African listed industrial firms. Unpublished master’s
thesis. Cape Town: University of Stellenbosch.
Duchin, R., Ozbas, O. and Sensoy, B.A. 2010. Costly external finance, corporate
investment, and the subprime mortgage credit crises. Journal of Financial
Economics, 97(3):418-435.
Du Plessis, D.P., Archer, A.A. and Affect-Graves, J.F. 1986. Historic income versus
inflation-adjusted income in the dividend decision. South African Journal of
Business Management, 17(3):119-124.
Du Toit, M.J. and Pienaar, A. 2005. A review of the capital budgeting behaviour of
large South African firms. Meditari Accounting Research, 13(1):19-27.
Du Toit, N.E. 2009. The effect of the FTSE and JSE merger on South African capital
markets. Unpublished report. Stellenbosch: University of Stellenbosch.
Stellenbosch University http://scholar.sun.ac.za
128 | P a g e
Ellis, E.C. 2001. The Impact of the taxation of dividends on the dividend policy of
South African companies. Unpublished master’s thesis. Cape Town:
University of Stellenbosch.
Erasmus, P.D. 2011. The influence of dividend yield and stability on share returns:
Implications for dividend policy formulation. Unpublished report. Cape Town:
University of Stellenbosch.
Fama, E.F. and French, K.R. 1998. Taxes, financing decision and firm value. Journal
of Finance, 53(1):819-843.
Fama, E.F. and French, K.R. 2002. Testing trade-off and pecking order predictions
about dividends and debt. Review of Financial Studies, 15(1):1-33.
Fama, E.F. and French, K.R. 2005. Financing decisions: Who issues stock? Journal
of Financial Economics, 76(3):217-248.
Frank, M. and Goyal, V. 2003. Testing the pecking order theory of capital structure.
Journal of Financial Economics, 67(2):217-248.
Firer, C., Gilbert, E. and Maythan, A. 2008. Dividend policy in South Africa.
Investment Analysis Journal, 68(1):5-20.
Fuller, K.P. and Goldstein, M.A. 2003. Dividend policy and market movements.
[Online] Available: http://ssrn.com/abstract=437700 [15 March 2010].
Gevers, W.R. and Hamman, W.D. 1988. Dividend policy in periods of continuing
inflation: An empirical study of listed industrial companies1982-1986. Studies
in Economics and Econometrics, 12(2):15-23.
Gidlow, R. 2009. The historical role of foreign equity portfolio capital in South Africa.
South African Journal of Economic History, 14(1):69- 93.
Stellenbosch University http://scholar.sun.ac.za

129 | P a g e
Gilbert, E. 2003. Do managers of South African manufacturing firms make optimal
capital investment decisions? South African Journal of Business
Management, 34(2):11-17.
Graham, J.R. 2002. How big are the tax benefits of debt? Journal of Finance,
55(5):1901-1941.
Graham, B. and Dodd, D.L. 1934. Security analysis. New York: McGraw-Hill.
Graham, B. and Dodd, D.L. 1962. Security analysis. Sixth edition. New York:
McGraw-Hill.
Graham, J.R. and Harvey, C.R. 2001. The theory and practice of corporate finance:
Evidence from the field. Journal of Financial Economics, 60(2-3):187-244.
Graham, J.R. and Harvey, C.R. 2002. How do CFOs make capital budgeting and
capital structuring decisions? Journal of Applied Corporate Finance, 15(1):1-
30.
Grullon, G., Michealy, R. and Swaminathan, B. 2002. Are dividend changes a sign of
firm maturity? Journal of Business, 75(3):387-424.
Gomes, J.F. 2001. Financing investment. American Economic Review, 91(5):1263-
1285.
Gordon, M.J. 1959. Dividends, earnings and stock prices. Review of Economics and
Statistics, 41(1):99-105.
Gordon, M.J. 1963. Optimum investing and financing policy. Journal of Finance,
18(2):264–272.
Gompers, P.A., Ishii, J.L. and Metrick, A. 2003. Corporate governance and equity
prices. Quarterly Journal of Economics, 118(1):107-155.
Stellenbosch University http://scholar.sun.ac.za

130 | P a g e
Hair, J.F., Money, A.H., Samouel, P. and Page, M. 2007. Research methods for
business. England: Wiley.
Harris, M. and Raviv, A. 1990. Capital structure and the information role of debt.
Journal of Finance, 2(1):321-349.
Harris, M. and Raviv, A. 1996. The capital budgeting process: Incentives and
information. Journal of Finance, 51(4):1139-1174.
Healy, P. and Palepu, K. 1988. Earnings information conveyed by dividend initiations
and omissions. Journal of Financial Economics, 21(2):149-176.
Henne, A., Ostrowski, S. and Reichling, P. 2008. Dividend yield and stability versus
performance on the German stock market: A descriptive study. Review of
Management Science, 3(1):225-248.
Hirshleifer, J. 1958. On the theory of optimal investment decision. Journal of Political
Economy, 66(4):329-352.
Hobbs, J.C. 2006. Dividend signalling and stability. Dissertation for doctorate of
philosophy in finance. Virginia: Virginia University.
Hubbard, R.G. 1998. Capital market imperfections and investment. Journal of
Economic Literature, 35(2):193-225.
Istvan, D.F. 1961. The economic evaluation of capital expenditures. Journal of
Business, 1(1):45-51.
Jensen, M.C. 1986. Agency cost and free cash flow, corporate finance and
takeovers. American Economic Review, 76(2):323-339.
Jensen, M.C. 2010. Value maximisation, stakeholder theory, and the corporate
objective function. Journal of Applied Corporate Finance, 22(1)32-42.
Stellenbosch University http://scholar.sun.ac.za
131 | P a g e
Jensen, M.C. and Meckling, W. 1976. Theory of the firm: Managerial behaviour,
agency cost and ownership structure. Journal of Financial Economics,
3(4):305-360.
Jog, V.M. and Srivastava, A.K. 1995. Capital budgeting practices in corporate
Canada. Financial Practice and Education, 5(2):37-43.
Kaplan, S.N. 1994. Campeau’s acquisition of federated: Value destroying or value
added? Journal of Financial Economics, 25(1):191-212.
Keller, G. 2005. Statistics for management and economics. Seventh edition.
Belmont: Thomson higher education.
Kester, W.C. 1984. Today's options for tomorrow’s growth. Harvard Business
Review, 1(1):153-160.
Kleim, D.B. 1985. Dividend yields and stock returns: Implications of abnormal
January effect. Journal of Financial Economics, 14(3):473-489.
Knight, R.F. and Affect-Graves, J.F. 1987. An evaluation of dividend signalling on the
JSE. South African Journal of Business and Management, 18(1):79-82.
Knowles, H.C. and Petty, D.H. 1992. The dividend investor: A safe and sure way to
beat the market with high-yield dividend stock. Unpublished report. Chicago:
Probus.
Kokic, P.N. and Bell, P.A. 1994. Optimal winsorizing cutoffs for a stratified finite
population estimator. Journal of Official Statistics, 10(4):419–435.
Kooyman, K. 2010. When the time comes to get the cash out. Business Day:
Investors monthly, 1 June:32-39.
Lambrechts, I.J. 1992. Finansiёle bestuur. Pretoria: Van Schaik.
Stellenbosch University http://scholar.sun.ac.za
132 | P a g e
Leary, M. and Roberts, M. 2010. The pecking order, debt capacity, and informational
asymmetry. Journal of Financial Economic, 95(1):332-355.
Lie, E. 2000. Excess funds and agency problems: An empirical study of incremental
cash disbursements. Review of Financial Studies, 13(1):218-245.
Lintner, J. 1956. Distributions of incomes of corporations among dividends, retained
earnings and taxes. American Economic Review, 46(2):97-113.
Lintner, J. 1962. Dividends, earnings, leverage, and the supply of capital to
corporations. Review of Economics and Statistics, 44(3):243-269.
Long, M.S. and Malitz, E.B. 1985. Investment patterns and financial leverage.
[Online] Available: http://www.nber.org/chapters/c11425 [13 November 2009].
Mackie-Mason, J. 1990. Do taxes affect corporate financing decisions? Journal of
Finance, 45(5):1471-1493.
Majluf, N. and Myers, S. 1984. Corporate financing and investment decisions when
firms have information that investors do not have. Journal of Financial
Economics, 13(1):187– 221.
Mao, J.C. 1970. Models of capital budgeting, EV vs ES. Journal of Financial and
Quantitative Analysis, 23(2):657-675.
Marsh, T.A. and Merton, R.C. 1987. Dividend behaviour for the aggregate stock
market. Journal of Business, 60(1):1-40.
Marx, J. 2001. Empirical findings of finance directors’ views on dividend policy.
Management Dynamics: Contemporary Research, 10(2):637-659.
Mason, S.P. and Merton, R.C. 1985. The role of contingent claims analysis in
corporate finance. Recent advances in corporate finance. Homewood: Irwin.
Stellenbosch University http://scholar.sun.ac.za

133 | P a g e
McDaniel, C.F. and Gates, R. 2001. Marketing research essentials. Third edition.
Cincinnati: South-Western College.
McGregor, BFA (Pty). Ltd. 2010. Research domain. Software and database.
Johannesburg.
Michealy, R., Thaler, R.H. and Womack, K.L. 1995. Price reactions to dividend
initiations and omissions: Overreaction or drift? Journal of Finance, 50(3):573-
608.
Mintzberg, H., Raisinghani, D. and Theoret, A. 1976. The structure of unstructured
decision process. Administrative Science Quarterly, 36(10):1246-1275.
Miller, M.H. 1960. The competitive market assumption and capital budgeting criteria.
Journal of Financial Management, 16(4):22-28.
Miller, M.H. and Rock, K. 1985. Dividend policy under asymmetric information.
Journal of Finance, 40(4):1031-1051.
Modigliani, F. and Miller, M.H. 1958. The cost of capital, corporate finance, and the
theory of investment. American Economic Review, 48(3):261-297.
Modigliani, F. and Miller, M.H. 1961. Dividend policy, growth, and the valuation of
shares. Journal of Business, 34(4):411-433.
Modigliani, F. and Miller, M.H. 1963. Corporate income tax and the cost of capital: A
correction. American Economic Review, 53(3):433-443.
Modigliani, F. and Miller, M.H. 1966. Some estimates of the cost of capital to the
electric utility industry, 1954-1957. American Economic Review, 56(3):333-
391.
Stellenbosch University http://scholar.sun.ac.za

134 | P a g e
Msweli-Mbanga, P. and Mkhize, H. 2006. The risk-adjusted performance of
companies with female directors: A South African case. South African Journal
of Economic and Management Sciences, 10(2):207-213.
Mukherjee, T.K. and Henderson, G.V. 1987. The capital budgeting process: Theory
and practice. [Online] Available: http://www.jstor.org/stable/25060944 [13
August 2010].
Myers, S.C. 1977. Determinants of corporate borrowing. Journal of Financial
Economics, 5(2):147-175.
Myers, S.C. 1984. The capital structure puzzle. Journal of Finance, 39(3):575-592.
Myers. S.C. 1987. Finance theory and financial strategy. Midland Corporate Finance
Journal, 5(1):6-13.
O'Leary, Z. 2005. Researching real-world problems: A guide to methods of inquiry.
London: Sage.
Palepu, K.G. 1990. Predicting consequences of leveraged buy-outs. Journal of
Financial Economics, 26(2):247-262.
Parry, H.M.A. and Firer, C. 1990. Capital budgeting under uncertainty: An empirical
study. South African Journal of Business Management, 21(3):52-58.
Pettit, R.R. 1977. Taxes, transaction costs and the clientele effect of dividends.
Journal of Financial Economics, 51(1):419-436.
Pike, R. 1996. A longitudinal survey on capital budgeting practices. Journal of
Business Finance and Accounting, 23(1):79-92.
Pocock, A.S., Correia, C. and Wormald, M.P. 1991. An analysis of the approaches
used by industrial companies on the JSE to identify their cost of capital. De
Ratione, 5(1):27-40.
Stellenbosch University http://scholar.sun.ac.za

135 | P a g e
Porter, M. 1992. Capital choices: Changing the way America invests in industry.
Journal of Applied Corporate Finance, 5(1):4-16.
Rajan, R.G. and Zingales, L. 1995. What do we know about capital structure? Some
evidence from international data. Journal of Finance. 50(5):1421-1460.
Ross, M. 1986. Capital budgeting practice of twelve large manufacturers. Financial
management, 1(1):15-22.
Ross, S.A., Westerfield, R.W. and Bradford, D. 1993. Fundamentals of corporate
finance. Second edition. Homewood: Irvin Press.
Ryan, P.A. and Ryan, G.P. 2002. Capital budgeting practices of the Fortune 1000:
How have things changed? Journal of Business and Management, 8(4):355-
364.
SAICA. 2010. Research domain. Software and database. Johannesburg.
SARS, 2009. South Africa’s tax system. [Online] Available:
http://www.sars.co.za/home.asp?pid=208 [01 September 2009].
Saville, A. 2010. When the time comes to get the cash out. Business Day: Investors
monthly, 1 June:33-39.
Schall, L.D., Sundem, G.L. and Geijsbeek, W.R. 1978. Survey and analysis of capital
budgeting methods. Journal of Finance, 33(1):281-288.
Seneque, P. and Gourlay, B. 1983. Dividend policy and practice in South Africa. The
Investment Analysis Journal, 21(2):22-28.
Sharpe, F.W. 1966. Mutual fund performance. Journal of Business, 39(1):119-138.
Stellenbosch University http://scholar.sun.ac.za
136 | P a g e
Shyam-Sunder, L. and Myers, S.C. 1999. Testing static trade-off against pecking
order models of capital structure. Journal of Financial Economics, 51(2):219-
244.
Smith, A.J. 1990. Corporate ownership structure and performance: The case of
managed buy-outs. Journal of Financial Economics, 8(1):3-35.
Smith, C.W. and Watts, R.L. 1992. The investment opportunity set and corporate
financing, dividend, and financing policies. Journal of Financial Economics,
32(5):262-292.
Statman, M. and Tyebjee, T. 1985. Optimistic capital budgeting forecasts: An
experiment. Journal of Financial Management, 1(1):27-33.
Stiglitz, J.E. 1988. Why financial structure matters. Journal of Economic
Perspectives, 4(2):121-126.
Stern, J.M. and Chew, D.H. 2003. The revolution in corporate finance. Fourth edition.
London: Blackwell Publishing.
Stow, J.D., Robinson, T.R., Pinto, J.E. and McLeavey, D.W. 2007. Equity asset
valuation. Second edition. Hoboken: Wiley.
Trigeorgis, L. 1986. Valuing real investment opportunities: An options approach to
strategic capital budgeting. Unpublished doctoral dissertation. Boston:
Harvard University.
Trigeorgis, L. and S.P. Mason. 1987. Valuing managerial flexibility. Midland
Corporate Finance Journal, 5:14-21.
Tyrrall, D.E. 1998. Discounted cash flow, rational decision or psychological crutch?
Management accounting: Magazine for Chartered Management Accountants,
76(1):46-50.
Stellenbosch University http://scholar.sun.ac.za
137 | P a g e
Vanek, M. 2009. Dividend taxes: the implications. [Online] Available:
http://www.moneywebtax.co.za/moneywebtax/view/moneywebtax/en/page346
77?oid=38347&sn=Detail [01 August 2009].
Van der Merwe, E. 2010. When the time comes to get the cash out. Business Day:
Investors monthly, 1 June:32-40.
Verbeeten, F.H.M. 2006. Do organisations adopt sophisticated capital budgeting
practices to deal with uncertainty in the investment decision? Management
Accounting Research, 17(1):106-120.
Wald, J.K. 1999. How firm characteristics affect capital structure: an international
comparison. Journal of Financial Research, 22(2):161-187.
Weiss, L.A. and Wruck, K.H. 1998. Information problems, conflict of interest, and
asset stripping: Chapter 11’s failure in the case of eastern airlines. Journal of
Financial Economics, 48(1):55-97.
Wolmarans, H.P. 2000. Does “dividend-investing” have value for the South African
investor? Meditari Accountancy Research, 8(1):229-247.
Wolmarans, H.P. 2003. Does Linter’s dividend model explain South African dividend
payments? Meditari Accountancy Research, 11(1):243-254.
Wruck, K.H. 1990. Financial distress, reorganisation, and organisational efficiency.
Journal of Financial Economics, 27(1):419-444.
Stellenbosch University http://scholar.sun.ac.za