dividend behaviour of public listed firm in...
TRANSCRIPT

DIVIDEND BEHAVIOUR OF PUBLIC LISTED FIRM IN MALAYSIA
By:
NORHISAM BIN YUSOFF
Thesis Submitted to
Othman Yeop Abdullah Graduate School of Business,
Universiti Utara Malaysia
in Partial Fulfilment of the Requirement for the Master of Sciences (Finance)

ii
Permission to Use
In presenting this dissertation/project paper in partial fulfillment of the requirements
for a Post Graduate degree from the Universiti Utara Malaysia (UUM), I agree that
the Library of this university may make it freely available for inspection. I further
agree that permission for copying this project paper in any manner, in whole or in
part, for scholarly purposes may be granted by my supervisor or in their absence, by
the Dean of Othman Yeop Abdullah Graduate School of Business where I did my
project paper. It is understood that any copying or publication or use of this project
paper parts of it for financial gain shall not be allowed without my written
permission. It is also understood that due recognition shall be given to me and to the
UUM in any scholarly use which may be made of any material in my project paper.
Request for permission to copy or to make other use of materials in this
dissertation/project paper in whole or in part should be addressed to:
Dean of Othman Yeop Abdullah Graduate School of Business
Universiti Utara Malaysia
06010 UUM Sintok
Kedah Darul Aman
iii
Abstract
The Malaysian financial market is governed and regulated by the Bursa Malaysia
Berhad, an indicator of Malaysian financial market. Dividend policy in Malaysian
companies is often inflexible as most of the firms are unwilling to cut or keep away
from omitting dividend even when the company‟s earnings are falling. This research
examined whether there are any correlation between earnings, firm‟s size and
liquidity against dividend. This research used data from companies from seven
different selected sectors covering over period of six years from 2007 to 2012. From
the results obtained, this research confirms that profitability, sizes and liquidity are
the important determinants of dividend payment in Malaysia and the influence of
industry on payout decision. The companies studied appear to be reluctant to omit
dividend even when they suffers losses.
Keywords: dividend, determinant, payout decision

iv
Abstrak
Pasaran kewangan Malaysia ditadbir dan dikawal selia oleh Bursa Malaysia Berhad,
yang merupakan penunjuk pasaran kewangan Malaysia. Dasar dividen syarikat
Malaysia sering tidak fleksibel kerana kebanyakan firma tidak mahu untuk
mengurangkan atau menjauhkan diri dari meninggalkan dividen walaupun
pendapatan syarikat jatuh. Kajian ini menguji sama ada terdapat apa-apa hubungan
antara pendapatan, saiz firma dan kecairan tunai terhadap dividen. Kajian ini
menggunakan data dari syarikat dari tujuh sektor terpilih berbeza yang meliputi
tempoh enam tahun 2007-2012. Daripada keputusan yang didapati, kajian ini
mengesahkan bahawa keuntungan, saiz dan kecairan tunai adalah penentu penting
dalam pembayaran dividen di Malaysia dan pengaruh industri atas keputusan
pembayaran. Syarikat-syarikat yang dikaji kelihatan keberatan untuk meninggalkan
dividen walaupun mereka mengalami kerugian.
Kata kunci: dividen, penentu, pembayaran dividen

v
Acknowledgement
I would like to express profound gratitude to my supervisor, Dr. Ahmad Rizal
Mazlan, for his invaluable support, encouragement, supervision and useful
suggestions throughout this research work. His moral support and continuous
guidance have enabled me to complete my work successfully.
I am also thankful to Universiti Utara Malaysia (UUM) for giving me the
opportunity to pursue Master of Science (Finance). In addition, my special
appreciation goes to all my lecturers, whose dedication and encouragement have
guided me to acquire the essential knowledge in this field.
I am as ever, especially indebted to my parents, wife daughter for their love and
support throughout my life. Lastly, I also would like to express my thanks to all my
fellow classmates and friends who assisted and encouraged me in completing my
studies.

vi
Table of Contents
Permission to Use ......................................................................................................... ii
Abstract ...................................................................................................................... iii
Abstrak ........................................................................................................................ iv
List of Tables............................................................................................................ viii
CHAPTER ONE .......................................................................................................... 1
1.1 Introduction and back ground of the study .................................................... 1
1.2 Problem Statement ........................................................................................ 7
1.3 Research Objectives .................................................................................... 10
1.4 Significance of the Study ............................................................................ 11
1.5 Scope and Limitations of the Study ............................................................ 11
CHAPTER TWO ....................................................................................................... 13
2.1 Types of Dividend ....................................................................................... 13
2.2 Dividend Policy ........................................................................................... 17
2.2.1 Residual Dividend Policy .................................................................... 17
2.2.2 Dividend Stability Policy ..................................................................... 18
2.2.3 Low-Regular-Dividend-Plus-Extras .................................................... 18
2.3 Dividend Theory .......................................................................................... 19
2.3.1 Tax Preference Theory ......................................................................... 19
2.3.2 Irrelevancy Theory ............................................................................... 20
2.3.3 Bird-in-the Hand Theory ...................................................................... 20
2.3.4 Signaling Theory .................................................................................. 21
2.4 Dividend Determinants ................................................................................ 23
2.4.1 Profitability .......................................................................................... 24
2.4.2 Size of Firms ........................................................................................ 26
2.4.3 Liquidity ............................................................................................... 26
2.5 Statistical Testing ........................................................................................ 28
2.6 Hypotheses of the Study .............................................................................. 29
2.7 Conceptual Framework ............................................................................... 30
CHAPTER THREE .................................................................................................... 31
3.1 Data Description and Sample Construction ................................................ 31
3.2 Data Analysis .............................................................................................. 32

vii
CHAPTER FOUR ...................................................................................................... 36
4.1 Introduction ................................................................................................. 36
4.2 Percentage of Payers and Non-Payers ......................................................... 36
4.3 Cross Tabulation Results ............................................................................. 38
4.3.1 EPS and DPS ........................................................................................ 38
4.3.2 ROE and DPS ....................................................................................... 41
4.3.3 Sales and DPS ...................................................................................... 42
4.3.4 Shareholders‟ Equity and DPS ............................................................. 43
4.3.5 Net Profit and DPS ............................................................................... 44
4.4 Correlation Analysis .................................................................................... 46
4.4.1 Correlation Testing for All Sector........................................................ 46
4.4.2 Correlation Testing for Consumer Product Sector ............................... 47
4.4.3 Correlation Testing for Construction Sector ........................................ 48
4.4.4 Correlation Testing for Industrial Product Sector ................................ 49
4.4.5 Correlation Testing for Plantation Sector ............................................ 49
4.4.6 Correlation Testing for Properties Sector ............................................ 50
4.4.7 Correlation Testing for Technology Sector.......................................... 51
4.4.8 Correlation Testing for Trading and Service Sector ............................ 51
4.4.9 Summary of Correlation Analysis ........................................................ 52
4.5 Regression Analysis .................................................................................... 53
4.6 Conclusion ................................................................................................... 55
CHAPTER FIVE ........................................................................................................ 57
5.1 Conclusion ................................................................................................... 57
5.2 Recommendation ......................................................................................... 60
References .................................................................................................................. 61

viii
List of Tables
Table 1.1: Summary of Models Tested in Previous Studies ……………………………3
Table 1.2: Comparison between Imputation System and Single
Tier Tax System …………………………………………………………………4
Table 1.3: Independent Variable……………………………………………………….....6
Table 2.1: Sample Description …………………………………………………………..31
Table 4.1 Percentage of Payers and Non-Payers for the Selected Sectors………..37
Table 4.2 Cross Tabulation of EPS and DPS………………………………………….40
Table 4.3 Cross Tabulation of ROE and DPS…………………………………………41
Table 4.4 Cross Tabulation of Sales and DPS………………………………………...42
Table 4.5 Cross Tabulation of Shareholders’ Equity and DPS……………………..43
Table 4.6 Cross Tabulation of Net Profit and DPS…………………………………...44
Table 4.7 Correlation Matrix for All Sectors………………………………………….46
Table 4.8 Correlation Matrix for Consumer Product Sector………………………..47
Table 4.9 Correlation Matrix for Construction Sector……………………………….48
Table 4.10 Correlation Matrix for Industrial Product Sector………………………...49
Table 4.11 Correlation Matrix for Plantation Sector………………………………….49
Table 4.12 Correlation Matrix for Properties Sector………………………………….50
Table 4.13 Correlation Matrix for Technology Sector…………………………………51
Table 4.14 Correlation Matrix for Trading and Service Sector………………………52
Table 4.15 Summary of the Correlation Analysis for All Sectors…………………….52
Table 4.16 Pooled Regression Analysis………………………………………………….53

1
CHAPTER ONE
INTRODUCTION
1.1 Introduction and back ground of the study
An organization‟s willingness to pay dividends to their shareholders over the time
can provide a positive message about its financial fundamentals and performance. In
general, profitable companies pay dividends and dividends are generally paid
quarterly. Dividends also are able to provide a signal to other potential investors of
what the company is really worth (Asquith and Mullins, 1983). A cautiously
planned and executed policy is important to maximizing shareholder wealth.
Dividend policy is needed as unpredictable dividend announcement will drop a
bombshell to the market participants which can result in a drop in the company‟s
value when there is a selling off. Thus, a well-devised policy could prevent these
unexpected circumstances and safeguard or even boost company value (Salih and
Alaa, 2010). Dividend refers to a sum, which a firm pays to its shareholders.
Dividend payment is not a cost for a company; it is an allocation of assets among the
shareholders. However high-growth companies rarely offer dividends because they
normally reinvest the profit so that they can sustain higher growth1 (Ross et al.,
2006).
1 Residual Dividend Approach, whereby firm will pay dividends only after meeting its investment
needs.

The contents of
the thesis is for
internal user
only

61
References
Anderson, Hamish D., Chi, Jing,Ing-aram, Chayot and Liang, Lu(2010) Stock
Dividend Puzzles in China. Massey U. College of Business Research Paper
No. 16.
Abdulrahman (2007), Dividend Policy and Payout Ratio: Evidence from Kuala
Lumpur Stock Exchange, TheJournal of Risk Finance, Vol. 8 No. 4 pp. 349-
363.
AlonBrav, John R.Graham, Campbell R. Harvey and RoniMichaely (2004), “Payout
Policy in the 21st Century”.
Alonso, Financial decisions and growth opportunities: a Spanish firm's panel data
analysis. Applied Economic Letters, 2005, vol 15, pp 391-407
Al-Yahyaee, Khamis, Pham, Toan M. and Walter, Terry S. (2010) The Information
Content of Cash Dividend Announcements in a Unique Environment. Journal
of Banking and Finance, 2010.
Ahmed, Tanveer (2012), Effects of Dividend Policy on Share Price Volatility: A
Comprehensive Empirical Analysis. Iqra University Islamabad Campus.
Anand, Manoj (2002), Corporate Finance Practices in India: A Survey. Vikalpa, Vol.
27, No. 4, pp. 29-56, October - December 2002.
Akpomi, Meg and Nnadi, Matthias (2008), The Effect of Taxes on Dividend Policy
of Banks in Nigeria. International Research Journal of Finance and
Economics, No. 19, p. 48.
Amidu, M. &Abor, J. (2006). Determinants of the Dividend payout in Ghana, The
Journal of Risk Finance Vol. 7, N o. 2, 136-145
Anupam. M. (2012) An Empirical Analysis of Determinants of Dividend Policy -
Evidence from the Japanese Companies. Global Review of Accounting and
Finance Vol. 3.No. 1. 18 – 31
Asquith, P. and Mullins, D. (1983), The Impact of In itiating Dividend Payments on
Shareholders‟ Wealth, The Journal of Business, Vol. 56 No. 1 pp. 77-96.
Baker, K. and Powell, G. (2012), Dividend Policy in Indonesia: Survey Evidence
from Executives, Journal of Asia Business Studies, Vol. 6 No. 1 pp. 79-92.
62
Baker, K & Gandhi, D. 2007, The Perception of Dividends by Canadian Managers,
International Journal of Managerial Finance, Vol. 13 No. 1, pp. 70-91
Baker, M. &Wurgler, J. (2002). A catering theory of dividends. Journal of Finance,
November 7, 1-61.
Brav, Alon, Harvey, Campbell R., Graham, John R. and Michaely, Roni(2005),
Payout Policy in the 21st Century. Tuck Contemporary Corporate Finance
Issues III Conference Paper.
Bourguignon, Francois, Fournier, Martin and Gurgand, Marc, (2004) Selection Bias
Corrections Based on the Multinomial Logit Model: Monte-Carlo
Comparisons.
Chi-square test. Retrieved on June 2013 from http://www2.lv.psu.edu/jxm57.
Dittmar, Amy K. and Dittmar, Robert F. (2002), Stock Repurchase Waves: An
Explanation of the Trends in Aggregate Corporate Payout Policy.
Dewenter, Kathryn L. and Warther, Vincent A. (1998), Dividends, Asymmetric
Information, and Agency Conflicts: Evidence from a Comparison of the
Dividend Policies of Japanese and U.S. Firms. Journal of Finance, June 1998.
Eckbo, B. Espen and Verma, Savita, Managerial Shareownership (1994), Voting
Power, and Cash Dividend Policy. Journal of Corporate Finance, Vol. 1, pp.
33-62, 1994.
Elayan, Fayez A., Li, Jennifer, Donnelly, Maureen E. and Young, Allister W. (2009),
Changes to Income Trust Taxation in Canada: Investor Reaction and Dividend
Clientele Theory. Journal of Business Finance & Accounting, Vol. 36, Nos. 5-
6, pp. 725-753, June/July 2009.
Franklin Allen, Antonio Bernardor& Ivo Welchx (1998) A Theory of Dividends on
Tax Clienteles, UCLA Research. Retrievedon July 10, 2013 from
http://finance.wharton.upenn.edu/~rlwctr/papers/9815.pdf.
GhassanOmet (2004), “Dividend Policy Behaviour in the Jordanian Capital
Market”.International Journal of Business, 9(3), ISSN: 1083 -4346.
Goetzmann, W. N. and P. Jorion(1993), “Testing the predictive power of dividend
yields “, Journal of Finance 48, 663-79.
Herman Manakyan&Carolyn Carroll (1991), “Dividend Change Announcements and
Structural Change” Quarterly Journal of Business and Economics, Vol. 30.
63
Jasim and Hameeda (2011), Corporate Dividends Decisions: Evidence from Saudi
Arabia, TheJurnal of Risk Finance, Vol 12 No. 1 pp. 41-56.
Jensen, M. C. (1986), Agency costs of free cash flow, corporate finance, and
takeovers. American Economic Review, May, 659-665.
Jose Manuel Benzinho (2004), “The Dividend Policy of The Portuguese
Corporations Evidence from Euronext Lisbon” Journal of International
Conference of Economics Policies in the New Millenium.
Keown, A. J., Martin, J. D., Petty, J. W. & Scott, D. F. (2002). Financial
management: Principles and applications (9th
ed.). New York, NJ: Prentice
Hall.
Kun-Li L. &Chung-Hua S. (2012) The Impact of Corporate Governance on the
Relationship between Investment Opportunities and Dividend Policy: An
Endogenous Switching Model Approach. Asia-Pacific Journal of Financial
Studies (2012) 41, 125–145
Lintner, J.(1956), “Distribution of incomes of corporations among dividends,
retained earnings and taxes”, Journal on American Economic Review 36, 97-
113.
Li, Qiang, Sun, Hua and Ong, SeowEng (2006), REIT Splits and Dividend Changes:
Tests of Signaling and Information Substitutability. Journal of Real Estate
Finance and Economics, Vol. 3, No. 2, 2006.
Marsh, T. A. and R. C. Merton(1987), “Dividend behaviour for the aggregate stock
market”,Journal of Business 60, 1-40.
Mahadwartha, PutuAnom (2003), Predictability Power of Dividend Policy and
Leverage Policy to Managerial Ownership in Indonesia: An Agency Theory
Perspective. JurnalEkonomidanBisnis Indonesia, Vol.18, No.3, 2003.
Magni, Carlo Alberto (2007), Relevance or Irrelevance of Retention for Dividend
Policy Irrelevance (November 4, 2007). International Review of Applied
Financial Issues and Economics, Vol. 2, No. 2, pp. 232-247, 2010.
Mohammed S. and Mohammed M (2012) Factors Affecting Dividends Policy
Decisions; An Empirical Study on Industrial Corporations Listed in Amman
Stock Exchange. Journal of Contemporary Research in BusinessVol 4, No 5

64
Norhayati et al. (2011), Empirical Analysis of Determinants of Dividend Payment:
Profitability and Liquidity, Accounting Research Institute, University
Teknologi MARA, Malaysia.
Norhayati, M. (2005), Information Signaling and Dividend Policies in Malaysia.
Unpublished Ph.D. Thesis, University Putra Malaysia.
Pandey, I. M. (2001), Corporate Dividend Policy and Behaviour: The Malaysian
Experience. IIMA Working Paper No. 2001-11-01.
Pierce, D. A. and L. D. Haugh(1977), “Causality in temporal systems:
Characterizations and a survey”, Journal of Econometrics 5, 265-93.
Ross, S., Westerfield, R. (2006), Corporate Finance Fundamentals.
Salih, Alaa, A (2010), The Effect of Dividend Policy on Market Value, Doctoral
Thesis, Durham University.
Samad, Fazilah A., Shaharudin, Roselee Shah and Soh, Guat Ha (2007), Does
Dividend Stability Provide a Promising Stock Return? Evidence from Bursa
Malaysia. 20th Australasian Finance & Banking Conference 2007.
Shinozaki, Shinya and Uchida, Konari (2010), Do Stock Option Rewards Increase
Dividend Payments? New Evidence from Japan.
Taher A. (2012) Determinants of dividend payout policy: Evidence from
Bangladesh. International Journal of Economic Practices and Theories, Vol.
2,
Turki S. & Ahmed A (2013) Determination of Dividend Policy: The Evidence from
Saudi Arabia. International Journal of Business and Social Science Vol. 4 No.
1
Urrutia, Jorge L. (1995), “Long Term and Short Term causal relations between
dividends and stock prices: a test of Lintner‟s dividend model and the present
valuwe model of stock prices”, Journal of Financial Research.
Xi He, Mingsheng Li, Jing Shi, Garry Twite (2009) “ Cash versus Stock Dividends”
Journal of Determinants of Dividend Policy in Chinese Firms.

65
Appendix
Appendix 1
EPS * DPS Cross Tabulation for Consumer Product
Dividend per Share Total
decrease increase maintain omission
EPS
decrease
Count 58 38 27 24 147
% within EPS 39.5% 25.9% 18.4% 16.3% 100.0%
% within DPS 61.1% 27.3% 54.0% 26.4% 39.2%
% of Total 15.5% 10.1% 7.2% 6.4% 39.2%
increase
Count 36 97 23 29 185
% within EPS 19.5% 52.4% 12.4% 15.7% 100.0%
% within DPS 37.9% 69.8% 46.0% 31.9% 49.3%
% of Total 9.6% 25.9% 6.1% 7.7% 49.3%
maintain
Count 1 1 0 0 2
% within EPS 50.0% 50.0% 0.0% 0.0% 100.0%
% within DPS 1.1% 0.7% 0.0% 0.0% 0.5%
% of Total 0.3% 0.3% 0.0% 0.0% 0.5%
negative
Count 0 3 0 38 41
% within EPS 0.0% 7.3% 0.0% 92.7% 100.0%
% within DPS 0.0% 2.2% 0.0% 41.8% 10.9%
% of Total 0.0% 0.8% 0.0% 10.1% 10.9%
Total
Count 95 139 50 91 375
% within EPS 25.3% 37.1% 13.3% 24.3% 100.0%
% within DPS 100.0% 100.0% 100.0% 100.0% 100.0%
% of Total 25.3% 37.1% 13.3% 24.3% 100.0%
Chi-Square Tests
Value df Asymp. Sig. (2-
sided)
Pearson Chi-Square 149.268a 9 .000
Likelihood Ratio 136.072 9 .000
N of Valid Cases 375
a. 4 cells (25.0%) have expected count less than 5. The minimum
expected count is .27.

66
Chi-Square Tests
Value df Asymp. Sig. (2-
sided)
Pearson Chi-Square 153.924a 9 .000
Likelihood Ratio 139.890 9 .000
N of Valid Cases 375
a. 4 cells (25.0%) have expected count less than 5. The minimum
expected count is .13.
Appendix 2
ROE * DPS Cross Tabulation for Consumer Product
Dividend per Share Total
decrease increase maintain omission
ROE
decrease
Count 64 44 28 28 164
% within ROE 39.0% 26.8% 17.1% 17.1% 100.0%
% within DPS 67.4% 31.7% 56.0% 30.8% 43.7%
increase
Count 31 92 22 24 169
% within ROE 18.3% 54.4% 13.0% 14.2% 100.0%
% within DPS 32.6% 66.2% 44.0% 26.4% 45.1%
maintain
Count 0 0 0 1 1
% within ROE 0.0% 0.0% 0.0% 100.0% 100.0%
% within DPS 0.0% 0.0% 0.0% 1.1% 0.3%
zero
Count 0 3 0 38 41
% within ROE 0.0% 7.3% 0.0% 92.7% 100.0%
% within DPS 0.0% 2.2% 0.0% 41.8% 10.9%
Total
Count 95 139 50 91 375
% within ROE 25.3% 37.1% 13.3% 24.3% 100.0%
% within DPS 100.0% 100.0% 100.0% 100.0% 100.0%
67
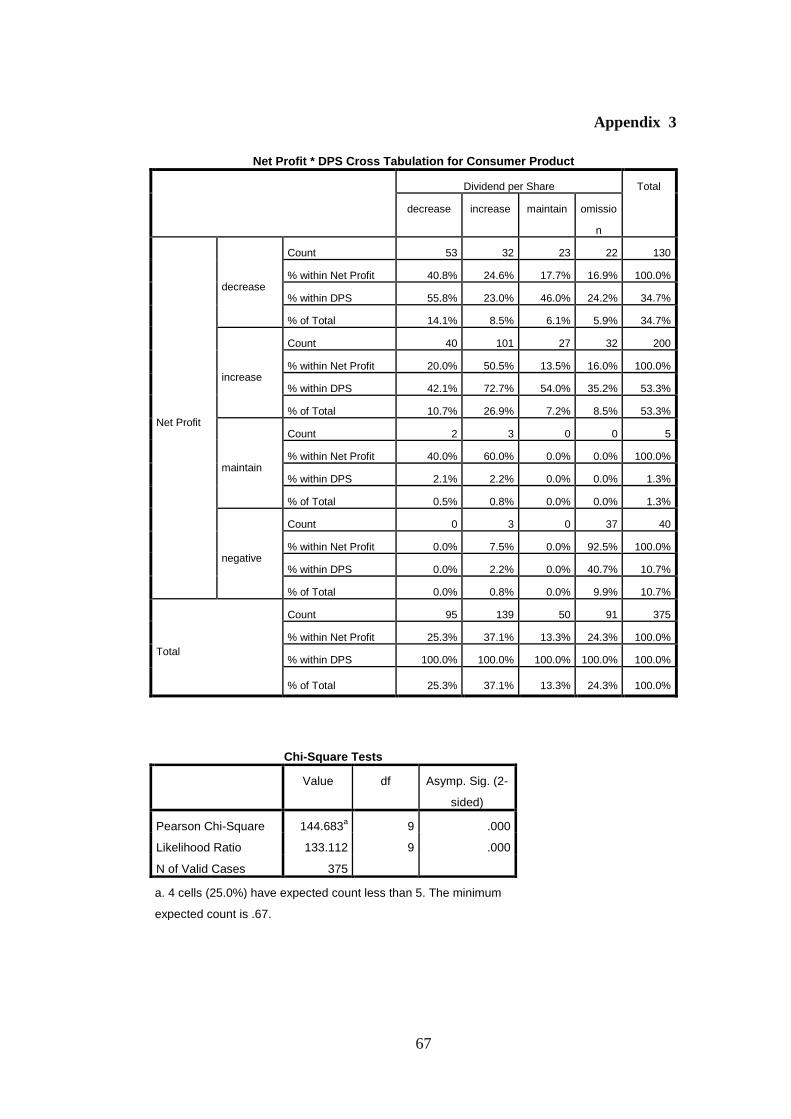
Appendix 3
Net Profit * DPS Cross Tabulation for Consumer Product
Dividend per Share Total
decrease increase maintain omissio
n
Net Profit
decrease
Count 53 32 23 22 130
% within Net Profit 40.8% 24.6% 17.7% 16.9% 100.0%
% within DPS 55.8% 23.0% 46.0% 24.2% 34.7%
% of Total 14.1% 8.5% 6.1% 5.9% 34.7%
increase
Count 40 101 27 32 200
% within Net Profit 20.0% 50.5% 13.5% 16.0% 100.0%
% within DPS 42.1% 72.7% 54.0% 35.2% 53.3%
% of Total 10.7% 26.9% 7.2% 8.5% 53.3%
maintain
Count 2 3 0 0 5
% within Net Profit 40.0% 60.0% 0.0% 0.0% 100.0%
% within DPS 2.1% 2.2% 0.0% 0.0% 1.3%
% of Total 0.5% 0.8% 0.0% 0.0% 1.3%
negative
Count 0 3 0 37 40
% within Net Profit 0.0% 7.5% 0.0% 92.5% 100.0%
% within DPS 0.0% 2.2% 0.0% 40.7% 10.7%
% of Total 0.0% 0.8% 0.0% 9.9% 10.7%
Total
Count 95 139 50 91 375
% within Net Profit 25.3% 37.1% 13.3% 24.3% 100.0%
% within DPS 100.0% 100.0% 100.0% 100.0% 100.0%
% of Total 25.3% 37.1% 13.3% 24.3% 100.0%
Chi-Square Tests
Value df Asymp. Sig. (2-
sided)
Pearson Chi-Square 144.683a 9 .000
Likelihood Ratio 133.112 9 .000
N of Valid Cases 375
a. 4 cells (25.0%) have expected count less than 5. The minimum
expected count is .67.

68
Appendix 4
Sales * DPS Cross Tabulation for Consumer Product
Dividend per Share Total
decrease increase maintain omission
Sales
decrease
Count 29 32 13 35 109
% within Sales 26.6% 29.4% 11.9% 32.1% 100.0%
% within DPS 30.5% 23.0% 26.0% 38.5% 29.1%
% of Total 7.7% 8.5% 3.5% 9.3% 29.1%
increase
Count 66 107 37 56 266
% within Sales 24.8% 40.2% 13.9% 21.1% 100.0%
% within DPS 69.5% 77.0% 74.0% 61.5% 70.9%
% of Total 17.6% 28.5% 9.9% 14.9% 70.9%
Total
Count 95 139 50 91 375
% within Sales 25.3% 37.1% 13.3% 24.3% 100.0%
% within DPS 100.0% 100.0% 100.0% 100.0% 100.0%
% of Total 25.3% 37.1% 13.3% 24.3% 100.0%
Chi-Square Tests
Value df Asymp. Sig. (2-
sided)
Pearson Chi-Square 6.685a 3 .083
Likelihood Ratio 6.602 3 .086
N of Valid Cases 375
a. 0 cells (.0%) have expected count less than 5. The minimum
expected count is 14.53.

69
Appendix 5
No of Shares * DPS Cross Tabulation for Consumer Product
Dividend per Share Total
decrease increase maintain omission
No of
Shares
decrease
Count 32 60 26 42 160
% within No
of Shares 20.0% 37.5% 16.2% 26.2% 100.0%
% within
DPS 33.7% 43.2% 52.0% 46.2% 42.7%
% of Total 8.5% 16.0% 6.9% 11.2% 42.7%
increase
Count 63 79 24 49 215
% within No
of Shares 29.3% 36.7% 11.2% 22.8% 100.0%
% within
DPS 66.3% 56.8% 48.0% 53.8% 57.3%
% of Total 16.8% 21.1% 6.4% 13.1% 57.3%
Total
Count 95 139 50 91 375
% within No
of Shares 25.3% 37.1% 13.3% 24.3% 100.0%
% within
DPS 100.0% 100.0% 100.0% 100.0% 100.0%
% of Total 25.3% 37.1% 13.3% 24.3% 100.0%
Chi-Square Tests
Value df Asymp. Sig. (2-
sided)
Pearson Chi-Square 5.380a 3 .146
Likelihood Ratio 5.432 3 .143
N of Valid Cases 375
a. 0 cells (.0%) have expected count less than 5. The minimum
expected count is 21.33.

70
Appendix 6
EPS * DPS Cross Tabulation for Construction
Dividend per Share Total
decrease increase maintain omission
EPS
decrease
Count 20 5 11 5 41
% within EPS 48.8% 12.2% 26.8% 12.2% 100.0%
% within DPS 74.1% 12.5% 47.8% 14.3% 32.8%
% of Total 16.0% 4.0% 8.8% 4.0% 32.8%
increase
Count 5 34 11 14 64
% within EPS 7.8% 53.1% 17.2% 21.9% 100.0%
% within DPS 18.5% 85.0% 47.8% 40.0% 51.2%
% of Total 4.0% 27.2% 8.8% 11.2% 51.2%
negative
Count 2 1 1 16 20
% within EPS 10.0% 5.0% 5.0% 80.0% 100.0%
% within DPS 7.4% 2.5% 4.3% 45.7% 16.0%
% of Total 1.6% 0.8% 0.8% 12.8% 16.0%
Total
Count 27 40 23 35 125
% within EPS 21.6% 32.0% 18.4% 28.0% 100.0%
% within DPS 100.0% 100.0% 100.0% 100.0% 100.0%
% of Total 21.6% 32.0% 18.4% 28.0% 100.0%
Chi-Square Tests
Value df Asymp. Sig. (2-
sided)
Pearson Chi-Square 66.824a 6 .000
Likelihood Ratio 63.008 6 .000
N of Valid Cases 125
a. 2 cells (16.7%) have expected count less than 5. The minimum
expected count is 3.68.

71
Appendix 7
ROE * DPS Cross Tabulation for Construction
Dividend per Share Total
decrease increase maintain omission
ROE
decrease
Count 20 8 12 5 45
% within ROE 44.4% 17.8% 26.7% 11.1% 100.0%
% within DPS 74.1% 20.0% 52.2% 14.3% 36.0%
% of Total 16.0% 6.4% 9.6% 4.0% 36.0%
increase
Count 5 31 10 14 60
% within ROE 8.3% 51.7% 16.7% 23.3% 100.0%
% within DPS 18.5% 77.5% 43.5% 40.0% 48.0%
% of Total 4.0% 24.8% 8.0% 11.2% 48.0%
zero
Count 2 1 1 16 20
% within ROE 10.0% 5.0% 5.0% 80.0% 100.0%
% within DPS 7.4% 2.5% 4.3% 45.7% 16.0%
% of Total 1.6% 0.8% 0.8% 12.8% 16.0%
Total
Count 27 40 23 35 125
% within ROE 21.6% 32.0% 18.4% 28.0% 100.0%
% within DPS 100.0% 100.0% 100.0% 100.0% 100.0%
% of Total 21.6% 32.0% 18.4% 28.0% 100.0%
Chi-Square Tests
Value df Asymp. Sig. (2-
sided)
Pearson Chi-Square 59.746a 6 .000
Likelihood Ratio 56.410 6 .000
N of Valid Cases 125
a. 2 cells (16.7%) have expected count less than 5. The minimum
expected count is 3.68.

72
Appendix 8
Net Profit * DPS Cross Tabulation for Construction
Dividend per Share Total
decrease increase maintain omission
Net Profit
decrease
Count 17 3 11 5 36
% within Net Profit 47.2% 8.3% 30.6% 13.9% 100.0%
% within DPS 63.0% 7.5% 47.8% 14.3% 28.8%
% of Total 13.6% 2.4% 8.8% 4.0% 28.8%
increase
Count 8 36 11 14 69
% within Net Profit 11.6% 52.2% 15.9% 20.3% 100.0%
% within DPS 29.6% 90.0% 47.8% 40.0% 55.2%
% of Total 6.4% 28.8% 8.8% 11.2% 55.2%
negative
Count 2 1 1 16 20
% within Net Profit 10.0% 5.0% 5.0% 80.0% 100.0%
% within DPS 7.4% 2.5% 4.3% 45.7% 16.0%
% of Total 1.6% 0.8% 0.8% 12.8% 16.0%
Total
Count 27 40 23 35 125
% within Net Profit 21.6% 32.0% 18.4% 28.0% 100.0%
% within DPS 100.0% 100.0% 100.0% 100.0% 100.0%
% of Total 21.6% 32.0% 18.4% 28.0% 100.0%
Chi-Square Tests
Value df Asymp. Sig. (2-
sided)
Pearson Chi-Square 63.427a 6 .000
Likelihood Ratio 59.933 6 .000
N of Valid Cases 125
a. 2 cells (16.7%) have expected count less than 5. The minimum
expected count is 3.68.

73
Appendix 9
Sales * DPS Cross Tabulation for Construction
Dividend per Share Total
decrease increase maintain omission
Sales
decrease
Count 13 9 9 18 49
% within Sales 26.5% 18.4% 18.4% 36.7% 100.0%
% within DPS 48.1% 22.5% 39.1% 51.4% 39.2%
% of Total 10.4% 7.2% 7.2% 14.4% 39.2%
increase
Count 14 31 14 17 76
% within Sales 18.4% 40.8% 18.4% 22.4% 100.0%
% within DPS 51.9% 77.5% 60.9% 48.6% 60.8%
% of Total 11.2% 24.8% 11.2% 13.6% 60.8%
Total
Count 27 40 23 35 125
% within Sales 21.6% 32.0% 18.4% 28.0% 100.0%
% within DPS 100.0% 100.0% 100.0% 100.0% 100.0%
% of Total 21.6% 32.0% 18.4% 28.0% 100.0%
Chi-Square Tests
Value df Asymp. Sig. (2-
sided)
Pearson Chi-Square 7.784a 3 .051
Likelihood Ratio 8.082 3 .044
N of Valid Cases 125
a. 0 cells (.0%) have expected count less than 5. The minimum
expected count is 9.02.

74
Appendix 10
No of Shares * DPS Cross Tabulation for Construction
Dividend per Share Total
decrease increase maintain omission
No of
Shares
decrease
Count 8 15 3 12 38
% within No
of Shares 21.1% 39.5% 7.9% 31.6% 100.0%
% within DPS 29.6% 37.5% 13.0% 34.3% 30.4%
% of Total 6.4% 12.0% 2.4% 9.6% 30.4%
increase
Count 19 25 20 23 87
% within No
of Shares 21.8% 28.7% 23.0% 26.4% 100.0%
% within DPS 70.4% 62.5% 87.0% 65.7% 69.6%
% of Total 15.2% 20.0% 16.0% 18.4% 69.6%
Total
Count 27 40 23 35 125
% within No
of Shares 21.6% 32.0% 18.4% 28.0% 100.0%
% within DPS 100.0% 100.0% 100.0% 100.0% 100.0%
% of Total 21.6% 32.0% 18.4% 28.0% 100.0%
Chi-Square Tests
Value df Asymp. Sig. (2-
sided)
Pearson Chi-Square 4.485a 3 .214
Likelihood Ratio 4.998 3 .172
N of Valid Cases 125
a. 0 cells (.0%) have expected count less than 5. The minimum
expected count is 6.99.

75
Appendix 11
EPS * DPS CrossTabulation for Industrial Product
Dividend per Share Total
decrease increase maintain omission
EPS
decrease
Count 28 27 34 22 111
% within EPS 25.2% 24.3% 30.6% 19.8% 100.0%
% within DPS 56.0% 28.1% 55.7% 34.9% 41.1%
% of Total 10.4% 10.0% 12.6% 8.1% 41.1%
increase
Count 15 66 25 23 129
% within EPS 11.6% 51.2% 19.4% 17.8% 100.0%
% within DPS 30.0% 68.8% 41.0% 36.5% 47.8%
% of Total 5.6% 24.4% 9.3% 8.5% 47.8%
negative
Count 7 3 2 18 30
% within EPS 23.3% 10.0% 6.7% 60.0% 100.0%
% within DPS 14.0% 3.1% 3.3% 28.6% 11.1%
% of Total 2.6% 1.1% 0.7% 6.7% 11.1%
Total
Count 50 96 61 63 270
% within EPS 18.5% 35.6% 22.6% 23.3% 100.0%
% within DPS 100.0% 100.0% 100.0% 100.0% 100.0%
% of Total 18.5% 35.6% 22.6% 23.3% 100.0%
Chi-Square Tests
Value df Asymp. Sig. (2-
sided)
Pearson Chi-Square 51.344a 6 .000
Likelihood Ratio 49.100 6 .000
N of Valid Cases 270
a. 0 cells (.0%) have expected count less than 5. The minimum
expected count is 5.56.

76
Appendix 12
ROE * DPS Cross Tabulation for Industrial Product
Dividend per Share Total
decrease increase maintain omission
ROE
decrease
Count 30 31 35 22 118
% within ROE 25.4% 26.3% 29.7% 18.6% 100.0%
% within DPS 60.0% 32.3% 57.4% 34.9% 43.7%
% of Total 11.1% 11.5% 13.0% 8.1% 43.7%
increase
Count 14 62 24 23 123
% within ROE 11.4% 50.4% 19.5% 18.7% 100.0%
% within DPS 28.0% 64.6% 39.3% 36.5% 45.6%
% of Total 5.2% 23.0% 8.9% 8.5% 45.6%
zero
Count 6 3 2 18 29
% within ROE 20.7% 10.3% 6.9% 62.1% 100.0%
% within DPS 12.0% 3.1% 3.3% 28.6% 10.7%
% of Total 2.2% 1.1% 0.7% 6.7% 10.7%
Total
Count 50 96 61 63 270
% within ROE 18.5% 35.6% 22.6% 23.3% 100.0%
% within DPS 100.0% 100.0% 100.0% 100.0% 100.0%
% of Total 18.5% 35.6% 22.6% 23.3% 100.0%
Chi-Square Tests
Value df Asymp. Sig. (2-
sided)
Pearson Chi-Square 49.350a 6 .000
Likelihood Ratio 46.263 6 .000
N of Valid Cases 270
a. 0 cells (.0%) have expected count less than 5. The minimum
expected count is 5.37.

77
Appendix 13
Net Profit * DPS Cross Tabulation for Industrial Product
Dividend per Share Total
decrease increase maintain omission
Net Profit
decrease
Count 28 25 34 20 107
% within Net
Profit 26.2% 23.4% 31.8% 18.7% 100.0%
% within DPS 56.0% 26.0% 55.7% 31.7% 39.6%
% of Total 10.4% 9.3% 12.6% 7.4% 39.6%
increase
Count 15 68 26 26 135
% within Net
Profit 11.1% 50.4% 19.3% 19.3% 100.0%
% within DPS 30.0% 70.8% 42.6% 41.3% 50.0%
% of Total 5.6% 25.2% 9.6% 9.6% 50.0%
negative
Count 7 3 1 17 28
% within Net
Profit 25.0% 10.7% 3.6% 60.7% 100.0%
% within DPS 14.0% 3.1% 1.6% 27.0% 10.4%
% of Total 2.6% 1.1% 0.4% 6.3% 10.4%
Total
Count 50 96 61 63 270
% within Net
Profit 18.5% 35.6% 22.6% 23.3% 100.0%
% within DPS 100.0% 100.0% 100.0% 100.0% 100.0%
% of Total 18.5% 35.6% 22.6% 23.3% 100.0%
Chi-Square Tests
Value df Asymp. Sig. (2-
sided)
Pearson Chi-Square 53.540a 6 .000
Likelihood Ratio 52.285 6 .000
N of Valid Cases 270
a. 0 cells (.0%) have expected count less than 5. The minimum
expected count is 5.19.

78
Appendix 14
Sales * DPS Cross Tabulation for Industrial Product
Dividend per Share Total
decrease increase maintain omission
Sales
decrease
Count 20 23 28 30 101
% within
Sales 19.8% 22.8% 27.7% 29.7% 100.0%
% within DPS 40.0% 24.0% 45.9% 47.6% 37.4%
% of Total 7.4% 8.5% 10.4% 11.1% 37.4%
increase
Count 30 73 33 33 169
% within
Sales 17.8% 43.2% 19.5% 19.5% 100.0%
% within DPS 60.0% 76.0% 54.1% 52.4% 62.6%
% of Total 11.1% 27.0% 12.2% 12.2% 62.6%
Total
Count 50 96 61 63 270
% within
Sales 18.5% 35.6% 22.6% 23.3% 100.0%
% within DPS 100.0% 100.0% 100.0% 100.0% 100.0%
% of Total 18.5% 35.6% 22.6% 23.3% 100.0%
Chi-Square Tests
Value df Asymp. Sig. (2-
sided)
Pearson Chi-Square 12.245a 3 .007
Likelihood Ratio 12.624 3 .006
N of Valid Cases 270
a. 0 cells (.0%) have expected count less than 5. The minimum
expected count is 18.70.

79
Appendix 15
No of Shares * DPS Cross Tabulation for Industrial Product
Dividend per Share Total
decrease increase maintain omission
No of
Shares
decrease
Count 24 50 25 32 131
% within No of
Shares 18.3% 38.2% 19.1% 24.4% 100.0%
% within DPS 48.0% 52.1% 41.0% 50.8% 48.5%
% of Total 8.9% 18.5% 9.3% 11.9% 48.5%
increase
Count 26 46 36 31 139
% within No of
Shares 18.7% 33.1% 25.9% 22.3% 100.0%
% within DPS 52.0% 47.9% 59.0% 49.2% 51.5%
% of Total 9.6% 17.0% 13.3% 11.5% 51.5%
Total
Count 50 96 61 63 270
% within No of
Shares 18.5% 35.6% 22.6% 23.3% 100.0%
% within DPS 100.0% 100.0% 100.0% 100.0% 100.0%
% of Total 18.5% 35.6% 22.6% 23.3% 100.0%
Chi-Square Tests
Value df Asymp. Sig. (2-
sided)
Pearson Chi-Square 2.011a 3 .570
Likelihood Ratio 2.020 3 .568
N of Valid Cases 270
a. 0 cells (.0%) have expected count less than 5. The minimum
expected count is 24.26.

80
Appendix 16
EPS * DPS Cross Tabulation for Plantation
Dividend per Share Total
decrease increase maintain omission
EPS
decrease
Count 31 15 5 9 60
% within EPS 51.7% 25.0% 8.3% 15.0% 100.0%
% within DPS 86.1% 25.9% 55.6% 40.9% 48.0%
% of Total 24.8% 12.0% 4.0% 7.2% 48.0%
increase
Count 5 43 3 9 60
% within EPS 8.3% 71.7% 5.0% 15.0% 100.0%
% within DPS 13.9% 74.1% 33.3% 40.9% 48.0%
% of Total 4.0% 34.4% 2.4% 7.2% 48.0%
negative
Count 0 0 1 4 5
% within EPS 0.0% 0.0% 20.0% 80.0% 100.0%
% within DPS 0.0% 0.0% 11.1% 18.2% 4.0%
% of Total 0.0% 0.0% 0.8% 3.2% 4.0%
Total
Count 36 58 9 22 125
% within EPS 28.8% 46.4% 7.2% 17.6% 100.0%
% within DPS 100.0% 100.0% 100.0% 100.0% 100.0%
% of Total 28.8% 46.4% 7.2% 17.6% 100.0%
Chi-Square Tests
Value df Asymp. Sig. (2-
sided)
Pearson Chi-Square 50.728a 6 .000
Likelihood Ratio 50.343 6 .000
N of Valid Cases 125
a. 6 cells (50.0%) have expected count less than 5. The minimum
expected count is .36.

81
Appendix 17
ROE * DPS Cross Tabulation for Plantation
Dividend per Share Total
decrease increase maintain omission
ROE
decrease
Count 34 18 6 7 65
% within ROE 52.3% 27.7% 9.2% 10.8% 100.0%
% within DPS 94.4% 31.0% 66.7% 31.8% 52.0%
% of Total 27.2% 14.4% 4.8% 5.6% 52.0%
increase
Count 2 40 2 11 55
% within ROE 3.6% 72.7% 3.6% 20.0% 100.0%
% within DPS 5.6% 69.0% 22.2% 50.0% 44.0%
% of Total 1.6% 32.0% 1.6% 8.8% 44.0%
zero
Count 0 0 1 4 5
% within ROE 0.0% 0.0% 20.0% 80.0% 100.0%
% within DPS 0.0% 0.0% 11.1% 18.2% 4.0%
% of Total 0.0% 0.0% 0.8% 3.2% 4.0%
Total
Count 36 58 9 22 125
% within ROE 28.8% 46.4% 7.2% 17.6% 100.0%
% within DPS 100.0% 100.0% 100.0% 100.0% 100.0%
% of Total 28.8% 46.4% 7.2% 17.6% 100.0%
Chi-Square Tests
Value df Asymp. Sig. (2-
sided)
Pearson Chi-Square 56.889a 6 .000
Likelihood Ratio 60.016 6 .000
N of Valid Cases 125
a. 6 cells (50.0%) have expected count less than 5. The minimum
expected count is .36.

82
Appendix 18
Net Profit * DPS Cross Tabulation for Plantation
Dividend per Share Total
decrease increase maintain omission
Net Profit
decrease
Count 29 12 4 7 52
% within Net Profit 55.8% 23.1% 7.7% 13.5% 100.0%
% within DPS 80.6% 20.7% 44.4% 31.8% 41.6%
% of Total 23.2% 9.6% 3.2% 5.6% 41.6%
increase
Count 7 46 4 11 68
% within Net Profit 10.3% 67.6% 5.9% 16.2% 100.0%
% within DPS 19.4% 79.3% 44.4% 50.0% 54.4%
% of Total 5.6% 36.8% 3.2% 8.8% 54.4%
negative
Count 0 0 1 4 5
% within Net Profit 0.0% 0.0% 20.0% 80.0% 100.0%
% within DPS 0.0% 0.0% 11.1% 18.2% 4.0%
% of Total 0.0% 0.0% 0.8% 3.2% 4.0%
Total
Count 36 58 9 22 125
% within Net Profit 28.8% 46.4% 7.2% 17.6% 100.0%
% within DPS 100.0% 100.0% 100.0% 100.0% 100.0%
% of Total 28.8% 46.4% 7.2% 17.6% 100.0%
Chi-Square Tests
Value df Asymp. Sig. (2-
sided)
Pearson Chi-Square 50.656a 6 .000
Likelihood Ratio 49.307 6 .000
N of Valid Cases 125
a. 6 cells (50.0%) have expected count less than 5. The minimum
expected count is .36.

83
Appendix 19
Sales * DPS Cross Tabulation for Plantation
Dividend per Share Total
decrease increase maintain omission
Sales
decrease
Count 25 11 2 10 48
% within
Sales 52.1% 22.9% 4.2% 20.8% 100.0%
% within DPS 69.4% 19.0% 22.2% 45.5% 38.4%
% of Total 20.0% 8.8% 1.6% 8.0% 38.4%
increase
Count 11 47 7 12 77
% within
Sales 14.3% 61.0% 9.1% 15.6% 100.0%
% within DPS 30.6% 81.0% 77.8% 54.5% 61.6%
% of Total 8.8% 37.6% 5.6% 9.6% 61.6%
Total
Count 36 58 9 22 125
% within
Sales 28.8% 46.4% 7.2% 17.6% 100.0%
% within DPS 100.0% 100.0% 100.0% 100.0% 100.0%
% of Total 28.8% 46.4% 7.2% 17.6% 100.0%
Chi-Square Tests
Value df Asymp. Sig. (2-
sided)
Pearson Chi-Square 25.387a 3 .000
Likelihood Ratio 25.986 3 .000
N of Valid Cases 125
a. 1 cells (12.5%) have expected count less than 5. The minimum
expected count is 3.46.

84
Appendix 20
No of Shares * DPS Cross Tabulation for Plantation
Dividend per Share Total
decrease increase maintain omission
Shares
decrease
Count 15 24 1 5 45
% within
Shares 33.3% 53.3% 2.2% 11.1% 100.0%
% within DPS 41.7% 41.4% 11.1% 22.7% 36.0%
% of Total 12.0% 19.2% 0.8% 4.0% 36.0%
increase
Count 21 34 8 17 80
% within
Shares 26.2% 42.5% 10.0% 21.2% 100.0%
% within DPS 58.3% 58.6% 88.9% 77.3% 64.0%
% of Total 16.8% 27.2% 6.4% 13.6% 64.0%
Total
Count 36 58 9 22 125
% within
Shares 28.8% 46.4% 7.2% 17.6% 100.0%
% within DPS 100.0% 100.0% 100.0% 100.0% 100.0%
% of Total 28.8% 46.4% 7.2% 17.6% 100.0%
Chi-Square Tests
Value df Asymp. Sig. (2-
sided)
Pearson Chi-Square 5.332a 3 .149
Likelihood Ratio 5.919 3 .116
N of Valid Cases 125
a. 1 cells (12.5%) have expected count less than 5. The minimum
expected count is 3.24.

85
Appendix 21
EPS * DPS Cross Tabulation for Properties
Dividend per Share Total
decrease increase maintain omission
EPS
decrease
Count 31 16 21 9 77
% within EPS 40.3% 20.8% 27.3% 11.7% 100.0%
% within DPS 66.0% 23.5% 35.6% 22.0% 35.8%
% of Total 14.4% 7.4% 9.8% 4.2% 35.8%
increase
Count 16 49 35 23 123
% within EPS 13.0% 39.8% 28.5% 18.7% 100.0%
% within DPS 34.0% 72.1% 59.3% 56.1% 57.2%
% of Total 7.4% 22.8% 16.3% 10.7% 57.2%
negative
Count 0 3 3 9 15
% within EPS 0.0% 20.0% 20.0% 60.0% 100.0%
% within DPS 0.0% 4.4% 5.1% 22.0% 7.0%
% of Total 0.0% 1.4% 1.4% 4.2% 7.0%
Total
Count 47 68 59 41 215
% within EPS 21.9% 31.6% 27.4% 19.1% 100.0%
% within DPS 100.0% 100.0% 100.0% 100.0% 100.0%
% of Total 21.9% 31.6% 27.4% 19.1% 100.0%
Chi-Square Tests
Value df Asymp. Sig. (2-
sided)
Pearson Chi-Square 41.476a 6 .000
Likelihood Ratio 38.972 6 .000
N of Valid Cases 215
a. 4 cells (33.3%) have expected count less than 5. The minimum
expected count is 2.86.

86
Appendix 22
ROE * DPS Cross Tabulation for Properties
Dividend per Share Total
decrease increase maintain omission
ROE
decrease
Count 32 18 27 11 88
% within ROE 36.4% 20.5% 30.7% 12.5% 100.0%
% within DPS 68.1% 26.5% 45.8% 26.8% 40.9%
% of Total 14.9% 8.4% 12.6% 5.1% 40.9%
increase
Count 15 47 28 21 111
% within ROE 13.5% 42.3% 25.2% 18.9% 100.0%
% within DPS 31.9% 69.1% 47.5% 51.2% 51.6%
% of Total 7.0% 21.9% 13.0% 9.8% 51.6%
maintain
Count 0 0 1 0 1
% within ROE 0.0% 0.0% 100.0% 0.0% 100.0%
% within DPS 0.0% 0.0% 1.7% 0.0% 0.5%
% of Total 0.0% 0.0% 0.5% 0.0% 0.5%
zero
Count 0 3 3 9 15
% within ROE 0.0% 20.0% 20.0% 60.0% 100.0%
% within DPS 0.0% 4.4% 5.1% 22.0% 7.0%
% of Total 0.0% 1.4% 1.4% 4.2% 7.0%
Total
Count 47 68 59 41 215
% within ROE 21.9% 31.6% 27.4% 19.1% 100.0%
% within DPS 100.0% 100.0% 100.0% 100.0% 100.0%
% of Total 21.9% 31.6% 27.4% 19.1% 100.0%
Chi-Square Tests
Value df Asymp. Sig. (2-
sided)
Pearson Chi-Square 42.081a 9 .000
Likelihood Ratio 40.128 9 .000
N of Valid Cases 215
a. 8 cells (50.0%) have expected count less than 5. The minimum
expected count is .19.

87
Appendix 23
Net Profit * DPS Cross Tabulation for Properties
Dividend per Share Total
decrease increase maintain omission
Net Profit
decrease
Count 27 12 20 8 67
% within Net Profit 40.3% 17.9% 29.9% 11.9% 100.0%
% within DPS 57.4% 17.6% 33.9% 19.5% 31.2%
% of Total 12.6% 5.6% 9.3% 3.7% 31.2%
increase
Count 20 53 36 23 132
% within Net Profit 15.2% 40.2% 27.3% 17.4% 100.0%
% within DPS 42.6% 77.9% 61.0% 56.1% 61.4%
% of Total 9.3% 24.7% 16.7% 10.7% 61.4%
maintain
Count 0 0 0 1 1
% within Net Profit 0.0% 0.0% 0.0% 100.0% 100.0%
% within DPS 0.0% 0.0% 0.0% 2.4% 0.5%
% of Total 0.0% 0.0% 0.0% 0.5% 0.5%
negative
Count 0 3 3 9 15
% within Net Profit 0.0% 20.0% 20.0% 60.0% 100.0%
% within DPS 0.0% 4.4% 5.1% 22.0% 7.0%
% of Total 0.0% 1.4% 1.4% 4.2% 7.0%
Total
Count 47 68 59 41 215
% within Net Profit 21.9% 31.6% 27.4% 19.1% 100.0%
% within DPS 100.0% 100.0% 100.0% 100.0% 100.0%
% of Total 21.9% 31.6% 27.4% 19.1% 100.0%
Chi-Square Tests
Value df Asymp. Sig. (2-
sided)
Pearson Chi-Square 43.916a 9 .000
Likelihood Ratio 40.588 9 .000
N of Valid Cases 215
a. 8 cells (50.0%) have expected count less than 5. The minimum
expected count is .19.

88
Appendix 24
Sales * DPS Cross Tabulation for Properties
Dividend per Share Total
decrease increase maintain omission
Sales
decrease
Count 25 13 26 19 83
% within Sales 30.1% 15.7% 31.3% 22.9% 100.0%
% within DPS 53.2% 19.1% 44.1% 46.3% 38.6%
% of Total 11.6% 6.0% 12.1% 8.8% 38.6%
increase
Count 22 55 33 22 132
% within Sales 16.7% 41.7% 25.0% 16.7% 100.0%
% within DPS 46.8% 80.9% 55.9% 53.7% 61.4%
% of Total 10.2% 25.6% 15.3% 10.2% 61.4%
Total
Count 47 68 59 41 215
% within Sales 21.9% 31.6% 27.4% 19.1% 100.0%
% within DPS 100.0% 100.0% 100.0% 100.0% 100.0%
% of Total 21.9% 31.6% 27.4% 19.1% 100.0%
Chi-Square Tests
Value df Asymp. Sig. (2-
sided)
Pearson Chi-Square 16.893a 3 .001
Likelihood Ratio 17.888 3 .000
N of Valid Cases 215
a. 0 cells (.0%) have expected count less than 5. The minimum
expected count is 15.83.
89
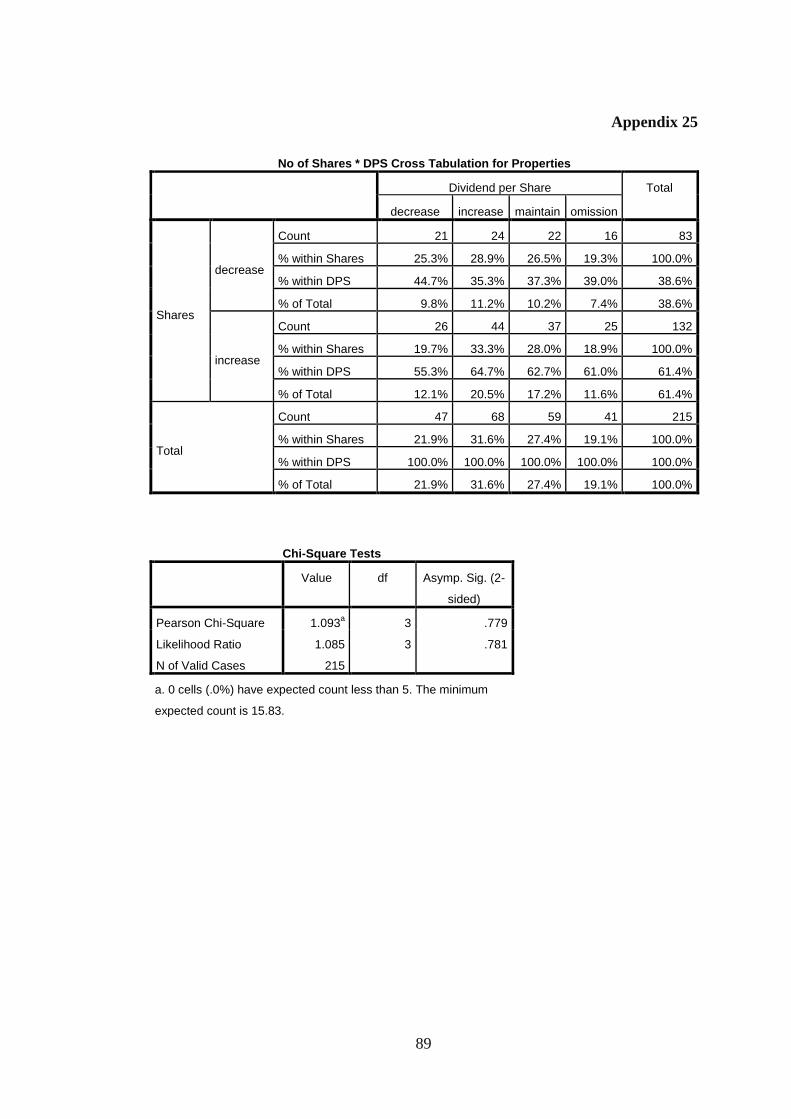
Appendix 25
No of Shares * DPS Cross Tabulation for Properties
Dividend per Share Total
decrease increase maintain omission
Shares
decrease
Count 21 24 22 16 83
% within Shares 25.3% 28.9% 26.5% 19.3% 100.0%
% within DPS 44.7% 35.3% 37.3% 39.0% 38.6%
% of Total 9.8% 11.2% 10.2% 7.4% 38.6%
increase
Count 26 44 37 25 132
% within Shares 19.7% 33.3% 28.0% 18.9% 100.0%
% within DPS 55.3% 64.7% 62.7% 61.0% 61.4%
% of Total 12.1% 20.5% 17.2% 11.6% 61.4%
Total
Count 47 68 59 41 215
% within Shares 21.9% 31.6% 27.4% 19.1% 100.0%
% within DPS 100.0% 100.0% 100.0% 100.0% 100.0%
% of Total 21.9% 31.6% 27.4% 19.1% 100.0%
Chi-Square Tests
Value df Asymp. Sig. (2-
sided)
Pearson Chi-Square 1.093a 3 .779
Likelihood Ratio 1.085 3 .781
N of Valid Cases 215
a. 0 cells (.0%) have expected count less than 5. The minimum
expected count is 15.83.
90
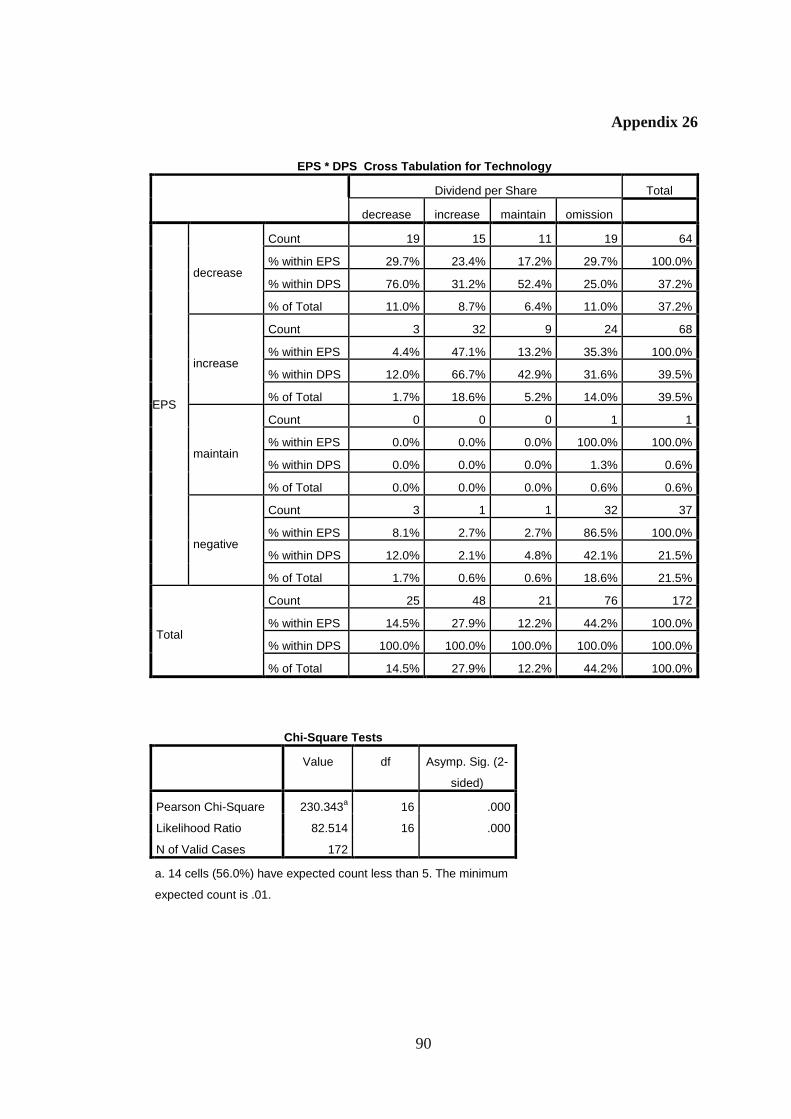
Appendix 26
EPS * DPS Cross Tabulation for Technology
Dividend per Share Total
decrease increase maintain omission
EPS
decrease
Count 19 15 11 19 64
% within EPS 29.7% 23.4% 17.2% 29.7% 100.0%
% within DPS 76.0% 31.2% 52.4% 25.0% 37.2%
% of Total 11.0% 8.7% 6.4% 11.0% 37.2%
increase
Count 3 32 9 24 68
% within EPS 4.4% 47.1% 13.2% 35.3% 100.0%
% within DPS 12.0% 66.7% 42.9% 31.6% 39.5%
% of Total 1.7% 18.6% 5.2% 14.0% 39.5%
maintain
Count 0 0 0 1 1
% within EPS 0.0% 0.0% 0.0% 100.0% 100.0%
% within DPS 0.0% 0.0% 0.0% 1.3% 0.6%
% of Total 0.0% 0.0% 0.0% 0.6% 0.6%
negative
Count 3 1 1 32 37
% within EPS 8.1% 2.7% 2.7% 86.5% 100.0%
% within DPS 12.0% 2.1% 4.8% 42.1% 21.5%
% of Total 1.7% 0.6% 0.6% 18.6% 21.5%
Total
Count 25 48 21 76 172
% within EPS 14.5% 27.9% 12.2% 44.2% 100.0%
% within DPS 100.0% 100.0% 100.0% 100.0% 100.0%
% of Total 14.5% 27.9% 12.2% 44.2% 100.0%
Chi-Square Tests
Value df Asymp. Sig. (2-
sided)
Pearson Chi-Square 230.343a 16 .000
Likelihood Ratio 82.514 16 .000
N of Valid Cases 172
a. 14 cells (56.0%) have expected count less than 5. The minimum
expected count is .01.

91
Appendix 27
ROE * DPS Cross Tabulation for Technology
Dividend per Share Total
decrease increase maintain omission
ROE
% within DPS 80.0% 35.4% 61.9% 26.3% 40.7%
% of Total 11.6% 9.9% 7.6% 11.6% 40.7%
increase
Count 2 30 7 23 62
% within ROE 3.2% 48.4% 11.3% 37.1% 100.0
%
% within DPS 8.0% 62.5% 33.3% 30.3% 36.0%
% of Total 1.2% 17.4% 4.1% 13.4% 36.0%
maintain
Count 0 0 0 1 1
% within ROE 0.0% 0.0% 0.0% 100.0% 100.0
%
% within DPS 0.0% 0.0% 0.0% 1.3% 0.6%
% of Total 0.0% 0.0% 0.0% 0.6% 0.6%
zero
Count 3 1 1 32 37
% within ROE 8.1% 2.7% 2.7% 86.5% 100.0
%
% within DPS 12.0% 2.1% 4.8% 42.1% 21.5%
% of Total 1.7% 0.6% 0.6% 18.6% 21.5%
Total
Count 25 48 21 76 172
% within ROE 14.5% 27.9% 12.2% 44.2% 100.0
%
% within DPS 100.0% 100.0% 100.0% 100.0% 100.0
%
% of Total 14.5% 27.9% 12.2% 44.2% 100.0
%
Chi-Square Tests
Value df Asymp. Sig. (2-
sided)
Pearson Chi-Square 231.947a 16 .000
Likelihood Ratio 84.878 16 .000
N of Valid Cases 172
a. 14 cells (56.0%) have expected count less than 5. The minimum
expected count is .01.

92
Appendix 28
Net Profit * DPS Cross Tabulation for Technology
Dividend per Share Total
decrease increase maintain omission
Net Profit
decrease
Count 18 14 11 17 60
% within Net
Profit 30.0% 23.3% 18.3% 28.3% 100.0%
% within DPS 72.0% 29.2% 52.4% 22.4% 34.9%
% of Total 10.5% 8.1% 6.4% 9.9% 34.9%
increase
Count 4 33 9 27 73
% within Net
Profit 5.5% 45.2% 12.3% 37.0% 100.0%
% within DPS 16.0% 68.8% 42.9% 35.5% 42.4%
% of Total 2.3% 19.2% 5.2% 15.7% 42.4%
negative
Count 3 1 1 32 37
% within Net
Profit 8.1% 2.7% 2.7% 86.5% 100.0%
% within DPS 12.0% 2.1% 4.8% 42.1% 21.5%
% of Total 1.7% 0.6% 0.6% 18.6% 21.5%
Total
Count 25 48 21 76 172
% within Net
Profit 14.5% 27.9% 12.2% 44.2% 100.0%
% within DPS 100.0% 100.0% 100.0% 100.0% 100.0%
% of Total 14.5% 27.9% 12.2% 44.2% 100.0%
Chi-Square Tests
Value df Asymp. Sig. (2-
sided)
Pearson Chi-Square 227.554a 12 .000
Likelihood Ratio 79.122 12 .000
N of Valid Cases 172
a. 9 cells (45.0%) have expected count less than 5. The minimum
expected count is .02.
93
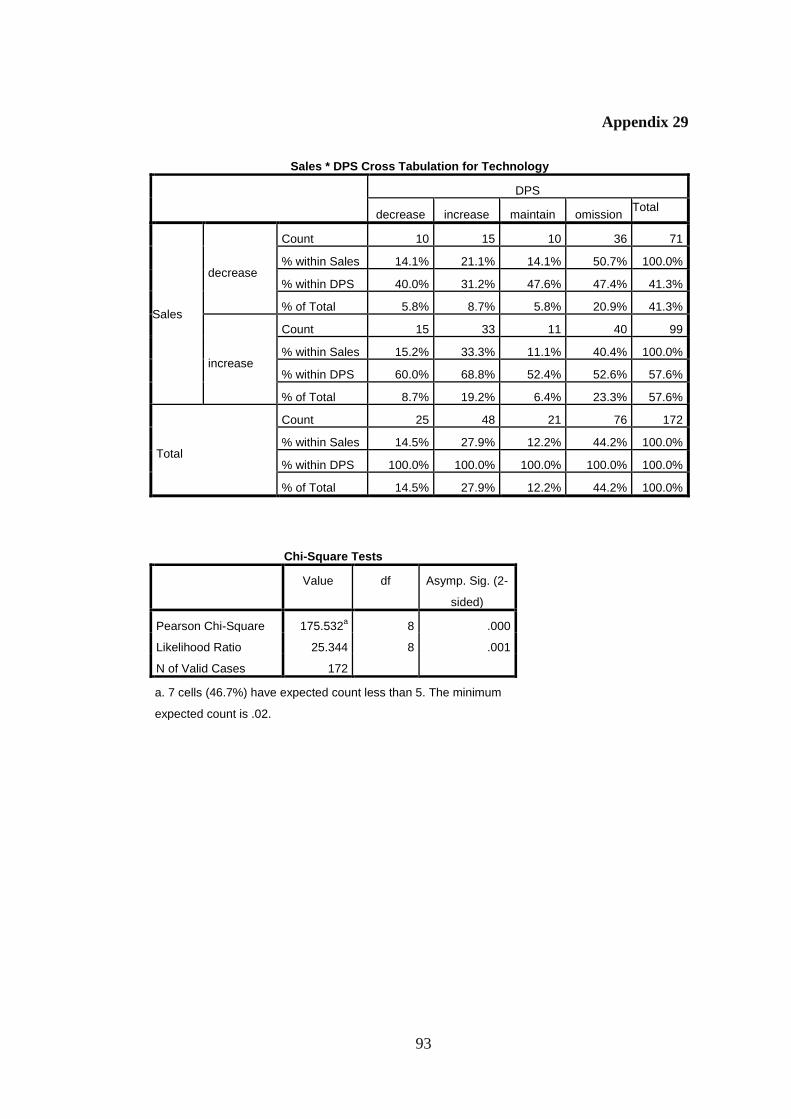
Appendix 29
Sales * DPS Cross Tabulation for Technology
DPS
decrease increase maintain omission Total
Sales
decrease
Count 10 15 10 36 71
% within Sales 14.1% 21.1% 14.1% 50.7% 100.0%
% within DPS 40.0% 31.2% 47.6% 47.4% 41.3%
% of Total 5.8% 8.7% 5.8% 20.9% 41.3%
increase
Count 15 33 11 40 99
% within Sales 15.2% 33.3% 11.1% 40.4% 100.0%
% within DPS 60.0% 68.8% 52.4% 52.6% 57.6%
% of Total 8.7% 19.2% 6.4% 23.3% 57.6%
Total
Count 25 48 21 76 172
% within Sales 14.5% 27.9% 12.2% 44.2% 100.0%
% within DPS 100.0% 100.0% 100.0% 100.0% 100.0%
% of Total 14.5% 27.9% 12.2% 44.2% 100.0%
Chi-Square Tests
Value df Asymp. Sig. (2-
sided)
Pearson Chi-Square 175.532a 8 .000
Likelihood Ratio 25.344 8 .001
N of Valid Cases 172
a. 7 cells (46.7%) have expected count less than 5. The minimum
expected count is .02.

94
Appendix 30
No of Shares * DPS Cross Tabulation for Technology
Dividend per Share Total
decrease increase maintain omissi
on
No of Shares
decrease
Count 10 18 12 26 66
% within Shares 15.2% 27.3% 18.2% 39.4% 100.0%
% within DPS 40.0% 37.5% 57.1% 34.2% 38.4%
% of Total 5.8% 10.5% 7.0% 15.1% 38.4%
increase
Count 15 30 9 50 104
% within Shares 14.4% 28.8% 8.7% 48.1% 100.0%
% within DPS 60.0% 62.5% 42.9% 65.8% 60.5%
% of Total 8.7% 17.4% 5.2% 29.1% 60.5%
Total
Count 25 48 21 76 172
% within Shares 14.5% 27.9% 12.2% 44.2% 100.0%
% within DPS 100.0% 100.0% 100.0% 100.0
% 100.0%
% of Total 14.5% 27.9% 12.2% 44.2% 100.0%
Chi-Square Tests
Value df Asymp. Sig. (2-
sided)
Pearson Chi-Square 175.742a 8 .000
Likelihood Ratio 25.407 8 .001
N of Valid Cases 172
a. 7 cells (46.7%) have expected count less than 5. The minimum
expected count is .02.

95
Appendix 31
EPS * DPS Cross Tabulation for Trading and Services
Dividend per Share Total
decrease increase maintain omission
EPS
decrease
Count 46 33 21 28 128
% within EPS 35.9% 25.8% 16.4% 21.9% 100.0%
% within DPS 62.2% 27.3% 38.2% 26.7% 36.1%
% of Total 13.0% 9.3% 5.9% 7.9% 36.1%
increase
Count 19 84 33 46 182
% within EPS 10.4% 46.2% 18.1% 25.3% 100.0%
% within DPS 25.7% 69.4% 60.0% 43.8% 51.3%
% of Total 5.4% 23.7% 9.3% 13.0% 51.3%
maintain
Count 1 1 0 0 2
% within EPS 50.0% 50.0% 0.0% 0.0% 100.0%
% within DPS 1.4% 0.8% 0.0% 0.0% 0.6%
% of Total 0.3% 0.3% 0.0% 0.0% 0.6%
negative
Count 8 3 1 31 43
% within EPS 18.6% 7.0% 2.3% 72.1% 100.0%
% within DPS 10.8% 2.5% 1.8% 29.5% 12.1%
% of Total 2.3% 0.8% 0.3% 8.7% 12.1%
Total
Count 74 121 55 105 355
% within EPS 20.8% 34.1% 15.5% 29.6% 100.0%
% within DPS 100.0% 100.0% 100.0% 100.0% 100.0%
% of Total 20.8% 34.1% 15.5% 29.6% 100.0%
Chi-Square Tests
Value df Asymp. Sig. (2-
sided)
Pearson Chi-Square 80.732a 9 .000
Likelihood Ratio 80.387 9 .000
N of Valid Cases 355
a. 4 cells (25.0%) have expected count less than 5. The minimum
expected count is .31.

96
Appendix 32
ROE * DPS Cross Tabulation for Trading and Services
Dividend per Share Total
decrease increase maintain omission
ROE
decrease
Count 43 38 32 33 146
% within ROE 29.5% 26.0% 21.9% 22.6% 100.0%
% within DPS 58.1% 31.4% 58.2% 31.4% 41.1%
% of Total 12.1% 10.7% 9.0% 9.3% 41.1%
increase
Count 23 80 22 39 164
% within ROE 14.0% 48.8% 13.4% 23.8% 100.0%
% within DPS 31.1% 66.1% 40.0% 37.1% 46.2%
% of Total 6.5% 22.5% 6.2% 11.0% 46.2%
maintain
Count 0 0 0 1 1
% within ROE 0.0% 0.0% 0.0% 100.0% 100.0%
% within DPS 0.0% 0.0% 0.0% 1.0% 0.3%
% of Total 0.0% 0.0% 0.0% 0.3% 0.3%
zero
Count 8 3 1 32 44
% within ROE 18.2% 6.8% 2.3% 72.7% 100.0%
% within DPS 10.8% 2.5% 1.8% 30.5% 12.4%
% of Total 2.3% 0.8% 0.3% 9.0% 12.4%
Total
Count 74 121 55 105 355
% within ROE 20.8% 34.1% 15.5% 29.6% 100.0%
% within DPS 100.0% 100.0% 100.0% 100.0% 100.0%
% of Total 20.8% 34.1% 15.5% 29.6% 100.0%
Chi-Square Tests
Value df Asymp. Sig. (2-
sided)
Pearson Chi-Square 75.423a 9 .000
Likelihood Ratio 73.791 9 .000
N of Valid Cases 355
a. 4 cells (25.0%) have expected count less than 5. The minimum
expected count is .15.
97
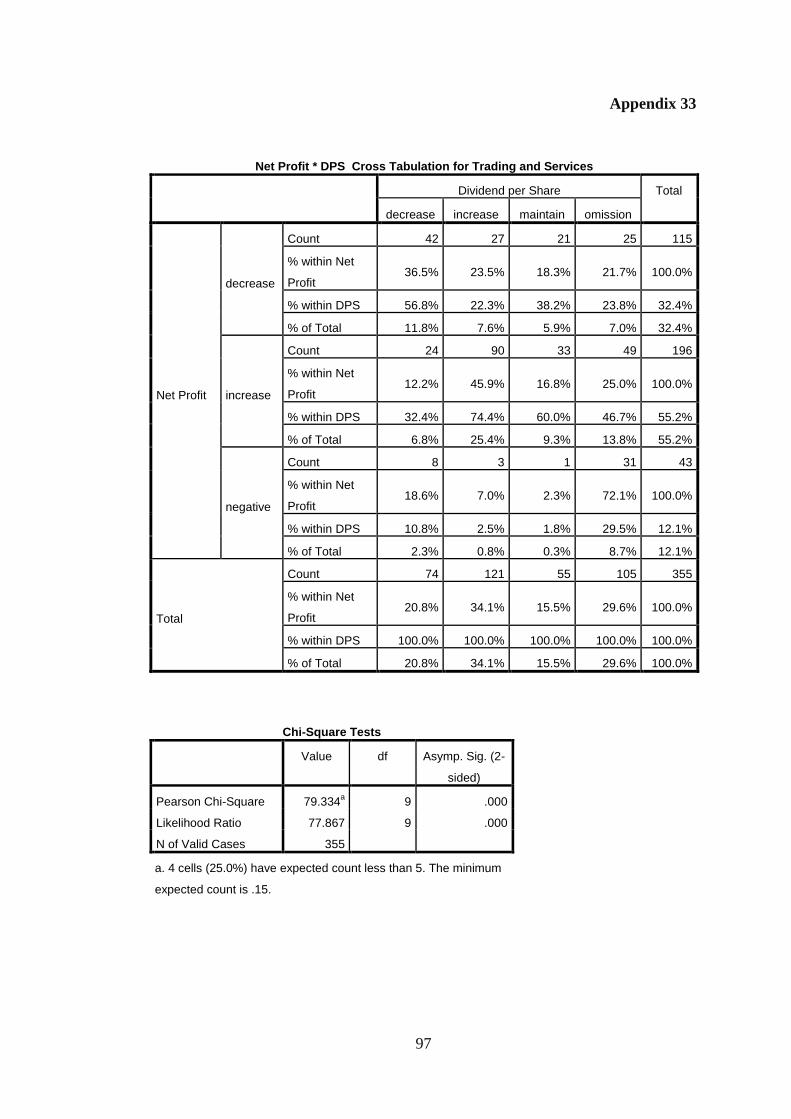
Appendix 33
Net Profit * DPS Cross Tabulation for Trading and Services
Dividend per Share Total
decrease increase maintain omission
Net Profit
decrease
Count 42 27 21 25 115
% within Net
Profit 36.5% 23.5% 18.3% 21.7% 100.0%
% within DPS 56.8% 22.3% 38.2% 23.8% 32.4%
% of Total 11.8% 7.6% 5.9% 7.0% 32.4%
increase
Count 24 90 33 49 196
% within Net
Profit 12.2% 45.9% 16.8% 25.0% 100.0%
% within DPS 32.4% 74.4% 60.0% 46.7% 55.2%
% of Total 6.8% 25.4% 9.3% 13.8% 55.2%
negative
Count 8 3 1 31 43
% within Net
Profit 18.6% 7.0% 2.3% 72.1% 100.0%
% within DPS 10.8% 2.5% 1.8% 29.5% 12.1%
% of Total 2.3% 0.8% 0.3% 8.7% 12.1%
Total
Count 74 121 55 105 355
% within Net
Profit 20.8% 34.1% 15.5% 29.6% 100.0%
% within DPS 100.0% 100.0% 100.0% 100.0% 100.0%
% of Total 20.8% 34.1% 15.5% 29.6% 100.0%
Chi-Square Tests
Value df Asymp. Sig. (2-
sided)
Pearson Chi-Square 79.334a 9 .000
Likelihood Ratio 77.867 9 .000
N of Valid Cases 355
a. 4 cells (25.0%) have expected count less than 5. The minimum
expected count is .15.

98
Appendix 34
Sales * DPS Cross Tabulation for Trading and Services
Dividend per Share Total
decrease increase maintain omission
Sales
decrease
Count 24 24 17 46 111
% within Sales 21.6% 21.6% 15.3% 41.4% 100.0%
% within DPS 32.4% 19.8% 30.9% 43.8% 31.3%
% of Total 6.8% 6.8% 4.8% 13.0% 31.3%
increase
Count 50 97 38 59 244
% within Sales 20.5% 39.8% 15.6% 24.2% 100.0%
% within DPS 67.6% 80.2% 69.1% 56.2% 68.7%
% of Total 14.1% 27.3% 10.7% 16.6% 68.7%
Total
Count 74 121 55 105 355
% within Sales 20.8% 34.1% 15.5% 29.6% 100.0%
% within DPS 100.0% 100.0% 100.0% 100.0% 100.0%
% of Total 20.8% 34.1% 15.5% 29.6% 100.0%
Chi-Square Tests
Value df Asymp. Sig. (2-
sided)
Pearson Chi-Square 15.095a 3 .002
Likelihood Ratio 15.308 3 .002
N of Valid Cases 355
a. 0 cells (.0%) have expected count less than 5. The minimum
expected count is 17.20.

99
Appendix 35
No of Shares * DPS Cross Tabulation for Trading and Services
Dividend per Share Total
decrease increase maintain omission
Shares
decrease
Count 23 42 21 34 120
% within Shares 19.2% 35.0% 17.5% 28.3% 100.0%
% within DPS 31.1% 34.7% 38.2% 32.4% 33.8%
% of Total 6.5% 11.8% 5.9% 9.6% 33.8%
increase
Count 51 79 34 71 235
% within Shares 21.7% 33.6% 14.5% 30.2% 100.0%
% within DPS 68.9% 65.3% 61.8% 67.6% 66.2%
% of Total 14.4% 22.3% 9.6% 20.0% 66.2%
Total
Count 74 121 55 105 355
% within Shares 20.8% 34.1% 15.5% 29.6% 100.0%
% within DPS 100.0% 100.0% 100.0% 100.0% 100.0%
% of Total 20.8% 34.1% 15.5% 29.6% 100.0%
Chi-Square Tests
Value df Asymp. Sig. (2-
sided)
Pearson Chi-Square .856a 3 .836
Likelihood Ratio .851 3 .837
N of Valid Cases 355
a. 0 cells (.0%) have expected count less than 5. The minimum
expected count is 18.59.

100
Appendix 36
Correlations Result for Consumer Product
DPS EPS ROE LN Sales Net Profit LN Shares
DPS
Pearson
Correlation 1 .518
** .780
** -.022 .048 -.031
Sig. (2-tailed)
.000 .000 .677 .350 .555
N 375 375 375 375 375 375
EPS
Pearson
Correlation .518
** 1 .689
** .084 .775
** -.085
Sig. (2-tailed) .000
.000 .106 .000 .100
N 375 375 375 375 375 375
ROE
Pearson
Correlation .780
** .689
** 1 .027 .207
** -.026
Sig. (2-tailed) .000 .000
.602 .000 .616
N 375 375 375 375 375 375
LN
Sales
Pearson
Correlation -.022 .084 .027 1 .062 .103
*
Sig. (2-tailed) .677 .106 .602
.228 .045
N 375 375 375 375 375 375
Net
Profit
Pearson
Correlation .048 .775
** .207
** .062 1 .010
Sig. (2-tailed) .350 .000 .000 .228
.841
N 375 375 375 375 375 375
LN
Shares
Pearson
Correlation -.031 -.085 -.026 .103
* .010 1
Sig. (2-tailed) .555 .100 .616 .045 .841
N 375 375 375 375 375 375
Net
Asset
Pearson
Correlation -.045 -.136
** -.062 .055 -.220
** .122
*
Sig. (2-tailed) .389 .009 .230 .286 .000 .018
N 375 375 375 375 375 375
**. Correlation is significant at the 0.01 level (2-tailed).
*. Correlation is significant at the 0.05 level (2-tailed).

101
Appendix 37
Correlations Result for Construction
DPS EPS ROE LN Sales Net Profit LN Shares
DPS
Pearson
Correlation 1 .530
** .356
** -.013 .673
** .071
Sig. (2-tailed) .000 .000 .888 .000 .431
N 125 125 125 125 125 125
EPS
Pearson
Correlation .530
** 1 .689
** .101 .810
** -.200
*
Sig. (2-tailed) .000 .000 .263 .000 .025
N 125 125 125 125 125 125
ROE
Pearson
Correlation .356
** .689
** 1 .069 .435
** -.250
**
Sig. (2-tailed) .000 .000 .442 .000 .005
N 125 125 125 125 125 125
LN Sales
Pearson
Correlation -.013 .101 .069 1 .045 .144
Sig. (2-tailed) .888 .263 .442 .618 .110
N 125 125 125 125 125 125
Net Profit
Pearson
Correlation .673
** .810
** .435
** .045 1 -.013
Sig. (2-tailed) .000 .000 .000 .618 .886
N 125 125 125 125 125 125
LN Shares
Pearson
Correlation .071 -.200
* -.250
** .144 -.013 1
Sig. (2-tailed) .431 .025 .005 .110 .886
N 125 125 125 125 125 125
**. Correlation is significant at the 0.01 level (2-tailed).
*. Correlation is significant at the 0.05 level (2-tailed).

102
Appendix 38
Correlations Result for Industrial Product
DPS EPS ROE LN Sales Net Profit LN Shares
DPS
Pearson
Correlation 1 .068 .108 .156
* .220
** .024
Sig. (2-tailed) .269 .077 .010 .000 .699
N 270 270 270 270 270 270
EPS
Pearson
Correlation .068 1 .132
* .028 .105 .746
**
Sig. (2-tailed) .269 .030 .651 .084 .000
N 270 270 270 270 270 270
ROE
Pearson
Correlation .108 .132
* 1 -.156
* .398
** -.064
Sig. (2-tailed) .077 .030 .010 .000 .295
N 270 270 270 270 270 270
LN Sales
Pearson
Correlation .156
* .028 -.156
* 1 .038 -.155
*
Sig. (2-tailed) .010 .651 .010 .533 .011
N 270 270 270 270 270 270
Net Profit
Pearson
Correlation .220
** .105 .398
** .038 1 .025
Sig. (2-tailed) .000 .084 .000 .533 .681
N 270 270 270 270 270 270
LN Shares
Pearson
Correlation .024 .746
** -.064 -.155
* .025 1
Sig. (2-tailed) .699 .000 .295 .011 .681
N 270 270 270 270 270 270
*. Correlation is significant at the 0.05 level (2-tailed).
**. Correlation is significant at the 0.01 level (2-tailed).

103
Appendix 39
Correlations Result for Plantation
DPS EPS ROE LN Sales Net Profit LN Shares
DPS
Pearson
Correlation 1 .674
** .512
** .389
** .422
** -.037
Sig. (2-tailed) .000 .000 .000 .000 .683
N 125 125 125 125 125 125
EPS
Pearson
Correlation .674
** 1 .679
** .456
** .450
** -.194
*
Sig. (2-tailed) .000 .000 .000 .000 .030
N 125 125 125 125 125 125
ROE
Pearson
Correlation .512
** .679
** 1 .362
** .529
** -.155
Sig. (2-tailed) .000 .000 .000 .000 .084
N 125 125 125 125 125 125
LN Sales
Pearson
Correlation .389
** .456
** .362
** 1 .126 -.120
Sig. (2-tailed) .000 .000 .000 .162 .181
N 125 125 125 125 125 125
Net Profit
Pearson
Correlation .422
** .450
** .529
** .126 1 .032
Sig. (2-tailed) .000 .000 .000 .162 .722
N 125 125 125 125 125 125
LN Shares
Pearson
Correlation -.037 -.194
* -.155 -.120 .032 1
Sig. (2-tailed) .683 .030 .084 .181 .722
N 125 125 125 125 125 125
**. Correlation is significant at the 0.01 level (2-tailed).
*. Correlation is significant at the 0.05 level (2-tailed).
104
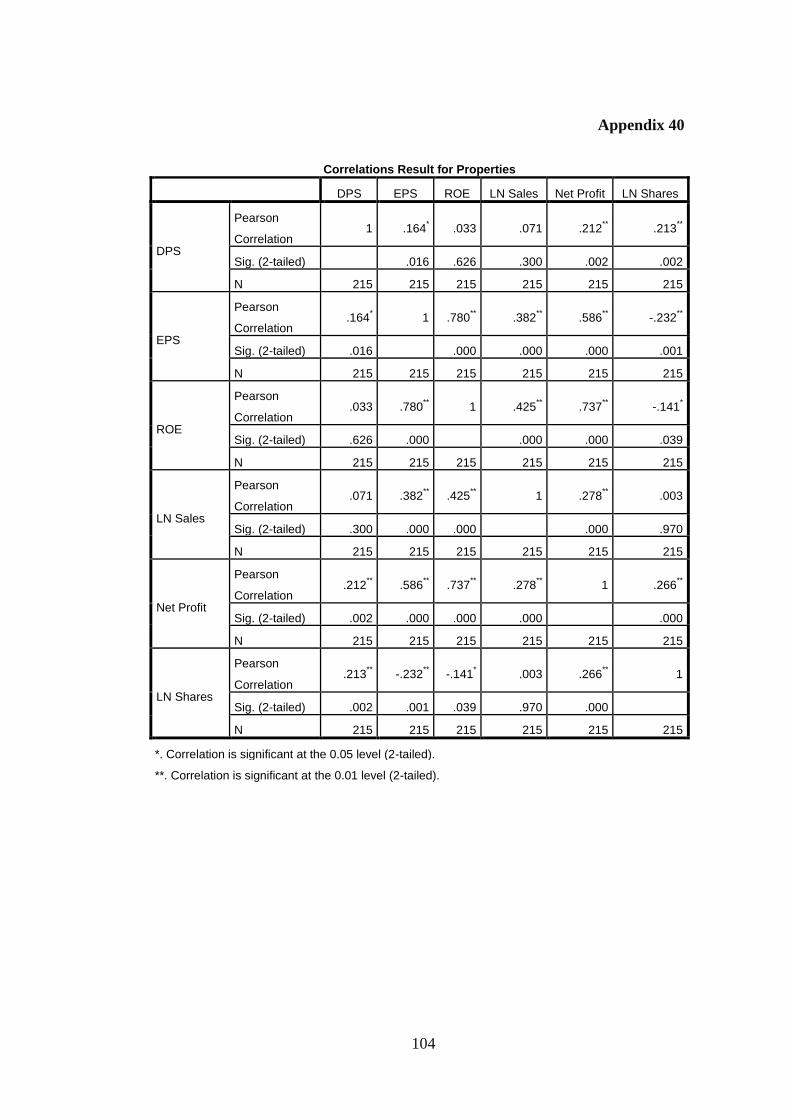
Appendix 40
Correlations Result for Properties
DPS EPS ROE LN Sales Net Profit LN Shares
DPS
Pearson
Correlation 1 .164
* .033 .071 .212
** .213
**
Sig. (2-tailed) .016 .626 .300 .002 .002
N 215 215 215 215 215 215
EPS
Pearson
Correlation .164
* 1 .780
** .382
** .586
** -.232
**
Sig. (2-tailed) .016 .000 .000 .000 .001
N 215 215 215 215 215 215
ROE
Pearson
Correlation .033 .780
** 1 .425
** .737
** -.141
*
Sig. (2-tailed) .626 .000 .000 .000 .039
N 215 215 215 215 215 215
LN Sales
Pearson
Correlation .071 .382
** .425
** 1 .278
** .003
Sig. (2-tailed) .300 .000 .000 .000 .970
N 215 215 215 215 215 215
Net Profit
Pearson
Correlation .212
** .586
** .737
** .278
** 1 .266
**
Sig. (2-tailed) .002 .000 .000 .000 .000
N 215 215 215 215 215 215
LN Shares
Pearson
Correlation .213
** -.232
** -.141
* .003 .266
** 1
Sig. (2-tailed) .002 .001 .039 .970 .000
N 215 215 215 215 215 215
*. Correlation is significant at the 0.05 level (2-tailed).
**. Correlation is significant at the 0.01 level (2-tailed).

105
Appendix 41
Correlations Result for Technology
DPS EPS ROE LN Sales Net Profit LN Shares
DPS
Pearson
Correlation 1 .562
** .262
** .100 .543
** -.157
*
Sig. (2-tailed) .000 .001 .195 .000 .041
N 170 170 170 170 170 170
EPS
Pearson
Correlation .562
** 1 .432
** .204
** .786
** -.082
Sig. (2-tailed) .000 .000 .008 .000 .290
N 170 170 170 170 170 170
ROE
Pearson
Correlation .262
** .432
** 1 .342
** .563
** -.002
Sig. (2-tailed) .001 .000 .000 .000 .979
N 170 170 170 170 170 170
LN Sales
Pearson
Correlation .100 .204
** .342
** 1 .168
* .034
Sig. (2-tailed) .195 .008 .000 .029 .663
N 170 170 170 170 170 170
Net Profit
Pearson
Correlation .543
** .786
** .563
** .168
* 1 .021
Sig. (2-tailed) .000 .000 .000 .029 .784
N 170 170 170 170 170 170
LN Shares
Pearson
Correlation -.157
* -.082 -.002 .034 .021 1
Sig. (2-tailed) .041 .290 .979 .663 .784
N 170 170 170 170 170 170
**. Correlation is significant at the 0.01 level (2-tailed).
*. Correlation is significant at the 0.05 level (2-tailed).

106
Appendix 42
Correlations Result for Trading and Services
DPS EPS ROE LN Sales Net Profit LN Shares
DPS
Pearson
Correlation 1 .452
** .477
** -.091 .411
** .010
Sig. (2-tailed) .000 .000 .086 .000 .848
N 355 355 355 355 355 355
EPS
Pearson
Correlation .452
** 1 .630
** .064 .678
** -.068
Sig. (2-tailed) .000 .000 .232 .000 .202
N 355 355 355 355 355 355
ROE
Pearson
Correlation .477
** .630
** 1 -.050 .297
** -.001
Sig. (2-tailed) .000 .000 .344 .000 .989
N 355 355 355 355 355 355
LN Sales
Pearson
Correlation -.091 .064 -.050 1 .030 .138
**
Sig. (2-tailed) .086 .232 .344 .579 .009
N 355 355 355 355 355 355
Net Profit
Pearson
Correlation .411
** .678
** .297
** .030 1 .025
Sig. (2-tailed) .000 .000 .000 .579 .640
N 355 355 355 355 355 355
LN Shares
Pearson
Correlation .010 -.068 -.001 .138
** .025 1
Sig. (2-tailed) .848 .202 .989 .009 .640
N 355 355 355 355 355 355
**. Correlation is significant at the 0.01 level (2-tailed).

107
Appendix 43
Model Summary
Mo
del
R R
Squa
re
Adjuste
d R
Square
Std. Error
of the
Estimate
Change Statistics
R Square
Change
F
Chang
e
df1 df2 Sig. F
Change
1 .699a .488 .487
18.216312
0 .488
372.93
0 5 1956 .000
a. Predictors: (Constant), Net Profit, ROE, EPS, LN Shares, LN Sales
ANOVAa
Model Sum of Squares df Mean Square F Sig.
1
Regression 618754.438 5 123750.888 372.930 .000b
Residual 649067.350 1956 331.834
Total 1267821.787 1961
a. Dependent Variable: DPS
b. Predictors: (Constant), Net Profit, ROE, EPS, LN Shares, LN Sales
Coefficientsa
Model Unstandardized
Coefficients
Standardized
Coefficients
t Sig. 95.0% Confidence Interval for
B
B Std.
Error
Beta Lower
Bound
Upper Bound
1
(Constant) -14.122 4.259 -3.315 .001 -22.476 -5.769
ROE .717 .021 .579 34.021 .000 .675 .758
EPS .033 .005 .118 6.962 .000 .024 .043
LN Sales .01 .341 .221 10.770 .000 3.001 4.337
LN Shares -.108 .477 -.175 -8.620 .000 -5.043 -3.174
Net Profit .0061 .000 .093 4.688 .000 .000 .000
a. Dependent Variable: DPS