divided cities: increasing socio-spatial polarization within large
TRANSCRIPT

DI
SC
US
SI
ON
P
AP
ER
S
ER
IE
S
Forschungsinstitut zur Zukunft der ArbeitInstitute for the Study of Labor
Divided Cities: Increasing Socio-Spatial Polarization within Large Cities in the Netherlands
IZA DP No. 8882
February 2015
Merle ZwiersReinout KleinhansMaarten van Ham

Divided Cities: Increasing Socio-Spatial Polarization within Large Cities in the Netherlands
Merle Zwiers Delft University of Technology
Reinout Kleinhans Delft University of Technology
Maarten van Ham
Delft University of Technology and IZA
Discussion Paper No. 8882 February 2015
IZA
P.O. Box 7240 53072 Bonn
Germany
Phone: +49-228-3894-0 Fax: +49-228-3894-180
E-mail: [email protected]
Any opinions expressed here are those of the author(s) and not those of IZA. Research published in this series may include views on policy, but the institute itself takes no institutional policy positions. The IZA research network is committed to the IZA Guiding Principles of Research Integrity. The Institute for the Study of Labor (IZA) in Bonn is a local and virtual international research center and a place of communication between science, politics and business. IZA is an independent nonprofit organization supported by Deutsche Post Foundation. The center is associated with the University of Bonn and offers a stimulating research environment through its international network, workshops and conferences, data service, project support, research visits and doctoral program. IZA engages in (i) original and internationally competitive research in all fields of labor economics, (ii) development of policy concepts, and (iii) dissemination of research results and concepts to the interested public. IZA Discussion Papers often represent preliminary work and are circulated to encourage discussion. Citation of such a paper should account for its provisional character. A revised version may be available directly from the author.

IZA Discussion Paper No. 8882 February 2015
ABSTRACT
Divided Cities: Increasing Socio-Spatial Polarization within Large Cities in the Netherlands
There is increasing evidence that our societies are polarizing. Most studies focus on labour market and educational outcomes and show a socioeconomic polarization of the bottom and top ends of the population distribution. Processes of social polarization have a spatial dimension which should be visible in the changing mosaic of neighbourhoods in cities. Many studies treat neighbourhoods as more or less static entities, but urban researchers are now increasingly interested in neighbourhood trajectories, moving away from point-in-time measures and enabling a close examination of processes of change. Sequence analysis allows for a visualization of complete trajectories, and is therefore gaining popularity in the social sciences. However, sequence analysis is mainly a descriptive method and statisticians have argued for the use of a tree-structured discrepancy analysis to examine to what extent outcome variability can be explained by a set of predictors. This paper offers a first empirical application of sequence analysis combined with a tree-structured discrepancy analysis. This paper contributes to the debate on urban renewal programs by offering a unique viewpoint on longitudinal neighbourhood change. Our findings show a clear pattern of socio-spatial polarization in Dutch cities, raising questions about the effects of area-based policies and the importance of path-dependency. JEL Classification: O18, P25, R23 Keywords: neighbourhood change, socio-spatial polarization, urban renewal,
sequence analysis, tree-structured discrepancy analysis Corresponding author: Merle Zwiers Delft University of Technology Faculty of Architecture and the Built Environment OTB - Research for the Built Environment P.O. Box 5043 2600 GA Delft The Netherlands E-mail: [email protected]
2
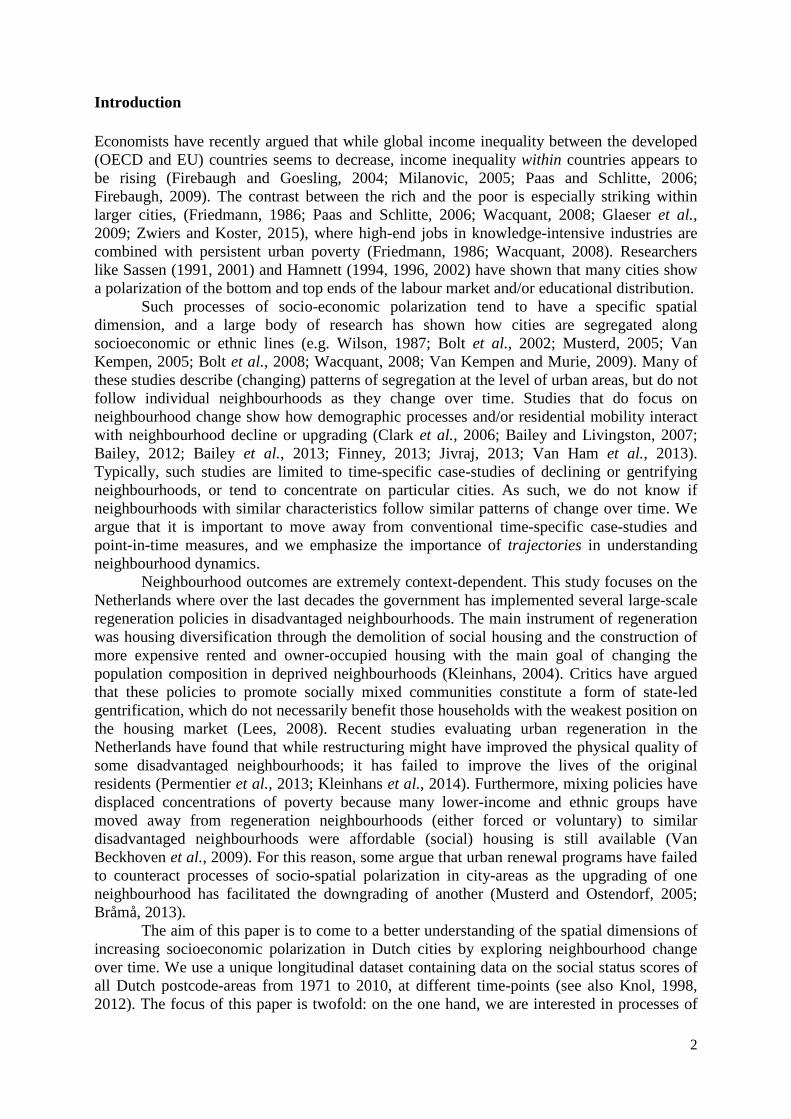
Introduction Economists have recently argued that while global income inequality between the developed (OECD and EU) countries seems to decrease, income inequality within countries appears to be rising (Firebaugh and Goesling, 2004; Milanovic, 2005; Paas and Schlitte, 2006; Firebaugh, 2009). The contrast between the rich and the poor is especially striking within larger cities, (Friedmann, 1986; Paas and Schlitte, 2006; Wacquant, 2008; Glaeser et al., 2009; Zwiers and Koster, 2015), where high-end jobs in knowledge-intensive industries are combined with persistent urban poverty (Friedmann, 1986; Wacquant, 2008). Researchers like Sassen (1991, 2001) and Hamnett (1994, 1996, 2002) have shown that many cities show a polarization of the bottom and top ends of the labour market and/or educational distribution. Such processes of socio-economic polarization tend to have a specific spatial dimension, and a large body of research has shown how cities are segregated along socioeconomic or ethnic lines (e.g. Wilson, 1987; Bolt et al., 2002; Musterd, 2005; Van Kempen, 2005; Bolt et al., 2008; Wacquant, 2008; Van Kempen and Murie, 2009). Many of these studies describe (changing) patterns of segregation at the level of urban areas, but do not follow individual neighbourhoods as they change over time. Studies that do focus on neighbourhood change show how demographic processes and/or residential mobility interact with neighbourhood decline or upgrading (Clark et al., 2006; Bailey and Livingston, 2007; Bailey, 2012; Bailey et al., 2013; Finney, 2013; Jivraj, 2013; Van Ham et al., 2013). Typically, such studies are limited to time-specific case-studies of declining or gentrifying neighbourhoods, or tend to concentrate on particular cities. As such, we do not know if neighbourhoods with similar characteristics follow similar patterns of change over time. We argue that it is important to move away from conventional time-specific case-studies and point-in-time measures, and we emphasize the importance of trajectories in understanding neighbourhood dynamics.
Neighbourhood outcomes are extremely context-dependent. This study focuses on the Netherlands where over the last decades the government has implemented several large-scale regeneration policies in disadvantaged neighbourhoods. The main instrument of regeneration was housing diversification through the demolition of social housing and the construction of more expensive rented and owner-occupied housing with the main goal of changing the population composition in deprived neighbourhoods (Kleinhans, 2004). Critics have argued that these policies to promote socially mixed communities constitute a form of state-led gentrification, which do not necessarily benefit those households with the weakest position on the housing market (Lees, 2008). Recent studies evaluating urban regeneration in the Netherlands have found that while restructuring might have improved the physical quality of some disadvantaged neighbourhoods; it has failed to improve the lives of the original residents (Permentier et al., 2013; Kleinhans et al., 2014). Furthermore, mixing policies have displaced concentrations of poverty because many lower-income and ethnic groups have moved away from regeneration neighbourhoods (either forced or voluntary) to similar disadvantaged neighbourhoods were affordable (social) housing is still available (Van Beckhoven et al., 2009). For this reason, some argue that urban renewal programs have failed to counteract processes of socio-spatial polarization in city-areas as the upgrading of one neighbourhood has facilitated the downgrading of another (Musterd and Ostendorf, 2005; Bråmå, 2013).
The aim of this paper is to come to a better understanding of the spatial dimensions of increasing socioeconomic polarization in Dutch cities by exploring neighbourhood change over time. We use a unique longitudinal dataset containing data on the social status scores of all Dutch postcode-areas from 1971 to 2010, at different time-points (see also Knol, 1998, 2012). The focus of this paper is twofold: on the one hand, we are interested in processes of

3
socio-spatial polarization in Dutch cities over a longer period of time. For this part of the paper, we create maps to visualize neighbourhood change for the four largest cities over a period of forty years. On the other hand, we are interested in neighbourhood trajectories and aim to understand how these are related to context. Here, we use sequence analysis to investigate neighbourhood trajectories. However, sequence analysis is ultimately a descriptive method and because our goal is to understand which covariates significantly affect neighbourhood trajectories, we have implemented a tree-structured discrepancy analysis. To our knowledge, this paper offers the first empirical application of a tree-structured discrepancy analysis in the field of neighbourhood research, and while relatively new, this method appears to be promising for explaining sequence trajectories and for building typologies of change trajectories. Social polarization in cities It has long been recognized that the contrast between the rich and the poor is especially striking in urban areas, and researchers have formulated different explanations. Based on research in large cities, such as New York, Tokyo and London, Saskia Sassen (1991, 2001) has argued that this polarization can be explained by the shift from industrial to post-industrial labour markets which has led to an increasing internationalization of the economy and the development of ‘global cities’ that function as production sites for specialized (financial) services. Her social polarization hypothesis states that at the same time, the specific structure of the economy in global cities also generates a vast array of low-wage jobs, attracting many migrant and lower income groups. As a result, these cities experience an increase in the demand for professional, high-skilled labour, and simultaneously, low-skilled, low-paid service jobs. Chris Hamnett (1994, 1996, 2002) has questioned Sassen’s hypothesis, emphasizing the role of education and arguing that, instead of a process of social polarization, we can witness a process of growing income polarization or inequality as the result of a professionalization of the occupational structure. According to Hamnett (1996), cities experience an increase in the proportion of professionals and managers, while the need for low-skilled workers is decreasing, leading to high unemployment levels and an ‘outsider-surplus’ (Buck, 1997; Hamnett, 2002). In both Sassen’s and Hamnett’s theories, the specific occupational structure in city-areas causes polarization along socioeconomic and ethnic lines (Burgers and Musterd, 2002, see also Zwiers & Koster, 2015). The consensus view is that social polarization has a specific spatial outcome (Tilly, 1998; Van Eijk, 2010). Research has mainly focused on segregation and shows how the social distance between the rich and the poor is translated into spatial segregation where low-income groups (including ethnic minorities) are concentrated in particular parts of cities (e.g. Musterd, 2005; Van Kempen, 2005; Bolt et al., 2008; Van Eijk, 2010). Many segregation studies look at (changing) patterns of segregation, but still have a rather static view of individual neighbourhoods. Studies that do take individual neighbourhood change into account are often focused on particular time-specific case-studies of gentrifying or declining neighbourhoods. As most studies on neighbourhood change are focused on relatively short periods of time – largely due to a lack of data – there is a gap in our knowledge on long-term neighbourhood change. A clear exception is David Hulchanski’s (2010) unique long-term study of the city of Toronto, in which he shows how Toronto has become increasingly polarized in terms of income. The inner-city neighbourhoods that were relatively poor and disadvantaged in the 1970s have become gentrified, and the previously wealthy suburban areas have experienced major downgrading (Van Ham et al., 2013). Using Canadian Census

4
Data for the city of Toronto from 1970 to 2005, Hulchanski (2010) illustrates that a process of spatial (income) polarization has taken place. Compared to 1970, in 2005, the share of high- and low- income neighbourhoods has increased while the middle income neighbourhoods are disappearing from the city. Hulchanksi’s findings raise questions about long-term neighbourhood change in other contexts, for example, in countries with a stronger welfare state involvement.
While neighbourhoods tend to be dynamic in their population composition over short periods of time – as a result of residential mobility or demographic processes (Van Ham et al., 2013) – changes in the physical fabric and the overall socio-economic status of a neighbourhood are much slower processes (Meen et al., 2013; Tunstall, forthcoming).There is therefore a need to focus on long-term neighbourhood trajectories, which allows for the investigation of complete pathways, and can contribute to a better understanding of the drivers behind neighbourhood change. Urban renewal and neighbourhood change Neighbourhood trajectories are extremely context dependent (Musterd and Ostendorf, 1998; Burgers and Musterd, 2002; Musterd and Ostendorf, 2005). Compared to the United States, it has been argued that European welfare states have mitigated socio-spatial polarization in cities to varying extents (Musterd and Ostendorf, 1998). In the Netherlands, the government has historically been strongly involved in housing and urban policies as an instrument to promote equal opportunities (Kleinhans, 2004). After the Second World War, large (affordable) high-rise housing estates were constructed as a response to the enormous housing shortage. These housing estates were located at some distance from the city centres, and initially functioned well in the local housing markets, with high levels of resident satisfaction with both dwellings and neighbourhoods (Van Beckhoven et al., 2009). From the 1970s onwards, the development of new low-rise neighbourhoods in the suburbs and satellite towns stimulated a process of relative depreciation of the high-rise housing estates. This led to the out-migration of middle and higher income groups, and the in-migration of lower income groups, which led to a range of social problems and a further decline of the attractiveness of the high rise estates (Prak and Priemus, 1986). In Prak and Priemus’ (1986) model of neighbourhood decline, the low initial quality of these post-war neighbourhoods is central to explaining later processes of neighbourhood decline. Meen and colleagues (2013) have argued that initial advantages and disadvantages of neighbourhoods tend to be reinforced over time, and play an important role in neighbourhood development; asserting path-dependency (Meen and Nygaard, 2011; Meen et al., 2013).
In 1997, a national Urban Renewal Policy was implemented in the Netherlands as a response to the rapid decline of post-war urban neighbourhoods, with the main goal of upgrading the worst neighbourhoods (Kleinhans, 2004). It was argued that the high share of social housing in these neighbourhoods, combined with negative trends involving high unemployment levels, the out-migration of businesses and increasingly unattractive living environments, reinforced each other into a spiral of decline (Uitermark, 2003; van Kempen and Bolt, 2009). To counteract concentrated deprivation, policy makers stated that there was a need to diversify the population composition in these neighbourhoods: homogeneous neighbourhoods with an overrepresentation of social housing should be transformed into mixed areas in terms of socioeconomic status (van Kempen and Bolt, 2009).
The main tools to accomplish a social mix in these neighbourhoods were the demolition of social housing and the construction of more expensive owner-occupied and rented dwellings (MVROM, 1997). The rationale behind this housing diversification was the

5
idea that bringing in middle-class residents into disadvantaged neighbourhoods would naturally lead to an overall upgrading of neighbourhoods. It was argued that social mixing would not only improve the position of the neighbourhood on the housing market; it was also assumed that it would lead to a better reputation of the neighbourhood, reduced maintenance costs, more social cohesion and participation among the residents, and even social mobility of the original residents (Tunstall, 2003). Studies evaluating social mix programmes in the Netherlands, but also elsewhere, have argued that although there have been major physical improvements in restructuring neighbourhoods; the policies have failed to significantly improve the socioeconomic position of the original residents (Permentier et al., 2013; Kleinhans et al., 2014). This is no surprise as there is no clear intervention theory on the potential causal mechanism between creating mixed neighbourhoods and individual level social mobility outcomes (van Ham et al., 2014). If anything, policies of social mixing are more likely to undermine existing social networks through processes of displacement (cf. Uitermark, 2003).
While these studies have shown that urban restructuring policies have not led to the desired changes in restructuring neighbourhoods, we have very little understanding of the trajectories of other types of neighbourhoods. It has been argued that the demolition of social housing in disadvantaged neighbourhoods might have an effect on other neighbourhoods through processes of displacement of low-income groups. These groups cannot afford to live in the newly constructed dwellings in their original neighbourhood and are then forced to find affordable (social) housing elsewhere (Posthumus et al., 2013). However, because these groups are limited in their choice set, they tend to end up in neighbourhoods with a similar population composition and socioeconomic profile, which might lead to concentrations of deprivation in other neighbourhoods (Bolt et al., 2009).
There is no direct evidence that the relocation of low-income households will lead to new concentrations of poverty in other neighbourhoods; it is nevertheless likely to have an effect on the situation in, and development of, destination neighbourhoods (Kleinhans and Varady, 2011; Kleinhans and Kearns, 2013). However, as the demolition of a substantial part of the social housing stock in restructuring areas leads to decreases in the overall share and relative quality of the social housing stock, this will likely contribute to a process of residualization of the social housing stock in other (disadvantaged) neighbourhoods (Kleinhans and van Ham, 2013). This might be particularly true in current times, when investments in the construction of new social rented dwellings are put on hold because of the financial crisis (Zwiers et al., 2014). On the city-level, all these developments can constitute a zero-sum game as the social upgrading of one neighbourhood might be balanced by the deterioration of another neighbourhood (Musterd and Ostendorf, 2005; Bråmå, 2013). This way, urban renewal programs have failed to counteract processes of socio-spatial polarization.
In this paper we do not focus on the trajectory of a particular neighbourhood, or a particular type of neighbourhood, but we focus on the whole spectrum of neighbourhoods in cities to get a complete understanding of neighbourhood trajectories and the possible effects of area-based policies. The present study explores processes of socio-spatial polarization in Dutch cities. From Sassen’s and Hamnett’s studies, we know that most large cities have experienced a polarization of the occupational structure and as a result we also expect to find longer term patterns of increasing spatial polarization in line with the work by Hulchanski (2010). In the context of extensive urban renewal programs, we are interested in understanding how the initial quality of the housing stock, changes in the housing stock and the population composition have affected overall neighbourhood development.

6
Data, measurement and methods Data This paper uses a unique dataset provided by the Netherlands Institute for Social Research (SCP) in collaboration with Statistics Netherlands (CBS), which includes data on the social status (and relative deprivation) of neighbourhoods from 1971 to 2010 (Knol, 1998, 2012). The data enables the study of neighbourhood change over a longer period of time as it includes aggregated data at the postcode-level for 1971, 1998, 2002, 2006, and 2010. Especially the inclusion of 1971 data is unique because historic neighbourhood level data from before the 1990s is extremely scarce in the Netherlands due to administrative changes in the collection of data. As a result of these changes, there is a 27 year time-gap between the 1971 and 1998 data points. Despite the fact that the data is not easily comparable over time, it still offers us a unique opportunity to investigate long-term neighbourhood trajectories.
The data from 1971 is based on the last Dutch census collected and processed by Statistics Netherlands. Because postcode-areas were only introduced in 1977, the Netherlands Institute for Social Research has aggregated the individual-level census data from 1971 to the postcode level. The 1971 neighbourhood social deprivation indicator was calculated using Principal Component Analysis and information on income, living situation and education in neighbourhoods (see also Knol, 1998). Data from 1998 to 2010 originates from the Woonmilieudatabank (WMD), which is part of GeoMarktProfiel (GMP). The data is collected from a sample of one person per six-position postcode areas (industrial and agricultural areas with fewer than one hundred residents have been excluded).The data was then aggregated to four-position postcode areas, which, on average, consist of one thousand six-position postcode areas. Respondents were asked about their perception of the status of the neighbourhood and their neighbours. Information about perceptions of income, education and employment is combined into one social status indicator using Principal Component Analysis. These indicators have been centered around their mean, with zero equal to the Dutch average over a cumulative period of 12 years. A higher score implies a higher status, and similarly, a lower score implies a lower status (see also Knol, 2012).
Obviously, the more recent social status indicators are subjective indicators in the sense that they refer to personal perceptions and evaluations of neighbourhoods and neighbours. While it could be argued that subjective measures are unstable over time, are incomparable across individuals, and might not correlate with objective measures (McCrea et al., 2006; Veenhoven, 2007); subjective measures are important because they drive individual behaviour (Logan and Collver, 1983; Rabe and Taylor, 2010). Moreover, research has shown that people have the ability to rank local areas by socioeconomic status and that people from different income groups generally share the same general perception of neighbourhood status (Coleman and Neugarten, 1972; Hourihan, 1979; Semyonov and Kraus, 1982; Logan and Collver, 1983; Permentier et al., 2011). As such, we believe that the subjective indicators can be used as proxies for neighbourhood social status and we will henceforth refer to them as social status indicators.
Several control variables from the ABF Vastgoedmonitor (version November 2011) have been added to our dataset. The ABF Vastgoedmonitor contains longitudinal information on the housing situation and population composition in Dutch neighbourhoods, enabling us to investigate how social status indicators are related to changes in neighbourhood context. Measures and selections The dependent variable in this study is neighbourhood’ social status. We use social status indicators to measure social polarization. Social polarization is often defined in terms of educational and/or labour market outcomes (Sassen, 1991; Hamnett, 1994, 1996; Sassen,

7
2001; Hamnett, 2002; Van Eijk, 2010), and because our social status indicators are composite variables that measure employment, education and income, we believe that they can be used to measure social polarization. The empirical section of this study consists of two parts. The first part is mainly descriptive and focuses on visualizing neighbourhood change over a longer period of time in the four largest cities of the Netherlands. Because the social status measures differ over time, it is impossible to directly compare data from 1971 to data from 2010. A solution to this problem is to work with neighbourhood rankings: for each time period, all neighbourhoods have been ranked according to their social status indicators. The rankings have been recoded into a categorical variable with equal size deciles, with the first decile representing a high social status and the last decile a low social status. To avoid problems with administrative changes, we use neighbourhood maps from 2010 and we follow the administrative neighbourhood and city boundaries from 2010. Newly constructed neighbourhoods are included. The maps are created in R version 3.1.2 (“Pumpkin Helmet”). The second part of this study is a more detailed analysis of neighbourhood trajectories. For this part of the analysis we will only use the social status indicators from 1998 to 2010 because these are directly comparable over time because they have been constructed in exactly the same way. Another reason is that this time-period coincides with the Dutch urban renewal program. The social status indicators are standardized variables that have been centered around their 12-year average and recoded into 10 equal groups (deciles). Because we are interested in change over time, we have centered the variables around their mean in their respective time-periods before recoding them. Recoding the continuous social status variables into a categorical variable is necessary, because the sequence analysis requires bounded states. To test the robustness of our categorization, we have also conducted all our analyses with a five-group categorical variable and a fifteen-group categorical variable. All robustness analyses yield similar results (results available upon request). We have decided to use the categorical variable with deciles, which, one the one hand, facilitates the visualization and comprehensibility of our results, and on the other hand, is detailed enough to illustrate the mosaic of neighbourhood change. For this part of the analysis, we have deleted all missing cases which resulted in a total of 3,404 out of 3,499 postcode-areas. To explore the hypothesis of increasing socio-spatial polarization in cities, we use the thirty largest cities in the Netherlands, resulting in a selection of 703 postcode-areas.
Table 1 provides an overview of the variables used in the analysis. To see how different ‘starting positions’ have affected neighbourhood trajectories, we have included the average housing values of the municipality in 1998 in euros and the percentage of post-war dwellings in 1998 (all dwellings built between 1945 and 1970). To assess the effects of changes in the housing stock on neighbourhood trajectories, we have included a variable measuring change in the share of social rented dwellings between 1998 and 2010 and a variable measuring change in the share of owner-occupied dwellings between 1998 and 2010. To analyse the effects of changes in the population composition, we have included a variable measuring the 1998-2010 change in the percentage of non-western minorities (first and second generation).
[Table 1 about here] Methods Sequence analysis The neighbourhood trajectories will be visualized using sequence analysis, enabling us to show the social status of a neighbourhood at each of the four time-points (1998, 2002, 2006, 2010) using a colour scheme. A neighbourhood can, for example, be in the lowest social

8
status decile (the 10thdecile) in 1998, then move up to the 9thdecile in 2002 and the 8thdecile in 2006, to end in the 7th social status decile. The sequence of this particular neighbourhood would then look like this: 10th decile-9th decile-8th decile-7thdecile (for a detailed understanding of sequence analysis see Gabadinho et al., 2011). Each social status decile category is assigned a different colour where the red to blue scheme represents the low to high status neighbourhood status scale. All sequences together can be visualized as a series of individual neighbourhood trajectories, which represent how each neighbourhood moves through the different states over time. There are different ways to visualize sequences, and in this paper, we use a sequence distribution plot showing the overall neighbourhood distribution instead of individual sequences. This means that we will not focus on individual neighbourhood change, but instead are more interested in the general pattern of the whole set of trajectories (see also Gabadinho et al., 2011). The neighbourhood sequences were plotted in R version 3.1.2 (“Pumpkin Helmet”) using the TraMineR package (Gabadinho et al., 2011). Visualizing and analyzing neighbourhood sequences allows for the study of ‘complete’ patterns and provides insight in diverse trajectories over time (see also Coulter and Van Ham, 2013; van Ham et al., 2014). The ten most frequent sequences are illustrated in Table 2. [Table 2 about here] Tree-structured discrepancy analysis We are interested in explaining variation in neighbourhood trajectories. Sequence analysis is often combined with cluster analysis to create a typology of groups of sequences using different matching algorithms. While this combination of methods can be used as a descriptive method; it tends to be problematic when trying to explain the typology. Using the clusters generated by cluster analysis as a dependent variable in further analyses is challenging and requires the assumption that the clusters are clearly distinct groups; this assumption is often not met (see Studer, 2013). Testing for stable cluster membership and quality of the clusters, often yield contradictory and inconclusive outcomes, making it difficult to select the appropriate number of clusters and assess their quality.
An alternative approach is to use discrepancy analysis, which does not presuppose clearly defined groups or clusters a priori, but can also be used to build typologies (Studer et al., 2010; Studer and Bürgin, 2012; Studer, 2013). A tree-structured discrepancy analysis will create groups of sequences that are similar to each other, using the values of a predictor (Studer, 2013). This means that the sequences are grouped together based on the selected predictors, instead of using an arbitrary algorithm. Rather than creating random groups of sequences and trying to explain them using a set of predictors (as would be the case when using cluster analysis), a tree-structured discrepancy analysis works the other way around: a set of predictors is used to create meaningful groups of sequences. A tree-structured discrepancy analysis thus allows us to understand how variation in neighbourhood sequences can be explained by changes in the housing stock and population composition, and how these changes will affect (groups of) neighbourhoods in different ways. To our knowledge, this paper is the first empirical application of a combination between sequence analysis and a tree-structured discrepancy analysis in the social sciences, constituting a new way of researching neighbourhood dynamics, and a move towards the visualization and analysis of complex trajectories.
We have first conducted a multifactor discrepancy analysis to assess the raw effects of the variables on the sequences trajectories (results available from the first author upon request).The multifactor approach offers insight in which covariates are significantly associated with the neighbourhood trajectories and provides information on the significance

9
of the variables (using permutation tests) and the strength of the model using a pseudo F and a pseudo R2 (see also Studer et al., 2011).The tree-structured discrepancy analysis uses a dissimilarity matrix based on optimal matching algorithms to analyse the discrepancy between sequences (more details on the algorithms used in these analyses available from the first author). The tree-structured discrepancy analysis starts with all sequences grouped in an initial group. In the next step, the discrepancy analysis uses the most important (significant) predictor and its most important values to split the group into two distinctly different groups. The criterion for the split is derived from the pairwise dissimilarities and uses a pseudo R2 and a pseudo F test. Significance is assessed through permutation tests (5000 permutations are sufficient to assess the results at the 1% significance level, see Studer et al., 2011). For each of the newly created groups, the discrepancy analysis splits the groups into two again, using the second most important predictor and its values (for that group) for which the highest pseudo R2 is found. This process leads to the creation of groups that are distinctly different from each other, i.e. that have the lowest within discrepancy. The process is repeated until a stopping criterion is reached or when a non-significant F for the selected split is encountered (Studer et al., 2010).
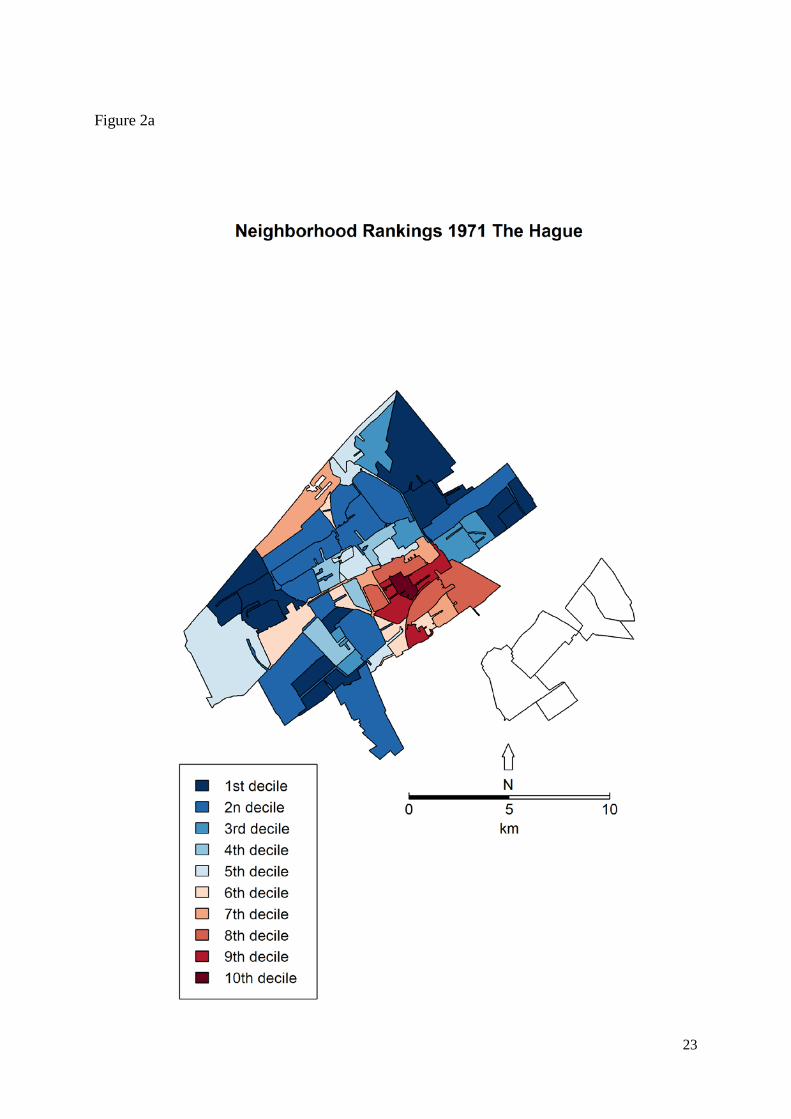
The discrepancy analysis uses the pseudo R2 as a splitting criterion which means that a group can only be split into two new groups (for more information on this topic see Studer et al., 2010). Nevertheless, the discrepancy analysis is a powerful way to understand how each selected variable nuances the effect of other variables introduced at earlier levels. The overall quality of the model can be assessed through the pseudo F test and the pseudo R2, that provide information on the statistical significance of the tree and the part of the total discrepancy explained, respectively (Studer et al., 2010). The tree structured discrepancy analysis can be illustrated in a comprehensible way using tree-structured sequence plots (ibid). Results To explore processes of socio-spatial polarization, we have visualized neighbourhood change in the four major Dutch cities, as shown in the maps in Figure 1 to 4. The maps show the neighbourhood rankings in 1971 and 2010 for Amsterdam, the Hague, Rotterdam and Utrecht, in relation to the Dutch average. The maps paint a picture of increasing social polarization in these four cities. Figure 1 shows that the socio-spatial structure of Amsterdam has turned more or less inside out: the inner-city neighbourhoods have experienced significant upgrading, while the neighbourhoods at the outskirts of the city have experienced downgrading. These results are comparable to what was found for Toronto by Hulchanski (2010). Figure 2 illustrates that, in the Hague, the neighbourhoods that are located adjacent to the sea in the south-western part of the city have maintained their high status over time. The picture of Rotterdam (Figure 3) shows significant downgrading of the whole city over the last forty years. There are a couple of neighbourhoods in the northern part of the city that have experienced some upgrading, but the largest part of Rotterdam is experiencing downgrading compared to the rest of the country. Figure 4 displays the neighbourhood rankings in Utrecht, showing that Utrecht has experienced the least socio-spatial polarization of the four cities as the contrast between the high status and low status neighbourhoods appears to be more nuanced. [Figure 1, 2, 3, 4 about here] While the four cities do not all show the same patterns (which can be explained by the different histories and contexts of each city); the overall picture is that these cities have

10
become increasingly polarized in terms of social status. The maps show that the average status neighbourhoods are disappearing from the cities, which is similar to Hulchanski’s (2010) findings for Toronto. In all four cities, we see that many neighbourhoods built after the Second World War were high status neighbourhoods in 1971, but by 2010, these post-war neighbourhoods have experienced significant downgrading and are now the most disadvantaged neighbourhoods in the Netherlands. This can be explained by the low-quality of these neighbourhoods which led to the development of multiple technical and physical problems, which, combined with relative downgrading due to new construction elsewhere, fuelled processes of neighbourhood decline (Prak and Priemus, 1986; Kleinhans, 2004). The maps of the four largest cities only show the differences in neighbourhood social status between two points in time – 1971 and 2010. While this longitudinal dimension gives us unique information about neighbourhood change and socio-spatial polarization over a longer period of time; the use of two time-points fails to provide insight in the trajectories of neighbourhoods as they move through different states over time. Focusing on neighbourhood social status in 1998, 2002, 2006 and 2010, we have compared the neighbourhood sequences of the thirty largest Dutch cities (N = 703) to the sequences of more rural areas (N = 2,701) (results not shown here). Our findings suggest that the overall neighbourhood status distribution has not changed much over a period of twelve years. The thirty largest cities are characterized by a large share of disadvantaged neighbourhoods, and at the same time, a fair share of high status neighbourhoods. This distribution appears to be stable over time. The share of neighbourhoods with an average status is much smaller in large cities. These average status neighbourhoods appear to be a characteristic of smaller cities and rural areas, where we can find a much more equal neighbourhood distribution, with a relatively small share of low status neighbourhoods. In sum, we find that, compared to more rural areas; large cities appear to experience more socio-spatial polarization.
Using neighbourhood maps of Amsterdam, the Hague, Rotterdam and Utrecht to look at neighbourhood change over a longer period of time, and sequence plots to explore neighbourhood trajectories, we have found that the largest Dutch cities have experienced an increase of the top and bottom ends of the neighbourhood distribution in terms of social status, at the expense of the middle. We are however interested in how these patterns of neighbourhood change can be explained by a set of predictors. We are interested to know how the quality of the housing stock, and changes in the overall housing stock and ethnic composition, have affected neighbourhood trajectories. We have first conducted a multi-factor discrepancy analysis to assess the raw effect of these variables on the neighbourhood sequences (results not shown here).The global statistics show that the model is significant (F=29.831, R=5000) with an R2 of 17.6%, meaning that our set of variables provide overall significant information about the diversity of neighbourhood trajectories. All variables are significant at the 1% level (assessed through 5000 permutations), and the share of post-war dwellings in 1998 and changes in the percentage social rented dwellings appear to be the most important predictors of neighbourhood trajectories.
The tree-structured discrepancy analysis of the neighbourhood trajectories is displayed in Figure 5.We have used the default stopping criteria of a p-value of 1% for the F test (R = 5000) (see also Studer et al., 2011), fixing the minimal group size at N = 35 (5% of the total N = 703), and allowing for the creation of five levels. Using this stopping criteria, the model selects the most important variables. The plot illustrates the overall sequence distribution. In the plot, the most significant variables and their most significant values are used in their respective order. The change in the share of owner-occupied dwellings is excluded from the analysis; most likely because the share of social housing is a stronger predictor of neighbourhood change. The plot shows that the change in the share of social rented dwellings

11
is the most important variable in our model, followed by the share of post-war dwellings and change in the share of non-western minorities. For each group, we see how the selected variable (and the selected values of the variable) affects the neighbourhood sequences, showing the group size, the within-discrepancy, and the R2 for that split. Our overall tree has an R2 of 18.1%, which is higher than the R2 from the multifactor discrepancy analysis, meaning that the tree has better explanatory power, which can be explained by the fact that the tree automatically accounts for interaction effects (Studer et al., 2011).
[Figure 5 about here]
The change in the share of social rented dwellings between 1998 and 2010 is the most important predictor for neighbourhood trajectories. The variable explains 0.070 of the total R2 and splits the sequences up in a binary tree with neighbourhoods that have experienced a decline in the share of social rented dwellings of more than or equal to 2.3% (N = 437) and neighbourhoods that have experienced very little decline and even increases in social housing (>-2.3%, N = 266). The tree shows that changes in the share of social housing interact with the share of post-war dwellings in 1998. Neighbourhoods that have experienced a decrease in the share of social housing were characterized by a large share of post-war dwellings in 1998. The neighbourhoods that have experienced a decrease in the share of social rented dwellings, are split up according to the share of post-war dwellings in 1998 (R2 = 0.044) into neighbourhoods with more than 48.7% post-war dwellings (N = 114) which are experiencing significantly more downgrading trajectories than neighbourhoods with less than or equal to 48.7% post-war dwellings (N = 323). The former group of neighbourhoods show similar low-status neighbourhood trajectories, as indicated by the low within-group discrepancy (s2 = 1.65). This group can be split up again into neighbourhoods that have experienced a decline in the share of social housing of 8.1% or more (N = 63), which show extremely similar low-status trajectories (s2 = 0.909) and neighbourhoods that have experienced very little decline or even increases (>-8.1%, N = 51). This split has an R2 of 0.117.
The share of post-war dwellings in 1998 interacts with changes in the share of non-western minorities. Neighbourhoods with less than or equal to 48.7% post-war dwellings in 1998 (N = 323) can be split up according to the change in non-western minorities over the period 1998 to 2010 (R2 = 0.052) into neighbourhoods that have experienced a decline in the share of ethnic minorities of more than or equal to 5.8% (N = 168) and neighbourhoods that have experienced an increase of more than 5.8% (N = 155). The former group shows more low-status trajectories, despite changes in the share of non-western minorities. The sequences of the latter group show more nuance in the neighbourhood trajectories, which is supported by the within-group discrepancy which illustrates that these neighbourhoods do not experience very similar trajectories (s2 = 3.03). This group can be split up according to the share of post-war dwellings in 1998 into neighbourhoods with a share of equal to or less than 10.9% post-war dwellings (N = 42), and neighbourhoods with more than 10.9% post-war dwellings (N = 113). This split has an R2 of 0.045.
For the neighbourhoods that have experienced a decline of more than or equal to 5.8% in the share of non-western minorities, the average housing value in the city in 1998 seems to matter (R2 = 0.076). The tree shows that neighbourhoods in cities with an average housing value of less than or equal to 63.000 euros (N = 90) tend to experience more similar low status trajectories (s2 = 1.85) compared to neighbourhoods with an average value of more than 63.000 euros (N = 78, s2 = 2.7).
Looking at the right hand side of the tree, we see that these neighbourhood trajectories appear to show much more variety in trajectories compared to the left hand side, indicated by relatively high within-group discrepancies, and the presence of more high status trajectories.

12
Neighbourhoods that have experienced very little decrease and more increases in the share of social housing (>-2.3, N = 266) can be split up according to the change in the share of non-western minorities into neighbourhoods that have experienced a decline of equal to or more than 1.2% (N = 75) and neighbourhoods that have experienced an increase of more than 1.2% (N = 191). This split has an R2 of 0.031.The neighbourhoods that have experienced an increase in the share of non-western minorities do not directly show a downward neighbourhood trajectory and appear to be characterized by relatively high status trajectories. This group can be split according to the share of post-war dwellings in 1998 (R2 = 0.039) into neighbourhoods with a relatively small share of post-war dwellings (<=30.3%, N = 130) and neighbourhoods with a large share (>30.3%. N = 61). The neighbourhoods with a smaller share of post-war dwellings show slightly more high status trajectories, but both groups are characterized by a relatively high within-group discrepancy, suggesting that there is diversity in neighbourhood trajectories. The last split shows that of the neighbourhoods with relatively few post-war dwellings, neighbourhoods can be further split up according to the change in the share of social rented dwellings (R2 = 0.039). Neighbourhoods that have experienced a small increase and decline in social rented dwellings (<=2.9%, N = 83) show more diversity in their neighbourhood trajectories than the neighbourhoods that have experienced an increase in the share of social rented dwellings (>2.9%, N = 47). The latter group showing high-status trajectories (s2 = 2.08).
Our findings show that neighbourhoods that have experienced a significant decline in the share of social housing and a decline in the share of ethnic minorities are characterized by a persistent low-status trajectory. This is an interesting finding which seems to suggest that such changes are not directly associated with neighbourhood upgrading. We find that neighbourhoods with large shares of post-war dwellings in 1998 tend to be characterized by similar low-status trajectories, despite declines in the share of social housing, suggesting that the initial low quality of post-war neighbourhoods is reinforced over time. This might indicate that the demolition, renovation or sales of a selection of social rented dwellings does not affect the social status of the entire neighbourhood. It has been argued that while a large number of social rented dwellings have been demolished; the overall share of social housing remained high in most restructuring neighbourhoods (Dol and Kleinhans, 2012). Urban restructuring is only effective in reducing socio-spatial segregation when a substantial part of the social housing stock in a neighbourhood is replaced by owner-occupied dwellings (Bolt et al., 2009). Another possible explanation is that, in many restructuring neighbourhoods, the original residents moved back in newly constructed more expensive dwellings (receiving discounts on the rent). This meant that while these neighbourhoods had experienced a physical upgrade; the social status of the residents has remained largely unchanged (Kleinhans et al., 2014).
Looking at changes in the percentage of non-western minorities between 1998 and 2010, our findings seem to suggest two things: (1) mainly neighbourhoods with a higher share of post-war dwellings in 1998 experience an increase in the share of non-western minorities; and (2) an increase in the share of non-western minorities is not directly associated with low status trajectories. The neighbourhoods that have experienced a decline in the share of social housing and a decline in the share of ethnic minorities, continue to show low-status trajectories. Besides the fact that the share of social housing remained high in these neighbourhoods, this indicates that a decline in the share of ethnic minorities is not automatically associated with neighbourhood upgrading. This might indicate that the out-migration of ethnic minorities (either more voluntary or forced), only facilitates the in-migration of other groups with a similar socioeconomic status, thus not significantly leading to an upgrading of the neighbourhood. Moreover, our findings also suggest that the share of post-war dwellings in 1998 interacts with changes in the share of ethnic minorities, suggesting

13
that neighbourhoods with relatively more post-war dwellings in 1998 are associated with an increase in the share of ethnic minorities. This might indicate a process of residualization of the social housing stock where ethnic minorities tend to relocate to other (low-status) neighbourhoods where affordable housing is still available. While this group of neighbourhoods is not characterized by low status trajectories only; the large majority of the trajectories are however located at the bottom end of the social status distribution, raising questions about processes of neighbourhood decline in the future (see also Zwiers et al., 2014).
At the same time, increases in the share of social housing and ethnic minorities are not directly associated with neighbourhood downgrading. These neighbourhoods show more variety in their trajectories and tend to be characterized by a relatively high status. This is possibly explained by the fact that newly built social rented dwellings between 1998 and 2010 are likely to be good quality dwellings that have not experienced much decline (yet). Because the Dutch government was focused on decreasing concentrations of poverty and creating socially mixed communities in that period, it is likely that these new social rented dwellings are built in a variety of neighbourhoods with different housing market positions, possibly explaining a more equal population distribution over space. Conclusion This study focused on processes of socio-spatial polarization in Dutch cities, and investigated how changes in the housing stock and population composition are associated with neighbourhood trajectories. Combining sequence analysis and discrepancy analysis has shown to be a powerful tool to visualize and understand complex, contextualized patterns of change. The tree-structured discrepancy analysis revealed that changes in the percentage of social rented dwellings between 1998 and 2010, changes in the percentage of ethnic minorities between 1998 and 2010, and the percentage of post-war dwellings in 1998 are the most important variables explaining neighbourhood trajectories.
Our findings have shown that the initial quality of the housing stock is a determinant factor in explaining neighbourhood trajectories. We find that neighbourhoods with large shares of post-war dwellings in 1998 and neighbourhoods in cities with a low average housing value in 1998 are more often characterized by extremely similar low-status trajectories. Contrary to what was expected in urban renewal policies, we found that declines in the share of social housing and ethnic minorities were not directly associated with upward neighbourhood trajectories. These neighbourhoods appear to be characterized by a persistent low-status, raising questions about the effectiveness of urban renewal programs, but also about ‘the problems’ associated with concentrations of social housing and ethnic minority groups. We find that ethnic minorities often end up in neighbourhoods with relatively high shares of post-war dwellings, which suggests that these neighbourhoods continue to be the least attractive, raising questions about the future of these neighbourhoods. At the same time, our findings show that increases in the share of social housing and ethnic minorities are not directly related to neighbourhood downgrading. This might indicate that the social rented dwellings that are built in the period 1998 to 2010 are better quality dwellings that are more evenly distributed between neighbourhoods. Overall, our findings suggest that the low status of neighbourhoods tends to be persistent over time, despite changes in the housing stock and population composition. However, it is possible that the effects of the changes in the share of social housing and non-western minorities on the social status of neighbourhoods are not visible yet.

14
This brings us to the limitations of this study that need to be addressed in further research. We have focused on the overall distribution of neighbourhood trajectories, which does not allow us to comment on changes in individual neighbourhoods. While it is possible that one neighbourhood has experienced a significant change over time, we have merely focused on the idea that the upgrading of one neighbourhood goes hand-in-hand with the downgrading of another. Our analyses are focused on changes between 1998 and 2010, which means that we have no insight in the longer-term effects of these changes. It is possible that the changes explored here will affect the social status of neighbourhoods in the future. Moreover, the analyses conducted in this paper do not allow us to comment on processes of residential mobility. As such, we are not able to assess if changes in the share of low income households in a neighbourhood are the direct result of restructuring programs or more voluntary processes of residential mobility. While residential mobility and demographic factors are important drivers for neighbourhood change (Van Ham et al., 2013); distinguishing the effects of residential mobility on changes neighbourhood social status is beyond the scope of this paper.
The methods used in this paper constitute a new way of investigating neighbourhood dynamics, and can be understood as a first attempt to move away from linear predictions. While sequence analysis is becoming increasingly popular in the social sciences, very few studies have actually tried to explain variation in trajectories. Combining sequence analysis and a tree-structured discrepancy analysis contributes to an understanding of how changes in a particular group of neighbourhoods are related to the development of other neighbourhoods. The analyses shows how specific levels of change function as the tipping-point for a different direction of neighbourhood trajectories. Neighbourhood effects research could greatly benefit from such methods to gain more insight in how neighbourhood trajectories influence individual outcomes such as satisfaction, selective migration and other types of residential behaviour. The methods used in this paper could contribute to an understanding of ‘when’, or ‘under what circumstances’, neighbourhood trajectories diverge in a particular direction, instead of ‘if’. Such research is necessary, because the time-period, frequency and composition of mechanisms that influence neighbourhood trajectories (and individual outcomes) may be non-linear (thresholds), can be temporary or long-lasting, may vary over time, and might be conditional on other factors (Galster, 2012; van Ham and Manley, 2012). Acknowledgements The research leading to these results has received funding from the European Research Council under the European Union's Seventh Framework Program (FP/2007-2013) / ERC Grant Agreement n. 615159 (ERC Consolidator Grant DEPRIVEDHOODS, Socio-spatial inequality, deprived neighbourhoods, and neighbourhood effects) and from the Marie Curie program under the European Union's Seventh Framework Program (FP/2007-2013) / Career Integration Grant n. PCIG10-GA-2011-303728 (CIG Grant NBHCHOICE, Neighbourhood choice, neighbourhood sorting, and neighbourhood effects).We want to thank the Netherlands Institute for Social Research (SCP) and Statistics Netherlands (CBS), and in particular Frans Knol, for providing us with the data. References Bailey, N. (2012) How spatial segregation changes over time: Sorting out the sorting
processes. Environment and Planning A, 44. 3, 705-722.

15
Bailey, N., H. Barnes, M. Livingston and D. Mclennan (2013) Understanding neighbourhood population dynamics for neighbourhood effects research: A review of recent evidence and data source developments. In Van Ham, M., Manley, D., Bailey, N., Simpson, L. & Maclennan, D. (eds.) Understanding neighbourhood dynamics: New insights for neighbourhood effects research. Springer, Dordrecht.
Bailey, N. and M. Livingston (2007) Population turnover and area deprivation, Policy Press, Briston.
Bolt, G., P. Hooimeijer and R. Van Kempen (2002) Ethnic segregation in the Netherlands: New patterns, new policies? Tijdschrift voor economische en sociale geografie, 93. 2, 214-220.
Bolt, G., R. Van Kempen and M. Van Ham (2008) Minority ethnic groups in the Dutch housing market: Spatial segregation, relocation dynamics and housing policy. Urban Studies, 45. 7, 1359-1384.
Bolt, G., R. Van Kempen and J. Van Weesep (2009) After urban restructuring: Relocations and segregation in Dutch cities. Tijdschrift voor economische en sociale geografie, 100. 4, 502-518.
Bråmå, Å. (2013) The effects of neighbourhood regeneration on the neighbourhood hierarchy of the city: A case study in Sweden. In Ham, M. V., Manley, D., Bailey, N., Simpson, L. & Maclennan, D. (eds.) Understanding neighbourhood dynamics: New insights for neighbourhood effects research. Springer, Dordrecht.
Buck, N. (1997) Social divisions and labour market change in London: National, urban and global factors. ISER Working Paper Series. Institute for Social and Economic Research, Essex.
Burgers, J. and S. Musterd (2002) Understanding urban inequality: A model based on existing theories and an empirical illustration. International Journal of Urban and Regional Research, 26. 2, 403-413.
Clark, W., M. Deurloo and F. Dieleman (2006) Residential mobility and neighbourhood outcomes. Housing Studies, 21. 3, 323-342.
Coleman, R. and B. Neugarten (1972) Social status in the city, Jossey-Bass,San Francisco. Coulter, R. and M. Van Ham (2013) Following people through time: An analysis of
individual residential mobility biographies. Housing Studies, 28. 7, 1037-1055. Dol, K. and R. Kleinhans (2012) Going too far in the battle against concentration? On the
balance between supply and demand of social housing in Dutch cities. Urban Research & Practice, 5. 2, 273-283.
Finney, N. (2013) How ethnic mix changes: Typologising neighbourhood population dynamics of ethnic groups. In Ham, M. V., Manley, D., Bailey, N., Simpson, L. & Maclennan, D. (eds.) Understanding neighbourhood dynamics: New insights for neighbourhood effects research. Springer, Dordrecht.
Firebaugh, G. (2009) The new geography of global income inequality, Harvard University Press, Cambridge, MA.
Firebaugh, G. and B. Goesling (2004) Accounting for the recent decline in global income inequality. American Journal of Sociology, 110. 2, 283-312.
Friedmann, J. (1986) The world city hypothesis. Development and change, 17. 1, 69-83. Gabadinho, A., G. Ritschard, N. S. Müller and M. Studer (2011) Analyzing and visualizing
state sequences in R with TraMineR. Journal of Statistical Software, 40. 4, 1-37. Galster, G. (2012) The mechanism(s) of neighbourhood effects: Theory, evidence, and policy
implications. In Van Ham, M., Manley, D., Bailey, N., Simpson, L. & Maclennan, D. (eds.) Neighbourhood effects research: New perspectives. Springer, Dordrecht.
Glaeser, E. L., M. Resseger and K. Tobio (2009) Inequality in cities*. Journal of Regional Science, 49. 4, 617-646.

16
Hamnett, C. (1994) Social polarisation in global cities: Theory and evidence. Urban Studies, 31. 3, 401-424.
Hamnett, C. (1996) Social polarisation, economic restructuring and welfare state regimes. Urban Studies, 33. 8, 1407-1430.
Hamnett, C. (2002) Social polarization in London: The income evidence, 1979-93. In Cross, M. and Moore, R. (ed.) Globalization and the new city. Palgrave McMillian, Houndmills.
Hourihan, K. (1979) The evaluation of urban neighbourhoods 1: Perception. Environment and Planning A, 11. 12, 1337-1353.
Hulchanski, D. (2010) The three cities within Toronto: Income polarization among Toronto’s neighbourhoods, 1970-2005. Cities Centre, University of Toronto, Ontario.
Jivraj, S. (2013) The components of socioeconomic neighbourhood change: An analysis of school census data at varying spatial scales in England. In Ham, M. V., Manley, D., Bailey, N., Simpson, L. & Maclennan, D. (eds.) Understanding neighbourhood dynamics: New insights for neighbourhood effects research. Springer, Dordrecht.
Kleinhans, R. and M. Van Ham (2013) Lessons learned from the largest tenure-mix operation in the world: Right to buy in the United Kingdom. Cityscape, 101-117.
Kleinhans, R., L. Veldboer, W. Doff, S. Jansen and M. Van Ham (2014) Terugblikken en vooruitkijken in Hoogvliet: 15 jaar stedelijke vernieuwing en de effecten op wonen, leefbaarheid en sociale mobiliteit. [Looking back and ahead to Hoogvliet: 15 years of urban renewal and its effects on housing, liveability and social mobility] Delft University of Technology, Faculty of Architecture and the Built Environment, OTB Research, Delft.
Kleinhans, R. J. (2004) Social implications of housing diversification in urban renewal: A review of recent literature. Journal of Housing and the Built Environment, 19. 4, 367-390.
Kleinhans, R. J. and A. Kearns (2013) Neighbourhood restructuring and residential relocation: Towards a balanced perspective on relocation processes and outcomes. Housing Studies, 28. 2, 163-176.
Kleinhans, R. J. and D. Varady (2011) Moving out and going down? A review of recent evidence on negative spillover effects of housing restructuring programmes in the United States and the Netherlands. International Journal of Housing Policy, 11. 2, 155-174.
Knol, F. (1998) Van hoog naar laag, van laag naar hoog: De sociaal-ruimtelijke ontwikkeling van wijken tussen 1971-1995. [Up and down, down and up: the socio-spatial development of neighbourhoods between 1971-1995]. The Netherlands Institute for Social Research, The Hague.
Knol, F. (2012) Statusontwikkeling van wijken in nederland 1998-2010. [Neighbourhood status developement in the Netherlands 1998-2010]. The Netherlands Institute for Social Research, The Hague.
Lees, L. (2008) Gentrification and social mixing: Towards an inclusive urban renaissance? Urban Studies, 45. 12, 2449-2470.
Logan, J. R. and O. A. Collver (1983) Residents' perceptions of suburban community differences. American Sociological Review, 428-433.
Mccrea, R., T.-K. Shyy and R. Stimson (2006) What is the strength of the link between objective and subjective indicators of urban quality of life? Applied Research in Quality of Life, 1. 1, 79-96.
Meen, G. and C. Nygaard (2011) Local housing supply and the impact of history and geography. Urban Studies, 48. 14, 3107-3124.

17
Meen, G., C. Nygaard and J. Meen (2013) The causes of long-term neighbourhood change. In Ham, M. V., Manley, D., Bailey, N., Simpson, L. & Maclennan, D. (eds.) Understanding neighbourhood dynamics: New insights for neighbourhood effects research. Springer, Dordrecht.
Milanovic, B. (2005) Can we discern the effect of globalization on income distribution? Evidence from household surveys. The World Bank Economic Review, 19. 1, 21-44.
Musterd, S. (2005) Social and ethnic segregation in Europe: Levels, causes, and effects. Journal of urban affairs, 27. 3, 331-348.
Musterd, S. and W. Ostendorf (1998) Urban segregation and the welfare state. Inequality and exclusion in Western cities. Routledge, London.
Musterd, S. and W. Ostendorf (2005) Social exclusion, segregation, and neighbourhood effects. In Kazepov, Y. (ed.) Cities of Europe: Changing contexts, local arrangements and the challenge to urban cohesion. Blackwell, Oxford.
MVROM (1997) Nota Stedelijke Vernieuwing [Policy Memorandum Urban Renewal], Ministry of Housing, Planning and Environment, The Hague.
Paas, T. and F. Schlitte (2006) Regional income inequality and convergence processes in the
EU-25. HWWA Discussion Paper No. 335. Hamburg Institute of International Economics, Hamburg.
Permentier, M., G. Bolt and M. Van Ham (2011) Determinants of neighbourhood satisfaction and perception of neighbourhood reputation. Urban Studies, 48. 5, 977-996.
Permentier, M., J. Kullberg and L. Van Noije (2013) Werk aan de wijk. Een quasi-experimentele evaluatie van het krachtwijkenbeleid. [Working on the neighbourhood. A quasi-experimental evaluation of the urban renewal policy]. The Netherlands Institute for Social Research, the Hague.
Posthumus, H., G. Bolt and R. Van Kempen (2013) Why do displaced residents move to socioeconomically disadvantaged neighbourhoods? Housing Studies, 28. 2, 272-293.
Prak, N. L. and H. Priemus (1986) A model for the analysis of the decline of postwar housing. International Journal of Urban and Regional Research, 10. 1, 1-7.
Rabe, B. and M. Taylor (2010) Residential mobility, quality of neighbourhood and life course events. Journal of the Royal Statistical Society: Series A (Statistics in Society), 173. 3, 531-555.
Sassen, S. (1991) The global city, Princeton University Press, Princeton, NJ. Sassen, S. (2001) The global city: New York, London, Tokyo, Princeton University Press,
Princeton, NJ. Semyonov, M. and V. Kraus (1982) The social hierarchies of communities and
neighborhoods. Social Science Quarterly, 63. 4, 780-789. Studer, M. (2013) Weigthed cluster library manual: A practical guide to create typologies of
trajectories in the social sciences with R. LIVES Working Papers, 24, NCCR Lives, Lausanne.
Studer, M. and R. Bürgin (2012) Beyond the search of ideal typical sequences: Analyzing, interpreting and visualizing relationships between sequences and explanatory variables using discrepancy analysis. Conference Paper, Lausanne Conference on Sequence Analysis.
Studer, M., G. Ritschard, A. Gabadinho and N. S. Muller (2010) Discrepancy analysis of complex objects using dissimilarities. In Guillet, F., Ritschard, G., Zighed, D.A., Briand, H. (ed.) Advances in knowledge discovery and management. Springer, Berlin.
Studer, M., G. Ritschard, A. Gabadinho and N. S. Muller (2011) Discrepancy analysis of state sequences. Sociological Methods & Research, 40. 3, 471-510.
Tilly, C. (1998) Durable inequality, University of California Press, Berkeley, CA.

18
Tunstall, R. (2003) ‘Mixed tenure’policy in the UK: Privatisation, pluralism or euphemism? Housing, Theory and Society, 20. 3, 153-159.
Tunstall, R. (forthcoming) Are neighbourhoods dynamic or are they slothful? The limited prevalence and extent of change in neighbourhood socio-economic status, and its implications for regeneration policy. Urban Geography.
Uitermark, J. (2003) 'Social mixing'and the management of disadvantaged neighbourhoods: The Dutch policy of urban restructuring revisited. Urban Studies, 40. 3, 531-549.
Van Beckhoven, E., G. Bolt and R. Van Kempen (2009) Theories of neighbourhood change and neighbourhood decline: Their signficance for post-wwii large housing estates. In R. Rowlands, S. Musterd., R. Van Kempen (ed.) Mass housing in Europe: Multiple faces of development, change and response. Palgrave MacMillan, Basingstoke, UK.
Van Eijk, G. (2010) Unequal networks: Spatial segregation, relationships and inequality in the city, IOS Press, Delft.
Van Ham, M., L. Hedman, D. Manley, R. Coulter and J. Östh (2014) Intergenerational transmission of neighbourhood poverty: An analysis of neighbourhood histories of individuals. Transactions of the Institute of British Geographers, 39. 3, 402-417.
Van Ham, M. and D. Manley (2012) Neighbourhood effects research at a crossroads. Ten challenges for future research. Environment and Planning A, 44. 2787-2793.
Van Ham, M., D. Manley, N. Bailey, L. Simpson and D. Maclennan (2013) Understanding neighborhood dynamics: New insights for neighbourhood effects research. In M. Van Ham, D. M., N. Bailey, L. Simpson, & D. Maclennan (ed.) Understanding neighbourhood dynamics: New insights for neighbourhood effects research. Springer, Dordrecht.
Van Kempen, R. (2005) Segregation and housing conditions of immigrants in Western European cities. In Kazepov, Y. (ed.) Cities of Europe, changing contexts, local arrangements, and the challenge to urban cohesion. Blackwell, Oxford.
Van Kempen, R. and G. Bolt (2009) Social cohesion, social mix, and urban policies in the Netherlands. Journal of Housing and the Built Environment, 24. 4, 457-475.
Van Kempen, R. and A. Murie (2009) The new divided city: Changing patterns in European cities. Tijdschrift voor economische en sociale geografie, 100. 4, 377-398.
Veenhoven, R. (2007) Subjective measures of well-being. In McGillivray, M. (ed.) Human well-being – concept and measurement. Palgrave McMillian, Houndmills, New Hampshire, USA.
Wacquant, L. (2008) Urban outcasts: A comparative sociology of advanced marginality, Polity Press, Cambridge, UK.
Wilson, W. J. (1987) The truly disadvantaged: The inner city, the underclass, and public policy. University of Chicago, Chicago.
Zwiers, M. D., G. Bolt, M. Van Ham and R. Van Kempen (2014) Neighborhood decline and the economic crisis. IZA Discussion Paper 8749. Institute for the Study of Labor,Bonn.
Zwiers, M. D. and F. Koster (2015) The local structure of the welfare state: Uneven effects of social spending on poverty within countries. Urban Studies, 52. 1, 87-102.

19
Table 1. Summary of the dataset
Variable Min Max Mean S.D.
Ranking 1971 1 10 5.451 2.858
Ranking 2010 1 10 5.550 2.846
Social status 1998 1 10 5.501 2.873
Social status 2002 1 10 5.501 2.873
Social status 2006 1 10 5.501 2.873
Social status 2010 1 10 5.501 2.873
Thirty largest cities 0 1 .207 (21%) .405
Average WOZ municipality (1998)
x 1000
42,000 190,000 80,983 19,666
Percentage post-war dwellings
(1998)
0 84.5 29.637 15.844
Change in percentage social rented
dwellings (1998-2010)
-47.7 27.7 -2.703 6.017
Change in percentage owner-
occupied dwellings (1998)
-21 53.8 6.133 5.574
Change in percentage non-western
minorities (1998)
-76.5 69.8 5.469 11.264

20
Table 2. Ten most frequent neighborhood sequences 1998-2010
Note: 1st =1stdecile (top ten percent), 10th = 10thdecile (bottom ten percent).
Sequence 1998-2002-2006-2010 Frequency Share (%)
10th-10th-10th-10th 149 4.38%
1st-1st-1st-1st 115 3.38%
9th-10th-10th-10th 35 1.03%
1st-1st-2nd-1st 30 0.88%
10th-10th-10th-9th 29 0.85%
9th-9th-9th-9th 23 0.68%
1st-1st-1st-2nd 21 0.62%
10th-10th-9th-10th 19 0.56%
8th-9th-9th-9th 19 0.56%
2nd-1st-1st-1st 17 0.50%

21
Figure 1a

22
Figure 1b
23
Figure 2a

24
Figure 2b

25
Figure 3a

26
Figure 3b

27
Figure 4a

28
Figure 4b

29
Figure 5 Tree-structured discrepancy analysis of neighbourhood trajectories