diversity of amyloid-beta proteoforms in the alzheimer's ...10.1038/s41598-017... · 1...
TRANSCRIPT
1
Diversity of Amyloid-beta Proteoforms in the Alzheimer's Disease Brain
Norelle C. Wildburger, Thomas J. Esparza, Richard D. LeDuc, Ryan T. Fellers, Paul M. Thomas,
Nigel J. Cairns, Neil L. Kelleher, Randall J. Bateman, David L. Brody
SUPPLEMENTARY INFORMATION:
SUPPLEMENTARY FIGURES
Supplementary Fig. 1: Separation of Aβ from other co-immunoprecipitated proteins
Supplementary Fig. 2: Protease inhibitor comparison
Supplementary Fig. 3: System performance over time during mass spectrometry data
acquisition
Supplementary Fig. 4: Schematic of data analysis
Supplementary Fig. 5: Additional mass spectrometry data for Aβp11-42 and Aβ4-42 detected
in human AD brain
Supplementary Fig. 6: Tandem mass spectrometry data for proteoform Aβ1-34
Supplementary Fig. 7: Tandem mass spectrometry data for proteoform Aβ1-20
Supplementary Fig. 8: Tandem mass spectrometry data for proteoform Aβ11-34
Supplementary Fig. 9: Soluble aggregate Aβ and more insoluble Aβ proteoform correlations
with post-mortem interval
SUPPLEMENTARY TABLES
Supplementary Table 1: Representative biochemical purifications of soluble high molecular
weight Aβ aggregates by immunoprecipitation
Supplementary Table 2: Aβ C8 solid phase extraction separation characteristics
SUPPLEMENTARY DISCUSSION
Summary
Relationship to previous studies
Advantages of our approach
Limitations
Priorities for future research
Implications
SUPPLEMENTARY REFERENCES
2
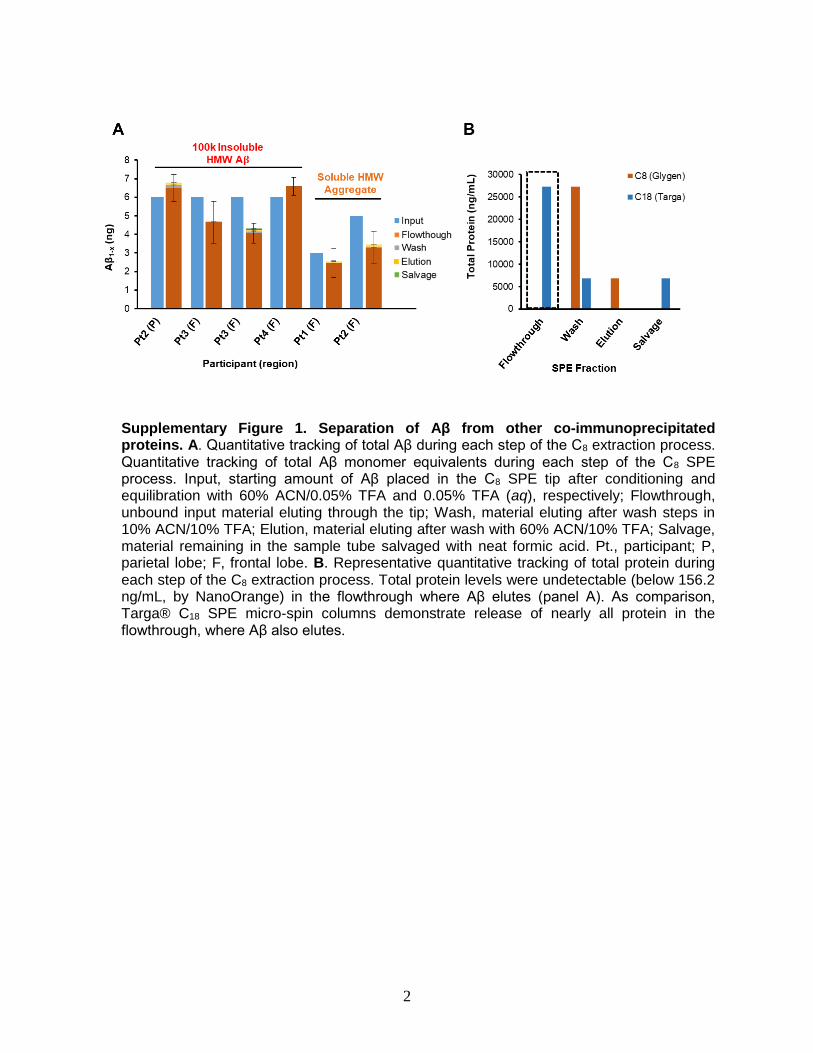
Supplementary Figure 1. Separation of Aβ from other co-immunoprecipitated proteins. A. Quantitative tracking of total Aβ during each step of the C8 extraction process. Quantitative tracking of total Aβ monomer equivalents during each step of the C8 SPE process. Input, starting amount of Aβ placed in the C8 SPE tip after conditioning and equilibration with 60% ACN/0.05% TFA and 0.05% TFA (aq), respectively; Flowthrough, unbound input material eluting through the tip; Wash, material eluting after wash steps in 10% ACN/10% TFA; Elution, material eluting after wash with 60% ACN/10% TFA; Salvage, material remaining in the sample tube salvaged with neat formic acid. Pt., participant; P, parietal lobe; F, frontal lobe. B. Representative quantitative tracking of total protein during each step of the C8 extraction process. Total protein levels were undetectable (below 156.2 ng/mL, by NanoOrange) in the flowthrough where Aβ elutes (panel A). As comparison, Targa® C18 SPE micro-spin columns demonstrate release of nearly all protein in the flowthrough, where Aβ also elutes.

3
Supplementary Figure 2. Protease inhibitor comparison. A. Logarithmic MS1 intensity of truncated Aβ proteoforms in the more insoluble fraction (100K) from a representative participant sample. B. Logarithmic MS1 intensity of truncated Aβ proteoforms in the soluble fraction (475K) from a representative participant sample. Standard buffer conditions with two protease inhibitors (aprotinin and leupeptin, see Methods and Materials) versus homogenization buffer with 1X protease and phosphatase inhibitor cocktail. Data is represented as mean ± S.D. of duplicated injections. ** q < 0.01 (q-values (q is a false discovery rate corrected p-value, where q ≤ 0.05 is considered statistically significant).
** **
B
A

4
Supplementary Figure 3. System performance over time during mass spectrometry data acquisition. A. Peak area measurements (from full scan MS; log scale) of 29 bovine serum albumin (BSA) peptides injected throughout the CDR3 cohort data acquisition at 20 fmole for quality assurance/quality control (QA/QC) metrics over the four-day course of the CDR3 cohort data-dependent acquisition (DDA) experiment. B. Peak full width half maximum (FWHM) measurements of 29 BSA peptides. C. Retention time (minutes) metric of 29 BSA peptides. Retention time drifts were no more than ±1 min with the exception of peptide LSQKFPK (from 18.5 min to 16.1-16.7 min) in the first run, likely due to column equilibration at the beginning. D. Mass accuracy in parts-per-million (ppm) of 29 BSA peptides over the four-day course of the CDR3 cohort DDA experiment. Mass accuracy did not demonstrate a substantial drift (e.g., ±15 ppm). These system suitability metrics for DDA (i.e., untargeted) proteomic experiments are extracted from the data directly and do not require database searches (i.e., identification-free metrics). These metrics allow determination of sub-optimal instrument performance which, in a untargeted proteomics experiments, can waste biological samples and lead to incorrect conclusions. Overall these metrics are stable throughout the experiment.

5
Supplementary Figure 4. Schematic of data analysis. After top-down nLC-MS/MS data acquisition, Thermo .raw files were imported into PEAKS8 where the spectra underwent (1) charge state deconvolution and (2) mass detection. (3) Refined m/z data was searched in PEAKS8 successively by de novo sequencing, human canonical proteome database (DB), PEAKS PTM using all PTMs contained in the UniMod database, and finally SPIDER to match unidentified spectra by altering the amino acids systematically at each residue until a new, better peptide sequence was constructed from the MS/MS data. This resulted in 27 identified Aβ proteoform (4), which were coded by a 3rd party (5) and searched independently in the NRTDP platform (6). One Aβ proteoforms identified in PEAKS failed to be recapitulated with NRTDP (7). Mass spectrometry data for each of the 26 proteoforms was extracted with Skyline across all charge states for each proteoform (8). Data was standardized and analyzed in SAS (9).

6
Supplementary Figure 5. Additional mass spectrometry data for Aβp11-42 and Aβ4-42 detected in human AD brain. A. The b-ion and y-ion table for Aβp11-42. Blue text indicates detected b-ions, red text indicated detected y-ions. Bottom graph indicates mass error relative to expected mass as a function of expected mass. B. The b-ion and y-ion table for Aβ4-42. Bottom graph indicates mass error relative to expected mass as a function of expected mass.

7

8
Supplementary Figure 6. Tandem mass spectrometry data for proteoform Aβ1-34. A. Annotated sequence Aβ1-34 showing sites of fragment ion cleavage (vertical lines), b ions (underlines), and y ions (overlines). B. Complete list of theoretical fragment ions for this proteoform, with observed b ions indicated in blue and observed y ions indicated in red. C. Error map of observed predicted mass/charge (m/z) ratio exported from PEAKS8. Blue indicates b ions, and red indicates y ions. D. Precursor ion isotopic envelope for this proteoform (-10logP: 61.66; RT: 51.60; Scan#7471; File: Pt6_F_SolAgg_tech-rep2). The monoisotopic peak (M
i) is delineated in the isotopic envelope with dashed red line, while the
peak the MS/MS triggered on is demarked with the dashed blue line. The observed m/z was 757.9772 (theoretical m/z = 757.9792), which was -2.6 parts per million (ppm) error from the theoretical mass of Aβ1-34.

9
10
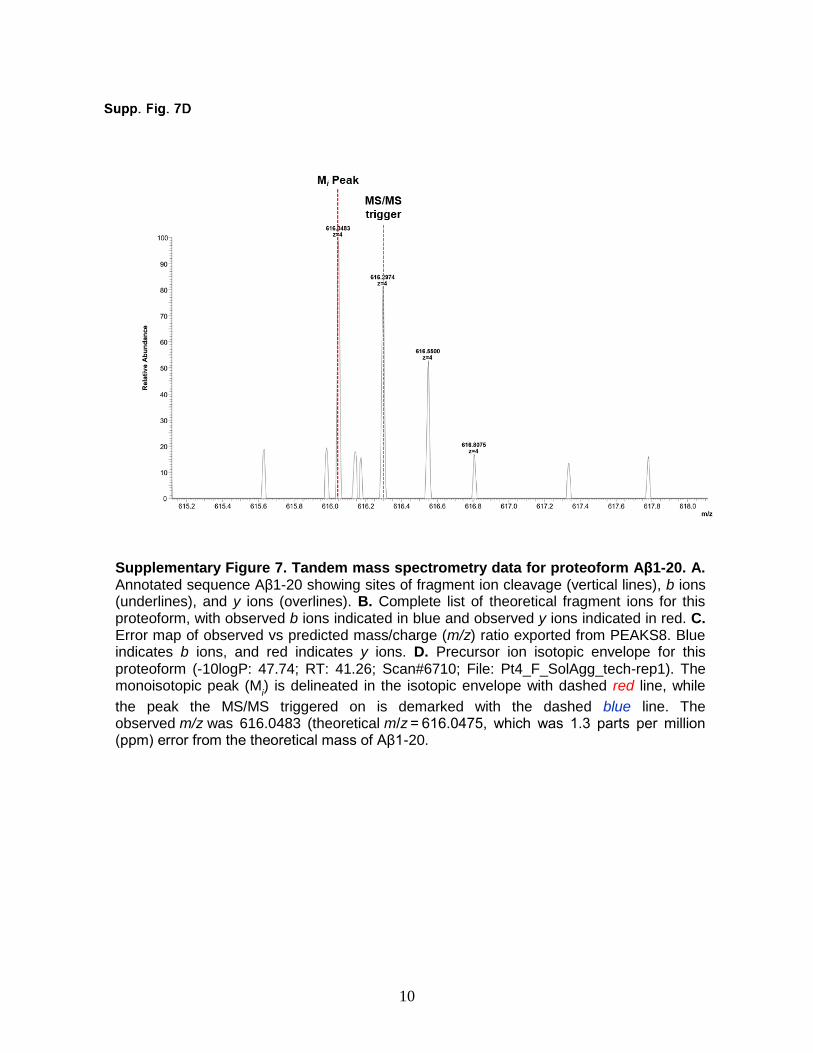
Supplementary Figure 7. Tandem mass spectrometry data for proteoform Aβ1-20. A. Annotated sequence Aβ1-20 showing sites of fragment ion cleavage (vertical lines), b ions (underlines), and y ions (overlines). B. Complete list of theoretical fragment ions for this proteoform, with observed b ions indicated in blue and observed y ions indicated in red. C. Error map of observed vs predicted mass/charge (m/z) ratio exported from PEAKS8. Blue indicates b ions, and red indicates y ions. D. Precursor ion isotopic envelope for this proteoform (-10logP: 47.74; RT: 41.26; Scan#6710; File: Pt4_F_SolAgg_tech-rep1). The monoisotopic peak (M
i) is delineated in the isotopic envelope with dashed red line, while
the peak the MS/MS triggered on is demarked with the dashed blue line. The observed m/z was 616.0483 (theoretical m/z = 616.0475, which was 1.3 parts per million (ppm) error from the theoretical mass of Aβ1-20.

11

12
Supplementary Figure 8. Tandem mass spectrometry data for proteoform Aβ11-34. A. Annotated sequence Aβ11-34 showing sites of fragment ion cleavage (vertical lines), b ions (underlines), and y ions (overlines). B. Complete list of theoretical fragment ions for this proteoform, with observed b ions indicated in blue and observed y ions indicated in red. C. Error map of observed vs predicted mass/charge (m/z) ratio exported from PEAKS8. Blue indicates b ions, and red indicates y ions. D. Precursor ion isotopic envelope for this proteoform (-10logP: 59.56; RT: 52.52; Scan#8127; File: Pt5_F_SolAgg_tech-rep1). The monoisotopic peak (M
i) is delineated in the isotopic envelope with dashed red line, while the
peak the MS/MS triggered on is demarked with the dashed blue line. The observed m/z was 652.8522 (theoretical m/z = 652.8525, which was -0.46 parts per million (ppm) error from the theoretical mass of Aβ11-34.
13

14
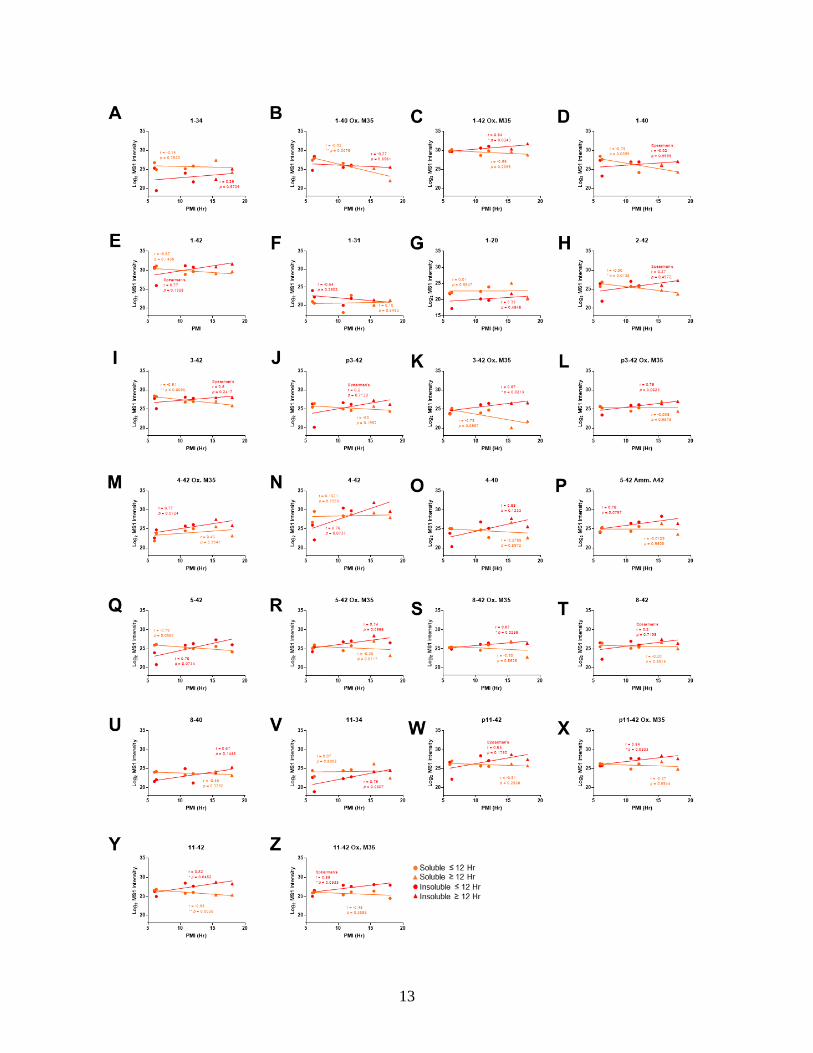
Supplementary Figure 9: Soluble and more insoluble Aβ proteoform correlations with post-mortem interval. A. No significant correlation of soluble or more insoluble Aβ1-34 with PMI. B. High negative correlation of oxidized Aβ1-40 in the soluble fraction only with PMI. C. High positive correlation of oxidized Aβ1-42 in the more insoluble fraction only with PMI. D-G. No correlation ofAβ1-40, Aβ1-42, Aβ1-31, and Aβ1-20 in either the soluble or more insoluble fractions with PMI. H. High negative correlation of Aβ2-42 in the soluble fraction only with PMI. I. High negative correlation of Aβ3-42 in the soluble fraction only with PMI. J. No correlation with Aβp3-42 and PMI. K. High positive correlation of oxidized Aβ3-42 in the insoluble fraction only with PMI. L-R. No correlation of oxidized Aβp3-42, oxidized Aβ4-42, Aβ4-42, Aβ4-40, ammonium ion Aβ5-42, Aβ5-42, and oxidized Aβ5-42, in either the soluble or more insoluble fractions, with PMI. S. High positive correlation of oxidized Aβ8-42 in the more insoluble fraction only with PMI. T-W. No correlation of Aβ8-42, Aβ8-40, Aβ4-42, Aβ11-34, and Aβp11-42 in either the soluble or more insoluble fractions with PMI. X. High positive correlation of oxidized Aβp11-42 in the more insoluble fraction with PMI. Y. High positive correlation of Aβ11-42 in the more insoluble fraction and high negative correlation of Aβ11-42 in the soluble fraction with PMI. Z. High positive correlation of oxidized Aβ11-42 in the more insoluble fraction with PMI. All analyses were done using Pearsons’s correlation coefficient unless otherwise stated. * p ≤ 0.05; p ** ≤ 0.01.

15

16
SUPPLEMENTARY DISCUSSION
Summary
In summary, we have developed a method for further enrichment of Aβ from the other,
as-yet-uncharacterized protein components of the soluble Aβ aggregates and a top-down
(undigested) nLC-MS/MS method for the mass spectrometric characterization of Aβ proteoforms
(Fig. 1, Supp. Fig. 1-3, Supp. Table 1-2). Applying this combined approach to soluble
aggregates and insoluble material in brains of 6 cases with severe dementia and pathologically
confirmed AD, we found diversity of Aβ peptides – 26 unique proteoforms total.
There are many unanswered questions arising from the data presented:
1. How do the observed truncations and PTMs affect AD pathology? The age of
presentation of clinical dementia, rate of cognitive decline, and plaque
growth/deposition?
2. If a large portion of Aβ peptide in both soluble and insoluble aggregates is modified (e.g.,
truncated), how does this affect the binding and thus accuracy of PET-PIB and other
amyloid-binding agents for imaging studies?
3. If Aβ is ~0.1% of total soluble aggregates based on Aβ1-x ELISA, what is the
composition of the ~99.9% as-yet-uncharacterized protein components of the soluble
aggregates?
4. How do the truncations and PTMs affect Aβ properties such as solubility, aggregation
propensity, toxicity, interaction with ‘binding partners’ (e.g., prion protein) 1, or
recognition by the brain’s immune response system, microglia?
5. Would we expect the same level of heterogeneity in the familial early-onset cases of AD?
6. What is the proteoform diversity in Aβ monomers and plaques, and which proteoforms
are predominant in each fraction?
7. Is there any correlation between Apolipoprotein E genotypes and particular Aβ
proteoforms?
8. Would any of these proteoforms be candidate pharmacodynamic markers for AD
treatments?
We are in the early stages of characterizing Aβ proteoforms present in the soluble Aβ aggregates
across the spectrum of AD progression using our top-down nLC-MS/MS approach followed by
absolute quantitation of proteoforms that segregate AD from cognitively intact high pathology
individuals. A full characterization of the Aβ proteoforms in a cross-sectional study of patient
cohorts is beyond the scope of this communication.
Relationship to Previous Studies
PTMs are chemical modifications to proteins2. PTMs can result in changes in the
physicochemical and biochemical properties of proteins, increasing the range of functional
outcomes and providing an additional level of regulatory control 3,4. The site localization,
chemical nature of the PTM, and the microheterogeneity serve to precisely fine-tune the
“information carrying capacity” of proteins within cellular networks 2,5. One of the first
described Aβ PTMs was pyro-glutamate at the third and eleventh amino acid residues of Aβ in
17
human AD brain6. However, analysis of Aβ proteoforms has been largely restricted to
examination of plaques 6-10 or more recently CSF 11-13. These studies, particularly plaque-based
studies, came to varying conclusions as to which Aβ proteoform was most abundant. This lack of
consensus is likely due to variations in methodology used to isolate Aβ and tools to identify the
sequence structure. However, few studies have examined the PTMs present on soluble Aβ
aggregates from either human or transgenic animal models. PTMs on soluble Aβ examined to-
date include glutamine deamidation14 and di-tyrosine crosslinking of synthetic Aβ15,
recombinantly expressed Aβ from CHO cells16, and N-terminal extension17 and O-linked
glycosylation of CSF Aβ18. One study identified phosphorylation of serine 8 in transgenic mice
and human AD tissue19. We found 26 unique Aβ proteoforms (Fig. 2) in severe AD brain. Of the
26 proteoforms identified none were phosphorylated19, glycosylated18, nitrated20, or di-tyrosine
linked20. Nor did we identify N-terminal extension, but rather extensive N- and C-terminal
truncations. These negative results should be interpreted with caution, as we have not determined
whether the methods we have used would have been sufficient for detection of these other PTMs
or extended peptides. However, the clear trend of N-terminally truncated Aβ proteoforms having
greater abundances in the more insoluble fraction relative to the soluble aggregates is in line with
early work demonstrating that these types of peptides displayed enhanced aggregation via
sedimentation analyses21.
Advantages of our approach
The advantages of our approach include: i) the application of top-down (i.e., intact,
undigested) mass spectrometry to Aβ allows the unambiguous identification of the peptide and
all its combinatorial truncations and PTMs. ii) The high resolution and high mass accuracy of the
intact Aβ peptide and its fragment ions via tandem mass spectrometry (MS/MS) provide precise
peptide sequencing information. iii) The discovery of both known and novel variations at
proteome level. Other techniques like matrix-assisted laser desorption/ionization (MALDI) do
not offer the same level of resolution and mass accuracy. In this study, it was the resolution and
mass accuracy of the parent and fragment ions that allowed the unambiguous identification of
peptide sequences and PTMs. Importantly, we employed MS/MS to fragment the peptides,
producing fragment ions, for direct de novo sequencing, a technique not often applied in
MALDI-based studies 11. Finally, chromatographic separation of proteoforms before mass
spectrometry analysis offers better sample separation, reducing sample complexity and
improving resolution.
Limitations
While our approach offers numerous advantages, it is not without its limitations. There
are numerous reports that detail types of proteoforms identified either by mass spectrometry or
biochemistry20 offering some insight as to what Aβ proteoforms we might expect to find in
human AD brain. However, an extraction of soluble HMW Aβ aggregates as detailed in our
previous work22, followed by high-resolution mass spectrometry has never been performed
before; thus, in practice we had no a priori knowledge. In our approach, we used a mass
spectrometry data acquisition method commonly referred to as data-dependent acquisition
(DDA). In DDA, MS/MS scans of a given proteoform are acquired once the proteoform has
been detected in the preceding MS scan. A limitation to this approach is that MS/MS spectra
acquired are done so in a stochastically sampled manner. In other words, the most abundant
proteoforms are targeted for MS/MS before less abundant proteoforms. Further, since this in an

18
untargeted approach, due to the lack of a priori knowledge, not every MS/MS spectrum acquired
is guaranteed to provide all the fragment ions needed to unambiguously determine a given
sequence and/or PTM. An alternative approach in future studies would be data-independent
acquisition (DIA), which does not require a priori knowledge like DDA, but instead fragments
all precursors in a defined m/z window (MS/MS-based quantification23). The result is effectively
a lower limit of detection (more sensitivity) compared to DDA (MS-based quantification)23 due
to increased selectivity23,24. However, DIA has been generally used and optimized for “bottom-
up” (i.e., proteolytically digested) samples25 rather than “top-down” (undigested) samples.
Coupled to these limitations, we used differential mass spectrometry (dMS) for proteoform
quantitation in this study. Labels, both chemical and isotopic, commonly employed in bottom-up
experiments are not readily applicable to top-down proteomics for quantitation. It is often
difficult to chemically label intact proteins 26-28. Isotopic labeling through stable isotopes, for
example, is not guaranteed to incorporate into the entire protein and further can result in often
difficult to interpret data due to overlapping isotopic envelopes and fragment ions 27. Thus, we
used dMS, which is reported to detect as low as 2-fold changes in protein or peptide expression
between sample sets 29-31. Until the issue of labeling intact proteins are addressed in the field,
quantitation in top-down proteomics experiments will remain largely limited to dMS.
Ultimately, the question of whether the N- and C-terminal truncations and post-
translational modifications of Aβ reflect findings relevant to living AD patients vs. post-mortem
artefact remains unanswered despite our correlation analysis. Initial attempts to discern whether
C-terminal truncations were an artefact of sample preparation by using 18O water demonstrated
incorporation of one to two heavy oxygen isotopes into the C-terminus of canonical Aβ1-42
(data not shown). Brain biopsy in living humans undergoing a craniotomy to relieve normal
pressure hydrocephalus followed by immediate preparation by our protocol 22 would help
address this question. The fact that several truncated Aβ proteoforms were found in the CSF of
living human AD patients 12,13,17,32 reduces the likelihood that these specific proteoforms are the
result of post-mortem or sample preparation artefacts. Yet, whether the heterogeneity of the
proteoforms observed is a reflection of the ‘age’ of the peptide in brain – with more truncations
and PTMs reflecting a longer lived peptide subjected to more processing – or if Aβ is rapidly
processed after canonical beta- and gamma-secretase cleavage of amyloid precursor protein
remains unresolved 33,34. Future work utilizing either BACE1 inhibitors or general aspartic-
acid protease inhibitors in the homogenization buffer could be a step forward in resolving some
of aspects of this issue particularly with Aβp11-42 and Aβ11-42 (Supp. Fig. 2 and Supp. Fig.
9). Further, while we take great care to remove all leptomeningeal, and intraparenchymal vessels
to the fullest extent possible, it is impossible with our current method and that of others (to the
best of our knowledge) to fully exclude all blood vessels (including capillaries). Given this
limitation, we cannot exclude the possibility of contribution of Aβ proteoforms from vessel walls
in our data. Aβ proteoforms from vessel walls may represent a different pool of proteoforms in
AD brain.
Lastly, given the surprising level of heterogeneity observed in Aβ, it is now evident that
our Aβ1-x ELISA is underestimating the total amount of Aβ, since the assay uses HJ3.4 as the
detection antibody, which requires Aβ to have a free (unmodified) canonical Aβ N-terminus. As
a result, an assessment of any Aβ proteoforms lost more readily than others throughout the
purification process and C8 micro-column procedure is lacking. In the absence of such an assay,
future studies will employ an isotopic-labeled internal Aβ standard for data normalization.
19
Priorities for future research
1. Future studies will include a broader exploration of the spectrum of Aβ proteoforms
present in the AD brain across disease severity – mild cognitive impairment, mild
dementia, and severe dementia – compared to non-demented with high pathology
controls and older healthy controls. Certain Aβ proteoforms may play an important role
in the pathogenesis of AD. For example, if the predominant pathogenic Aβ proteoforms
were C-terminally truncated, monoclonal antibodies targeting C-terminal truncated neo-
epitopes of Aβ would have a higher chance of success in clinical trials compared to those
targeting the N-terminus. Many monoclonal antibodies currently in clinical trials target
the canonical N-terminus and have not shown success35, yet, likewise, mid-domain
monoclonal antibody Solanezumab has also recently shown disappointing results36.
However, we cannot exclude the possibility that timing, dosage, or combination of
therapeutics may still net an effect in reducing disease progression.
2. The characterization of Aβ proteoforms could lead to the targeted analysis of CSF or
plasma in non-demented patient cohorts to identify which proteoforms may be a
predictive marker for progression to clinical dementia.
3. Given the level of heterogeneity observed in Aβ, the development of an ELISA with
capture and detection antibodies in the mid-domain would provide more accurate
orthogonal measurements of total Aβ. However, the problems of cross reactivity with
other amyloid precursor protein fragments and mid-domain steric hindrance would need
to be addressed. If successful, this would likely improve consistency among reports of Aβ
measurements using ELISAs to make therapeutic, prognostic, or diagnostic assessments.
Implications
The present findings provide an initial profile of Aβ proteoforms derived from soluble
and more insoluble Aβ aggregates in human AD brain. Readily apparent from the data are the
diversity of Aβ in human tissue. These data clearly demonstrate our dearth of knowledge in Aβ
and the properties of these modified forms, which remain entirely unknown until further
investigation.
Overall, this work i) developed an operational template for advancing our understanding
of Aβ proteoform abundance and expression during disease progression, which will inform our
therapeutic efforts. ii) Will facilitate direct comparison of human Aβ proteoforms to those found
in transgenic animal models to determine which, if any, faithfully recapitulate those found in
human AD 37,38. Such an animal model would be the logical choice for novel AD therapeutic
development, though it is possible no existing model accurately mimics the human disease,
which would prompt the development of new model systems. iii) Enable direct comparison with
Aβ proteoforms in the CSF to provide diagnostic and prognostic markers to distinguish AD
patients from non-AD and monitor clinical trial treatment effects. Furthermore, the purification
scheme and the top-down platform developed here may be used as a framework for the
assessment of other human neurodegenerative diseases with hallmark proteinopathies, such as
alpha-synuclein, prion protein, and superoxide dismutase 1 and therefore potential relevant
therapeutic targets.

20
SUPPLEMENTARY REFERENCES
1 Laurén, J., Gimbel, D. A., Nygaard, H. B., Gilbert, J. W. & Strittmatter, S. M. Cellular
prion protein mediates impairment of synaptic plasticity by amyloid-beta oligomers. Nature 457,
1128-1132, doi:10.1038/nature07761 (2009).
2 Lichti, C. F. et al. in Genomics and Proteomics for Clinical Discovery and Development
Translational Bioinformatics 6 (ed G. Marko-Varga) Ch. 6, 101-136 (Springer Science+Business
Media Dordrecht, 2014).
3 James, T. F. et al. The Nav1.2 channel is regulated by GSK3. Biochim Biophys Acta
1850, 832-844, doi:10.1016/j.bbagen.2015.01.011 (2015).
4 Brooks, C. L. & Gu, W. Ubiquitination, phosphorylation and acetylation: the molecular
basis for p53 regulation. Curr Opin Cell Biol 15, 164-171 (2003).
5 Edwards, A. V., Edwards, G. J., Schwammle, V., Saxtorph, H. & Larsen, M. R. Spatial
and temporal effects in protein post-translational modification distributions in the developing
mouse brain. J Proteome Res 13, 260-267, doi:10.1021/pr4002977 (2014).
6 Mori, H., Takio, K., Ogawara, M. & Selkoe, D. J. Mass spectrometry of purified amyloid
beta protein in Alzheimer's disease. J Biol Chem 267, 17082-17086 (1992).
7 Saido, T. C. et al. Dominant and differential deposition of distinct beta-amyloid peptide
species, A beta N3(pE), in senile plaques. Neuron 14, 457-466 (1995).
8 Kuo, Y. M., Emmerling, M. R., Woods, A. S., Cotter, R. J. & Roher, A. E. Isolation,
chemical characterization, and quantitation of A beta 3-pyroglutamyl peptide from neuritic
plaques and vascular amyloid deposits. Biochem Biophys Res Commun 237, 188-191,
doi:10.1006/bbrc.1997.7083 (1997).
9 Roher, A. E., Palmer, K. C., Yurewicz, E. C., Ball, M. J. & Greenberg, B. D.
Morphological and biochemical analyses of amyloid plaque core proteins purified from
Alzheimer disease brain tissue. J Neurochem 61, 1916-1926 (1993).
10 Roher, A. E. et al. Structural alterations in the peptide backbone of beta-amyloid core
protein may account for its deposition and stability in Alzheimer's disease. J Biol Chem 268,
3072-3083 (1993).
11 Portelius, E., Westman-Brinkmalm, A., Zetterberg, H. & Blennow, K. Determination of
beta-amyloid peptide signatures in cerebrospinal fluid using immunoprecipitation-mass
spectrometry. J Proteome Res 5, 1010-1016, doi:10.1021/pr050475v (2006).
12 Portelius, E. et al. Characterization of amyloid beta peptides in cerebrospinal fluid by an
automated immunoprecipitation procedure followed by mass spectrometry. J Proteome Res 6,
4433-4439, doi:10.1021/pr0703627 (2007).
13 Portelius, E. et al. Identification of novel APP/Abeta isoforms in human cerebrospinal
fluid. Neurodegener Dis 6, 87-94, doi:10.1159/000203774 (2009).
14 Schmid, A. W. et al. Tissue transglutaminase-mediated glutamine deamidation of beta-
amyloid peptide increases peptide solubility, whereas enzymatic cross-linking and peptide
fragmentation may serve as molecular triggers for rapid peptide aggregation. J Biol Chem 286,
12172-12188, doi:10.1074/jbc.M110.176149 (2011).
15 Galeazzi, L., Ronchi, P., Franceschi, C. & Giunta, S. In vitro peroxidase oxidation
induces stable dimers of beta-amyloid (1-42) through dityrosine bridge formation. Amyloid 6, 7-
13 (1999).
21
16 Tay, W. M. et al. A mass spectrometric approach for characterization of amyloid-β
aggregates and identification of their post-translational modifications. Biochemistry 51, 3759-
3766, doi:10.1021/bi300316d (2012).
17 Brinkmalm, G. et al. An online nano-LC-ESI-FTICR-MS method for comprehensive
characterization of endogenous fragments from amyloid-β and amyloid precursor
protein in human and cat cerebrospinal fluid. J Mass Spectrom 47, 591-603,
doi:10.1002/jms.2987 (2012).
18 Halim, A. et al. Site-specific characterization of threonine, serine, and tyrosine
glycosylations of amyloid precursor protein/amyloid beta-peptides in human cerebrospinal fluid.
Proc Natl Acad Sci U S A 108, 11848-11853, doi:10.1073/pnas.1102664108 (2011).
19 Kumar, S. et al. Extracellular phosphorylation of the amyloid β-peptide promotes
formation of toxic aggregates during the pathogenesis of Alzheimer's disease. EMBO J 30, 2255-
2265, doi:10.1038/emboj.2011.138 (2011).
20 Kummer, M. P. & Heneka, M. T. Truncated and modified amyloid-beta species.
Alzheimers Res Ther 6, 28, doi:10.1186/alzrt258 (2014).
21 Pike, C. J., Overman, M. J. & Cotman, C. W. Amino-terminal deletions enhance
aggregation of beta-amyloid peptides in vitro. J Biol Chem 270, 23895-23898 (1995).
22 Esparza, T. J. et al. Purification and Quantitative Characterization of Soluble HMW
Amyloid-beta from Alzheimer's disease Brain Lysates. Manuscript in Preparation Scientific
Reports 6, 38187, doi:10.1038/srep38187 (2016).
23 Egertson, J. D. et al. Multiplexed MS/MS for improved data-independent acquisition. Nat
Methods 10, 744-746, doi:10.1038/nmeth.2528 (2013).
24 Gillet, L. C. et al. Targeted data extraction of the MS/MS spectra generated by data-
independent acquisition: a new concept for consistent and accurate proteome analysis. Mol Cell
Proteomics 11, O111 016717, doi:10.1074/mcp.O111.016717 (2012).
25 Egertson, J. D., MacLean, B., Johnson, R., Xuan, Y. & MacCoss, M. J. Multiplexed
peptide analysis using data-independent acquisition and Skyline. Nat Protoc 10, 887-903,
doi:10.1038/nprot.2015.055 (2015).
26 Toby, T. K., Fornelli, L. & Kelleher, N. L. Progress in Top-Down Proteomics and the
Analysis of Proteoforms. Annu Rev Anal Chem (Palo Alto Calif) 9, 499-519,
doi:10.1146/annurev-anchem-071015-041550 (2016).
27 Waanders, L. F., Hanke, S. & Mann, M. Top-down quantitation and characterization of
SILAC-labeled proteins. J Am Soc Mass Spectrom 18, 2058-2064,
doi:10.1016/j.jasms.2007.09.001 (2007).
28 Cui, W., Rohrs, H. W. & Gross, M. L. Top-down mass spectrometry: recent
developments, applications and perspectives. Analyst 136, 3854-3864, doi:10.1039/c1an15286f
(2011).
29 Wiener, M. C., Sachs, J. R., Deyanova, E. G. & Yates, N. A. Differential mass
spectrometry: a label-free LC-MS method for finding significant differences in complex peptide
and protein mixtures. Anal Chem 76, 6085-6096, doi:10.1021/ac0493875 (2004).
30 Mazur, M. T. et al. Quantitative analysis of intact apolipoproteins in human HDL by top-
down differential mass spectrometry. Proc Natl Acad Sci U S A 107, 7728-7733,
doi:10.1073/pnas.0910776107 (2010).
31 Ntai, I. et al. Applying label-free quantitation to top down proteomics. Anal Chem 86,
4961-4968, doi:10.1021/ac500395k (2014).

22
32 Halim, A. et al. Site-specific characterization of threonine, serine, and tyrosine
glycosylations of amyloid precursor protein/amyloid beta-peptides in human cerebrospinal fluid.
Proc Natl Acad Sci U S A 108, 11848-11853, doi:10.1073/pnas.1102664108 (2011).
33 Kim, I., Saito, T., Fujii, N. & Kanamoto, T. One-shot LC-MS/MS analysis of post-
translational modifications including oxidation and deamidation of rat lens α-and
β-crystallins induced by γ-irradiation. Amino Acids,
doi:10.1007/s00726-016-2324-y (2016).
34 Sharma, K. K. & Santhoshkumar, P. Lens aging: effects of crystallins. Biochim Biophys
Acta 1790, 1095-1108, doi:10.1016/j.bbagen.2009.05.008 (2009).
35 Vandenberghe, R. et al. Bapineuzumab for mild to moderate Alzheimer's disease in two
global, randomized, phase 3 trials. Alzheimers Res Ther 8, 18, doi:10.1186/s13195-016-0189-7
(2016).
36 Doody, R. S. et al. Phase 3 trials of solanezumab for mild-to-moderate Alzheimer's
disease. N Engl J Med 370, 311-321, doi:10.1056/NEJMoa1312889 (2014).
37 Schieb, H. et al. Beta-amyloid peptide variants in brains and cerebrospinal fluid from
amyloid precursor protein (APP) transgenic mice: comparison with human Alzheimer amyloid. J
Biol Chem 286, 33747-33758, doi:10.1074/jbc.M111.246561 (2011).
38 Kuo, Y. M. et al. Comparative analysis of amyloid-beta chemical structure and amyloid
plaque morphology of transgenic mouse and Alzheimer's disease brains. J Biol Chem 276,
12991-12998, doi:10.1074/jbc.M007859200 (2001).