diversity and abundance of benthic macroinvertebrates in
TRANSCRIPT
DIVERSITY AND ABUNDANCE OF BENTHIC MACROINVERTEBRATES IN TECOCOMULCO LAKE, A
WETLAND IN HIDALGO, MEXICO A. E. Rico Sánchez1, A. J. Rodríguez Romero1, E. López López1 and J. E. Sedeño Díaz2
1Laboratorio de Ictiología y Limnología, Escuela Nacional de Ciencias Biológicas del IPN, Distrito Federal MX, México. 2 Programa Ambiental del IPN.- Edificio Adolfo Ruiz Cortines, Unidad Profesional Adolfo López Mateos. Distrito Federal, MX, México.
Introduction
The benthic macroinvertebrates are used as indicators of quality water and environmental
assessment (Giacometti & Berbosa, 2006), these parameters can be inferred by invertebrate
community structure. Biotic interactions in a lake are frequently narrow, and some environmental
properties as conductivity and salinity gradient determine the macroinvertebrates distribution
among wetlands (Scheibler & Ciocco, 2010). Vegetation presence is an important factor that in-
crease the diversity and abundance of macroinvertebrates since plants constitute refuges for
macroinvertebrates and fish larvae (Schultz & Dibble, 2011). The aim of this study was to assess
the diversity and abundance of macroinvertebrates in the Tecocomulco lake
Materials and methods
Study area
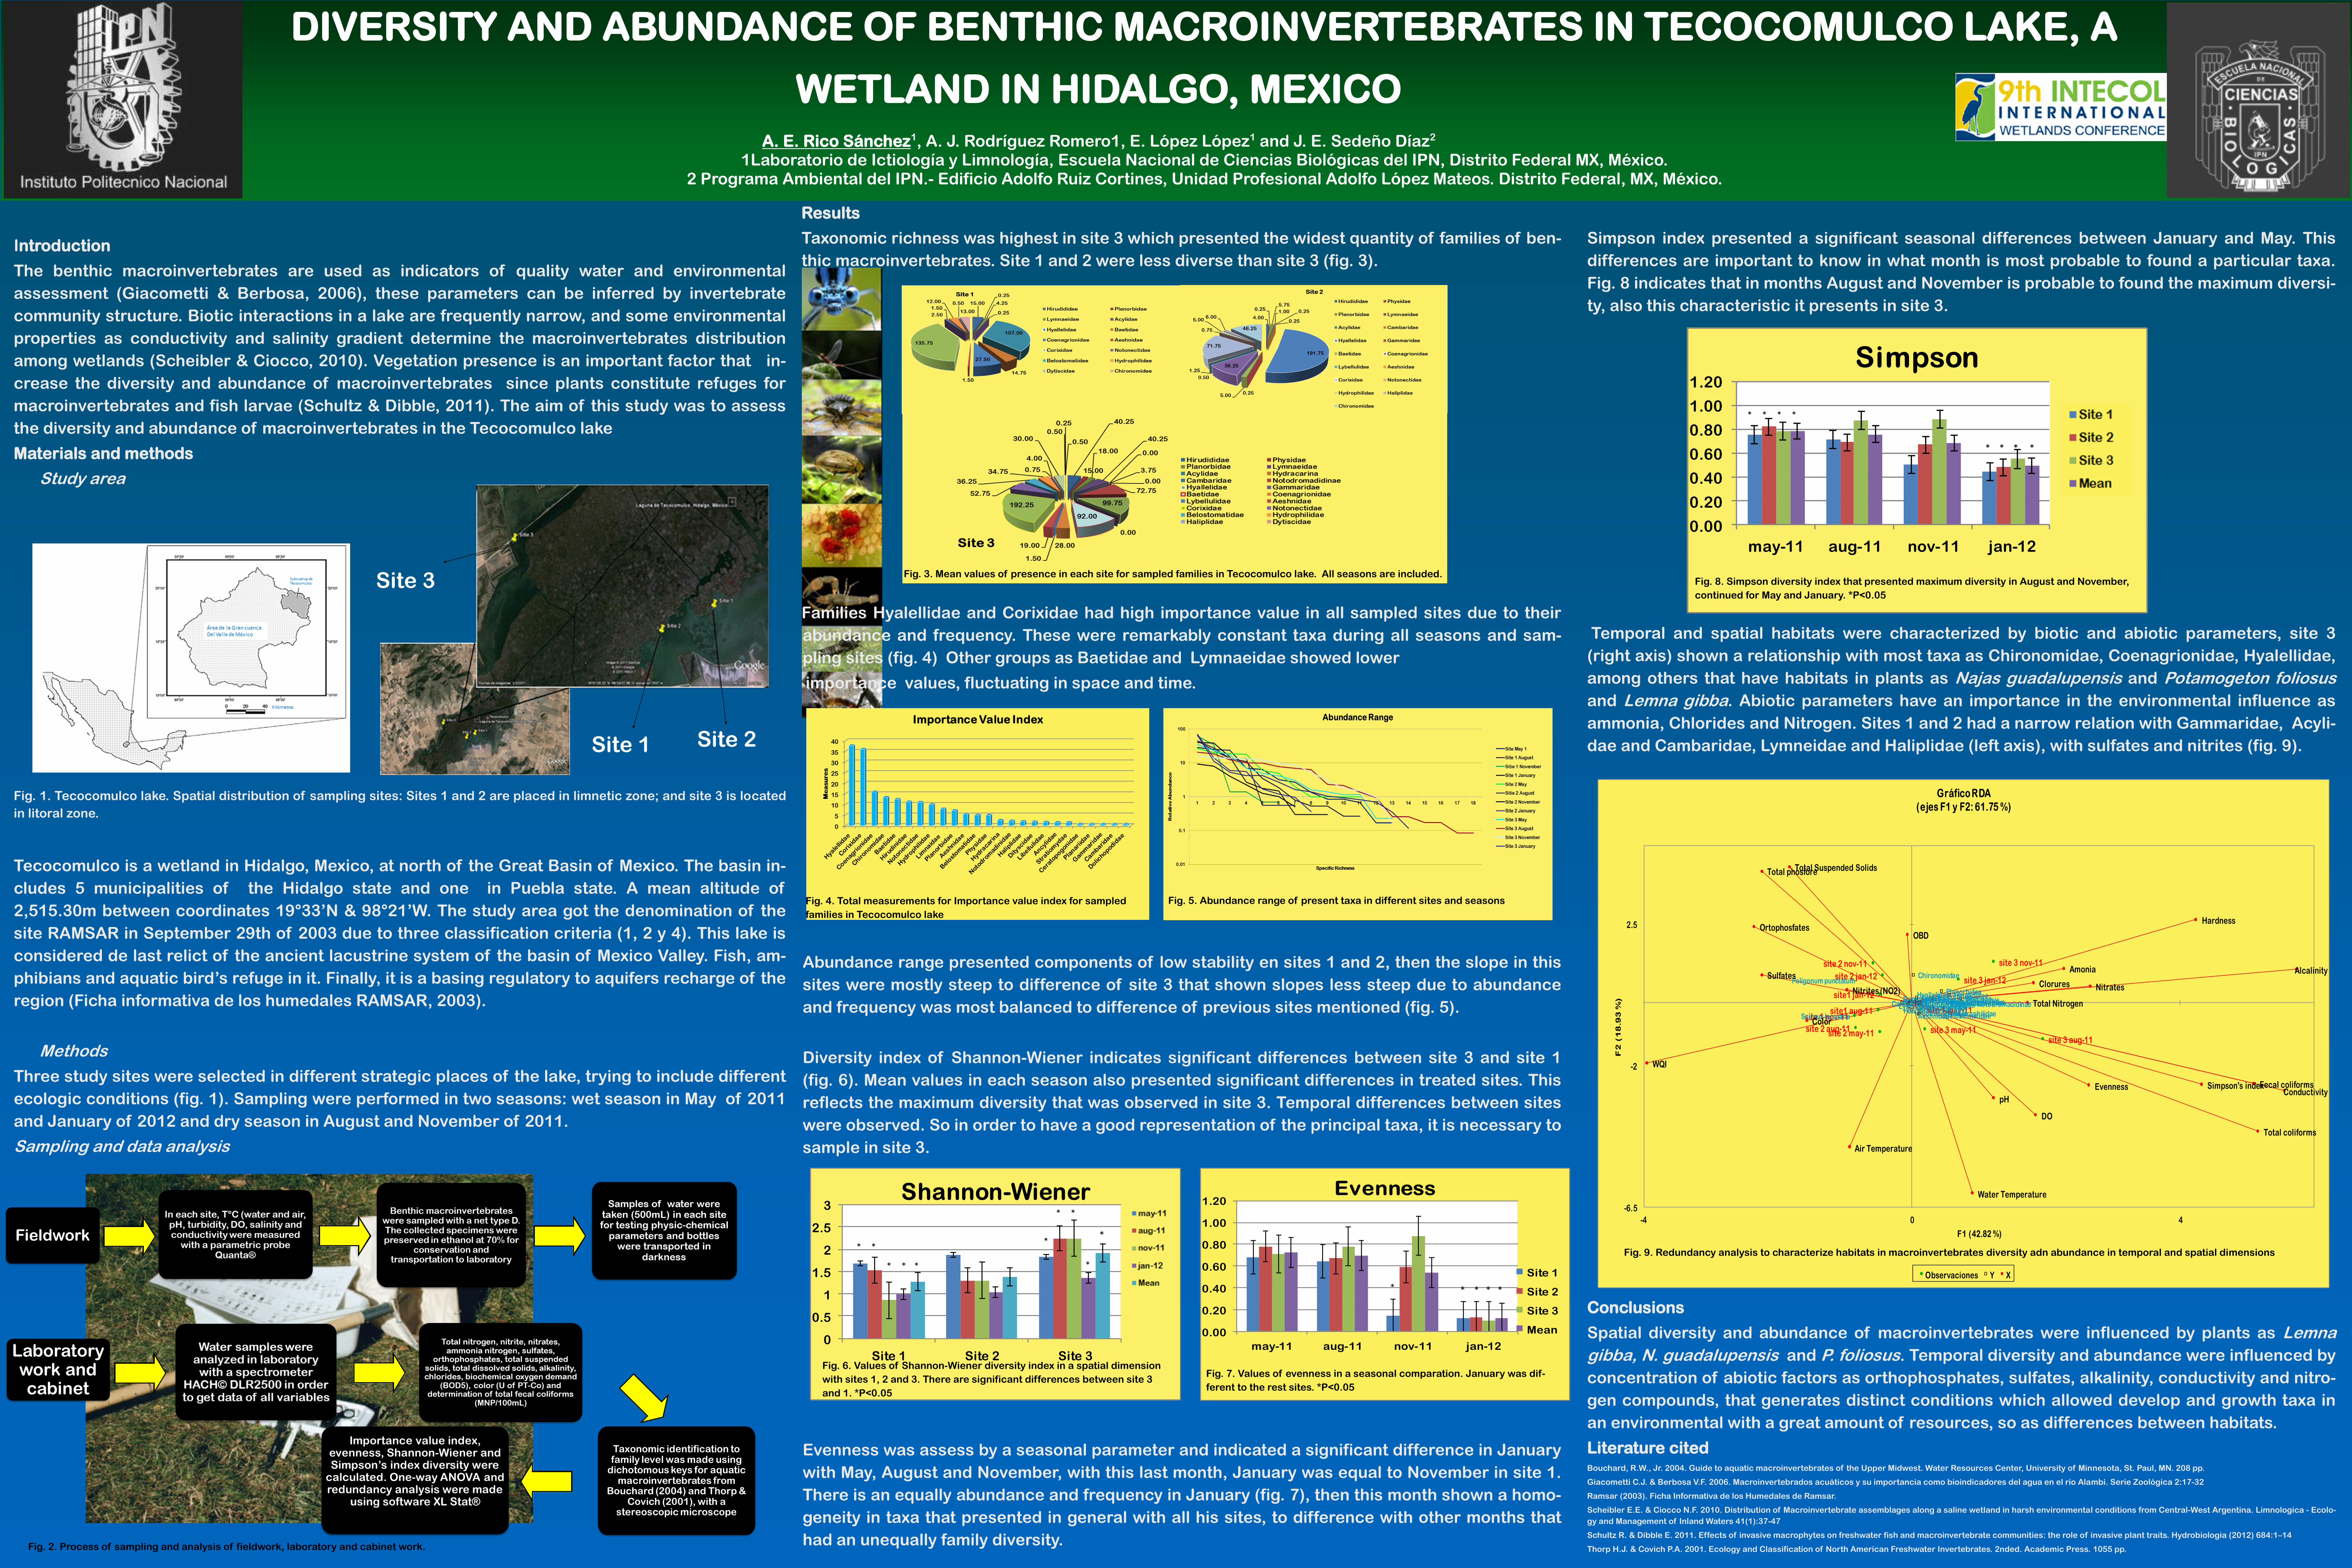
Fig. 1. Tecocomulco lake. Spatial distribution of sampling sites: Sites 1 and 2 are placed in limnetic zone; and site 3 is located
in litoral zone.
Tecocomulco is a wetland in Hidalgo, Mexico, at north of the Great Basin of Mexico. The basin in-
cludes 5 municipalities of the Hidalgo state and one in Puebla state. A mean altitude of
2,515.30m between coordinates 19°33’N & 98°21’W. The study area got the denomination of the
site RAMSAR in September 29th of 2003 due to three classification criteria (1, 2 y 4). This lake is
considered de last relict of the ancient lacustrine system of the basin of Mexico Valley. Fish, am-
phibians and aquatic bird’s refuge in it. Finally, it is a basing regulatory to aquifers recharge of the
region (Ficha informativa de los humedales RAMSAR, 2003).
Methods
Three study sites were selected in different strategic places of the lake, trying to include different
ecologic conditions (fig. 1). Sampling were performed in two seasons: wet season in May of 2011
and January of 2012 and dry season in August and November of 2011.
Sampling and data analysis
Results
Taxonomic richness was highest in site 3 which presented the widest quantity of families of ben-
thic macroinvertebrates. Site 1 and 2 were less diverse than site 3 (fig. 3).
Families Hyalellidae and Corixidae had high importance value in all sampled sites due to their
abundance and frequency. These were remarkably constant taxa during all seasons and sam-
pling sites (fig. 4) Other groups as Baetidae and Lymnaeidae showed lower
importance values, fluctuating in space and time.
Abundance range presented components of low stability en sites 1 and 2, then the slope in this
sites were mostly steep to difference of site 3 that shown slopes less steep due to abundance
and frequency was most balanced to difference of previous sites mentioned (fig. 5).
Diversity index of Shannon-Wiener indicates significant differences between site 3 and site 1
(fig. 6). Mean values in each season also presented significant differences in treated sites. This
reflects the maximum diversity that was observed in site 3. Temporal differences between sites
were observed. So in order to have a good representation of the principal taxa, it is necessary to
sample in site 3.
Evenness was assess by a seasonal parameter and indicated a significant difference in January
with May, August and November, with this last month, January was equal to November in site 1.
There is an equally abundance and frequency in January (fig. 7), then this month shown a homo-
geneity in taxa that presented in general with all his sites, to difference with other months that
had an unequally family diversity.
Simpson index presented a significant seasonal differences between January and May. This
differences are important to know in what month is most probable to found a particular taxa.
Fig. 8 indicates that in months August and November is probable to found the maximum diversi-
ty, also this characteristic it presents in site 3.
Temporal and spatial habitats were characterized by biotic and abiotic parameters, site 3
(right axis) shown a relationship with most taxa as Chironomidae, Coenagrionidae, Hyalellidae,
among others that have habitats in plants as Najas guadalupensis and Potamogeton foliosus
and Lemna gibba. Abiotic parameters have an importance in the environmental influence as
ammonia, Chlorides and Nitrogen. Sites 1 and 2 had a narrow relation with Gammaridae, Acyli-
dae and Cambaridae, Lymneidae and Haliplidae (left axis), with sulfates and nitrites (fig. 9).
Conclusions
Spatial diversity and abundance of macroinvertebrates were influenced by plants as Lemna
gibba, N. guadalupensis and P. foliosus. Temporal diversity and abundance were influenced by
concentration of abiotic factors as orthophosphates, sulfates, alkalinity, conductivity and nitro-
gen compounds, that generates distinct conditions which allowed develop and growth taxa in
an environmental with a great amount of resources, so as differences between habitats.
Literature cited Bouchard, R.W., Jr. 2004. Guide to aquatic macroinvertebrates of the Upper Midwest. Water Resources Center, University of Minnesota, St. Paul, MN. 208 pp.
Giacometti C.J. & Berbosa V.F. 2006. Macroinvertebrados acuáticos y su importancia como bioindicadores del agua en el río Alambi. Serie Zoológica 2:17-32
Ramsar (2003). Ficha Informativa de los Humedales de Ramsar.
Scheibler E.E. & Ciocco N.F. 2010. Distribution of Macroinvertebrate assemblages along a saline wetland in harsh environmental conditions from Central-West Argentina. Limnologica - Ecolo-
gy and Management of Inland Waters 41(1):37-47
Schultz R. & Dibble E. 2011. Effects of invasive macrophytes on freshwater fish and macroinvertebrate communities: the role of invasive plant traits. Hydrobiologia (2012) 684:1–14
Thorp H.J. & Covich P.A. 2001. Ecology and Classification of North American Freshwater Invertebrates. 2nded. Academic Press. 1055 pp.
Site 2
Site 3
Site 1
Fig. 3. Mean values of presence in each site for sampled families in Tecocomulco lake. All seasons are included.
Fig. 4. Total measurements for Importance value index for sampled
families in Tecocomulco lake
Fig. 2. Process of sampling and analysis of fieldwork, laboratory and cabinet work.
Fig. 5. Abundance range of present taxa in different sites and seasons
0
0.5
1
1.5
2
2.5
3
Site 1 Site 2 Site 3
Shannon-Wienermay-11aug-11nov-11
Fig. 6. Values of Shannon-Wiener diversity index in a spatial dimension
with sites 1, 2 and 3. There are significant differences between site 3
and 1. *P<0.05
0.00
0.20
0.40
0.60
0.80
1.00
1.20
may-11 aug-11 nov-11 jan-12
Evenness
Site 1
Site 2
Site 3
Mean
Fig. 7. Values of evenness in a seasonal comparation. January was dif-
ferent to the rest sites. *P<0.05
* * * * *
* *
*
*
*
* * *
* *
0.00
0.20
0.40
0.60
0.80
1.00
1.20
may-11 aug-11 nov-11 jan-12
Simpson
Sit
e 1Sit
e 2
* * * *
* * * *
Fig. 8. Simpson diversity index that presented maximum diversity in August and November,
continued for May and January. *P<0.05
site 1 may-11site1 aug-11site 1 nov-11
site1 jan-12
site 2 may-11site 2 aug-11
site 2 nov-11
site 2 jan-12
site 3 may-11site 3 aug-11
site 3 nov-11
site 3 jan-12
HirudididaePhysidae
Planorbidae
LymnaeidaeAcylidae
HydracarinaCambaridae Notodromadidinae
HyallelidaeGammaridae Baetidae
Coenagrionidae
Lybellulidae
Aeshnidae
CorixidaeNotonectidae
BelostomatidaeHydrophilidaeHaliplidae Dytiscidae
Chironomidae
CeratopogonidaeDolichopodidaeStratiomydae
Scirpus lacustris
Poligonum punctatum
Potamogeton foliosusNajas guadalupensisLemna gibba
Evenness Simpson's index
DO
OBD
Nitrates
Hardness
Color
Total coliforms
Fecal coliforms
Alcalinity
Clorures
ConductivitypH
Water Temperature
Air Temperature
Total Nitrogen
Nitrites (NO2)
Amonia
Ortophosfates
Total phosfore
Sulfates
Total Suspended Solids
WQI
-6.5
-2
2.5
-4 0 4
F2
(1
8.9
3 %
)
F1 (42.82 %)
Gráfico RDA
(ejes F1 y F2: 61.75 %)
Observaciones Y X
Fig. 9. Redundancy analysis to characterize habitats in macroinvertebrates diversity adn abundance in temporal and spatial dimensions