diversity reportnamic.com/.../uploads/2018/02/2017-namic-aim-report.pdfadvancement investment...
TRANSCRIPT

ADVANCEMENT INVESTMENT MEASUREMENT
DIVERSITYREPORT
2017CABLE AND COMMUNICATIONS INDUSTRY MULTI-ETHNIC
NAMIC INC50 BROAD STREETSUITE 1801NEW YORK, NY 10004
212.594.5985
www.namic.com
#NAMICAIM

II 12017 CABLE AND COMMUNICATIONS INDUSTRY MULTI-ETHNIC DIVERSITY REPORT
ABOUT NAMIC ...............................................................................................................................ii
INTRODUCTION ............................................................................................................................ 2
SURVEY METHODOLOGY .......................................................................................................4
EXECUTIVE SUMMARY: 2017 NAMIC AIM HIGHLIGHTS ..........................................6
2017 INDUSTRY SCORECARD ............................................................................................. 10
MULTI-ETHNICITY ACROSS EMPLOYEE LEVELS AND FUNCTIONS ..............12
INTERNAL LABOR MARKET MAPS AND PROJECTIONS .....................................26
DIVERSITY POLICIES AND PRACTICES .........................................................................42
HOW DOES THE CABLE INDUSTRY COMPARE TO OTHERS? ...........................51
CONCLUSIONS ............................................................................................................................52
WHAT YOU CAN DO ............................................................................................................... 54
DEFINITIONS ................................................................................................................................55
NAMIC (National Association for Multi-ethnicity in Communications) is the premier organization focusing on multicultural diversity, equity and inclusion in the communications industry. More than 3,500 professionals belong to a network of 18 chapters nationwide. Through initiatives that target leadership development, advocacy and empowerment, NAMIC collaborates with industry partners to grow and nurture a workforce that reflects the cultural richness of the populations served. Please visit www.namic.com for more information about NAMIC and its many opportunities.
ABOUT NAMIC CONTENTS
2 32017 CABLE AND COMMUNICATIONS INDUSTRY MULTI-ETHNIC DIVERSITY REPORT
ABOUT MERCER
Mercer delivers advice and technology-driven solutions that help organizations meet the health, wealth and career needs of a changing workforce. Mercer’s more than 22,000 employees are based in 43 countries and the firm operates in over 130 countries. Mercer is a wholly owned subsidiary of Marsh & McLennan Companies (NYSE: MMC), the leading global professional services firm in the areas of risk, strategy and people. With more than 60,000 colleagues and annual revenue over $13 billion, Marsh & McLennan helps clients navigate an increasingly dynamic and complex environment. For more information, visit www.mercer.com. Follow Mercer on Twitter @Mercer.
ABOUT THE WALTER KAITZ FOUNDATION
The Walter Kaitz Foundation advocates for diversity and inclusion across the media and entertainment industries. In addition, the Foundation provides targeted funding to key organizations within the industry that support vital programs and initiatives that promote the contributions of women and people of color. The Foundation also curates programs which are designed to bring together various partners and stakeholders who work towards the diversification of the industry's workforce, expanding its supplier diversity base and promotes diversity in its programming content. Please visit www.walterkaitz.org or follow @WalterKaitz on Twitter for more information about the organization.
INTRODUCTION
ABOUT THIS REPORT
The National Association for Multi-Ethnicity in Communications (NAMIC) and Women in Cable Telecommunications (WICT) once again teamed up to combine their research surveys—NAMIC’s AIM (Advancement Investment Measurement) and WICT’s PAR (Pay Equity, Advancement Opportunities and Resources for Work/Life Integration) Initiative—for the 2017 NAMIC and WICT Cable and Communications Industry Diversity Survey. The survey was conducted by Mercer as a third-party expert. The Walter Kaitz Foundation funded this project.
The NAMIC AIM provides a baseline of statistics on the status of multi-ethnic employment in the industry. Now in its ninth wave, the biennial diversity survey is a powerful example of the organization’s partnership with companies to provide information and resources to nurture a pipeline of diverse talent in the industry.
The findings from the NAMIC AIM are important determinants of NAMIC’s programmatic direction, and leverage support for other strategic diversity endeavors. In fact, the initial 1999 research was the impetus for creating NAMIC’s flagship Executive Leadership Development Program (ELDP), currently held in partnership with the University of Virginia Darden School of Business. In 2005, strong inferences gleaned from later research gave rise to the creation of the NAMIC Leadership Seminar, targeting industry professionals from across the full multicultural spectrum committed to crafting personal blueprints for career success and interested in becoming culturally competent leaders. In recent years, the research has influenced content of the Annual NAMIC Conference, as the organization works to ensure that NAMIC members and broader constituencies have access to information that leverages the benefits of an increasingly diverse workforce and consumer base.

4 52017 CABLE AND COMMUNICATIONS INDUSTRY MULTI-ETHNIC DIVERSITY REPORT
The primary research methodology for this study was a survey of cable and communications companies. The survey consisted of 51 quantitative and qualitative questions. In January 2017, an e-mail invitation that included a hyperlink to the survey was sent to companies in the industry.1 The survey was open for eight weeks, with periodic reminders sent to non-respondents. These efforts resulted in 24 companies completing the survey. Fifteen of these companies were programmers, six companies were multi-system operators (MSOs), and three companies were industry suppliers. Nineteen organizations participated in both the 2015 and 2017 NAMIC AIM surveys, and five were new to the survey in 2017.
Cable programmers, operators, and related businesses directly employ about 417,000 people in the United States.2 The 24 companies that responded to the survey comprise more than 281,000 U.S. employees, or approximately 67.5% of this workforce, suggesting that the survey results are representative of the industry.
Similarly to the 2015 NAMIC AIM survey, the 2017 survey captured information on diversity at the highest
leadership levels within the industry and also captured information that enabled the creation of industry-wide Internal Labor Market (ILM) maps showing the workforce dynamics (i.e., hires, promotions, and exits) of people of color in the industry. This year for the first time, the survey also captured industry-wide ILM dynamics for the young professional workforce. This information was used to generate projections of how representation of people of color at management levels can be expected to change over the next five and ten years. Each survey participant received ILM maps and projections reflecting its organization. Furthermore, information from the Equal Employment Opportunity Commission’s (EEOC) Job Patterns for Minorities and Women in Private Industry database was used to generate national representation benchmarks. The database provides aggregated information on the distribution of women and minorities by EEO-1 job classification for private employers with more than 100 employees. Data are available by geographic area and industry. For this study, 2015 information was captured for:
SURVEY METHODOLOGY
all industries, for the Information sector (NAICS 51), and for the Broadcasting (NAICS 515) and Telecommunications (NAICS 517) industries, which are both part of the Information sector.3 The Information sector includes organizations involved in publishing (including software publishing), motion picture and sound recording, broadcasting, telecommunications, data processing and hosting, and other information services such as internet publishing and web search portals. Using the latter data, each survey participant received custom representation benchmarks reflective of the organization’s largest work locations. For boards of directors, national benchmarks in this report came from the Spencer Stuart U.S. Board Index 2016 and denote representation on the boards of S&P 500 companies. Finally, the survey captured diversity practices and commitment to diversity and inclusion in the industry,
as well as the prevalence of non-traditional employee benefits.
Regarding employee headcount, participating organizations were asked to report full-time employees who were active, on disability (STD & LTD), or on leave of absence, excluding temporary/contingent employees and employees who reside and work outside the United States and its territories. Not all survey participants responded to all of the survey questions. Results were calculated based on the number of organizations that responded to a given question.
The survey was conducted in 2017. Respondents were asked to report on 2016 workforce demographics by gender and race/ethnicity for a variety of job categories. In keeping with how survey results have historically been reported, survey data included in this report are labeled as 2017 data. The results in this report reflect the most current data available.
1 Seventy-one companies were invited to participate.
2 Total industry workforce estimates come from Bortz Media & Sports Group, Inc.’s Unleashing Connectivity and Entertainment in America, 2017 (retrieved from https://www.ncta.com/impact). 3 More detail on the NAICS industry classification can be found at http://www.census.gov/eos/www/naics/.

6 72017 CABLE AND COMMUNICATIONS INDUSTRY MULTI-ETHNIC DIVERSITY REPORT
4 Unless otherwise stated, key highlights reflect full-time employees at participating organizations who are active, on disability (STD & LTD), or on leave of absence, excluding temporary/contingent employees and employees who reside and work outside the United States and its territories. The national benchmark referenced in this section is for all indus-tries. People of color include those classified as Hispanic/Latino, Black or African American, Native Hawaiian or Other Pacific Islander, Asian, American Indian or Alaskan Native, or Two or more races.
This executive summary highlights key findings from the 2017 NAMIC AIM industry diversity survey. The findings reflect the responses of 24 participating organizations; 15 of which are programmers, six are multi-system operators, and three industry suppliers. Collectively, these 24 companies employ more than 281,000 people.
Key Highlights4
• Industry representation of people of color exceeds the national benchmark at all levels, with the exception of boards of directors where representation is on par with the national benchmark (Figure 1). The most notable differences are for executives and professionals, where industry representation outpaces the national benchmark by nine percentage points and seven percentage points, respectively.
EXECUTIVE SUMMARY: 2017 NAMIC AIM HIGHLIGHTS
OverallWorkforce
Professionals Entry and Mid-LevelManagers
Executive and Senior-Level
Managers
Boardof Directors
40%38%
Percent People of Color
Industry
National Benchmark
35%
28% 28%
23%
14%15%
• Representation compares favorably to the national benchmark for both operators and programmers, with all figures on par or exceeding the benchmark, with the exception of the overall workforce for programmers (Figure 2).
• Representation of people of color in the industry has generally increased over the past two years. A look at the 19 organizations that participated in both the 2015 and 2017 surveys (i.e., “survey-over-survey” participants) shows that representation increased or remained flat across all levels (Figure 3). Operators saw increases at every level, while programmers saw mixed results.
23%
15%
Percentage Point (%pt) Change in People of Color RepresentationSurvey-over-survey participants only (2015, 2017)
Figure 3. Survey-over-Survey (2015, 2017) Percentage Point Change in Representation of People of Color: Industry, MSOs, Programmers.
Level Industry Multi-SystemOperators Programmers
Board of Directors 1.5 3.4 8.7
Executives/Sr. Managers 0.4 2.0 0.7
Managers 1.1 1.7 -1.1
Professionals 0.3 1.7 -2.3
Overall Workforce 1.8 2.1 -1.0
Increase of 1% pt or more Less than 1 % pt difference Decrease of 1-2 %pts Decrease if more than 2 %pts
Figure 1. Representation of People of Color: Industry and National Benchmark.
National Benchmarks
Industry Multi-System Operators
Programmers
Board of Directors 15% 15% 17% 16%
Executive/Sr. Manager 14% 23% 15% 32%
Managers 23% 28% 29% 26%
Professionals 28% 35% 32% 38%
Overall Workforce 38% 40% 42% 33%
Figure 2. Representation of People of Color: National Benchmark, Industry, MSOs, Programmers.
Percent People of Color
8 92017 CABLE AND COMMUNICATIONS INDUSTRY MULTI-ETHNIC DIVERSITY REPORT
Summary of representation changes between 2016 and 2026, baseline vs. simultaneous changes
Current and ProjectedPeople of Color Representation %
Current Period: 2016
Baseline Scenario
With adjusted promotions
28% 28% 30% 33% 33% 41%Managers and Above
With All Changes Baseline Scenario With All Changes Baseline Scenario With All Changes
Workforce Projections: % People of Color - Managers and Above, 2016 to 2026
Leg
end
2016
45%
40%
35%
30%
25%2017 2018 2019 2020 2021 2022 2023 2024 2025 2026
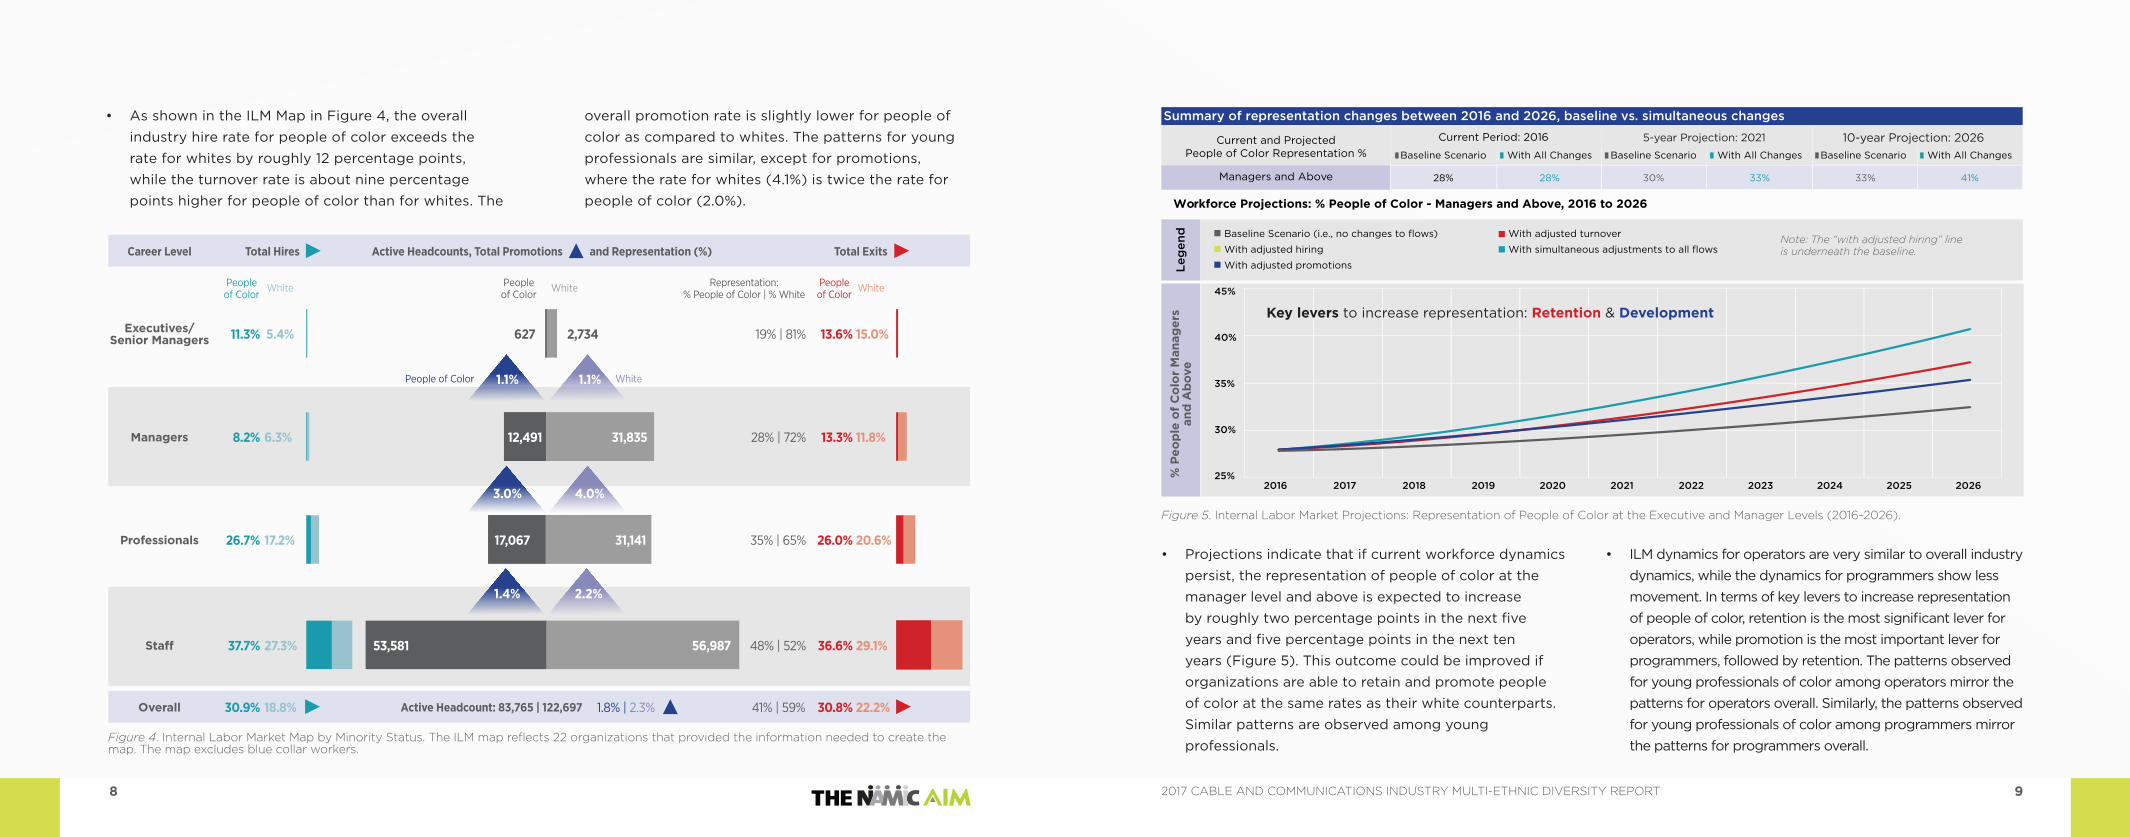
• As shown in the ILM Map in Figure 4, the overall industry hire rate for people of color exceeds the rate for whites by roughly 12 percentage points, while the turnover rate is about nine percentage points higher for people of color than for whites. The
overall promotion rate is slightly lower for people of color as compared to whites. The patterns for young professionals are similar, except for promotions, where the rate for whites (4.1%) is twice the rate for people of color (2.0%).
• Projections indicate that if current workforce dynamics persist, the representation of people of color at the manager level and above is expected to increase by roughly two percentage points in the next five years and five percentage points in the next ten years (Figure 5). This outcome could be improved if organizations are able to retain and promote people of color at the same rates as their white counterparts. Similar patterns are observed among young professionals.
Figure 4. Internal Labor Market Map by Minority Status. The ILM map reflects 22 organizations that provided the information needed to create the map. The map excludes blue collar workers.
Figure 5. Internal Labor Market Projections: Representation of People of Color at the Executive and Manager Levels (2016-2026).
% P
eop
le o
f C
olor
Man
ager
san
d A
bov
e
• ILM dynamics for operators are very similar to overall industry dynamics, while the dynamics for programmers show less movement. In terms of key levers to increase representation of people of color, retention is the most significant lever for operators, while promotion is the most important lever for programmers, followed by retention. The patterns observed for young professionals of color among operators mirror the patterns for operators overall. Similarly, the patterns observed for young professionals of color among programmers mirror the patterns for programmers overall.
Key levers to increase representation: Retention & Development11.3% 5.4%
Career Level Total Hires Active Headcounts, Total Promotions and Representation (%) Total Exits
Executives/Senior Managers
Managers
Professionals
Staff
Overall
Peopleof Color
White People of Color
White Representation:% People of Color | % White
Peopleof Color
White
8.2% 6.3%
26.7% 17.2%
37.7% 27.3%
627 2,734
People of Color White
12,491 31,835
17,067 31,141
53,581 56,987
30.9% 18.8% Active Headcount: 83,765 | 122,697 1.8% | 2.3%
19% | 81%
28% | 72%
35% | 65%
48% | 52%
41% | 59%
13.6% 15.0%
13.3% 11.8%
26.0% 20.6%
36.6% 29.1%
30.8% 22.2%
1.1% 1.1%
3.0% 4.0%
1.4% 2.2%
Note: The “with adjusted hiring” line is underneath the baseline.
5-year Projection: 2021 10-year Projection: 2026
10 112017 CABLE AND COMMUNICATIONS INDUSTRY MULTI-ETHNIC DIVERSITY REPORT
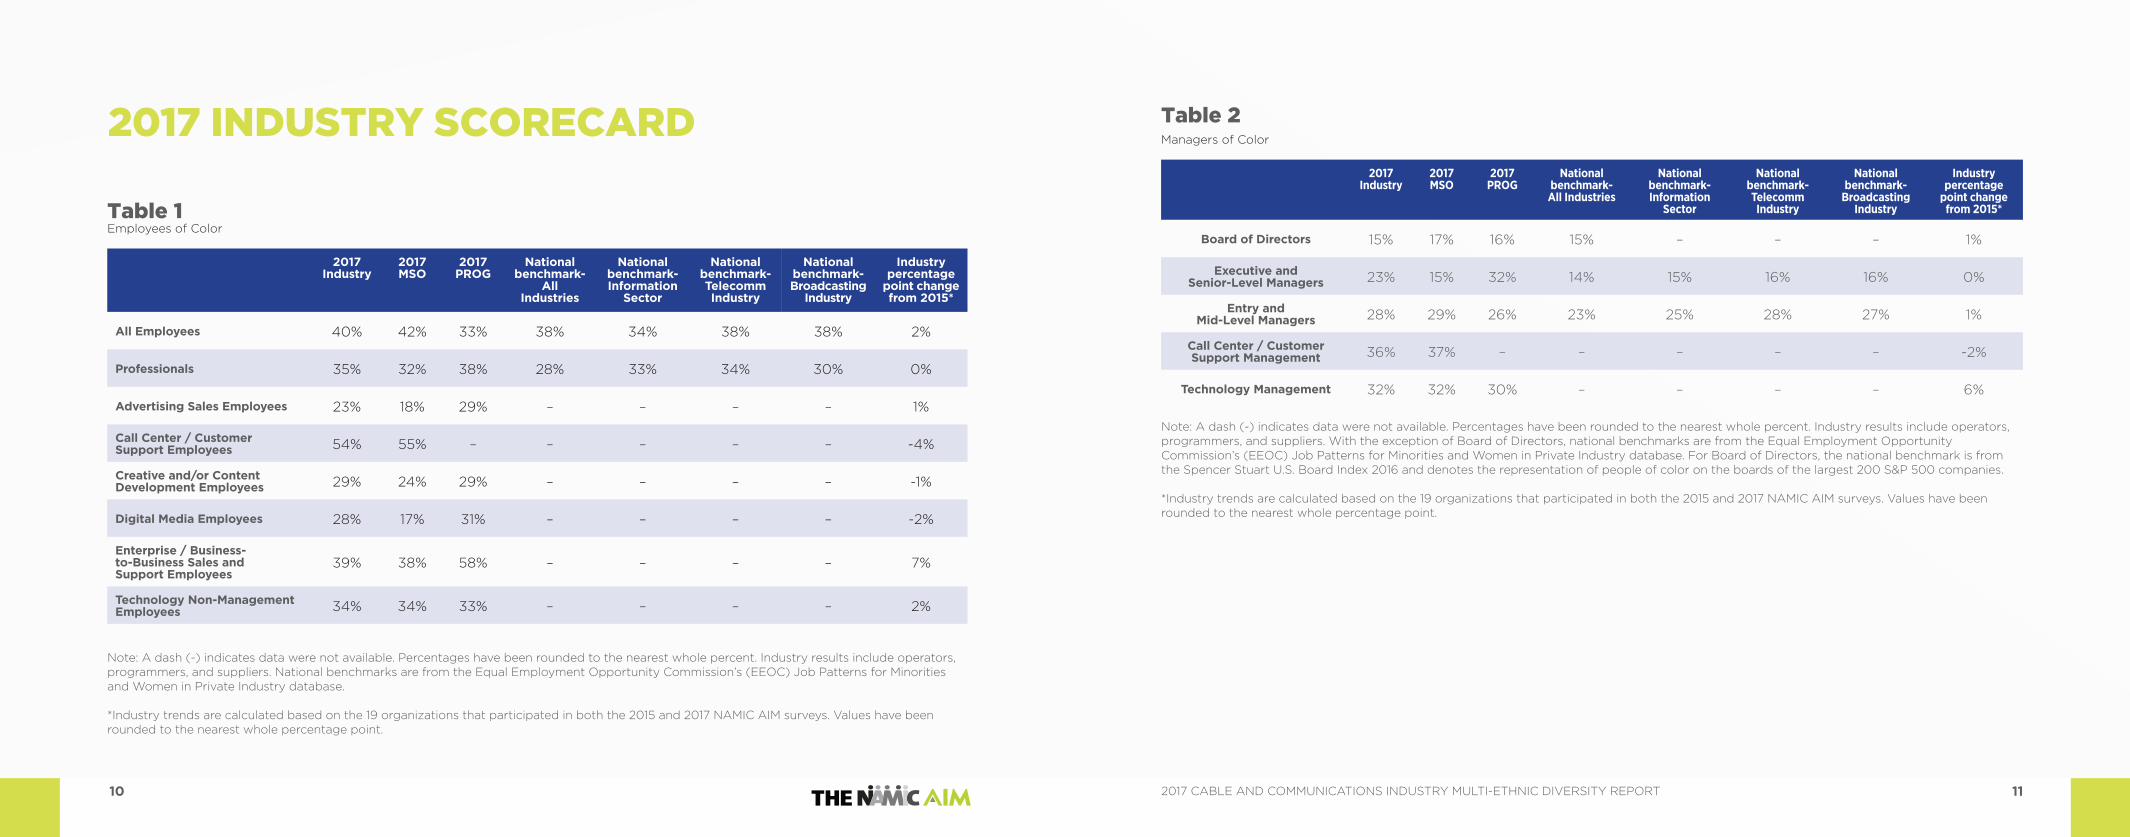
Table 1Employees of Color
2017 Industry
2017 MSO
2017 PROG
National benchmark-
All Industries
National benchmark- Information
Sector
National benchmark- Telecomm Industry
National benchmark- Broadcasting
Industry
Industry percentage
point change from 2015*
All Employees 40% 42% 33% 38% 34% 38% 38% 2%
Professionals 35% 32% 38% 28% 33% 34% 30% 0%
Advertising Sales Employees 23% 18% 29% – – – – 1%
Call Center / Customer Support Employees 54% 55% – – – – – -4%
Creative and/or Content Development Employees 29% 24% 29% – – – – -1%
Digital Media Employees 28% 17% 31% – – – – -2%
Enterprise / Business-to-Business Sales and Support Employees
39% 38% 58% – – – – 7%
Technology Non-Management Employees 34% 34% 33% – – – – 2%
Note: A dash (-) indicates data were not available. Percentages have been rounded to the nearest whole percent. Industry results include operators, programmers, and suppliers. National benchmarks are from the Equal Employment Opportunity Commission’s (EEOC) Job Patterns for Minorities and Women in Private Industry database.
*Industry trends are calculated based on the 19 organizations that participated in both the 2015 and 2017 NAMIC AIM surveys. Values have been rounded to the nearest whole percentage point.
2017 INDUSTRY SCORECARD Table 2Managers of Color
2017 Industry
2017 MSO
2017 PROG
National benchmark-
All Industries
National benchmark- Information
Sector
National benchmark- Telecomm Industry
National benchmark-
Broadcasting Industry
Industry percentage
point change from 2015*
Board of Directors 15% 17% 16% 15% – – – 1%
Executive and Senior-Level Managers 23% 15% 32% 14% 15% 16% 16% 0%
Entry and Mid-Level Managers 28% 29% 26% 23% 25% 28% 27% 1%
Call Center / Customer Support Management 36% 37% – – – – – -2%
Technology Management 32% 32% 30% – – – – 6%
Note: A dash (-) indicates data were not available. Percentages have been rounded to the nearest whole percent. Industry results include operators, programmers, and suppliers. With the exception of Board of Directors, national benchmarks are from the Equal Employment Opportunity Commission’s (EEOC) Job Patterns for Minorities and Women in Private Industry database. For Board of Directors, the national benchmark is from the Spencer Stuart U.S. Board Index 2016 and denotes the representation of people of color on the boards of the largest 200 S&P 500 companies.
*Industry trends are calculated based on the 19 organizations that participated in both the 2015 and 2017 NAMIC AIM surveys. Values have been rounded to the nearest whole percentage point.

12 132017 CABLE AND COMMUNICATIONS INDUSTRY MULTI-ETHNIC DIVERSITY REPORT
MULTI-ETHNICITY ACROSSEMPLOYEE LEVELS AND FUNCTIONSThis section examines the racial/ethnic diversity of those in leadership, management, professional, and other key positions within the industry.
BOARDS OF DIRECTORS
Looking at the members of boards of directors of the participating companies, 15% are people of color (see Table 2). The figure is relatively comparable between programmers and multi-system operators (16% and 17%, respectively). All three measures meet or exceed the proportion of people of color on boards at the largest 200 S&P 500 companies (15%). Examination of the 19 organizations that participated in both the 2015 and 2017 NAMIC AIM surveys (“survey-over-survey” participants) reveals that the representation of people of color on
boards of directors increased by one percentage point over the past two years.
Across the participating organizations, Asians constitute 3% of board directors, which is one percentage point higher than the representation of Asians on the boards of directors at the largest 200 S&P 500 companies (see Table 3). African Americans/Blacks account for 8% of board members at surveyed organizations, which is on par with the representation of African Americans/Blacks on the boards of directors at the largest 200 S&P 500 companies. Hispanics/Latinos make up 4% of boards of directors at participating companies, which is one percentage point lower than the representation of Hispanics/Latinos on the boards of directors at the largest 200 S&P 500 companies.
Table 3 Board of Directors: Race/Ethnicity
2017 Industry
2017 Multi-System Operators
2017 Programmers
National benchmark Industry percentage point change from 2015*
American Indian / Alaska Native 0% 0% 0% – 0%
Asian 3% 5% 3% 2% 1%
African American / Black 8% 7% 7% 8% 1%
Hispanic / Latino 4% 5% 5% 5% 1%
Native Hawaiian / Pacific Islander 0% 0% 0% – 0%
Two or more races 0% 0% 0% – 0%
White 85% 83% 84% 85%** -1%
Note: A dash (-) indicates data were not available. Percentages have been rounded to the nearest whole percent. Industry results include operators, programmers, and suppliers. The national benchmark is from the Spencer Stuart U.S. Board Index 2016 and denotes the representation of people of color on the boards of the largest 200 S&P 500 companies.
*Industry trends are calculated based on the 19 organizations that participated in both the 2015 and 2017 NAMIC AIM surveys. Values have been rounded to the nearest whole percentage point.
**Includes non-US directors.

14 152017 CABLE AND COMMUNICATIONS INDUSTRY MULTI-ETHNIC DIVERSITY REPORT
EXECUTIVES AND SENIOR-LEVEL MANAGERS
Based on the 2017 NAMIC AIM survey, 23% of executives and senior-level managers in the industry are people of color (see Table 2). The figure is 15% for multi-system operators and 32% for programmers. These figures equal or exceed the national benchmarks, which range from 14%-16%, with the overall industry and programmer figures substantially exceeding the national benchmarks. For survey-over-survey participants, the overall representation of people of color among executives and senior-level managers remained constant over the past two years.
A look at the representation of people of color at the executive and senior manager level for different racial/ethnic groups shows that African Americans/Blacks and Asians each constitute 5% of executives and senior managers, and Hispanics/Latinos constitute 13% of executives and senior managers (see Table 4).
The figures for African Americans/Blacks and Asians are comparable to the national benchmarks, which range from 2%-5% for African Americans/Blacks and 5%-8% for Asians. The figures for Hispanics/Latinos substantially exceed the national benchmarks, which range from 3%-5%.
ENTRY AND MID-LEVEL MANAGERS
The 2017 NAMIC AIM survey results show that 28% of entry and mid-level managers are people of color (see Table 2). Twenty-nine percent of multi-system operator employees and 26% of programmer employees in entry and mid-level management are people of color. This is comparable to the national benchmarks, which range from 23% to 28%, with operators exceeding the benchmarks. Looking at the survey-over-survey participants, the representation of people of color among entry and mid-level managers
increased over the past two years by one percentage point.
Across the participating organizations, representation of Asians in entry and mid-level manager roles is 5% (see Table 5). This figure is below the national benchmarks, which range from 6% to 10%. Hispanics/Latinos constitute 9% of those in entry and mid-level manager roles. This figure is comparable to the national benchmarks, which range from 7%-10%. The representation of African Americans/Blacks in entry and mid-level manager jobs is 11%, which is at the top end of the national benchmarks (7%-11%).
Table 4Executives and Senior-Level Managers: Race/Ethnicity
2017 Industry
2017 MSO
2017 PROG
National benchmark-
All Industries
National benchmark- Information
Sector
National benchmark- Telecomm Industry
National benchmark-
Broadcasting Industry
Industry percentage point
change from 2015*
American Indian / Alaska Native 0% 0% 0% 0% 0% 0% 0% 0%
Asian 5% 5% 4% 5% 8% 8% 5% 1%
African American / Black 5% 6% 4% 3% 2% 3% 5% 0%
Hispanic / Latino 13% 3% 22% 5% 3% 4% 5% -1%
Native Hawaiian /Pacific Islander 0% 0% 0% 0% 0% 0% 0% 0%
Two or more races 1% 0% 1% 1% 1% 1% 1% 0%
White 77% 85% 68% 86% 85% 84% 84% 0%
Note: A dash (-) indicates data were not available. Percentages have been rounded to the nearest whole percent. Industry results include operators, programmers, and suppliers. National benchmarks are from the Equal Employment Opportunity Commission’s (EEOC) Job Patterns for Minorities and Women in Private Industry database.
*Industry trends are calculated based on the 19 organizations that participated in both the 2015 and 2017 NAMIC AIM surveys. Values have been rounded to the nearest whole percentage point.
Table 5 Entry and Mid-Level Managers: Race/Ethnicity
2017 Industry
2017 MSO
2017 PROG
National benchmark-
All Industries
National benchmark-
Information Sector
National benchmark-
Telecomm In-dustry
National benchmark-
Broadcasting Industry
Industry percentage point
change from 2015*
American Indian / Alaska Native 0% 0% 0% 0% 0% 0% 0% 0%
Asian 5% 4% 7% 7% 10% 8% 6% 0%
African American / Black 11% 14% 7% 7% 7% 10% 11% 1%
Hispanic / Latino 9% 9% 11% 8% 7% 8% 10% 0%
Native Hawaiian / Pacific Islander 0% 0% 0% 0% 0% 0% 0% 0%
Two or more races 1% 1% 1% 1% 1% 1% 1% 0%
White 72% 71% 74% 77% 75% 72% 73% -1%Note: A dash (-) indicates data were not available. Percentages have been rounded to the nearest whole percent. Industry results include operators, programmers, and suppliers. National benchmarks are from the Equal Employment Opportunity Commission’s (EEOC) Job Patterns for Minorities and Women in Private Industry database.
*Industry trends are calculated based on the 19 organizations that participated in both the 2015 and 2017 NAMIC AIM surveys. Values have been rounded to the nearest whole percentage point.
16 172017 CABLE AND COMMUNICATIONS INDUSTRY MULTI-ETHNIC DIVERSITY REPORT
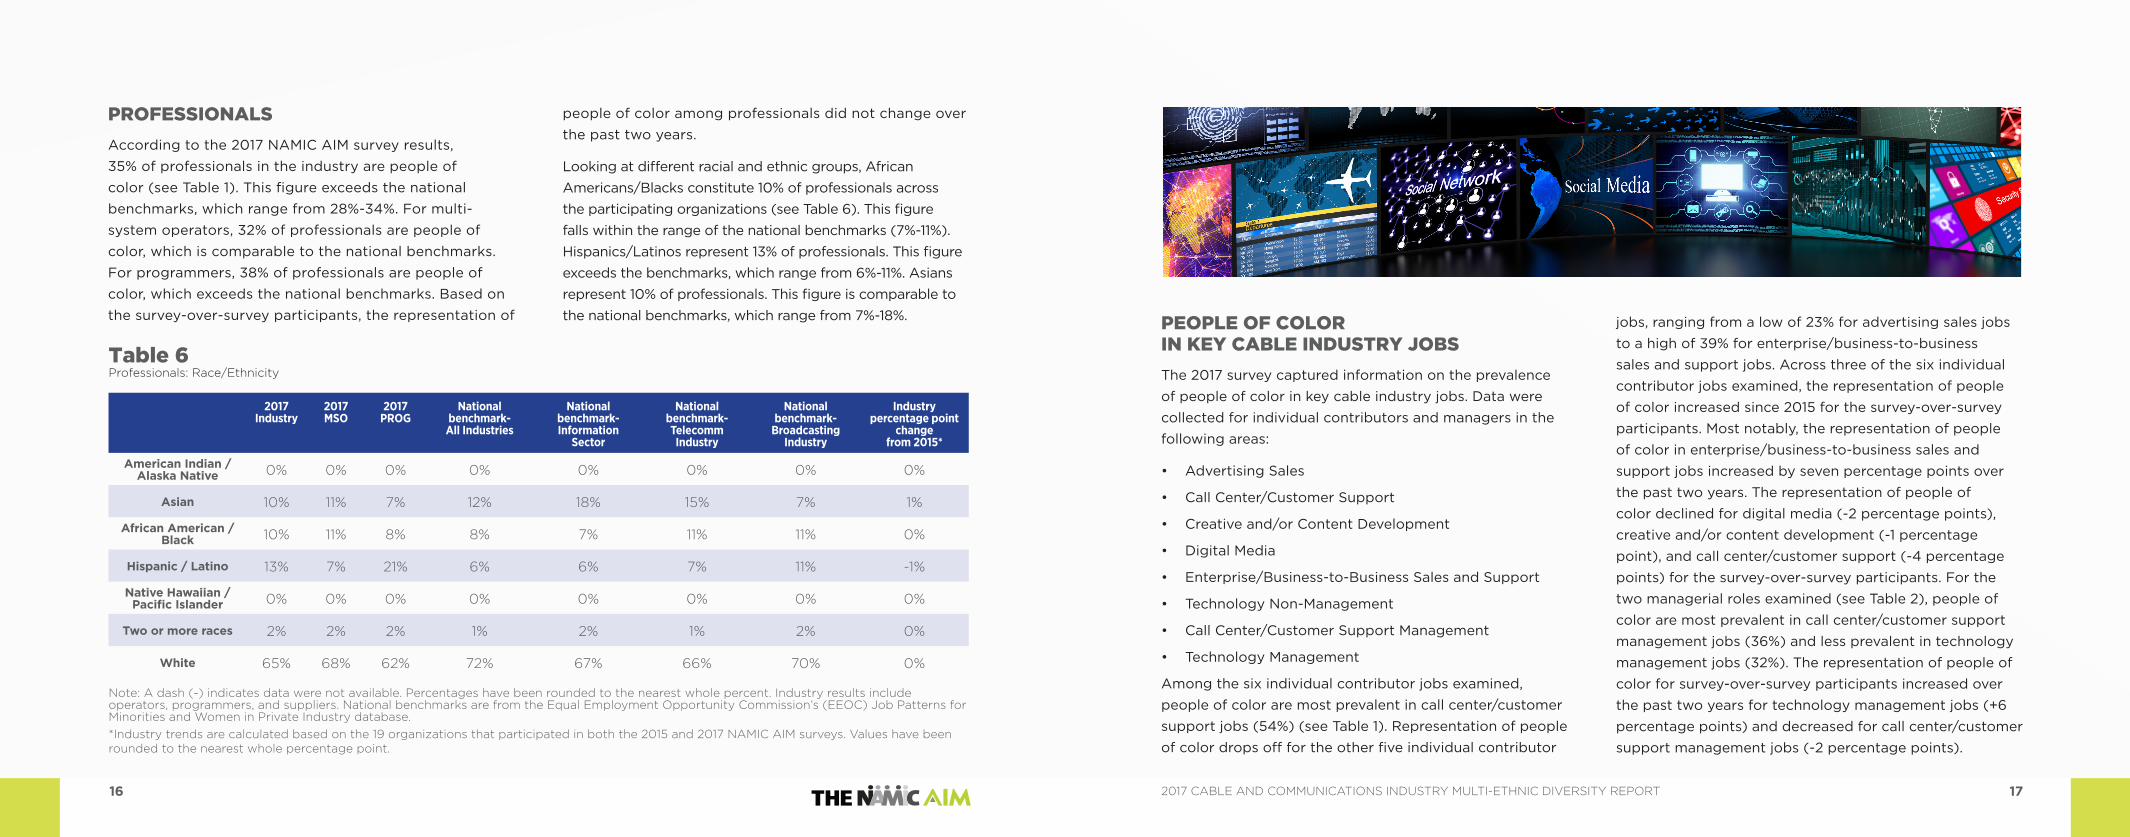
PROFESSIONALS
According to the 2017 NAMIC AIM survey results, 35% of professionals in the industry are people of color (see Table 1). This figure exceeds the national benchmarks, which range from 28%-34%. For multi-system operators, 32% of professionals are people of color, which is comparable to the national benchmarks. For programmers, 38% of professionals are people of color, which exceeds the national benchmarks. Based on the survey-over-survey participants, the representation of
people of color among professionals did not change over the past two years.
Looking at different racial and ethnic groups, African Americans/Blacks constitute 10% of professionals across the participating organizations (see Table 6). This figure falls within the range of the national benchmarks (7%-11%). Hispanics/Latinos represent 13% of professionals. This figure exceeds the benchmarks, which range from 6%-11%. Asians represent 10% of professionals. This figure is comparable to the national benchmarks, which range from 7%-18%. PEOPLE OF COLOR
IN KEY CABLE INDUSTRY JOBS
The 2017 survey captured information on the prevalence of people of color in key cable industry jobs. Data were collected for individual contributors and managers in the following areas:
• Advertising Sales
• Call Center/Customer Support
• Creative and/or Content Development
• Digital Media
• Enterprise/Business-to-Business Sales and Support
• Technology Non-Management
• Call Center/Customer Support Management
• Technology Management
Among the six individual contributor jobs examined, people of color are most prevalent in call center/customer support jobs (54%) (see Table 1). Representation of people of color drops off for the other five individual contributor
jobs, ranging from a low of 23% for advertising sales jobs to a high of 39% for enterprise/business-to-business sales and support jobs. Across three of the six individual contributor jobs examined, the representation of people of color increased since 2015 for the survey-over-survey participants. Most notably, the representation of people of color in enterprise/business-to-business sales and support jobs increased by seven percentage points over the past two years. The representation of people of color declined for digital media (-2 percentage points), creative and/or content development (-1 percentage point), and call center/customer support (-4 percentage points) for the survey-over-survey participants. For the two managerial roles examined (see Table 2), people of color are most prevalent in call center/customer support management jobs (36%) and less prevalent in technology management jobs (32%). The representation of people of color for survey-over-survey participants increased over the past two years for technology management jobs (+6 percentage points) and decreased for call center/customer support management jobs (-2 percentage points).
Table 6 Professionals: Race/Ethnicity
2017 Industry
2017 MSO
2017 PROG
National benchmark-
All Industries
National benchmark- Information
Sector
National benchmark- Telecomm Industry
National benchmark-
Broadcasting Industry
Industry percentage point
change from 2015*
American Indian / Alaska Native 0% 0% 0% 0% 0% 0% 0% 0%
Asian 10% 11% 7% 12% 18% 15% 7% 1%
African American / Black 10% 11% 8% 8% 7% 11% 11% 0%
Hispanic / Latino 13% 7% 21% 6% 6% 7% 11% -1%
Native Hawaiian / Pacific Islander 0% 0% 0% 0% 0% 0% 0% 0%
Two or more races 2% 2% 2% 1% 2% 1% 2% 0%
White 65% 68% 62% 72% 67% 66% 70% 0%
Note: A dash (-) indicates data were not available. Percentages have been rounded to the nearest whole percent. Industry results include operators, programmers, and suppliers. National benchmarks are from the Equal Employment Opportunity Commission’s (EEOC) Job Patterns for Minorities and Women in Private Industry database. *Industry trends are calculated based on the 19 organizations that participated in both the 2015 and 2017 NAMIC AIM surveys. Values have been rounded to the nearest whole percentage point.

18 192017 CABLE AND COMMUNICATIONS INDUSTRY MULTI-ETHNIC DIVERSITY REPORT
Advertising Sales. Across participating organizations, 23% of advertising sales employees in the industry are people of color (see Table 1). Since the 2015 survey, the survey-over-survey participants experienced a one percentage point increase in the representation of people of color among advertising sales employees. People of color are more prevalent among programmers (29%) than among multi-system operators (18%). Looking at the representation of people of color for different racial/
ethnic groups (see Table 7), Hispanics/Latinos, at 8%, have the highest representation, followed by African Americans/Blacks (7%). Two or more races represent 4% of advertising sales employees and Asians represent 3%. For the survey-over-survey participants, Hispanics/Latinos experienced a three percentage point decrease over the past two years, while the category of two or more races experienced a three percentage point increase.
Call Center/Customer Support. Fifty-four percent of call center/customer support employees in the industry are people of color (see Table 1). The survey-over-survey participants experienced a decrease of four percentage points in the representation of people of color since the 2015 survey. For people of color, the predominant racial/ethnic group represented is African Americans/Blacks, who represent 35% of call center/customer support
employees (see Table 8). Hispanics/Latinos constitute 12% of call center/customer support employees, those in the two or more races category constitute 4%, and Asians constitute 2%. These results are primarily reflective of multi-system operators. For the survey-over-survey participants, African Americans/Blacks experienced a notable decrease in representation over the past two years (-7 percentage points).
Table 7 Advertising Sales: Race/Ethnicity
2017 Industry
2017 Multi-System Operators
2017 Programmers
Industry percentage point change from 2015*
American Indian / Alaska Native 0% 0% 0% 0%
Asian 3% 2% 5% 0%
African American / Black 7% 8% 6% 1%
Hispanic / Latino 8% 7% 10% -3%
Native Hawaiian / Pacific Islander 0% 0% 0% 0%
Two or more races 4% 1% 8% 3%
White 77% 82% 71% -1%
Note: A dash (-) indicates data were not available. Percentages have been rounded to the nearest whole percent. Industry results include operators, programmers, and suppliers.
*Industry trends are calculated based on the 19 organizations that participated in both the 2015 and 2017 NAMIC AIM surveys. Values have been rounded to the nearest whole percentage point.
Table 8 Call Center/Customer Support: Race/Ethnicity
2017 Industry
2017 Multi-System Operators
2017 Programmers
Industry percentage point change from 2015*
American Indian / Alaska Native 0% 0% – 0%
Asian 2% 2% – 0%
African American / Black 35% 36% – -7%
Hispanic / Latino 12% 12% – 2%
Native Hawaiian / Pacific Islander 0% 0% – 0%
Two or more races 4% 4% – 1%
White 46% 45% – 4%
Note: A dash (-) indicates data were not available. Percentages have been rounded to the nearest whole percent. Industry results include operators, programmers, and suppliers.
*Industry trends are calculated based on the 19 organizations that participated in both the 2015 and 2017 NAMIC AIM surveys. Values have been rounded to the nearest whole percentage point.

20 212017 CABLE AND COMMUNICATIONS INDUSTRY MULTI-ETHNIC DIVERSITY REPORT
Creative or Content Development. Across survey participants, 29% percent of creative or content development employees are people of color (see Table 1). This figure is 24% for multi-system operators and 29% for programmers. The survey-over-survey participants experienced a one percentage point decrease in the representation of people of color in creative and/or content development jobs over the
past two years. Looking at different racial and ethnic groups, Hispanics/Latinos constitute 15% of creative and/or content development employees (see Table 9), although the figure is considerably higher for programmers (16%) than for multi-system operators (5%). Eight percent of creative or content development employees are African Americans/Blacks and 4% are Asian.
Digital Media. Currently, 28% of digital media employees at participating companies are people of color (see Table 1). The figure is notably higher for programmers (31%) than for multi-system operators (17%). Survey-over-survey participants experienced a two percentage point decrease
in the representation of people of color in digital media jobs over the past two years. Asians and Hispanics/Latinos account for 9% and 10%, respectively, of digital media employees in the industry, while African Americans/Blacks make up 5% (see Table 10).
Table 9 Creative and/or Content Development: Race/Ethnicity
2017 Industry
2017 Multi-System
Operators
2017 Programmers
Industry percentage point change
from 2015*
American Indian / Alaska Native 0% 0% 0% 0%
Asian 4% 3% 4% 0%
African American / Black 8% 14% 7% 0%
Hispanic / Latino 15% 5% 16% -1%
Native Hawaiian / Pacific Islander 0% 0% 0% 0%
Two or more races 2% 1% 2% 0%
White 71% 76% 71% 1%
Note: A dash (-) indicates data were not available. Percentages have been rounded to the nearest whole percent. Industry results include operators, programmers, and suppliers.
*Industry trends are calculated based on the 19 organizations that participated in both the 2015 and 2017 NAMIC AIM surveys. Values have been rounded to the nearest whole percentage point.
Table 10 Digital Media: Race/Ethnicity
2017 Industry
2017 Multi-System Operators
2017 Programmers
Industry percentage point change from 2015*
American Indian / Alaska Native 0% 0% 0% 0%
Asian 9% 7% 10% 0%
African American / Black 5% 4% 6% -2%
Hispanic / Latino 10% 3% 13% -2%
Native Hawaiian / Pacific Islander 1% 0% 1% 0%
Two or more races 2% 2% 2% 1%
White 72% 83% 69% 2%
Note: A dash (-) indicates data were not available. Percentages have been rounded to the nearest whole percent. Industry results include operators, programmers, and suppliers.
*Industry trends are calculated based on the 19 organizations that participated in both the 2015 and 2017 NAMIC AIM surveys. Values have been rounded to the nearest whole percentage point.

22 232017 CABLE AND COMMUNICATIONS INDUSTRY MULTI-ETHNIC DIVERSITY REPORT
Enterprise/Business-to-Business Sales and Support. For participating organizations, 39% of business-to-business sales and support employees are people of color (see Table 1). Survey-over-survey participants experienced a seven percentage point increase in the representation of people of color in these roles. The representation of people of color in business-to-business sales and support
positions is lower for multi-system operators (38%) than for programmers (58%). The primary racial/ethnic groups represented are African Americans/Blacks and Hispanics/Latinos, at 17% and 15% of employees, respectively (see Table 11). For survey-over-survey participants, African Americans/Blacks experienced a notable increase in representation of five percentage points since 2015.
Technology Non-Management. Thirty-four percent of technology non-managers are people of color (see Table 1). For survey-over-survey participants, the percentage of technology non-managers who are people of color increased by two percentage points since 2015. Representation of people of color in technology non-manager roles is
slightly higher for multi-system operators (34%) than for programmers (33%). Among people of color, Hispanics/Latinos have the highest representation in technology non-manager roles at 13%, followed closely by African Americans/Blacks at 12% (see Table 12). Asians currently represent 6% of technology non-managers.
Table 11 Enterprise/Business-to-Business Sales and Support: Race/Ethnicity
2017 Industry
2017 Multi-System Operators
2017 Programmers
Industry percentage point change from 2015*
American Indian / Alaska Native 0% 0% 0% 0%
Asian 3% 3% 2% 0%
African American / Black 17% 19% 3% 5%
Hispanic / Latino 15% 12% 46% 1%
Native Hawaiian / Pacific Islander 0% 0% 0% 0%
Two or more races 3% 3% 5% 1%
White 61% 62% 42% -7%
Note: A dash (-) indicates data were not available. Percentages have been rounded to the nearest whole percent. Industry results include operators, programmers, and suppliers.
*Industry trends are calculated based on the 19 organizations that participated in both the 2015 and 2017 NAMIC AIM surveys. Values have been rounded to the nearest whole percentage point.
Table 12 Technology Non-Management: Race/Ethnicity
2017 Industry
2017 Multi-System Operators
2017 Programmers
Industry percentage point change from 2015*
American Indian / Alaska Native 1% 1% 0% 0%
Asian 6% 5% 12% -2%
African American / Black 12% 13% 10% 2%
Hispanic / Latino 13% 14% 10% 1%
Native Hawaiian / Pacific Islander 0% 0% 0% 0%
Two or more races 2% 2% 1% 1%
White 66% 66% 67% -2%
Note: A dash (-) indicates data were not available. Percentages have been rounded to the nearest whole percent. Industry results include operators, programmers, and suppliers.
*Industry trends are calculated based on the 19 organizations that participated in both the 2015 and 2017 NAMIC AIM surveys. Values have been rounded to the nearest whole percentage point.

24 252017 CABLE AND COMMUNICATIONS INDUSTRY MULTI-ETHNIC DIVERSITY REPORT
MANAGEMENT JOBS
Call Center/Customer Support Management. Thirty-six percent of call center/customer support management employees in the industry are people of color (see Table 2). Survey-over-survey participants experienced a two percentage point decrease in the representation of people of color in these roles over the past two years. African Americans/Blacks currently represent 20% of
call center/customer support managers (see Table 13). Hispanics/Latinos represent 10% of call center/customer support managers, and Asians represent 3% of call center/customer support managers.
These results are primarily reflective of multi-system operators. For survey-over-survey participants, African Americans/Blacks experienced a considerable decrease in representation of four percentage points over the past two years.
Technology Management. Thirty-two percent of technology managers are people of color (see Table 2). The representation of people of color among technology managers increased by six percentage points since 2015 for survey-over-survey participants. The representation of people of color for programmers (30%) is a bit lower than the representation of people of color for multi-system operators (32%). African Americans/Blacks and
Hispanics/Latinos are similarly represented at 12% and 11% of technology managers, respectively (see Table 14). Asians represent 6% of technology managers. For survey-over-survey participants, African Americans/Blacks and Hispanics/Latinos both experienced four percentage point increases in representation over the past two years, while Asians saw a two percentage point decrease.
Table 13 Call Center/Customer Support Management: Race/Ethnicity
2017 Industry
2017 Multi-System Operators
2017 Programmers
Industry percentage point change from 2015*
American Indian / Alaska Native 0% 0% – 0%
Asian 3% 3% – 1%
African American / Black 20% 21% – -4%
Hispanic / Latino 10% 11% – 1%
Native Hawaiian / Pacific Islander 0% 0% – 0%
Two or more races 2% 2% – 0%
White 64% 63% – 2%
Note: A dash (-) indicates data were not available. Percentages have been rounded to the nearest whole percent. Industry results include operators, programmers, and suppliers.
*Industry trends are calculated based on the 19 organizations that participated in both the 2015 and 2017 NAMIC AIM surveys. Values have been rounded to the nearest whole percentage point.
Table 14Technology Management: Race/Ethnicity
2017 Industry
2017 Multi-System Operators
2017 Programmers
Industry percentage point change from 2015*
American Indian / Alaska Native 1% 1% 0% 0%
Asian 6% 5% 13% -2%
African American / Black 12% 13% 7% 4%
Hispanic / Latino 11% 12% 9% 4%
Native Hawaiian / Pacific Islander 0% 0% 0% 0%
Two or more races 1% 2% 1% 1%
White 68% 68% 70% -6%
Note: A dash (-) indicates data were not available. Percentages have been rounded to the nearest whole percent. Industry results include operators, programmers, and suppliers.
*Industry trends are calculated based on the 19 organizations that participated in both the 2015 and 2017 NAMIC AIM surveys. Values have been rounded to the nearest whole percentage point.
26 272017 CABLE AND COMMUNICATIONS INDUSTRY MULTI-ETHNIC DIVERSITY REPORT
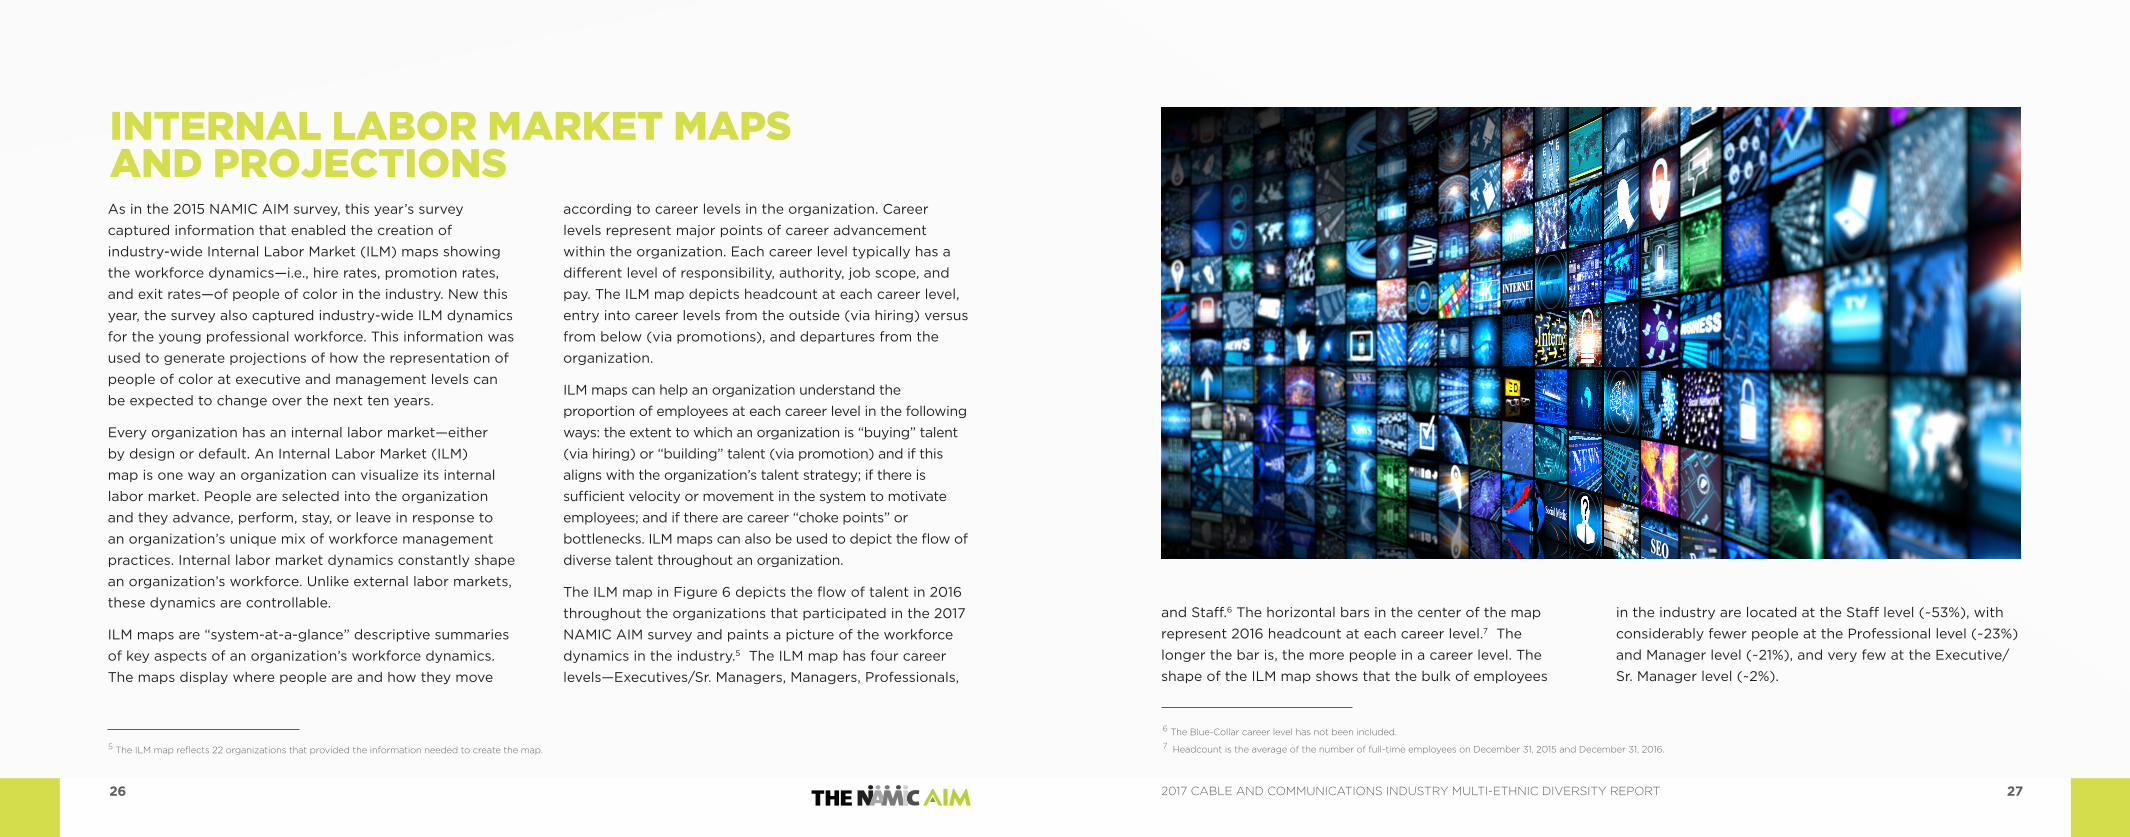
INTERNAL LABOR MARKET MAPS AND PROJECTIONSAs in the 2015 NAMIC AIM survey, this year’s survey captured information that enabled the creation of industry-wide Internal Labor Market (ILM) maps showing the workforce dynamics—i.e., hire rates, promotion rates, and exit rates—of people of color in the industry. New this year, the survey also captured industry-wide ILM dynamics for the young professional workforce. This information was used to generate projections of how the representation of people of color at executive and management levels can be expected to change over the next ten years.
Every organization has an internal labor market—either by design or default. An Internal Labor Market (ILM) map is one way an organization can visualize its internal labor market. People are selected into the organization and they advance, perform, stay, or leave in response to an organization’s unique mix of workforce management practices. Internal labor market dynamics constantly shape an organization’s workforce. Unlike external labor markets, these dynamics are controllable.
ILM maps are “system-at-a-glance” descriptive summaries of key aspects of an organization’s workforce dynamics. The maps display where people are and how they move
according to career levels in the organization. Career levels represent major points of career advancement within the organization. Each career level typically has a different level of responsibility, authority, job scope, and pay. The ILM map depicts headcount at each career level, entry into career levels from the outside (via hiring) versus from below (via promotions), and departures from the organization.
ILM maps can help an organization understand the proportion of employees at each career level in the following ways: the extent to which an organization is “buying” talent (via hiring) or “building” talent (via promotion) and if this aligns with the organization’s talent strategy; if there is sufficient velocity or movement in the system to motivate employees; and if there are career “choke points” or bottlenecks. ILM maps can also be used to depict the flow of diverse talent throughout an organization.
The ILM map in Figure 6 depicts the flow of talent in 2016 throughout the organizations that participated in the 2017 NAMIC AIM survey and paints a picture of the workforce dynamics in the industry.5 The ILM map has four career levels—Executives/Sr. Managers, Managers, Professionals,
and Staff.6 The horizontal bars in the center of the map represent 2016 headcount at each career level.7 The longer the bar is, the more people in a career level. The shape of the ILM map shows that the bulk of employees
in the industry are located at the Staff level (~53%), with considerably fewer people at the Professional level (~23%) and Manager level (~21%), and very few at the Executive/Sr. Manager level (~2%).
5 The ILM map reflects 22 organizations that provided the information needed to create the map.
6 The Blue-Collar career level has not been included. 7 Headcount is the average of the number of full-time employees on December 31, 2015 and December 31, 2016.

28 292017 CABLE AND COMMUNICATIONS INDUSTRY MULTI-ETHNIC DIVERSITY REPORT
The ILM map in Figure 7 shows the flow of young professionals throughout the industry in 2016.11 Similar to the overall industry ILM map, the shape of the ILM map for young professional shows that the bulk of young
professional employees in the industry are located at the Staff level (~66%), with considerably fewer at the Professional level (~22%) and Manager level (~11%), and very few at the Executive/Sr. Manager level (<1%).
11 Young professionals comprise employees born on or after January 1, 1981. The ILM map for young professionals reflects 21 organizations that provided the information needed to create the map. The Blue-Collar career level has not been included.
Figure 7. Young Professional Internal Labor Market Map. The ILM map reflects 21 organizations that provided the information needed to create the map. The map does not include blue collar workers.
Figure 6. Internal Labor Market Map. The ILM map reflects 22 organizations that provided the information needed to create the map. The map excludes blue collar workers.
Managers
Professionals
Overall
7.0%
20.8%
32.7%
24.0% 2.0%Active Headcount: 207,256
12.3%
22.6%
32.9%
25.7%
6.8%Executives/Senior Managers 14.9%3,387
Career Level Total Hires Active Headcounts, Total Promotions and Representation (%) Total Exits
The blue bars between career levels indicate 2016 promotion rates.8 There is limited upward mobility out of the Staff level (1.8% promotion rate), slightly more movement from the Professional level to the Manager level (3.6% promotion rate), and very limited movement into the Executive/Sr. Manager level (1.1% promotion rate). The green bars on the left-hand side of the map indicate the
2016 hire rate at each career level.9 Hire rates are higher at lower levels, suggesting that the primary ports of entry into the industry are at the Staff and Professional levels. The red bars on the right-hand side of the map indicate the 2016 exit rate at each career level.10 As we typically see for organizations and industries, exit rates are higher at lower levels of the career hierarchy.
8 Promotion rate is the number of promotions from one level to the next, divided by the headcount in the originating level. 9 Hire rate is the number of hires into a level, divided by the headcount at that level. 10 Exit rate is the number of exits at each level, divided by the headcount at that level.
14.5%Executives/Senior Managers
Managers
Professionals
11.8%
33.5%
52.6%
10.2%
12.5%
28.4%
45.5 %
Overall 43.6% 3.0%Active Headcount: 72,289 25.7%
118
47,855
Career Level Total Hires Active Headcounts, Total Promotions and Representation (%) Total Exits
1.1%
4,450
48,510
3.6%
110,860
1.8%
2.3%
5.3%
16,137
2.3%
8,180
30 312017 CABLE AND COMMUNICATIONS INDUSTRY MULTI-ETHNIC DIVERSITY REPORT
11.3% 5.4%
Career Level Total Hires Active Headcounts, Total Promotions and Representation (%) Total Exits
Executives/Senior Managers
Managers
Professionals
Staff
Overall
8.2% 6.3%
26.7% 17.2%
37.7% 27.3%
627 2,734
12,491 31,835
17,067 31,141
53,581 56,987
30.9% 18.8% Active Headcount: 83,765 | 122,697 1.8% | 2.3%
19% | 81%
28% | 72%
35% | 65%
48% | 52%
41% | 59%
13.6% 15.0%
13.3% 11.8%
26.0% 20.6%
36.6% 29.1%
30.8% 22.2%
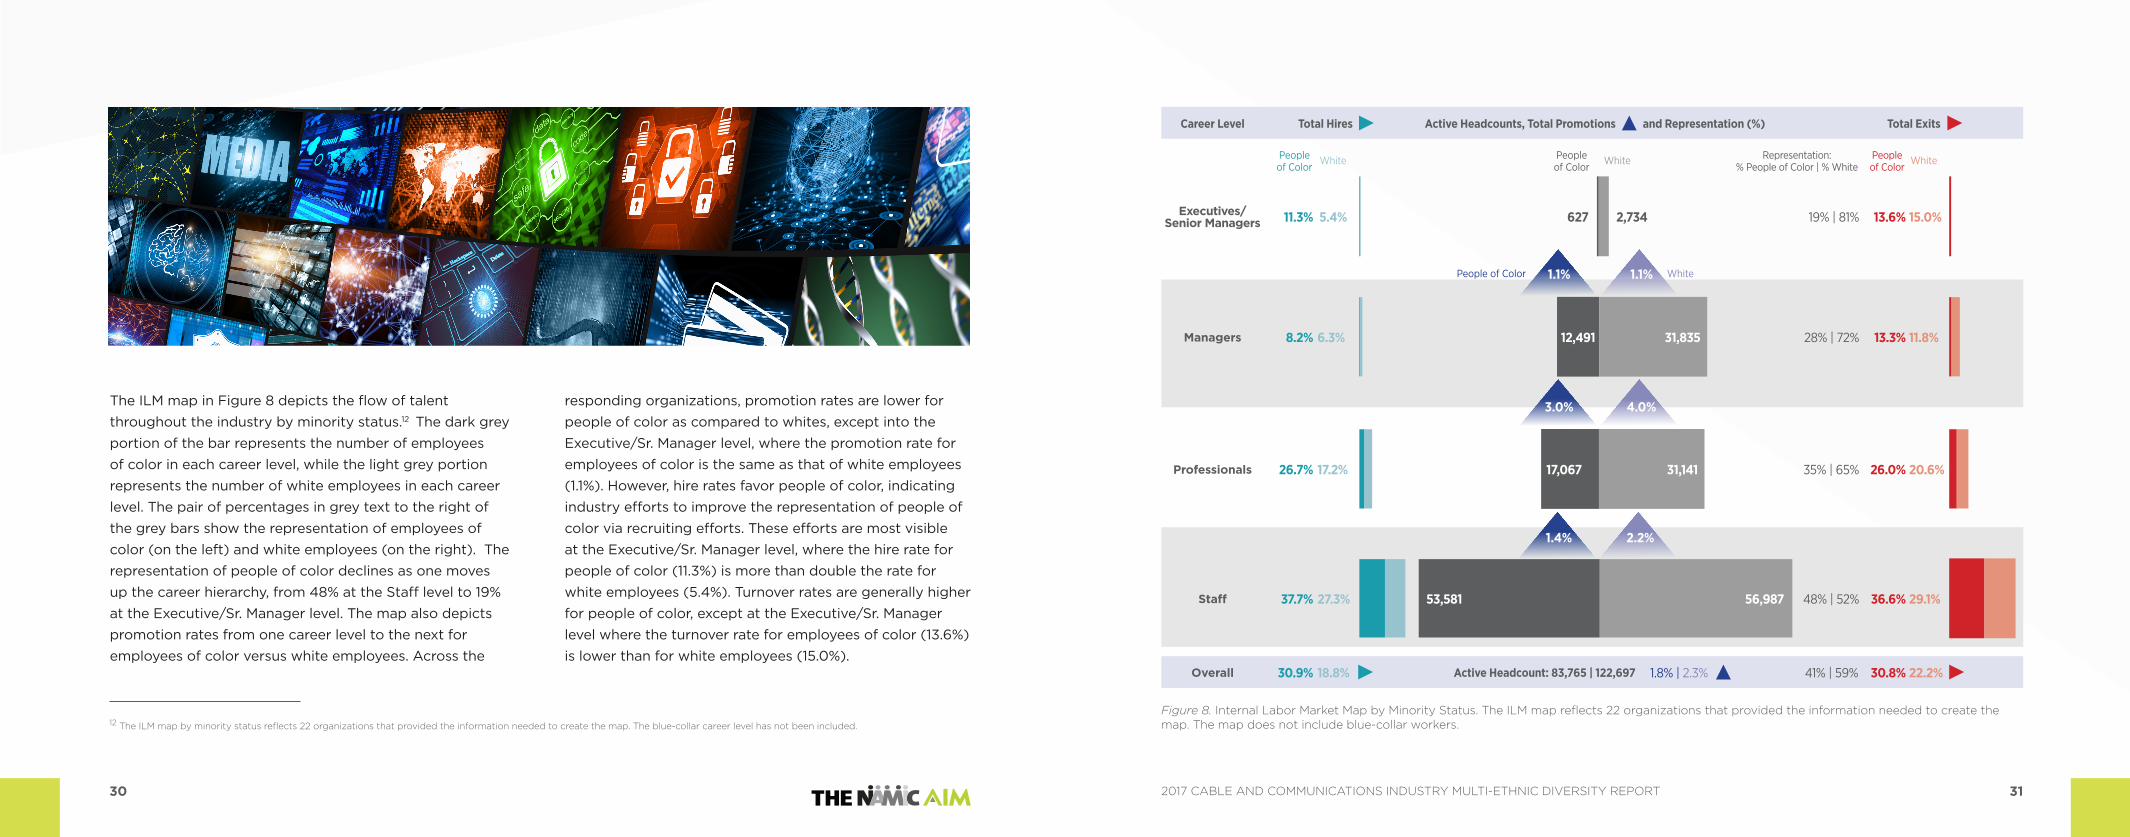
Figure 8. Internal Labor Market Map by Minority Status. The ILM map reflects 22 organizations that provided the information needed to create the map. The map does not include blue-collar workers.12 The ILM map by minority status reflects 22 organizations that provided the information needed to create the map. The blue-collar career level has not been included.
The ILM map in Figure 8 depicts the flow of talent throughout the industry by minority status.12 The dark grey portion of the bar represents the number of employees of color in each career level, while the light grey portion represents the number of white employees in each career level. The pair of percentages in grey text to the right of the grey bars show the representation of employees of color (on the left) and white employees (on the right). The representation of people of color declines as one moves up the career hierarchy, from 48% at the Staff level to 19% at the Executive/Sr. Manager level. The map also depicts promotion rates from one career level to the next for employees of color versus white employees. Across the
responding organizations, promotion rates are lower for people of color as compared to whites, except into the Executive/Sr. Manager level, where the promotion rate for employees of color is the same as that of white employees (1.1%). However, hire rates favor people of color, indicating industry efforts to improve the representation of people of color via recruiting efforts. These efforts are most visible at the Executive/Sr. Manager level, where the hire rate for people of color (11.3%) is more than double the rate for white employees (5.4%). Turnover rates are generally higher for people of color, except at the Executive/Sr. Manager level where the turnover rate for employees of color (13.6%) is lower than for white employees (15.0%).
Peopleof Color
White People of Color
White Representation:% People of Color | % White
Peopleof Color
White
People of Color White1.1% 1.1%
3.0% 4.0%
1.4% 2.2%
32 332017 CABLE AND COMMUNICATIONS INDUSTRY MULTI-ETHNIC DIVERSITY REPORT
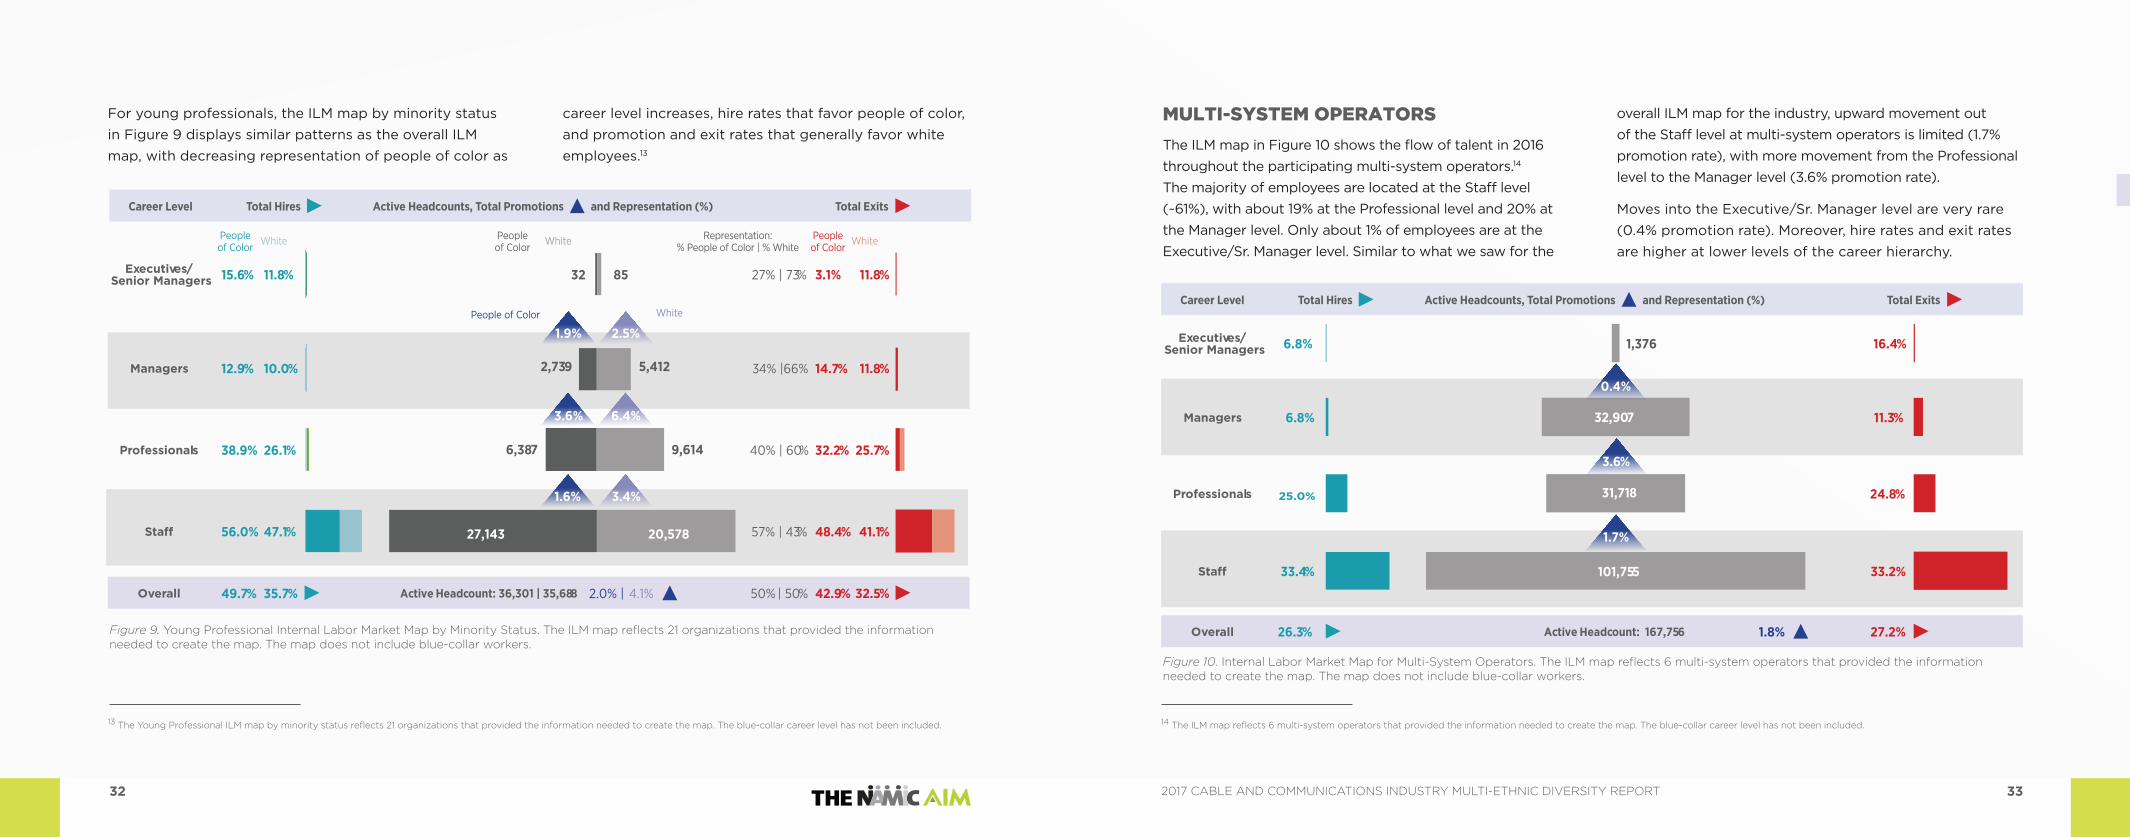
MULTI-SYSTEM OPERATORS
The ILM map in Figure 10 shows the flow of talent in 2016 throughout the participating multi-system operators.14 The majority of employees are located at the Staff level (~61%), with about 19% at the Professional level and 20% at the Manager level. Only about 1% of employees are at the Executive/Sr. Manager level. Similar to what we saw for the
overall ILM map for the industry, upward movement out of the Staff level at multi-system operators is limited (1.7% promotion rate), with more movement from the Professional level to the Manager level (3.6% promotion rate).
Moves into the Executive/Sr. Manager level are very rare (0.4% promotion rate). Moreover, hire rates and exit rates are higher at lower levels of the career hierarchy.
14 The ILM map reflects 6 multi-system operators that provided the information needed to create the map. The blue-collar career level has not been included.
For young professionals, the ILM map by minority status in Figure 9 displays similar patterns as the overall ILM map, with decreasing representation of people of color as
career level increases, hire rates that favor people of color, and promotion and exit rates that generally favor white employees.13
Figure 9. Young Professional Internal Labor Market Map by Minority Status. The ILM map reflects 21 organizations that provided the information needed to create the map. The map does not include blue-collar workers.
13 The Young Professional ILM map by minority status reflects 21 organizations that provided the information needed to create the map. The blue-collar career level has not been included.
Figure 10. Internal Labor Market Map for Multi-System Operators. The ILM map reflects 6 multi-system operators that provided the information needed to create the map. The map does not include blue-collar workers.
15.6% 11.8% 32 85Executives/Senior Managers
Managers
Professionals
Overall
12.9% 10.0%
38.9% 26.1%
56.0% 47.1%
49.7% 35.7% Active Headcount: 36,301 | 35,688 2.0% | 4.1%
27% | 73%
34% |66%
40% | 60%
57% | 43%
50% | 50%
3.1% 11.8%
14.7% 11.8%
32.2% 25.7%
48.4% 41.1%
42.9% 32.5%
2,739 5,412
6,387 9,614
27,143 20,578
Career Level Total Hires Active Headcounts, Total Promotions and Representation (%) Total Exits
6.8%Executives/Senior Managers
Managers
Professionals
6.8%
25.0%
33.4%
16.4%
11.3%
24.8%
33.2%
Overall 26.3% 1.8%Active Headcount: 167,756 27.2%
1,376
32,907
31,718
101,755
Career Level Total Hires Active Headcounts, Total Promotions and Representation (%) Total Exits
Peopleof Color
White People of Color
White Representation:% People of Color | % White
Peopleof Color
White
People of Color White
1.9% 2.5%
3.6% 6.4%
1.6% 3.4%
0.4%
3.6%
1.7%

34 352017 CABLE AND COMMUNICATIONS INDUSTRY MULTI-ETHNIC DIVERSITY REPORT
Figure 11 shows the young professional ILM map for multi-system operators in 2016.15 Similar to the overall multi-system operators ILM map, the shape of the young professional ILM map shows that the bulk of young professional employees
among multi-system operators are located at the Staff level (~74%), with considerably fewer young professionals at the Professional level (~16%) and Manager level (~10%), and very few at the Executive/Sr. Manager level (<1%).
Figure 11. Young Professional Internal Labor Market Map for Multi-System Operators. The ILM map reflects 5 multi-system operators that provided the information needed to create the map. The map does not include blue-collar workers.
15 The young professional ILM map reflects 5 multi-system operators that provided the information needed to create the map. The blue-collar career level has not been included.
The ILM map in Figure 12 depicts the flow of employees of color and white employees in 2016 for multi-system operators.16 The map shows that the representation of employees of color is lower at higher career levels, ranging from 49% at the Staff level to 14% at the Executive/Sr. Manager level. Hire rates are greater for employees of color as compared to white employees at
all levels. The promotion rate for employees of color is lower than the promotion rate for white employees at each career level. Moreover, across almost all levels exit rates are higher for employees of color than for white employees, except at the Executive/Sr. Manager level, where people of color leave at lower rates than white employees (12.2% vs. 16.8%).
Figure 12. Internal Labor Market Map for Multi-System Operators by Minority Status. The ILM map reflects 6 multi-system operators that provided the information needed to create the map. The map does not include blue-collar workers.
16 The ILM map by minority status reflects 6 multi-system operators that provided the information needed to create the map. The blue-collar career level has not been included.
30.8%Executives/Senior Managers
Managers
Professionals
10.4%
41.0%
53.4%
10.3%
10.8%
33.2%
45.7 %
Overall 47.3% 2.3%Active Headcount: 59,365 40.4%
20
5,681
9,442
44,224
Career Level Total Hires Active Headcounts, Total Promotions and Representation (%) Total Exits
10.7% 5.5%Executives/Senior Managers
Managers
Professionals
Overall
7.7% 6.2%
32.5%
38.8% 27.4%
People of Color White
33.6% 20.5% Active Headcount: 70,462 | 96,903 1.7% | 2.0%
14% | 86%
28% | 72%
35% | 65%
49% | 51%
42% | 58%
12.2% 16.8%
12.0%10.9%
28.9% 22.4%
37.1% 29.1%
32.4% 23.1%
197 1,177
0.3% 0.4%
9,340 23,493
11,179 20,390
49,747 51,844
3.4% 3.9%
1.5% 2.0%
Career Level Total Hires Active Headcounts, Total Promotions and Representation (%) Total Exits
20.4%
Peopleof Color
White People of Color
White Representation:% People of Color | % White
Peopleof Color
White0.1%
4.9%
2.0%

36 372017 CABLE AND COMMUNICATIONS INDUSTRY MULTI-ETHNIC DIVERSITY REPORT
Figure 13 contains the 2016 young professional ILM map for multi-system operators by minority status.17 The ILM map patterns of the young professionals by minority status are similar to those observed among the overall
multi-system operators by minority status. Specifically, hire rates and exit rates tend to be higher for young professional people of color, while promotion rates tend to be lower.
Figure 13. Young Professional Internal Labor Market Map for Multi-System Operators by Minority Status. The ILM map reflects 5 multi-system operators that provided the information needed to create the map. The map does not include blue-collar workers.
17 The young professional ILM map by minority status reflects 5 multi-system operators that provided the information needed to create the map. The blue-collar career level has not been included.
PROGRAMMERS
The ILM map in Figure 14 shows the flow of talent in 2016 throughout the participating programming organizations.18 Unlike the ILM map for the industry overall and the ILM map for multi-system operators, the largest career level for programmers is the Professional level (~41%) rather than the Staff level. The Staff level among programmers contains roughly 24% of
employees and the Manager level contains about 31%.
The remaining employees are at the Executive/Sr. Manager level (~5%). Moreover, unlike the overall ILM map and the multi-system operators ILM map where upward movement out of the Staff level is very limited, for programmers, the promotion rate out of the Staff level into the Professional level is comparable to the promotion rates in more senior levels of the hierarchy.
Figure 14. Internal Labor Market Map for Programmers. The ILM map reflects 13 programmers that provided the information needed to create the map. The map does not include blue-collar workers.
18 The ILM map reflects 13 programmers that provided the information needed to create the map. The blue-collar career level has not been included.
7.7%Executives/Senior Managers
Managers
Professionals
8.0%
14.7%
27.7%
14.6%
14.8%
17.4%
24.9%
Overall 15.4% 3.4%Active Headcount: 33,551 18.2%
1,652
Career Level Total Hires Active Headcounts, Total Promotions and Representation (%) Total Exits18.2% 28.6%Executives/
Senior Managers
Managers
Professionals
Overall
10.6% 8.6%
46.1% 30.7%
57.0% 47.4%
52.6% 39.0% Active Headcount: 31,598 | 27,599 1.7% | 3.1%
28% | 72%
35% |65%
43% | 57%
58% | 42%
53% | 47%
0.0% 7.1%
12.4% 9.7%
36.7% 30.3%
48.5%41.1%
44.7%34.8%
6 14
1,998 3,666
4,034 5,356
25,561 18,564
Career Level Total Hires Active Headcounts, Total Promotions and Representation (%) Total Exits
Peopleof Color
White People of Color
White Representation:% People of Color | % White
Peopleof Color
White
People of Color White
0.2% 0.0%
3.7% 5.9%
1.5% 2.9%
10,310
3.3%
4.0%
13,649
7,942
3.3%

38 392017 CABLE AND COMMUNICATIONS INDUSTRY MULTI-ETHNIC DIVERSITY REPORT
Figure 15 shows that the ILM map for young professional programmers is similarly distributed when compared to the overall programmers ILM map, with the majority of the young professional workforce located at the Professional level (~51%).19 Also similar to the overall programmers ILM map, the promotion rates for young professional programmers at all levels are generally comparable, with
the promotion rate into the Executive/Sr. Manager level slightly higher than the promotion rate into other levels. Patterns of hiring and turnover among young professional programmers also mimic those observed in the overall programmers ILM map, with higher rates of hiring and turnover at lower levels.
Figure 15. Young Professional Internal Labor Market Map for Programmers. The ILM map reflects 13 programmers that provided the information needed to create the map. The map does not include blue-collar workers.
19 The young professional ILM maps reflect 13 programmers that provided the information needed to create the map. The blue-collar career level has not been included.
The ILM map in Figure 16 illustrates the flow of employees of color and white employees for programmers in 2016.20 The representation of employees of color declines moving up the career hierarchy, ranging from 45% at the Staff level to 24% at the Executive/Sr. Manager level. The promotion rate at most levels is higher for white employees than for employees of color, except promotions into the Executive/Sr. Manager level where promotion rates are comparable (3.3% for white employees vs. 3.6%
for employees of color). The exit rate is higher for people of color as compared to white employees at the Manager and Professional levels. On the other hand, the exit rate for people of color is slightly lower than that of white employees at the Executive/Sr. Manager and Staff levels. The hire rate for employees of color at most levels exceeds the hire rate for white employees, except at the Staff level where the white employee hire rate is nearly seven percentage points higher than that of employees of color.
Figure 16. Internal Labor Market Map for Programmers by Minority Status. The ILM map reflects 13 programmers that provided the information needed to create the map. The map does not include blue collar workers.
20 The ILM map by minority status reflects 13 programmers that provided the information needed to create the map. The blue-collar career level has not been included.
10.6%Executives/Senior Managers
Managers
Professionals
15.0%
23.3%
43.9%
9.6%
15.9%
21.4%
33.8%
Overall 27.3% 6.3%Active Headcount: 12,231 23.7%
94
2,437
6,298
3,403
Career Level Total Hires Active Headcounts, Total Promotions and Representation (%) Total Exits
11.2% 6.3%Executives/Senior Managers
Managers
Professionals
Overall
10.3% 7.1%
17.9% 12.7%
24.0% 30.9%
17.6% 14.1% Active Headcount: 11,480 | 21,607 2.6% | 3.9%
24% | 76%
28% | 72%
35% | 65%
45% | 55%
35% | 65%
14.3% 14.7%
16.4% 14.3%
19.2% 16.5%
24.2%25.9%
19.9% 17.5%
392 1,237
2,868 7,344
Career Level Total Hires Active Headcounts, Total Promotions and Representation (%) Total Exits
Peopleof Color
White People of Color
White Representation: % People of Color Peopleof Color
White7.6%
6.0%
6.1%
People of Color White
3.6% 3.3%
2.6% 4.8%
4,704 8,725
3,517 4,301
1.9% 4.4%
40 412017 CABLE AND COMMUNICATIONS INDUSTRY MULTI-ETHNIC DIVERSITY REPORT
Figure 17 displays the young professional ILM flows by minority status for programmers in 2016.21 The patterns observed among programmers overall are similar to the patterns for young professional programmers. Hiring
rates generally favor people of color, promotion rates consistently favor white employees, and turnover rates generally favor white employees.
Figure 17. Young Professional Internal Labor Market Map for Programmers by Minority Status. The ILM map reflects 13 programmers that provided the information needed to create the map. The map does not include blue-collar workers
21 The young professional ILM map by minority status reflects 13 programmers that provided the information needed to create the map. The blue-collar career level has not been included.
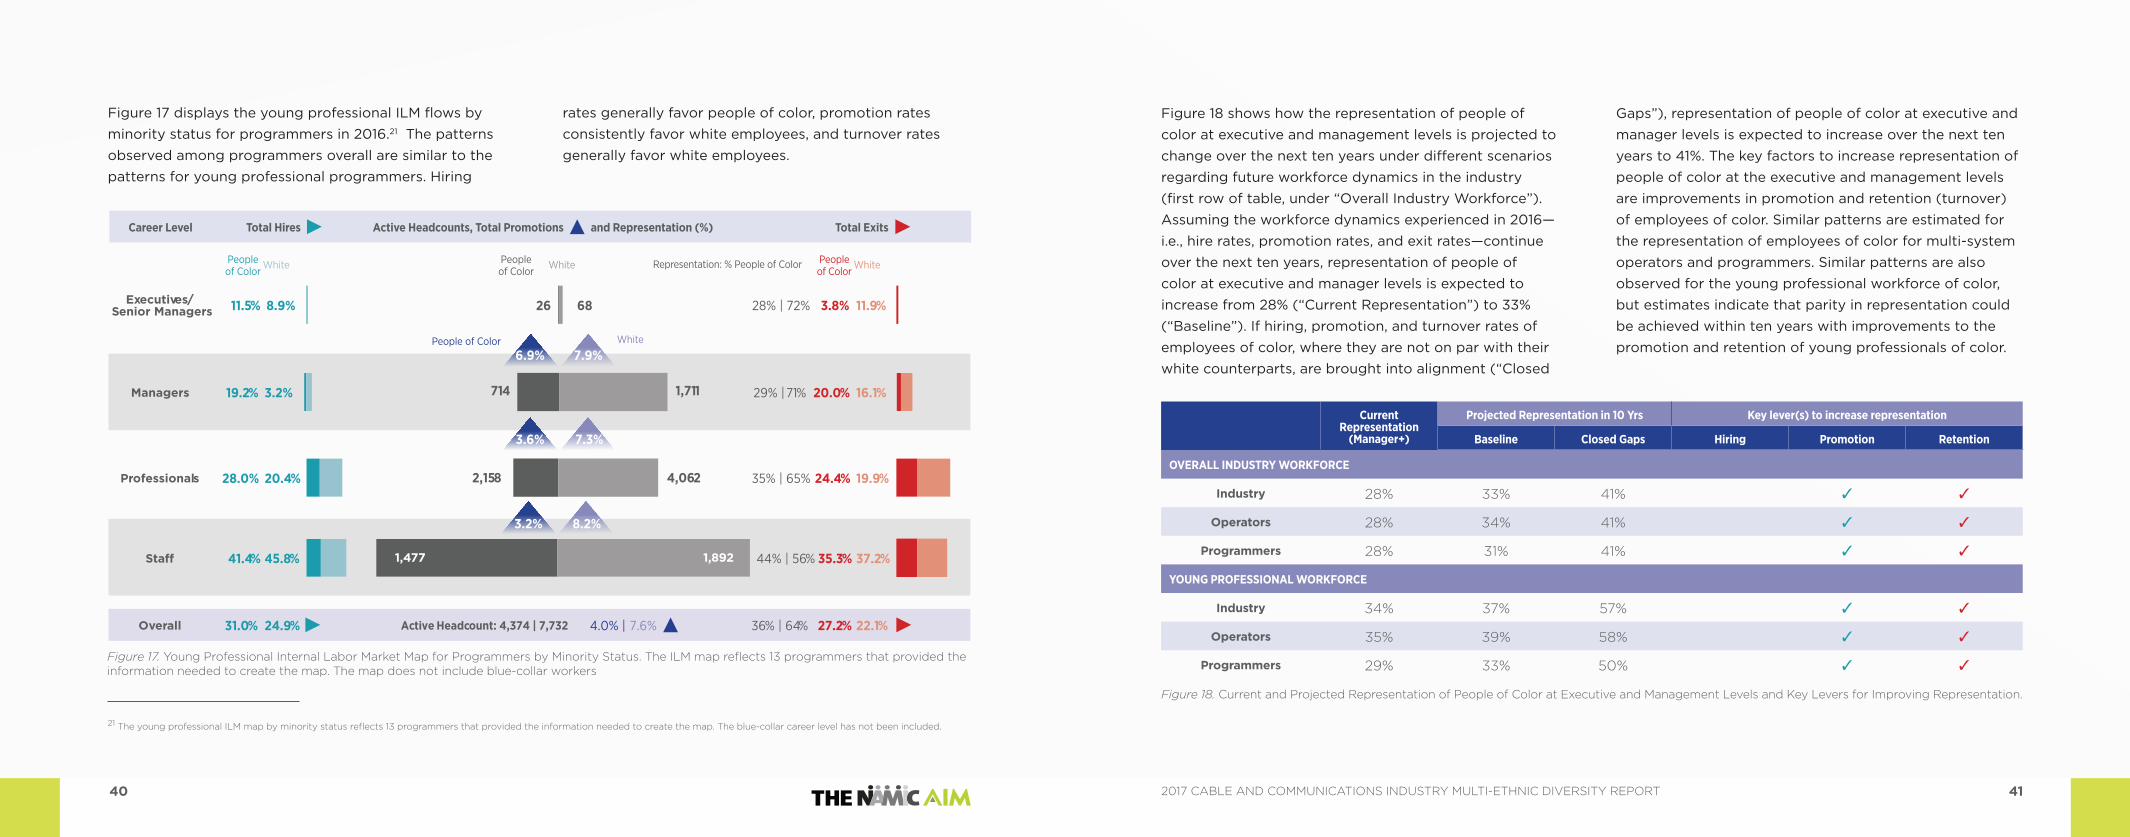
Figure 18 shows how the representation of people of color at executive and management levels is projected to change over the next ten years under different scenarios regarding future workforce dynamics in the industry (first row of table, under “Overall Industry Workforce”). Assuming the workforce dynamics experienced in 2016—i.e., hire rates, promotion rates, and exit rates—continue over the next ten years, representation of people of color at executive and manager levels is expected to increase from 28% (“Current Representation”) to 33% (“Baseline”). If hiring, promotion, and turnover rates of employees of color, where they are not on par with their white counterparts, are brought into alignment (“Closed
Gaps”), representation of people of color at executive and manager levels is expected to increase over the next ten years to 41%. The key factors to increase representation of people of color at the executive and management levels are improvements in promotion and retention (turnover) of employees of color. Similar patterns are estimated for the representation of employees of color for multi-system operators and programmers. Similar patterns are also observed for the young professional workforce of color, but estimates indicate that parity in representation could be achieved within ten years with improvements to the promotion and retention of young professionals of color.
Figure 18. Current and Projected Representation of People of Color at Executive and Management Levels and Key Levers for Improving Representation.
Current Representation
(Manager+)
Projected Representation in 10 Yrs Key lever(s) to increase representation
Baseline Closed Gaps Hiring Promotion Retention
OVERALL INDUSTRY WORKFORCE
Industry 28% 33% 41% ✓ ✓
Operators 28% 34% 41% ✓ ✓
Programmers 28% 31% 41% ✓ ✓
YOUNG PROFESSIONAL WORKFORCE
Industry 34% 37% 57% ✓ ✓
Operators 35% 39% 58% ✓ ✓
Programmers 29% 33% 50% ✓ ✓
11.5% 8.9%Executives/Senior Managers
Managers
Professionals
Overall
19.2% 3.2%
28.0% 20.4%
41.4% 45.8%
31.0% 24.9% Active Headcount: 4,374 | 7,732 4.0% | 7.6%
28% | 72%
29% | 71%
35% | 65%
44% | 56%
36% | 64%
3.8% 11.9%
20.0% 16.1%
24.4% 19.9%
35.3% 37.2%
27.2% 22.1%
26 68
714 1,711
2,158 4,062
Career Level Total Hires Active Headcounts, Total Promotions and Representation (%) Total Exits
Peopleof Color
White People of Color
White Representation: % People of Color Peopleof Color
White
1,477 1,892
People of Color White
6.9% 7.9%
3.6% 7.3%
3.2% 8.2%

42 432017 CABLE AND COMMUNICATIONS INDUSTRY MULTI-ETHNIC DIVERSITY REPORT
DIVERSITY POLICIES AND PRACTICES
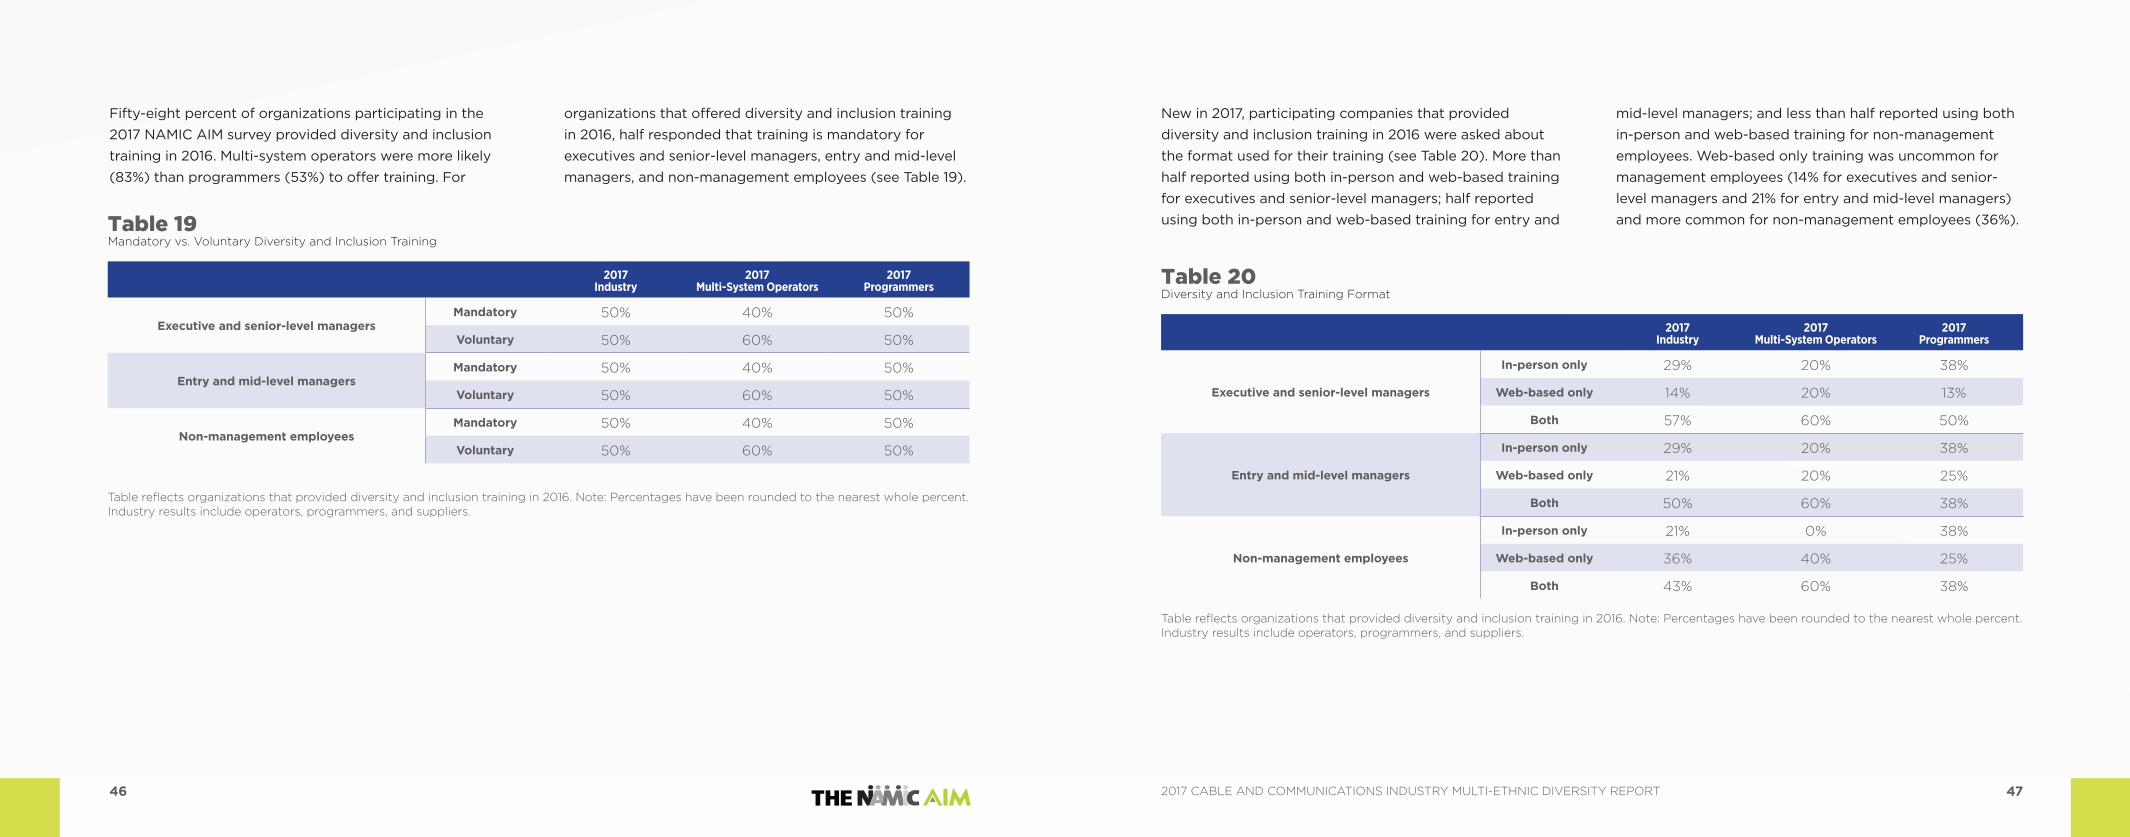
As part of the 2017 NAMIC AIM survey, participating organizations were asked about their diversity policies and practices. The head of HR is most commonly reported as the person responsible for spearheading diversity and inclusion initiatives (60%), followed by the head of diversity & inclusion (30%) and, less frequently, the CEO/President (25%). Note that participants were allowed to provide multiple responses to this question (i.e., identify more than one person who is responsible for spearheading diversity and inclusion initiatives). Thirty-eight percent of responding organizations have staff dedicated exclusively to diversity
and inclusion (see Table 15). The proportion is much higher for multi-system operators (67%) than programmers (33%). For organizations with staff dedicated exclusively to diversity and inclusion, the median number of full-time equivalent employees (FTEs) on staff is 6, although this figure is higher for multi-system operators (7.5 FTEs) than for programmers (6 FTEs). Moreover, 65% of responding organizations have an internal group that focuses on diversity. For organizations with an internal group, almost all of them (93%) report that the group contains a senior executive (i.e., CEO and/or a direct report).
Table 15 Diversity-related Staff and Internal Groups
2017 Industry
2017 Multi-System Operators
2017 Programmers
Organization has staff dedicated exclusively to diversity and inclusion 38% 67% 33%
Median number of full-time equivalent employees (FTEs) on staff dedicated exclusively to diversity and inclusion* 6.0 7.5 6.0
Organization has an internal group that focuses on diversity 65% 67% 71%
If organization has an internal group, senior executive (i.e., CEO and/or direct report) is a member of the group 93% 100% 90%
Note: Percentages have been rounded to the nearest whole percent. Industry results include operators, programmers, and suppliers.*Excludes organizations reporting zero FTEs dedicated exclusively to diversity and inclusion.
New in 2017, participating companies were asked to provide information on how involved or engaged senior executives (i.e., CEO and direct reports) are in diversity and inclusion programs and initiatives (Table 16). Fifty-four percent of responding organizations report that senior executives are “very” or “extremely” involved or engaged in diversity and inclusion programs and initiatives. The rates are roughly the same for multi-system operators and programmers (50% vs. 54%).
The 2017 NAMIC AIM survey collected information from participating organizations on the specific ways in which CEOs in the industry demonstrate support for diversity initiatives (see Table 17). The most common ways that CEOs demonstrate support for diversity initiatives are (1) taking responsibility for signing off on diversity metrics and programs (47%); (2) signing off on supplier diversity goals (37%); and (3) signing off on executive compensation targets tied to diversity (32%). The CEOs of multi-system operators are more likely to engage in most activities surveyed than the CEOs of programmers.Table 16
Extent to which Senior Executives* Are Actively Involved/Engaged in Diversity and Inclusion Practices
2017 Industry
2017 Multi-System
Operators
2017 Programmers
Extremely 29% 33% 27%
Very 25% 17% 27%
Somewhat 38% 50% 33%
Slightly 4% 0% 7%
Not at all 4% 0% 7%
Note: Percentages have been rounded to the nearest whole percent. Industry results include operators, programmers, and suppliers.*Senior executives include CEO and direct reports.
Table 17 Ways in Which CEOs Demonstrate Support for Diversity Initiatives
2017 Industry
2017 Multi-System
Operators
2017 Programmers
Signs off on diversity metrics and programs 47% 50% 50%
Signs off on supplier diversity goals 37% 50% 40%
Signs off on executive compensation targets
tied to diversity32% 50% 20%
Regularly meets with various employee resource groups/
affinity groups26% 33% 20%
Is a member of the diversity council 16% 33% 10%
Note: Percentages have been rounded to the nearest whole percent. Industry results include operators, programmers, and suppliers.
44 452017 CABLE AND COMMUNICATIONS INDUSTRY MULTI-ETHNIC DIVERSITY REPORT
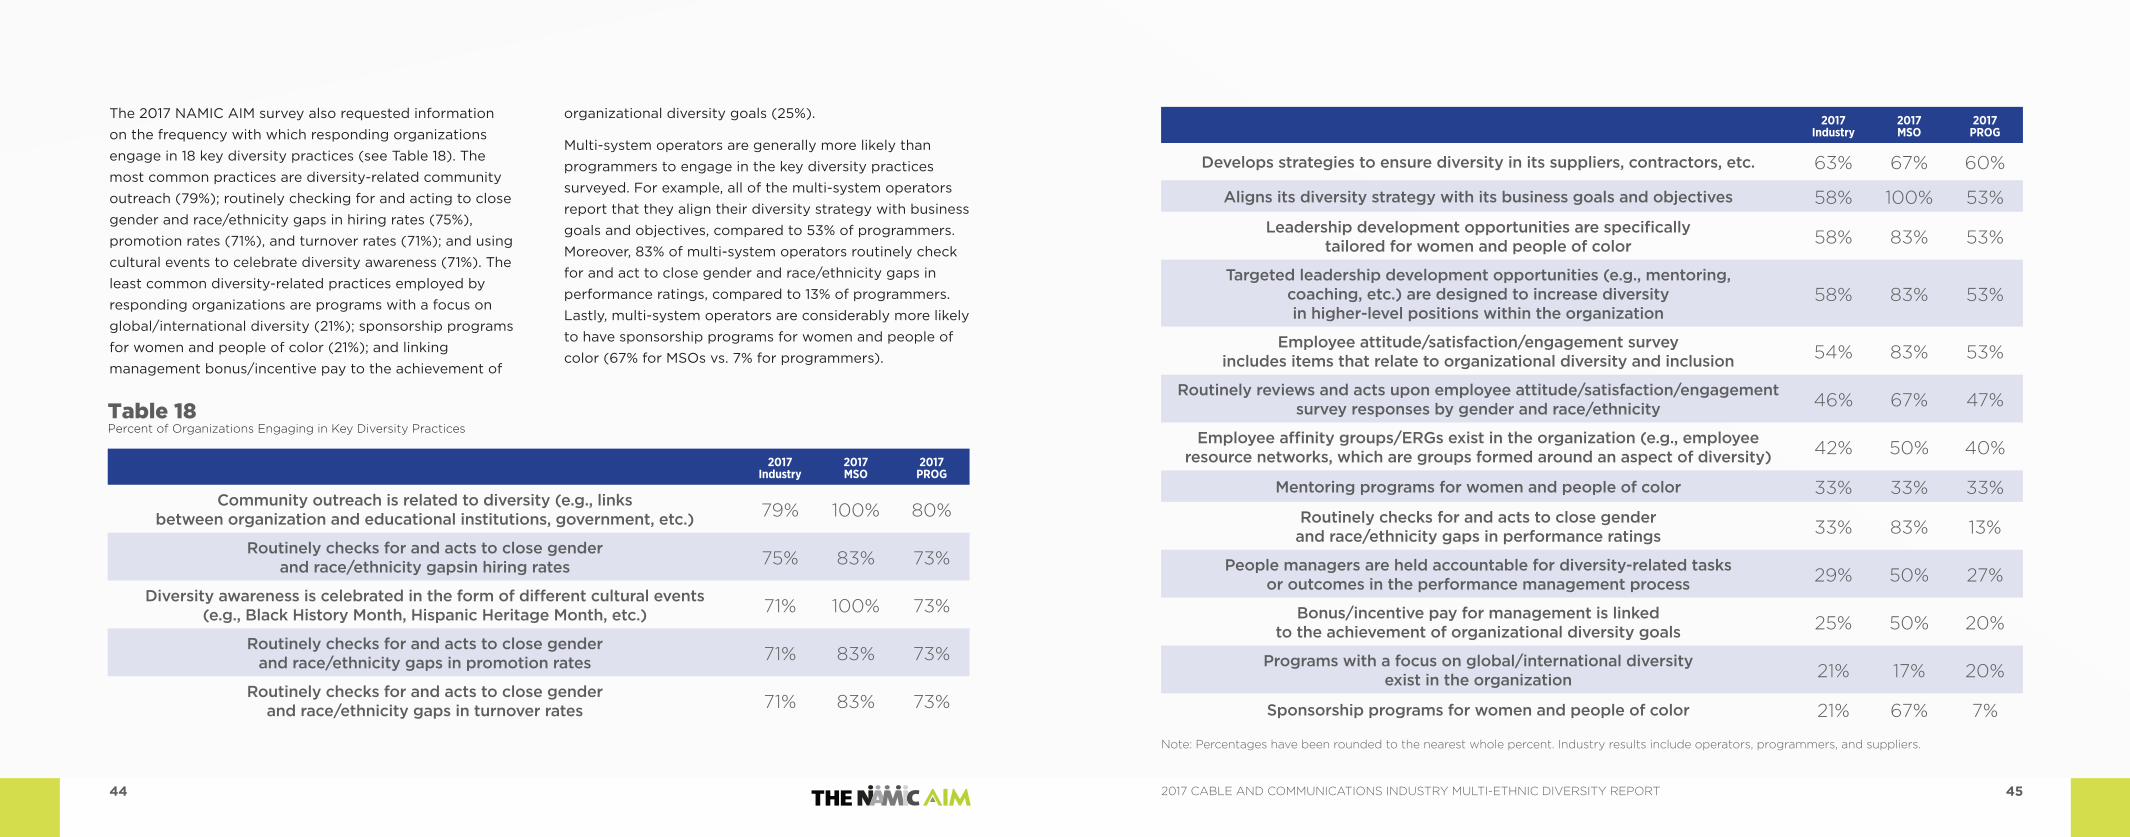
The 2017 NAMIC AIM survey also requested information on the frequency with which responding organizations engage in 18 key diversity practices (see Table 18). The most common practices are diversity-related community outreach (79%); routinely checking for and acting to close gender and race/ethnicity gaps in hiring rates (75%), promotion rates (71%), and turnover rates (71%); and using cultural events to celebrate diversity awareness (71%). The least common diversity-related practices employed by responding organizations are programs with a focus on global/international diversity (21%); sponsorship programs for women and people of color (21%); and linking management bonus/incentive pay to the achievement of
organizational diversity goals (25%).
Multi-system operators are generally more likely than programmers to engage in the key diversity practices surveyed. For example, all of the multi-system operators report that they align their diversity strategy with business goals and objectives, compared to 53% of programmers. Moreover, 83% of multi-system operators routinely check for and act to close gender and race/ethnicity gaps in performance ratings, compared to 13% of programmers. Lastly, multi-system operators are considerably more likely to have sponsorship programs for women and people of color (67% for MSOs vs. 7% for programmers).
Table 18 Percent of Organizations Engaging in Key Diversity Practices
2017 Industry
2017 MSO
2017 PROG
Community outreach is related to diversity (e.g., links between organization and educational institutions, government, etc.) 79% 100% 80%
Routinely checks for and acts to close gender and race/ethnicity gapsin hiring rates 75% 83% 73%
Diversity awareness is celebrated in the form of different cultural events (e.g., Black History Month, Hispanic Heritage Month, etc.) 71% 100% 73%
Routinely checks for and acts to close gender and race/ethnicity gaps in promotion rates 71% 83% 73%
Routinely checks for and acts to close gender and race/ethnicity gaps in turnover rates 71% 83% 73%
Develops strategies to ensure diversity in its suppliers, contractors, etc. 63% 67% 60%
Aligns its diversity strategy with its business goals and objectives 58% 100% 53%
Leadership development opportunities are specifically tailored for women and people of color 58% 83% 53%
Targeted leadership development opportunities (e.g., mentoring, coaching, etc.) are designed to increase diversity in higher-level positions within the organization
58% 83% 53%
Employee attitude/satisfaction/engagement survey includes items that relate to organizational diversity and inclusion 54% 83% 53%
Routinely reviews and acts upon employee attitude/satisfaction/engagement survey responses by gender and race/ethnicity 46% 67% 47%
Employee affinity groups/ERGs exist in the organization (e.g., employee resource networks, which are groups formed around an aspect of diversity) 42% 50% 40%
Mentoring programs for women and people of color 33% 33% 33%
Routinely checks for and acts to close gender and race/ethnicity gaps in performance ratings 33% 83% 13%
People managers are held accountable for diversity-related tasks or outcomes in the performance management process 29% 50% 27%
Bonus/incentive pay for management is linked to the achievement of organizational diversity goals 25% 50% 20%
Programs with a focus on global/international diversity exist in the organization 21% 17% 20%
Sponsorship programs for women and people of color 21% 67% 7%
Note: Percentages have been rounded to the nearest whole percent. Industry results include operators, programmers, and suppliers.
2017 Industry
2017 MSO
2017 PROG
46 472017 CABLE AND COMMUNICATIONS INDUSTRY MULTI-ETHNIC DIVERSITY REPORT
Fifty-eight percent of organizations participating in the 2017 NAMIC AIM survey provided diversity and inclusion training in 2016. Multi-system operators were more likely (83%) than programmers (53%) to offer training. For
organizations that offered diversity and inclusion training in 2016, half responded that training is mandatory for executives and senior-level managers, entry and mid-level managers, and non-management employees (see Table 19).
New in 2017, participating companies that provided diversity and inclusion training in 2016 were asked about the format used for their training (see Table 20). More than half reported using both in-person and web-based training for executives and senior-level managers; half reported using both in-person and web-based training for entry and
mid-level managers; and less than half reported using both in-person and web-based training for non-management employees. Web-based only training was uncommon for management employees (14% for executives and senior-level managers and 21% for entry and mid-level managers) and more common for non-management employees (36%).Table 19
Mandatory vs. Voluntary Diversity and Inclusion Training
2017 Industry
2017 Multi-System Operators
2017 Programmers
Executive and senior-level managersMandatory 50% 40% 50%
Voluntary 50% 60% 50%
Entry and mid-level managersMandatory 50% 40% 50%
Voluntary 50% 60% 50%
Non-management employeesMandatory 50% 40% 50%
Voluntary 50% 60% 50%
Table reflects organizations that provided diversity and inclusion training in 2016. Note: Percentages have been rounded to the nearest whole percent. Industry results include operators, programmers, and suppliers.
Table 20 Diversity and Inclusion Training Format
2017 Industry
2017 Multi-System Operators
2017 Programmers
Executive and senior-level managers
In-person only 29% 20% 38%
Web-based only 14% 20% 13%
Both 57% 60% 50%
Entry and mid-level managers
In-person only 29% 20% 38%
Web-based only 21% 20% 25%
Both 50% 60% 38%
Non-management employees
In-person only 21% 0% 38%
Web-based only 36% 40% 25%
Both 43% 60% 38%
Table reflects organizations that provided diversity and inclusion training in 2016. Note: Percentages have been rounded to the nearest whole percent. Industry results include operators, programmers, and suppliers.

48 492017 CABLE AND COMMUNICATIONS INDUSTRY MULTI-ETHNIC DIVERSITY REPORT
SUPPORT FOR LGBTQ EMPLOYEES
Across respondents, the most common ways in which organizations support LGBTQ employees in the workplace are supervisory training that includes sexual orientation and gender identity as topics (77%), LGBTQ-focused employee affinity groups or ERGs (69%), and a publicized commitment to LGBTQ employees (69%) (see Table 21).
Relatively few organizations have sponsorship programs (8%), mentoring programs (15%), or targeted leadership development programs for LGBTQ employees (23%).
Programmers are considerably more likely to have a senior-level champion for LGBTQ hiring, development, and retention efforts than multi-system operators (44% for programmers vs. 25% for multi-system operators).
SUPPORT RETURN OF VETERANS TO THE CIVILIAN WORKFORCE
The most common ways in which participating organizations support veterans returning to the civilian workforce are through a careers web site that includes a section on veteran recruitment (80%); a public commitment to hire, train, and support veterans (67%); and a senior-level champion for veteran hiring, development, and retention efforts (60%) (see Table 22). Furthermore, almost half of organizations have veteran-focused employee affinity groups/ERGs and almost half
have a dedicated recruiting team. Sponsorship programs designed specifically for veterans are relatively uncommon (20%) and no participating organizations report having targeted leadership development programs for veterans. Sixty percent of the responding multi-system operators have veteran-focused mentoring programs, compared to 22% of programmers. Moreover, 60% of multi-system operators have dedicated recruiting team for veterans, compared to 44% of programmers. Programmers are more likely than multi-system operators to have veteran-focused employee affinity groups or ERGs (56% vs. 40%).
Table 21 Ways in which organizations support LGBTQ employees in the workplace
2017 Industry
2017 MSO
2017 PROG
Supervisory training includes sexual orientation and gender identity as topics 77% 75% 78%
Employee affinity groups/ERGs 69% 75% 67%
Publicized commitment to LGBTQ employees 69% 50% 78%
Senior-level champion for LGBTQ hiring, development, and retention efforts 38% 25% 44%
Targeted leadership development programs 23% 0% 33%
Mentoring programs 15% 25% 11%
Sponsorship programs 8% 25% 0%
Note: Percentages have been rounded to the nearest whole percent. Industry results include operators, programmers, and suppliers.
Table 22 Ways in which organizations support return of veterans to the civilian workforce
2017 Industry
2017 MSO
2017 PROG
Careers web site includes section on veteran recruitment 80% 80% 89%
Public commitment to hire, train, and support veterans 67% 80% 56%
Senior-level champion for veteran hiring, development, and retention efforts 60% 60% 67%
Dedicated recruiting team 47% 60% 44%
Employee affinity groups/ERGs 47% 40% 56%
Internal training program designed specifically for veterans 33% 40% 33%
Mentoring programs 33% 60% 22%
Sponsorship programs 20% 20% 22%
Targeted leadership development programs 0% 0% 0%
Note: Percentages have been rounded to the nearest whole percent. Industry results include operators, programmers, and suppliers.

50 512017 CABLE AND COMMUNICATIONS INDUSTRY MULTI-ETHNIC DIVERSITY REPORT
SUPPORT FOR PEOPLE WITH DISABILITIES
Sixty-four percent of responding organizations have a public commitment to hire, train, and support people with disabilities (see Table 23). Moreover, half of organizations have a careers web site that includes a section on recruitment for people with disabilities and 43% have a recruiting team dedicated to people with disabilities. No participating organizations have targeted leadership development programs for people with disabilities or
sponsorship programs. Across most of the support mechanisms surveyed, multi-system operators are more likely to offer support to people with disabilities.
For example, 80% of multi-system operators have a public commitment to hire, train, and support people with disabilities, compared to 50% of programmers. Moreover, 60% of multi-system operators have a dedicated recruiting team for people with disabilities, compared to 38% of programmers.
HOW DOES THE CABLE INDUSTRY COMPARE TO OTHERS?Exit rates are higher in the cable industry when compared to the typical organization in the US and Canada based on Mercer’s When Women Thrive research.22 The NAMIC AIM survey shows that the exit rate at the staff level in the cable industry is 33%. The rate for the typical organization in the US and Canada is less than 20%. At the professional level, the exit rate in the cable industry is 23%. The rate for the typical organization in the US and Canada is roughly ten percentage points lower. At the manager level, the exit rate in the cable industry is roughly comparable to the typical organization in the US and Canada. At the executive and senior manager level, however, the exit rate is higher in the cable industry. While the 2017 NAMIC AIM research demonstrates that increasing the representation of people of color at management levels in the cable industry will require organizations to focus on retaining people of color at higher rates, retention appears to be a broader issue in the industry.
Given the high exit rates in the cable industry, especially at lower career levels, it’s not surprising that hire rates at the staff and professional levels in the cable industry exceed those of the typical organization in the US and Canada. Hire rates at management levels in the cable industry are comparable to the typical organization. Moreover, promotion opportunities in the cable industry are more limited compared to the typical organization in the US and Canada. The typical company participating in Mercer’s When Women Thrive research has annual promotion rates in the 6%-10% range and these are generally consistent across career levels. As noted earlier in the report, promotion rates in the cable industry are low, with rates less than 2% at the staff and manager levels and less than 4% at the professional level. These low promotion rates may make it more challenging to create a diverse workforce by building talent from within.
22 Mercer. When Women Thrive, Businesses Thrive, 2016, p. 81, available at https://www.mercer.com/our-thinking/when-women-thrive.html
Table 23Ways in which organizations support people with disabilities
2017 Industry
2017 MSO
2017 PROG
Public commitment to hire, train, and support people with disabilities 64% 80% 50%
Careers web site includes section on recruitment for people with disabilities 50% 60% 50%
Dedicated recruiting team 43% 60% 38%
Employee affinity groups/ERGs 36% 40% 38%
Internal training program designed specifically for people with disabilities 29% 20% 38%
Mentoring programs 29% 40% 25%
Senior-level champion for hiring development and retention efforts for people with disabilities 29% 40% 25%
Sponsorship programs 0% 0% 0%
Targeted leadership development programs 0% 0% 0%
Note: Percentages have been rounded to the nearest whole percent. Industry results include operators, programmers, and suppliers

52 532017 CABLE AND COMMUNICATIONS INDUSTRY MULTI-ETHNIC DIVERSITY REPORT
CONCLUSIONS
The 2017 NAMIC AIM Survey reveals that the proportion of full-time employees in the cable and communications industry who are people of color is 40%. The percentage of executives and senior-level managers in the industry who are people of color is 23%, while the percentage of entry and mid-level managers who are people of color is 28%. Moreover, despite lower promotion rates and higher exit rates for people of color, robust hire rates suggest that the percentage of people of color at executive and management levels is expected to increase from its current level of 28% to 30% over the next five years.
Figure 19 shows the five-year industry outlook, assuming recent workforce dynamics persist (i.e., under the “baseline” scenario) and assuming that organizations are able to close gaps in hire, promotion, and turnover rates. If organizations are able to promote and retain people of color at the same rates as their white counterparts, we expect to see further increases in the representation of people of color at executive and management levels over the next five years. Specifically, if organizations are able to close promotion and retention rate gaps, the representation of people of color at executive and management levels is expected to reach 33% in the next five years.
Figure 19. Five-year Industry Outlook: People of Color Representation at Executive and Manager Levels.
New this year, our examination of the young professional workforce has provided insight into the people of color representation of this cohort of the workforce. Higher representation of people of color at executive and management levels is observed among the young professional workforce compared to the overall workforce (34% for young professionals vs. 28% for overall industry) (see Figures 19 and 20). However, the representation of people of color in the industry’s young professional workforce at the executive and management levels is expected to decrease over the next five years (see “baseline” scenario in Figure 20). The key factors to improve the representation of young professionals of color at the executive and manager levels are improvements in promotion and retention of young professionals of color. If organizations are able to promote and retain young professionals of color at the same rates as their white counterparts, we would expect to see increases in the representation of young professionals of color at the executive and manager levels over the next five years (estimated to be 43% in 2021).
The 2017 survey shows that participating companies do a good job recruiting people of color. To improve diversity outcomes, however, companies must also focus on the retention and promotion of people of color. NAMIC will continue to use its education, advocacy, and empowerment resources, along with its solution-building strategic initiatives, to partner with the industry in the goal of continued business success aligned with an increasingly diverse, increasingly knowledgeable workforce and consumer base.
Figure 20. Five-Year Young Professional Industry Outlook: People of Color Representation at Executive and Manager Levels.
Young Professionals: % People of Color, Manager and above
Industry MSOs Programmers
2016 representation
Projected 2021 “baseline” representation
Projected 2021 “adjusted” representation
34% 33%
43% 44%
39%
35% 35%
29% 29%
% People of Color, Manager and above
2016 representation
Projected 2021 “baseline” representation
Projected 2021 “adjusted” representation
Industry MSOs Programmers
28%30%
28%30%
28% 29%
33% 33% 34%

54 552017 CABLE AND COMMUNICATIONS INDUSTRY MULTI-ETHNIC DIVERSITY REPORT
WHAT YOU CAN DO23
Let’s close with a few thoughts on what you can do to advance diversity and inclusion in your organization. First, build a business case for diversity and inclusion that’s unique to your organization. There is no generic business case; it will differ for every company. Reach out to key stakeholder groups (e.g., senior leaders, first-line and middle managers, individual contributors, HR business partners) to learn about their business objectives and where diversity and inclusion issues may be impeding the achievement of these objectives. To earn stakeholders’ support, the business case must show how diversity and inclusion efforts will help them at a personal level. Second, understand the current state of diversity in your organization and where it’s headed. For example, what proportion of your workforce are women, people of color, and other diverse groups? Based on your organization’s recent talent dynamics (e.g., recent hiring, promotion, and
retention trends), how is the representation of diverse talent expected to change over the next 5 or 10 years? Third, identify the cultural dynamics that pose a risk to your organization’s culture of inclusion. Workforce diversity can only be sustained if it is supported by an inclusive culture (defined by values, norms, behaviors, leadership, and organizational practices). Measuring the experiences of employees in your organization—through interviews, surveys, and focus groups—enables you to measure the inclusiveness of your culture. Lastly, engage senior leaders in the development of data-driven diversity and inclusion strategies that are aligned with your organization’s business goals. Visible leadership is vital to successful execution, so look for those who, due to the breadth of their personal networks and respect with which colleagues view them, can be the most credible and powerful allies.
23 The views and opinions expressed in this section are solely those of Mercer. These views and opinions do not necessarily represent those of NAMIC or the Kaitz Foundation.
DEFINITIONS
Advertising Sales – Includes employees in traditional and digital sales.
Blue-Collar – Includes production and / or operations workers.
Board of Directors – Includes a group of individuals elected by stockholders at publicly held companies (or elected by members at some nonprofits) and has governance responsibility for the organization.
Call Center / Customer Support – Employees provide customer-facing support and manage billing, installation, cross-marketing and other communications directly with customers via telephone, e-mail, web-based online chat, fax or other technologies.
Call Center / Customer Support Management – Includes employees who manage call center / customer support employees.
Compressed Workweeks – Allows full-time employees to work longer days for part of the week or pay period in exchange for shorter days, or a day off, each week or pay period.
Creative and / or Content Development – Employees develop and oversee the creation of content, including on-air promotion and production.
Digital Media – Employees develop and operate new content delivery platforms and services, including designing
customer interface and running technology that supports new business, such as websites and distributed content platforms. There may be overlap between this category and IT project management and project development.
Employee Resource Groups (ERGs) – Groups formed around an aspect of diversity within an organization. Enterprise / Business-to-Business Sales and Support – Includes traditional and digital. Executive and Senior-Level Managers – Individuals who plan, direct and formulate policies, set strategy and provide the overall direction of enterprises / organizations for the development and delivery of products or services, within the parameters approved by boards of directors or other governing bodies. Residing in the highest levels of organizations, these executives plan, direct or coordinate activities with the support of subordinate executives and staff managers. They include, in larger organizations, those individuals within two reporting levels of the CEO, whose responsibilities require frequent interaction with the CEO. Examples of these kinds of managers are: chief executive officers, chief operating officers, chief financial officers, line of business heads, presidents or executive vice presidents of functional areas or operating groups, chief information officers, chief human resources officers, chief marketing officers, chief legal officers, management directors and managing partners.

56 572017 CABLE AND COMMUNICATIONS INDUSTRY MULTI-ETHNIC DIVERSITY REPORT
Executive / Senior Managers – Includes employees who determine policy and direction of the organization or a functional area and direct its activities, usually through other managers. They control the selection of senior employees and the allocation of resources.
Entry and Mid-Level Managers – Individuals who serve as managers, other than those who serve as Executive / Senior-Level Officials and Managers, including those who oversee and direct the delivery of products, services or functions at group, regional or divisional levels of organizations. These managers receive directions from the Executive / Senior-Level management and typically lead major business units. They implement policies, programs and directives of executive / senior management through subordinate managers and within the parameters set by Executive / Senior-Level management. Examples of these kinds of managers are: vice presidents and directors, group, regional or divisional controllers, treasurers, human resources, information systems, marketing, and operations managers. Also includes those who report directly to middle managers. These individuals serve at functional, line of business segment or branch levels and are responsible for directing and executing the day-to-day operational objectives of enterprises / organizations, conveying the directions of higher level officials and managers to subordinate personnel and, in some instances, directly supervising the activities of exempt and non-exempt personnel. Examples of these kinds of managers are: first-line managers, team managers, unit managers, operations and production mangers, branch managers, administrative services managers, purchasing and transportation managers, storage and distribution managers, call center or customer service managers, technical support managers, and brand or product managers.
Flextime – Allows employees to choose their work hours within limits established by the employer. Job Sharing – Two or more employees share the responsibilities, accountability, and compensation of one full-time job. Managers – Includes employees who co-ordinate and organize the activities of a discrete unit or service within the organization, usually reporting to a senior manager. They establish operational and administrative procedures, formulate policy relevant to their areas, and organize, lead and direct others to achieve their goals. People of Color – Includes those classified as Hispanic/Latino, African American/Black, Native Hawaiian/Pacific Islander, Asian, American Indian/Alaskan Native, or Two or More Races. Professionals – Most jobs in this category require bachelor and graduate degrees, and / or professional certification. In some instances, comparable experience may establish a person’s qualifications. Most occupations in this group are responsible for professional & technical day-to-day activities of the division / company. In some instances, relevant experience is required in addition to the formal qualification. Senior positions may take team leader roles designed around specialist expertise rather than people management. Examples of these kinds of positions include: accountants and auditors; airplane pilots and flight engineers; architects; artists; chemists; computer programmers; designers; dieticians; editors; engineers; lawyers; librarians; mathematical scientists; natural scientists; registered nurses; physical scientists; physicians and surgeons; social scientists; teachers; and surveyors.
Race / Ethnicity – Excludes those classified as Hispanic/Latino from the six race designations. For example, African American/Black should be interpreted as African American/Black (not Hispanic/Latino) and White should be interpreted as White (not Hispanic/Latino).
Shift Flexibility – Allows employees to coordinate with co-workers to adjust their schedules by trading, dropping, or picking up shifts.
Staff – Includes clerical, operational support and technicians – excluding blue-collar employees. Include employees who perform operational tasks according to specific standards and guidelines. Most occupations in this group require only limited job knowledge or relevant experience.
Technology Non-management – Includes non-management employees who are involved in the integrated planning,
design, optimization and operation of technological products, processes and services. Technology Management – Includes management employees who are involved in the integrated planning, design, optimization and operation of technological products, processes, and services. Terminations – Includes voluntary and involuntary termination, and retirement. Year-end Revenue – Revenue for the latest completed fiscal year, reported in U.S. dollars. Revenue includes total sales, earnings, and all other income (pre-tax), which are found on financial statements. Revenue for U.S. operations only, including its territories, is reported. Young Professionals – Young professionals include employees who were born on or after January 1, 1981.
ADVANCEMENT INVESTMENT MEASUREMENT
DIVERSITYREPORT
2017CABLE AND COMMUNICATIONS INDUSTRY MULTI-ETHNIC
NAMIC INC50 BROAD STREETSUITE 1801NEW YORK, NY 10004
212.594.5985
www.namic.com
#NAMICAIM