diversification, ownership and control of swedish corporations
TRANSCRIPT

{Journals}Eufm/8_3/G174/makeup/G174.3d
Diversification, Ownership and Controlof Swedish Corporations
John A. DoukasDepartment of Finance, School of Business and Public Administration, Old Dominion University,
Norfolk, VA 23529-0218, Stern School of Business, New York University and Cardiff BusinessSchool, Cardiff, UKe-mail: [email protected]
Martin HolmenStockholm University, Stockholm, Swedene-mail: [email protected]
Nickolaos G. Travlos*Athens Laboratory of Business Administration, Athinas Ave. and 2A Areos St, 166 71Vouliagmeni, Athens, Greece, and Cardiff Business School, Cardiff, UKe-mail: [email protected]
Abstract
We study the short- and long-term valuation effects of Swedish takeovers. Using asample of 93 bidding firms that acquired 101 targets between 1980 and 1995, we findthat diversifying acquisitions lead to a negative market reaction and deterioration ofthe operating performance of the bidder. Announcement and performance gains ineach of the three years following the acquisition occur only when bidders expandtheir core rather than their peripheral lines of business. Our findings suggest thatfocused acquisitions lead to greater synergies and operating efficiencies thandiversifying acquisitions. Intra-group acquisitions, however, show that bidders donot realise significant gains whether they adopt diversifying or focusing investmentstrategies by purchasing firms controlled by the Wallenberg and SHB conglomerategroups. Intra-group targets realize significant gains regardless bidder’s investmentstrategy. Finally, the evidence does not support the view that intra-conglomerateacquisitions are associated with expropriation of minority shareholders. However,they appear to enhance the control rights of large shareholders of the bidding firm.
# Blackwell Publishers Ltd 2002, 108 Cowley Road, Oxford OX4 1JF, UK and 350 Main Street, Malden, MA 02148, USA.
European Financial Management, Vol. 8, No. 3, 2002, 281–314
*We would like to thank Larry Lang, the referee, for his valuable suggestions and comments.
We also like to thank Clas Bergstrom and Kristian Rydqvist for generously providing some ofthe data used in this study. We are grateful to Richard Levich, Jianping Mei and PhDWorkshop participants at Stern School of Business, NYU, October 2001, for their insightful
comments. Comments from participants at the ODU Workshop, November 2001, are alsoappreciated. Holmen acknowledges financial support from The Bank of Sweden TercentenaryFoundation. Travlos acknowledges financial support from the Kitty Kyriacopoulos Chair inFinance.
{Journals}Eufm/8_3/G174/makeup/G174.3d
Keywords: conglomerate and non-conglomerate acquisitions; corporate focus;diversification.
JEL classification: G34
1. Introduction
In recent years, an increasing number of empirical studies has documented that theaverage diversified firm trades at a discount than a portfolio of comparable single-segment firms.1 This is in contrast with Alchian (1969), Weston (1970), Williamson(1970, 1975, 1985), Scharfstein and Stein (1996), and Stein (1997) who argue thatcorporate diversification can be motivated by the benefits of creating or expanding theinternal capital markets of the firm.2 Matsasuka and Nanda (1996), and Khanna andPalepu (1997) suggest that the diversification advantages arising from internal capitalmarkets can be even greater in the presence of significant external capital marketconstraints and imperfections. Consistent with this view, Khanna and Palepu (2000)find little evidence of a diversification discount in emerging countries where externalcapital markets constraints and imperfections are plentiful. However, more recentstudies have raised doubts about the findings of the diversification discountliterature.3
Corporate diversification research has primarily focused on US companies withwidely dispersed ownership where agency problems are confined between managersand shareholders. In Europe, however, widely held corporations are in the minority(Faccio and Lang, 2000). European corporations, with the exception of UK, arecharacterised by high concentration of ownership, predominantly in the hands offamilies. Therefore, the agency problem in European firms may have its roots in theexpropriation of outside shareholders by the controlling shareholder. Unlike theprevious literature, this paper explores the intersection of investment decisions andownership structure of Swedish firms where corporate ownership is not as widelydispersed as in other developed countries. In fact 62% of the firms listed in theStockholm Stock Exchange are controlled by a family or a private individual(Agnblad, 2000). Moreover, Sweden has the highest percentage of firms issuing dual
1 See, for example, Lang and Stulz (1994), Berger and Ofek (1995), Servaes (1996), Lins and
Servaes (1999a). An exception is Germany where diversified firms found to trade with zeropercent discount (Lins and Servaes 1999a).2 Recent empirical evidence (Berger and Ofek, 1995; Lamont, 1997; Shin and Stulz, 1998;
Scharfstein 1997; Rajan et al., 2000), however, suggests that the diversification discount is partlyassociated with inefficient cross-subsidization.3 Campa and Kedia (2001) show that diversified firms are valued at a discount before theydiversify, implying that diversification itself does not inevitably produce the discount reported inprevious studies. Similarly, Hyland (1999) shows that conglomerate firms were poor performers
prior to becoming diversified and advocates that diversification is driven by the acquisition ofexternal growth opportunities. Maksimovic and Phillips (2001, 2002) fail to find that non-corebusiness segments are inefficiently protected by headquarters. Billet and Mauer (1998) also
report that internal capital markets transfer funds to financially constrained divisions with goodinvestment opportunities consistent with a well functioning internal capital market. Villalonga(2000) claims that the diversification discount in the US stock market is a data artefact. UsingBITS data, she finds that diversified firms trade at significant average premium.
282 J. A. Doukas, Martin Holmen and N. G. Travlos
# Blackwell Publishers Ltd, 2002

{Journals}Eufm/8_3/G174/makeup/G174.3d
class shares (66.07) in Europe (Faccio and Lang, 2002) used to enhance the control ofthe largest shareholders. Furthermore, Swedish conglomerate groups are some of themost complex organizations with interlocking ownership structures in Europe(LaPorta et al., 1999). There are two dominant conglomerate groups (Wallenbergfamily (SE-Banken) and Handelsbanken (SHB)) in Sweden, operating in a widevariety of industries, with a strikingly high concentration of ownership and controlstructures. These two groups exercise control through their investment companies(closed-end funds) and by having access to a house bank. Thus, in Sweden, the agencyproblem may have its roots in the expropriation of outside shareholders by thecontrolling shareholder. Does this pattern of ownership assist insiders to removecorporate wealth from outside investors when firms engage in the acquisition ofassets? According to Shleifer and Vishny (1997), Bebchuck et al. (1999), Wolfenzon(1999) and Claessens et al. (2000), expropriation possibilities by insiders, throughintra-group transfers of assets and control stakes, increase when the corporation isaffiliated to a group of corporations, controlled by the same shareholder.This unique aspect of Swedish corporate environment presents itself as a testing
ground to examine whether the causes and effects of corporate diversification differbetween conglomerate and non-conglomerate members. We also ask whetherexpropriation of minority shareholders, through wealth-transfers, acts as a motivein intra-group acquisitions. Thus, by examining investment behavior in anenvironment of extraordinary concentration of control, we expect to shed light onwhether corporate pyramids are used for the expropriation of outside shareholders.The purpose of this paper is twofold. First, we test whether the act of corporate
diversification in the Swedish corporate environment increases firm value. Ifdiversification increases firm value by creating internal capital markets, diversifyingacquisitions should be more value increasing and result in post-acquisitionperformance increases than non-diversifying acquisitions. This should be morepronounced in acquisitions by non-conglomerate than conglomerate bidders. Unlikenon-conglomerate related acquisitions that might be motivated by the benefits ofdiversification arising from increased operating and internal capital marketefficiencies, intra-conglomerate acquisitions, focused or diversifying, are likely to bedriven by operating efficiencies rather than internal capital market efficiencies. This ismainly because, diversifying acquisitions by conglomerate-affiliated firms acquiringtargets controlled by the same conglomerate group involves firms already havingaccess to internal capital markets they should not be motivated by the need to createinternal capital markets. This type of acquisition should be pursued by the intention toenhance the operating efficiency rather than the internal capital market of the bidder.Intra-group non-diversifying acquisitions should also be motivated by similarobjectives. As a result, intra-group diversifying acquisitions should not besubstantially different from intra-group non-diversifying acquisitions in terms ofvalue creation and post-acquisition operating performance. Consequently, intra-group transactions are expected to allow us to draw inferences about the operatingefficiency gains of acquisitions. Acquisitions by non-conglomerate firms, however, areexpected to gauge the importance of internal capital markets.The second purpose is to examine whether intra-group acquisitions are motivated
by entrenched controlling interests (Shleifer and Vishny, 1997; Bebchuck et al., 1999;Wolfenzon, 1999; Claessens et al., 2000). That is, we investigate whether controllingshareholders expropriate minority shareholders by setting unfair terms in the transferof control stakes. This is expected to add to the rapidly expanding literature on the
Diversification, Ownership and Control 283
# Blackwell Publishers Ltd, 2002
{Journals}Eufm/8_3/G174/makeup/G174.3d
separation of ownership and control in Western Europe and East Asia (see e.g. LaPorta et al., 1999; Faccio and Lang 2000, 2002; Claessens et al., 2000).
Our study differs from previous studies in several other ways. While there has beenan extensive literature on the value of corporate diversification, the diversificationdiscount that empirical researchers have uncovered may be attributed to the use of thesame database of US firms. It can therefore not be ruled out that the diversificationdiscount is simply the outcome of an elaborate data snooping process. Without testingthe robustness of these findings outside the environment in which they werediscovered, we cannot determine whether these empirical regularities are merelyspurious or dependant on the institutional setting (Lins and Servaes, 1999a).4 In thispaper we address this concern by studying the effects of the act of corporatediversification outside the US context. Although previous work (Lins and Servaes,1999a), has examined at the aggregate level the phenomenon of corporatediversification across countries, this study primarily focuses on the effects of theinvestment decision of the firm on its market value and post-investment performance.5
There is no evidence on whether the act of diversification (focus) destroys (improves)corporate performance relying on non-US disaggregated data.6 While previous studies(Doukas and Lang, 2001) have investigated the expansion of core and non-corebusiness of firms, they rely upon US firms that are more widely held in comparison toSwedish firms. Our analysis allows us to examine whether the efficiency of corporateinvestment is influenced by the pronounced separation of ownership and control ofSwedish corporations. Furthermore, our research differs from earlier studies in thesense that it avoids the possible limitations associated with the estimation of thediversification discount using the Berger and Ofek (1995) procedure that relies on theuse of industry-matched stand-alone firms to make inferences about the imputed valueof diversified firms. Such diversification discount estimates may be inappropriate ifdiversified firms consist of business segments that systematically differ from stand-alone firms in the same industry (Campa and Kedia, 2001; Chevalier, 1999; Graham etal., 1999; Whited, 2001). In contrast with previous studies, our approach relies on themarket’s assessment of corporate diversifying and non-diversifying investmentactivities and the long-term performance of the firm to draw inferences about thevalue of the act of diversification. Consequently, our investigation is not subject to the
4 Lins and Servaes (1999a), report a significant diversification discount of 10% in Japan and
15% in the UK, respectively. For German diversified firms, however, they document adiversification discount only when insider ownership is less than 5%.5 See, however, Matsasuka (1993) and Hubbard and Palia (1999), who find positive
announcement effects associated with diversifying acquisitions during the 1960s.6 Regarding US based studies, Matsusaka (1993) finds positive bidder returns at the
announcement of US conglomerate acquisitions in the late 1960s and early 1970s. Ravenscraftand Scherer (1987) document that conglomerate acquisitions during the 1960s were unsuccessfulbecause of the post-acquisition poor performance and subsequent bust-up. Kaplan and
Weisbach (1992) find similar evidence. Servaes (1996) finds a negative relation betweendiversification and firm performance in the 1960s, and, a negative but weaker relation, in the1970s. In fact, Lang and Stulz (1994) argue ‘ ... that firms that diversify do so because they are
performing poorly and are seeking growth opportunities ...’ suggesting ‘... that further insightscould be obtained by investigating diversification at a more disaggregated level than at thesegment level and by distinguishing between firms that diversify into similar activities and thosethat diversify into unrelated activities ... ’.
284 J. A. Doukas, Martin Holmen and N. G. Travlos
# Blackwell Publishers Ltd, 2002

{Journals}Eufm/8_3/G174/makeup/G174.3d
construction biases contained in the diversification discount measures used in earlierstudies. Another difference is that we examine the pre-diversification valuation andperformance characteristics of target firms that are acquired by conglomerate andnon-conglomerate groups. This feature permits testing whether diversification isdriven by the motive of operating efficiencies, since the intention of achieving greaterinternal markets is rather weak for conglomerate bidders buying targets controlled bythe same conglomerate group.We examine a sample of 101 Swedish acquisitions that spans the 1980–95 period.
The evidence shows that firms that acquire companies in related industriessignificantly increase shareholder value while diversifying acquisitions, in general,cause negative market reactions at the expense of shareholder value by an average ofSEK108 million ($10 million) around the announcement period. Furthermore, we findbidders’ long-term operating performance to be consistent with market’s reaction.Industry-adjusted operating margins for firms that engage in diversifying acquisitionsdeteriorate by 4% three years after the acquisition year. Performance gains in each ofthe three years following the acquisition occur only when bidders invest in their corerather than in peripheral lines of business. Intra-group acquisitions, however, showthat bidders do not realise significant gains whether they adopt diversifying orfocusing investment strategies by purchasing firms already controlled by theconglomerate group. Intra-group targets realise significant gains regardless bidder’sinvestment strategy.The remainder of the paper is organised as follows. The next section describes the
data and institutional environment. Section 3 presents descriptive statistics andanalyses the pre-acquisition cash-flow performance of bidders and targets. Section 4presents the announcement returns and cross-sectional results. The post-acquisitionoperating performance results are presented and discussed in Section 5. Section 6concludes the paper
2. Institutional setting and data collection
2.1. Swedish corporate governance and institutions
The Swedish corporate governance model promotes strong private owners with along-term investment horizon and a social responsibility towards other stakeholdersand society in general. Within the Swedish financial system, ownership groups haveoften held controlling blocks in affiliated firms and taken an active part inmanagement. These ownership groups control many firms, especially the largestones. The largest sphere—the Wallenberg family—controls companies representingalmost half of the Stockholm Stock Exchange (SSE) market capitalisation. This statehas been remarkably stable for most of the last 60 years.The groups usually exercise control through their investment companies (closed end
investment funds) organised as pyramidal holding companies. The funds stem fromthe economic crisis in the 1920s and 1930s when Swedish commercial banks took overfirms in severe financial distress. Before 1934, banks were permitted to acquire stocksas collateral for loans. As a result of this and the economic crisis, banks held largeportfolios of stocks. In 1934, the new Bank Law forced banks to sell existingportfolios. The solution was to create holding companies and retain these portfoliosthrough the holding companies. The ownership of the holding companies wasdistributed to the shareholders of the banks (Agnblad et al., 2000).
Diversification, Ownership and Control 285
# Blackwell Publishers Ltd, 2002

{Journals}Eufm/8_3/G174/makeup/G174.3d
Historically, the two most important and influential groups have been organisedaround SE-Banken and Handelsbanken. SE-Banken’s holding company is Investor,which is controlled by the Wallenberg family through three foundations. Investor isstructured as a pyramid with only two layers. In combination with dual class sharesystems it controls many of the largest firms on the SSE, e.g., ABB, Electrolux,Ericsson, and SKF.7 Agnblad et al. (2000) report that in October 1998 the Wallenbergsphere controlled 14 large listed firms with a total market value of SEK922 billions(42% of the SSE market capitalisation) with an ownership stake of 19.4% of thecapital and 41.3% of the votes in Investor (Wallenberg’s Closed-End InvestmentFund). Therefore with an investment of about 1% of the SSE market capitalisation inInvestor, the Wallenberg foundations control 42% of the market capitalisation!Figure 1 represents the organisational structure of the Wallenberg group in 1986(ownership data obtained from Sundqvist (1986)). The Wallenberg group ischaracterised by a complex pyramidal structure with interlocking ownership andvoting powers that allow for the control of a large group of companies with only afraction of their shares. For example, with 4% of equity ownership, Wallenberg has29% of the voting power in Ericsson.
Handelsbanken’s holding company is Industrivarden, which is formed around themanagement team of the bank that controls the fund. Agnblad et al. (2000) report thatthe Handelsbanken sphere in 1998 controlled 11 firms and a market value of SEK259billions (about 12% of SSE’s market capitalization) with an equity stake worthSEK36 billions. The organisational structure of the SHB group in 1986 is shown inFigure 2. Although SHB has a similar pyramid structure with that of the Wallenberggroup, its cross ownership was more pronounced in 1986.
Firms within the Wallenberg and SHB groups have (i) access to internal capitalmarkets and (ii) strong separation of ownership and control. Hence, intra-groupacquisitions are likely to be driven by different motives than non-group acquisitions.Since Wallenberg and SHB firms already have access to internal capital markets,diversifying investments should not be determined by the will to create or expandinternal capital markets. Instead, they should be motivated by the need to enhanceoperating efficiencies. Intra-group non-diversifying acquisitions should also bemotivated by similar objectives. As a result, intra-group diversifying acquisitionsshould not be substantially different from intra-group non-diversifying acquisitions interms of value creation and post-acquisition operating performance. Intra-grouptransactions, then, are expected to allow us to draw inferences about the operatingefficiency gains of acquisitions. On the other hand, non-group diversifyingacquisitions should reveal whether internal capital markets create value and improvepost-acquisition performance of bidders that did not benefit from internal capitalmarkets in the pre-acquisition period. This should be more pronounced in diversifyingthan non-diversifying acquisitions of non-conglomerate bidders.
Intra-group acquisitions may also reveal different motives. Since conglomeratecontrolling shareholders with minority capital interest do not bear the full cash flowconsequences of takeovers, they have biased investment incentives and might engagein empire building acquisitions, to increase their personal power base. Furthermore,controlling shareholders might engage in intra-group acquisitions in order to
7 Firms issue two types of shares (A and B) with equal cash flow rights but with different votingrights. Typically, A shares carry 10 shares per vote while B shares carry one share per vote.
286 J. A. Doukas, Martin Holmen and N. G. Travlos
# Blackwell Publishers Ltd, 2002

{Journals}Eufm/8_3/G174/makeup/G174.3d
expropriate minority stakes by setting unfair terms in the transfer of assets. Intra-group acquisitions, diversifying and focused, are likely to be the manifestation ofagency problems between majority and minority shareholders. Intra-group transac-tions, then, are also expected let us infer whether they are designed by the controllingshareholders to expropriate minority interests.
Wallenberg Foundations
Investor
Wallenberg Family
Providentia
Export Invest
26(24)
23(21)
15(10) 1(1)
0.3(0.4)
1(1)
Papyrus
Astra
SKF
Atlas Copco
SE-Bank
Ericsson
Swedish Match
ESAB
Sila
Asea
Electrolux
Forsinvest
Alfa-Laval
Incentive
LKB Orrefors
Hasselblad
Garphyttan
34 (34)
32 (32)
22 (10)
14 (14)
53 (53)
11 (11)
47 (25)
14 (14) Saab-Scania
18 (18)
7(7) 58(58)
56(56)
82(61) 94(64)
27 (18)
29 (14)
20 (20)
49(42)
49(13)
51 (51)
50 (50)
1 (8)
13 (11)
46 (5)
6(6)
29 (4)
6(1)
Stora
Fig. 1. The Wallenberg sphere of business in January 1986. Vote ownership (%) is reported
with equity ownership (%) in parenthesis. Investor, Providentia and Export Invest are threeClosed End Investment Funds (CEIFs) controlled by the Wallenbergs.
Diversification, Ownership and Control 287
# Blackwell Publishers Ltd, 2002

{Journals}Eufm/8_3/G174/makeup/G174.3d
2.2. Data collection
The acquisition of a publicly traded firm is usually accomplished through a publictender offer. Therefore, almost all acquisitions are preceded by a public tender offer(Bergstrom and Rydqvist, 1989).8 We create a sample of publicly traded firms thatengaged in acquisitions during the 1980–95 period from several sources. The tenderoffers associated with the acquisitions for the 1980–91 period were collected from therecords of the SSE and daily financial newspapers. The announcements of tenderoffers, reported in the Swedish financial press, were confirmed with the SSEs quarterlyreports. Tender offers for the 1992–95 period were collected from the SSE QuarterlyReport. Only successful non-partial bids where both the target and the bidder were
SHB
Foundations
SHB Mutual Funds
Oktogonen
SCA
Beijer Argentus
JM
Geveko
SHB
AGA
Besam
16 (15)
Promotion/ Bahco Ericsson
PLM
Gunnebo
Thorsman
Almedahl
Modo
Iggesund
9(4) 8(8) 14(5)
10(9)
24(10) 10(10)
3(3)
28(28)
20(7) 17(11)
6 (6)
3(3)
1 (1)
41 (41)
13 (2)
13(7) 50(50)
30(26)
51(33)
19(14) 12(6)
34(34) 30(30)
30(30)
4(4)
16(8)
61(61)
5(5)
10 (10)
22 (3)
3(3)
9 (5)
5(3)
30(12)
7(7)
Volvo 8 (4)
3(1)
Fig. 2. The SHB sphere of business in January 1986. Vote ownership (%) is reported with
equity ownership (%) in parenthesis. Industrivarden is a Closed End Investment Fund (CEIF)controlled by the SHB sphere.
8We are aware of only two successful non-partial mergers without a public tender offer.
288 J. A. Doukas, Martin Holmen and N. G. Travlos
# Blackwell Publishers Ltd, 2002

{Journals}Eufm/8_3/G174/makeup/G174.3d
listed at the time of the bid are included in the sample. The final sample containscomplete data for 101 successful acquisitions.9 Most of the excluded observations weredue to missing data for small target firms.The typical bidder is an industrial firm or a holding company, which has been listed
on the SSE for at least ten years. Targets are also industrial firms, but publicly tradedfirms for less than ten years on the SSE. Almost one third of the target firms had beentraded on the Stockholm stock market for less than four years when they were takenover. An interesting observation is that 14 of the bidders went bankrupt or were takenover within three years from the acquisition announcement.10 Another samplecharacteristic is that 20 of the bidders made more than one bid during the sampleperiod. This implies that their performance measures and industry segments mayoverlap between observations. Since we are interested in focused and diversifyinginvestment strategies, these observations are important and we leave them in thesample. Bidders that made two acquisitions in the same year are counted only once.This reduced the sample to 93 bidders and 101 targets.It is noteworthy, that almost all acquisitions were uncontested (i.e., there was only
one bidder). This was the case in 94 of the transactions. Six bids in our sample wererevised before they ultimately succeeded. It should be noted that a shareholder, or agroup of shareholders, with 10% of the shares can block the acquisition and thatalmost all firms traded on SSE have at least one 10% blockholder. Therefore, theterms of the tender offer are often negotiated between the bidder and the largeshareholders before the public announcement. When large blockholders have acceptedthe terms of the bid, a follow-up tender offer is made for all target shares including theblockholders’ shares (Rydqvist, 1993). The legal system and the fact that we includeonly successful bids suggest that all the acquisitions in our sample are friendly. Thisalso implies that there is no auction for target shares.
3. Descriptive statistics and pre-acquisition performance
In this section we provide summary statistics of Swedish firms involved in acquisitionsduring the 1980–95 period. We also outline the industrial structure of bidders andtargets three years before the acquisition. Finally, we investigate their pre-acquisitioncash flow performance. This is investigated in order to determine potential differencesbetween bidders and targets as well as differences between bidders that invest outsidetheir core business and bidders that invest within their core business.
3.1. Descriptive statistics
Table 1 lists summary statistics for Swedish companies involved in acquisitions duringthe 1980–95 period. Although the number of business segments suggests that, onaverage, target firms are more diversified than bidding firms, the difference is
10 Eight bidders actually show up as targets subsequently in our sample.
9Acquisitions of state dominated companies by other state dominated companies have been
deleted since they may have been politically motivated. Furthermore, other acquisitions whichwere made under specific circumstances have been deleted (e.g., Trygg Hansa SPP’s acquisitionof Gota was deleted since it was motivated by Trygg Hansa SPP being the major owner in Gota
and therefore wanting to save Gota from bankruptcy). However, the major reason for theexclusion of an acquisition from our sample is due to missing data.
Diversification, Ownership and Control 289
# Blackwell Publishers Ltd, 2002

{Journals}Eufm/8_3/G174/makeup/G174.3d
negligible.11 The approximate q ratio, measure of firm performance and manage-ment’s ability to increase shareholders value, suggests that there are no significantdifferences between bidding and target firms.12 Thus, bidders do not seem to buy firmsof superior or inferior performance.
The debt ratio of bidding firms is marginally exceeding that of target firms. The sizeof bidding firms, measured by book value of total assets, is on average three times aslarge as targets’ firm size. Bidders’ market value of equity is about four times larger(SEK6167 million) than the market value of equity of target firms. While biddingfirms are considerably larger than target firms, they are as diversified as targets are.Hence, there is no distinct pattern between size and industrial structure (i.e., numberof industry segments).
Table 1
Summary statistics for Swedish firms involved in acquisitions: 1980–95.
The sample used in this study consists of Swedish acquisitions over the 1980–1995 period.
Bidder (N=93) and target (N=101) firms were listed on the Stockholm Stock Exchange (theA-list, the OTC, or the Unofficial list) at the time of the announcement.
N Mean Std. Dev Min Median Max
Panel A: Bidding Firms
Number of Segments 93 1.750 0.991 1 1 5Approximate q1 93 1.206 0.353 0.7423 1.101 2.7593
Debt=Total Assets 93 0.700 0.165 0.079 0.718 0.973
Size of Investment2 101 1579 3066 30 603 25617Firm Size (M SEK) 93 20397 39634 146 4642 238011Managerial Ownership 93 0.162 0.192 0 0.082 0.709
Panel B: Target FirmsNumber of Segments 101 1.850 1.123 1 1 5
Approximate q 1003 1.304 0.474 0.5634 1.114 3.1174
Debt=Total Assets 101 0.666 0.182 0.011 0.672 0.968Firm Size (M SEK) 101 7623 26593 28 1220 243745
Managerial Ownership 101 0.184 0.248 0 0.023 0.852
1 The approximate q ratio is defined as market value of equity plus book value of total debt divided by book
value of total assets.2Market value of target’s equity in M SEK.3One extreme outlayer (Hotorget 1989, q=9.68) deleted.4 For bidding firms, Min is Kanthal 1986 and Max is WM Data 1989. For target firms, Min is Elverk 1981
and Max is Hilleshog 1985.
11Accounting data were collected from Findata’s FINLIS database. Industry segments wereobtained from the Sweden’s Largest Corporations (1980–1996). This source gives summarystatistics for the 5000 largest firms in Sweden each year. The industry segments given in this
source are the ones reported by the companies themselves. Ownership data was collected fromSundqvist (1985–93), Sundin and Sundqvist (1994–95). The q ratios have not been industryadjusted since we do not have access to industry qs.12Approximated by the sum of the market value of a firm’s equity and the book value of totaldebt divided by the book value of assets. Deflating q values may not equally affect all firms in thesample. However, it should affect the sub-samples equally if they have a similar industry profile.
290 J. A. Doukas, Martin Holmen and N. G. Travlos
# Blackwell Publishers Ltd, 2002

{Journals}Eufm/8_3/G174/makeup/G174.3d
Acquisitions are defined as ‘diversifying’ when the first two-digits of the mainindustry code of the bidder and the target are not the same and ‘focused’ when the firsttwo-digits of the main industry code of the bidder and target are identical. We useindustry codes based on the UN international classification standard (ISIC) for the1980–92 period. For the rest of the sample period, we use the SNI 92 industryclassification. Both systems provide a four-digit industry code where the first digitidentifies a wide industry classification. The classification is, then, narrowed by thesecond, third and fourth digit. The SNI 92 is constructed as the ISIC, but the actualcode numbers are different. The rationale for using two-digit industry codes is thatindustries with the same first two digits are closely related and require comparablemanagement skills.13 Consistent with Servaes (1996), we consider the 4-digitclassification as inappropriate to identify accurately the industrial structure of
Table 2
Frequency distribution of acquisitions by years.
The sample used in this study consists of Swedish acquisitions over the 1980–95 period. Bidder
and target firms were listed on the Stockholm Stock Exchange (the A-list, the OTC, or theUnofficial list) at the time of the announcement. If the bidder and the target have the same firsttwo digits industry code, the acquisition is defined as focused and as diversifying when the
bidder and the target do not share the same main two-digit industry code.
Frequency
Year Focused Diversifying Total
1980 1 2 31981 1 1 21982 0 0 0
1983 0 2 21984 1 3 41985 7 7 14
1986 9 5 141987 3 4 71988 10 8 181989 8 2 10
1990 4 3 71991 2 4 61992 0 1 1
1993 0 0 01994 2 5 71995 4 2 6
Total 52 49 101
13 Business activity within the same two-digit level is also defined as ‘related diversification’ (see
Rumelt, 1974; Matsusaka, 1993; Servaes, 1996). Operating in several 2-digit industry (SNI)codes is defined as unrelated diversification (see Palepu, 1985). Morck et al. (1990), however,define an acquisition as related if the bidder and the target have one of their 4-digit industrycodes in common.
Diversification, Ownership and Control 291
# Blackwell Publishers Ltd, 2002

{Journals}Eufm/8_3/G174/makeup/G174.3d
acquisitions in our sample.14 Table 2 presents the frequency distribution of focusedand diversifying acquisitions based on the two-digit industrial classification measure.
Very few acquisitions occurred before 1985. More than 75% of the acquisitionsoccurred during the 1985–91 period. Takeover activity declined considerably in 1992and 1993, coinciding with the collapse of the financial sector in Sweden, and picked upagain in 1994. The median acquisition year in the sample is 1988. While more thanhalf of the acquisitions are classified as diversified (i.e., 49 out of 101), no discernablepattern characterises the two types of acquisition activity in Sweden throughout the1980–95 period.
Table 3 lists the number of reported business segments for the year the acquisitiontook place and for each year during the three-year pre-acquisition period.15 Panels Aand B suggest, on average, that the corporate structure of bidding and target firmschanges over time. For both groups the number of business segments increases as wedraw near to the acquisition year. Targets’ number of business segments, however,increased by 13.49% while bidders’ business segments increased only by 5.42% overthe three-year period prior to the acquisition to the year. The target’s increasingbusiness diversity during the pre-acquisition period is consistent with the view thatfirms that diversify are likely to become targets. Columns 3 and 4 report thecorresponding number of business segments for bidders and targets by type ofacquisition. What is more interesting is that bidders that acquire related targets (i.e.,conduct focused acquisitions) report activity in fewer business segments than biddersthat acquire unrelated targets (i.e., conduct diversifying acquisitions). The differencesare significant at the 10% level for years minus one and zero (i.e., the years when theacquisitions were planned and carried out). This suggests that diversified bidders arelikely to acquire firms outside their core business while focused bidders are likely toacquire firms within their core business.
Panel B shows that target companies associated with focused acquisitions, onaverage, have fewer business segments than target companies associated withdiversified acquisitions. The difference is significant at the 5% level at theannouncement year. These results suggest that diversifying acquisitions are morelikely to be the choice of diversified companies that appear to seek growthopportunities outside their core business by purchasing diversified targets. Panel Cconfirms that multi-segment bidders are more likely to engage in diversified thanfocused acquisitions. More than 56% of acquisitions by multi-segment firms areclassified as diversified while 46% of acquisitions by single-segment firms are classifiedas diversified. Panel D shows that a higher percentage of diversified targets is acquiredby multi-segment than single-segment bidders.
We conclude that diversified bidders expand considerably their degree of industrialstructure not only by investing outside their core business but also by acquiring targetswith a diverse industrial profile. Focused acquisitions, however, are pursued by lessdiversified bidders with the objective to enhance their core business.
14An alternative would be to compare the 4-digit SNI codes. This classification method providesqualitatively similar results, but the number of acquisitions defined as focused declinesdramatically.15 The information given for each year is the industry codes reported by the firm’s managementand published at the end of the year. The business activity reported for year zero is based on thelast reported segments prior to the announcement of the acquisition.
292 J. A. Doukas, Martin Holmen and N. G. Travlos
# Blackwell Publishers Ltd, 2002

{Journals}Eufm/8_3/G174/makeup/G174.3d
Panel C: Corporate structure of bidders and proportion of diversifying acquisitions (i.e., thefraction of bidders that acquire targets with a different main two-digit industry code
Corporate structure bidder, N=90 N Fraction of diversifying acquisitions
Single segment 50 0.44Multi-segment 40 0.55Difference �0.11
Panel D: Corporate structure of targets and proportion of diversifying acquisitions (i.e., thefraction of targets that is acquired by bidders with a different main two-digit industry code
Corporate structure target, N=101 N Fraction of diversifying acquisitions
Single segment 52 0.37Multi-segment 49 0.63
Difference �0.26***
Table 3
Statistics on number of segments for bidding and target firms in Swedish acquisitions.
The sample used in this study consists of Swedish acquisitions over the 1980–95 period. Bidder(N=93) and target (N=101) firms were listed on the Stockholm Stock Exchange (the A-list,
the OTC, or the Unofficial list) at the time of the announcement. If the bidder and the targethave the same first two digits industry code, the acquisition is defined as focused and asdiversifying when the bidder and the target do not share the same main two-digit industry code.
** and * denote significance at the 5% and 10% levels, respectively.
Panel A. The number of two-digit industry segments reported by the bidders the years beforethe acquisition.
YearTotal sample
Mean (N=901)Focused acquisition
Mean (N=46)Diversifying acquisition
Mean (N=44) Difference
�3 1.66 1.56 1.75 0.18�2 1.69 1.54 1.84 0.30
�1 1.78 1.59 1.98 0.39*0 1.77 1.61 1.93 0.32
1 Three bidders made one focused and one diversifying acquisition the same year. These eight observationsare deleted (Asea 1988, Esselte 1988, and Investor 1991). Five bidders made two focused or two diversifyingacquisitions the same year. These bidders are only counted once (Volvo made two diversifying acquisitions1985, MoDo made two focused acquisitions 1988, Nobel made two diversifying acquisitions 1988, Gotamade two focused acquisitions 1989, and Asea made two focused acquisitions 1990).
Panel B. The number of two-digit industry segments reported by the targets the years before theacquisition. The sample is divided by whether or not the firm was acquired by a bidder within
the same industry or not.
Year
Total sample
Mean (N=101)
Focused acquisition
Mean (N=52)
Diversifying acquisition
Mean (N=49) Difference
�3 1.63 1.40 1.86 �0.45**�2 1.64 1.38 1.92 �0.53***�1 1.72 1.42 2.04 �0.62***0 1.85 1.52 2.20 �0.68***
Diversification, Ownership and Control 293
# Blackwell Publishers Ltd, 2002

{Journals}Eufm/8_3/G174/makeup/G174.3d
3.2. Pre-acquisition cash-flow performance
In this section we estimate bidders’ and targets’ pre-acquisition cash flow performanceusing industry-adjusted growth in sales and profitability changes in operating margin,return on assets, and return on equity [(EBITD)=Sales, (EBITD)=Total Assets, and(EBITD)=Equity]. The motivation of our analysis is to gain additional insights aboutthe pre-acquisition performance characteristics of bidders and targets. This is expectedto help us determine whether diversification is driven by inferior performance relativeto the performance of industry peers. Industry-adjusted performance changes fromyear n to 0 for firm i are calculated as
Y0
t¼ n
(1þ�Xfirm i; t)�Y0
t¼ n
(1þ�XIndustry; t)
where
�Xfirm i; t is the change in the performance measure, X, between year n and year 0�XIndsutry; t is the change in the industry-mean of the performance measure, X, between
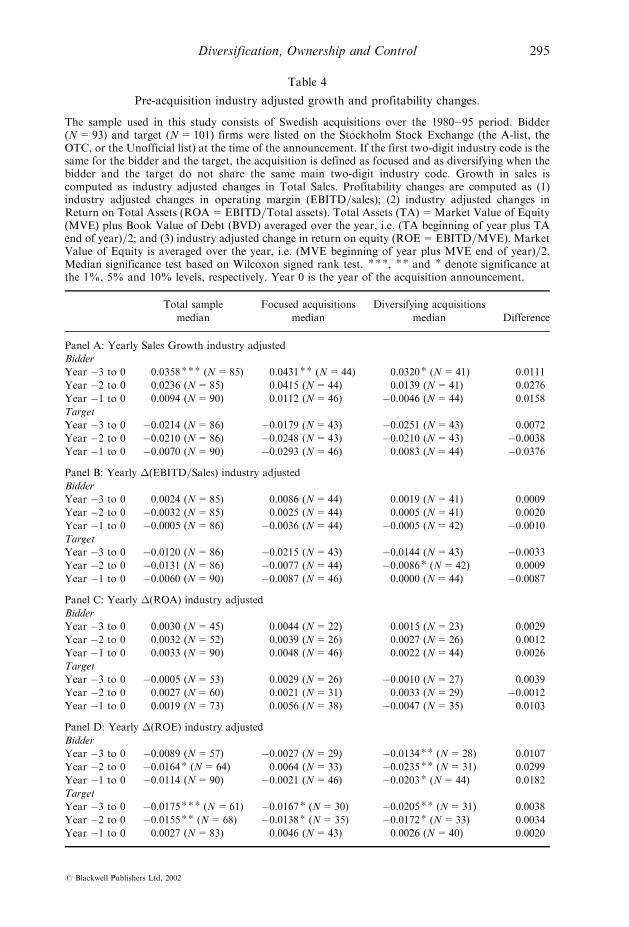
year n and year 0; n=�3, �2, �1Medians and median differences between focused and diversifying acquisitions for
years �3, �2, and �1 and year 0 are reported in Table 4.16 Panel A shows thatacquiring firms in our sample have an average annual sales growth performance thatis substantially better than the industry median in year �3. While bidders’ growth insales is considerably higher than the industry mean three years before the acquisition,it declines steadily in years �2 and �1 and that resembles the industry median. Incontrast with the evidence reported by Lang and Stulz (1994) at the aggregate level,our results do not necessarily suggest that bidders seek growth through acquisitionsbecause they have exhausted their own growth opportunities relative to their industrypeers. The empirical evidence also shows that both diversified and focused biddingfirms had not been underperformers long beforehand. Consequently, analysis of thepost-acquisition performance of diversified and focused bidders will reveal the extentto which the nature of acquisition (i.e., diversifying and focused) impacts differentlyon the long-term profitability of the bidder. This issue is addressed later in Section 4.
Our results are also consistent with Berger and Ofek (1996), who find that firmswith value losses are likely to be taken over. The sales growth measure of performancefor target firms indicates that the typical target has a negative performance prior tothe acquisition year. Therefore, this suggests that acquiring firms do not buy firmsthat exhibit performance greater than their industry median. When we split the sampleinto diversifying and focused acquisitions, we observe the same pattern. Bidders andtargets associated with diversified acquisitions have, in general, lower pre-acquisitionperformance than the industry median in comparison to firms engaged in focusedacquisitions. For all three pre-acquisition intervals, however, the performancedifferences are not statistically significant at any conventional level. The evidencealso shows that focused bidders do not have superior pre-acquisition performancethan diversified bidders. The performance difference between the two types ofacquiring firms is not statistically significant for all three pre-acquisition intervals.Hence, the type of acquisition, not the pre-acquisition performance of the bidder, isexpected to have a direct bearing on the post-acquisition performance of the bidder.
16Medians and median differences are reported since the distributions are skewed.
294 J. A. Doukas, Martin Holmen and N. G. Travlos
# Blackwell Publishers Ltd, 2002
{Journals}Eufm/8_3/G174/makeup/G174.3d
Table 4
Pre-acquisition industry adjusted growth and profitability changes.
The sample used in this study consists of Swedish acquisitions over the 1980–95 period. Bidder(N=93) and target (N=101) firms were listed on the Stockholm Stock Exchange (the A-list, theOTC, or the Unofficial list) at the time of the announcement. If the first two-digit industry code is thesame for the bidder and the target, the acquisition is defined as focused and as diversifying when thebidder and the target do not share the same main two-digit industry code. Growth in sales iscomputed as industry adjusted changes in Total Sales. Profitability changes are computed as (1)industry adjusted changes in operating margin (EBITD=sales); (2) industry adjusted changes inReturn on Total Assets (ROA=EBITD=Total assets). Total Assets (TA)=Market Value of Equity(MVE) plus Book Value of Debt (BVD) averaged over the year, i.e. (TA beginning of year plus TAend of year)=2; and (3) industry adjusted change in return on equity (ROE=EBITD=MVE). MarketValue of Equity is averaged over the year, i.e. (MVE beginning of year plus MVE end of year)=2.Median significance test based on Wilcoxon signed rank test. ***, ** and * denote significance atthe 1%, 5% and 10% levels, respectively. Year 0 is the year of the acquisition announcement.
Total sample
median
Focused acquisitions
median
Diversifying acquisitions
median Difference
Panel A: Yearly Sales Growth industry adjusted
Bidder
Year �3 to 0 0.0358*** (N=85) 0.0431** (N=44) 0.0320* (N=41) 0.0111
Year �2 to 0 0.0236 (N=85) 0.0415 (N=44) 0.0139 (N=41) 0.0276
Year �1 to 0 0.0094 (N=90) 0.0112 (N=46) �0.0046 (N=44) 0.0158
Target
Year �3 to 0 �0.0214 (N=86) �0.0179 (N=43) �0.0251 (N=43) 0.0072
Year �2 to 0 �0.0210 (N=86) �0.0248 (N=43) �0.0210 (N=43) �0.0038Year �1 to 0 �0.0070 (N=90) �0.0293 (N=46) 0.0083 (N=44) �0.0376
Panel B: Yearly �(EBITD=Sales) industry adjusted
Bidder
Year �3 to 0 0.0024 (N=85) 0.0086 (N=44) 0.0019 (N=41) 0.0009
Year �2 to 0 �0.0032 (N=85) 0.0025 (N=44) 0.0005 (N=41) 0.0020
Year �1 to 0 �0.0005 (N=86) �0.0036 (N=44) �0.0005 (N=42) �0.0010Target
Year �3 to 0 �0.0120 (N=86) �0.0215 (N=43) �0.0144 (N=43) �0.0033Year �2 to 0 �0.0131 (N=86) �0.0077 (N=44) �0.0086* (N=42) 0.0009
Year �1 to 0 �0.0060 (N=90) �0.0087 (N=46) 0.0000 (N=44) �0.0087
Panel C: Yearly �(ROA) industry adjusted
Bidder
Year �3 to 0 0.0030 (N=45) 0.0044 (N=22) 0.0015 (N=23) 0.0029
Year �2 to 0 0.0032 (N=52) 0.0039 (N=26) 0.0027 (N=26) 0.0012
Year �1 to 0 0.0033 (N=90) 0.0048 (N=46) 0.0022 (N=44) 0.0026
Target
Year �3 to 0 �0.0005 (N=53) 0.0029 (N=26) �0.0010 (N=27) 0.0039
Year �2 to 0 0.0027 (N=60) 0.0021 (N=31) 0.0033 (N=29) �0.0012Year �1 to 0 0.0019 (N=73) 0.0056 (N=38) �0.0047 (N=35) 0.0103
Panel D: Yearly �(ROE) industry adjusted
Bidder
Year �3 to 0 �0.0089 (N=57) �0.0027 (N=29) �0.0134** (N=28) 0.0107
Year �2 to 0 �0.0164* (N=64) 0.0064 (N=33) �0.0235** (N=31) 0.0299
Year �1 to 0 �0.0114 (N=90) �0.0021 (N=46) �0.0203* (N=44) 0.0182
Target
Year �3 to 0 �0.0175*** (N=61) �0.0167* (N=30) �0.0205** (N=31) 0.0038
Year �2 to 0 �0.0155** (N=68) �0.0138* (N=35) �0.0172* (N=33) 0.0034
Year �1 to 0 0.0027 (N=83) 0.0046 (N=43) 0.0026 (N=40) 0.0020
Diversification, Ownership and Control 295
# Blackwell Publishers Ltd, 2002

{Journals}Eufm/8_3/G174/makeup/G174.3d
Using the operating margin, return on assets, and return on equity performancemeasures, Panels B, C and D report similar pre-acquisition performance patterns forbidders and targets. The return on equity performance measure, however, suggeststhat the pre-acquisition performance of diversifying bidders was considerably lower incomparison to the industry median. Consistent with the operating margin results, thereturn on equity change for targets is negative and statistically significant. Weconclude that a possible motive for related and unrelated acquisitions to the corebusiness of the bidder is the restoration of bidders’ performance. However, focusedbidding firms may find it more profitable to expand core lines of business than todiversify, while diversified firms may find it more profitable to expand to peripheralthan core business. We investigate both the short- and long-term profitability effectsof these two strategies next.
4. Empirical tests and results
In this section we examine the market reaction to tender offer announcements inSweden over the 1980–95 period. Our approach relies on the market’s assessment ofcorporate diversifying and non-diversifying investment activities in order to drawinferences about the effects of diversification on firm value. Finally, cross-sectionregression analysis is conducted to test the prediction of the internal capital markethypothesis, while we control for other effects as well.
4.1. Bidder announcement returns
We examine the market reaction to tender offer announcements. The abnormal excessreturns are estimated by subtracting bidder’s expected daily return from its actual.Following the methodology of Bradley et al. (1988), the expected daily return isestimated by using a market model that is estimated over the 180-trading-day periodthat ends 20 days before the announcement.17 The market index used is theAffarsvarldens General Index, which is a value weighted index representing 95% ofthe SSE’s market capitalization. When the firm has both A and B shares traded, avalue weighted portfolio of the two types of stock is calculated. When the A shares arenot traded, the abnormal return on the B shares is used as a proxy for the abnormalreturn on the A shares.18 We checked our sample of acquisition announcements forpossible concurrent announcements from day �10 to day 0. We found no suchannouncements. However, the daily abnormal returns (ARs) and cumulativeabnormal returns (CARs) are calculated for only 92 observations since one bidder’sacquisition was ambiguous and four bidders made two offers on the same day. Whentwo offers occur on the same day, it is impossible to separate the effect of each tenderoffer.19
17 Stock prices were collected from the Aktiedata Oy tape and the Superchart tape.18 Some firms do not have their A shares traded. The founding family keeps the controlling Ashares when the firms go public and only the B shares are traded.19 Volvo made tender offers for Cardo and Hilleshog 21 November 1985. MoDo made tenderoffers for Holmen and Iggesund on 11 March 1988. Nobel made tender offers for Asken andCarnegie on 20 October 1988. Gota made tender offers for Skaraborgsbanken andWermlandsbanken on 2 October 1989.
296 J. A. Doukas, Martin Holmen and N. G. Travlos
# Blackwell Publishers Ltd, 2002

{Journals}Eufm/8_3/G174/makeup/G174.3d
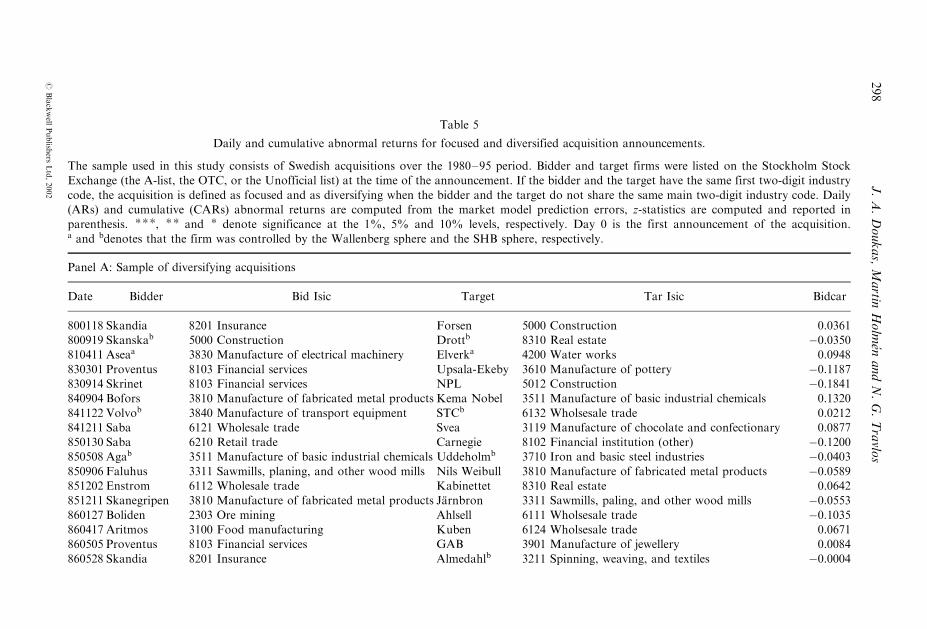
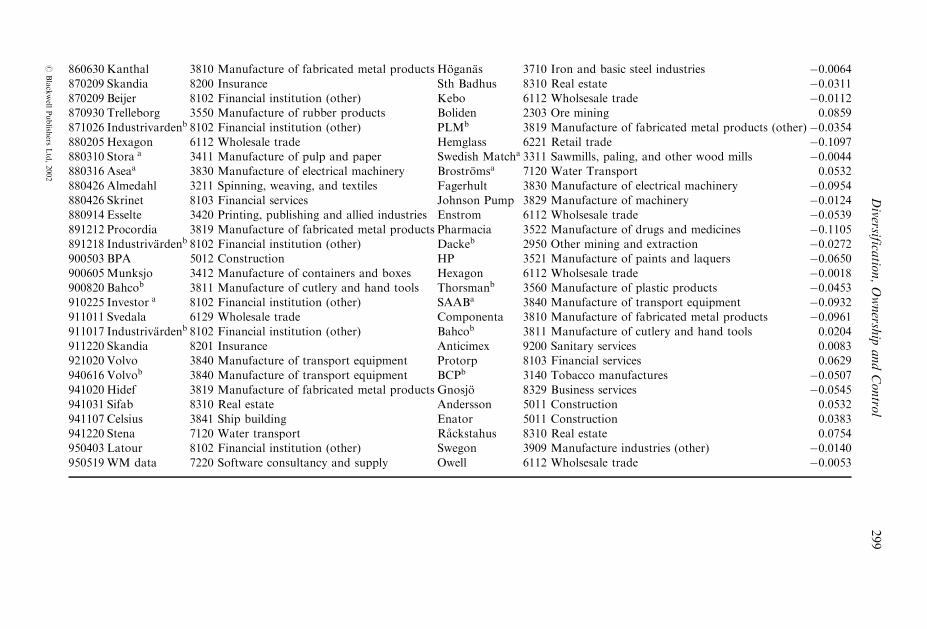
Panel A and B of Table 5, report the name, affiliation with the Wallenberg (a) andSHB (b) conglomerate groups, industrial structure (ISIC) of firms engaged inacquisitions along with bidder’s abnormal return at the announcement date (Day 0)for diversifying and focused acquisitions, respectively. Intra-group related acquisitionsrepresent one fourth of the sample: 13 for the Wallenberg (a) and 12 for SHB (b)group, respectively. It is noteworthy that Wallenberg and SHB firms are subject totender offers, but only in intra-group acquisitions. The only exception is Skandia’sdiversifying tender offer for Almedahl (controlled by SHB). SHB was a shareholder inSkandia but did not have control. Given that Wallenbergs and SHB are veryentrenched in the firms they control, change of control is almost impossible withoutthe approval of the controlling shareholder. Furthermore, since the control rights arevery valuable to them, they will only be willing to sell the controlling block if someoneis interested to pay for these control rights. Our sample suggest that it would beuncommon for an outsider to pay the price Wallenbergs and SHB demand for thesecontrol rights.Panel C of Table 5 reports the abnormal stock returns for both diversifying and
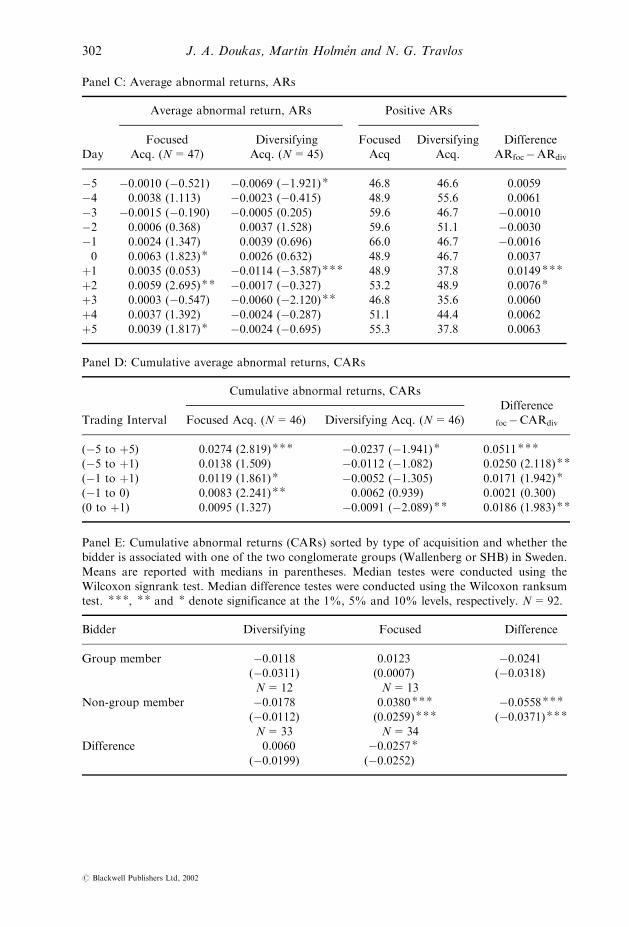
focused acquisitions for each day in the period �5 to þ5 days around theannouncement day. The daily abnormal return to the diversifying bidder on theannouncement of the acquisition (day �0) is positive but not statistically significant atany conventional level. In contrast, the abnormal return to bidders that expand theircore business is 0.0063 and significant at the 10% level. While there is a differentmarket response to the acquisition announcements of diversifying and non-diversifying firms, the difference (0.0037) does not appear to be statistically significantat conventional levels. One day after the announcement (day þ1), the market’sreaction is significantly negative for diversifying acquisitions, while positive andinsignificant for focused acquisitions. The difference is 0.0149 and significant at the1% level, implying that diversifying acquisitions are harmful to shareholders’ wealth.Though the mean return differences are not significant, with the exception of the dayafter the announcement (0.0149) and the two-day day after the announcement(0.0076), the daily abnormal returns are, in general, larger for bidders associated withfocused than diversifying acquisitions. Consistent with the pattern of daily abnormalreturns, the percentage of positive abnormal returns is by and large higher for focusedthan diversifying acquisitions.Following Bradley et al. (1988), our analysis is based on a five-day window
interval around the announcement of the acquisition (days �5 to þ5), to capturepre-announcement leakage effects as well as post-announcement corrections. Theseresults are listed on Panel D along with cumulative returns for other tradingintervals. Most of the excess return comes from day �5 to þ5. The cumulativeabnormal return to the non-diversifying bidder on the 11-day period is 0.0274 andsignificant at the 1% level (with a z-value of 2.819). Over the same trading interval,the abnormal return for the diversifying bidder is �0.0237 and marginallysignificant (with a z-value of �1.941). The means difference is 0.0511 andsignificant at the 1% level. These results suggest that shareholders of firms thatbuy targets related to their core business (non-diversifying) gain 2.7%, whileshareholders of firms that buy targets unrelated to their core business realize 2.3%negative returns. While these results appear to be consistent with the diversificationdiscount literature, one can also argue that the market’s negative reaction todiversifying acquisition announcements is likely to be driven by its perceptionof whether the bidder has overpaid the target rather than by the costs of
Diversification, Ownership and Control 297
# Blackwell Publishers Ltd, 2002
{Journals}E
ufm
/8_3/G
174/m
akeup/G
174.3d
Table 5
Daily and cumulative abnormal returns for focused and diversified acquisition announcements.
The sample used in this study consists of Swedish acquisitions over the 1980–95 period. Bidder and target firms were listed on the Stockholm StockExchange (the A-list, the OTC, or the Unofficial list) at the time of the announcement. If the bidder and the target have the same first two-digit industry
code, the acquisition is defined as focused and as diversifying when the bidder and the target do not share the same main two-digit industry code. Daily(ARs) and cumulative (CARs) abnormal returns are computed from the market model prediction errors, z-statistics are computed and reported inparenthesis. ***, ** and * denote significance at the 1%, 5% and 10% levels, respectively. Day 0 is the first announcement of the acquisition.a and bdenotes that the firm was controlled by the Wallenberg sphere and the SHB sphere, respectively.
Panel A: Sample of diversifying acquisitions
Date Bidder Bid Isic Target Tar Isic Bidcar
800118 Skandia 8201 Insurance Forsen 5000 Construction 0.0361800919 Skanskab 5000 Construction Drottb 8310 Real estate �0.0350810411 Aseaa 3830 Manufacture of electrical machinery Elverka 4200 Water works 0.0948
830301 Proventus 8103 Financial services Upsala-Ekeby 3610 Manufacture of pottery �0.1187830914 Skrinet 8103 Financial services NPL 5012 Construction �0.1841840904 Bofors 3810 Manufacture of fabricated metal products Kema Nobel 3511 Manufacture of basic industrial chemicals 0.1320
841122 Volvob 3840 Manufacture of transport equipment STCb 6132 Wholsesale trade 0.0212841211 Saba 6121 Wholesale trade Svea 3119 Manufacture of chocolate and confectionary 0.0877850130 Saba 6210 Retail trade Carnegie 8102 Financial institution (other) �0.1200850508 Agab 3511 Manufacture of basic industrial chemicals Uddeholmb 3710 Iron and basic steel industries �0.0403850906 Faluhus 3311 Sawmills, planing, and other wood mills Nils Weibull 3810 Manufacture of fabricated metal products �0.0589851202 Enstrom 6112 Wholesale trade Kabinettet 8310 Real estate 0.0642851211 Skanegripen 3810 Manufacture of fabricated metal products Jarnbron 3311 Sawmills, paling, and other wood mills �0.0553860127 Boliden 2303 Ore mining Ahlsell 6111 Wholsesale trade �0.1035860417 Aritmos 3100 Food manufacturing Kuben 6124 Wholsesale trade 0.0671860505 Proventus 8103 Financial services GAB 3901 Manufacture of jewellery 0.0084
860528 Skandia 8201 Insurance Almedahlb 3211 Spinning, weaving, and textiles �0.0004
298
J.A.Doukas,Martin
Holm
enandN.G.Travlo
s
#Blackwell
Publish
ersLtd,2002
{Journals}E
ufm
/8_3/G
174/m
akeup/G
174.3d
860630 Kanthal 3810 Manufacture of fabricated metal products Hoganas 3710 Iron and basic steel industries �0.0064870209 Skandia 8200 Insurance Sth Badhus 8310 Real estate �0.0311870209 Beijer 8102 Financial institution (other) Kebo 6112 Wholsesale trade �0.0112870930 Trelleborg 3550 Manufacture of rubber products Boliden 2303 Ore mining 0.0859
871026 Industrivardenb 8102 Financial institution (other) PLMb 3819 Manufacture of fabricated metal products (other)�0.0354880205 Hexagon 6112 Wholesale trade Hemglass 6221 Retail trade �0.1097880310 Stora a 3411 Manufacture of pulp and paper Swedish Matcha 3311 Sawmills, paling, and other wood mills �0.0044880316 Aseaa 3830 Manufacture of electrical machinery Brostromsa 7120 Water Transport 0.0532
880426 Almedahl 3211 Spinning, weaving, and textiles Fagerhult 3830 Manufacture of electrical machinery �0.0954880426 Skrinet 8103 Financial services Johnson Pump 3829 Manufacture of machinery �0.0124880914 Esselte 3420 Printing, publishing and allied industries Enstrom 6112 Wholsesale trade �0.0539891212 Procordia 3819 Manufacture of fabricated metal products Pharmacia 3522 Manufacture of drugs and medicines �0.1105891218 Industrivardenb 8102 Financial institution (other) Dackeb 2950 Other mining and extraction �0.0272900503 BPA 5012 Construction HP 3521 Manufacture of paints and laquers �0.0650900605Munksjo 3412 Manufacture of containers and boxes Hexagon 6112 Wholsesale trade �0.0018900820 Bahcob 3811 Manufacture of cutlery and hand tools Thorsmanb 3560 Manufacture of plastic products �0.0453910225 Investor a 8102 Financial institution (other) SAABa 3840 Manufacture of transport equipment �0.0932911011 Svedala 6129 Wholesale trade Componenta 3810 Manufacture of fabricated metal products �0.0961911017 Industrivardenb 8102 Financial institution (other) Bahcob 3811 Manufacture of cutlery and hand tools 0.0204911220 Skandia 8201 Insurance Anticimex 9200 Sanitary services 0.0083921020 Volvo 3840 Manufacture of transport equipment Protorp 8103 Financial services 0.0629
940616 Volvob 3840 Manufacture of transport equipment BCPb 3140 Tobacco manufactures �0.0507941020 Hidef 3819 Manufacture of fabricated metal products Gnosjo 8329 Business services �0.0545941031 Sifab 8310 Real estate Andersson 5011 Construction 0.0532
941107 Celsius 3841 Ship building Enator 5011 Construction 0.0383941220 Stena 7120 Water transport Rackstahus 8310 Real estate 0.0754950403 Latour 8102 Financial institution (other) Swegon 3909 Manufacture industries (other) �0.0140950519WM data 7220 Software consultancy and supply Owell 6112 Wholsesale trade �0.0053
Diversifica
tion,Ownersh
ipandContro
l299
#Blackwell
Publish
ersLtd,2002

{Journals}E
ufm
/8_3/G
174/m
akeup/G
174.3d
Panel B: Sample of focused acquistion
Date Bidder Bid Isic Target Tar Isic Bidcar
801125 Sonesson 3820 Manufacture of machinery Nife 3810 Manufacture of fabricated metal products �0.0040810210 Alfa Lavala 3820 Manufacture of machinery Rotora 3820 Manufacture of machinery 0.0661
840924 Stora 3411 Manufacture of pulp and paper Billerud 3411 Manufacture of pulp and paper 0.0749841203 Papyrusa 3411 Manufacture of pulp and paper Nymollaa 3411 Manufacture of pulp and paper 0.0760850228 Reinholds 8310 Real estate SAA 8310 Real estate �0.0297850423 Sth Badhus 8310 Real estate Citadellet 8310 Real estate 0.0827850808 Stralfors 3420 Printing, publishing and allied industries Topflight 3420 Printing, publishing and allied industries 0.0088850821 Sundsvallsbanken 8101 Monetary institution Uplandsbanken 8101 Monetary institution 0.0084850822 Catena 6131 Wholesale trade Safvean 6140 Wholsesale trade 0.0738
851127 Promotionb 3810 Manufacture of fabricated metal products Bahcob 3810 Manufacture of fabricated metal products 0.0178851203 Bilsped 7190 Transport services Scansped 7190 Transport services 0.0988860111 Bilspedition 7190 Transport services Adamsson 7190 Transport services �0.0119860225 Volvob 3840 Manufacture of transport equipment Sonessonb 3820 Manufacture of machinery 0.0058860526 Pronator 8329 Business services Foretagsfinans 8329 Business services 0.1534860623 Malmros 6112 Wholesale trade Stiab 6112 Wholsesale trade 0.1053
860822 Philipsons 6131 Wholesale trade Ivars Bil 6131 Wholsesale trade �0.0002860929 Storaa 3411 Manufacture of pulp and paper Papyrusa 3411 Manufacture of pulp and paper �0.0451861008 Pharmacia 3522 Manufacture of drugs and medicines LKB 3529 Manufacture of chemicals �0.0069861124 Munksjo 3411 Manufacture of pulp and paper Ljungdals 3419 Manufacture of pulp and paper (other) 0.1253861208 Gotabanken 8101 Monetary institution B&B Invest 8101 Monetary institution 0.0881870203 Pronator 8329 Business services Enator 8310 Real estate �0.0565870406 JW 8324 Engineering and architectural services Sjolander 8324 Engineering and architectural services �0.0032870413 Argentus 6112 Wholesale trade Beijer 6111 Wholsesale trade 0.1851880126 Bahcob 3819 Manufacture of fabricated metal products Besam b 3830 Manufacture of electrical machinery �0.0044
300
J.A.Doukas,Martin
Holm
enandN.G.Travlo
s
#Blackwell
Publish
ersLtd,2002

{Journals}E
ufm
/8_3/G
174/m
akeup/G
174.3d
880224 Aseaa 3830 Manufacture of electrical machinery Flakta 3810 Manufacture of fabricated metal products 0.0755880413 Esselte 3420 Printing, publishing and allied industries Kontorsutveckling 3420 Printing, publishing and allied industries 0.0468
880416 Proventus 8103 Financial services Gotabanken 8101 Monetary institution 0.0717880430 Opus 6121 Wholesale trade Sardus 6121 Wholsesale trade 0.1188880621 Ericssona 3830 Manufacture of electrical machinery Radiosystem 3839 Manufacture of electrical apparatus �0.0313880818 Bilsped 7190 Transport services Transatlantic 7120 Water Transport 0.0746880924 Skandia 8201 Insurance Skandia Int 8201 Insurance �0.0047890324 BGB 8310 Real estate Hotorget 8310 Real estate �0.0568890620 WM data 8329 Business services Edebe 8323 Data processing 0.0515890901 Marieberg 3420 Printing, publishing and allied industries Duni 3419 Manufacture of pulp and paper (other) �0.0437891206 PK 8101 Monetary institution Nordbanken 8101 Monetary institution �0.0170900129 Volvo b 3840 Manufacture of transport equipment Akermansb 3820 Manufacture of machinery �0.1001900323 BGB 8310 Real estate Convexa 8310 Real estate 0.0059900402 Aseaa 3830 Manufacture of electrical machinery Incentivea 3849 Manufacture of transport equipment �0.0408900531 Aseaa 3830 Manufacture of electrical machinery Hasselblada 3850 Manufacture of scientific equipment 0.0310
910204 Aritmos 3820 Manufacture of machinery Malmros 3840 Manufacture of transport equipment 0.1819911126 Investora 8102 Financial institution (other) Providentiaa 8102 Financial institution (other) �0.0316940207 Klovern 8310 Real estate Bastionen 8310 Real estate 0.0697
940314 Investora 8102 Financial institution (other) Export Investa 8103 Financial services �0.0231950609 Exab 7000 Real estate Hilab 7000 Real estate �0.1053950609 Prifast 7000 Real estate Stancia 7000 Real estate �0.0440950807 ASG 6310 Cargo handling and storage Frigoscandia 6310 Cargo handling and storage 0.0068950912 Assi Doman 0201 Forestry and logging Hasselfors 0201 Forestry and logging 0.0430
Diversifica
tion,Ownersh
ipandContro
l301
#Blackwell
Publish
ersLtd,2002
{Journals}Eufm/8_3/G174/makeup/G174.3d
Panel C: Average abnormal returns, ARs
Average abnormal return, ARs Positive ARs
DayFocused
Acq. (N=47)DiversifyingAcq. (N=45)
FocusedAcq
DiversifyingAcq.
DifferenceARfoc�ARdiv
�5 �0.0010 (�0.521) �0.0069 (�1.921)* 46.8 46.6 0.0059�4 0.0038 (1.113) �0.0023 (�0.415) 48.9 55.6 0.0061
�3 �0.0015 (�0.190) �0.0005 (0.205) 59.6 46.7 �0.0010�2 0.0006 (0.368) 0.0037 (1.528) 59.6 51.1 �0.0030�1 0.0024 (1.347) 0.0039 (0.696) 66.0 46.7 �0.00160 0.0063 (1.823)* 0.0026 (0.632) 48.9 46.7 0.0037þ1 0.0035 (0.053) �0.0114 (�3.587)*** 48.9 37.8 0.0149***þ2 0.0059 (2.695)** �0.0017 (�0.327) 53.2 48.9 0.0076*þ3 0.0003 (�0.547) �0.0060 (�2.120)** 46.8 35.6 0.0060
þ4 0.0037 (1.392) �0.0024 (�0.287) 51.1 44.4 0.0062þ5 0.0039 (1.817)* �0.0024 (�0.695) 55.3 37.8 0.0063
Panel E: Cumulative abnormal returns (CARs) sorted by type of acquisition and whether thebidder is associated with one of the two conglomerate groups (Wallenberg or SHB) in Sweden.
Means are reported with medians in parentheses. Median testes were conducted using theWilcoxon signrank test. Median difference testes were conducted using the Wilcoxon ranksumtest. ***, ** and * denote significance at the 1%, 5% and 10% levels, respectively. N=92.
Bidder Diversifying Focused Difference
Group member �0.0118(�0.0311)
0.0123(0.0007)
�0.0241(�0.0318)
N=12 N=13
Non-group member �0.0178(�0.0112)
0.0380***(0.0259)***
�0.0558***(�0.0371)***
N=33 N=34Difference 0.0060
(�0.0199)�0.0257*(�0.0252)
Panel D: Cumulative average abnormal returns, CARs
Cumulative abnormal returns, CARsDifference
Trading Interval Focused Acq. (N=46) Diversifying Acq. (N=46) foc�CARdiv
(�5 to þ5) 0.0274 (2.819)*** �0.0237 (�1.941)* 0.0511***(�5 to þ1) 0.0138 (1.509) �0.0112 (�1.082) 0.0250 (2.118)**(�1 to þ1) 0.0119 (1.861)* �0.0052 (�1.305) 0.0171 (1.942)*(�1 to 0) 0.0083 (2.241)** 0.0062 (0.939) 0.0021 (0.300)(0 to þ1) 0.0095 (1.327) �0.0091 (�2.089)** 0.0186 (1.983)**
302 J. A. Doukas, Martin Holmen and N. G. Travlos
# Blackwell Publishers Ltd, 2002

{Journals}Eufm/8_3/G174/makeup/G174.3d
diversification. We revisit this issue in the cross-sectional analysis by explicitlyaccounting for the possible effects of overpayment=underpayment by the bidder.If diversification is driven by internal capital market advantages, firms should
benefit from corporate diversifying activities as they are expected to increase theirexisting internal capital market advantages. Consistent with the predictions of theinternal capital market hypothesis, bidders that are not associated with one of the toptwo conglomerate groups in Sweden are expected to benefit the most from diversifyingacquisitions. Conglomerate group members, however, are expected to experiencesmall gains from similar transactions since they have access to greater internal capitalmarkets. Panel E shows that the diversifying acquisitions of group and non-grouprelated bidders fail to produce significant firm value gains. Focused acquisitions,however, appear to be mostly beneficial for non-group related bidders.Consistent with the findings of Morck et al. (1990), and Doukas and Lang (2002),
these results also imply that acquisitions of related assets have a better fit and they areworth more as part of the bidder’s organization. Consequently, they are expected toproduce synergy gains from increased operational efficiencies, reduction of costs,leveraging of purchasing power with suppliers and synergies. In addition, acquisitionsof related business are expected to increase shareholder value by expanding thebidder’s market share. Although not in the context of focused acquisitions, theSwedish results are also consistent with asset sales (selloffs) studies (see, for example,John and Ofek, 1995) which report that unrelated asset sales (i.e., increased corporatefocus) lead to firm value increases in the seller’s remaining assets. The non-positiveexcess returns of diversifying acquisitions, however, suggest that the newly acquiredassets are expected to interfere with the buyer’s core business operations and,therefore, neutralise any positive synergies. This result is also consistent with Lins andServaes (1999a, b) who find that the agency costs of diversification dominate thepotential benefits in most developed and emerging capital markets.Overall, the evidence is consistent with the view that the market expects operating
inefficiencies and agency costs to outweigh the potential benefits of internal capitalmarkets when firms expand outside their core business by acquiring unrelated assets.The opposite expectation, however, seems to be formed by the market when firmsexpand their core business by acquiring related assets.
4.2. Abnormal returns in intra-conglomerate group acquisitions
In this section we take a closer look at the valuation effects of diversifying and non-diversifying activities of firms controlled by the Wallenberg and SHB conglomerategroups. Table 6 lists the cumulative abnormal stock returns over the 11-day period(i.e., �5 to þ5 days) around the announcement day for the bidder, the target, and thevalue weighted portfolio of bidder and target.Panel A of Table 6 reports the abnormal returns of firms involved in acquisitions
controlled by the Wallenberg group. While 69% of the acquisitions are focused, theevidence suggests that targets realise significant gains regardless of whether the bidderacquires assets related or unrelated to its core business. Bidders do not experiencesignificant losses even when they diversify their operations. While the transaction perse suggests a wealth transfer from bidders to targets, bidder shareholders do not sufferfrom significant losses. Consistent with our previous results reported in Table 5, thisresult suggests that intra-conglomerate industrial diversification (focus) does notdestroy (create) firm value. This is also confirmed by the value weighted portfolio
Diversification, Ownership and Control 303
# Blackwell Publishers Ltd, 2002

{Journals}E
ufm
/8_3/G
174/m
akeup/G
174.3d
Table 6
Sample acquisitions by firms controlled by the Wallenberg and SHB conglomerates.
The sample used in this study consists of Swedish acquisitions over the 1980–95 period. Bidder and target firms were listed on the Stockholm Stock
Exchange (the A-list, the OTC, or the Unofficial list) at the time of the announcement. If the bidder and the target have the same first two-digit industrycode (ISIC), the acquisition is defined as focused and as diversifying when the bidder and the target do not share the same main two-digit industry code. 11-day C cumulative Abnormal Returns (CARs) for the bidder, the target, and the value weighted portfolio of bidder and target shares are computed from the
market model prediction errors. a and b denotes that the firm was controlled by the Wallenberg sphere and the SHB sphere, respectively. ***, ** and *denote significance at the 1%, 5% and 10% levels, respectively.
Panel A: Acquisitions by firms controlled by Wallenberg conglomerate group
Date Bidder Bid ISIC Target Tar ISIC Classification
Bidder
CAR Bid Z
Target
CAR Tar Z
Portfolio
CAR Port Z
810210 Alfa Lavala 3820 Rotora 3820 Focused 0.0661 1.5082 0.2727 5.7873*** 0.0723 1.6365
810411 Aseaa 3830 Elverka 4200 Diversifying 0.0948 1.7335* 0.0077 0.0955 0.0905 1.6516*841203 Papyrusa 3411 Nymollaa 3411 Focused 0.0760 1.7093* 0.3776 7.7018*** 0.1514 3.2074***860929 Storaa 3411 Papyrusa 3411 Focused �0.0451 �0.6973 0.2099 3.2414*** 0.0296 0.4567
880224 Aseaa 3830 Flakta 3810 Focused 0.0755 1.3282 0.2111 3.7071*** 0.0891 1.5661880310 Storaa 3411 Swedish matcha 3311 Diversifying �0.0044 �0.0906 0.2251 4.6132*** 0.0149 0.3045880316 Aseaa 3830 Brostromsa 7120 Diversifying 0.0532 0.9449 0.3522 6.2632*** 0.0556 0.9874880621 Ericssona 3830 Radiosystem 3839 Focused �0.0313 �0.6645 0.2346 2.8091*** �0.0526 �0.6295900402 Aseaa 3830 Incentive a 3849 Focused �0.0408 �1.3251 0.3747 12.1615*** �0.0112 �0.3659900531 Aseaa 3830 Hasselblada 3850 Focused 0.0310 1.0840 0.2244 7.9217*** 0.0368 1.2892910225 Investora 8102 SAABa 3840 Diversifying �0.0932 �1.2062 0.2324 3.0109*** 0.0273 0.3541
911126 Investora 8102 Providentiaa 8102 Focused �0.0316 �0.6078 0.0783 1.4935 0.0091 0.1697940314 Investora 8102 Export investa 8103 Focused �0.0231 �0.5706 0.1863 4.5873*** �0.0038 �0.0961
Mean Agr Z Mean Agr Z Mean Agr Z0.0098 0.8725 0.2298 17.5822*** 0.0391 2.9210***
304
J.A.Doukas,Martin
Holm
enandN.G.Travlo
s
#Blackwell
Publish
ersLtd,2002

{Journals}E
ufm
/8_3/G
174/m
akeup/G
174.3d
Panel B: Acquisitions by firms controlled by SHB conglomerate group
Date Bidder Bid ISIC Target Tar ISIC Classification
Bidder
CAR Bid Z
Target
CAR Tar Z
Portfolio
CAR Port Z
800919 Skanskab 5000 Drott b 8310 Diversifying �0.0350 �1.3086 0.0632 1.8791* �0.0241 �0.9580841122 Volvob 3840 STCb 6132 Diversifying 0.0212 0.5617 0.6891 5.3259*** 0.0613 0.8476850508 Agab 3511 Uddeholmb 3710 Diversifying �0.0403 �1.6194 0.1770 7.0658*** 0.0957 3.8175***851127 Promotionb 3810 Bahcob 3810 Focused 0.0178 0.4055 0.0302 0.6958 0.0224 0.5129860225 Volvob 3840 Sonessonb 3820 Focused 0.0058 0.1306 0.0760 1.9795** 0.0121 0.2970
871026 Industrivardenb 8102 PLM b 3819 Diversifying �0.0354 �0.5475 �0.0696 0.3806 �0.0420 �0.3702880126 Bahcob 3819 Besamb 3830 Focused �0.0044 �0.0637 0.1097 1.6324 0.0086 0.1296891218 Industrivardenb 8102 Dackeb 2950 Diversifying �0.0272 �0.6809 0.3173 5.0260*** 0.0296 0.4718
900129 Volvob 3840 Akermansb 3820 Focused �0.1001 �2.1590** 0.0729 1.5867 �0.0864 �1.8833*900820 Bahcob 3811 Thorsmanb 3560 Diversifying �0.0453 �0.8060 0.1918 3.3263*** �0.0164 �0.3019911917 Industrivardenb 8102 Bahcob 3811 Diversifying 0.0204 0.3672 0.2319 4.2727*** 0.0902 1.6560*940616 Volvob 3840 BCPb 3140 Diversifying �0.0507 �0.9791 0.0455 0.6067 0.0195 0.1785
Mean Agr Z Mean Agr Z Mean Agr Z
�0.0228 �1.9339* 0.1612 9.7507*** 0.0142 1.2695
Diversifica
tion,Ownersh
ipandContro
l305
#Blackwell
Publish
ersLtd,2002

{Journals}Eufm/8_3/G174/makeup/G174.3d
returns. Similar results are reported in Panel B of Table 6 for firms involved inacquisitions controlled by the SHB conglomerate group. While more than 66% ofacquisitions are diversifying, the evidence shows that targets gain significant abnormalreturns. Bidders experience no significant losses whether they invest in related orunrelated assets. Value weighted portfolio returns indicate that bidder’s intra-conglomerate diversifying and non-diversifying investments do not enhance its firmvalue. Overall, the evidence suggests that intra-conglomerate acquisitions benefit theshareholders of targets but they do not harm the minority shareholders of the buyer.The evidence also points out that the market does not anticipate significant operatingefficiency gains from, diversifying or non-diversifying, intra-group acquisitions.
It is noteworthy that Wallenberg and SHB acquire mostly targets that are groupmembers. The only exception is Ericsson’s (Wallenberg) focused acquisition ofRadiosystem.20 In the pure intra-group acquisitions (24 observations) the bidder istypically a dual class firm (23 observations) while the typical target is a one share—one vote firm (14 observations). This practice suggests that Wallenbergs and SHB useintra-group acquisitions to enhance their control. In a dual class firm (bidder) acertain vote fraction requires less capital than in the one share-one vote firm (target).Hence, the controlling bidding shareholder tends to enhance his voting rights (i.e., inexcess of their ownership rights) in intra-group acquisitions that involve a dual classbidder and one share-one vote target. We conclude that intra-group acquisitions aremotivated by control considerations, rather than by the expropriation of minorityshareholders in the transfer of control stakes.
4.3. Increased corporate diversification and bidder short-term returns
We have documented that unrelated acquisitions by Swedish buyers fail to increaseshareholder value while related acquisitions augment buyer’s shareholder value. Intra-conglomerate related and unrelated acquisitions, however, have no significant impacton bidders’ firm value. The non-conglomerate findings suggest that the costsassociated with diversification outweigh the benefits arising from the creation and=orincrease of internal capital markets when managers seek to expand the size and scopeof the firm. In order to test the robustness of these results, we proceed with a cross-section regression analysis that is also designed to control for other effects.
An implication of the diversification hypothesis is that there should be a positiverelation between the abnormal return of the bidder, when a diversifying acquisition isannounced, and the increase in corporate diversification achieved by an acquisition. Inthe regression analysis, the measure of diversification used in testing its influence onfirm value is an indicator variable, DIV, that takes the value of one if the two-digitmain industry code of the bidder is different from the two-digit main industry code ofthe target, and zero otherwise. If diversification benefits the shareholders of thebidding firm through the creation of internal capital market advantages, thecoefficient of the indicator variable, DIV, should be positive and significant. Todistinguish between conglomerate and non-conglomerate acquisitions, we introducethe GROUP binary variable that takes the value of one if the bidder is controlled bythe Wallenberg or SHB group and its interaction term with the diversification
20 Sonesson, Akermans, and BCP were not directly controlled by the SHB group. However, theywere controlled by Volvo, which was controlled (largest vote holder) by SHB.
306 J. A. Doukas, Martin Holmen and N. G. Travlos
# Blackwell Publishers Ltd, 2002

{Journals}Eufm/8_3/G174/makeup/G174.3d
variable, DIV*GROUP. DIV*GROUP examines whether the effect of diversificationis different between group and non-group members. If diversification works for non-group members but not for group members, the sum of the coefficients of DIV andDIV*GROUP variables should be statistically insignificant.We also control for the effects of insider ownership in bidders and the terms and
characteristics of the takeover. The ownership variable, MANOWN, measures thefraction of insider ownership stakes by the CEO and the board of directors of thebidding firm. This variable is used to examine whether bidder’s abnormal returns areaffected by ownership concentration.Furthermore, we control for the method of payment, METPAY, (Travlos, 1987)
and the relative size of the target to the bidder, RELSIZE, (Jarrell and Poulsen, 1989).The METPAY is an indicator variable that is set equal to one if it is a pure cash offer,and zero otherwise. The RELSIZE is measured as the logarithm of the ratio of thetotal sales of the target to the total sales of bidder.21,22 Finally, we introduce theabnormal return of the target, TARCAR, to account for possible overpayment orunderpayment effects by the bidder.Table 7 presents the results of regressions relating bidder’s abnormal return to
measures of increased corporate diversification. All regression results document anegative and significant relation between increases in diversification, DIV, andabnormal announcement returns. The negative and significant coefficient of thediversification variable suggests that industrial diversification results in value lossesfor bidders. The coefficients indicate that bidder’s shares decline by 4.76–6.00%around the announcement of diversifying acquisitions. Hence, returns to firms thatdid not invest outside their core business are 4–6% higher than returns to firms thatdid invest outside their core business. These results also suggest that the value lossdocumented in the aggregate studies of the diversification literature is partlyassociated with the investment activities of the firm. Given that bidders in oursample had a pre-acquisition performance similar to their industry peers while targets’pre-acquisition performance was inferior to their industry peers, our evidence alsosuggests that diversifying investments of this nature are inefficient. The coefficient ofthe GROUP variable indicates that conglomerate bidders experience losses when theyengage in acquisitions as well. As expected, the coefficient of the DIV*GROUPvariable is positive but insignificant suggesting that intra-group diversifyingacquisitions do not result in internal capital market efficiency gains.In an additional set of regressions, results not reported, we relate the bidder’s
abnormal return to an alternative measure of diversification. In these regressions weuse the change in the number of business as a measure of diversification. The negativeand significant coefficient of the increase in the number of segments provides furthersupport for our previous findings. These results indicate that bidders lose more whenthey announce unrelated acquisitions. We find that firms that increased the number ofbusiness segments through diversifying acquisitions experienced 3.3–6.8% lowerreturns than firms that engaged in focused acquisitions (i.e., acquisitions by firms thatdid not increase the number of their business segments). Once again, these resultsimply that decreases in bidder’ equity value stem from the anticipation of cash flow
21The sales figures based on the fiscal year prior to the acquisition announcement year are used.22We have also used an asset-based relative size variable. The results are qualitatively similar tothose reported for the sales-based relative size variable.
Diversification, Ownership and Control 307
# Blackwell Publishers Ltd, 2002
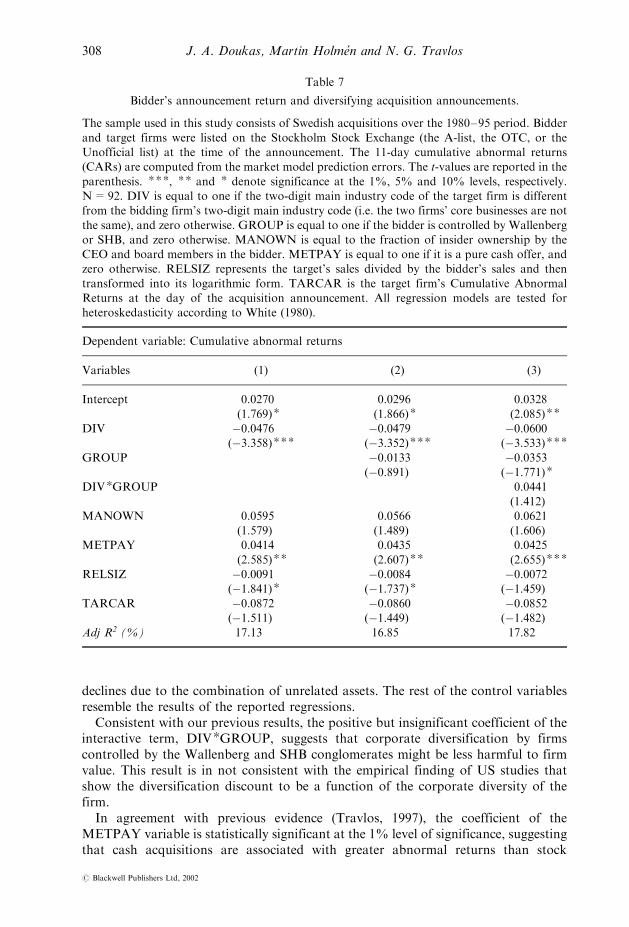
{Journals}Eufm/8_3/G174/makeup/G174.3d
declines due to the combination of unrelated assets. The rest of the control variablesresemble the results of the reported regressions.
Consistent with our previous results, the positive but insignificant coefficient of theinteractive term, DIV*GROUP, suggests that corporate diversification by firmscontrolled by the Wallenberg and SHB conglomerates might be less harmful to firmvalue. This result is in not consistent with the empirical finding of US studies thatshow the diversification discount to be a function of the corporate diversity of thefirm.
In agreement with previous evidence (Travlos, 1997), the coefficient of theMETPAY variable is statistically significant at the 1% level of significance, suggestingthat cash acquisitions are associated with greater abnormal returns than stock
Table 7
Bidder’s announcement return and diversifying acquisition announcements.
The sample used in this study consists of Swedish acquisitions over the 1980–95 period. Bidder
and target firms were listed on the Stockholm Stock Exchange (the A-list, the OTC, or theUnofficial list) at the time of the announcement. The 11-day cumulative abnormal returns(CARs) are computed from the market model prediction errors. The t-values are reported in the
parenthesis. ***, ** and * denote significance at the 1%, 5% and 10% levels, respectively.N=92. DIV is equal to one if the two-digit main industry code of the target firm is differentfrom the bidding firm’s two-digit main industry code (i.e. the two firms’ core businesses are not
the same), and zero otherwise. GROUP is equal to one if the bidder is controlled by Wallenbergor SHB, and zero otherwise. MANOWN is equal to the fraction of insider ownership by theCEO and board members in the bidder. METPAY is equal to one if it is a pure cash offer, andzero otherwise. RELSIZ represents the target’s sales divided by the bidder’s sales and then
transformed into its logarithmic form. TARCAR is the target firm’s Cumulative AbnormalReturns at the day of the acquisition announcement. All regression models are tested forheteroskedasticity according to White (1980).
Dependent variable: Cumulative abnormal returns
Variables (1) (2) (3)
Intercept 0.0270
(1.769)*0.0296
(1.866)*0.0328
(2.085)**DIV �0.0476
(�3.358)***�0.0479(�3.352)***
�0.0600(�3.533)***
GROUP �0.0133(�0.891)
�0.0353(�1.771)*
DIV*GROUP 0.0441
(1.412)MANOWN 0.0595
(1.579)0.0566(1.489)
0.0621(1.606)
METPAY 0.0414
(2.585)**0.0435
(2.607)**0.0425
(2.655)***RELSIZ �0.0091
(�1.841)*�0.0084(�1.737)*
�0.0072(�1.459)
TARCAR �0.0872(�1.511)
�0.0860(�1.449)
�0.0852(�1.482)
Adj R2 (%) 17.13 16.85 17.82
308 J. A. Doukas, Martin Holmen and N. G. Travlos
# Blackwell Publishers Ltd, 2002

{Journals}Eufm/8_3/G174/makeup/G174.3d
acquisitions. Interestingly enough, the coefficient of the RELSIZE variable is negativeand statistically significant at the 5% level of significance in two out of threeregressions. This finding is consistent with the view that large target firms forcebidders to share with targets a large portion of the added value generated by theacquisition. The coefficient of the TARCAR is insignificant at conventional levels ofsignificance and inconsistent with the notion that bidders overpay targets.
5. Diversifying acquisitions and long-term operating performance
We have reported that an increase in corporate diversification results in value lossesfor non-conglomerate related acquisitions. We have attributed this finding to market’santicipation of future cash flow declines arising from increased agency costs andinefficiencies in managing more diverse assets after the merger. This implies that thereshould be a negative relation between the bidder’s long-term performance anddiversification increases. In this section, we use regression analysis to examine therelation between changes in performance and increase in diversification when anacquisition is announced.Following Pagano et al. (1998), we use a fixed-effects model to regress the annual
industry-adjusted changes in operating margin, �(EBITD=Sales), spanning the periodfrom year �3 to year þ3 on the firm’s diversifying acquisition. The effect of thedecision to engage in a diversifying acquisition is captured by dummy variables (DIV).To capture the different effects of diversifying acquisitions on operating performancebetween non-group and group members (GROUP), we also include the interactionvariable between diversification and group member, DIV*GROUP. We also useindustry-adjusted changes in return on assets, �(ROA) and return on equity, �(ROE),as alternative performance measures. Because the internal capital market hypothesisalso predicts that corporate diversification weakens the cash flow constraint, we alsointroduce a cash flow measure, �CF, to investigate whether the expansion of internalcapital markets, stemming from the acquisition, has an effect on the firm’s post-acquisition cash flows. If internal capital markets work, the cash flow constraintshould lessen during the post-acquisition period. Cash flow is measured as theabsolute change in net cash flows (Net Income plus Depreciation) scaled by theaverage net cash flow from year �3 to year 0 (year 0 to year þ3) for the pre-acquisition (post-acquisition) period (j�CFj=Mean CF)). Using a fixed-effect modelallows us to use each bidder before the acquisition as a control for itself after theacquisition.Table 8 presents the coefficient estimates of the effects of diversifying acquisition
dummy variables on three financial performance measures and cash flow volatility.The regression results show that the profit margin steadily declines after thediversifying acquisition. Consistent with the market’s predictions, this result suggeststhat firms that expand their operations by acquiring assets outside their core businessadversely affect their long-term profitability following the acquisition. The effectranges from �2.9% in the first year after the acquisition to �3.4% and �3.9% in thesecond and third years, respectively. The decline in profitability is statisticallysignificant at the 10% level. The coefficients of the interaction terms show that theeffects of diversification for group members are less pronounced relative to non-groupmembers. Even though the difference is insignificant, this suggests that the harmfuleffects of diversification on bidder’s operating efficiency are less dramatic in intra-group acquisitions. Non-group diversifying acquisitions appear to exert mostly
Diversification, Ownership and Control 309
# Blackwell Publishers Ltd, 2002
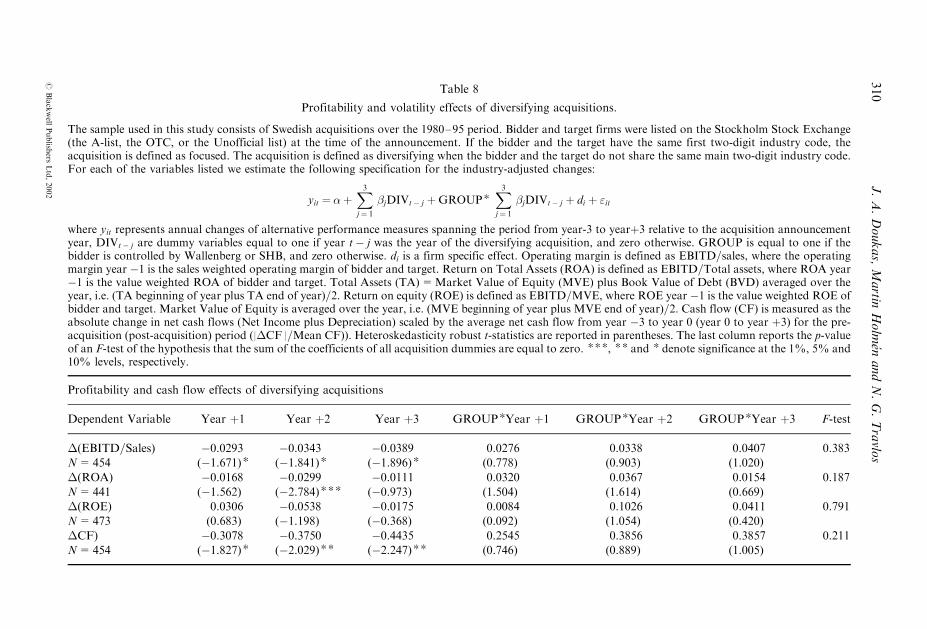
{Journals}E
ufm
/8_3/G
174/m
akeup/G
174.3d
Table 8
Profitability and volatility effects of diversifying acquisitions.
The sample used in this study consists of Swedish acquisitions over the 1980–95 period. Bidder and target firms were listed on the Stockholm Stock Exchange(the A-list, the OTC, or the Unofficial list) at the time of the announcement. If the bidder and the target have the same first two-digit industry code, theacquisition is defined as focused. The acquisition is defined as diversifying when the bidder and the target do not share the same main two-digit industry code.For each of the variables listed we estimate the following specification for the industry-adjusted changes:
yit ¼ �þX3
j¼ 1
�jDIVt� j þGROUP*X3
j¼ 1
�jDIVt� j þ di þ "it
where yit represents annual changes of alternative performance measures spanning the period from year-3 to yearþ3 relative to the acquisition announcementyear, DIVt� j are dummy variables equal to one if year t� j was the year of the diversifying acquisition, and zero otherwise. GROUP is equal to one if thebidder is controlled by Wallenberg or SHB, and zero otherwise. di is a firm specific effect. Operating margin is defined as EBITD=sales, where the operatingmargin year �1 is the sales weighted operating margin of bidder and target. Return on Total Assets (ROA) is defined as EBITD=Total assets, where ROA year�1 is the value weighted ROA of bidder and target. Total Assets (TA)=Market Value of Equity (MVE) plus Book Value of Debt (BVD) averaged over theyear, i.e. (TA beginning of year plus TA end of year)=2. Return on equity (ROE) is defined as EBITD=MVE, where ROE year �1 is the value weighted ROE ofbidder and target. Market Value of Equity is averaged over the year, i.e. (MVE beginning of year plus MVE end of year)=2. Cash flow (CF) is measured as theabsolute change in net cash flows (Net Income plus Depreciation) scaled by the average net cash flow from year �3 to year 0 (year 0 to year þ3) for the pre-acquisition (post-acquisition) period (|�CF |=Mean CF)). Heteroskedasticity robust t-statistics are reported in parentheses. The last column reports the p-valueof an F-test of the hypothesis that the sum of the coefficients of all acquisition dummies are equal to zero. ***, ** and * denote significance at the 1%, 5% and10% levels, respectively.
Profitability and cash flow effects of diversifying acquisitions
Dependent Variable Year þ1 Year þ2 Year þ3 GROUP*Year þ1 GROUP*Year þ2 GROUP*Year þ3 F-test
�(EBITD=Sales)N=454
�0.0293(�1.671)*
�0.0343(�1.841)*
�0.0389(�1.896)*
0.0276(0.778)
0.0338(0.903)
0.0407(1.020)
0.383
�(ROA)N=441
�0.0168(�1.562)
�0.0299(�2.784)***
�0.0111(�0.973)
0.0320(1.504)
0.0367(1.614)
0.0154(0.669)
0.187
�(ROE)N=473
0.0306(0.683)
�0.0538(�1.198)
�0.0175(�0.368)
0.0084(0.092)
0.1026(1.054)
0.0411(0.420)
0.791
�CF)N=454
�0.3078(�1.827)*
�0.3750(�2.029)**
�0.4435(�2.247)**
0.2545(0.746)
0.3856(0.889)
0.3857(1.005)
0.211
310
J.A.Doukas,Martin
Holm
enandN.G.Travlo
s
#Blackwell
Publish
ersLtd,2002

{Journals}Eufm/8_3/G174/makeup/G174.3d
negative influence on the other financial measures of performance following theacquisition year as well.The negative impact on long-term performance is also found on bidder’s ROA
while no significant effect is found on bidder’s ROE. In contrast with the view thatcorporate diversification increases firm value by generating internal capital marketadvantages, our results show that expansion outside the core business of Swedishbidders does not improve long-term profitability. Consistent with Jensen (1986), andStulz (1990), our evidence suggests that diversification benefits do not exceed costsrooted in increased agency problems and operating inefficiencies of the diversifiedfirm. Our findings are also consistent with recent studies (see, for example, John andOfek (1995)) which show that long-term operating performance improves when firmsdivest unrelated assets to their core business.While diversification fails to increase firm value and operating performance, it
reduces the cash flow volatility of the bidder as indicated in the last regression. Theabsolute changes in yearly cash flows decrease significantly in the post-diversifyingacquisition years. However, the cash flow volatility decreases do not seem toimprove bidder’s post-acquisition operating performance. If the decline in cash flowvolatility is one of the internal capital market benefits arising from thediversification, it seems that they are not strong enough to improve bidder’s post-acquisition performance.
6. Conclusion
In this study we examine whether the act of corporate diversification increases theshort- and long-term performance of 101 Swedish bidding firms over the 1980–95period. We also examine the diversification effects of conglomerate-affiliated firmsthat acquire targets controlled by the same conglomerate group. Our findings are notconsistent with the view that diversification creates value.Consistent with the agency cost theory, our evidence based on non-conglomerate
diversifying acquisitions, seems to suggest that investing in unrelated assets results ingreater agency costs and operating inefficiencies that outweigh the diversificationbenefits. We find investments in peripheral lines of businesses to have adverse effectson the short- and long-term performance of the firm, suggesting that corporatemanagers engage in diversifying investment activities at the expense of shareholderwealth. Announcement and post-acquisition performance gains are realised whenbidders expand their core line of business.Intra-conglomerate diversifying acquisitions, however, show that bidders do not
realise significant gains whether they undertake diversifying or focusing investmentstrategies by purchasing firms controlled by the Wallenbergs and SHB conglomerategroups. Intra-group targets realise significant gains regardless of bidder’s investmentstrategy. Our evidence also shows that there are no substantive wealth transfers frombidder to target shareholders in intra-conglomerate acquisitions. Finally, our findingsdo not necessarily support the view that intra-conglomerate acquisitions are associatedwith expropriation of minority shareholders. However, intra-group acquisitions appearto enhance the control rights of large shareholders of the bidding firm since in thetypical intra-group acquisition the bidder is a dual class firm while the target is a oneshare-one vote firm.
Diversification, Ownership and Control 311
# Blackwell Publishers Ltd, 2002

{Journals}Eufm/8_3/G174/makeup/G174.3d
References
Agnblad, J., Berglof, E., Hogfeldt, P. and Svancar, H. ‘Ownership and control in Sweden:
strong owners, weak minorities, and social control, in M. Becht and C. Mayer (eds), TheControl of Corporate Europe, (Oxford University Press, 2000).
Alchian, A. ‘Corporate management and property rights’, in H. G. Mainne (ed.), Economic Policyand the Regulation of Corporate Securities (Washington DC: American Enterprise Institute, 1969).
Bebchuck, L., Kraakman, R. and Triantis, G. ‘Stock pyramids, cross-ownership, and dual classequity’, Working Paper (Harvard Law School, 1998).
Berger, P. and Ofek, E. ‘Diversification’s effect on firm value’, Journal of Financial Economics,
1995, 39–65.Berger, P. and Ofek, E. ‘Bustup takeovers and value-destroying diversified firms’, Journal ofFinance, 1996, 1175–1200.
Bergstrom, C. and Rydqvist, K. Stock Price Reactions to Tender Offers in Sweden (SNSOccasional Paper No. 11, 1989).
Billet, M. and Mauer, D. ‘Cross-subsidies external financing constraints, and the contributionof internal capital markets to firm value’, Working Paper (University of Iowa, 1998).
Bradley, M., Desai, A. and Kim, E. ‘Synergistic gains from corporate acquisitions and theirdivisions between stockholders of target and acquiring firms’, Journal of Financial Economics,1998, pp. 3–40.
Campa, J. M. and Kedia, S. ‘Explaining the diversification discount’, Working Paper (HarvardBusiness School, 2001).
Chevalier, J. A. ‘Why do firms undertake diversifying mergers? An examination of the
investment policies of merging firms’, Working Paper (University of Chicago, 1999).Claessens, S., Djankov, S., Fan, J. and Lang, L. ‘The separation of ownership and control inEast Asian Corporations’, Journal of Financial Economics, Vol. 58, 2000, pp. 81–112.
Doukas, J. and Lang, L. ‘Foreign direct investment, diversification and firm performance’,Working Paper (New York University, 2002).
Faccio, M. and Lang, L. ‘The separation of ownership and control. An analysis of ultimateownership in Western European corporations’, Working Paper (Universita Cattolica del
Sacro Coure, 2000).Faccio, M. and Lang, L. ‘The ultimate ownership of Western European corporations’, Journalof Financial Economics, forthcoming, 2002.
Graham, J. R., Lemmon, M. L. and Wolf, J. ‘Does corporate diversification destroy value?’Working Paper (Duke University). Journal of Finance, forthcoming, 2002.
Hubbard, G. R, and Palia, D. ‘A re-examination of the conglomerate merger wave in the 1960s:
an internal capital markets view’, Journal of Finance, Vol. 54, 1999, pp. 1131–1152.Hyland, D. C., ‘Why firms diversify: an empirical examination’, Working Paper (University ofTexas Arlington, 1999).
Jarrell, G. and Poulsen, A., ‘The returns to acquiring firms in tender offers: evidence from three
decades’, Financial Management, 1989. pp. 12–19.Jensen, M., ‘Agency costs of free cash flow, corporate finance, and takeover’, AmericanEconomic Review, Vol. 76, 1986, pp. 323–329.
John, K. and Ofek, E. ‘Asset sales and increase in focus’, Journal of Financial Economics, 1995,pp. 105–126.
Kaplan, S. N. and Weisbach, M. S., ‘The success of acquisitions: evidence from divestitures’,
Journal of Finance, Vol. 47, 1992, pp. 107–138.Khanna, T. and Palepu, K., ‘Why focused strategies may be wrong for emerging markets’,Harvard Business Review, 1997, pp. 41–51.
Khanna, T. and Palepu, K., ‘Is group affiliation profitable in emerging markets? An analysis ofdiversified Indian business groups’, Journal of Finance, Vol. 55, 2000, pp. 867–891.
Lamont, O., ‘Cash flow and investment: evidence from internal capital markets’, Journal ofFinance, Vol. 52, 1997, pp. 83–109.
312 J. A. Doukas, Martin Holmen and N. G. Travlos
# Blackwell Publishers Ltd, 2002
{Journals}Eufm/8_3/G174/makeup/G174.3d
Lang, L. and Stulz, R., ‘Tobin’s q, corporate diversification, and firm performance’, Journal ofPolitical Economy, 1994, pp. 1248–1280.
La Porta, R., Lopez-de-Silanes, F. and Schleifer, A., ‘Corporate ownership around the world’,Journal of Finance, Vol. 54, 1999, pp. 471–517.
Lins, K. and Servaes, H., ‘International evidence on the value of corporate diversification’,Journal of Finance, Vol. 54, 1999a, pp. 2215–2239.
Lins, K. and Servaes, H., ‘Is corporate diversification beneficial in emerging markets?’ WorkingPaper (University of North Carolina at Chapel Hill and London Business School, 1999b).
Maskimovic, V. and Phillips, G., ‘Do conglomerate firms allocate resources inefficiently across
industries?’ Journal of Finance, forthcoming, 2002.Maksimovic, V. and Phillips, G., ‘The market for corporate assets: who engages in mergers andasset sales and are there efficiency gains?’ Journal of Finance, forthcoming, 2002.
Matsusaka, J. G., ‘Takeover motives during the conglomerate merger wave’, Rand Journal ofEconomics, Vol. 24, 1993, pp. 357–379.
Matsusaka, J. G. and Nanda, V., ‘Internal capital markets and corporate refocusing’, Working
Paper (University of Southern California, 1996).Morck, R., Shleifer, A. and Vishny, R., ‘Do managerial objectives drive bad acquisitions’,Journal of Finance, 1990, pp. 31–48.
Pagano, M., Panetta, F. and Zingales, L., ‘Why do companies go public? An empirical
investigation’, Journal of Finance, Vol. 53, 1998, pp. 27–64.Palepu, K., ‘Diversification strategy, profit performance and the entropy measure’, StrategicManagement Journal, Vol. 6, 1985, pp. 239–255.
Rajan, R., Servaes, H. and Zingales, L., ‘The cost of diversity: the diversification discount andinefficient investment’, Journal of Finance, Vol. 55, 2000, pp. 35–80.
Ravenscraft, D. J. and Scherer, F. M., Mergers, Sell-offs, and Economic Efficiency (Washington
DC: Brookings Institute, 1987).Rumelt, R., Strategy, Structure, and Economic Performance (Harvard University Press, 1974).Rydqvist, K., ‘The division of takeover gains in Sweden’, CEPR Working Paper No. 31, 1993.
Scharfstein, D. S., ‘The dark side of internal capital markets II: evidence from diversifiedconglomerates’, Working Paper (MIT, 1996).
Scharfstein, D. S. and Stein, J., ‘The dark side of internal capital markets: divisional rent-seeking and inefficient investment’, Working Paper (MIT, 1996).
Servaes, H., ‘The value of diversification during the conglomerate merger wave’, Journal ofFinance, 1996, pp. 1201–1225.
Shin, H.-H. and Stulz, R. M., ‘Are internal capital markets efficient?’, Quarterly Journal of
Economics, Vol. 113, 1998, pp. 531–552.Shleifer, A. and, Vishny, R., ‘A survey of corporate governance’, Quarterly Journal of Finance,Vol. 52, 1997, pp. 737–783.
Stein, J. C., ‘Internal capital markets and the competition for corporate resources’, Journal ofFinance, Vol. 52, 1997, pp. 111–133.
Stulz, R., ‘Managerial discretion and optimal financing policies’, Journal of FinancialEconomics, 1990, pp. 3–27.
Sundqvist, S. I., Owners and Power in Sweden’s Listed Companies (Dagens Nyheter’s PublishingCompany, 1985–93).
Sundin, A. and Sundqvist, S. I., Owners and Power in Sweden’s Listed Companies (Dagens
Nyheter’s Publishing Company, 1994–95).Sweden’s Largest Companies (Ekonomisk Litteratur Publishing Company, 1980–96).Travlos, N., ‘Corporate takeover bids, method of payment, and bidding firms’ stock returns’,
Journal of Finance, 1987, pp. 943–963.Villalonga, B., ‘Diversification discount or premium? New evidence from BITS establishment-level data’, Working Paper (University of California, Los Angeles, 2000).
Weston, J. F, ‘Mergers and acquisitions in business planning’, Rivista Internationale di ScienzeEconomiche e Commerciali, April 1970, pp. 309–320.
Diversification, Ownership and Control 313
# Blackwell Publishers Ltd, 2002

{Journals}Eufm/8_3/G174/makeup/G174.3d
White, H., ‘A heteroskedasticity-consistent covariance matrix and a direct test forheteroskedasticity’, Econometrica, 1980, pp. 721–746.
Whited, T. M., ‘Is it inefficient investment that causes the diversification discount?’, Journal ofFinance, Vol. 56 no. 5, 2001, pp. 1667–1691.
Williamson, O., Corporate Control and Business Behavior: an Inquiry into the Effects ofOrganizational Form on Enterprise Behavior (Prentice Hall, New Jersey, 1970).
Williamson, O. E., Markets and Hierarchies (New York: Free Press, 1975).Williamson, O. E., The Economic Institutions of Capitalism: Firms, Markets, RelationalContracting (New York: Free Press, 1985).
Wolfenzon, D., ‘A theory of pyramidal structures’, Working Paper (Harvard Business School,1999).
314 J. A. Doukas, Martin Holmen and N. G. Travlos
# Blackwell Publishers Ltd, 2002