diversification discount or premium? evidence from merger
TRANSCRIPT

Diversification Discount or Premium?
Evidence from Merger Announcements
by
Douglas Bunim
An honors thesis submitted in partial fulfillment
of the requirements for the degree of
Bachelor of Science
Undergraduate College
Leonard N. Stern School of Business
New York University
May 2005
Professor Marti G. Subrahmanyam Professor Heitor Almeida
Faculty Adviser Thesis Advisor

1
Diversification Discount or Premium?
Evidence from Merger Announcements
DOUGLAS BUNIM
ABSTRACT
I use an event study methodology to analyze the existence of the diversification discount. I
examine a sample of 5,042 acquisitions by public firms between 1985-2005, using a cumulative
abnormal return window of (-1,+1) around the day of the announcement. I find that a statistically
significant premium of 1.17% exists for firms announcing diversifying acquisitions. After
controlling for various deal specific factors, the diversification premium becomes insignificant for
the period as a whole. However, upon further analysis of abnormal returns by years as well, an
insignificant discount exists for both 1985-1989 and 1990-1994, getting closer to zero in the first
half the 90s. For 1995-2005, however, a significant premium emerges, shedding further light on
the notion that the diversification discount or premium may be a factor of the time period being
analyzed.
There has been much research into whether a conglomerate discount exists. Most findings in
the past, including those of Lang and Stulz (1994), Berger and Ofek (1995) and Servaes (1996)
find that diversified firms trade at discounts relative to the summation of the prices of single-
segment firms. More recently however, there have been other papers suggesting that the discount
is merely a result of a biased sample selection. Villalonga (1999) and Campa and Kedia (2002)
find that most diversified firms traded at a discount prior to diversifying and suggest that they
only diversify to find new sources of investment. Once the selection bias was corrected, the
diversification discount was either eliminated or turned into a premium. Graham, Lemmon, and
Wolf (2002) show that half or more of the discount can be explained by the fact that the
segments acquired by diversifying firms were also discounted prior to acquisition. These more
recent papers do not contradict the fact that as a whole conglomerates trade at a discount, they
merely show that diversifying firms trade at a discount because they always traded at a discount
even before diversifying.
Most recently, there has been a revolutionizing idea that diversified firms actually trade at
premiums. Villalonga (2004) finds that the previously described discount was a result of
incorrectly measuring diversification in the first place. Previous papers had used COMPUSTAT,
which breaks companies down into business segments, as financially reported by companies
under rules set forth by the Financial Accounting Standards Board (FASB). However, a new
database called the Business Information Tracking Series (BITS) allows the user to “construct
business units that are more consistently and objectively defined than segments, and thus more
comparable across firms” (p. 479). She finds that a diversification discount exists when firms’
activities are broken down into COMPUSTAT segments, which are those segments as reported
by the companies. However, writes Villalonga (2004, p. 481) “when the same firm’s activities
are broken down into BITS business units, diversified firms trade a significant average premium
relative to comparable portfolios of single-business firms.” Villalonga also suggests that her

2
findings can be interpreted as evidence that a discount exists for unrelated (conglomerate)
diversification, but a premium exists for related diversification.
Most research in the past has been based on sum of the part’s analysis using Tobin’s q-ratio
to determine whether the company is trading at a premium or discount. This method requires
many assumptions about how many sectors or business units a company is actually engaged in
and trying to construct a similar portfolio. This error in estimating the number of actually
business units only exacerbates the error associated with LeBaron and Speidell’s (1987)
assumption that the standalone q of divisions of conglomerates is well approximated by the
average q of specialized firms in the same industry.
Therefore, a more practical approach to determining whether diversification destroys value is
by using an event study. Andrade, Mitchell and Stafford (2001, p. 109) state:
The most statistically reliable evidence on whether mergers create value for shareholders
comes from traditional short-window event studies, where the average abnormal stock
market reaction at merger announcement is used as a gauge of value creation or destruction.
In a capital market that is efficient with respect to public information, stock prices quickly
adjust following a merger announcement, incorporating any expected value changes.
A few papers in the past have used short-window event studies to analyze whether there is
really a discount for diversification, however, only two papers actually focus on the
diversification discount. Morck, Shleifer and Vishny (1990) and Matsusaka (1993) study
shareholder returns of related v. unrelated acquisitions from the 1960s through the 1980s. The
results are basically complementary to each other, showing a diversification premium in the late
1960s during the merger wave, neither a discount nor a premium in the 1970s, and a major
discount in the 1980s during the conglomerate “bust-up” era. More recently, Graham et al.
(2002) focused on a long-term event study, but as a side also calculated the cumulative abnormal
returns (CAR) to shareholders for a short-window using data from 1980-1995. They find a
negative CAR for the acquirer shareholders in unrelated acquisitions, but also find a negative
CAR for related acquisitions. This is probably the result of a sample bias, as they only studied
acquisitions of public targets. Moeller, Schlingemann and Stulz (2004) recently sampled the
most extensive number of acquisitions, over 12,000, from 1980-2001. However, they focus
mainly on other aspects of the merger, discussing unrelated acquisitions for only about a
paragraph. They find a statistically significant negative coefficient in their regression for
unrelated acquisitions.
I employ a three-day event window (-1,+1) around the announcement of the merger (day 0),
to calculate the CAR for the bidding firm’s shareholders. I studied 5,042 completed acquisitions
between January 1985 and March 2005. Using the SIC codes from Securities Data Corporation
(SDC), not COMPUSTAT, I group every firm (both acquirers and targets) into conglomerates
and pure-plays. If the firm operates in more than two SIC codes on 2-digit level then it is a
conglomerate, otherwise it is a pure-play firm. Any differences between SIC codes on a 3-digit
level is deemed as related diversification, and therefore I continue to see the firm as a pure-play.
I likewise group all mergers into those that are diversifying and those that are strategic. If the
target’s main SIC code is the same as any SIC code of the bidder on a 2-digit level, the
acquisition is strategic in nature, otherwise it is diversifying.
Replicating the results of Moeller et al (2004) with regard to CAR and abnormal dollar
return, I find a CAR for all bidding firm shareholders to be a statistically significant 1% (at the

3
1% level), with a negative cumulative abnormal dollar return of about -$44.381 million per
announcement (at the 1% level). Similar to Moeller et al. (2004), I also find this to be the result
of the size effect, that small acquirers notice positive CARs on average whereas the larger
acquirers on average have negative CARs upon announcement of acquisitions. Therefore, the
value weighted CAR is negative. After controlling for certain deal characteristics, I still found
the size effect to be significant at the 1% level. In addition, acquisitions of public firms had a
negative impact on the equal weighted CAR at a 1% significance level.
With regard to the diversification discount, I find that before controlling for any deal
characteristics, there is a significant diversification premium based on CARs at the 1%
significant level for the 20 year period under investigation. However, upon breaking up the
sample into 5 year intervals, there exists an insignificant discount for 1985-1989, an insignificant
premium for 1990-1995, and a significant premium of 1.71% (at the 1% level) and 1.81% (at the
5% level), for 1995-1999 and 2000-2005, respectively. Upon controlling for deal characteristics
such as size and public status of the target, I find that the premium on diversification for the
entire 20 year period becomes insignificant. However, upon further breakdown, the same results
occur for 1985-1989 and 1990-1995, that is an insignificant discount and premium, respectively.
For the second decade, 1995-2005, I find a significant premium of 1.07% at the 5% level.
Interestingly, I find no real positive or negative affect on the CAR depending on whether or not
the acquirer is already a conglomerate and is further diversifying, or if the acquirer is a pure-play
and is diversifying for the first time.
Assuming that event studies show the true value of diversification, upon joining my results
with those of Morck et al. (1990) and Matsusaka (1993), it appears that in some time periods
there is a diversification discount and in others there is a premium. There are many reasons
justifying both a premium and discount. There are benefits to diversification such as imperfectly
correlated cash flows which allow the firm to take on more debt (Lewellen, 1971) and an internal
capital market created by the conglomerate structure allowing for more efficient resource
allocation (Westin, 1970). There are also costs to diversification such as overinvestment in
underperforming divisions (Stulz, 1990) and increased information asymmetry costs between
central management and divisional managers (Myerson, 1982; Harris, Kriebel, and Raviv (1982).
Back in the 1960s when capital markets were less efficient, the internal capital market
created by the conglomerate structure was used to fund necessary positive net present value
projects (Bernstein, 1992; Bhide, 1990). Then, as the capital markets became more efficient, the
internal capital markets became less efficient, being used to subsidize value destroying projects.
However, there are still many benefits to the conglomerate structure, which acts as an “efficient
form of organizing economic activities” (Martin and Sayrak, 2003, p. 40). Therefore, though the
strategic rational behind the recent cross-industry merger wave is different from that during the
conglomerate merger wave of the 1960s (Martin et al., 2003), the new ‘no-border’ economy in
which we operate has for some reason revived the efficiency of, and the need for, the internal
capital markets.
Though many of my results have applications for the general field of merger event studies,
this paper differs from other event studies papers by focusing in particular on the market’s
associated value, or lack thereof, to diversification. This paper examines whether the market
reacts differently to conglomerates making acquisitions as opposed to pure-play firms. Also, it
discusses if there is a difference in returns when the target being acquired is already a
conglomerate.
1 I find a higher dollar abnormal return than Moeller et al. (2004).

4
The rest of the paper is organized as follows. Section I is a discussion of previous research on
the conglomerate discount theory and whether or not it exists. Section II describes the sample,
data and methods. Section III analyzes the results. Section IV explains why a premium or
discount might exist and attempts to understand why it changes through time. Section V
concludes.
I. Review of Previous Empirical Research on the Conglomerate Discount/Premium
A. The Conglomerate Discount Theory from Non-Event Study Literature2
A1. Diversification Destroys Shareholder Value
Scharfstein (1998, p. 1) sums up this position as: “The consensus among academic
researchers, consultants, and investment bankers is that diversified firms destroy value.” Most of
this evidence comes from Tobin’s Q3 analysis which finds that diversified firms trade at
discounts when compared to a portfolio of comparable stand alone firms.4 Maksimovic and
Philips (2002) measure the growth and efficiency of firms and their business segments from
plant level data for the period of 1975-1992 and find that conglomerates are less productive than
similar stand alone firms of comparable size. Furthermore, when conglomerates decide to
increase their focus, the market tends to react favorably.5 With regards to focusing decisions
increasing shareholder wealth, Daley, Mehrotra and Sivakumar (1997) found that spin-offs
where a firm sheds a two digit SIC code in which it operates adds more value than own-industry
spin-offs. John and Ofek (1995) find evidence of improved operating performance over the three
years following the sale of assets that lead to increased corporate focus.
A2. The Discount is the Result of the Endogeneity of the Diversification Decision
More recent research has begun to focus on whether diversification actually destroys value.
These studies do not question whether diversified firms are discounted, rather they analyze
whether this discount is attributable to sample selection factors. The basis of this line of
reasoning is that the segments in a conglomerate are somehow different than pure-play firms in
that all firms have the option of diversifying. Therefore, there is some bias involved in why they
chose to diversify in the first place. Graham et al. (2002), Hyland (1999), Campa and Kedia
(2002) and Villalonga (1999) find that diversified firms trade at discounts prior to diversifying.
Lang & Stulz (1994) document how diversifying firms are poor performers prior to
conglomeration. Hyland (1999) claims that conglomerate firms adopt a diversification strategy in
search of growth opportunities, essentially buying growth. Campa and Kedia (2002, p 1759)
state, “A firm’s choice to diversify is likely to be a response to exogenous changes in the firm’s
environment that also affect firm value…Firms that choose to diversify have higher value than
exiting firms in their industry and lower value than other firms in the industry that remain
focused.” Once these sample selection biases are controlled for, the authors find that the discount
either drops or disappears, sometimes even turning into a slight premium. Campa and Kedia
2 Martin and Sayrak (2003) provide a detailed review of the literature and I rely heavily upon their work.
3 Wernerfelt and Montgomery (1988), Lang and Stulz (1994), and Servaes (1996).
4 Berger and Ofek (1995), Servaes and Lins (1999), and Lamont and Polk (2000).
5 Daley, Mehrotra and Sivakumar (1997), Desai and Jain (1999), and John and Ofek (1995).

5
(2002, p 1760) also add that “diversification is a value-enhancing strategy for those firms that
actually pursue it.”
A3. A Diversification Premium Actually Exists
Only one paper really takes this position. Belén Villalonga (2004) claims that all previous
attempts to assess the diversification discount are flawed because of their reliance on reported
segment data. She points out three limitations in using segment data. First, the extent of
diversification in segment financials is lower than the true extent of a firm’s industrial
diversification. This is due to standards set forth by the Financial Accounting Standards Board
(FASB) prior to 1997,6 which only required the 10% materiality rules, where segments only need
to be reported if they constitute 10% or more of sales, assets, or profits. Firms also need not
report more than ten segments in any year, when many firms operate in more than ten distinct
segments. Lichtenberg (1991) finds that this ten segment constraint is binding for 17% of all
COMPUSTAT firms, while Montgomery (1994) finds it binding for 56% of the 500 largest
public companies.
Second, the segment definition itself creates problems. The Statement of Financial
Accounting Standards (SFAS) 14 defines a segment as a “component of an enterprise engaged in
providing a product or service or a group of related products and services primarily to
unaffiliated customers (i.e. customers out the enterprise) for a profit” (FASB (1976), paragraph
10a).” This allows managers to group together two or more activities that are vertically or
otherwise related into a single segment. This problem is further aggravated by the fact that
segments are self reported and managers have an incentive to misrepresent the true segments.7
Segments are identified by a name by the reporting company and COMPUSTAT then assigns the
segment a 4 digit SIC code. Davis and Duhaime (1992) report that in 5-10% of the companies
they study, businesses that are neither related nor vertically integrated are group into one
segment.
Third, firms frequently change the segments they report without any real change in
operations. Denis, Denis and Sarin (1997) and Hyland (1999) find that about one-fourth of
changes in the reported number of segments in COMPUSTAT were reporting changes only, as
opposed to real changes in firm structure.
These three biases together distort the industries and segments whereby industries may be
misallocated to firms and firms that are present in more than one industry may be labeled as
pure-plays. This misclassification distorts the Tobin’s Q-ratio used to benchmark valuation of
segments. As Villalonga puts it, “the ‘pure-play’ qs imputed to segments may not be so pure” (pg
481). Using the Business Information Tracking Series (BITS), a new database compiled by the
U.S. Census Department that covers the whole U.S. economy at the establishment level,
Villalonga constructs business units that overcome the segment problems. She notes, “Unlike
segments, business units are constructed in a way that makes them comparable across firms, and
6 FAS 131 replaced FAS 14 in 1997 which made segment reporting slightly more regulated. It stipulated that the
10% materiality rule applied to combined assets not consolidated assets (e.g., pre-elimination entries). Also, 10% of
net income was changed to 10% of the absolute value of net income (accounting for years of losses). In addition,
management was instructed to report segments based on how they viewed them internally, i.e. according to internal
managerial segments. Though SFAS 131 has resulted in a greater number of segments being reported by certain
firms (Berger and Hann, 2002, 2003), these improvements do not affect diversification discount studies whose
samples all include pre-1997 data. 7 Hayes and Lundholm (1996) find that diversified firms aggregate activities into segments to avoid disclosing to
competitors which segments are most profitable.

6
the maximum number of business units for a firm is not limited to 10.” (pg 484) Using data form
1989-1996, Villalonga finds a diversification discount when firm’s activities are broken down
into COMPUSTAT segments. However, when firms were broken down by BITS business units,
she finds that diversified firms traded at significant average premiums relative to a comparable
portfolio of pure-play firms.
B. Long-Term Event Studies
The results of long term event studies may be insignificant as Andrade et al. (2002) point out
that there are a number of “methodological concerns” with long-term even studies. “Three-year
expected returns can easily range from 30% to 65%, depending on the model used, making it
very difficult to determine whether an abnormal return of 15% is statistically significant.” 8 (pg.
112)
Nevertheless, Bradley, Desai and Kim (1988) find that the abnormal returns to acquirers
from 1981-1984 is -2.93% for all acquisitions, regardless of motive. Agrawal, Jaffe and
Mandelker (1992) find that bidding firms lose a statistically significant 10% of value during the
five year post merger period. Desai and Jain (1999) discover that long term abnormal returns
spanning the three years following a spin-off that increases corporate focus are 47% higher than
the returns to firms that engage in non-focusing spin-offs. Megginson, Morgan and Nail (2000)
study long-term abnormal returns for diversifying mergers and find that focus decreasing
mergers result in a 25% loss of shareholder wealth by the third post-merger year. In addition,
they find that every 10% decrease in focus results in a $9 loss in shareholder wealth. Graham et
al. (2002) analyze the conglomerate discount theory through an event study, focusing their
attention on the value of the firm over a 3 year period, (t-1, t+1) with t=0 being the year of the
merger. They evaluate what the combined firm’s market capitalization should have been in year
t+1 based on their t-1 market values and find that excess value firm (the difference between the
implied value based on Tobin’s q analysis and the actual value) decreases after the diversifying
event. However, they note that most of this can be attributed to the fact that the segments in the
sample were discounted before being acquired.
C. Short Term Event Study Research
Morck et al. (1990) were the first to focus on analyzing whether diversifying acquisitions had
a negative impact on the stock price of acquirers using an event study. They studied only public
mergers from 1975-1987 and use a window of (-2, +1) with Day 0 being the announcement day.
They use two measures of relatedness, the first comparing the lines of business based on SIC
codes and the second using the correlation coefficient of monthly stock returns between the
target and the bidder over the three years prior to the acquisition. I will focus on the first method
because it is more closely aligned9 to this paper. Morck et al. use 4-digit SIC codes when
attempting to distinguish between diversified firms. They use the Broadstreet Million Dollar
8 For more information on this see: Barber and Lyon (1997), Kothari and Warner (1997), Fama (1998), Mitchell and
Stafford (2000) and (Brav, 2000). These papers question every aspect of the long-term event studies, from the
calculation of the point estimates to the assumptions required to assess statistical significance. 9 Morck et al. (1990) only use the second measure to assess whether the acquisition was for the purposes of
diversifying either personal or firm risk. They also note the weakness of the results using the second measure.
Morck et al. write “One reason the results are weaker is that we split the sample at the median, and call acquisitions
with above median stock return correlation related, even though according to our previous measure of relatedness
over two thirds of the acquisitions are unrelated.”

7
Directory (MDD) to obtain the 4-digit SIC codes of the three main lines of business (by sales)
that the firm operates in, and if there were fewer than three, all codes were used. Mergers are
then classified as related if the bidder and target share any 4-digit SIC codes in common among
the top three businesses in which they operate.
Before reviewing their results, I consider there to be three flaws in their analysis. First,
Morck et al. (1990) only analyze bidder share price returns over the event window, without
comparing the share prices to any know benchmark such an as index, to calculate the CAR.
Second, using only the top three 4 digit SIC codes by sales is erred. Diversified firms tend to
group activities together for reporting purposes to hide the most lucrative operations (Hayes and
Lundholm, 1996) thereby incorrectly attributing the SIC codes to sales. Also, by only comparing
the top 3 SIC codes of the bidder to the target (assuming the SIC codes are correct), the sample
of related acquisitions is biased towards bidders who are either smaller conglomerates or pure-
play firms. For example, on September 29, 2004 Cendant Corporation (a conglomerate) acquired
Orbitz, an online travel service company. Cendant was previously involved in this line of
business, already owning Cheaptickets and Lodging.com. Due to Cendant’s large size both by
revenue and diversification measures, the online travel business was not one of Cendant’s top 3
businesses by sales. However, the acquisition of Orbitz immediately launched Cendant from the
#5 online travel service company to the #2 player with 20% market share (Banc of America
Securities Equity Research, 2004). This acquisition was clearly strategic in nature.
Nevertheless, Morck et al. (1990) find that when the bidder and target share a 4-digit SIC
industry, the mean bidder return is 2.38% v. -1.89% in unrelated acquisitions. Neither of the two
returns are statistically different from 0 and nor is their difference of 4.2%. Interestingly, when
the sample is further broken down into acquisitions occurring in the 1970s and acquisitions
occurring in the 1980s, the difference between the related and unrelated acquisitions drastically
changes. From 1975-79, bidders notice a stock price appreciation of 1.54% for related
acquisitions, and 0.227% for unrelated acquisitions. From 1980-1987, related bidders for related
acquisitions notice an increase in stock price of 2.88% while diversifying bidders lose 4.09% in
share price. Though none of these numbers are statistically significant themselves or from each
other, the large change between the 1970s and 1980s is noteworthy.
Matsusaka (1993) looks at a sample of 199 manufacturing sector acquisitions in the years
1968, 1971, and 1974. He looks at both public and private targets without ever differentiating
between the two in analysis, thereby biasing the resulting CARs upwards as 128 of the final 199
combinations involved private targets. For calculating the CAR, he used a market model based
on a 240 day interval beginning 300 days before the acquisition, and calculated CAR over a 10
day window of (-5,+5), with the announcement date as day 0. A notable exception in his study is
that he measures CAR in dollars, not in percentages. However, he adds that his results do not
change when he used percentages. He defines a merger as “diversifying” if the buyer and target
do not have any 2-digit SIC code in common, and “related” if the buyer and target share a two
digit SIC code. Matsusaka finds that buyers earned significantly positive announcement-period
returns during the conglomerate merger wave for diversifying acquisitions. Furthermore, from
his data, “it can be seen that buyers who diversified earned significantly positive returns in 1968-
1974, approximately zero returns in 1975-1979, and significantly negative returns in 1980-
1987.” (Matsusaka, 1993, pg. 376)
Graham et al. (2002), discuss an event study using a three-day (-1,+1) period surrounding the
announcement date as reported by SDC. They find that mean three-day announcement period
CAR of the bidders in unrelated acquisitions is negative. However, they also find a negative

8
CAR for bidders in non-related acquisitions. Their result is probably due to a sample bias of only
using public targets which consistently have statistically significant negative coefficients when
regressed against bidder returns (in comparison to private targets). Another bias in their research
is they define classification on a 4-digit SIC level similar to Morck et al. (1990).
Moeller et al. (2004) did an extensive event study on mergers from 1980-2001 analyzing
12,023 acquisitions by public bidders. They focus on all aspects of the deal, performing
numerous regressions. In one of the later regressions they included a “conglomerate” dummy
which is defined as deals involving “targets with a 2-digit SIC code other than that of the
bidder.” (p. 211) In the regression which controlled for the size effect, public/private effect,
payment method (equity vs. cash), and other variables, they find a statistically significant and
negative coefficient for the conglomerate variable at the 5 or 10% level depending on certain
controls. Moeller et al. have a more strict definition of a strategic deal. I believe a strategic deal
is where the target SIC code matches any SIC code of the bidder (on a 2-digit level) whereas
Moeller et al. define an unrelated acquisition as those where the main SIC codes do not match on
a two digit level. In addition, Moeller et al. include the entire 1980s in their data, a period when
there probably was a statistically significant negative impact on abnormal returns for diversifying
acquisitions.
II. Data
I collected from Security Data Corporation’s (SDC) U.S. Mergers and Acquisitions (M&A)
Database all mergers between both domestic bidders and targets, where the initial bid
announcement occurred between January 1, 1985 and March 5, 200510
. Only acquisitions
between two distinct entities were included--no share repurchases or divestitures were pulled. I
then used the tickers provided by SDC to pull the historical stock prices of the acquirers from
FACTSET11
. To be included in the sample, mergers had to meet the following conditions (in
order of deletion from the sample):
1. The target firm must be either public, private or the subsidiary of a public firm12
.
2. FACTSET must have been able to pull stock prices for ten trading days both before and
after the day of announcement (t=0).
3. The announcement day of the acquisition has to itself be a trading day.
4. The acquirer must own less than 50% of the outstanding stock of the target prior to the
announcement of the acquisition, and 100% following the acquisition (deal must be
completed).
10
Fuller, Netter & Stegemoller (2002) tested a random sample of 500 acquisitions from SDC using similar
parameters to mine to verify the announcement dates listed on SDC. For 92.6% of the sample, the announcement
date provided by SDC was correct, and for the rest it was off at most by two days. Similar to Fuller et al., I did not
check for confounding events. However, as Fuller et al. noted, even if I do not have the exact date (which rarely
occurs) or if there is a random confounding event, it biases against finding significant returns for acquirers in my
sample. A problem not addressed by either Fuller or myself is that identified by Bhagat Shleifer and Vishny (2001)
that bidders can choose to announce the bid along with another positive announcement to make the bid look better.
Furthermore, this is more likely for bids of private targets than public targets due to regulatory restrictions
surrounding the announcement of acquisitions of public targets. 11
I realize the upward bias that this introduces into my data as FACTSET uses tickers to track companies and pull
stock prices. It is quite plausible the sample of companies for which I was able to obtain prices is weighted towards
the better performing companies that made better acquisition decisions and thereby were able to avoid being the
targets of acquisitions at later dates. 12
Subsidiaries and private firms are grouped together in analysis under the label of Private Firms.

9
5. The target’s last twelve months’ (LTM) sales as pulled from SDC must be present and
greater than zero.
6. The acquirer’s sales must be present either in SDC or in FACTSET’s database. Similarly,
the sales number must be greater than zero.
7. Acquiring firms must be publicly traded on the NYSE, NASDAQ, or AMEX.
8. The Acquirer name as pulled by FACTSET based on the SDC ticker must match the
name of the acquirer as listed in SDC, except where prices were correct because of a
name change in previous years. 13
9. Two merger announcements by the same acquirer cannot be within five trading days of
each other otherwise both announcements are deleted.
10. Target LTM sales as reported by SDC must be greater than or equal to 5% of the
acquirer’s sales as reported by either SDC or FACTSET.
11. Acquirer’s market capitalization on the day of announcement must be present in
FACTSET’s database.
I initially pulled a sample of 70,869 mergers from SDC, 12,655 of which FACTSET has
stock prices for. I then set the requirement that the bidder must have owned less than 50% of the
target prior to the announcement because I wanted to capture the effect of going from a non
consolidation basis to a consolidation basis14
. In addition, the requirement of 100% was set to
ensure that given there was a premium paid for the target, the target’s books would be written up
to the full 100% of fair value15
. Also, as I used a sales criteria for determining the cutoff for
relative size of the target vis-à-vis the acquirer, I wanted the parent to be able to consolidate the
full 100% of sales from the target the following year, as opposed to having a portion of the
subsidiaries sales (which trickle down to net income) be apportioned to minority interest rather
than to the parents retained earnings16
.
Continuing with my use of sales as the relative size criteria, I deleted all acquisitions where
SDC did not have the sales of the target. For the acquirers, however, since they were all public, if
FACTSET’s database had the acquirer’s sales and SDC did not, I used FACTSET’s number. I
realize the slight bias in my sample this may introduce as SDC uses LTM sales whereas
FACTSET uses calendar year sales. However, for the purposes of simply trying to use a relative
size measure between the target and the acquirer whereby the target was sufficiently large
enough to have an impact on the share price of the acquirer, I did not see this bias as influencing
statistical significance of my results. My next criterion was that the exchange the company
13
I went through all approximately 5,000 instances individually where the names did not match using a simple IF
function on the two columns. About 3,400 were merely errors in whether the database used Inc. or Incorporated for
the company name. The other 1,600 required additional attention to see if a new company had picked up the ticker
of an old company and the prices were therefore wrong, or if FACTSET was simply attaching the name of the firm
that acquired the acquirer in a year post the initial merger. For example, any acquisition by Montgomery Securities
is listed by FACTSET as an acquisition by Bank of America, yet the share prices attached to the acquisition are
Montgomery’s stock prices, not Bank of America’s. In addition, many companies change their names through the
course of business as their focus changes, yet keep the same ticker. The acquirer’s closing share price on Day -1 (the
day prior to announcement) must be the same or a multiple of (due to stock splits) the reported closing share price
the day before announcement as reported by SDC. Of the 1,600 that required additional attention, only 500 were
actual errors. 14
According to Financial Accounting Standards Board Statement (SFAS) 94, if a parent company has a controlling
financial interest though direct or indirect ownership of a majority voting interest (greater than 50%) in a subsidiary,
it must consolidate the subsidiary’s financial statements into its own for financial reporting purposes. 15
See Accounting Principles Board (APB) No. 16 and Accounting Research Bulletin (ARB) No. 51. 16
See Accounting Principles Board (APB) No. 16 and Accounting Research Bulletin (ARB) No. 51.

10
traded on was the NYSE, NASDAQ, or AMEX. This measure was implemented to assure
liquidity of the stock. This last set of deletions brought the number of mergers down to 10,083.
I then compared the names attached to FACTSET’s prices to the names SDC used, to make
sure that the tickers were correct in SDC. The only time an error occurred was when a new
company picked up the ticker of a previously public company. The historical prices would then
track the new company attached to that ticker. For example, prior to 1995, the ticker C was
Chrysler’s ticker. Now Citigroup trades under C. FACTSET therefore pulls the stock prices for
Traveler’s Group for the 1980’s. This process brought the sample down to 9,506 mergers.
I then eliminated all the acquisitions announced by the same company within a five day
window of each other because in clustered takeovers where the bidder acquires two or more
firms within five days, it is difficult to isolate the bidder’s return for a particular target (Fuller et
al., 2002). I then removed all acquisitions where target sales were less than 5% of the acquirer’s
sales because I felt the merger was not material. Lastly, for purposes of using equity value as a
size variable in my analysis, I deleted all acquisitions for which FACTSET did not have the
equity value of the firm on the day of announcement. This left me with a fairly large sample of
5,042 mergers.
A. Determination of Firm Size
I employ a simple scheme for determining relative size of bidding firms as Small, Midsize, or
Large. I divided the mergers up by year of announcement and ranked each acquiring firm from
smallest to largest, based on Market Capitalization on the day of announcement. The smallest
33% were classified as small, the next 33% as Midsize, and the largest 33% as Large. So
therefore in each year of data approximately 33% are classified as small, mid, and large
(approximately because the number of mergers in a given year was not always a multiple of 3). I
realize the bias that this introduces as the market value cutoffs in every year change arbitrarily.
However, I was using this measure mainly to compare small firms to large firms, and therefore
the arbitrary change between midsize and another category did not affect my analysis as no firms
changed between small and large during the sample period, unless as part of a new merged
entity. Moeller et al. (2004, p. 205) used a more complicated and precise metric whereby they
divided firms between only large and small and defined small as “those with a market
capitalization below the 25th
percentile of NYSE firms in the year in which the acquisition is
announced.”
B. Diversification Measures
Similar to Andrade et al. (2002), Servaes (1996) and Berger & Ofek (1995), I define a firm as
a conglomerate if it operates in two different SIC codes, as reported by SDC, on a 2-digit level17
.
Servaes (1996, p. 1205) points out that that “management literature classifies a firm operating in
several related 4-digit SIC code industries within the same 2-digit SIC code as a firm that has
entered into related diversification.” Unrelated diversification is defined as operating in several
2-digit SIC codes18
. All non-conglomerates are defined as pure-plays.
Along the same lines, I define acquisitions as diversifying or unrelated if the target’s primary
SIC code does not match any SIC code of the acquirer on a 2-digit level. I only use the primary
17
I realize that even this measure of diversification has its faults. See Martin et al. (2003) and Villalonga (2004) for
more information on this topic. 18
See Palepu (1985).

11
SIC code of the target because I want the capture the main business in which the target is
engaged. I compare the target’s SIC code to all the SIC codes of the bidding firm so that the
aforementioned Cendant example would be coded a strategic or related acquisition.
C. Calculation of Cumulative Abnormal Returns (CAR)
I calculate CAR using the most commonly used event window of three days (-1,1) around the
announcement date provided by SDC. Similar to Fuller et al. (2002), I follow Brown and
Warner’s standard event methodology to estimate abnormal returns using a modified market
model:
ARi = ri - rm (1)
where ri is the return on firm i and rm is the daily return on the S&P500. I realize the bias that
may be introduced by using the S&P500 since it is weighted in favor of the large-cap companies,
however it is still a commonly used proxy of for the US equity markets. There may also be
criticism for using a beta of one and the CAPM model altogether19
. As Fuller et al. (2002, p. 775)
notes “it has been shown that for short-window event studies, weighting the market return by the
firm’s beta does not significantly improve estimation.”20
III. Results
A. Basic Results Without Any Controls
Table I shows the number of acquisitions by year. Similar to Moeller et al. (2004), the
number of acquisitions does not increase monotonically though time: it falls in the l990 and in
recent years. However, the number of acquisitions for the five year period of 1985-1989 is
significantly lower than any other five year period. The mean cumulative abnormal return is
presented next to each year. There is a significant and positive CAR for the bidder’s share prices
in every five year period except the most recent, where there is a CAR of zero to five decimal
places. Also, similar to Moeller et al. I find a cumulative abnormal return for the entire 20 year
period of 0.82%, which is slightly lower than Moeller et al., but probably only a result of the five
year difference in our data sets (Moeller et al. studied mergers from 1980-2001).
However, upon further analysis of this positive abnormal return, shareholders actually lose
value on a dollar basis. Table II, Panel A shows that the mean cumulative abnormal return over
the 20 year period is positive and significant, while the Abnormal Dollar Return turns out to be
negative and significant (Moeller et al. (2004) received the same result). I calculate the abnormal
dollar returns by multiplying the cumulative abnormal returns (in percent) by the market
capitalization of the acquirer on the day of the announcement (Day 0). Panel B of Table II breaks
out the abnormal percentage and dollar returns by firm size. Though I report the results for the
midsize acquirers, as mentioned before, I will only focus on results for the small and large
companies because of the slight arbitrariness as to how I define company size. It becomes come
quite clear that the large firms notice negative and significant abnormal returns of 0.51% upon
announcement of an acquisition and the small firms experience positive and significant abnormal
returns of 2.18%. It therefore makes sense that the equal weighted cumulative abnormal returns
for the sample as a whole are positive while on an aggregate shareholders actually lost wealth. I
will discuss this size effect more in the next section. Though it has been identified that the equal
19
See MacKinlay (1997) for a more detailed explanation of the failures of CAPM. 20
See Brown and Warner (1980) for a comparison of the market model with the market-and-risk adjusted model.

12
weighted CAR does not actually represent true shareholder wealth creation, I will continue to
analyze the abnormal returns on a percentage basis. The focus of the analysis is on the difference
in CARs between different types of mergers, not the actual CARs themselves. Also, in the
regression, I include a size control.
Table III presents the deal characteristics that are of more importance in analyzing whether a
diversification discount or premium exists. Though many of the numbers are positive and
statistically significant, the real focus of the analysis, as aforementioned, is on the difference
column in each panel. Panel A compares public to private mergers where private includes both
private companies and subsidiaries of public targets. I only use this measure to extract the
significant and negative abnormal return associated with public mergers, so this does not really
affect results.
In Panel B I begin to analyze deal specific characteristics associated with diversification and
how it is valued. Interestingly, the difference in abnormal returns between acquirers that are
conglomerates and those that are pure-plays is not significantly different from zero. In Panel C, it
appears that without any other deal controls, acquirer’s notice better abnormal returns when
acquiring a pure play as opposed to an already diversified conglomerate.
Panel D begins showing interesting results. Conglomerates who acquire other conglomerates
do worse (in terms of abnormal returns) than conglomerates who acquire pure-play targets by
2.66% at the 1% significance level. However, pure-play firms that acquire conglomerates notice
better abnormal returns than conglomerates that acquire other conglomerate, at the 5%
significance level. This seems to imply that the initial diversification by a pure-play is valued
higher, showing a diversification premium. However, this could merely be the result of the size
effect where there are more small pure-plays.
Panel E and F really focus on the idea of diversification. Panel E shows that firms making
diversifying acquisitions experience abnormal returns that are 1.17% higher than firms making
strategic acquisitions (at the 1% significance level). Panel F breaks down each merger into the
type of acquirer (conglomerate v. pure-play) and the type of deal (diversifying v. strategic). The
only significant difference is that conglomerates making diversifying acquisitions notice a 1.14%
higher abnormal return than conglomerates making strategic acquisitions, further supporting the
diversification premium.
B. The Size Effect
Based on the previous analysis of the abnormal percentage returns vs. the abnormal dollar
returns, it is obvious that small firms notice higher abnormal returns than large firms. So a
necessary control, as implemented by Moeller et al. (2004) as well, is to see (1) if this difference
holds true in every type of deal and (2) to see if our results from Table II were simply biases of
how many small vs. large deals were in each type of acquisition.
Table IV essentially presents the same results as Table III, only it further breaks everything
down into size of the acquirer involved in the acquisition. As can be seen from the difference
column down on right side between the large acquirers and small acquirers, in almost every
instance there is a smaller abnormal return for large acquirers at the 1% or 5% significance level.
Moeller et al. (2004, p. 226) devote much of their paper to analyzing this size phenomenon
and conclude that “large firms offer larger acquisition premiums than small firms and enter
acquisition with negative dollar synergy gains.” Furthermore, small firm announcements exhibit
positive synergy gains. They find their results consistent with the manager hubris theory that
managers of large firms will spend more on acquisitions because they believe that they know
13
what they are doing. Also, large established firms are more likely to have exhausted their growth
opportunities than small firms and therefore face agency problems with free cash flow. Demsetz
and Lehn (1985) find that the incentives of the managers in smaller firms are better aligned with
those of the shareholders because managers in smaller firms typically have more firm ownership.
It can be seen in Panel A that deals involving private targets consistently yield better results
for the acquirer in across all sizes, at the 1% significance level. Moeller et al. (2004) and Fuller
et al. (2002) both find this as well. Panel C in Table IV shows that once the deals are broken out
by acquirer size, there no longer is a significant difference between conglomerate targets and
pure-play targets in terms of abnormal returns (we ignore the midsize acquirer). Panel D displays
that large conglomerates who acquire other conglomerates notice statistically significant negative
abnormal returns, but this is not the case for large pure-play acquirers who merge with
conglomerate targets. Though the positive abnormal return for large pure-play acquirers is not
significant, the difference in abnormal returns between them and large conglomerate acquirers
(difference (a) – (c)) is significant (at the 5% level).
With regards to diversifying acquisitions, we see again (Panel E) that there definitely is not a
discount. There is a positive yet insignificant premium for large and midsize acquirers and a
significant premium of 1.48% for small acquirers who diversify (at the 5% level). Additionally,
Panel F once again shows that conglomerates that further diversify notice better abnormal returns
than conglomerates that make strategic acquisitions (difference (a) – (b)), at the 10% significance
level.
C. The Public Target Effect
Table V splits up the mergers similar to Table IV, however this time the focus is on the
difference between the acquisition of public targets and private (and subsidiary) targets. The
difference column on the far right shows that public targets yield acquirers lower abnormal
returns across all acquisition types at the 1% significance level (except for a conglomerate
further diversifying, in which case it holds true at the 5% significance level). Private targets
consistently yield higher abnormal returns than public targets. Moeller et al. (2004) and Fuller et
al. (2002) found this with their data as well, along with Chang (1998) and Hansen and Lott
(1996). Hansen and Lott hypothesize that since investors are diversified, when a public bidder
acquires a public target, shareholders will be indifferent as to how the gains from the acquisition
will be divided (assuming they own stock in both firms). However, when a public bidder
acquires a private target, the bidder’s shareholders will capture some of the gains from the
acquisition. Fuller et al. (2002) argue that private firms can be bought at a discount in
comparison to their true value because of liquidity issues. They point out hat sales of public
targets are auction like in nature and regulated by the SEC whereas private firms, at best, can
have a financial advisor who attempts to promote an auction like atmosphere with many
interested bidders. In addition, Mitchell, Pulvino, and Stafford (2004) provide evidence that with
equity deals involving public targets, arbitragers put downward pressure on the stock price of the
acquirers by taking long positions in the target’s stock and short positions in the bidder’s stock.
When the data is broken up by private v. public as it is in Table V, no significant differences
exist in the data between types of mergers. This statistically significant control will have an
impact on the regression. It should be noted that in Panel E, though only at a 10% significance
level, a premium still exists for an already established conglomerate further diversifying as
opposed to making a strategic acquisition (difference (a) – (b)).

14
D. The Year Effect
Since many authors in the past (Morck et al., 1990; Matsusaka, 1993; and Graham et al.,
2002) discuss a diversification discount in event studies in the 1980s, I decided to see if there are
different results for diversification between different 5 year periods. Table VI summarizes the
results. Similar to Morck el al. who analyzed a period from 1980-1987, I find a statistically
insignificant discount for 1985-1989 and an insignificant premium for the first half of the 90s.
However, for both the second half the 1990s and for 2000-2005, there exist significant premiums
on diversification in the order of 1.77% and 1.81%, respectively.
E. Testing for the Value of Diversification Using Controls and Regression
I ran five different regressions based on different time periods. As can be seen in Table VII,
the five time periods that were regressed are: (1) 1985-2005, (2) 1985-1989, (3) 1990-1994, (4)
1990-2005 and (5) 1995-2005.
The dependant variable in every regression is the equal weighted cumulative abnormal return
over the time period and the controls I included are public status of the target, a size control,
relative size of the target vis-à-vis the acquirer, and whether the acquirer and target were
conglomerates or pure-plays. The independent variable I am most interested in is obviously the
diversifying acquisition one. Diversifying Acquisition, Public, Acquirer Conglomerate, and
Target Conglomerate are all dummy variables which take the value of 1 when the merger is a
diversifying acquisition, the target is public, the acquirer is a conglomerate, and the target is a
conglomerate, respectively. Similar to Moeller et al. (2004), I use the natural log of the market
capitalization of the acquirer denoted as ln (market cap) as my continuous size control. The
relative size control is calculated as the LTM sales of target divided by the LTM sales of the
acquirer.
As expected, the Public dummy and ln (market cap) are statistically significant and negative
at the 1% level in every regression except for the period from 1985-1989. The regression model
for that time period is the least valuable of all the models, having the lowest R2 of 0.69%.
Interesting to note is in the Regression 3 (1990-1994), the acquirer being a conglomerate had a
negative impact on the abnormal return with a statistical significance at the 5% level. Also
noteworthy, but not as surprising after seeing Table III, conglomerate targets had positive
impacts on abnormal returns with statistical significance of 10% (Regression 1).
Once all the controls were added in, as was done in the regressions, for the entire 20 year
span as a whole, diversifying acquisitions had no statistical impact on the abnormal returns.
Neither a discount nor a premium exists. In Regression 2 (1985-1989), we are not surprised by
the diversifying variable having a statistically insignificant negative coefficient. Surprisingly,
this coefficient remained insignificant and negative for Regression 3 (1990-1994) as well. The
associated p-value however indicated even less significance for this negative coefficient in the
early 90s. As expected, for Regression 5 (1995-2005), diversification has an associated
premium, marked by a positive and significant coefficient of 0.0107. Additionally, as a
robustness check for previous results from the Tables (results omitted), over the entire 20 year
period, already established conglomerates who made further diversifying acquisitions as opposed
to strategic acquisitions, noticed a positive abnormal return of 0.78% at the 10% significance
level (factoring in the same controls as in the regressions).
I find in my results what Morck et al. (1990), Matsusaka (1993) and Klein (2001) find in
their data as well. Though they analyzed the 1960s-1980s, they all conclude that the
diversification discount/premium is time dependant. I find the same results for the last 20 years,

15
finding no significant premium or discount for 1985-1994, but a significant premium for 1995-
2005.
IV. Justifications for the Discount and Premium
A. Benefits of Diversification
The gains from diversification could arise from many sources. Diversified firms are larger
and cash flows come from more diverse sources allowing the firm to have a less risky cash flow
stream. This gives rise to Lewellen’s (1971) financial theory, based on insurance, that combining
businesses with cash flows that are not perfectly correlated allow the firm to increase its debt
capacity. This option to increase debt can be seen as value added. In addition, these cash flows
can give rise to a superior means of funding through an internal capital market, which creates
value in numerous ways. First, internally raised capital is cheaper than external financing. The
firm avoids the transaction costs associated with going to the markets (investment banking costs,
issuance costs, legal fees) and, as Hadlock, Ryngaert and Thomas (2001) argue, the firm gains
from a reduction in the adverse selection problem related to time-of-equity issues. Furthermore,
as Alchain (1969), Weston (1970) and Williamson (1975) discuss, managers can use internal
financing to exercise superior decision making control over project selection, rather than leave
the decision making up to the whims of the market participants. Diversified firms also can use
firm specific assets to internalize market failures (Khanna and Palepu, 2000). Finally, though
Schoar (1999) finds that conglomerates appear to be discounted, he also notes that divisions of
conglomerates are more productive than others in their industry.
B. Costs of Diversification
The same situations that can be sources of potential value for diversified firms also create
potential costs to shareholders. Diversified firms only exacerbate managerial agency problems.
Internal capital markets allow for the inefficient allocation of capital amongst divisions.21
Jensen
(1986, 1993) points out that managers tend to over-invest when the firm has excess cash flow,
thereby taking on negative net present value (NPV) projects. Even if the diversified firm does not
have excess cash flow, Harris et al. (1982) show that diversified firms do a worse job of
allocating resources due to information asymmetry problems between central management and
division mangers. Wulf (1998) combined agency and allocation efficiency problems in a moral
hazard model where managers of well-established, large divisions have an incentive to use their
influence to skew capital budgeting in their favor. In addition, the dilemma of designing optimal
incentive compensation programs is further aggravated by the diversified structure. Aron (1988)
and Rotenberg and Saloner (1994) show that stock options and grants are less valuable in the
diversified structure as operating managers within a given division can only be responsible for
the profits of their own segment, whereas the equity is representative of the combined
performance of all operating divisions.
C. Internal Capital Markets of Today
It appears that conglomerates were valued at a premium in the 1960s and a discount in the
1980s. Klein (2001) and Matsusaka (1993) find that a diversification premium existed in the
1960s during the major conglomeration wave. Using Tobin’s Q analysis, Klein (2001) finds a
21
See Stulz (1990); Lamont (1997); Scharfstein (1998); and Rajan, Servaes, and Zingales (2000).

16
statistically insignificant discount for 1969-1971, but a statistically significant discount of 0.17
for 1972-1974. Morck et al. (1990) and Matsusaka (1993), for the 1970s, find either a slight
diversification premium or neither a premium nor a discount, based on event studies. Almost all
research finds a discount to diversification in a 1980s. Most literature analyzing the 1960s
through 1980s attributes this continual downward pressure on the conglomerate valuation as a
result of internal capital markets and their efficiency as the public capital markets become more
efficient (Klein 2001). Bernstein (1992) states that the investment community in the 1960s was a
small, close knit group where competition was minimal and peer influence strong. Bhide (1990,
p. 76) states that “internal capital markets…may well have possessed a significant edge because
the external markets were not highly developed. In those days, one’s success on Wall Street
reportedly depended far more on personal connections than analytical prowess.” However,
Bhide (1990) sees the internal capital markets in the 1970s as less important as the public capital
markets became more efficient. Klein (2001, p. 759) writes, “As the cost of external finance has
fallen, firms have tended to rely less on internal finance, and thus the value added from internal-
capital-market allocation has fallen.” As the external capital markets became more efficient,
companies began using external capital markets to fund truly positive NPV projects and internal
capital markets to fund value-destroying projects.
However, as Villalonga (2004) and I show, the 1990s witnessed a reversal of this discount
even as capital markets became more efficient. Martin et al. (2003, p. 40) discuss economies of
scope “whereby the diversified firm is an efficient form of organizing economic activities….The
firm may be able to utilize its corporate legal and financial staffs to support a variety of different
industries.” Regardless of the reason for this revival in efficiency of the conglomerate structure
and internal capital markets, the point is that diversification is once again creating value for
shareholders.
V. Conclusions
Much of the research in the past has been dedicated to assessing the validity behind a
discount or a premium for diversification using Tobin’s q analysis. The most efficient way,
however, to analyze diversifications true value, is through a short-term event study calculating
abnormal returns on the day of announcement of acquisitions. Through my event study, in
which I replicated many of the findings of Moeller et al. (2004) with regards to cumulative
abnormal returns, the size effect, and the public status of the target effect, it became clear that
diversification is viewed differently in different time periods. It seems that the current economy
has created the need for internal capital markets and as a result, the huge conglomerate structures
are once again seen as value creators rather than destroyers. Many studies in the past have
focused on trying to prove or disprove the conglomerate discount theory. However, as I have
shown, for the last decade there has definitely been a premium of 1.07% associated with
diversification. Going forward, the research should instead be focused on why diversification has
again become a value-added structure given the efficiency of our current domestic markets. If in
today’s markets, “diversification is easier and cheaper for the stockholder than the corporation”
(Brealey and Myers, 2000, p. 946), then why has there been a reemergence of a phenomenon not
seen since the late 1960s-early 1970s?

17
References
Agrawal, A., Jaffe, J.F., Mandelker, G.N., 1992. The post-merger performance of acquiring
firms: a re-examination of an anomaly. Journal of Finance 47, 1605-1621.
Alchain, A., 1969. Corporate management and property rights. In: Manne, H. (Ed.), Economic
Policy and the Regulation of Corporate Securities. American Enterprise Institute,
Washington, DC, pp. 337-360.
American Institute of Certified Public Accountants: Committee on Accounting Procedure, 1959.
Accounting Research Bulletin No. 51: Consolidated Financial Statements (CAP, AICPA,
New York, NY).
American Institute of Certified Public Accountants, 1970. Accounting Principles Board Opinion
No. 16: Business Combinations (APB, AICPA, New York, NY).
Andrade, G., Mitchell, M., Stafford, E., 2001. New evidence and perspectives on mergers.
Journal of Economic Perspectives 15, 103-120.
Aron, D., 1988. Ability, moral hazard, firm size and diversification. The RAND Journal of
Economics 19, 72-87.
Banc of America Securities Equity Research, 2004. Cendant Corp.
Barber, B.M., Lyon, J.D., 1997. Detecting long-run abnormal stock returns: the empirical power
and specification of test-statistics. Journal of Financial Economics 43, 341-372.
Berger, P.G., Hann, R., 2002. Segment disclosures, proprietary costs, and the market for
corporate control. Unpublished manuscript, University of Chicago and University of
Southern California.
Berger, P.G., Hann, R., 2003. The impact of SFAS No. 131 on information and monitoring.
Journal of Accounting Research 41, 163-223.
Berger, P.G., Ofek, E., 1995. Diversification’s effect on firm value. Journal of Financial
Economics 37, 39-65.
Bernstein, P.L., 1992. Capital Ideas: The Improbable Origins of Modern Wall Street. Free Press,
New York.
Bhagat, S., Shleifer, A., Vishny, R.W., 1990. Hostile takeovers in the 1980s: The return to
corporate specialization. Brookings Papers on Economic Activity: Microeconomics, 1-72.
Bhide, A., 1990. Reversing corporate diversification. Journal of Applied Corporate Finance 3,
70-81.
Bradley, M., Desai, A., Kim, E. H., 1988. Synergistic gains from corporate acquisitions and their
division between the stockholders of target and acquiring firms. Journal of Financial
Economics 21, 3-40.
Brav, A., 2000. Inference in long-horizon event studies: A parametric bootstrap approach with
application to initial public offerings. Journal of Finance 55, 1979-2016.
Brealey, R.A., Myers, S.C., 2000. Principles of Corporate Finance, 6th edn. McGraw-Hill, New
York.
Brown, S.J., Warner, J.B., 1985. Measuring security price performance. Journal of Financial
Economics 8, 205-258.
Campa, J.-M, Kedia, S., 2002. Explaining the diversification discount. Journal of Finance 57,
1731-1761.
Chang, S., 1998. Takeovers of privately held targets, method of payment, and bidder returns.
Journal of Finance 53, 773-784.
Daley, L., Mehrotra, V., Sivakumar, R., 1997. Corporate focus and value creation: evidence from
spinoffs. Journal of Financial Economics 45, 257-281.

18
Davis, R., Duhaime, I.M., 1992. Diversification, industry analysis and vertical integration: new
perspectives and measurement. Strategic Management Journal, 511-524.
Demsetz, H., Lehn, K., 1985. The structure of corporate ownership: Causes and consequences.
Journal of Political Economy, 1155-1177.
Denis, D.J., Denis, D.K., Sarin, A., 1997. Agency problems, equity ownership and corporate
diversification. Journal of Finance 52, 135-160.
Desai, H., Jain, P.C., 1999. Firm performance and focus: long-run stock market performance
following spinoffs. Journal of Financial Economics 54, 75-101.
Fama, E. F., 1998. Market efficiency, long-term returns, and behavioral finance. Journal of
Financial Economics 49, 283-306.
Financial Accounting Standards Board, 1976. Statement of Financial Accounting Standards No.
14: Financial Reporting for Segments of a Business Enterprise (FASB, Norwalk, CT).
Financial Accounting Standards Board, 1987. Statement of Financial Accounting Standards No.
94: Consolidation of All Majority-owned Subsidiaries (FASB, Norwalk, CT).
Financial Accounting Standards Board, 1997. Statement of Financial Accounting Standards No.
131: Disclosures about Segments of an Enterprise and Related Information (FASB,
Norwalk, CT).
Fuller, K., Netter, J., Stegemoller, M., 2002. What do returns to acquiring firms tell us? Evidence
from firms that make many acquisitions. Journal of Finance 57, 1763-1794.
Graham, J.R., Lemmon, M.L., Wolf, J., 2002. Does corporate diversification destroy value?
Journal of Finance 57, 695-720.
Hadlock, C., Ryngaert, M., Thomas, S., 2001. Corporate structure and equity offerings: are there
benefits to diversification? Journal of Business, in press.
Hansen, R.G., Lott, J., 1996. Externalities and corporate objectives in a world with diversified
shareholders/consumers. Journal of Financial and Quantitative Analysis 31, 43-68.
Harris, M., Kriebel, C.H., Raviv, A., 1982. Asymmetric information, incentives and intrafirm
resource allocation. Management Science, 604620.
Hayes, R.M., Lundholm, R., 1996. Segment reporting to the capital market in the presence of a
competitor. Journal of Accounting Research 31, 261-279.
Hyland, D., 1999. Why Firms Diversify: An Empirical Examination. Unpublished manuscript,
University of Texas at Arlington.
Jensen, M.C., 1986. Agency costs of free cash flow, corporate finance and takeovers. American
Economic Review 76, 323-329.
Jensen, M.C., 1993. The modern industrial revolution, exit, and the failure of internal control
systems. Journal of Finance 48, 831-880.
John, K., Ofek, E., 1995. Asset sales and increase in focus. Journal of Financial Economics 37,
105-126.
Khanna, N., Palepu, K., 1999. Corporate Scope and Institutional Context: An Empirical Analysis
of Diversified Indian Business Groups. Unpublished manuscript, Harvard University.
Klein, P.G., 2001. Were the acquisitive conglomerates inefficient? RAND Journal of Economics
32, 745-761.
Kothari, S.P., Warner, J.B., 1996. Measuring long-horizon security price performance. Journal of
Financial Economics 43, 301-339.
Lamont, O., 1997. Cash flow and investment: evidence from internal capital markets. Journal of
Finance 52, 83-109

19
Lamont, O., Polk, C., 2000. Does Diversification Destroy Value? Evidence from Industry
Shocks. Unpublished manuscript, The Center for Research in Securities Prices, No. 521
(July).
Lang, L.H.P., Stulz, R.M., 1994. Tobin’s q, corporate diversification, and firm performance.
Journal of Political Economy 102, 1248-1280.
LeBaron, D., Speidell, L.S., 1987. Why are the parts worth more than the sum? ‘Chop Shop,’ a
corporate valuation model. In The Merger Boom, edited by Lynn E. Browne and Eric S.
Rosengren. Conference Series, no. 31. Boston: Fed. Reserve Bank.
Lewellen, W., 1971. A pure financial rationale for the conglomerate merger. Journal of Finance
26, 521-537.
Lichtenberg, F.R., 1991. The managerial response to regulation of financial reporting for
segments of a business enterprise. Journal of Regulatory Economics 3, 241-249.
MacKinlay, A.C., 1997. Event studies in economics and finance. Journal of Economic Literature
35, 13-39.
Maksimovic, V., Philips, G., 2001. Do conglomerate firms allocate resources inefficiently.
Journal of Finance 57, 721-767.
Martin, J.D., Sayrak, A., 2003. Corporate diversification and shareholder value. Journal of
Corporate Finance 9, 37-57.
Matsusaka, J., 1993. Takeover motives during the conglomerate merger wave. RAND Journal of
Economics 24, 357-379.
Megginson, W.L., Morgan, A., Nail, L., 2000. Changes in corporate focus, ownership structure,
and long-run merger returns. Unpublished manuscript, Michael Price College of Business,
University of Oklahoma (October).
Mitchell, M., Pulvino, T., Stafford, E., 2004. Price pressure around mergers. Journal of Finance
59, 31-63.
Mitchell, M.L., Stafford, E., 2000. Managerial decisions and long term stock price performance.
Journal of Business 73, 287-329.
Moeller, S.B., Schlingemann, F.P., Stulz, R.M., 2004. Firm size and the gains from acquisitions.
Journal of Financial Economics 73, 201-228.
Montgomery, C.A., 1994. Corporate diversification. Journal of Economic Perspectives 8 (3),
163-178.
Morck, R., Shleifer, A., Vishny, R.W., 1990. Do managerial objectives drive bad acquisitions?
Journal of Finance 45, 31-48.
Myerson, R.B., 1982. Optimal coordination mechanisms in generalized principal-agent
problems. Journal of Mathematical Economics 10, 67-81.
Palepu, K., 1985. Diversification strategy, profit performance and the entropy measure. Strategic
Management Journal 6, 239-255.
Rajan, R., Servaes, H., Zingales, L., 2000. The cost of diversity: The diversification discount and
inefficient investment. Journal of Finance 60, 35-80.
Rotemberg, J., Saloner, G., 1994. Benefits of narrow business strategies. American Economic
Review 84 (5),1330-1349.
Scharfstein, D.S., 1998. The Dark Side of Internal Capital Markets II: Evidence from Diversified
Conglomerates. National Bureau of Economic Research unpublished manuscript, No. 6352.
Schoar, A.S., 2002, Effects of corporate diversification on productivity. Journal of Finance 57,
2379-2403.

20
Servaes, H., 1996. The value of diversification during the conglomerate merger wave. Journal of
Finance 51, 1201-1226.
Servaes, H., Lins, K., 1999. International evidence on the value of corporate diversification.
Journal of Finance 54, 2215-2240.
Stulz, R.M., 1990. Managerial discretion and optimal financing policies, Journal of Financial
Economics 26, 3-27.
Villalonga, B., 1999. Does Diversification Cause the ‘‘Diversification Discount’’? Unpublished
manuscript, Harvard University.
Villalonga, B., 2004. Diversification Discount or Premium? New evidence from the business
information tracking series.. Journal of Finance 59, 479-506.
Wernerfelt, B., Montgomery, C.A., 1988. Tobin’s q and the importance of focus in firm
performance. American Economic Review 78, 246-250.
Weston, J.F., 1970. The nature and significance of conglomerate firms. St. John’s Law Review
44, 66-80.
Williamson, O., 1975. Markets and Hierarchies: Analysis and Antitrust Implications. Collier
Macmillian Publishers, New York.
Wulf, J., 1998. Influence and Inefficiency in the Internal Capital Market: Theory and Evidence.
Unpublished manuscript, the Wharton School, University of Pennsylvania (October).

21
Table I
Sample Distribution by Announcement Years and Abnormal Bidder Returns The sample contains completed U.S. mergers and acquisitions between 1985-March 5, 2005 listed on SDC where a
domestic publicly traded acquiring firm gained 100% control of a domestic public, private, or subsidiary target
whose LTM sales were at least 5% of the bidder’s LTM sales. Acquirers must be listed on the NYSE, AMEX, or
NASDAQ, own less than 50% of the target prior to acquisition, and have stock prices for a 10 day window around
the day of the announcement (-10, +10) in the FACTSET database. Returns are mean 3-day (-1,+1) cumulative
abnormal returns (CARs) around the announcement day (day 0) of a takeover, calculated using a modified market
model ARi = ri - rm where ri is the return on firm i and rm is the daily return on the S&P500.
Announcement Number of
Year Mergers Mean
1985 57 0.0024
1986 112 0.0093c
1987 80 0.0217c
1988 97 0.0044
1989 131 0.0024
1985-89 477 0.0077b
1990 95 -0.0002
1991 156 0.0178a
1992 261 0.0248a
1993 356 0.0172a
1994 410 0.0118a
1990-94 1278 0.0158a
1995 265 0.0109a
1996 270 0.0298b
1997 536 0.0106a
1998 505 0.0026
1999 438 -0.0016
1995-99 2014 0.0086a
2000 342 -0.0177a
2001 254 -0.0013
2002 195 0.011
2003 243 0.0094c
2004 224 0.0061
2005 15 0.0407c
2000-05 1273 0
1985-2005 5042 0.0081a
a Statistical significance at the 1% level.
b Statistical significance at the 5% level.
c Statistical significance at the 10% level.

22
Table II
Cumulative Abnormal Returns and Dollar Abnormal Returns The sample contains completed U.S. mergers and acquisitions between 1985-March 5, 2005 listed on SDC where a
domestic publicly traded acquiring firm gained 100% control of a domestic public, private, or subsidiary target
whose LTM sales were at least 5% of the bidder’s LTM sales. Acquirers must be listed on the NYSE, AMEX, or
NASDAQ, own less than 50% of the target prior to acquisition, and have stock prices for a 10 day window around
the day of the announcement (-10, +10) in the FACTSET database. CAR(-1,+1) denoted the bidder’s mean 3-day (-
1,+1) cumulative abnormal returns (CARs) (in percent) around the announcement day (day 0) of a takeover,
calculated using a modified market model ARi = ri - rm where ri is the return on firm i and rm is the daily return on
the S&P500. CADR(-1,+1) , the cumulative abnormal dollar return is found by multiplying each CAR by the equity
value of the firm on the day of announcement, and is reported in millions of dollars. Small, mid, and large size firms
are defined as the smallest 33%, middle 33%, and largest 33% of acquirers, respectively, in each year, as defined by
market capitalization on the day of announcement. Median values are shown in brackets (but not tested for
significance) and the number of acquisitions is reported below.
Panel A: Summary of Percentage v. Dollar Abnormal Returns
All
CAR(-1,+1) 0.0081
0.0031
5042
CADR(-1,+1) -44.3788
0.3368
5042
Panel B: Summary of Percentage v. Dollar Abnormal Returns by Size
Large Mid Small
CAR(-1,+1) -0.0051a
0.0078a
0.0218a
[-0.0029] [0.0046] [0.0087]
1686 1682 1674
CADR(-1,+1) -133.9912a
0.4845 0.7984a
[-4.1808] [1.0963] [0.3646]
1686 1682 1674
a Statistical significance at the 1% level.
b Statistical significance at the 5% level.
c Statistical significance at the 10% level.

23
Table III
Summary Abnormal Return Statistics The sample contains completed U.S. mergers and acquisitions between 1985-March 5, 2005 listed on SDC where a
domestic publicly traded acquiring firm gained 100% control of a domestic public, private, or subsidiary target
whose LTM sales were at least 5% of the bidder’s LTM sales. Acquirers must be listed on the NYSE, AMEX, or
NASDAQ, own less than 50% of the target prior to acquisition, and have stock prices for a 10 day window around
the day of the announcement (-10, +10) in the FACTSET database. All numbers are the bidder’s mean 3-day (-1,+1)
cumulative abnormal returns (CARs) around the announcement day (day 0) of a takeover, calculated using a
modified market model ARi = ri - rm where ri is the return on firm i and rm is the daily return on the S&P500. Public,
private, conglomerate, pure-play, diversifying and strategic are defined as public targets, private or subsidiary
targets, a firm that operates in more than two SIC codes on a two digit level (acquirer or target) as reported by SDC,
a firm that does not operate in more than two SIC codes on a two digit level, an acquisition involving a target whose
primary SIC code does not match any SIC code of the acquirer on a two digit level, and an acquisition involving a
target whose primary SIC code does match one of the acquirer’s on two digit level, respectively. Median values are
in brackets (but not tested for significance) and the number of acquisitions is reported below. Difference tests are
based on t-tests for equality in means.
Panel A: Private Targets v. Public Targets
Private Targets Public Targets Difference Test
(1) (2) (1) - (2)
0.0222a
-0.0108a
0.0329a
[0.0123] [0.0084] [0.0038]
2892 2150
Panel B: Conglomerate Acquirers v. Pure-Play Acquirers
Conglomerate Acquirers Pure-Play Acquirers Difference Test
(1) (2) (1) - (2)
0.0066a
0.0113a
-0.0047
[0.0017] [0.0069] [-0.0052]
3415 1627
Panel C: Conglomerate Targets v. Pure-Play Targets
Conglomerate Targets Pure-Play Targets Difference Test
(1) (2) (1) - (2)
0.0041b
0.0108a
-0.0067b
[-0.0024] [0.0064] [-0.0088]
2028 3014
Panel D: Comparison between Type of Acquirer (Congl/P-Play) and Type of Target (Congl/P-Play)
Congl. Acquire
Congl.
Congl. Acquire
P-Play
P-Play Acquire
Congl.
P-Play Acquire
P-Play Difference Tests
(1) (2) (3) (4) (1) - (2) (3) - (4) (1) - (3) (2) - (4)
0.0016 0.0110a
0.0131a
0.0106a
-0.0093a
0.0025 -0.0115b
0.0003
[-0.0016] [0.0054] [0.0044] [0.0076] [-0.0070] [-0.0032] [-0.0060] [-0.0022]
1585 1830 443 1184

24
Table III – Continued
Panel E: Diversifying Acquisitions v. Strategic Acquisitions
Diversifying Acquisitions Strategic Acquisitions Difference Test
(1) (2) (1) - (2)
0.0173a
0.0057a
0.0116a
[0.0076] [0.0021] [0.0055]
1061 3981
Panel F: Comparison between Type of Acquirer (Congl/P-Play) and Type of Acquisition (Diversifying/Strategic)
Conglomerate Conglomerate Pure-Play Pure-Play
Diversifying Strategic Diversifying Strategic Difference Tests
(1) (2) (3) (4) (1) - (2) (3) - (4) (1) - (3) (2) - (4)
0.0180a
0.0043a
0.0165a
0.0092a
0.0138a
0.0073 0.0016 -0.0049
[0.0063] [0.0009] [0.0094] [0.0059] [0.0054] [0.0035] [-0.0031] [-0.0049]
585 2830 476 1151
a Statistical significance at the 1% level.
b Statistical significance at the 5% level.
c Statistical significance at the 10% level.

25
Table IV
Announcement Abnormal Returns broken out by Firm Size The sample contains completed U.S. mergers and acquisitions between 1985-March 5, 2005 listed on SDC where a
domestic publicly traded acquiring firm gained 100% control of a domestic public, private, or subsidiary target
whose LTM sales were at least 5% of the bidder’s LTM sales. Acquirers must be listed on the NYSE, AMEX, or
NASDAQ, own less than 50% of the target prior to acquisition, and have stock prices for a 10 day window around
the day of the announcement (-10, +10) in the FACTSET database. All numbers are the bidder’s mean 3-day (-1,+1)
cumulative abnormal returns (CARs) around the announcement day (day 0) of a takeover, calculated using a
modified market model ARi = ri - rm where ri is the return on firm i and rm is the daily return on the S&P500. Small,
mid, and large size firms are defined as the smallest 33%, middle 33%, and largest 33% of acquirers, respectively, in
each year, as defined by market capitalization on the day of announcement. Public, private, conglomerate, pure-
play, diversifying and strategic are defined as public targets, private or subsidiary targets, a firm that operates in
more than two SIC codes on a two digit level (acquirer or target) as reported by SDC, a firm that does not operate in
more than two SIC codes on a two digit level, an acquisition involving a target whose primary SIC code does not
match any SIC code of the acquirer on a two digit level, and an acquisition involving a target whose primary SIC
code does match one of the acquirer’s on two digit level, respectively. Difference tests are based on t-tests for
equality in means.
Panel A: Private Targets v. Public Targets
Large Midsize Small Difference Tests
(1) (2) (3) (1) - (2) (2) - (3) (1) - (3)
Private 0.0152a
0.0197a
0.0277a
-0.0045 -0.0080c
-0.0125b
Public -0.0164a
-0.0124a
0.0054 -0.0039 -0.0178a
-0.0217a
Difference 0.0316a
0.0322a
0.0223a
Panel B: Conglomerate Acquirers v. Pure-Play Acquirers
Large Midsize Small Difference Tests
(1) (2) (3) (1) - (2) (2) - (3) (1) - (3)
Conglomerate Acquirer -0.0061a
0.0080a
0.0218a
-0.0142a
-0.0137a
-0.0279a
Pure-Play Acquirer -0.0019 0.0074b
0.0219a
-0.0093c
-0.0145a
-0.0238a
Difference -0.0043 0.0006 -0.0002
Panel C: Conglomerate Targets v. Pure-Play Targets
Large Midsize Small Difference Tests
(1) (2) (3) (1) - (2) (2) - (3) (1) - (3)
Conglomerate Target -0.0049b
0.0009 0.0234a
-0.0058 -0.0225a
-0.0283a
Pure-Play Target -0.0053b
0.0120a
0.0211a
-0.0173a
-0.0091c
-0.0264a
Difference 0.0004 -0.0111a
0.0023

26
Table IV - Continued
Panel D: Comparison between Type of Acquirer (Congl/P-Play) and Type of Target (Congl/P-Play)
Large Midsize Small Difference Tests
(1) (2) (3) (1) - (2) (2) - (3) (1) - (3)
Congl. acquire Congl. (a) -0.0070a
0.0002 0.0208a
-0.0072c
-0.0207a
-0.0279a
Congl acquire P-Play (b) -0.0050c
0.0140a
0.0223a
-0.0190a
-0.0083 -0.0273a
P-Play acquire Congl. (c) 0.0050 0.0034 0.0293a
0.0016 -0.0259b
-0.0242b
P-Play acquire P-Play (d) -0.0061 0.0088b
0.0198a
-0.0149b
-0.0110c
-0.0259a
Difference (a) - (b) -0.0021 -0.0138s
-0.0014
Difference (c) - (d) 0.0111 -0.0054 0.0095
Difference (a) - (c) -0.0121b
-0.0032 -0.0084
Difference (b) - (d) 0.0012 0.0052 0.0025
Panel E: Diversifying Acquisitions v. Strategic Acquisitions
Large Midsize Small Difference Tests
(1) (2) (3) (1) - (2) (2) - (3) (1) - (3)
Diversifying Acquisition -0.0006 0.0127a
0.0328a
-0.0133b
-0.0201c
-0.0334a
Strategic Acquisition -0.0060a
0.0066a
0.0180a
-0.0126a
-0.0114a
-0.0240a
Difference 0.0054 0.0061 0.0148b
Panel F: Comparison between Type of Acquirer (Congl/P-Play) and Type of Acquisition (Diversifying/Strategic)
Large Midsize Small Difference Tests
(1) (2) (3) (1) - (2) (2) - (3) (1) - (3)
Congl. Diversifying (a) -0.0020 0.0164a
0.0393b
-0.0183b
-0.0229 -0.0413b
Conglomerate Strategic (b) -0.0069a
0.0063a 0.0173
a -0.0132
a -0.0110
b -0.0242
a
Pure-Play Diversifying (c) 0.0023 0.0079 0.0273a
-0.0057 -0.0194c
-0.0251b
Pure-Play Strategic (d) -0.0031 0.0072c
0.0191a
-0.0104 -0.0119c
-0.0222a
Difference (a) - (b) 0.0049 0.0100c
0.0220c
Difference (c) - (d) 0.0054 0.0007 0.0082
Difference (a) - (c) -0.0042 0.0084 0.0119
Difference (b) - (d) -0.0038 -0.0009 -0.0018
a Statistical significance at the 1% level.
b Statistical significance at the 5% level.
c Statistical significance at the 10% level.

27
Table V
Announcement Abnormal Returns broken out by Public Status of Target The sample contains completed U.S. mergers and acquisitions between 1985-March 5, 2005 listed on SDC where a
domestic publicly traded acquiring firm gained 100% control of a domestic public, private, or subsidiary target
whose LTM sales were at least 5% of the bidder’s LTM sales. Acquirers must be listed on the NYSE, AMEX, or
NASDAQ, own less than 50% of the target prior to acquisition, and have stock prices for a 10 day window around
the day of the announcement (-10, +10) in the FACTSET database. All numbers are the bidder’s mean 3-day (-1,+1)
cumulative abnormal returns (CARs) around the announcement day (day 0) of a takeover, calculated using a
modified market model ARi = ri - rm where ri is the return on firm i and rm is the daily return on the S&P500. Public,
private, conglomerate, pure-play, diversifying and strategic are defined as public targets, private or subsidiary
targets, a firm that operates in more than two SIC codes on a two digit level (acquirer or target) as reported by SDC,
a firm that does not operate in more than two SIC codes on a two digit level, an acquisition involving a target whose
primary SIC code does not match any SIC code of the acquirer on a two digit level, and an acquisition involving a
target whose primary SIC code does match one of the acquirer’s on two digit level, respectively. Difference tests are
based on t-tests for equality in means.
Panel A: Conglomerate Acquirers v. Pure-Play Acquirers
Private Public Difference Test
(1) (2) (1) - (2)
Conglomerate Acquirer 0.0221a
-0.0110a
0.0331a
Pure-Play Acquirer 0.0223a
-0.0100a
0.0324a
Difference -0.0002 -0.0010
Panel B: Conglomerate Targets v. Pure-Play Targets
Private Public Difference Test
(1) (2) (1) - (2)
Conglomerate Target 0.0226a
-0.0078a
0.0304a
Pure-Play Target 0.0221a
-0.0147a
0.0368a
Difference 0.0005 0.0069c
Panel C: Comparison between Type of Acquirer (Congl/P-Play) and Type of Target (Congl/P-Play)
Private Public Difference Test
(1) (2) (1) - (2)
Congl. acquire Congl. (a) 0.0208a
-0.0092a
0.0300a
Congl acquire P-Play (b) 0.0227a
-0.0141a
0.0368a
P-Play acquire Congl. (c) 0.0272a
-0.0013 0.0284a
P-Play acquire P-Play (d) 0.0211a
-0.0158a
0.0369a
Difference (a) - (b) -0.0019 0.0049
Difference (c) - (d) 0.0061 0.0145c
Difference (a) - (c) -0.0064 -0.0079
Difference (b) - (d) 0.0017 0.0017
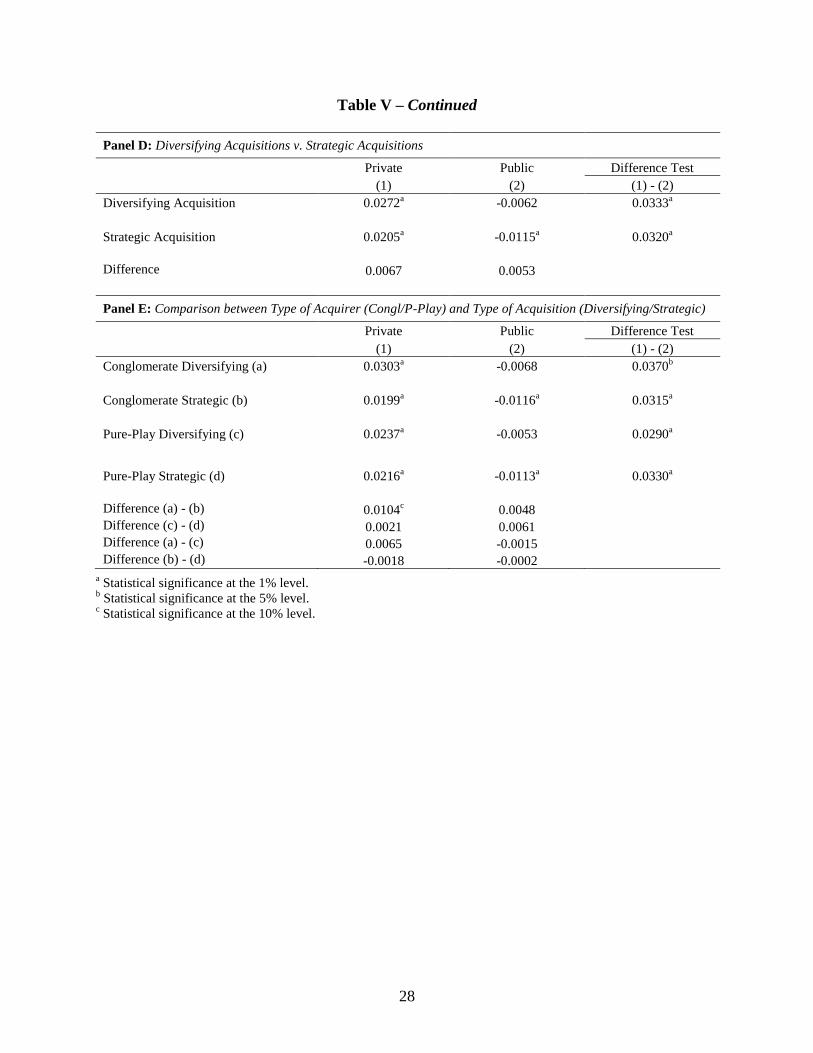
28
Table V – Continued
Panel D: Diversifying Acquisitions v. Strategic Acquisitions
Private Public Difference Test
(1) (2) (1) - (2)
Diversifying Acquisition 0.0272a
-0.0062 0.0333a
Strategic Acquisition 0.0205a
-0.0115a
0.0320a
Difference 0.0067 0.0053
Panel E: Comparison between Type of Acquirer (Congl/P-Play) and Type of Acquisition (Diversifying/Strategic)
Private Public Difference Test
(1) (2) (1) - (2)
Conglomerate Diversifying (a) 0.0303a
-0.0068 0.0370b
Conglomerate Strategic (b) 0.0199a
-0.0116a
0.0315a
Pure-Play Diversifying (c) 0.0237a
-0.0053 0.0290a
Pure-Play Strategic (d) 0.0216a
-0.0113a
0.0330a
Difference (a) - (b) 0.0104c
0.0048
Difference (c) - (d) 0.0021 0.0061
Difference (a) - (c) 0.0065 -0.0015
Difference (b) - (d) -0.0018 -0.0002
a Statistical significance at the 1% level.
b Statistical significance at the 5% level.
c Statistical significance at the 10% level.

29
Table VI
Comparison of Diversified vs. Strategic Acquisitions by Year Groupings The sample contains completed U.S. mergers and acquisitions between 1985-March 5, 2005 listed on SDC where a
domestic publicly traded acquiring firm gained 100% control of a domestic public, private, or subsidiary target
whose LTM sales were at least 5% of the bidder’s LTM sales. Acquirers must be listed on the NYSE, AMEX, or
NASDAQ, own less than 50% of the target prior to acquisition, and have stock prices for a 10 day window around
the day of the announcement (-10, +10) in the FACTSET database. All numbers are the bidder’s mean 3-day (-1,+1)
cumulative abnormal returns (CARs) around the announcement day (day 0) of a takeover, calculated using a
modified market model ARi = ri - rm where ri is the return on firm i and rm is the daily return on the S&P500.
Diversifying and strategic are defined as an acquisition involving a target whose primary SIC code does not match
any SIC code of the acquirer on a two digit level, and an acquisition involving a target whose primary SIC code does
match one of the acquirer’s on two digit level, respectively. Median values are shown in brackets (but not tested for
significance) and the number of acquisitions is reported below that. Difference tests are based on t-tests for equality
in means.
Diversified Strategic Difference Test
(1) (2) (1) - (2)
1985-1989 0.0029 0.0090a
-0.0061
[-0.0040] [0.0016] [-0.0056]
105 372
1990-1994 0.0179a
0.0152a
0.0027
[0.0108] [0.0063] [0.0045]
287 991
1995-1999 0.0227b
0.0050b
0.0177a
[0.0122] [0.0034] [0.0089]
402 1612
2000-2005 0.0143b
-0.0038 0.0181b
[0.0080] [-0.0055] [0.0136]
267 1006
a Statistical significance at the 1% level.
b Statistical significance at the 5% level.
c Statistical significance at the 10% level.

30
Table VII
Cross-Sectional Regression Analysis of Announcement Abnormal Returns The sample contains completed U.S. mergers and acquisitions between 1985-March 5, 2005 listed on SDC where a
domestic publicly traded acquiring firm gained 100% control of a domestic public, private, or subsidiary target
whose LTM sales were at least 5% of the bidder’s LTM sales. Acquirers must be listed on the NYSE, AMEX, or
NASDAQ, own less than 50% of the target prior to acquisition, and have stock prices for a 10 day window around
the day of the announcement (-10, +10) in the FACTSET database. The dependant variable is the bidder’s three-day
(-1,+1) cumulative abnormal returns (CARs) around the announcement day (day 0) of a takeover, calculated using a
modified market model ARi = ri - rm where ri is the return on firm i and rm is the daily return on the S&P500.
Ln(market cap) is the natural logarithm of market capitalization of the acquiring firm’s equity. Public, conglomerate
acquirer, conglomerate target, and diversifying are all dummy variables that take the value one for acquisitions
involving public targets, an acquirer that operates in two or more SIC codes on a two digit level as reported by SDC,
a target that operates in two or more SIC codes on a two digit level as reported by SDC and targets whose primary
SIC code does not match any SIC code of the acquirer on a two digit level, respectively. Relative size is measured
as the last twelve months (LTM) sales of the target divided by the LTM sales of the acquirer. Significance is based
on White-adjusted standard errors with p-values reported below each coefficient.
Sample
1985-2005 1985-1989 1990-1994 1990-2005 1995-2005
(1) (2) (3) (4) (5)
Intercept 0.0469 0.0396 0.0488 0.0473 0.0471
0.000 0.001 0.000 0.000 0.000
Public -0.0261a
-0.0047 -0.0247a
-0.0282a
-0.0290a
0.000 0.481 0.000 0.000 0.000
ln(market cap) -0.0055a
-0.0036c
-0.0041a
-0.0055a
-0.0060a
0.000 0.058 0.001 0.000 0.000
Diversifying Acquisition 0.0049 -0.0090 -0.0037 0.0062c
0.0107b
0.151 0.224 0.437 0.095 0.029
Acquirer Conglomerate 0.0019 -0.0078 -0.0089b
0.0027 0.0068
0.540 0.301 0.038 0.411 0.107
Target Conglomerate 0.0050c
-0.0015 0.0025 0.0055c
0.0060
0.095 0.813 0.571 0.086 0.141
Relative Size 0.0001 -0.0001 0.0001 0.0000 -0.0001
0.983 0.616 0.323 0.861 0.533
N 5042 477 1278 4565 3287
Adjusted-R2 0.0356 0.0069 0.0453 0.0381 0.0359
a Statistical significance at the 1% level.
b Statistical significance at the 5% level.
c Statistical significance at the 10% level.