divca report 2013 final 6.7 - cpuc.ca.gov · more households have more video ... f. available...
TRANSCRIPT


i
Table of Contents
Executive Summary ...................................................................................................... 2
Overview of DIVCA ....................................................................................................... 4
Video Findings .............................................................................................................. 6
A. Video Deployment Decreased Overall, But Increased for AT&T and Verizon ..... 7 B. More Households Have More Video Choices ..................................................... 8 C. State Video Franchising Growth Continues ...................................................... 10 D. Verizon Has Met Its Build‐out Requirements, but AT&T Qualified for a Delay . 13 E. AT&T and Verizon Have Met Their Low Income Obligations ............................ 14 F. Prohibition Against Telco‐Video Cross‐Subsidization ....................................... 15
Broadband Findings .................................................................................................... 17
A. Broadband Subscriptions Continue to Increase ................................................ 19 B. Broadband Penetration Increased by 2.6 Percentage Points ........................... 20 C. Mobile Broadband’s Role in Providing Broadband Access ............................... 21 D. Slight Increase in Households with Choice of Three or More Broadband Providers .................................................................................................................. 23 E. The Federal Communication Commission’s Definition of Broadband Has Changed ................................................................................................................... 24 F. Available Broadband Speeds are Generally Faster in Urban Areas .................. 26 G. Californians are Subscribing to Faster Speed Tiers ........................................... 28 H. Broadband Technologies: Cable Modems Overtake DSL Modems ................... 31
Appendix A: Implementing DIVCA: Decisions and Resolutions .................................... 33
Appendix B: Collecting Data Mandated by DIVCA ....................................................... 37
Appendix C: Methods, Sources, and Data Limitations ................................................. 39
Appendix D: Video Franchise Area Maps .................................................................... 45

2
Executive Summary
This report presents the video and broadband service findings relating to California state‐issued video
franchisees that must be reported annually to the Legislature pursuant to the Digital Infrastructure and
Video Competition Act of 2006 (DIVCA).1
The number of households offered video by all state‐issued video franchisees and their local affiliates
decreased during 2011. However, this decrease may be attributable, in part, to the use of 2010 census
data for this report. Prior reports used projections based on data from the 2000 census.2 In contrast,
AT&T and Verizon now offer video to about six times as many households as they did in 2007 as they
expand their service into areas that were previously served only by incumbent cable providers. This
growth has coincided with more households having greater choice in video providers. This is true in
many urban areas and some rural areas. However, a significant, but decreasing number of California
households have access to only one fixed wire video provider. Satellite delivered video services are an
additional option in nearly all locations.3
State video franchising continues to grow as incumbent providers transition from local franchises to
state franchises as DIVCA envisioned. This translates into more new state franchises issued and more
state franchisees, rather than local franchisees, providing service to subscribers. This analysis also
revealed that the total number of subscribers to both state‐issued franchisees and local franchisees has
decreased slightly. This is likely due to both “cord cutting” and reduced consumer spending generally. 4
However, more households obtained the option of a second or third video service provider.
DIVCA includes a statutory five year build‐out obligation that applies to Verizon and AT&T. Verizon has
met this obligation, but AT&T qualified for a delay based on §5890(e)(4) of DIVCA, which suspends the
build‐out requirement if the franchise holder achieves less than 30% penetration. Also under DIVCA, five
years after Verizon and AT&T begin offering video service and continuing thereafter, each is obligated to
ensure that at least 30% of the households with access to video service in their respective video service
territories are low income households. Both AT&T and Verizon met this obligation at the five year mark.
DIVCA prohibits state‐issued franchisees that provide stand‐alone residential primary line basic
telephone service from increasing their rate for such service to finance the cost of deploying a network
to provide video service. A previous California Public Utilities Commission (CPUC or Commission)
decision, which prevented AT&T and Verizon from raising their rates, expired and since 2011 both have
raised their basic rates. This alone does not necessarily mean that cross‐subsidization has occurred.
1 Cal. Pub. Util. Code §§5800 – 5970. 2 Due to multiple franchisees offering video to the same households, more households are offered video than the total number of households in the state (12,633,403). For details, see Appendix C: Methods, Sources, and Data Limitations. 3 These providers are not required to obtain a franchise. 4 Nielsen, Zero‐TV Doesn’t Mean Zero Video, Mar. 11, 2013. http://www.nielsen.com/us/en/newswire/2013/zero‐tv‐doesnt‐mean‐zero‐video.html. Last visited April 26, 2013; Reuters, Faltering Consumer Spending to Weigh on Growth, Aug. 2, 2011, http://www.reuters.com/article/2011/08/02/us‐usa‐economy‐idUSTRE7662I420110802. Last visited April 26, 2013.

3
Nonetheless, CPUC staff is reviewing procedural options and may recommend that the Commission
initiate a formal investigation into cross‐subsidization.
Broadband subscriptions continue to increase, with the number of broadband subscribers to state‐
issued video franchisees and their affiliates growing by almost 400,000 broadband subscribers since
2010. This is in contrast to the decrease in video subscribers throughout the state. The data show that
penetration has also increased by 2.6 percentage points, with about 73% of California households now
subscribing to broadband.5
The CPUC revised the definition of what speeds qualify an area to be considered “served” from 3 Mbps
for downloads and 1 Mbps for uploads to 6 Mbps for downloads and 1.5 Mbps for uploads. Under this
definition, approximately 97% of households in the state are considered served by either mobile or fixed
broadband providers. Our analysis also shows that mobile providers are either the fastest or only
broadband service option in some areas.
The percentage of households offered broadband service by three or more state‐issued franchisees and
their local affiliates has increased slightly. However, rural areas generally have fewer choices of fixed
broadband providers.
The data also show that available broadband speeds are generally faster in urban areas. Additionally,
many Californians are subscribing to faster speed tiers than in previous years. This is expected as faster
speeds become available in more areas and as people begin to utilize applications and services that
require more bandwidth, such as streaming video and audio.
Additionally, providers continue to predominantly use cable modem technology to serve residential
households. However, fiber optic technology, deployed to the home, has shown some modest growth.
5 For the purposes of this report, penetration is defined as number of subscribers divided by the total number of households in the state.

4
Overview of DIVCA
On September 29, 2006, the Governor signed into law Assembly Bill 2987, the Digital Infrastructure and
Video Competition Act of 2006 (DIVCA).6 DIVCA’s goals are to promote rapid, widespread competition in
the broadband and video markets and accelerate the deployment of additional infrastructure in
California.
DIVCA is implemented by the California Public Utilities Commission (CPUC or Commission) and addresses
not only video franchising, but also the deployment of additional broadband infrastructure within
California, particularly to unserved and underserved areas. DIVCA fundamentally changed video
franchising within California by transferring the authority for issuing franchises for the provision of video
services from local entities to the State of California. The State Legislature designated the CPUC as the
sole franchising authority for issuing state video franchises as of January 1, 2007.
California was the eighth state to fundamentally reform video franchising to facilitate competitive video
entry.7 As of 2011, 20 states had transferred video franchising authority to the state. These states
include California, Florida, Georgia, Iowa, Illinois, Indiana, Kansas, Michigan, Missouri, New Jersey, North
Carolina, Nevada, Ohio, South Carolina, Texas, Virginia, Louisiana, Wisconsin, Connecticut, and
Tennessee.8
Prior to DIVCA, local entities, primarily cities, counties and special districts issued cable television
franchises. This required cable operators to negotiate separate franchise agreements with each locality
where they wished to provide video service. California is made up of 58 counties encompassing over
6,000 cities and towns.9 These local franchise agreements required that service providers comply with
specified customer service and performance standards and other requirements that often varied by
locality.
For new entrants seeking to provide video and broadband services on a widespread basis, the process of
negotiating franchise agreements with each individual local entity would inevitably have been a long
process, delaying the widespread market entry of additional competitive service providers for many
years. To speed the entry of new video and broadband providers into the marketplace, the Legislature
sought to replace the local franchising system with one in which the state issues video franchises. The
Legislature designated the CPUC as the agency charged with issuing state video franchises.
6A.B. 2987, Ch. 700, Stats. 2006; Cal. Pub. Util. Code, §§5800 – 5970 ‐ Digital Infrastructure and Video Competition Act of 2006 (DIVCA). 7 Communications Daily, Passage of Cal. Video Bill Expands Franchise Reform to 1/3 of U.S. Population, available at http://listserv.educause.edu/cgi‐bin/wa.exe?A3=ind0609&L=TELECOM‐HE&E=quoted‐printable&P=8882&B=‐‐‐‐‐‐_%3D_NextPart_001_01C6D0FF.101FDEB9&T=text%2Fhtml;%20charset=us‐ascii. Last visited September 5, 2006. 8 Best, Best and Krieger et. al., State Cable Franchise Laws at a Glance, available athttp://www.allcommunitymedia.org/wp‐content/uploads/2011/08/States‐at‐a‐Glance‐Franchise‐Rules.pdf. Last visited November 16, 2012. 9 California Gazetteer: City Profiles, Physical and Cultural Features, http://california.hometownlocator. com/cities/. Last visited June 16, 2008; California State Association of Counties, http://www.csac. counties.org/. Last visited June 16, 2008.

5
In order to carry out its statutory goals, the CPUC developed and adopted rules to implement DIVCA
through a series of three formal decisions and several resolutions. Appendix A: Implementing DIVCA:
Decisions and Resolutions contains descriptions of these decisions and resolutions.
Following the adoption of these new rules, the CPUC began issuing ten‐year state video franchises. The
CPUC will issue a state video franchise so long as an applicant is eligible for a state franchise, the
application is complete, and the applicant swears that it will adhere to all state and federal laws, rules,
and regulations.
State franchisees are required to submit certain data annually on April 1 relating to their provision of
video and broadband services, and information pertaining to their service to low‐income households
within the franchisees’ video service areas as of December 31st of the previous year. DIVCA directs the
CPUC to aggregate the data described above and to report the aggregated totals to the Governor and
the Legislature annually. Appendix B: Collecting Data Mandated by DIVCA contains a description of the
data collected.
While DIVCA provides that the CPUC is the sole franchising authority for issuing state video franchises,10
the statute also states that video service providers are not public utilities and prohibits the Commission
from imposing any requirements on state‐issued franchisees that DIVCA does not expressly provide
for.11
DIVCA defined the jurisdiction of the Commission quite narrowly, limiting its enforcement authority to
the following provisions:
Issuing and renewing 10‐year video franchises.12
Gathering data from state‐issued franchisees on their deployment of video and broadband services on an annual basis.13
Aggregating data submitted by holders for use in an Annual Report from the CPUC to the Governor and Legislature.14
Ascertaining that holders of video franchises have complied with build‐out requirements and have not discriminated against low‐income households.15
Enforcement of the prohibition on the use of telco‐video cross‐subsidization.16
Collecting fees from state–issued franchisees to equal the cost of carrying out the CPUC’s duties under DIVCA.17
10 Cal. Pub. Util. Code § 5840(a). 11 Id. at §5820(c). 12 Id. at §5840 (a). 13 Id. at §5960 (b). 14 Id. at §5960 (c). 15 Id. at §§5890. 16 Id. at §§5940, 5950; Decision Adopting a General Order and Procedures to Implement the Digital Infrastructure and Video Competition Act of 2006 at 174 (D. 07‐03‐014, Mar. 1, 2007). (Phase 1 Decision). 17 Cal. Pub. Util. Code § 5810(a)(3).

6
Video Findings
Section I summarizes data describing video services that state‐issued video franchisees and their local
affiliates offer, which franchisees submit in response to the statutory requirements of DIVCA. These data
show the trends in video deployment and subscribership since DIVCA was implemented five years ago.
This includes the continuing transition from local franchises to state‐issued franchises.
The data collected include the number of households that state‐issued franchisees have deployed video
to, the number of state franchises granted and the number of subscribers to a state‐issued franchisees’
video service. Appendix B: Collecting Data Mandated by DIVCA contains a description of the data
collected.
Additionally, this report discusses AT&T and Verizon’s progress in meeting DIVCA’s build‐out and low
income requirements. Lastly, this report discusses the prohibition against telco‐video cross‐
subsidization.

7
A. Video Deployment Decreased Overall, But Increased for AT&T and Verizon
Video deployment measures the number of households that are offered video services. The number of
households offered video by all state‐issued video franchisees and their local affiliates decreased 5% to
18.2 million during 2011, compared with 19.1 million during 2010.18 This decrease may be attributable,
at least in part, to the use of 2010 census data for this report. This is in contrast to prior reports which
used projections based on data from the 2000 census. Appendix C: Methods, Sources and Data
Limitations includes a detailed discussion of the impact of this change on household counts.
In contrast, AT&T and Verizon increased the number of households to which they offer video between
2007 and 2011 to almost 6.4 million households. This is an increase of 18.5% since 2010. AT&T and
Verizon continue to build in areas where only incumbent cable providers were previously providing
service.
18 Due to multiple franchisees offering video to the same households, more households are offered video than there are households in the state (12, 633,403). For details, see Appendix C: Methods, Sources, and Data Limitations.

8
B. More Households Have More Video Choices
The chart below illustrates that while there has been a slight decrease in the number of total households
offered video, over 76% of California households (about 9.67 million) are now located in census tracts in
which two or more state‐issued video franchisees or their local affiliates offer video services.19
This is an addition of about 550,000 more households which obtained a second video provider in 2011.
Additionally, about 40,000 households obtained a third video provider during 2011. These data show
that, in general, more areas of California have obtained more options when choosing a video service
provider.
The map on the next page shows the geographic location of census tracts with 0, 1, 2, 3, and 4 state‐
issued video franchisees operating within them. This map shows that multiple providers exist in both
large urban and some rural census tracts. However, one or less providers currently serve most rural
tracts. But because population densities are much smaller in rural tracts, most households have at least
one provider, as the chart above shows.
19 It is difficult to precisely compare 2010 and 2011 information in this section because of the use of 2010 census data for this report. Prior reports used projections based on data from the 2000 census. This change results in an analysis that assumed fewer households and a greater number of census blocks in the state than assumed in 2010. For details, see Appendix C: Methods, Sources, and Data Limitations.
# of Franchisees Offering Video in a Census Tract

9

10
C. State Video Franchising Growth Continues
A state video franchise grants the right to offer video services in an area of the state. State video
franchises are not exclusive. Multiple video service providers can receive video franchises for the same
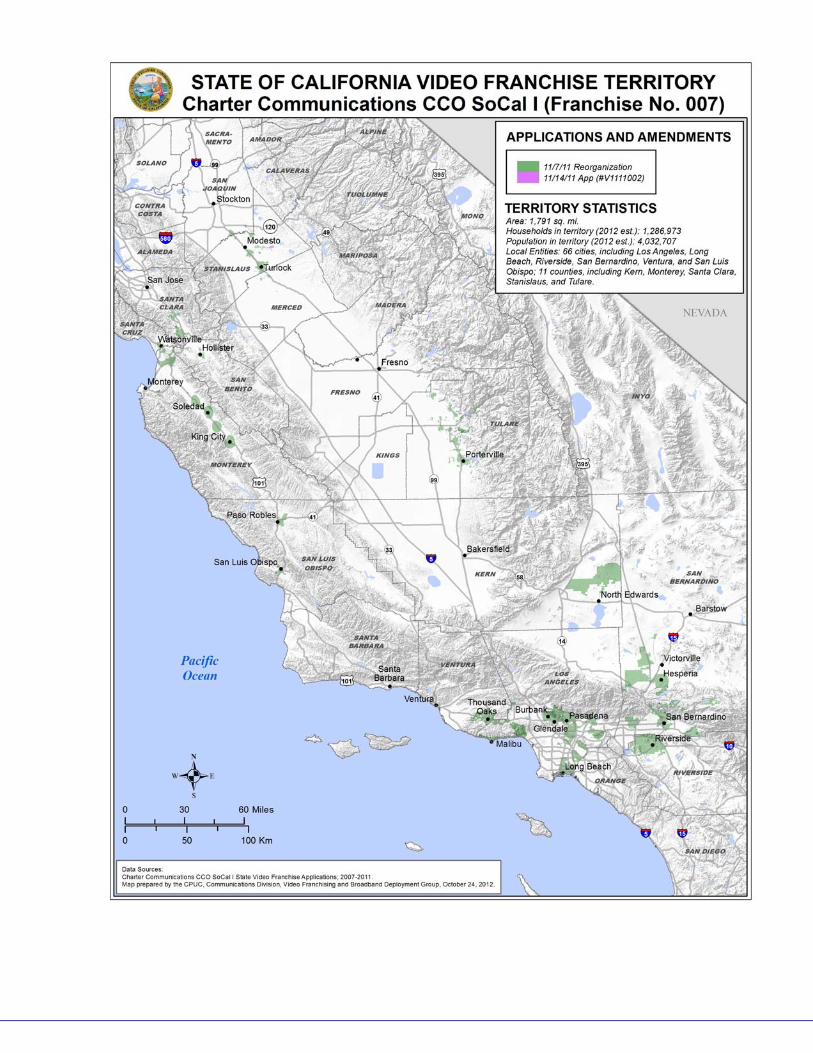
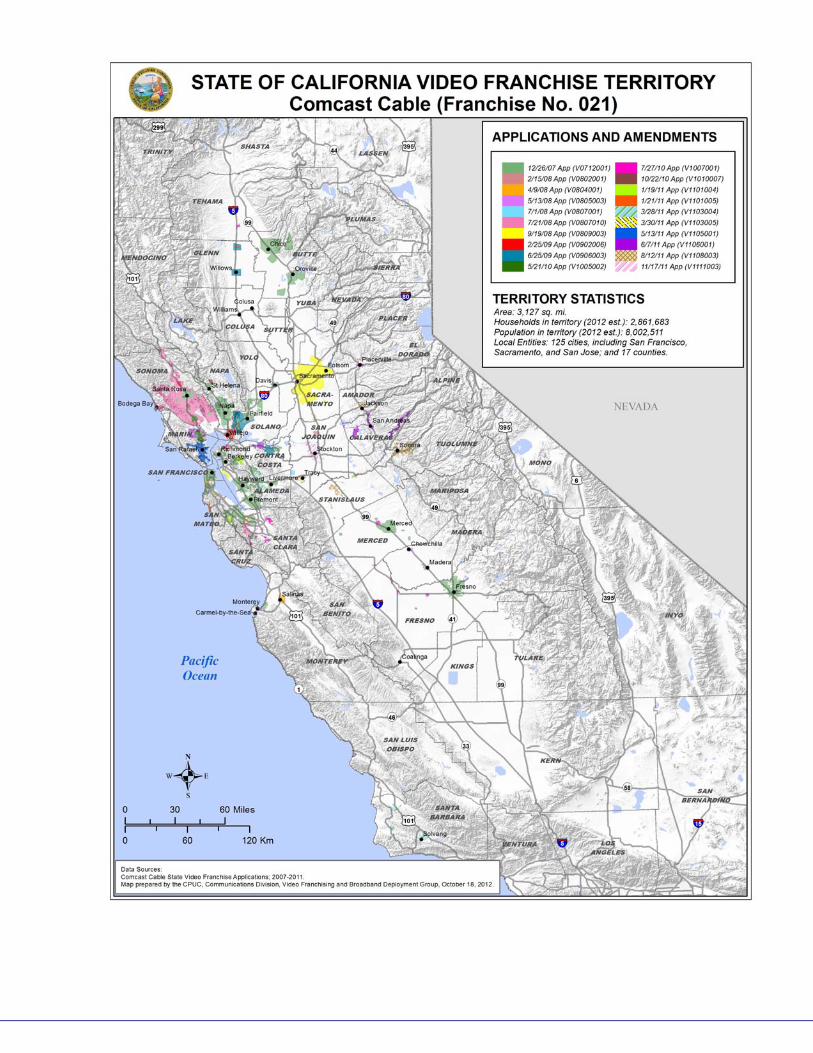
geographic area. Appendix D: Video Franchise Area Maps contains maps representing the boundaries of
each video franchise.
The graph below shows the continued increase in initial video franchises granted since 2007, when
DIVCA was first implemented. Since 2007, many incumbent cable operators have chosen to shift their
video franchises from local entities ‐ primarily municipalities and counties ‐ to state‐issued video
franchises, as DIVCA allows. DIVCA also requires cable operators to obtain a state franchise once their
local franchise expires. This growth in the total number of initial franchises processed by the CPUC is
reflective of the continued transition from local franchises to state franchises.

11
The shift towards state franchises is also reflected in the number of households that subscribe to state‐
issued franchisees rather than local franchisees. The chart below shows that the number of households
subscribing to video in areas served by a state‐issued franchisee or their local affiliate, increased by 45%
(1.5 million) between 2007 and 2011, to almost 4.7 million households. As new providers expand their
territory, state‐issued franchisees will provide service to even more subscribers.
We noted that the slight decrease in overall video subscribers may be attributable to “cord‐cutting” or
terminating video subscription in favor of online video alternatives.20 Section II of this report shows that
there has been an increase in broadband subscribership. The decrease in video subscribership may also
be a result of reduced consumer spending generally.21
This trend towards state‐issued franchises is also reflected on the following map. This map shows that
new entrants, or telephone companies whose entry into the video service provider market was spurred
by the passage of DIVCA, currently serve most areas of California.
20 Nielsen, Zero‐TV Doesn’t Mean Zero Video, Mar. 11, 2013. http://www.nielsen.com/us/en/newswire/2013/zero‐tv‐doesnt‐mean‐zero‐video.html. Last visited April 26, 2013. 21 Reuters, Faltering Consumer Spending to Weigh on Growth, Aug. 2, 2011, http://www.reuters.com/article/2011/08/02/us‐usa‐economy‐idUSTRE7662I420110802. Last visited April 26, 2013.
Local Franchise

12

13
D. Verizon Has Met Its Build‐out Requirements, but AT&T Qualified for a Delay
DIVCA requires the CPUC to monitor state‐issued franchisees’ deployment of infrastructure and services
to enforce build‐out requirements contained in the statute.22 The table below shows the build‐out
requirements for holders with over one million telephone customers.
Buildout Requirements
Holders with more than one million telephone customers in CA
Predominantly fiber optic to
premises (Verizon)
Not predominantly fiber optic to
premises (AT&T)
Within 2 years
25% of customers households in a
telephone service area must have
access to video service
Within 3 years
35% of households in telephone
service area must have access to
video service
Within 5 years*
40% of customers households in a
telephone area must have access
to video service
50% of households in telephone
service area must have access to
video service
* Not required to meet until 2 years after at least 30% of households with access become
subscribers for 6 consecutive months
Both AT&T and Verizon have exceeded their two and three year build‐out obligations, as defined in
§5890(e) of DIVCA. However, only Verizon has met its five year build‐out obligation by offering video
services to at least 40% of the households in its telephone service area while AT&T was entitled to an
extension to meet its 50% obligation based on DIVCA § 5890(e)(4). This section of DIVCA permits a video
service provider, like AT&T, to delay meeting this obligation until 30% of the households it offers service
to subscribe to that service for six consecutive months.
22 Phase I Decision, at 7; See Cal. Pub. Util. Code §5890.

14
E. AT&T and Verizon Have Met Their Low Income Obligations
DIVCA includes low income build‐out requirements for state‐issued franchisees with more than one
million telephone customers in California.23 AT&T and Verizon are the only two state franchisees
meeting this threshold. The table below shows the low income requirement.
Low Income Requirements
Holders with more than one million telephone
customers in CA
Within 3 years
25% of households in a telephone area with
access to video service must be low‐income
households
Within 5 years
30% of households in a telephone area with
access to video service must be low‐income
households
Under DIVCA, five years after Verizon and AT&T begin offering video service and continuing thereafter,
each is obligated to ensure that at least 30% of the households with access to video service in their
respective video service territories are low income households. Both AT&T and Verizon met this
obligation at the five year mark.
23 Cal. Pub. Util. Code §5890(j)(4); "Low‐income household" means those residential households located within the holder's existing telephone service area where the average annual household income is less than thirty‐five thousand dollars ($35,000) based on the United States Census Bureau estimates adjusted annually to reflect rates of change and distribution through January 1, 2007.

15
F. Prohibition against Telco‐Video Cross‐Subsidization
DIVCA prohibits state franchise holders that provide stand‐alone, residential, primary line, basic
telephone service from increasing rates to such service to finance the cost of deploying a network to
provide video service.24
Both DIVCA25 and the CPUC’s Uniform Regulatory Framework (URF) decision prohibited AT&T and
Verizon from raising such rates at all, prior to January 1, 2009, except to reflect increases in inflation.26
The CPUC’s Decision, D. 08‐09‐042 OP 12, extended this freeze on basic rate increases (other than
inflation) to December 30, 2010 after which AT&T and Verizon were permitted to adjust rates at will.
In comparison to the rate in effect on the date the freeze was removed, on January 3, 2011, AT&T raised
its rate for flat rate service by approximately 21% from $16.45 to $19.95 and its rate for measured
service by close to 40% from $8.87 to $12.37.27 Verizon raised its rate for flat rate service by
approximately 5% from $19.50 to $20.50 and its rate for measured service by close to 5% from $11.80
to $12.37.28 In addition, as of the publication date of this report, AT&T had further raised its rate for flat
rate service on January 2, 2013, by approximately 40% since the freeze was removed from $16.45 to
$23.00 and its rate for measured service by close to 107% from $8.87 to $18.35.29 Pursuant to the DIVCA
prohibition, the Commission need only suspend a basic service rate increase advice letter to determine
whether the proposed rate increase would result in unlawful cross‐subsidization and if so, reject the
advice letter. A party did raise the issue of cross‐subsidization in its protest to the AT&T January 3, 2011
rate increase advice letter.30 On February 11, 2011, staff rejected the protest based on its interpretation
of URF decisions D.07‐01‐024, D.07‐09‐019 and D.08‐09‐042.31 No protest was received regarding the
January 2, 2013 rate increase advice letter, and the proposed rate increase was allowed to become
effective.
The fact that both ILECs raised rates in 2011 does not prove or disprove that residential basic services
are cross‐subsidizing a network used to provide video service. To make this determination significant
analysis is required. Revenues for residential basic service, video service and other services that use the
network to provide video service would need to be compared to their respective costs. Audits of those
costs would need to be done to ensure they have been accurately assigned to each service. In addition,
if either AT&T or Verizon provides residential basic service and video service through separate corporate
affiliates, the transactions between those affiliates would need to be audited to ensure that they have
not resulted in cross‐subsidization.
24 Cal. Pub. Util. Code §5940. 25 Id. at §5950. 26 Order Instituting Rulemaking on the Commission’s Own Motion to Assess and Revise the Regulation of Telecommunications Utilities (D.06‐08‐030, Aug. 24, 2006). 27 AT&T, AL 38685. 28 Verizon, AL 12525. 29 AT&T, AL 41714. 30 TURN, Protest of AT&T AL 38685, Jan. 24, 2011. 31 Cal. P.U.C., Letter in Response to TURN’s Protest of AT&T AT 38685, Feb. 1, 2011.

16
The data necessary to conduct this analysis is no longer available at the Commission. In the 2006 URF
decision referenced above, the Commission eliminated the monitoring reports it previously required
AT&T and Verizon to submit which provided service specific cost and revenue data for regulated
services.32 Moreover, it is questionable whether the monitoring reports, if still in existence, would be
sufficient to make a definitive conclusion regarding the cross‐subsidization issue. In addition, it
eliminated all California specific affiliate transaction reports.33 Furthermore, it determined that it could
rely on a review of accounting data, which AT&T and Verizon are required to submit to the Federal
Communication Commission (FCC), to meet the Commission’s statutory obligation to conduct audits
every three years of the companies’ books and records.34 This data, however, while it includes California
specific cost and affiliate transaction information, is not sufficiently detailed to conduct the analysis
necessary to ensure that AT&T’s and Verizon’s standalone basic service rates are not cross‐subsidizing
the network used to provide video service. Nonetheless, the Commission’s staff is in the process of
pursuing the matter further with AT&T and Verizon as part of staff efforts to enforce compliance with
DIVCA’s prohibition against cross‐subsidization. Staff is reviewing procedural options and may
recommend that the Commission initiate a formal investigation into cross‐subsidization.35
32 Order Instituting Rulemaking on the Commission’s Own Motion to Assess and Revise the Regulation of Telecommunications Utilities at 216‐18 (D. 06‐08‐030, Aug. 24, 2006).The relevant NRF reports that were eliminated are referred to as the Service Specific Reports and provided service specific revenues and costs on a fully distributed basis. 33 Id. 34 Id. The data is contained in the FCC’s Automated Reporting Management Information System (ARMIS) reports. The specific reports include ARMIS reports 43‐01 ,43‐02, 43‐07, and 43‐08. See also Decision Regarding Monitoring Reports, Retail Special Access Pricing and Customer Disclosure Rules at 22‐24 (D.08‐09‐015, Sept. 9, 2008). 35 Phase 1 Decision at 189; Cal. Pub. Util. Code §§798, 5890(g).

17
Broadband Findings
This section on broadband summarizes data describing broadband services that state‐issued video
franchisees and their affiliates provide to Californians. In response to the statutory requirements of
DIVCA, state‐issued video franchisees and their affiliates submitted this data. Then the Commission
aggregated the data, which illustrates changes in broadband penetration over the past five years.36
The data collected include the number of fixed wireline and wireless broadband subscribers of state‐
issued franchisees and their affiliates, download and upload speed tier information, and the
technologies used to deploy broadband. The broadband section of this report analyzes data provided by
state‐issued franchisees and their affiliates, but does not include data from providers unaffiliated with
state‐issued franchisees.37
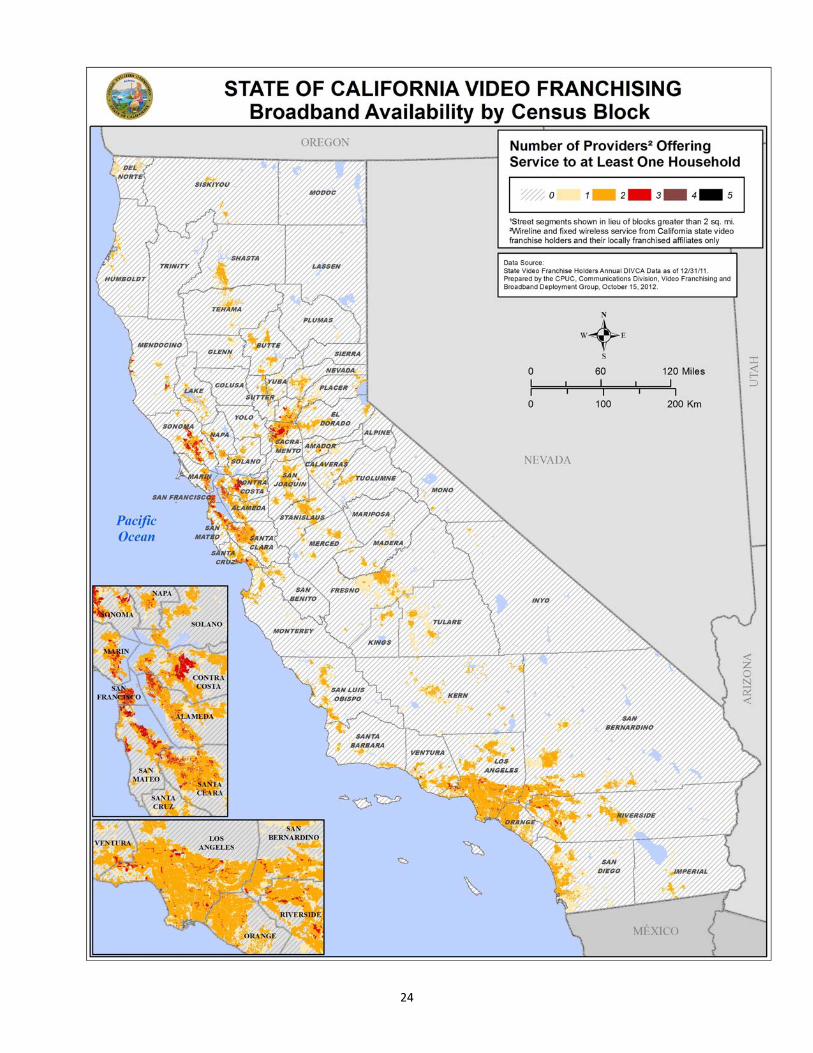
However, the FCC released data collected from all broadband providers in June 2011, including those
unaffiliated with state‐issued franchisees, which was used to create California Broadband Report: A
Summary of Broadband Availability and Adoption in California. The Center for Economic Development at
California State University, Chico in conjunction with the CPUC published this report in June 2012. The
map on the following page shows an example of the findings made in this report. This map shows that
there are geographic disparities in broadband adoption. Numerous urban communities including South
Los Angeles, East Oakland, South Sacramento, and National City, show very low adoption rates
compared to suburban and exurban locations within the same region. Organizations such as federal
Broadband Technology Opportunities Program sustainable adoption grantees, the California Emerging
Technology Fund grantees and others are using this map to focus their efforts on the precise
neighborhoods where the Digital Divide is most prevalent. The full report can be found at:
http://www.cpuc.ca.gov/PUC/Telco/generalInfo/CPUC+Reports+and+Presentations.htm.
36 Penetration rates are calculated by dividing the number of subscribers by the number of total households. 37 Year‐end data collected in December 2011 from FCC Form 477, which collects these data from unaffiliated
franchises, was unavailable at the time of compiling this report.

18

19
A. Broadband Subscriptions Continue to Increase
The chart below shows that the number of broadband subscribers to state‐issued video franchisees and
their affiliates has grown to 9.9 million connections over the past four years since 2008. In previous
years, we have shown a comparison between the number of households that subscribed to service
provided by a state‐issued franchisee or their affiliate and those that subscribed to other providers.
However, we are unable to show that comparison in this report because the FCC had not released 2011
year‐end data from the Form 477 at the time data were compiled for this report.

20
B. Broadband Penetration Increased by 2.6 Percentage Points
The 2011 residential wireline broadband penetration rate for households served by state‐issued video
franchisees or their affiliates increased 2.6 percentage points to 73.3% (9.2 million) during 2011, up from
70.7% in 2010 (8.9 million subscribers). Penetration rates are calculated by dividing the number of
subscribers by the number of total households. This number has steadily increased as more households
subscribe to broadband service from state‐issued franchisees or their affiliates.
In previous years, we have shown penetration rates for all statewide residential wireline, fixed wireless,
and mobile broadband wireless providers, in addition to state‐issued franchisees and their affiliates that
provide broadband service. However, due to the fact the FCC had not released year‐end data from the
Form 477 at the time data for this report was compiled, we are unable to show that data here.
Broadband Penetration Rates for Households Served by State‐Issued Video
Franchisees or Their Affiliates*
2008 2009 2010 2011
2008 ‐
2011
Total
Growth
2010‐
2011
Growth
Total Households 12,462,043 12,577,498 12,609,150 12,633,403
Total Subscribers 7,910,166 8,484,435 8,917,437 9,261,776 17% 4%
Residential Wireline Broadband
Penetration State‐Issued Video
Franchisees & Affiliates
(% Total HHs in CA) 63.5% 67.5% 70.7% 73.3%
*Penetration rates are calculated by dividing the number of subscribers by the number of total households

21
C. Mobile Broadband’s Role in Providing Broadband Access
In analyzing broadband availability data, geographic areas are deemed served, underserved or unserved.
In February 2012, the Commission adopted D.12‐02‐015, which changed the Commission’s definition of
“underserved” and “served.” The current definition states that underserved areas are offered
broadband slower than 6 Mbps for downloads and 1.5 Mbps for uploads (6 Mbps/ 1.5 Mbps), but faster
than 768 Kbps/ 200 Kbps. Served areas are offered broadband at speeds greater than or equal to
6Mbps/ 1.5 Mbps. Previously, the Commission had defined an area as served if it was offered speeds
greater than or equal to 3Mbps/ 1Mbps.
The chart below shows the total number of households considered served, underserved and unserved.
The totals are shown for mobile and fixed broadband availability combined and for fixed broadband
availability only.38
Households Served, Underserved and Unserved in 2011
Total Population Served Broadband
service at least 6 mbps down and 1.5 mbps up
Underserved Broadband service slower than 6 mbps down or 1.5 mbps
up
Unserved, Populated
Broadband service slower than 768 kbps down or 200
kbps up
Mobile and Fixed Broadband Availability
12,577,498 12,218,916 97.1% 347,131 2.8% 11,451 0.1%
Fixed Broadband Availability
12,577,498 11,761,012 93.5% 668,030 5.3% 148,456 1.2%
38 The total population is from the 2010 census and is not a projection of any growth that may have occurred in 2011.

22
Our analysis also shows that mobile broadband providers have the potential to play a significant role in
providing access to broadband service because they are able to provide service in areas that are
unserved or underserved by fixed providers. The table below shows that in 2011, 3.6% of the state’s
households were in an area that was either underserved or unserved by fixed providers, but were
considered served because of service from one or more mobile providers. Additionally, 0.7% of the
state’s households were in an area that was unserved by fixed providers, but were considered
underserved because of service from one or more mobile providers.
Additionally, identification and validation of areas that are underserved or served only because of the
presence of mobile service may increase the number of areas that are eligible for California Advanced
Services Fund (CASF) grants.39 The data shown above were aggregated from providers’ reported data.
The CPUC has received approximately $1.5 million from the National Telecommunications and
Information Administration that is to be used, in part, to conduct drive tests to measure mobile service
quality in urban, rural and tribal land areas of the state.40 These measurements are used to validate
providers’ reported data and will be used to determine whether an area is actually unserved and
underserved and therefore, eligible for CASF grant funding.
39 Interim Opinion Implementing California Advanced Services Fund (D.07‐12‐054, Dec. 20, 2007); The Commission authorized the California Advanced Services Fund (CASF) in accordance with Public Utilities (P.U.) Code § 701. The CASF provides infrastructure grants to bridge the “digital divide” in unserved and underserved areas in the state. 40 Cal. P.U.C., California Broadband Availability GIS Data and Maps, http://www.cpuc.ca.gov/PUC/Telco/Information+for+providing+service/Broadband+Availability+Maps.htm. Last visited April 26, 2013.
Households with Broadband Access Due to Mobile Service 2011
Households
Number Percent
State 12,577,498 100%
Underserved & Unserved, Considered Served Due to Mobile Service 452,690 3.6%
Unserved, Considered Underserved Due to Mobile Service 88,260
0.7%

23
D. Slight Increase in Households with Choice of Three or More Broadband
Providers
The chart below illustrates that 84% (10.6 million) of the households in the state are located in census
blocks where broadband was offered by two or more state‐issued video franchisees or their affiliates in
December 2011.41 This decreased from 86% (10.8 million) in December 2010. However, about 3%
(377,441) of households were located in census blocks which obtained a third provider between 2010
and 2011.
The map on the next page shows the geographic location of census blocks with 0, 1, 2, 3, 4, and 5
providers. This map only includes state‐issued franchisees which provide service using fixed technology
(excludes mobile broadband providers and local franchises). Based on this map, many rural areas have
less choice in fixed broadband providers. We note that the map includes unpopulated rural areas which
have no providers.
41 It is difficult to precisely compare 2010 and 2011 information in this section because of the use of 2010 census data for this report. Prior reports used projections based on data from the 2000 census. This change results in an analysis that assumed fewer households and a greater number of census blocks in the state than assumed in 2010. For details, see Appendix C: Methods, Sources, and Data Limitations.
24
E.

25
E. The Federal Communication Commission’s Definition of Broadband Has
Changed
Our ability to track availability is based on the data that the FCC collects. In June 2008, the FCC changed
how it defines and gathers data about broadband services. Previously, the FCC had defined broadband
services as those with transmission speeds in excess of 200 Kbps in one direction. The FCC voted to
change this definition to define broadband as speeds greater than 768 Mbps/ 200 Mbps.
Additionally, the FCC adopted new Form 477 reporting requirements for broadband and internet service
providers, which required service providers to report their service by technology and census tract in the
bandwidth tiers listed below. This allows a much deeper analysis of consumer demand.
768 Kbps to < 1.5 Mbps
1.5 Mbps to < 3 Mbps
3 Mbps to < 6 Mbps
6 Mbps to < 10 Mbps
10 Mbps to < 25 Mbps
25 Mbps to <50 Mbps
50 Mbps < 100
100 Mbps < 1 Gbps
≥ 1 Gbps
Immediately following the FCC’s action, the Commission amended G.O. 169 to match the FCC’s 477
reporting requirements. Video franchisees satisfy this obligation by submitting their data or the data of
their affiliates from their California Form 477 data directly to the CPUC. Therefore, although Form 477
data for all broadband providers in the state was not available, this same information from state‐issued
franchisees was available and compiled in this report. Using this data, the CPUC made the following
findings regarding speed and technology.

26
F. Available Broadband Speeds are Generally Faster in Urban Areas
The map on the next page uses the collected download speed data to display the maximum advertised
broadband download speeds for each census block in the state of California. It is apparent from this map
that urban areas are more likely to have greater advertised maximum broadband download speeds.
However, not depicted on the map are broadband services offered by providers which do not have a
state‐issued video franchise. Comprehensive broadband availability data can be viewed on the California
interactive broadband map.42
42 Cal. P.U.C., California Broadband Availability Map, http://www.broadbandmap.ca.gov/. Last visited at April 12, 2013.

27

28
G. Californians are Subscribing to Faster Speed Tiers
In 2011, many Californians subscribed to faster speed tiers than in 2010. For example, about 700,000
more households subscribed to speed tiers above 25 Mbps for downloads. The most subscribed to
speed in 2011 was 10‐25 Mbps as it was in 2010. In 2009, 6‐10 Mbps was the most subscribed to speed
tier and in 2008, 3‐6 Mbps was the most subscribed to speed tier. This shift in the most subscribed to
tier (from 3‐6 Mbps to 10‐25 Mbps) during 2008 ‐2011 reflects the increasing speed demands of
consumers as they begin to utilize applications and services that require more bandwidth such as
streaming video and audio.
The bar chart below shows the number of subscribers served by state‐issued video franchisees and their
affiliates in each maximum advertised download speed tier category from 2008 ‐ 2011 for their fixed
broadband services. As stated previously, the trend over the years has been towards faster speed tiers.

29
The pie chart below describes the aggregated data for subscriber download speeds in 2011. This chart
shows that almost half of all households subscribing to internet subscribe to speed tiers above 6 Mbps
for downloads, which is the benchmark speed for the Commission to consider an area as served.
Speeds

30
The chart below shows that average broadband download bandwidth (speed) used by subscribers of
state‐issued video franchisees and their affiliates has increased from 4.8 Mbps in 2008 to 12.1 Mbps in
2011. This correlates with the previous data showing subscribers’ transition towards faster speed tiers.

31
H. Broadband Technologies: Cable Modems Overtake DSL Modems
The charts below and on the following page show the technologies that state‐issued video franchisees
and their affiliates used to deploy broadband as of December 31, 2011.
The bar chart shows that state‐issued franchisees used cable modems to serve 52.2% of the residential
households (4.8 million) in franchise territories that subscribe to broadband. This is an increase of 2.2
percentage points from 50% in 2010.
In contrast, state‐issued franchisees used DSL (both Asymmetric and Symmetric) to serve 41.1% of the
residential households (3.9 million) in franchise territories that subscribe to broadband. This is a
decrease of 2.9 percentage points from 43.9% in 2010.
Noticeably, fiber optic technology, deployed to the home, is increasingly used to provide service, but
remains a small percentage of the technology used to serve residential households.
The pie chart on the following page shows that in 2011, state‐issued franchisees continued to
predominantly use cable modem and DSL to provide broadband service to residential households.

32
Cable Modem 4,832,308
52%

33
Appendix A: Implementing DIVCA: Decisions and Resolutions

34
Rules Adopted to Implement DIVCA
Shortly after DIVCA was enacted on September 29, 2006, the CPUC, on October 5, 2006 issued its Order
Instituting Rulemaking to consider the adoption of a General Order and procedures to implement the
Digital Infrastructure and Video Competition Act of 2006 (R. 06‐10‐005) (“Rulemaking”). Under this
Rulemaking, the CPUC has developed rules for implementing DIVCA. This was accomplished in three
phases.
Phase I ‐ Adopting Rules to Implement the DIVCA
On March 1, 2007, following the receipt of comments and reply comments on the OIR and subsequent
Proposed Decision, the CPUC issued Decision 07‐03‐014 establishing rules for implementing DIVCA and
adopting General Order 169. (“Rules”) These rules set forth application requirements, CPUC procedures
for considering applications, buildout requirements, low‐income buildout requirements, annual
reporting requirements of both cable and broadband information by census tract, and other
requirements as mandated by DIVCA.43
Phase II ‐ Adopting Non‐Discriminatory Buildout Requirements for Small
LECs
On May 7, 2007 the assigned Commissioner issued a Scoping Ruling setting out issues to be addressed in
Phase II of the Rulemaking. On October 4, 2007, the CPUC issued a Phase II decision adopting non‐
discriminatory buildout requirements for smaller companies and additional reporting requirements.44 In
Phase II, the CPUC determined that the “reasonable time” deployment standard applicable to franchise
holders who are telephone companies with fewer than one million telephone customers should largely
mirror the buildout timetable required of the larger telephone companies. Further, the CPUC
determined that, in their annual reports to the CPUC, holders must provide video subscriber data,
finding that such data are necessary in order for the CPUC to determine whether franchise holders are
adhering to the requirements of DIVCA.45
43 On October 5, 2006, the Commission issued Opinion Modifying Decision 07‐03‐014 (D. 10‐07‐050, Jul. 29, 2010) in order to amend the form of the franchise certificate adopted in Phase I to conform to statutory requirements. 44 Order Instituting Rulemaking to Consider the Adoption of a General Order and Procedures to Implement the Digital Infrastructure and Video Competition Act of 2006 Opinion Resolving Issues in Phase II ( D. 07‐10‐013 Oct. 4, 2007). 45 Previously, the Commission’s Rules required the submission of data related to the number of households offered video services, but not the number of households subscribing to such services.

35
Phase III ‐ Adopting New Rules to Administer DIVCA
On March 27, 2008, the CPUC issued a Scoping Ruling setting out issues to be addressed in the third, and
final, phase of the DIVCA Rulemaking. On July 10, 2008, the CPUC issued the Phase III decision amending
the bonding requirements under DIVCA, adopting new rules regarding deadline extensions for buildout
requirements, and additional reporting requirements.
Under DIVCA, holders of a state video franchise are subject to statutory requirements regarding, among
other things, the extent and pace at which franchise holders must buildout facilities and offer video
services to households. The statute provides that franchise holders may apply to the CPUC for an
extension of the time for such buildout requirements to be satisfied, under certain circumstances. The
Phase III added procedural requirements to ensure that holders’ extension requests are made and
decided in a timely fashion.
Further, Phase III eliminates an unintended and unfair asymmetry in the bond requirement under GO
169 between new entrants in the video marketplace and incumbent cable operators. Local franchises
held by incumbent cable operators tend to be held by many separate affiliates of an ultimate parent.
Verizon and AT&T, by contrast, have each applied for only one state franchise covering their entire video
service areas. The Phase III decision changes the rules under DIVCA to require only one bond to be
posted to cover all affiliated holders rather than separate bonds so that “incumbent” applicants for
video franchises do not have additional burdens placed on them due to their historic corporate
organization under the local franchising scheme.
Finally, Phase III requires holders to include in their annual data submitted to the CPUC broadband
speed “tiers” that state video franchise holders make available. Numerous commenters urged the CPUC
to wait until the FCC released its order requiring broadband reporting by census tract, broken down by
speed tier and technology, and, thereafter, to adopt the FCC’s speed reporting regime. The FCC released
its Report and Order and Further Notice of Proposed Rulemaking adopting new requirements for
reporting broadband service by speed tier on June 12, 2008. 46 The CPUC issued this decision to reflect
the FCC’s speed tier reporting requirements. Holders are now required to report the same broadband
speed information that it reports to the FCC to the CPUC.
46 F.C.C., Form 477 Order, fn. 21, Supra.

36
Resolutions
After gaining experience in processing applications, CPUC staff has made several recommendations for
revisions to the application forms through two resolutions, T‐17107 and T‐17141, which were
subsequently adopted by the CPUC. In addition, DIVCA provides for video franchise holders to pay fees
to the CPUC calculated to equal the amount authorized in the CPUC budget for DIVCA implementation.
Resolution T‐17137 set the user fee due per household in a video franchise holders’ service area for the
2007‐2008 fiscal year. Subsequent to this Resolution, the user fee will be determined annually based on
the pro‐rata percentage of all state video franchise holders’ gross state video franchise revenues that is
attributable to an individual state video franchise holder.
DIVCA Application Process
The application process was designed to be simple and straight forward. It requires applicants to file the
following: a completed application form; a $2,000 application fee; confirmation of technical, managerial,
and financial qualifications demonstrated through the posting of a bond ($100,000 to $500,000); an
affidavit attesting to the lawful operation of the franchise; a definition of the video service area sought;
demographic information by census block group; the expected date for the deployment of video service
in the video service area; and, a list of affected local entities.
The CPUC must determine within 30 days if an application is complete and issue the franchise within 14
days of such determination.47 If the application is not complete, CPUC staff is required to notify the
applicant, and the 30‐day clock restarts. If the CPUC does not issue the franchise within the required 14
days, it is deemed issued. The new franchise holder then notifies the affected local entities.48
The CPUC’s Phase I Decision allowed applicants, except for incumbent cable operators, to begin filing
applications for state‐issued video franchises as of March 1, 2007.49 The first such application was filed
by Verizon California Inc. on March 2, 2007. AT&T California filed its application on March 7, 2007. The
CPUC reviewed these franchise applications for completeness, and issued video franchises Nos. 0001
and 0002 to Verizon and AT&T on March 8 and March 30, 2007, respectively. All franchise applications
and grants may be viewed on the Commission’s web site at
http://www.cpuc.ca.gov/PUC/Telco/Information+for+providing+service/videofranchising.htm.
47 Cal. Pub. Util. Code §5840 (h). 48 Cal. Pub. Util. Code §5840 (n). 49 Phase 1 Decision at Appendix B at 4; DIVCA required the CPUC to begin accepting applications no later than April 1, 2007; Cal. Pub.Util. Code §5847(g).

37
Appendix B: Collecting Data Mandated by DIVCA

38
DIVCA’s Data Reporting Requirements
Holders of state‐issued video franchises are required to submit data relating to their provision of video
and broadband services annually by April 1.50 Pursuant to DIVCA, all video franchisees must report, by
Census tract, the following: 51
1. Video Information:
a. The number of households in the franchisees’ video or telephone service area. 52
b. The number of low‐income households in the franchisees’ video or telephone service area.
c. The number of households in the franchisees’ video or telephone service areas that are offered
video service by the franchise holder.
d. The number of low‐income households in the franchise holder’s video or telephone service
areas that are offered video service by the franchisees.
e. The number of subscribers in the franchisees’ video or telephone service area.53
2. Broadband Information:
a. The number of households to which the franchisee makes broadband available in California. If
the holder does not maintain this information on a Census tract basis, in its normal course of
business, the holder may reasonably approximate the number of households based on
information it keeps in the normal course of business.
b. The number of households that subscribe to broadband that the holder makes available in this
state.
c. The number of subscribers to each download and upload broadband speed tier
d. Whether the broadband service provided by the franchise holder utilizes wireline‐based
facilities or another technology.
e. Types of technology used to deploy broadband services
DIVCA directs the CPUC to aggregate the data described above and to report the aggregated totals to
the Governor and the Legislature annually no later than July 1.54 In the following sections, we will discuss
the broadband and video data submitted by the Video Franchisees as of April 1, 2008.
50 Cal. Pub. Util. Code §5960. 51 Id. 52 Incumbents must report by video service area; telephone corporations by telephone service area. 53 Order Instituting Rulemaking to Consider the Adoption of a General Order and Procedures to Implement the Digital Infrastructure and Video Competition Act of 2006 Opinion Resolving Issues in Phase II ( D. 07‐10‐013 Oct. 4, 2007). 54 Cal. Pub. Util. Code §5960.

39
Appendix C: Methods, Sources, and Data Limitations

40
Video and Broadband Subscribership Data Sources
DIVCA requires state franchise holders to submit annual data describing their territories, availability of
service, and subscribership (see Appendix B: Collecting Data Mandated by DIVCA). The data used in this
fifth annual report were current as of December 31, 2011. These data were used throughout this report
and provided a base from which to compare and evaluate providers’ year‐to‐year performance under
DIVCA.
All state video franchise holders who had state franchises and/or amendments issued before December
31, 2011, submitted annual data pursuant to Cal. Pub. Util. Code §5960. Each parent company of a state
video franchise holder filed one annual report which included broadband and video service data for all
of their state franchised operations as well as their local affiliates that operate in California and provide
video or broadband service in the state.
The companies that filed annual reports for 2011 are: AT&T California, Astound Broadband, Bright
House Networks, Cable USA, Cableview Communications, Calaveras Cablevision, CalNeva Broadband,
Champion Broadband, Charter Communications, Comcast Cable, Cox Communications, Google Fiber,
Horizon Cable TV, Mediacom, Northland Cable Television, Sebastian Enterprises, Suddenlink
Communications, SureWest Broadband, Time Warner Cable, Verizon California, and Volcano Vision.
The analyses of video and broadband service are based on these self‐reported data from parent
companies of the state video franchise holders listed above and exclude companies that are not yet
state franchise holders.55
To aggregate the data reported by Census tract and map and analyze it, we used an Oracle database and
a Geographic Information System (GIS). We also used Excel spreadsheets to aggregate, analyze and
create graphs of the annual data. The findings are illustrated in maps, graphs, and charts throughout the
report.
Staff conducted analyses of broadband subscribership and penetration using data collected from
franchisees under the FCC’s Form 477 requirements, as required by DIVCA.
Broadband Availability Data Sources
The CPUC’s Broadband Mapping Program, under the auspices of the National Telecommunication and
Information Administration’s (NTIA) State Broadband Initiative (SBI), which implements the joint
purposes of the American Recovery and Reinvestment Act (ARRA) and the Broadband Data
Improvement Act (BDIA), collected broadband availability data used in this analysis. The NTIA has
authorized the CPUC as the sole authority in California for collecting, compiling, analyzing, and
presenting broadband data. Details are described in section three on the next page.
Broadband availability data, collected by the CPUC’s Broadband Mapping Program from current state
video franchisees, have been used in this report in lieu of data mandated under the 2006 Digital
55 Some of the small video franchisees did not report broadband availability data.

41
Infrastructure and Video Competition Act (DIVCA). We used this data because the SBI data is aggregated
to the Census block and street segment level, and therefore can be up to 8,991 times more granular
than data collected at the Census tract level under DIVCA.56
According to SBI rules, a broadband provider may elect to provide data on the availability of their service
by either 1) address, or 2) Census blocks and street segment. If a provider offers service in a Census
block that is less than 2 square miles in size, they may assert that they provide service to all households
in that block. If a provider offers service in a block that is 2 square miles in size or larger, they must
specify to which segments they provide the service. All collected data is aggregated by Census block and
street segment, preserving the 2 square mile break. More details are available on the State Broadband
Mapping Program webpage:
www.cpuc.ca.gov/PUC/Telco/Information+for+providing+service/Broadband+Mapping/.
Buildout and Non‐Discrimination Data Sources
Under DIVCA Section 5890e, telephone companies with more than one million subscribers are required
to submit data supporting their compliance with the statute’s 5‐year buildout and non‐discrimination
requirements. AT&T and Verizon provided these data to the Commission as separate filings by their
respective 5‐year franchise anniversaries.
Determining the Number of Providers and Households Served per Census Block
or Tract
The broadband availability data from each provider were incorporated into feature classes in a file
geodatabase according to SBDDP standards, where they exist in a many‐to‐one relationship to the
Census blocks. That is, many availability records exist for each Census block, based on differences in
provider name, technology type, and upstream and downstream speed. To estimate the number of
distinct broadband providers per Census block, data from each provider was exported to shapefile then
attribute‐joined to a clean Census block shapefile, which removes any “duplicate” records, thereby
enforcing a one‐to‐one relationship. After all provider data has been exported and joined, each distinct
provider name, contained in a separate field, is concatenated together into a single field, using the field
calculator’s “&” operator. The resulting concatenation sequences were then sorted alphabetically,
common blocks of sequences identified visually and selected, and the number of distinct providers
entered in a new field. The same method was used for the street segment data.
Video data mandated under DIVCA are gathered in Excel data templates, and stored permanently in an
ORACLE database, from which data is queried. Calculations, such as the number of distinct providers per
Census tract, were performed directly in the queried tables, then exported to Excel and immediately
joined to a Census tract shapefile for mapping.
Once the number of broadband providers per Census block and video providers per Census tract were
56 There can be up to 999 Census blocks (CBs) in a single Census block group (CBG), and up to 9 CBGs in a single Census tract.

42
determined, the aggregate number of households associated with each of these provider numbers could
be summed from the shapefile attribute table.
New 2010 Census Data
New Census 2010 household data were used as the basis for estimating the aggregate number of
households in Census blocks with a common number of broadband providers (0, 1, 2, 3, 4, or 5). These
new data were combined with household growth factors derived from the California Department of
Finance’s (CDF) annual household estimates by incorporated city and county, to project a household
estimation to the current year for each Census block. We derived the household growth factor by
dividing the CDF’s current year household estimate by their previous year household estimate for each
incorporated city, and the unincorporated balance of each county. This growth factor was then applied
to all Census blocks with their centroid within the incorporated city or unincorporated balance of county
in question, to arrive at a new current year projected household estimate for each Census block.
This new method of household projection is a significant improvement over the methods used in
previous reports. In 2008 we used a single statewide growth rate for every calculation, both county and
Census tract. We refined the method in 2009 by using separate growth rates for each county, and their
component Census tracts. This addressed the regional variation in growth rates but failed to address the
urban/rural dichotomy, 57 which had most likely resulted in an overestimation of the number of
households served by multiple providers, painting a rosier picture of broadband competition in
California than may actually be the case.
The new method accounts for variations in both regional household growth rates and urban and rural
areas. It also uses more up‐to‐date Census data. As a result, the projections are much closer to reality. It
also creates a statistical disconnect with previous reports, which became progressively less accurate the
further away from Census 2000 they were. Prior to January 2011 when the 2010 Census data were
released, our best estimate of households in California was 12,790,143. The 2010 Census data showed
that the actual number of households in California (in April 2010) was 12,577,498. We had
overestimated by about 1.7% statewide, and probably much more in locally.
New 2010 Census Boundaries
The 2010 Census delivered more than just up‐to‐date household estimates. It also added new blocks
and tracts and redrew existing boundaries. The number of Census blocks in California increased by
33.2% (533,136 to 710,145) over 2000. The number of Census tracts increased by 14.1% (7,049 to 8,043)
over 2000. The effect of these increases is to reduce the average size of both blocks and tracts, thereby
increasing their overall granularity as mapping units, and increasing the accuracy of any household
estimation based on their selection. This increased accuracy can manifest as a decrease in the household
estimate in specific areas outside urban cores, because the blocks or tracts which now comprise these
areas have a smaller overall footprint. Blocks and tracts within urban cores are far less likely to have
been split or redrawn – they therefore manifest only an increased overall household estimate.
57 With the exception of purely rural counties, such as Alpine, Modoc, and Trinity.

43
Data Limitations
Census Data Aggregation. Despite the use of more granular Census boundaries and up‐to‐date data,
there are still limitations inherent in their use for household estimation in local areas. Data is reported
to us in a number of different units – address, street segment, Census block (under SBI), and Census
tract (under DIVCA). Address‐level availability data is aggregated to either Census blocks or street
segments before being permanently stored in file geodatabase feature classes, reported to the National
Telecommunications Information Agency (NTIA), and incorporated into the analyses in this report. For
the purpose of estimating households, street segment availability was also “rolled up” to Census blocks.
Most of our work here, therefore, deals only with Census geographies (block and tract).
Although Census blocks are a much more granular mapping unit than Census tracts, and provide a much
better picture of broadband availability than Census tracts do of video availability under DIVCA, the
unavoidable fact of aggregation means that staff’s ability to perfectly analyze and depict the availability
of broadband and video service is still limited. The table below compares the relative sizes of Census
tracts and blocks in California.
Geography Count
Size (in sq. mi.) Number of Households
Min. Max. Ave. Min. Max. Ave.
Census Block 709,128 <0.000001 523 0.22 0 1,392 18
Census Tract 8,043 0.00052 7,008 19.7 0 8,362 1,562
Census tract reporting for video availability data, rather than actual address reporting, makes it
impossible to know exactly how many households are offered service in any given Census tract, or how
many households exist within the franchise territory of any given State franchisee. Individual franchisees
report the number of households to which they offer service by Census tract, and for Census tracts
where they are the only provider, this figure can be taken as the actual number of households offered
service in that tract; but for Census tracts in which there are multiple providers, it is impossible to know
whether or not the competing services are offered to the same households. Therefore, simply adding
the “households offered video” figures from two or more providers may result in double or triple
counting, bringing some availability and subscription rates to over 100%.
Consequently, mapping where competition has occurred (one of the core concerns of DIVCA) is
complicated. Since it is impossible to know where within each Census tract video service is being
offered, we can only classify tracts as being either served or unserved by each provider, then add up the
number of providers in each tract. In this way, the current level of video competition was also
overstated.
Similarly for broadband, if one household in a Census block was offered service by any franchise holder,
then it was assumed that all households within it were offered the service, and the block was considered

44
“served.” This naturally results in an overstatement of the level of availability. Error estimation was not
done for this report, so it is not known how inaccurate these estimates are. On the other hand, the
population density within California varies widely, as reflected in the extreme variation in its Census
geography sizes. This means that the Census tracts comprising California’s vast rural north and east
(where most of the error in the results probably lie) are relatively few, and that the total number of
households this represents are also relatively few.
Street Segment Data Aggregation. Street segments amounted to about a third of all broadband
availability data collected; yet linear (polyline) data has no associated Census household data. It was
therefore necessary to derive the data by an overlay selection with another layer. A simple overlay
selection with a Census block layer containing provider and household data wouldn’t work since street
segments, by their very nature, overlap or straddle multiple Census blocks, which would result in double
counting of households in many Census blocks. Instead, we applied a Census block overlay selection for
each group of street segments with a common number of providers; then removed any selected blocks
that may already have had a non‐zero provider count (i.e. blocks 2 square miles in size or larger), before
summing the households in those blocks.58 The Census blocks and street segments with no providers
could not be directly selected and summed; since they overlap each other (they are not spatially
exclusive). So instead, that total was derived by subtracting the Census block / street segment
household totals for 1, 2, 3, 4 and 5 providers from the statewide household grand total.
An implicit assumption in this method is that a single served street segment causes an entire block (and
all households in it) to be classified as served. The same assumption is also made regarding the number
of households being served by 0, 1, 2, 3, or 4 video providers, in this, and previous, years’ reports.
When drawing conclusions from this report, it is important to keep in mind that only services offered by
state‐issued video franchise holders and their affiliates are reflected. Broadband and video services
offered by local independent wireline providers and wireless and satellite ISPs are, by definition,
excluded.
58 Note that Census blocks and street segments with a non‐zero provider count are spatially exclusive, due to the 2 square mile SBDD criteria; so a simple additive approach was used.

45
Appendix D: Video Franchise Area Maps