district energy system pre-feasibility2).pdf · district energy system pre-feasibility ... gary...
TRANSCRIPT
District Energy System Pre-Feasibility
Study City of Whitehorse, Yukon
A study to assess the viability of
establishing a District Energy System in
the City of Whitehorse, Yukon
Prepared for:
Sean MacKinnon
Senior Energy Advisor
Energy Solutions Centre, Department of
Energy Mines and Resources,
Government of Yukon
206A Lowe Street, Yukon
Ph: (867) 393 - 7067
Prepared by:
Stantec Consulting Ltd.
111 Dunsmuir, Suite 1100
Vancouver, BC V6B 6A3
Ph: (604) 696-8000
Fax: (604) 696-8100
And
Earthvoice Strategies
Contact:
Gary Wheating, P.Eng.
Alex Hutton, P.Eng.
March 8, 2010
Stantec Project Number: 118200105


DISTRICT ENERGY SYSTEM PRE-FEASIBILITY STUDY CITY OF WHITEHORSE, YUKON
ah w:\1182\active\01 active projects\118200105 - city of whitehorse des\180-230-mechanical\05-reports\final_report\2010_03_08\rpt_001_20100308.doc E.1
Executive Summary
Stantec is pleased to present this report to the City of Whitehorse (the City), as well as the
Energy Solutions Centre (ESC) and the Property Management Division (PMD), two branches of
the Yukon Territory Government (YTG). The report summarizes the results of the District
Energy Pre-Feasibility Study for the City of Whitehorse, Yukon.
The purpose of the Pre-Feasibility Study was to evaluate the economic and technical viability of
a District Energy System (DES), which would supply heat energy to municipal and territorial
buildings in the City of Whitehorse, Yukon.
The scope of the report is in keeping with the Terms of Reference section of the RFP, and can
be summarized by the following tasks:
• Task 1: Load Intensity Analysis
• Task 2: Energy Input Discussion
• Task 3: Preliminary System Concept
• Task 4: Greenhouse Gas (GHG) Emissions and Air Quality
• Task 5: Financial Analysis / Projections
• Task 6: Recommended Course of Action
The load intensity analysis revealed that three zones within the City (Zone 1: Lewes Blvd, Zone
2: Hospital Road, & Zone 3: Downtown Core) have sufficient heating energy intensity and scale
to be considered viable, even without connecting any non-government buildings. Connecting to
some key non-YTG/City buildings (such as hotels) would only improve the heating intensity and
thus viability within each of these zones.
Three other zones within the City (Zone 4: Range Road, Zone 5: Quartz Road, & Zone 6:
Airport) have potential to be viable options for either connected expansions or stand-alone
district systems; however, they likely require some non-government buildings to connected.
The scenarios that were considered for the District Energy System (DES) for the City of
Whitehorse included heat only systems and combined heat and power systems utilizing various
fuels including biomass, heating oil and electricity. Most of the options explored are deemed
technically viable.
The system that appears to represent the best case for the DES is the heat only system utilizing
biomass in the form of wood pucks as the fuel. This scenario was used as the basis for
financial analysis and projections.

DISTRICT ENERGY SYSTEM PRE-FEASIBILITY STUDY CITY OF WHITEHORSE, YUKON EXECUTIVE SUMMARY
March 8, 2010
E.2 ah w:\1182\active\01 active projects\118200105 - city of whitehorse des\180-230-mechanical\05-reports\final_report\2010_03_08\rpt_001_20100308.doc
The financial analysis showed that the recommended DES option is financially viable even
when using the conservative assumptions made throughout (providing that the Client is willing
to pay heating charges about 6% higher than business as usual (BAU), and is willing to fund the
cumulative operating deficit projected to reach $1,311,000 before cash flow after debt service
and sinking fund payments turns positive).
It is recommended that the project proceed to a Feasibility Study in order to refine and confirm
all aspects of this study by going into more detail. Specific political, business, technical, and
financial recommendations and next steps are outlined in the report.

DISTRICT ENERGY SYSTEM PRE-FEASIBILITY STUDY CITY OF WHITEHORSE, YUKON
ah w:\1182\active\01 active projects\118200105 - city of whitehorse des\180-230-mechanical\05-reports\final_report\2010_03_08\rpt_001_20100308.doc E.1
Acknowledgements
The following is a summary of the contacts who have provided input and assistance in the
development of this report including members of the Client partnership organizations.
Table 1: Summary of Acknowledgements
Organization Name Contact Info Role / Input
Brian Crist [email protected] Input on cost of borrowing, other
resources
City of
Whitehorse
Shannon Clohosey Shannon.Clohosey@whitehor
se.ca
Site tour and building
information
Colin McDowell [email protected] Report review
Bob Collins [email protected] Report review
Sean MacKinnon,
Energy Solutions
Centre (ESC)
[email protected] Client Project Manager, input
through out the process and
review of the report
Shane Andre, ESC [email protected] Input on biomass fuel suppliers
Cathy Cottrell,
ESC
[email protected] Input on the Public Buildings
Energy Tracking System
(PBETS)
Josh
Mickelborough,
Property
Management
Division (PMD)
ca
Led tour of numerous YTG
buildings
Yukon Territory
Government
Satch Atchison,
PMD
Led tour of numerous City
buildings
Pinnacle Pellet Peter Brandt Principal
www.pinnaclepellet.com/
Input on availability of biomass
pellets
Yukon North
Biomass
Company
Terrance Taite [email protected] Wood puck information
Sawmill Dimok Timber http://dimoktimber.com/ Input on availability of waste
biomass
Yukon Energy
Corporation
(YEC)
Hector Campbell,
Director, Domestic
Sales & Marketing
[email protected] Info in secondary sales of
electricity
Yukon Electrical
Company Ltd.
(YECL)
Phil Borgel [email protected] Info in secondary sales of
electricity


DISTRICT ENERGY SYSTEM PRE-FEASIBILITY STUDY CITY OF WHITEHORSE, YUKON
ah w:\1182\active\01 active projects\118200105 - city of whitehorse des\180-230-mechanical\05-reports\final_report\2010_03_08\rpt_001_20100308.doc E.1
Limits of Liability
This report was prepared by Stantec Consulting Ltd. for the Client. The material in it reflects our
professional judgment based on previous experience, research, engineering principles, and
visual observation and operations personnel comments for the facilities during the site visit of
September 29th, 2009. Assumptions presented in this report should be reviewed and any
discrepancies brought to the attention of the appropriate Stantec contact. All results are
estimates with a margin of uncertainty and are not guaranteed. Any use which a third party
makes of this report, or any reliance on or decisions made based on it, are the responsibility of
such third parties. Stantec Consulting Ltd. accepts no responsibility for damages, if any,
suffered by any third party as a result of the decisions made or actions based on this report.
Some assumptions have been made for parameters of the operation or performance of
equipment and materials. The use of these values and parameters shall in no way imply
endorsement of a specific product or manufacturer.


DISTRICT ENERGY SYSTEM PRE-FEASIBILITY STUDY CITY OF WHITEHORSE, YUKON Table of Contents
March 8, 2010
ah w:\1182\active\01 active projects\118200105 - city of whitehorse des\180-230-mechanical\05-reports\final_report\2010_03_08\rpt_001_20100308.doc i
Table of Contents
EXECUTIVE SUMMARY E.1
1.0 INTRODUCTION ..............................................................................................................1.1 1.1 OVERVIEW.......................................................................................................................1.1
1.1.1 Purpose..............................................................................................................1.1 1.1.2 Objective ............................................................................................................1.1 1.1.3 Context...............................................................................................................1.1 1.1.4 Scope.................................................................................................................1.3
1.2 ORGANIZATION OF THE REPORT .................................................................................1.4 1.3 DISTRICT ENERGY OVERVIEW .....................................................................................1.4
1.3.1 Background........................................................................................................1.5 1.3.2 Benefits ..............................................................................................................1.5 1.3.3 Determinants......................................................................................................1.6 1.3.4 Challenges .........................................................................................................1.7
2.0 TASK 1: LOAD INTENSITY ANALYSIS..........................................................................2.9 LOAD DATA ACQUISITION..............................................................................................2.9 2.1 2.9
2.1.1 Utility Data........................................................................................................2.10 2.1.2 Aggregate Statistical Data ................................................................................2.10 2.1.3 Building Description Information .......................................................................2.11 2.1.4 Site Visit ...........................................................................................................2.11
2.2 LOAD INTENSITY ANALYSIS ........................................................................................2.12 2.2.1 Summary of Known Heating Loads ..................................................................2.12 2.2.2 Average Energy Intensity .................................................................................2.13 2.2.3 Predicted Heating Loads and Intensity (YTG and City Bldgs)...........................2.14 2.2.4 Predicted Heating Loads and Intensity (Other Bldgs) .......................................2.15 2.2.5 Predicted Heating Loads and Intensity (Future Bldgs)......................................2.16 2.2.6 Summary of Heating Intensity by Zone.............................................................2.16 2.2.7 Preliminary Screening ......................................................................................2.17
2.3 MOST FEASIBLE ZONES AND BUILDINGS..................................................................2.18 2.3.1 Zones ...............................................................................................................2.18 2.3.2 Buildings ..........................................................................................................2.19 2.3.3 Future Expansion .............................................................................................2.19
3.0 TASK 2: ENERGY INPUT DISCUSSION ......................................................................3.20 3.1 ENERGY INPUT CHARACTERISTICS, PRICING, AND AVAILABILITY.........................3.20
3.1.1 Wood Waste.....................................................................................................3.20 3.1.2 Wood Pellets ....................................................................................................3.20 3.1.3 Wood Pucks .....................................................................................................3.21 3.1.4 Heating Oil .......................................................................................................3.21 3.1.5 Propane ...........................................................................................................3.21 3.1.6 Electric – Firm ..................................................................................................3.22
DISTRICT ENERGY SYSTEM PRE-FEASIBILITY STUDY CITY OF WHITEHORSE, YUKON Table of Contents
March 8, 2010
ii ah w:\1182\active\01 active projects\118200105 - city of whitehorse des\180-230-mechanical\05-reports\final_report\2010_03_08\rpt_001_20100308.doc
3.1.7 Electric – Secondary ........................................................................................3.22 3.1.8 Municipal Solid Waste ......................................................................................3.22 3.1.8.1 Solar Energy ....................................................................................................3.22 3.1.8.2 Waste Heat Sources ........................................................................................3.22 3.1.8.3 Geo-Thermal Heat............................................................................................3.23 3.1.9 Summary..........................................................................................................3.23
3.2 HEAT GENERATION TECHNOLOGIES CONSIDERED ................................................3.24 3.3 ENERGY INPUT AND TECHNOLOGY SCENARIOS CONSIDERED.............................3.24
3.3.1 Combustion Only (Cases 1-5): .........................................................................3.24 3.3.2 Combined Heat and Power (CHP) – Organic Rankin Cycle (ORC) Technology
(Cases 6-10): ...................................................................................................3.26 3.3.3 Combined Heat and Power – Steam Turbine Technology (Cases 11-15): ........3.27 3.3.4 Heat Only by Electric (Cases 16 – 17)..............................................................3.28 3.3.5 Ground Source Heat Pump (GSHP) System Option.........................................3.28 3.3.5.1 Site Potential ....................................................................................................3.29 3.3.5.2 Compatibility Issues .........................................................................................3.29 3.3.5.3 GHG Issues......................................................................................................3.29 3.3.5.4 Summary..........................................................................................................3.30 3.3.6 Waste to Energy Options..................................................................................3.30
3.4 COMPARISON OF OPTIONS.........................................................................................3.31 3.5 CONCLUSIONS..............................................................................................................3.32
4.0 TASK 3: PRELIMINARY SYSTEM CONCEPT..............................................................4.33 4.1 SERVICE AREA .............................................................................................................4.33 4.2 SYSTEM CONCEPT.......................................................................................................4.33
4.2.1 Distribution Network .........................................................................................4.33 4.2.2 Plant.................................................................................................................4.34 4.2.3 Energy Transfer Stations..................................................................................4.36 4.2.4 System Operation.............................................................................................4.36 4.2.5 System Control.................................................................................................4.37
5.0 TASK 4: GHG EMISSIONS AND AIR QUALITY ...........................................................5.38 5.1 EMISSION FACTORS ....................................................................................................5.38 5.2 RESULTS .......................................................................................................................5.39 5.3 AIR QUALITY IMPACTS.................................................................................................5.40
6.0 TASK 5: FINANCIAL ANALYSIS / PROJECTIONS......................................................6.41 6.1 ASSUMPTIONS..............................................................................................................6.41
6.1.1 Energy Costs....................................................................................................6.41 6.1.2 Taxes ...............................................................................................................6.44 6.1.3 Revenue...........................................................................................................6.45 6.1.4 Capital and Financing.......................................................................................6.45
6.2 PROJECTIONS ..............................................................................................................6.46 6.2.1 BAU Projections ...............................................................................................6.47 6.2.2 DES Projections ...............................................................................................6.48
6.3 RATE ANALYSIS............................................................................................................6.54

DISTRICT ENERGY SYSTEM PRE-FEASIBILITY STUDY CITY OF WHITEHORSE, YUKON Table of Contents
March 8, 2010
ah w:\1182\active\01 active projects\118200105 - city of whitehorse des\180-230-mechanical\05-reports\final_report\2010_03_08\rpt_001_20100308.doc iii
6.4 SENSITIVITY ANALYSIS................................................................................................6.55 6.5 OWNERSHIP AND OPERATING MODELS....................................................................6.58
6.5.1 Ownership Models............................................................................................6.58 6.5.2 Operating Models ...............................................................................................6.1
6.6 FINANCIAL AND OPERATIONAL CONCLUSION ............................................................6.1
7.0 CONCLUSIONS, RECOMMENDATIONS, AND NEXT STEPS ........................................7.3 7.1 CONCLUSIONS................................................................................................................7.3
7.1.1 Technical............................................................................................................7.3 7.1.2 Financial.............................................................................................................7.3 7.1.3 Other ..................................................................................................................7.3
7.2 RECOMMENDATIONS AND NEXT STEPS......................................................................7.4 7.2.1 Political...............................................................................................................7.4 7.2.2 Business ............................................................................................................7.4 7.2.3 Technical............................................................................................................7.4 7.2.4 Financial.............................................................................................................7.5 7.2.5 Other ..................................................................................................................7.6
APPENDICES..........................................................................................................................7.7 APPENDIX A – LOAD INTENSITY DATA................................................................................7.8 APPENDIX B – SITE VISIT SUMMARY.................................................................................7.16 APPENDIX C – HEATING ENERGY INTENSITY MAPS .......................................................7.18 APPENDIX D – ENERGY INPUT DATA ................................................................................7.22 APPENDIX E – FINANCIAL PROJECTIONS.........................................................................7.23
DISTRICT ENERGY SYSTEM PRE-FEASIBILITY STUDY CITY OF WHITEHORSE, YUKON Table of Contents
March 8, 2010
iv ah w:\1182\active\01 active projects\118200105 - city of whitehorse des\180-230-mechanical\05-reports\final_report\2010_03_08\rpt_001_20100308.doc
List of Figures
Figure 1: Screen Capture from On-line Visualization of Strategic Goals..................................1.3 Figure 2: Changing Fuel Sources for Municipality of Linköping DES (Source: Usitall) .............1.6 Figure 3: District Energy Systems in the Yukon and Northwest Territories ..............................1.7 Figure 4: HEI Data by Building Type from Various Sources (kWh/m2/year) ...........................2.13 Figure 5: Wood Pellet Boiler..................................................................................................3.25 Figure 6: Organic Rankin Cycle Unit .....................................................................................3.27 Figure 7: Example District Heating Distribution Pipe Installation ...........................................4.33 Figure 8: Schematic Layout of Proposed DES ......................................................................4.34 Figure 9: Biomass District Heating Plant in Revelstoke BC ...................................................4.35 Figure 10: Energy Transfer Station Installation......................................................................4.36 Figure 11: Oil Prices - Historical and Forecast ......................................................................6.43 Figure 12: Energy Price Projection 2010 - 2034....................................................................6.44 Figure 13: BAU Expense Breakdown ....................................................................................6.48 Figure 14: Customer Cost Comparison .................................................................................6.51 Figure 15: DES Cashflow and NPV.......................................................................................6.52 Figure 16: DES Revenue Breakdown....................................................................................6.53 Figure 17: DES Expense Breakdown ....................................................................................6.54 Figure 18: Identifying Buildings and Zones within Study Area ...............................................7.20 Figure 19: Estimated Heating Energy Intensity of All Buildings within Study Area .................7.21
List of Tables
Table 1: Summary of Acknowledgements ................................................................................. 1 Table 2: Summary of Load Data Sources................................................................................2.9 Table 3: Summary of Utility Data...........................................................................................2.12 Table 4: Average HEI Values used to Predict Heating Load (kWh/m2/year) .........................2.14 Table 5: Summary of Estimated Heating Load for YTG and City Buildings............................2.15 Table 6: Summary of Heating Energy Intensity by Zone (All YTG and City Buildings) ...........2.17 Table 7: Summary of Heating Energy Intensity by Zone (After Screening Level 1)................2.18 Table 8: Costs and Characteristics of Fuels Considered .......................................................3.23 Table 8: Ranking of Technology and Fuel Alternatives..........................................................3.31 Table 9: GHG Intensity by Fuel .............................................................................................5.39 Table 10: Summary of Energy Consumption and GHG Emissions for BAU and DES Scenarios
(Year 2034)*...................................................................................................................5.40 Table 11: Oil Price Forecasts ................................................................................................6.42 Table 12: Financial Figures...................................................................................................6.46 Table 13: BAU Financial Projections .....................................................................................6.47 Table 14: DES Financial Projections .....................................................................................6.49 Table 15: Rate Analysis ........................................................................................................6.54 Table 16: Sensitivity Analysis................................................................................................6.57 Table 17: Ownership Models Assessment ..............................................................................6.1 Table 18: Summary of Recommended Buildings for Connection to DES...............................7.15 Table 19: Summary of Site Visit Notes for Buildings Included in DES ...................................7.17
DISTRICT ENERGY SYSTEM PRE-FEASIBILITY STUDY CITY OF WHITEHORSE, YUKON
ah w:\1182\active\01 active projects\118200105 - city of whitehorse des\180-230-mechanical\05-reports\final_report\2010_03_08\rpt_001_20100308.doc 1.1
1.0 Introduction
1.1 OVERVIEW
Stantec is pleased to present this report to the City of Whitehorse (the City), as well as the
Energy Solutions Centre (ESC) and the Property Management Division (PMD), two branches of
the Government of Yukon (the Territory). The report summarizes the results of the District
Energy Pre-Feasibility Study for the City of Whitehorse, Yukon. The project and resulting report
were conducted according to the scope of work outlined in our proposal (dated July 30th, 2009),
which in turn references the Request for Proposals (dated June 24th 2009), and based
information collected during the one day site visit, which took place on September 29th, 2009.
The partnership (the City, ESC, and PSD) are referred to herein as “the Client”.
1.1.1 Purpose
The purpose of the Pre-Feasibility Study was to evaluate the economic and technical viability of
a District Energy System (DES), which would supply heat energy to municipal and territorial
(and possibly commercial) buildings in the City of Whitehorse, Yukon.
1.1.2 Objective
Drawing directly from the Terms of Reference document, the key objective is to determine
whether or not a DES would be technically and economically viable to implement in Whitehorse,
Yukon.
1.1.3 Context
This study was instigated and completed within the broader context of numerous city and
territory-wide sustainability initiatives including the following:
• 2002 Official Community Plan (OCP)
• Local Action Plan to Reduce Greenhouse Gas Emissions (2004)
• Integrated Community Sustainability Plan (2007) (ICSP)
• Climate Change Report for Whitehorse (PCIC 2008)
• Whitehorse Strategic Sustainability Plan (WSSP 2008)
• City of Whitehorse Sustainability Plan See-it™
• Energy Strategy for Yukon (2009)
• Yukon Climate Action Plan (2009)
A district energy system has the potential to contribute toward the first two and possibly three of
the four strategy focuses outlined in the Energy Strategy for Yukon (January 2009):
DISTRICT ENERGY SYSTEM PRE-FEASIBILITY STUDY CITY OF WHITEHORSE, YUKON Introduction
March 8, 2010
1.2 ah w:\1182\active\01 active projects\118200105 - city of whitehorse des\180-230-mechanical\05-reports\final_report\2010_03_08\rpt_001_20100308.doc
1. Conserving energy and using it more efficiently;
2. Increasing the supply and use of renewable energy;
3. Meeting our current and future electricity needs; and
4. Managing responsible oil and gas development.
This study responds specifically to one of the priority actions listed within the renewable energy
focus: “Conduct pilot studies to assess the feasibility of renewable energy initiatives [including]
new or expanded district heating systems.”
The Yukon Climate Action Plan (February 2009) identifies four key goals:
1. Goal 1: Enhance our knowledge and Understanding of Climate Change
2. Goal 2: Adapt to Climate Change
3. Goal 3: Reduce our Greenhouse Gas Emissions
4. Goal 4: Lead Yukon Action in Response to Climate Change
This study responds to Goal 3, since one of the key benefits of a DES is the economies of scale
created, which facilitate the implementation of alternative and renewable energy technologies
and strategies that can reduce GHG emissions.
Both the OCP and ICSP reference District Energy as an opportunity to reduce GHG emissions,
shelter the community from rising fuel prices, and improve environmental sustainability. Figure
1 shows a screen capture from the City of Whitehorse’s “see-it” web based model which
summarizes visually the Principles, Strategies, and Actions within the City of Whitehorse’s
ICSP.

DISTRICT ENERGY SYSTEM PRE-FEASIBILITY STUDY CITY OF WHITEHORSE, YUKON Introduction
March 8, 2010
ah w:\1182\active\01 active projects\118200105 - city of whitehorse des\180-230-mechanical\05-reports\final_report\2010_03_08\rpt_001_20100308.doc 1.3
Figure 1: Screen Capture from On-line Visualization of Strategic Goals1
1.1.4 Scope
The scope, as outlined in our proposal and in keeping with the Terms of Reference section of
the RFP, can be summarized by the following tasks:
• Task 1: Load Intensity Analysis
• Task 2: Energy Input Discussion
• Task 3: Preliminary System Concept
• Task 4: GHG Emissions and Air Quality
• Task 5: Financial Analysis / Projections
• Task 6: Recommended Course of Action
District energy systems can include heating, cooling, and/or electricity. For the purpose of this
study, heating energy is understood to be the primary focus. Opportunities to generate
electricity as well as heat (combined heat and power) are also explored; however, cooling is not
1 Source: http://whitehorse.visiblestrategies.com

DISTRICT ENERGY SYSTEM PRE-FEASIBILITY STUDY CITY OF WHITEHORSE, YUKON Introduction
March 8, 2010
1.4 ah w:\1182\active\01 active projects\118200105 - city of whitehorse des\180-230-mechanical\05-reports\final_report\2010_03_08\rpt_001_20100308.doc
explored, due to the small portion of cooling loads compared to heating and domestic hot water
loads.
1.2 ORGANIZATION OF THE REPORT
As stated in the Terms of Reference, the assessment will deliver results focused on the
following six key areas, which correspond with the above six tasks and are summarized in the
sections indicated in bold and square brackets:
• Potential system loads and their relative locations (load intensity) to be used in financial
analysis for economic viability [Section 2.0 - Task 1: Load Intensity Analysis]
• Initial energy input screening and energy/fuel-type recommendations [Section 3.0 -
Task 2: Energy Input Discussion]
• Preliminary system design concept (including energy centre locations and distribution
system layout options) [Section 4.0 - Task 3: Preliminary System Concept]
• Anticipated effect on GHG emissions and air quality implications (especially if fuel input
recommendations include fossil fuel, biomass, or bio-fuels) [Section 5.0 - Task 4: GHG
Emissions and Air Quality
• High level financial analysis/projection to compare “business as usual” to district energy
costs in order to determine “go or no-go” status of project [Section 6.0 - Task 5:
Financial Analysis / Projections]
• Recommendations for next steps [Section 7.0 - Conclusions, Recommendations, and
Next Steps]
Although the six tasks are described in a linear sequential fashion through the report, many of
the tasks are in fact inter-related. In reality, the process of developing the report is an iterative
process moving through successive levels of detail. For example, some high level decisions
need to be made with respect to the preferred input technology before the final choice with
respect to inclusion of various zones can be made. As such, references to the conclusions
made in a later task may be referenced in an earlier task.
In order to balance the desire for a concise and easy to read report with the need for sufficient
depth of information, supporting and detailed information is located in the Appendices.
1.3 DISTRICT ENERGY OVERVIEW
In order to provide a high level context for this study, some key background information,
advantages, determinants, and challenges associated with district energy are summarized.

DISTRICT ENERGY SYSTEM PRE-FEASIBILITY STUDY CITY OF WHITEHORSE, YUKON Introduction
March 8, 2010
ah w:\1182\active\01 active projects\118200105 - city of whitehorse des\180-230-mechanical\05-reports\final_report\2010_03_08\rpt_001_20100308.doc 1.5
1.3.1 Background
It is worth noting that district energy systems are not a new phenomenon. It is a concept that
dates back to the Roman times when this approach was used to heat baths and green houses.
The technologies can be very simple; the barriers and challenges are typically not of a technical
nature.
1.3.2 Benefits
There are a number of potential benefits of moving to a district based heating system; they stem
primarily from the economies of scale that are created, are summarized below:
Reduced costs - Centralization of heating offers possible cost savings through reduced
equipment requirements (due to load diversification), economies of scale in equipment costs,
savings in operating costs from more efficient equipment and optimized operations, lower
financing rates, and longer amortization periods for capital. These potential cost savings must,
however, be weighed against any additional costs associated with centralization such as the
cost of the distribution system and the additional costs of establishing operating and
administering a utility. In addition, cost savings associated with centralization may in part be
offset by investment in more environmentally-friendly forms of heat production.
Improved quality of service – A district heating system is designed to utility grade reliability
standards, which incorporate “n-1” redundancy. As centralized equipment is operated and
maintained by trained professionals, the reliability of district heating systems is generally better
than stand alone boilers.
Improved environmental performance - Economies of scale and other cost savings from
centralization of heat sources can increase efficiency and facilitate the use of alternative
technologies for the same or in some cases lower costs as more conventional on-site
technologies. Furthermore, with longer amortization periods and lower financing rates, a utility
can more easily use alternative technologies with higher capital costs and lower operating costs
while remaining competitive with conventional on-site technologies.
Reduced risk and increased flexibility - Financial and operating risks can be pooled across a
larger number of customers; implementation of more efficient and alternative technologies can
further reduce customer exposure to fluctuating fuel prices; hydronic heating systems are also
more adaptable to new technologies over time.
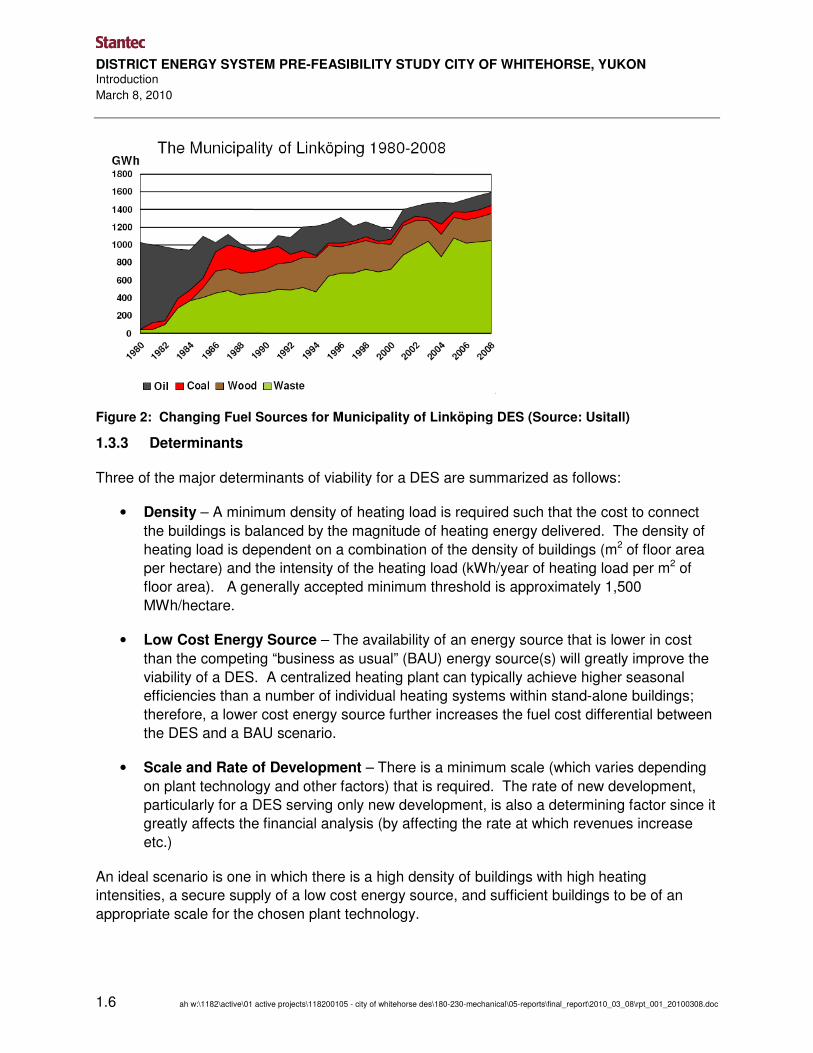
Figure 2 shows how the fuel source for the Municipality of Linköping, Sweden changed
dramatically from almost 100% oil to less than 20% fossil-fuel between 1980 and 2008.
DISTRICT ENERGY SYSTEM PRE-FEASIBILITY STUDY CITY OF WHITEHORSE, YUKON Introduction
March 8, 2010
1.6 ah w:\1182\active\01 active projects\118200105 - city of whitehorse des\180-230-mechanical\05-reports\final_report\2010_03_08\rpt_001_20100308.doc
Figure 2: Changing Fuel Sources for Municipality of Linköping DES (Source: Usitall)
1.3.3 Determinants
Three of the major determinants of viability for a DES are summarized as follows:
• Density – A minimum density of heating load is required such that the cost to connect
the buildings is balanced by the magnitude of heating energy delivered. The density of
heating load is dependent on a combination of the density of buildings (m2 of floor area
per hectare) and the intensity of the heating load (kWh/year of heating load per m2 of
floor area). A generally accepted minimum threshold is approximately 1,500
MWh/hectare.
• Low Cost Energy Source – The availability of an energy source that is lower in cost
than the competing “business as usual” (BAU) energy source(s) will greatly improve the
viability of a DES. A centralized heating plant can typically achieve higher seasonal
efficiencies than a number of individual heating systems within stand-alone buildings;
therefore, a lower cost energy source further increases the fuel cost differential between
the DES and a BAU scenario.
• Scale and Rate of Development – There is a minimum scale (which varies depending
on plant technology and other factors) that is required. The rate of new development,
particularly for a DES serving only new development, is also a determining factor since it
greatly affects the financial analysis (by affecting the rate at which revenues increase
etc.)
An ideal scenario is one in which there is a high density of buildings with high heating
intensities, a secure supply of a low cost energy source, and sufficient buildings to be of an
appropriate scale for the chosen plant technology.

DISTRICT ENERGY SYSTEM PRE-FEASIBILITY STUDY CITY OF WHITEHORSE, YUKON Introduction
March 8, 2010
ah w:\1182\active\01 active projects\118200105 - city of whitehorse des\180-230-mechanical\05-reports\final_report\2010_03_08\rpt_001_20100308.doc 1.7
Today there are approximately 6,000 systems in North America and they are concentrated in
downtown cores, on medical and educational campuses, as well as for government and military
installations; these are examples where the above determinants are typically met.
There are also district energy systems in operation in the Yukon. Some examples of utility
models for heat delivery include Watson Lake, Old Crow, and Burwash Landing (see Figure 3).
Figure 3: District Energy Systems in the Yukon and Northwest Territories2
The 6,000 systems in North America are supplying far less than 1% of total heating load. For
comparison internationally, Lithuania, Sweden, Poland, Denmark, and Finland all have over
40% of their heating supplied by district systems. This leads to the question of why there are
not more systems in place in North America.
1.3.4 Challenges
Some of the key challenges and barriers to implementing DES systems are summarized as
follows:
• Initiation – having the leadership, coordination, vision, and partnerships necessary to
initiate a DES project is a major challenge in many cases.
• Policy – Lack of policy framework to encourage and support
• Financial – Understanding short versus long-term benefits and the comparison between
DES and BAU costs
For this project, the partnership that issued the RFP for this study has demonstrated excellent
leadership, coordination, vision, and partnership toward initiating a DES. The references to
2 Ref: http://cdea.ca/resources/district-energy-across-canada/

DISTRICT ENERGY SYSTEM PRE-FEASIBILITY STUDY CITY OF WHITEHORSE, YUKON Introduction
March 8, 2010
1.8 ah w:\1182\active\01 active projects\118200105 - city of whitehorse des\180-230-mechanical\05-reports\final_report\2010_03_08\rpt_001_20100308.doc
GHG reduction and district energy specifically within the Yukon Energy Strategy, the Yukon
Climate Action Plan, the OCP and the ICSP provide some policy framework in support of a
DES. This study will provide a clear step toward understanding the financial implications.
These factors combined place the City of Whitehorse in a good position to overcome the
challenges.

DISTRICT ENERGY SYSTEM PRE-FEASIBILITY STUDY CITY OF WHITEHORSE, YUKON Task 1: Load Intensity Analysis
March 8, 2010
ah w:\1182\active\01 active projects\118200105 - city of whitehorse des\180-230-mechanical\05-reports\final_report\2010_03_08\rpt_001_20100308.doc 2.9
2.0 Task 1: Load Intensity Analysis
This section summarizes the sources, assumptions, methodology, and results of Task 1: Load
Intensity Analysis. More specifically, this section summarizes the sources of data used to
estimate the heating loads for buildings within the study area; how these estimates were
conducted; and how the loads were analyzed in order to determine the most feasible
combination of buildings that could be served by one or more district energy systems.
2.1 LOAD DATA ACQUISITION
Understanding current and projected loads is the starting point for assessing the financial
viability and technical feasibility of a district energy system. Hence, collection of energy
consumption data was an integral part of Task 1. Data for the purposes of load analysis has
been collected from a variety of sources as summarized in Table 2. Refer to Appendix A – Load
Intensity Data for more information and detailed data. Where available, utility data was obtained
to characterize space and water heat loads. Where utility data was not available, energy use
intensity estimates from referenced sources were combined with floor area data to estimate
loads. While appropriate for a concept design, detailed utility data for all proposed buildings
which connect to the system will be required for completion of a detailed feasibility study.
Table 2: Summary of Load Data Sources
Data Type Description Data Source
Historical utility data (2001-2007) for 57 Yukon Territory Government (YTG) buildings
YTG buildings database Utility data
Historical utility data for 26 additional buildings within ASHRAE
3 Climate zone 7
4.
Stantec internal database of utility data from previous projects called “Energy Map”.
Average energy intensity data by end use and by region within Canada (BC and the Territories are grouped). Data is from existing building stock in 1999.
Office of Energy Efficiency, Natural Resources Canada
5
Aggregate Statistical Data
EPA Target Finder, which references average energy intensity data by fuel and by specific locations within US.
2003 CBECS data6
3 ASHRAE is the American Society of Heating, Refrigerating and Air-Conditioning Engineers
4 ASHRAE Climate Zone 7 includes most of Yukon and Alaska, as well as northern parts of other Canadian provinces and territories. 5 Information is obtained from the Office of Energy Efficiency, Natural Resources Canada. The data pertain to 1999. They do not represent data from specific buildings, but rather are generated by dividing total energy consumption for each building activity and end-use by total floor space for that building activity. 6 Commercial Buildings Energy Consumption Survey (CBECS) is a national sample survey that collects information on the stock of U.S. commercial buildings, their energy-related building characteristics, and their energy consumption and expenditures. http://www.eia.doe.gov/emeu/cbecs/

DISTRICT ENERGY SYSTEM PRE-FEASIBILITY STUDY CITY OF WHITEHORSE, YUKON Task 1: Load Intensity Analysis
March 8, 2010
2.10 ah w:\1182\active\01 active projects\118200105 - city of whitehorse des\180-230-mechanical\05-reports\final_report\2010_03_08\rpt_001_20100308.doc
Data Type Description Data Source
Description of an additional 90 YTG buildings (including floor area, building type, and location).
YTG buildings database Building Descriptions
Description of City buildings (including floor area, building type, and summary of heating equipment).
Summary sheet provided by Client
Site Visit Observations made during the site visit and in discussion with operations staff.
Site visit and discussion with operations staff
How the various sources of information summarized in Table 2 are used is summarized in the
following sections.
2.1.1 Utility Data
The main source of information, and the most reliable source, is the historical (2001 to 2007)
utility data for 57 existing City-owned buildings that was provided by the Client. The average
energy consumption value, for the years available, was used in calculations.
An internal Stantec resource called the “Energy Map” summarizes utility data for completed
projects based on location, climate zone, building type, and level of LEED Certification7 (where
applicable). The LEED standard requires a minimum level of energy performance over and
above a minimum energy code; therefore, projects that are LEED Certified are likely to be more
energy efficient than standard construction. The 26 buildings within the Energy Map that are
within the same climate zone as Whitehorse (ASHRAE Climate Zone 7) are used to supplement
the 57 buildings. Half (13 of the 26 buildings) pursued LEED or CBIP8, therefore suggesting
that they are more energy efficient than standard construction.
2.1.2 Aggregate Statistical Data
Canadian and US average heating energy intensity (HEI) data based on aggregate building
stock data from 1999 and 2003 respectively by location was also used to supplement and
confirm the utility data. Canadian data used is for “BC and the Territories” and therefore is
expected to be an underestimate of heating for buildings in Whitehorse specifically (since most
of the buildings within this aggregate data are located in milder climates within BC).
US data for Fairbanks Alaska is used to represent Whitehorse since it has closest heating
degree day (HDD9) value to Whitehorse. The HDD18 value (i.e., relative to a base temperature
of 18°C) is 8,642 for Whitehorse and 7,744 for Fairbanks.
7 Leader in Energy and Environmental Design (LEED) is a green building rating system, which is used to measure performance of buildings under 5 main categories, one of which is “Energy and Atmosphere.” 8 The Commercial Building Incentive Program (CBIP), which has been replace by the ecoENERGY Validation Program, used to provide incentives for new construction projects that could demonstrate at least 25% energy savings over a Model National Energy Code for Buildings (MNECB-1997) baseline. 9 A location’s climate, as it pertains to heating energy consumption, can be summarized by the number of heating degree days, a qualitative measure of the time which the outside temperature is below the indoor

DISTRICT ENERGY SYSTEM PRE-FEASIBILITY STUDY CITY OF WHITEHORSE, YUKON Task 1: Load Intensity Analysis
March 8, 2010
ah w:\1182\active\01 active projects\118200105 - city of whitehorse des\180-230-mechanical\05-reports\final_report\2010_03_08\rpt_001_20100308.doc 2.11
2.1.3 Building Description Information
In addition to the 57 Yukon Territory Government (YTG) buildings for which there is actual utility
data, the YTG database included the name, address, building type, and floor area for another
90 buildings. From the floor area and building type, a rough estimate of heating energy
consumption was estimated (as described further in later sections).
The City also provided the name, address, building type, and floor area for over 50 City-owned
buildings. Most of these are very small buildings, such as pump houses, which are too small to
consider connecting to a DES and were therefore excluded from the study. However, for 12 of
the largest buildings from this list, the City provided a mechanical system description to facilitate
consideration of these buildings, which are more likely to be feasible for connection.
2.1.4 Site Visit
The above information sources were supplemented by the one day site visit, which took place
on September 29th, 2009. The site visit consisted of a meeting at the Energy Solutions Centre
and a tour of several buildings. During the meeting a variety of useful background and
contextual information as well as previous studies were downloaded to Stantec. Following that
a large number of the key buildings were toured with the assistance and guidance of several
individuals including City staff members and building operators.
The following are some of the key issues that were reviewed and types of information gathered
during the site visit at the broader project level as well as the individual building scale in order to
improve our understanding:
Project-wide considerations and issues • Regulatory context (safety authority, GHG legislation, energy codes, etc.) • Locally available fuels in region (such as biomass) • Utility rate structures (including secondary electricity sales) • Public perception (with respect to district energy and specific technologies) • Demand side management strategies (degree and rate at which being implemented) • Client’s financial performance targets • Client’s risk tolerance and perceived risks • Community context (sustainability goals, emission reduction targets, expected growth, etc.) • Site / topographic factors that could influence trenching costs for piping (such as bedrock or
permafrost) • Proximity of key buildings (those with potential for connection) to each other • Possible sources of waste heat • Location of sewage outfall • Possible sites for the district energy plant
temperature. Heating requirements for a given structure at a specific location are considered to be directly proportional to the number of HDD at that location. HDD are defined relative to a base temperature - the outside temperature above which a building needs no heating.

DISTRICT ENERGY SYSTEM PRE-FEASIBILITY STUDY CITY OF WHITEHORSE, YUKON Task 1: Load Intensity Analysis
March 8, 2010
2.12 ah w:\1182\active\01 active projects\118200105 - city of whitehorse des\180-230-mechanical\05-reports\final_report\2010_03_08\rpt_001_20100308.doc
Building specific considerations • Heating system description (both heat generation and heat distribution equipment) • Heating energy source(s) used for space and domestic water heating • Operating temperatures (supply and return water temperature) of the building heating loop • Observations for significant potential future demand side management strategies • Compatibility of heating systems in the buildings (hot water versus steam, supply and return
temperatures, flow regimes, etc.) • Service life of key pieces of equipment
A summary of information gathered and observations made during the site visit are summarized
in Appendix B – Site Visit Summary and key issues will be referenced through the report as the
decision-making methodology is explained.
2.2 LOAD INTENSITY ANALYSIS
This section describes how the data collected was used to determine the most feasible
combination of buildings, loads, and zones that can be served by one or more district energy
systems.
2.2.1 Summary of Known Heating Loads
Table 3 provides is a summary of the known heating loads for YTG buildings for which utility
data is available. Refer to Appendix A – Load Intensity Data for a summary of the estimated
energy consumption for each individual building.
Table 3: Summary of Utility Data
Total Floor Area
Total Heating Load10
Average Heating Energy Intensity
Estimated Annual Peak
Heating Demand
11
Total No. of Buildings
m2 (GJ/year) (MWh/year) (kWh/m
2/year) (MW)
57 175,270 172,500 47,910 273 16.4
It is noted that this study does not include consideration of demand side management (energy
conservation strategies) that might be implemented within existing building. The impact of
potential DSM strategies should be incorporated into future studies.
10 Based on total fuel consumption including space heating and domestic water (unless domestic water heating is provided by electricity) 11 The annual peak heating demand is estimated based on a factor of 0.40213 (taken from the RETScreen tool for Whitehorse), which is an average used to convert annual heating energy consumption to annual peak heating demand using the following formula:
Peak load factor = Peak load (kW) / Energy consumption (MWh/yr).
DISTRICT ENERGY SYSTEM PRE-FEASIBILITY STUDY CITY OF WHITEHORSE, YUKON Task 1: Load Intensity Analysis
March 8, 2010
ah w:\1182\active\01 active projects\118200105 - city of whitehorse des\180-230-mechanical\05-reports\final_report\2010_03_08\rpt_001_20100308.doc 2.13
2.2.2 Average Energy Intensity
The estimates in the absence of utility data are based on the floor area (m2) of the facility
multiplied by average heating energy intensity (HEI) values in kWh/m2/year for each building
type.
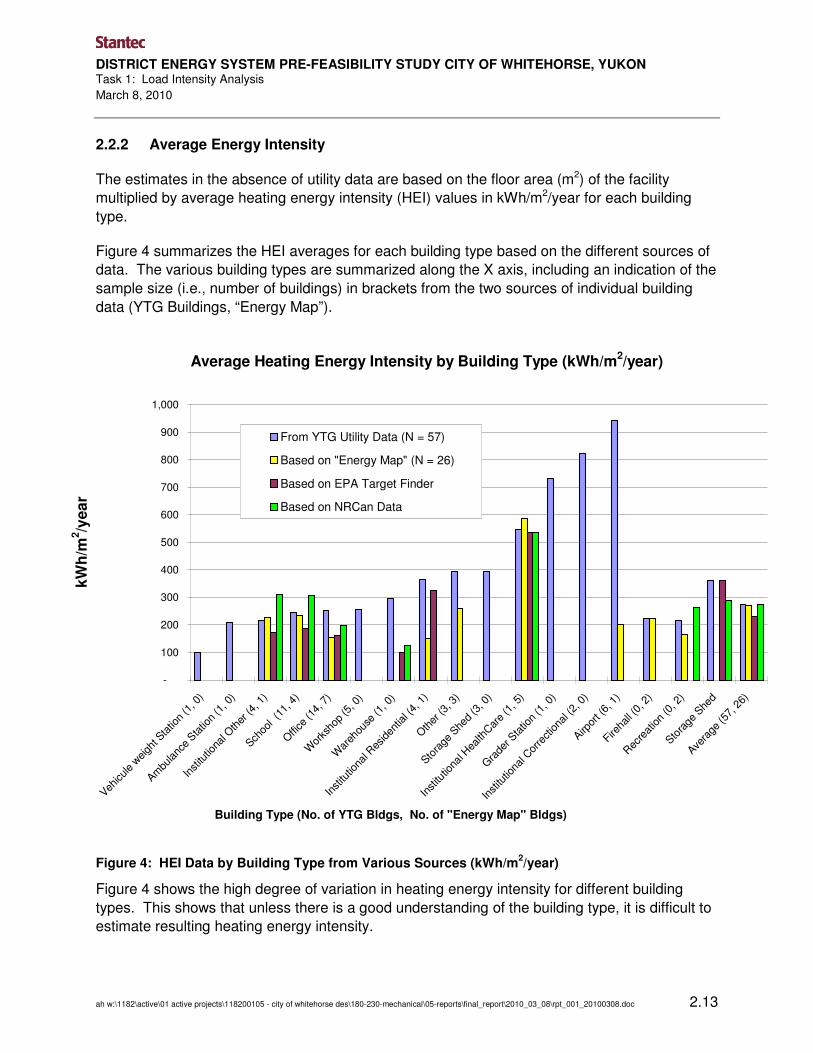
Figure 4 summarizes the HEI averages for each building type based on the different sources of
data. The various building types are summarized along the X axis, including an indication of the
sample size (i.e., number of buildings) in brackets from the two sources of individual building
data (YTG Buildings, “Energy Map”).
Average Heating Energy Intensity by Building Type (kWh/m2/year)
-
100
200
300
400
500
600
700
800
900
1,000
Vehicule
weigh
t Sta
tion
(1, 0
)
Ambu
lanc
e Sta
tion
(1, 0
)
Inst
itutio
nal O
ther
(4, 1
)
Schoo
l (1
1, 4
)
Office
(14,
7)
Wor
ksho
p (5
, 0)
War
ehou
se (1
, 0)
Inst
itutio
nal R
esiden
tial (
4, 1
)
Oth
er (3
, 3)
Stora
ge S
hed
(3, 0
)
Inst
itutio
nal H
ealth
Car
e (1
, 5)
Gra
der S
tatio
n (1
, 0)
Institu
tiona
l Cor
rectiona
l (2,
0)
Airpor
t (6,
1)
Fireha
ll (0
, 2)
Rec
reat
ion
(0, 2
)
Stora
ge S
hed
Avera
ge (5
7, 2
6)
Building Type (No. of YTG Bldgs, No. of "Energy Map" Bldgs)
kW
h/m
2/y
ear
From YTG Utility Data (N = 57)
Based on "Energy Map" (N = 26)
Based on EPA Target Finder
Based on NRCan Data
Figure 4: HEI Data by Building Type from Various Sources (kWh/m2/year)
Figure 4 shows the high degree of variation in heating energy intensity for different building
types. This shows that unless there is a good understanding of the building type, it is difficult to
estimate resulting heating energy intensity.

DISTRICT ENERGY SYSTEM PRE-FEASIBILITY STUDY CITY OF WHITEHORSE, YUKON Task 1: Load Intensity Analysis
March 8, 2010
2.14 ah w:\1182\active\01 active projects\118200105 - city of whitehorse des\180-230-mechanical\05-reports\final_report\2010_03_08\rpt_001_20100308.doc
Figure 4 also shows a degree of consistency between the various different sources of
information, which is clear when looking at building types including school, office, and health
care for which there is data from all 4 sources. There is also a high degree of consistency
between the average intensity determined from the various sources, providing a level of
confidence in using an average value for high-level approximations, such as a pre-feasibility
stage study.
The resulting average HEI values that were used to predict heating energy consumption for
each building type are summarized in Table 4, and range from 217 kWh/m2/year to 944
kWh/m2/year. An average value for the purposes of prediction is calculated only for the building
types for which there are at least three buildings in the sample data, or for which there is
statistical data; all other building types will reference the overall average (273 kWh/m2/year),
which is based on the total known heating energy divided by total known floor area.
Table 4: Average HEI Values used to Predict Heating Load (kWh/m2/year)
Space Type Heating Energy Intensity (HEI) kWh/m
2/yr
Institutional Other 217
School 244
Office 254
Airport 944
Warehouse 295
Hotel 362
Institutional Residential 363
Institutional HealthCare 545
Workshop 256
Other (based on average) 273
The same HEI values are used to predict heating energy consumption throughout the 25-year
period considered within the financial analysis. It is recognized that over time some of the
existing buildings may undergo energy efficiency upgrades that result in reduced heating energy
consumption. No attempts are made within this study to account for potential energy efficiency
upgrades; however, it is recommended that future studies consider this level of detail.
2.2.3 Predicted Heating Loads and Intensity (YTG and City Bldgs)
Using the values in Table 4 and the floor areas, Table 5 summarizes the total predicted heating
load and intensity for all of the buildings for which the floor area was provided by the Client.

DISTRICT ENERGY SYSTEM PRE-FEASIBILITY STUDY CITY OF WHITEHORSE, YUKON Task 1: Load Intensity Analysis
March 8, 2010
ah w:\1182\active\01 active projects\118200105 - city of whitehorse des\180-230-mechanical\05-reports\final_report\2010_03_08\rpt_001_20100308.doc 2.15
Table 5: Summary of Estimated Heating Load for YTG and City Buildings
Total Floor Area
Total Heating Load12
Average Heating Energy Intensity
Estimated Annual Peak
Heating Demand
13
Total No. of Buildings
m2 (GJ/year) (MWh/year) (kWh/m
2/year) (MW)
166 244,000 232,200 65,000 264 26.1
Table 5 shows that the total estimated peak heating demand for the YTG and City buildings
included is approximately 26 MW. Refer to Appendix A – Load Intensity Data for a summary of
the estimated energy consumption for each individual building. The YTG and City buildings are
shown visually in Figure 18: Identifying Buildings and Zones within Study Area, located in
Appendix A – Load Intensity Data.
Figure 18 is developed using an interactive excel-based tool that was developed for the purpose
of this study. The figure shows a map of the study area overlaid on top of a grid of cells. Each
cell is equivalent to 22 m2 or 0.002 hectares. The approximate location of each building is
denoted by placing the Building ID number in the cell that most closely corresponds to the
building’s location on the overlain map. Each cell that represents a building is also colour-coded
to signify the energy intensity of that individual building. Three colours are used: red for those
that consume more than 900 MWh/year (3,240 GJ/year), orange for those that consume
between 550 and 900 MWh/year (between 1,908 and 3,240 GJ/year), and blue for those that
consume less than 550 MWh/year (1,908 GJ/year).
2.2.4 Predicted Heating Loads and Intensity (Other Bldgs)
It is recognized that there are many non-YTG/City buildings (commercial, industrial, and
residential) within City of Whitehorse that could also be considered for connection to a DES. It
is recommended that these opportunities be explored further in subsequent studies.
In order to provide a sense of the heating energy intensity including all buildings within the core
study areas of City of Whitehorse, Figure 19 was developed. Figure 19 is located in Appendix A
– Load Intensity Data, and provides an Energy Intensity Map for all buildings within the study
area. Figure 19 represents an order of magnitude estimate of energy intensity across most of
the developed areas of the city. The intensities are based on estimated density factors (i.e.,
building density in square meters of conditioned building floor area per hectare, m2/ha) and the
average HEI value estimated for Whitehorse (273 kWh/m2/year), based on the utility data
provided (and correlated by statistical data).
12 Based on total fuel consumption including space heating and domestic water (unless domestic water heating is provided by electricity) 13 The annual peak heating demand is estimated based on a factor of 0.40213 (taken from the RETScreen tool for Whitehorse), which is an average used to convert annual heating energy consumption to annual peak heating demand using the following formula:
Peak load factor = Peak load (kW) / Energy consumption (MWh/yr).

DISTRICT ENERGY SYSTEM PRE-FEASIBILITY STUDY CITY OF WHITEHORSE, YUKON Task 1: Load Intensity Analysis
March 8, 2010
2.16 ah w:\1182\active\01 active projects\118200105 - city of whitehorse des\180-230-mechanical\05-reports\final_report\2010_03_08\rpt_001_20100308.doc
The intensity (annual MWh of heating energy per hectare, MWh/ha) is indicated using three
colours: red for areas that are very likely to be viable (>1,500 MWh/ha), orange for areas that
appear to be marginally viable (1,000 to 1,500 MWh/ha), and yellow for areas that do not
appear to be viable at this time (< 1,000 MWh/ha).
2.2.5 Predicted Heating Loads and Intensity (Future Bldgs)
It is recognized that new buildings that are constructed are likely to be more energy efficient
than the existing buildings, especially if energy code requirements become more stringent. For
the purpose of this study no attempt is made to quantify the reduction in heating intensity of
future buildings since there is little basis upon which to make such predictions and since the
margin of uncertainty with respect to the type of new buildings that might be constructed is
already high. Future studies should take into account increases in energy efficiency of new
construction.
2.2.6 Summary of Heating Intensity by Zone
Most district energy systems start out providing service within a single zone, then expand to
other zones as additional customers sign on. The initial zone will likely be the hospital or a
comparable “anchor” tenant. To permit analysis of different zones and the impact of phasing,
an interactive spreadsheet based tool was developed in order to quickly estimate the energy
intensity within a given area or zone of the city. The tool allows the user to define an area on a
map of City of Whitehorse (study area only) by shading cells and then to calculate the energy
intensity (annual MWh per hectare) for this area. This allowed zones of the city to be identified
for further study based on achieving the minimum rule of thumb energy intensity required to
make a DES financially viable (1,500 MWh/ha).
For this analysis, only YTG and City owned buildings were included. As shown in Figure 18
located in Appendix C – Heating Energy Intensity Map, six key regions, or zones, of the city
were identified and analyzed. Table 6 provides a high level summary of the heating energy
intensity for each region based on including all of the government buildings from Table 5 that
are within the six key zones; the buildings that are not within any of the key zones are excluded.
Refer to Appendix A – Load Intensity Data for a detailed summary listing heating load and
intensity on an individual building basis within the six key zones.

DISTRICT ENERGY SYSTEM PRE-FEASIBILITY STUDY CITY OF WHITEHORSE, YUKON Task 1: Load Intensity Analysis
March 8, 2010
ah w:\1182\active\01 active projects\118200105 - city of whitehorse des\180-230-mechanical\05-reports\final_report\2010_03_08\rpt_001_20100308.doc 2.17
Table 6: Summary of Heating Energy Intensity by Zone (All YTG and City Buildings)
Total Building
Floor Area
Total Zone Area
Total Energy Consumption
Total Heating Energy
Intensity
Total Peak Load
Zone m2 Ha MWh/year MWh/ha/year MW
Zone 1: Lewes Blvd 30,493 2.4 9,915 4,128 4
Zone 2: Hospital Road 25,514 1.1 10,592 9,570 4
Zone 3: Downtown 66,695 5.0 15,858 3,199 6
Zone 4: Range Road 58,112 3.6 12,307 3,416 5
Zone 5: Quartz Road 17,399 2.1 4,999 2,372 2
Zone 6: Airport 21,733 2.5 5,506 2,196 2
Total 219,945 16.7 59,176 3,547 24
Any zone with a total annual heating energy intensity of 1,500 MWh/ha or greater is considered
potentially viable. As such, based on this high-level screening, all zones are considered viable
(the lowest intensity being the airport with 2,196 MWh/ha/year) based on inclusion of all YTG
and City buildings studied.
2.2.7 Preliminary Screening
Some preliminary screening was conducted for the buildings within each zone to remove those
buildings that are incompatible based on heat delivery temperatures (supply and return
temperature) and/or mechanical heating deliver equipment within the building (i.e.; air based
heating systems), as well as those that are deemed to have too low an annual heating
consumption to make the cost of the energy transfer station viable.
Table 7 provides a summary of the heating energy intensity for each zone after screening out
buildings that were deemed incompatible or for which the annual heating energy consumption is
less than 330 MWh/year14 (or $32,000/year). More detailed analysis could reveal opportunities
to use one energy transfer station for multiple buildings, thus making the connection of some of
the buildings with a smaller heating load more financially viable.
14
This cut-off value is estimated based on a maximum acceptable simple payback of 10 years and an assumed 15% savings on heating energy costs associated with connecting to the DES.

DISTRICT ENERGY SYSTEM PRE-FEASIBILITY STUDY CITY OF WHITEHORSE, YUKON Task 1: Load Intensity Analysis
March 8, 2010
2.18 ah w:\1182\active\01 active projects\118200105 - city of whitehorse des\180-230-mechanical\05-reports\final_report\2010_03_08\rpt_001_20100308.doc
Table 7: Summary of Heating Energy Intensity by Zone (After Screening Level 1)
Total Building
Floor Area
Total Zone Area
Total Energy Consumption
Total Energy Intensity
Total Peak Load
Zone m2 Ha MWh/year MWh/ha/year MW
Zone 1: Lewes Blvd 30,493 2.4 9,152 3,810 4
Zone 2: Hospital Road 25,514 1.1 9,663 8,731 4
Zone 3: Downtown 66,695 5.0 9,417 1,900 4
Zone 4: Range Road 58,112 3.6 4,844 1,344 2
Zone 5: Quartz Road 17,399 2.1 1,754 832 1
Zone 6: Airport 21,733 2.5 934 373 0.4
Total 219,945 16.7 35,764 2,144 14.4
2.3 MOST FEASIBLE ZONES AND BUILDINGS
Based on the analysis described previously, the following is a commentary on the most feasible
zones and buildings.
2.3.1 Zones
When determining the viability of connecting certain zones, it is necessary to also consider
decisions surrounding the technology used to generate heat. For example, the economies of
scale required to implement a waste to energy heating plant are greater than the scale required
for a biomass combustion based plant. In Section 3.0 - Task 2: Energy Input Discussion, it is
concluded that the preferred input technology is a combustion system fueled by biomass in the
form of wood pucks. Based on this conclusion there is a threshold capacity below which a
stand-alone biomass combustion system is not considered viable (technically and/or financially).
This is related to the minimum viable plant capacity, cost of duplicating emission control
equipment, and potential increases in operating cost associated with having more than one
plant. This threshold is considered to be approximately 2 MW, as a preliminary estimate.
Based on the results summarized in Table 7 and the conclusions from Section 3.0 noted above,
zones 4, 5, and 6 are deemed to have too small a plant capacity and/or too low a heating
energy intensity to make them viable as stand-alone systems without connecting to additional
non-government buildings in their respective zones. For the purpose of this study, and in order
to demonstrate viability using conservative assumptions, the additional complications
associated with connecting buildings with diverse owners resulted in the conclusion to consider
only Zones 1, 2 and 3. This does not mean that a DES is not viable in the other zones, but it
would likely require connecting additional non-YTG/City buildings, and/or a different heat input
technology.

DISTRICT ENERGY SYSTEM PRE-FEASIBILITY STUDY CITY OF WHITEHORSE, YUKON Task 1: Load Intensity Analysis
March 8, 2010
ah w:\1182\active\01 active projects\118200105 - city of whitehorse des\180-230-mechanical\05-reports\final_report\2010_03_08\rpt_001_20100308.doc 2.19
2.3.2 Buildings
The most viable buildings are those that are within the most viable zones, with large enough
heating consumption to warrant the cost of an energy transfer station, and with compatible
heating systems (i.e.; those that were not removed during the preliminary screening). These 20
most viable buildings are summarized in Table 19 of Appendix A – Load Intensity Data, and are
represented in Figure 18 by cells with a black border.
2.3.3 Future Expansion
A rough estimate of the potential growth in building floor area within each zone was developed
based on the assumption that building floor area grows at the same rate as population (estimate
at 6% over a 5 year period)15, and that 50% of new growth within each zone connects to the
DES. The growth rate was applied to an estimate of the total building floor area within each
zone, based on an estimated average density factor of 1.5,16 resulting in an average estimated
growth of 765 m2 each year.
The assumption that 50% of new buildings connect to the DES is a very rough estimate. It is
noted that from the sensitivity analysis (summarized Section 6.4), the impact of not connecting
any new growth in buildings does not have a negative impact on the overall financial viability.
Further study in later stages of implementation would be required to optimize which new
buildings should be connected to the DES.
These estimates are coarse and should be refined in subsequent studies. The downtown zone
likely has greater potential for growth; it is noted that several of the recommended buildings fall
within the areas identified in the City of Whitehorse Downtown Plan17 as “Core Areas Under-
Utilized”.
15 Source: http://www.eco.gov.yk.ca/pdf/families06.pdf 16 In other words, 1.5 m2 floor area per m2 of land, which is equivalent to 15,000 m2/ha 17 As shown in Figure 4.2 (http://ww3.whitehorse.ca/planning/downtown%20plan/finalplan.pdf)

DISTRICT ENERGY SYSTEM PRE-FEASIBILITY STUDY CITY OF WHITEHORSE, YUKON Task 2: Energy Input Discussion
March 8, 2010
3.20 ah w:\1182\active\01 active projects\118200105 - city of whitehorse des\180-230-mechanical\05-reports\final_report\2010_03_08\rpt_001_20100308.doc
3.0 Task 2: Energy Input Discussion
The following section discusses the energy input / energy source options (including fuel oil,
electricity, biomass, etc.) and heat generation technology options (including combustion,
combined heat and power, heat pump, etc.) for the district energy system.
The discussion is based on the heating energy required for the Downtown, Hospital Road and
Lewes Boulevard areas of Whitehorse since these are the most viable zones. Should additional
viable buildings be identified within other zones, such that they exceed the minimum required
energy intensity and scale for a viable DES, the results of this analysis are expected to be
applicable to other zones.
3.1 ENERGY INPUT CHARACTERISTICS, PRICING, AND AVAILABILITY
This section provides a summary of the characteristics, pricing, and availability of the energy
inputs/sources that were considered for the City of Whitehorse district energy system.
3.1.1 Wood Waste
A limited supply of wood waste is available in the Yukon Territory for use in the Whitehorse
DES. Wood waste includes sources such as sawdust and hog fuel produced during the
processing of lumber. The wood processing industry in the Yukon provides a very small portion
of the lumber to meet the domestic demand in the Yukon which is primarily met by lumber
imported to the Territory. There is no lumber export market due to the long distance required for
the transport of the product to the export markets. The lack of a lumber export industry results
in a very small supply of waste wood. This supply of waste wood is not found in the vicinity of
the City of Whitehorse.
The fuel considered as wood waste for the study is actually wood harvested specifically for use
as fuel. The cost used for this fuel is based on the estimated cost to harvest the wood. The
cost includes the cost of labour, fuel for harvesting equipment, and transportation.
3.1.2 Wood Pellets
Wood pellets are produced through a process of grinding, drying and extruding wood fiber into
small cylindrical pellets approximately 5 mm in diameter and 10 mm long. These pellets are a
dry, easily handled biomass fuel with a high heating value. The advantage of pellets as a
biomass fuel is the ease of handling due to the constant sizing and the lower cost of
transportation due to the higher heating content per unit volume due to the lower moisture
content.
It is understood that the construction of a wood pellet plant is under consideration for the
Whitehorse area. The advantage of such a facility would be the capability to provide fuel for the

DISTRICT ENERGY SYSTEM PRE-FEASIBILITY STUDY CITY OF WHITEHORSE, YUKON Task 2: Energy Input Discussion
March 8, 2010
ah w:\1182\active\01 active projects\118200105 - city of whitehorse des\180-230-mechanical\05-reports\final_report\2010_03_08\rpt_001_20100308.doc 3.21
DES from a local source which would be insulated from the global market conditions. This
should help to maintain a relatively stable fuel cost for the DES.
The technology for the production of wood pellets is well proven in British Columbia with
approximately one million tonnes of pellets being exported annual for use in power generation
and related combustion processes in Europe. The establishment of a wood pellet processing
facility in the Yukon would not require the use of new technology or new processes.
3.1.3 Wood Pucks
Wood pucks are produced through a process of grinding and drying of the wood fiber and then
pressing into a cylindrical shape which is about 75 to 100 mm in diameter. Segments of the
cylinder approximately 25 mm thick are referred to as pucks. The pucks are a dry, high heating
value biomass fuel that is easily transported and handled.
It was found through an internet search and subsequent telephone conversation that there is an
enterprise in Whitehorse with the potential capacity to supply the City of Whitehorse with
sufficient wood pucks for fuel for the DES. This company (Yukon North Biomass Company) is
currently in the start-up phase with a small production capability for the retail market. It was
confirmed with the company representative that the production can be ramped up as the
demand for the product grows. It is estimated that the DES would require an annual fuel flow of
10,000 tonnes. The supply of this quantity was confirmed as possible by the representative of
Yukon North Biomass Company.
The process for the production of wood pucks is similar to the production of wood pellets with
the exception that the form of the final product is such that the individual pieces are larger that
the pellets. This fuel is acceptable for combustion in grate type of furnaces such as those
envisioned for the Whitehorse DES.
It is recommended as the project moves forward that additional discussions take place with the
fuel suppliers to confirm the capacity, future expandability and fuel cost.
3.1.4 Heating Oil
The heating oil considered is the same fuel that is currently widely used in Whitehorse for
building heating. Heating oil for the DES would be purchased at bulk or wholesale prices. The
pricing is based on the average of the bi-weekly cost for the previous four years. This approach
has the effect of minimizing the volatility that has occurred over the recent years.
3.1.5 Propane
The propane case was used as a comparison to the other studied heating sources. It is
currently used for a small portion of the heating in Whitehorse. The currently published cost of
propane was used for this study.

DISTRICT ENERGY SYSTEM PRE-FEASIBILITY STUDY CITY OF WHITEHORSE, YUKON Task 2: Energy Input Discussion
March 8, 2010
3.22 ah w:\1182\active\01 active projects\118200105 - city of whitehorse des\180-230-mechanical\05-reports\final_report\2010_03_08\rpt_001_20100308.doc
3.1.6 Electric – Firm
Electric input to the system by firm electrical energy is shown to illustrate the relative cost of the
uninterruptible electrical power source for the DES.
3.1.7 Electric – Secondary
The secondary electrical supply to the DES is considered as an interruptible electrical source.
This supply should be considered as a heat source that must be backed up by an alternative
heat input source. The pricing for the secondary electrical supply is approximately 70% of the
firm electrical pricing. It should be noted that the secondary electrical supply is expected to be
available during periods of maximum hydro generation and lowest electrical consumption. This
is generally in the summer months. The secondary electrical supply may be cut off with as little
as two hours notice. The secondary electrical supply is not recommended as a long term energy
supply to the DES due to the possible interruptions.
3.1.8 Municipal Solid Waste
Municipal Solid Waste (MSW) is a potential energy source. The cost of using MSW should
include the operating cost (or potentially revenue) associated with collection of the fuel as well
as fuel sorting to ensure the recyclable materials are removed from the fuel stream. Using
MSW as a fuel for district heating has been demonstrated successfully, particularly in Europe18.
The scale of operation that is required to make these systems viable is assumed to be too large
for consideration as fuel source for the initial phases of a DES. The use of MSW as a fuel is not
explored further within this study; however, it is recommended that this be explored further as a
potential future energy source option.
3.1.8.1 Solar Energy
Direct capture of solar energy is a potential energy source, using a technology such as solar hot
water collectors. The solar energy itself is free, but there is a capital cost associated with the
equipment required to capture this energy in a usable form. This is considered a potential
supplemental energy source option and is not explored further within this study.
3.1.8.2 Waste Heat Sources
Sewage heat recovery was discussed as an option (using heat pumps); however, it was
discounted for the following reasons:
• 1) heat should not be extracted from the sewage prior to it reaching the wastewater treatment plant (WWTP) since this is understood to negatively affect the sewage treatment process (i.e.; heat might need to be re-added at the WWTP), and
18 The Municipality of Linköping, Sweden is a good example. Household waste from Linköping and approximately 30 other municipalities as well as waste from industries is transported to the Gärstadverket WTE plant where 400,000 tons of waste are incinerated every year, producing heating and electricity and displacing over 100,000 tons of oil.

DISTRICT ENERGY SYSTEM PRE-FEASIBILITY STUDY CITY OF WHITEHORSE, YUKON Task 2: Energy Input Discussion
March 8, 2010
ah w:\1182\active\01 active projects\118200105 - city of whitehorse des\180-230-mechanical\05-reports\final_report\2010_03_08\rpt_001_20100308.doc 3.23
• 2) Heat could be extracted at the sewage outfall, but the distance to the sewage outfall (near Porter Creek) makes this infeasible.
No other specific waste heat sources (such as industrial processes resulting in waste heat) were
identified within the study area. Waste heat sources are not likely to serve as the primary
source of heating and therefore are not explored as an individual scenario. Waste heat sources
should be examined on a case by case basis and are often best captured within the specific
building (to directly reduce heating requirements within that building) or used by a new adjacent
building that can design a system specifically to take advantage of the waste heat19. Waste
heat sources are considered a potential supplemental energy source option and are not
explored further within this study.
3.1.8.3 Geo-Thermal Heat
It is understood that there are significant geo-thermal heat sources within the Whitehorse
region; however, no such source is known to be within sufficiently close proximity to the study
area to warrant further analysis at this stage. This energy source option is not explored further
within this study.
3.1.9 Summary
The pricing and key characteristics of the energy source options that are considered further
within this study are summarized in Table 8.
Table 8: Costs and Characteristics of Fuels Considered
Fuel Cost, $/GJ Characteristics
Wood waste 19.13 50% moisture 10.5 GJ/ tonnes $200 / tonnes
Wood pellets 16.44 7% moisture 16.7 GJ/ tonnes $275 / tonnes
Wood pucks 14.26 7% moisture 18.6 GJ/ tonnes $265 / tonnes
Heating oil 22.90 $0.894/l 38.2 MJ/l
Propane 31.61 $0.817/l
25.3 MJ/l
19 An excellent example of this is the Centre for Interactive Research on Sustainability (CIRS), which is a new building being designed on the University of British Columbia campus in Vancouver, BC. This building will utilize heat pumps to capture sufficient waste heat from an adjacent laboratory exhaust system to provide the majority of heating for the new building and return some of the waste heat back to the adjacent building to reduce their heating requirements.

DISTRICT ENERGY SYSTEM PRE-FEASIBILITY STUDY CITY OF WHITEHORSE, YUKON Task 2: Energy Input Discussion
March 8, 2010
3.24 ah w:\1182\active\01 active projects\118200105 - city of whitehorse des\180-230-mechanical\05-reports\final_report\2010_03_08\rpt_001_20100308.doc
Fuel Cost, $/GJ Characteristics
Electric – Firm 29.06 Non-interruptible
Electric – Secondary 20.30 Interruptible
3.2 HEAT GENERATION TECHNOLOGIES CONSIDERED
The heat generation technologies considered include the following:
• Combustion (Heating Only) • Organic Rankin Cycle (ORC) (Combined Heat and Power) • Steam Turbine (Combined Heat and Power) • Waste to Energy (WTE) • Solar Thermal Collectors • Ground Source Heat Pump (GSHP)
The first three technology options listed above are described in the following sections in
combination with energy input options that they can be combined with. The last three options
are discussed but not included in any of the scenarios considered; the reasons are described in
their respective sections.
3.3 ENERGY INPUT AND TECHNOLOGY SCENARIOS CONSIDERED
This section provides a description of the general characteristics of the 17 cases considered for
the DES. It should be noted that each case represents a combination of an energy input source
(as described in Section 3.1) and a heat generation technology (as described in Section 3.2).
The cases are listed and ranked in Section 3.4. The cases considered for the DES include
heating only of the circulated water and combined heating of the circulated water and electrical
power production (CHP). The CHP cases considered two technologies. These are the Organic
Rankin Cycle (ORC) and the Steam Turbine Generator (STG) technologies.
3.3.1 Combustion Only (Cases 1-5):
These cases are based on the combustion of the fuel in a hot water heater. The combustion
takes place in the furnace which chemically releases the energy contained in the fuel in the form
of heat. The heat in the flue gas is then transferred via the heat exchange surface to water
which is then circulated to the buildings which are connected to the DES.
The biomass cases (1, 2 & 3) are very similar to each other with the major differences in the
systems being the sizing and design of the fuel handling equipment and the sizing of the
furnace to accommodate the expected higher moisture content of the waste wood fuel. The
furnace for the wood waste fuel (case 1) may have a radiant arch that is used to direct the flow
of the flue gas through the furnace allowing sufficient residence time for complete combustion
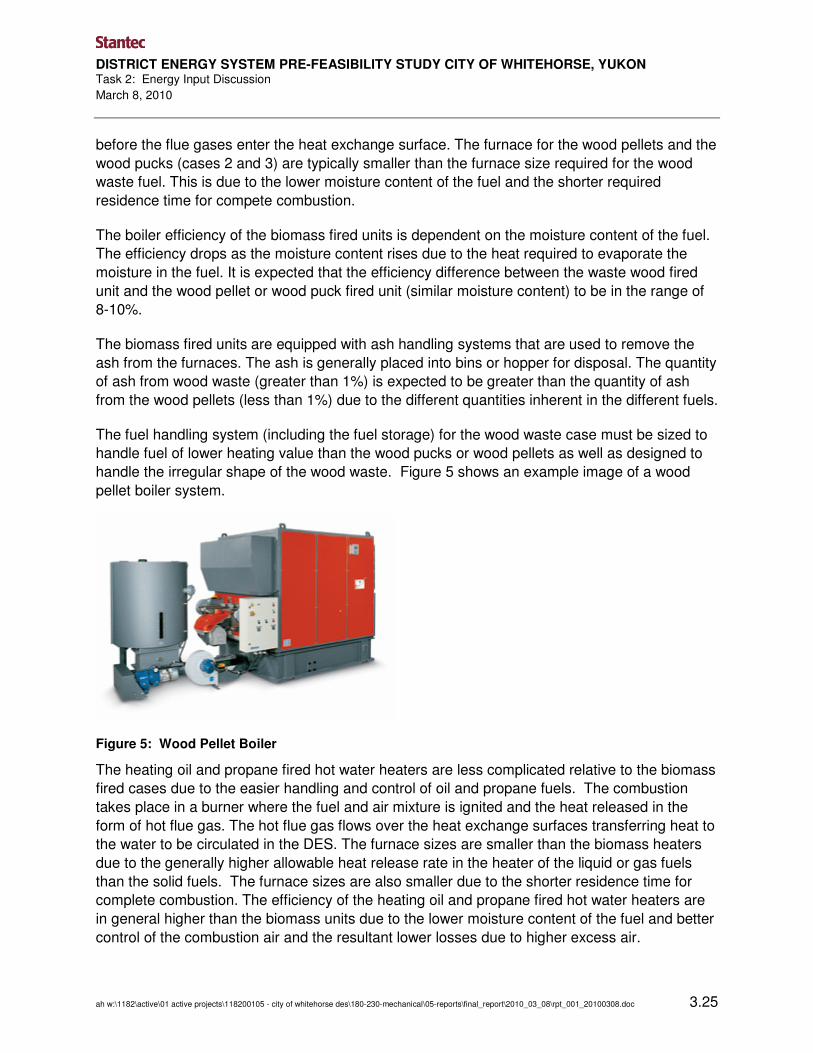
DISTRICT ENERGY SYSTEM PRE-FEASIBILITY STUDY CITY OF WHITEHORSE, YUKON Task 2: Energy Input Discussion
March 8, 2010
ah w:\1182\active\01 active projects\118200105 - city of whitehorse des\180-230-mechanical\05-reports\final_report\2010_03_08\rpt_001_20100308.doc 3.25
before the flue gases enter the heat exchange surface. The furnace for the wood pellets and the
wood pucks (cases 2 and 3) are typically smaller than the furnace size required for the wood
waste fuel. This is due to the lower moisture content of the fuel and the shorter required
residence time for compete combustion.
The boiler efficiency of the biomass fired units is dependent on the moisture content of the fuel.
The efficiency drops as the moisture content rises due to the heat required to evaporate the
moisture in the fuel. It is expected that the efficiency difference between the waste wood fired
unit and the wood pellet or wood puck fired unit (similar moisture content) to be in the range of
8-10%.
The biomass fired units are equipped with ash handling systems that are used to remove the
ash from the furnaces. The ash is generally placed into bins or hopper for disposal. The quantity
of ash from wood waste (greater than 1%) is expected to be greater than the quantity of ash
from the wood pellets (less than 1%) due to the different quantities inherent in the different fuels.
The fuel handling system (including the fuel storage) for the wood waste case must be sized to
handle fuel of lower heating value than the wood pucks or wood pellets as well as designed to
handle the irregular shape of the wood waste. Figure 5 shows an example image of a wood
pellet boiler system.
Figure 5: Wood Pellet Boiler
The heating oil and propane fired hot water heaters are less complicated relative to the biomass
fired cases due to the easier handling and control of oil and propane fuels. The combustion
takes place in a burner where the fuel and air mixture is ignited and the heat released in the
form of hot flue gas. The hot flue gas flows over the heat exchange surfaces transferring heat to
the water to be circulated in the DES. The furnace sizes are smaller than the biomass heaters
due to the generally higher allowable heat release rate in the heater of the liquid or gas fuels
than the solid fuels. The furnace sizes are also smaller due to the shorter residence time for
complete combustion. The efficiency of the heating oil and propane fired hot water heaters are
in general higher than the biomass units due to the lower moisture content of the fuel and better
control of the combustion air and the resultant lower losses due to higher excess air.

DISTRICT ENERGY SYSTEM PRE-FEASIBILITY STUDY CITY OF WHITEHORSE, YUKON Task 2: Energy Input Discussion
March 8, 2010
3.26 ah w:\1182\active\01 active projects\118200105 - city of whitehorse des\180-230-mechanical\05-reports\final_report\2010_03_08\rpt_001_20100308.doc
3.3.2 Combined Heat and Power (CHP) – Organic Rankin Cycle (ORC) Technology
(Cases 6-10):
In the ORC cases the heat produced by the combustion of the various fuels is used to heat
thermal oil which is circulated to a heat exchanger which in turn heats an organic expandable
fluid to a temperature above the saturation temperature which results in a pressurized vapour
form of the organic fluid. The vapour expands through a turbine where the energy in the fluid is
converted to mechanical energy. The turbine is coupled to the generator where the mechanical
energy is converted to electrical power. The fluid (in vapour form) exits the turbine and is
condensed to liquid before being pumped back to the heat exchanger to repeat the cycle. The
heat removed from the fluid in the condenser in used as heat input to the DES. This is
accomplished by the flow of the circulated water through the condenser to cool and condense
the organic vapour.
The combustion system for the ORC cases vary based on the fuel that is used but in general
they are similar to those as described in the combustion only cases. The main difference in the
combustion system of the ORC system compared to the heat only cases is that the heat in the
hot flue gases exiting the furnace is transferred to the thermal oil which is then used as a heat
source in the heat exchanger evaporate the organic expandable fluid in the heat exchanger.
The advantage of the ORC cases is the closed system for the thermal oil which is used for the
transfer of heat from the combustor to the evaporator and the closed system for the organic fluid
for the transfer of the energy from the evaporator to the turbine and condenser. The use of the
closed systems eliminates the requirement for make-up water which in turn will minimize
operating cost while retaining the system capability of producing electricity and heat. Also the
thermal oil / ORC system operates at a lower pressure and temperature which contributes to the
lower operating costs as fewer operating engineers are required with lower level certification.
It should be noted that the ORC systems of the size required for this project are delivered as
skid mounted equipment to ease installation. There are ORC systems of this type installed and
in operation in Europe. Figure 6 shows an example ORC unit.

DISTRICT ENERGY SYSTEM PRE-FEASIBILITY STUDY CITY OF WHITEHORSE, YUKON Task 2: Energy Input Discussion
March 8, 2010
ah w:\1182\active\01 active projects\118200105 - city of whitehorse des\180-230-mechanical\05-reports\final_report\2010_03_08\rpt_001_20100308.doc 3.27
Figure 6: Organic Rankin Cycle Unit
The advantage of the capability to generate electricity while providing heat input to the DES may
be important in the future as the electrical requirement in the region grows.
3.3.3 Combined Heat and Power – Steam Turbine Technology (Cases 11-15):
The combined heat and power cases that make use of the steam turbine technology use similar
combustion technology to the ORC cases however the heat of combustion is used to evaporate
water in a boiler to generate high pressure and high temperature steam. The steam flows from
the boiler to the steam turbine where it expands thus converting the energy in the steam to
mechanical energy. This rotational mechanical energy is used to drive a generator which
produces electricity for the grid. The steam exhausting from the turbine is condensed back to
water and pumped back to the boiler as part of the feed water cycle. The heat that is removed
from the condensation of the steam is used as heat input to the DES. This is accomplished by
the flow of the circulated water through the condenser to cool and condense the steam vapour.
The advantage of the steam turbine CHP cases is the conversion of the chemical energy in the
any of the fuels to both heat (for the DES) and electrical power for the grid. This would provide a
back-up electrical power supply to the City of Whitehorse while still providing heat to the DES.
There are many examples of installations of this technology.
The disadvantage of the steam turbine cases is the design requirements of the boiler and steam
turbine to operate at high steam pressure and temperature. This is required to facilitate the
efficient transfer of energy from the fuel to the steam turbine. The high operating pressure and
temperature will necessitate a more complicated boiler design and more robust boiler
components as well as higher licensed operating engineers than the heat only or the ORC

DISTRICT ENERGY SYSTEM PRE-FEASIBILITY STUDY CITY OF WHITEHORSE, YUKON Task 2: Energy Input Discussion
March 8, 2010
3.28 ah w:\1182\active\01 active projects\118200105 - city of whitehorse des\180-230-mechanical\05-reports\final_report\2010_03_08\rpt_001_20100308.doc
cases. Also the boiler will require treated make up water to ensure long term reliability of the
boiler pressure parts. This will add to the overall operation cost.
3.3.4 Heat Only by Electric (Cases 16 – 17)
The cases of heat only by electric (firm and secondary) were added for comparison to the
combustion based systems.
The advantage of electrical based scenarios is the relatively simple system in that no
combustion in required. As more heat is required for the system increased current is applied to
the electric heater and additional heat is input to the system. The system simplicity has the
effect of a minimizing the operating cost.
The disadvantage is the higher cost of heat input to the system on a $/GJ basis for the firm
electrical basis and an interruptible supply for the secondary supply scenario. A system based
on an interruptible secondary supply would require a back-up input supply for times when the
secondary supply is not available.
3.3.5 Ground Source Heat Pump (GSHP) System Option
Ground Source Heat Pump (GSHP) systems are an efficient and typically lower emission
heating and cooling source. They can be designed for either a single building application or a
district system application. This kind of heat pump system takes advantage of the relatively
constant temperature of the ground – heat is rejected from the system in the summer so that
cooling is provided and extracted in the winter so that heating is provided.
The efficiency of the heat pumps is quite high with a typical coefficient of performance (COP) of
3. A COP of 3 means that for every unit of electricity used to power the units, 3 units of heating
energy are produced thanks to the amount of energy extracted from the ground.
A GSHP system consists of two main components – a well field and a heat pump array. The
well field is a series of either open or closed loop pipes that are bored into the ground either
horizontally or vertically. The location and design of the well field are significant factors in
determining how well the GSHP system will work. The soil conditions and the presence or
absence of ground water will vary the ability of the well field to transfer heat in and out of the
ground. The higher the soil conductivity, the better the system’s cost effectiveness – the better
the heat transfer, the shorter the well needs to be for the same system capacity. The other
component of the system is the heat pump array. Heat pumps can vary widely in terms of size
and efficiency. Matching the appropriate technology with the desired system configuration is
obviously necessary for optimal performance.
Clearly, this energy benefit makes them an attractive technology option but there are a number
of additional issues that must be addressed to determine if this kind of system is appropriate for
a service area. In order to obtain the maximum efficiency from a GSHP system and to make the
cost associated with drilling the required wells worthwhile, soil conditions, system type and loop

DISTRICT ENERGY SYSTEM PRE-FEASIBILITY STUDY CITY OF WHITEHORSE, YUKON Task 2: Energy Input Discussion
March 8, 2010
ah w:\1182\active\01 active projects\118200105 - city of whitehorse des\180-230-mechanical\05-reports\final_report\2010_03_08\rpt_001_20100308.doc 3.29
temperature and GHG issues must all be considered. An overview of these considerations is
presented here in the context of the Whitehorse study area.
3.3.5.1 Site Potential
Some significant investigation has already been completed to assess the technical feasibility of
GSHP systems in the study area. Notably, Gartner Lee described the potential for all of the
areas under consideration for this study in their 2003 “Yukon Groundwater and Ground Source
Heat Potential Inventory”. In summary, the area near the Hospital has reasonably good
potential thanks to the presence of some form of groundwater. Most other areas under
consideration seem to present low or low-moderate potential thanks to the soil conditions.
Lewes Boulevard does not seem to have very favorable soils but the same groundwater that
makes the Hospital area favorable may also be present here.
3.3.5.2 Compatibility Issues
GSHP systems are low temperature water systems on the heating side, generally limited to a
maximum temperature of 60 degrees C. Because of this design consideration, a GSHP-fueled
district energy system must be paired with buildings that can utilize low temperature water or
those buildings must be equipped with booster boilers that will increase the temperature of the
water to a compatible temperature. Unfortunately, the buildings in the potential Whitehorse
district energy precincts are all likely higher temperature (generally 80 to 90 degrees C) than
would be easily compatible with a GSHP system, especially the Hospital. Booster boilers would
be necessary to provide water of the appropriate temperature. The capital cost of providing
these boilers would likely be prohibitive, especially when the on-going maintenance and
servicing costs are included.
A second compatibility issues is the match between heating and cooling loads. Generally, heat
is rejected in the summer to re-charge the ground field, and then extracted over the winter. In
this way a ground field may be considered a seasonal storage device for thermal energy. A
challenge in Whitehorse is the imbalance between heating and cooling loads. In the long term,
this may lead to deterioration of the ground field, particularly in locations with poor conductivity
and low water permeability.
3.3.5.3 GHG Issues
Reductions in carbon or greenhouse gas emissions are a valid and significant reason to
consider a GSHP system. Provided the carbon signature of the electricity in the jurisdiction is
low enough, the use of an electrically-fueled system like a GSHP will reduce the carbon
signature of the system compared to a gas-fired system. In the Yukon, the average GHG
intensity of electricity is 0.249 kg CO2e/kWh whereas natural gas is 0.204 kg CO2e / kWh
according to Natural Resources Canada. (Note that propane and most other fossil fuels are
even higher) So long as boosting boilers are not required, the overall system emissions
signature is lower with a GSHP choice. If, however, significant numbers of booster boilers are

DISTRICT ENERGY SYSTEM PRE-FEASIBILITY STUDY CITY OF WHITEHORSE, YUKON Task 2: Energy Input Discussion
March 8, 2010
3.30 ah w:\1182\active\01 active projects\118200105 - city of whitehorse des\180-230-mechanical\05-reports\final_report\2010_03_08\rpt_001_20100308.doc
required, the emissions signature would be higher, reducing the benefit of selecting a GSHP
system.
3.3.5.4 Summary
GSHP systems are an important system to investigate for any district system. However, the soil
conditions in the Whitehorse areas under investigation do not seem to present significant
potential for cost-effective, efficient GSHP installations. The only area where there is potential
based on the soil conditions is the area around the Hospital. Unfortunately, the Hospital’s
mechanical systems will require high temperature water and the GSHP system is unlikely to
prove cost effective with the amount of boosting required.
3.3.6 Waste to Energy Options
Waste to energy (WTE) is the process of creating energy in the form of electricity and/or heat
from the incineration of a waste source, such as municipal solid waste (MSW).
A WTE technology could be used as the primary or a secondary heat input component for the
district energy system. Energy contained within the waste stream would be converted to heat
through any one of a number of thermal technologies such as incineration, gasification, thermal
depolymerization, pyrolysis, or plasma arc gasification. This heat could then be used as an
input to the DES by passing the hot flue gas over the heat exchange surfaces to transfer the
heat to the circulation water of the DES. Non-thermal technologies such as anaerobic digestion,
fermentation and mechanical biological treatment may also be used to convert the waste to a
form that is useable for the production of heat.
The incineration type combustion system represents the most mature technology for a WTE
system and most appropriate for the City of Whitehorse DES.
In addition to supplying heat input to the City of Whitehorse DES the implementation of a WTE
option could provide the advantage of long term waste disposal. It is expected that the most
appropriate system would use a combustion system to heat hot water which would then be used
as heat input for the distribution system of the DES. The use of the WTE system would
effectively result in a reduced input requirement from the other heat sources for the DES which
would result in a larger back-up or stand-by capability if the WTE system was added in the
future.
The cost of using a WTE system should include the increased operating cost required for
collection and transportation of the waste to be used as fuel as well as fuel sorting to ensure the
recyclable materials are removed from the fuel stream. The cost for the emissions clean up
equipment must also be included in the capital cost of the WTE system. It is expected that the
operational cost of the WTE system will be higher than the biomass system due to the impurities
in the waste fuel.

DISTRICT ENERGY SYSTEM PRE-FEASIBILITY STUDY CITY OF WHITEHORSE, YUKON Task 2: Energy Input Discussion
March 8, 2010
ah w:\1182\active\01 active projects\118200105 - city of whitehorse des\180-230-mechanical\05-reports\final_report\2010_03_08\rpt_001_20100308.doc 3.31
A WTE scenario is not included in the analysis since sufficient information is not available to
develop a complete scenario; however, this option is recommended for further analysis.
3.4 COMPARISON OF OPTIONS
This section discusses the DES heat input sources and technology options for each of the
cases studied. The results of the comparison are listed in Error! Reference source not found.
which shows the relative ranking of each of the cases. The purpose of the ranking of the cases
was to determine the most economically attractive case from those reviewed. The selected case
was then used as the basis for the financial analysis / projection of Section 6.
Table 9: Ranking of Technology and Fuel Alternatives
Case Fuel Technology Technically feasible, y/n
Ranking
1 wood waste Heat only by combustion Y 9
2 wood pellets Heat only by combustion Y 2
3 wood pucks Heat only by combustion Y 1
4 heating oil Heat only by combustion Y 7
5 propane Heat only by combustion Y 15
6 wood waste combined heat and power - ORC Y 12
7 wood pellets combined heat and power - ORC Y 6
8 wood pucks combined heat and power - ORC Y 4
9 heating oil combined heat and power - ORC Y 10
10 propane combined heat and power - ORC Y 16
11 wood waste combined heat and power - steam turbine Y 14
12 wood pellets combined heat and power - steam turbine Y 8
13 wood pucks combined heat and power - steam turbine Y 5
14 heating oil combined heat and power - steam turbine Y 13
15 propane combined heat and power - steam turbine Y 17
16 electric - firm heat only Y 11
17 electric - secondary heat only Y 3
The ranking was based on a high level evaluation of the expected total annual cost for each of
the cases. The evaluation considered the base and peak load analysis taking into account the
heat input required by the system, the required heat input in the fuel, the unit fuel cost and the
annual fuel cost based on the results of Section 3.1. The income from electrical sales for the
CHP cases was also included in the evaluation. An estimated capital cost for each of the cases
was used as an input to determine the estimated annual financial charge used in the
determination of the total annual cost to operate the system.
It was found that the most economically attractive option is Case 3 (heat only by combustion
using wood pucks as the fuel). This case consists of a combustion system which utilizes wood
pucks as the biomass fuel. Case 2 (heat only by combustion using wood pellets as fuel) was
ranked second. The use of wood pellets for fuel for the DES may be considered as an
DISTRICT ENERGY SYSTEM PRE-FEASIBILITY STUDY CITY OF WHITEHORSE, YUKON Task 2: Energy Input Discussion
March 8, 2010
3.32 ah w:\1182\active\01 active projects\118200105 - city of whitehorse des\180-230-mechanical\05-reports\final_report\2010_03_08\rpt_001_20100308.doc
alternative to the wood pucks in the event that a supply of wood pucks is not available for the
DES. It is expected that the capital cost of the combustion equipment will be similar for either of
these biomass fuels. The characteristics of the fuels that were considered are described in
Section 3.1.
In each of the cases analyzed the base heating load was provided by the various fuels as listed
in the Error! Reference source not found.. The heat required for the peak load was supplied
by heating oil fired equipment. The heat input for the base load component is handled by the
equipment operating continuously at full load. This equipment typically has a higher capital cost
but is capable of using lower cost fuel thus minimizing the operating costs of the system. In
case 3, the biomass (wood pucks) fired hot water combustion system provides the heat input for
the base load. The peak load is handled by heating oil fired hot water heaters.
The details of the ranking of the cases that were considered are shown in Appendix D.
The CHP cases (ORC and STG) were ranked lower (more expensive) than the combustion only
systems mainly due to the higher capital costs of the equipment even though an income stream
due to the electrical production was possible.
3.5 CONCLUSIONS
Various energy input sources (fuels) and heat-input technologies to the district energy system
were screened at a high level by comparing the expected fuel costs, expected capital costs, and
expected operating and maintenance costs.
Case 3 (heat only by combustion using wood pucks as the fuel) was the combination of energy
input and technology that was found to represent the lowest annual cost. The advantages of a
locally supplied fuel using proven equipment are an expected low cost operation with a minimal
of unplanned downtime due to such factors as fuel availability, equipment failures or mis-
operation. This scenario was selected for further financial analysis as shown in Section 6.0 -
Task 5: Financial Analysis / Projections.
The combined heat and power options were encouraging however it appears that the relatively high capital cost of these systems combined with the low expected income due to the electrical power produced resulted in these systems being ranked lower than heat only system. The GSHP system also showed promise but the area with the best soil condition for a GSHP system (hospital area) had to supply the hospital’s mechanical systems with high temperature water that would require temperature boosting and the associated extra expense of a booster boiler.

DISTRICT ENERGY SYSTEM PRE-FEASIBILITY STUDY CITY OF WHITEHORSE, YUKON Task 3: Preliminary System Concept
March 8, 2010
ah w:\1182\active\01 active projects\118200105 - city of whitehorse des\180-230-mechanical\05-reports\final_report\2010_03_08\rpt_001_20100308.doc 4.33
4.0 Task 3: Preliminary System Concept
4.1 SERVICE AREA
The service areas under consideration for the Whitehorse are the Lewes Blvd areas, Hospital
Rd area and the Downtown area as previously explained. The DES may also be able to capture
additional existing or new buildings within the service area, but given the uncertainty this
creates, these are not considered in this analysis.
4.2 SYSTEM CONCEPT
The district heating system includes a distribution network of pipes, a central energy plant and
energy transfer stations within each building served. A brief description of each component is
presented below.
4.2.1 Distribution Network
The proposed district energy system would supply the space heating and domestic hot water
(DHW) needs of compatible buildings throughout the service area via a network of insulated, hot
water distribution pipes (see Figure 7). A variable temperature variable flow concept is
recommended to minimize line losses and pipe size. As the system will be serving primarily
existing buildings, the supply and return temperatures will be defined by the heat transfer
equipment within each building. Generally the system operator will strive to minimize the supply
temperature (usually about 80 C for existing systems) and maximize the temperature drop
across the building heat exchanger.
Stantec recommends utilization of welded thin wall steel pipe designed to En253 specifications
for all piping installation to ensure long and trouble free operation. A leak detection system is an
optional component of the pipe network that is recommended. For this study, compatible
buildings were those with hydronic heating and with a minimum annual load of 330,000 kWh.
Figure 7: Example District Heating Distribution Pipe Installation

DISTRICT ENERGY SYSTEM PRE-FEASIBILITY STUDY CITY OF WHITEHORSE, YUKON Task 3: Preliminary System Concept
March 8, 2010
4.34 ah w:\1182\active\01 active projects\118200105 - city of whitehorse des\180-230-mechanical\05-reports\final_report\2010_03_08\rpt_001_20100308.doc
Figure 8 shows a purely notional piping layout for the recommended DES.
Figure 8: Schematic Layout of Proposed DES
The interconnection of the DES piping from Zones 1 and 2 to Zone 3 requires the piping to use
the bridge as support for the river crossing. This will require the piping to be designed to
operate from below grade to above grade in a harsh winter climate. This requirement will
necessitate the use of a suitable insulation system and a heat tracing system if required to
ensure trouble free operation. Access to the bridge during the construction phase must be
confirmed however the impact is not expected to be to significant. It is envisioned that the
installation of the piping could be timed to take place during routine bridge maintenance such as
lane paving.
4.2.2 Plant
Heat will be produced and/or distributed from a central heat plant. The recommended fuel for
the heating plant is wood pucks which will provide between 70 and 95% of annual heat demand.
Peaking and back-up heat would be supplied by near condensing oil-fired boilers. As the loads
(existing buildings) are already in-place, the biomass plant will be built in conjunction with the
distribution system and buildings will be connected as the system is built.
A detailed description of the recommended heat input plant is as follows: The energy plant is envisioned to consist of biomass fired hot water heaters, the required auxiliary equipment, back-up heat input equipment, buildings and infrastructure. The proposed combustion systems are capable of firing the dry biomass fuel in the form of wood pucks. The pucks are essentially disks of dried compressed wood fibers of approximately 100 mm in diameter and 25 mm thickness. This fuel is uniform and capable of being easily handled and fed into the combustor. The auxiliary equipment used for this plant includes the fuel supply and ash handling system, fans and motors, automatic cleaning system, ignition and control systems, emissions control equipment, flues, ducts and a stack.

DISTRICT ENERGY SYSTEM PRE-FEASIBILITY STUDY CITY OF WHITEHORSE, YUKON Task 3: Preliminary System Concept
March 8, 2010
ah w:\1182\active\01 active projects\118200105 - city of whitehorse des\180-230-mechanical\05-reports\final_report\2010_03_08\rpt_001_20100308.doc 4.35
The peaking and back-up hot water heating system is envisioned to be heating oil fired
equipment capable of providing heat input to the system in the event that the biomass heat
systems are out of service for any reason or the heating requirement is at its seasonal peak.
The following are some other back-up options that could be considered:
• Utilization of the existing heating equipment in the buildings that will be connected to the
DES. The majority of the existing heating equipment is fired by heating oil. In the event
that back-up heat is required to the DES the existing equipment could be placed into
service. This scenario would provide back-up heat during periods of peak operation. In
addition, a number of the existing heating plants include electric boilers, which make
use of the surplus electricity at reduced rates. It may be advantageous to use these to
meet some of the summer base load when there surplus electricity. This concept has
not been included within the financial analysis.
• The capital cost for the DES energy input system has considered the requirement for
additional heat input capacity to satisfy the N-1 case. The N-1 designation is used to
describe the case where the required capacity of the system can be supplied with one
of the components out of service. In this case N is the total number of components and
N-1 represents one unit out of service or not available. In this case, the additional
capacity is supplied by heating oil fired hot water heaters.
• During periods when the demand is less that than peak, the peaking biomass boilers
can also act as back-up capacity if some of the base load equipment is shut down.
An example biomass plant is presented in Figure 9.
Figure 9: Biomass District Heating Plant in Revelstoke BC

DISTRICT ENERGY SYSTEM PRE-FEASIBILITY STUDY CITY OF WHITEHORSE, YUKON Task 3: Preliminary System Concept
March 8, 2010
4.36 ah w:\1182\active\01 active projects\118200105 - city of whitehorse des\180-230-mechanical\05-reports\final_report\2010_03_08\rpt_001_20100308.doc
The plant will be fully manned, and supervision requirements will need to be reviewed with the
jurisdiction having authority. Plant operators will be responsible for operation of the plant,
delivery of heat, monitoring of in-building performance and collection of heat sales for billing.
4.2.3 Energy Transfer Stations
Individual buildings will be served using an Energy Transfer Stations (ETS) located on the
customer premises that are owned and operated by the utility (Figure 10). The utility would
meter and bill for consumption. Building owners or landlords will be responsible for allocating
costs to individual businesses/tenants within the building. No sub-metering costs are included
in this analysis. Flow control valves and energy meters are interfaced with a communications
network to allow for continuous monitoring of all systems remotely.
Figure 10: Energy Transfer Station Installation
4.2.4 System Operation
The system is a heating only concept, since cooling loads in Whitehorse are small and not
economic to service from a centralized system. The concept utilizes hot water distributed
through the insulated pipes. A variable temperature variable flow operating schedule is
recommended, where operating temperature ranges from 75C to 95 C, and re-set to outdoor
temperature. Operating pressure is generally at 150 PSI. The system efficiency is dependent
on achieving a low return temperature. Therefore, control valves at the energy transfer station
should be return temperature limiting.
A steam based systems is not recommended for the current application due to relatively high
losses and miss-match of primary and secondary supply temperatures. Similarly, an ambient
loop concept is not recommended due to the minimal cooling load anticipated for this system.

DISTRICT ENERGY SYSTEM PRE-FEASIBILITY STUDY CITY OF WHITEHORSE, YUKON Task 3: Preliminary System Concept
March 8, 2010
ah w:\1182\active\01 active projects\118200105 - city of whitehorse des\180-230-mechanical\05-reports\final_report\2010_03_08\rpt_001_20100308.doc 4.37
4.2.5 System Control
It is ideal if the individual building heating systems are designed for variable volume flow
operation, preferably with variable speed pumps to minimize the pumping (power) requirements.
Based on observations made during the site visit, many of the existing buildings have a constant
flow design. The details of how these buildings will be connected should be explored within a
subsequent feasibility study.
All control valves (terminal units and zone valves) should be of 2-way modulating type (or on/off
for Fan Coil Units). The secondary supply temperature (from the ETS) shall be reset based on
outside air temperature. Ideally the maximum ETS secondary supply temperature should not
exceed 70oC. Flow control valves will be set to be return temperature limiting.
A LonWorks20 communications protocol is recommended for system communication, as vendors
such as TA Canada have developed controllers for district energy applications. The
communications network may be supported off an internet platform or utilizing a copper or fibre
optics cable that may be installed with the pipe network. This will permit automated billing
collection, trouble shooting and system control.
20 LonWorks is a networking platform specifically created to address the needs of control applications. (http://en.wikipedia.org/wiki/LonWorks)

DISTRICT ENERGY SYSTEM PRE-FEASIBILITY STUDY CITY OF WHITEHORSE, YUKON Task 4: GHG Emissions and Air Quality
March 8, 2010
5.38 ah w:\1182\active\01 active projects\118200105 - city of whitehorse des\180-230-mechanical\05-reports\final_report\2010_03_08\rpt_001_20100308.doc
5.0 Task 4: GHG Emissions and Air Quality
A key benefit of the district energy concept relative to the business as usual (BAU) scenario
includes reduced greenhouse gas (GHG) or carbon emissions and reduced local air pollutants
in Whitehorse.
The BAU scenario is fuel oil fired boilers for the majority of buildings, and a limited amount of
propane fired boilers and electric boilers. The proposed DES scenario includes moving to a
biomass fired heating plant with fuel oil used only for peaking and backup (~20% of total
output).
5.1 EMISSION FACTORS
The quantification of GHG emissions is a relatively new and evolving phenomenon for
organizations and government bodies in North America. There are many subtleties associated
with GHG emissions quantification, which are evolving with the industry. One important issue is
the emission factor that is applied to various energy sources. Emission factors are published by
many different sources, sometimes with contradictory results.
For direct emissions from fuels such as natural gas, fuel oil, and propane there is minimal
variation between emission factors stated by different information sources. For indirect
emissions associated with electricity generation there are many different emission factors
available from different sources. The results vary depending on many factors including year(s)
reported (for example, single year data versus average over several years); regions included
(for example, Whitehorse specifically versus Yukon Territory in general); and calculation
methodology (for example, if imports and exports of electricity are included in analysis).
Some of the different GHG intensity or emission factor values researched, for each of the fuel
alternatives are presented in Table 10.
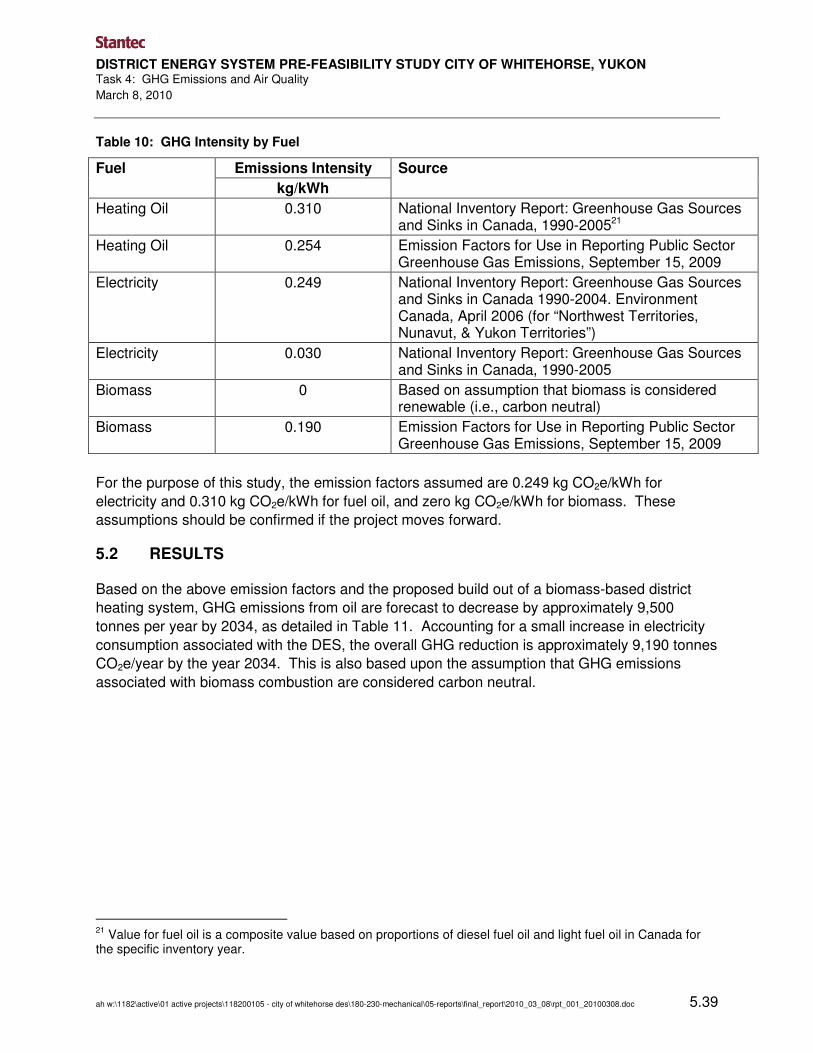
DISTRICT ENERGY SYSTEM PRE-FEASIBILITY STUDY CITY OF WHITEHORSE, YUKON Task 4: GHG Emissions and Air Quality
March 8, 2010
ah w:\1182\active\01 active projects\118200105 - city of whitehorse des\180-230-mechanical\05-reports\final_report\2010_03_08\rpt_001_20100308.doc 5.39
Table 10: GHG Intensity by Fuel
Emissions Intensity Fuel
kg/kWh
Source
Heating Oil 0.310 National Inventory Report: Greenhouse Gas Sources and Sinks in Canada, 1990-200521
Heating Oil 0.254 Emission Factors for Use in Reporting Public Sector Greenhouse Gas Emissions, September 15, 2009
Electricity 0.249 National Inventory Report: Greenhouse Gas Sources and Sinks in Canada 1990-2004. Environment Canada, April 2006 (for “Northwest Territories, Nunavut, & Yukon Territories”)
Electricity 0.030 National Inventory Report: Greenhouse Gas Sources and Sinks in Canada, 1990-2005
Biomass 0 Based on assumption that biomass is considered renewable (i.e., carbon neutral)
Biomass 0.190 Emission Factors for Use in Reporting Public Sector Greenhouse Gas Emissions, September 15, 2009
For the purpose of this study, the emission factors assumed are 0.249 kg CO2e/kWh for
electricity and 0.310 kg CO2e/kWh for fuel oil, and zero kg CO2e/kWh for biomass. These
assumptions should be confirmed if the project moves forward.
5.2 RESULTS
Based on the above emission factors and the proposed build out of a biomass-based district
heating system, GHG emissions from oil are forecast to decrease by approximately 9,500
tonnes per year by 2034, as detailed in Table 11. Accounting for a small increase in electricity
consumption associated with the DES, the overall GHG reduction is approximately 9,190 tonnes
CO2e/year by the year 2034. This is also based upon the assumption that GHG emissions
associated with biomass combustion are considered carbon neutral.
21 Value for fuel oil is a composite value based on proportions of diesel fuel oil and light fuel oil in Canada for the specific inventory year.

DISTRICT ENERGY SYSTEM PRE-FEASIBILITY STUDY CITY OF WHITEHORSE, YUKON Task 4: GHG Emissions and Air Quality
March 8, 2010
5.40 ah w:\1182\active\01 active projects\118200105 - city of whitehorse des\180-230-mechanical\05-reports\final_report\2010_03_08\rpt_001_20100308.doc
Table 11: Summary of Energy Consumption and GHG Emissions for BAU and DES Scenarios (Year 2034)*
Energy
Consumption
Units BAU Scenario DES Scenario Savings
(BAU - DES)
Fuel Oil MWh/yr 35,669 5,024 30,645
Electricity22 MWh/yr 0 1,238 (1,238)
Biomass MWh/yr 0 28,470 (28,470)
Total MWh/yr 35,669 34,732 937
GHG Emissions Units BAU Scenario DES Scenario Savings
(BAU - DES)
Fuel Oil tCO2e 11,057 1,557 9,500
Electricity tCO2e - 308 (308)
Biomass tCO2e - - -
Total tCO2e 11,057 1,866 9,192
*Brackets indicated negative values (ie; increases rather than savings).
5.3 AIR QUALITY IMPACTS
Air quality impacts are equipment dependent. Emissions cleanup equipment may be specified
for either oil fired or biomass equipment to reduce common air contaminants. For the biomass
system installation of a precipitator is assumed that would reduce stack emissions of particulate
matter to required limits (assumed < 15 mg/nm3). Costs for post combustion cleanup
equipment to achieve this level of particulate emission are included in the financial analysis.
Additional limits for NOx (<120 mg/nm3), CO (<400 ppmv), and opacity (<5%) are also
achievable. These costs were not included in the financial analysis and would be included only
if the City of Whitehorse has exceedances relative to the Canada-wide standards. Including this
level of emissions control could be considered as a means to improve air quality and public
perception associated with a combustion based district energy. Additional direction is required
to understand local air quality issues.
22 It is noted that some of the heating in the BAU scenario (~6%) is provided by propane and electricity; however, these are insignificant and therefore ignored for the purpose of this study. Electricity consumption under the DES scenario is for equipment and pumping energy associated with the DES plant and distribution network.

DISTRICT ENERGY SYSTEM PRE-FEASIBILITY STUDY CITY OF WHITEHORSE, YUKON Task 5: Financial Analysis / Projections
March 8, 2010
ah w:\1182\active\01 active projects\118200105 - city of whitehorse des\180-230-mechanical\05-reports\final_report\2010_03_08\rpt_001_20100308.doc 6.41
6.0 Task 5: Financial Analysis / Projections
6.1 ASSUMPTIONS
This section summarizes the key assumptions used to develop financial projections for the
Business as Usual (BAU) scenario and the preferred District Energy System (DES) scenario,
including the cost of fuel oil, electricity, biomass and carbon offsets during the 25 year study
period (2010-2034). All dollar figures within the financial model are in real 2009 dollars
unless otherwise noted. The assumed rate of inflation for the 25 year period is 2%, which is
consistent with the long-term Bank of Canada target.
The study period begins in January, 2010 since an anticipated time at which operation could be
commenced is not known given this is a pre-feasibility study. A 25-year study period ending in
2034 has been used because district energy systems have assets with a relatively long useful
lifetime and a number of years are required to recoup the customary operating losses in the
initial years.
Regarding governance structure, after discussion with the client, it was decided to assume that
the DES would be a utility owned by the City of Whitehorse.
It is important to note that there is a good deal of uncertainty when projecting energy costs,
particularly over a 25-year horizon. Given the uncertainty in projecting energy pricing beyond 10
years, it is recommended that the projections beyond 10 years be viewed as an indication of
likely trends only.
6.1.1 Energy Costs
Average energy costs for fuel oil, electricity and biomass were researched for the Whitehorse
market in 2009 and used as the basis for projecting energy costs over the 25-year study period.
It was assumed that customers purchase fuel oil at commercial rates in the BAU scenario
whereas the DES utility purchases the fuel oil it requires at wholesale rates. Wholesale rates
were about 2% lower than commercial rates in 2009.
In the case of fuel oil, the projected annual rates of increase for light crude developed by
Sproule were used to escalate the price of fuel oil. Sproule is a world-wide petroleum consulting
and research firm and is considered a reputable source for oil and gas price forecasts. Gas
companies, financial organizations, and government agencies use Sproule reports for technical
and financial planning. The analyst responsible for developing the Sproule oil and gas forecasts
was contacted and confirmed that it was reasonable to apply the price increase projections for
Edmonton par light crude to fuel oil in the Yukon market. Table 12 shows the Sproule forecast
for Edmonton par dated 31 December 2009. Although the average price for 2009 was
$66.87/Bbl, by December, 2009 the monthly average price had recovered to $74.65/Bbl. The
Sproule forecast projects light crude reaching a price of around $91/Bbl by 2013, about 14%

DISTRICT ENERGY SYSTEM PRE-FEASIBILITY STUDY CITY OF WHITEHORSE, YUKON Task 5: Financial Analysis / Projections
March 8, 2010
6.42 ah w:\1182\active\01 active projects\118200105 - city of whitehorse des\180-230-mechanical\05-reports\final_report\2010_03_08\rpt_001_20100308.doc
below the average price of $105/Bbl for 2008. Beyond 2013, the price of light crude is forecast
to remain constant in real dollars or increase annually at a rate of 2% nominal. These price
increase projections were applied to fuel oil unless otherwise noted.
Table 12: Oil Price Forecasts
Figure 11, shows the same information graphically.

DISTRICT ENERGY SYSTEM PRE-FEASIBILITY STUDY CITY OF WHITEHORSE, YUKON Task 5: Financial Analysis / Projections
March 8, 2010
ah w:\1182\active\01 active projects\118200105 - city of whitehorse des\180-230-mechanical\05-reports\final_report\2010_03_08\rpt_001_20100308.doc 6.43
Figure 11: Oil Prices - Historical and Forecast
Electricity was projected to increase at a real rate of 0% or 2% nominal. This is considered
conservative given that the real rate of increase in BC Hydro rates is about -1% over the last 20
years and Yukon Energy implemented a 6% rate decrease on December 1, 2008. Furthermore,
Whitehorse is supplied by hydro and so its rate should be independent of fluctuations in the
price of oil.
Biomass was projected to increase at a real rate of 0% or 2% nominal due to the source of
supply being local. This forecast came from a potential supplier of biomass and is considered
reasonable given that there is no export market for biomass produced locally owing to a lack of
cost-effective transportation.
Figure 12 shows the projected energy costs over the study period based on the above
assumptions.

DISTRICT ENERGY SYSTEM PRE-FEASIBILITY STUDY CITY OF WHITEHORSE, YUKON Task 5: Financial Analysis / Projections
March 8, 2010
6.44 ah w:\1182\active\01 active projects\118200105 - city of whitehorse des\180-230-mechanical\05-reports\final_report\2010_03_08\rpt_001_20100308.doc
Figure 12: Energy Price Projection 2010 - 2034
For the DES scenario, it was assumed that saleable carbon offsets would be generated from the
reduction in GHG emissions compared to the BAU scenario. Pricing of these was based on a
forecast by Natsource23 included in BC Hydro’s 2008 Long Term Acquisition Plan. The most
likely scenario begins with a midpoint of $14/tonne in 2010 increasing to $39/tonne (real 2008 $)
in 2030 which is equivalent to a compound average growth rate (CAGR) of 5.26%. Pacific
Carbon Trust is reported to be buying carbon offsets in the range of $14-$20/tonne validating
this forecast for the short term. Accordingly, it was assumed that a DES could sell carbon
offsets beginning at $14/tonne in 2010 and increasing in value by 5.26% annually in real dollars
over the study period.
6.1.2 Taxes
As a city owned utility, it is assumed that the DES revenues would not be subject to income tax.
So the financial projections have been prepared on a pre-tax basis. In the event a different
governance structure was adopted, provision for taxes would have to be made based on the
ownership structure actually put in place.
It has also been assumed that the DES utility would charge GST to any non-YTG customers
and thus be entitled to claim a GST rebate for all GST payable on energy and other costs.
23
BC Hydro 2008 Long Term Acquisition Plan, Appendix G1, Natsource 2007 GHG Offset Forecast Report

DISTRICT ENERGY SYSTEM PRE-FEASIBILITY STUDY CITY OF WHITEHORSE, YUKON Task 5: Financial Analysis / Projections
March 8, 2010
ah w:\1182\active\01 active projects\118200105 - city of whitehorse des\180-230-mechanical\05-reports\final_report\2010_03_08\rpt_001_20100308.doc 6.45
Hence, a net GST rate of 0% has been assumed. Heating fuel is zero rated for Yukon sales
tax; a similar treatment has been assumed for all energy used by the DES24.
6.1.3 Revenue
Revenue to the DES is assumed to come from two sources: heating charges for connected
customers and the sale of carbon offsets. The assumptions behind the pricing of carbon offsets
have been explained previously in Section 6.1.1. The heating charge was developed in two
steps. First, a rate is calculated that would yield a cost of heating equal to the fuel costs
currently incurred in the BAU scenario. Secondly, a premium over that rate is applied to deliver
sufficient revenue to achieve positive cash flow and a positive net present value over the study
period. As a simplifying assumption for the BAU scenario, it was assumed that all of the
premises in study area used fuel oil as a heating energy source since the overwhelming majority
did so.
The initial market for the DES was considered to be 20 Yukon Government and City of
Whitehorse buildings, henceforth referred to as the Initial Buildings, in the downtown, Hospital
Road and Lewes Boulevard zones with a total area 96,224 m2. An estimated growth of new
buildings was assumed within each area, as described in Section 2.3.3 - Future Expansion.
50% of the estimated annual growth in the three zones was assumed to connect to the DES,
amounting to an annual increase in the served floor space of 765 m2. 40% of the growth was
assumed to be government space and 60% private commercial space. It was assumed that the
DES would charge the same rate to both government and commercial customers. The growth
is assumed to come from new development in both the BAU and DES scenarios.
Heating consumption per m2 (also known as heating intensity) is assumed to remain constant
over the study period and for new growth it is based on the current average heating intensity for
the Initial Buildings.
Customers are assumed to be added in the middle of the year; in other words, the DES only has
50% of the annual revenue for a customer in the first year of acquisition. This reflects the fact
that in any given year, the exact timing of connection will be determined by issues of customer
convenience and when the DES utility can be ready to provide the in-building infrastructure for
new customers. All of the Initial Buildings are assumed to connect within the first year.
6.1.4 Capital and Financing
The replacement cost for the heating plant in the Initial Buildings has been estimated at
$870,000 or $9.05 per m2. In the BAU scenario, a replacement plant charge of 1/25th of this
amount has been applied each year representing an average expected cost to replace heating
plant equipment as it reaches the end of its useful lifetime. Similarly, an allowance for the cost
of new heating plant equipment for the new growth has been included based on the same cost
24 Currently there is no Yukon sales tax on fuel used for heating; it has been assumed that a similar treatment would be extended to other fuel sources used for heating such as biomass.

DISTRICT ENERGY SYSTEM PRE-FEASIBILITY STUDY CITY OF WHITEHORSE, YUKON Task 5: Financial Analysis / Projections
March 8, 2010
6.46 ah w:\1182\active\01 active projects\118200105 - city of whitehorse des\180-230-mechanical\05-reports\final_report\2010_03_08\rpt_001_20100308.doc
per m2. Both of these charges have been treated as expenses in the BAU scenario since
together they amount to around $40,000 per year or about 1% of the annual fuel costs.
The capital cost of the DES system has been estimated at $17.5 million plus $200,000 for land
costs. That estimate includes 10% for soft costs and 20% for contingency. A further capital
cost allowance has been included for upgrades to the DES plant to accommodate growth. Each
upgrade is assumed to be made to accommodate projected growth over the next 5 years.
All new capital assets are assumed to come into use January 1 with construction carried out in
the previous calendar year during which time the assets are treated as assets under
development. Construction financing is assumed to be part of the provision for soft costs.
All assets are depreciated on a straight-line basis over the asset’s lifetime.
The funds required to make the DES capital investments are assumed to be funded through the
issue of bonds with a coupon25 of 8.25% and a 25-year term, which is the City of Whitehorse’s
current cost of borrowing. The discount rate has been assumed to be equal to the cost of
borrowing. It has been assumed that the City would establish a sinking fund with annual
contributions beginning the year each bond is issued to accumulate the funds necessary to
repay the principal of each bond when it becomes due. It has also been assumed that the City
could earn an average return of 5% on its sinking funds and this rate has been used to estimate
the required contributions for the sinking funds. Since the model is in real dollars, the discount
rate, cost of borrowing and the return on sinking funds have all been adjusted by the assumed
rate of inflation of 2%. Table 13 summarizes these figures.
Table 13: Financial Figures
Nominal Real
City’s cost of borrowing 8.25% 6.25%
Discount rate 8.25% 6.25%
Sinking fund return 5.0% 3.0%
The NPV calculation includes a terminal value or salvage value equal to the book value of the
assets for the period over which the NPV is being calculated plus the value of the assets under
development in the last year of the period.
6.2 PROJECTIONS
Two scenarios were modeled, a BAU scenario estimating the costs of supplying heating to the
three zones in the study with the existing heating systems burning fuel oil and assuming that
new development also uses fuel oil-fired heating plants, and a DES scenario implementing the
preferred DES solution.
25 Another term for interest rate, used in the context of bonds

DISTRICT ENERGY SYSTEM PRE-FEASIBILITY STUDY CITY OF WHITEHORSE, YUKON Task 5: Financial Analysis / Projections
March 8, 2010
ah w:\1182\active\01 active projects\118200105 - city of whitehorse des\180-230-mechanical\05-reports\final_report\2010_03_08\rpt_001_20100308.doc 6.47
6.2.1 BAU Projections
Table 14 shows the financial projections for the BAU scenario.
Table 14: BAU Financial Projections
There are no revenues as the BAU scenario models carrying on with the current situation where
each building has its own independent heating plant burning fuel oil.
BAU expenses consist of three components:
• Fuel • Operating and Maintenance (O&M) • Other
O&M expenses for the Initial Buildings have been estimated at $105,000 annually. This amount
has been prorated as additional growth takes place, with the additional O&M cost being
proportional to the additional floor space. Other expenses are the charges for the replacement
cost of existing and additional heating plant equipment as discussed earlier.
Total expenses are estimated at $34.31/m2 in 2010, growing to $36.80/m2 in 2034. Figure 13
shows the relative contribution of the three components to the annual costs under the BAU
scenario. Fuel is far and away the most significant cost element, accounting for 96% of total
costs, with O&M and Other accounting for 3% and 1% respectively.
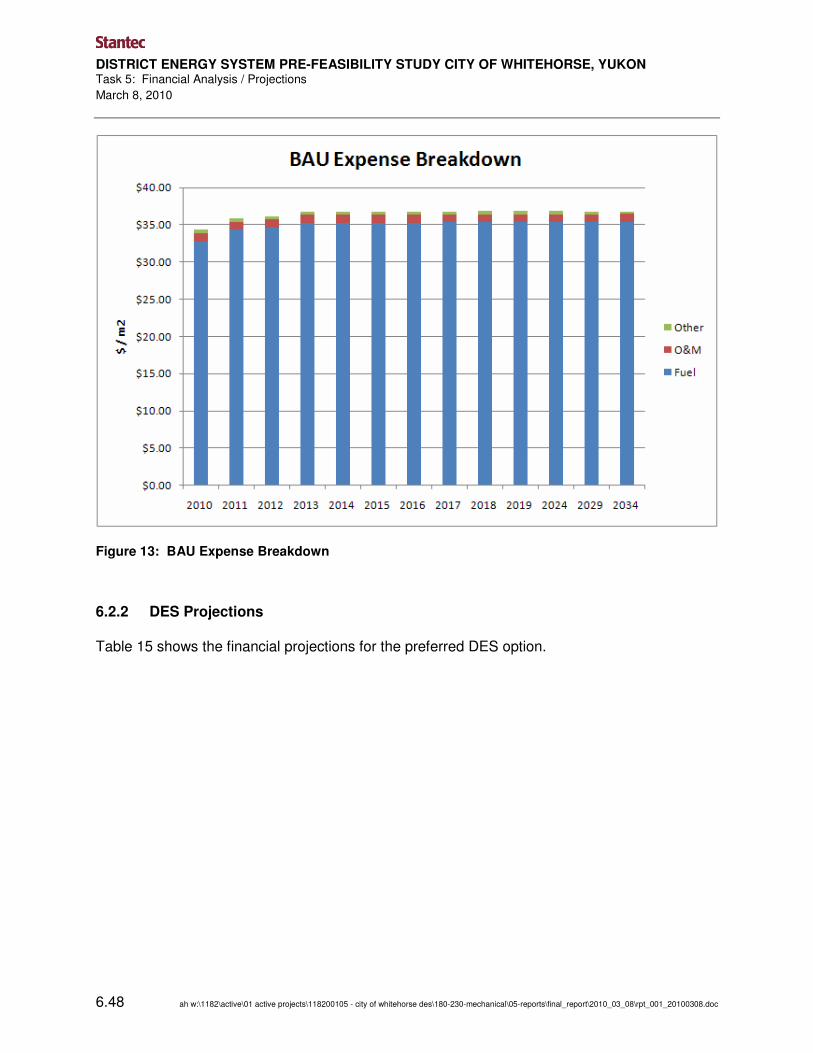
DISTRICT ENERGY SYSTEM PRE-FEASIBILITY STUDY CITY OF WHITEHORSE, YUKON Task 5: Financial Analysis / Projections
March 8, 2010
6.48 ah w:\1182\active\01 active projects\118200105 - city of whitehorse des\180-230-mechanical\05-reports\final_report\2010_03_08\rpt_001_20100308.doc
Figure 13: BAU Expense Breakdown
6.2.2 DES Projections
Table 15 shows the financial projections for the preferred DES option.

DISTRICT ENERGY SYSTEM PRE-FEASIBILITY STUDY CITY OF WHITEHORSE, YUKON Task 5: Financial Analysis / Projections
March 8, 2010
ah w:\1182\active\01 active projects\118200105 - city of whitehorse des\180-230-mechanical\05-reports\final_report\2010_03_08\rpt_001_20100308.doc 6.49
Table 15: DES Financial Projections
The heating plant equipment in the BAU scenario has an estimated average efficiency of 72%.
DES customers will be billed for heat delivered to the heat exchanger in the building mechanical
room, meaning that from the customer’s perspective it is 100% efficient. This means that if the
energy charge per MWh of heat delivered to DES customers was identical to the energy cost
per MWh of fuel oil burned for BAU customers, DES customers would be paying significantly
less for heat. Therefore, to set the DES energy charge to result in equivalent fuel costs to BAU
means a multiplier of 1/.72 or 30% has to be applied to the energy cost per MWh of heating with
fuel oil to arrive at an estimate of the DES energy charge that would match the energy costs of
the BAU scenario.

DISTRICT ENERGY SYSTEM PRE-FEASIBILITY STUDY CITY OF WHITEHORSE, YUKON Task 5: Financial Analysis / Projections
March 8, 2010
6.50 ah w:\1182\active\01 active projects\118200105 - city of whitehorse des\180-230-mechanical\05-reports\final_report\2010_03_08\rpt_001_20100308.doc
The DES energy charge has been set at a premium of 10% over the rate needed to match the
energy costs of the BAU scenario. This is necessary to ensure that initial operating losses are
kept to a reasonable level and that the City earns a return on investment roughly equal to its
cost of borrowing. With the energy charge at a 10% premium, the project has a simple payback
period of 12 years without taking into account debt service and sinking fund payments. Cash
flow after debt service and sinking fund payments turns positive in year 4 and the maximum
cumulative deficit before cash flow turns positive is $1,311,000. The effect of having zero or
lower premiums over the rate needed to match BAU energy costs is explored in section 6.4 -
Sensitivity Analysis.
Figure 14 shows how the DES customer charges compare to the BAU customer costs. Based
on the 10% premium, the DES customer charges are about $3.75/m2 more than the BAU fuel
costs but about $2/m2 more than the BAU total costs or about a 6% increment. A 10% premium
is in line with rate strategies adopted by other municipal heating utilities. For example, the City
of North Vancouver initially established their rate structure for the Lonsdale Energy Corporation
at 15% above the typical rate that a customer would pay for using conventional electric heating;
after a few years of operation, they reduced it to be comparable to the rates charged by Terasen
Gas. The City of Vancouver has adopted a 2010 rate structure for the Southeast False Creek
Neighbourhood Energy Utility that is estimated to result in heating costs about 10% higher than
those charged by BC Hydro, Dockside Green, Lonsdale Energy Corporation or Central Heat
Distribution.
It should be noted that the possibility of paying a premium is considered a worst case scenario,
which could be eliminated after further analysis to optimize other factors. It is also noted that
paying a premium has not been reviewed with either the City of Whitehorse or the Yukon
government. Such a discussion is recommended as one of the next steps to be undertaken as
part of a follow-on Feasibility Study as outlined in section 7.1.2. It should also be noted that it
may be possible to eliminate the premium after a few years of operation due to costs being
lower than expected or fuel oil prices rising more quickly than the conservative rate of escalation
assumed here. This proved to be case with the Lonsdale Energy Corporation as mentioned
above.
In addition, we have not accounted for any sinking funds that are likely required under the BAU
scenario for boiler replacement and O&M costs by owners. These operating and maintenance
costs need to be better understood at the detailed feasibility study stage and accounting for
these will likely improve the financial performance of the DES scenario relative to BAU.

DISTRICT ENERGY SYSTEM PRE-FEASIBILITY STUDY CITY OF WHITEHORSE, YUKON Task 5: Financial Analysis / Projections
March 8, 2010
ah w:\1182\active\01 active projects\118200105 - city of whitehorse des\180-230-mechanical\05-reports\final_report\2010_03_08\rpt_001_20100308.doc 6.51
Figure 14: Customer Cost Comparison
NPV is Net Present Value. The project has a 25-year NPV of $3 million, indicating its rate of
return is higher than the discount rate and hence a good investment from a financial
perspective. IRR is the internal rate of return. The 25-year IRR is 7.3% which is higher than the
discount rate of 6.25%, once again indicating a good investment. ROIC is Return on Invested
Capital and is frequently used as a financial measure of performance to avoid the distorting
effects of leverage on Return on Equity (ROE) and Return on Assets (ROA). Since it is
assumed that the DES Utility is entirely financed through debt, and hence is highly leveraged,
ROIC is a superior ratio. ROIC is defined as follows:
EBIT (1 – Tax rate)
ROIC26 = ---------------------------------------- where EBIT = earnings before interest & taxes
Interest-bearing debt + Equity
ROIC exceeds the discount rate by year 10, indicating that this investment makes sense in the
long-term but would not be advisable for an investor seeking short-term results. This is
consistent with an approach generally adopted for rate setting for utilities in which costs are
under-recovered in the early years to avoid setting initial rates too high and discouraging market
acceptance.
26 Robert C. Higgins, Analysis for Financial Management, McGraw-Hill/Irwin, 7th ed, 2004

DISTRICT ENERGY SYSTEM PRE-FEASIBILITY STUDY CITY OF WHITEHORSE, YUKON Task 5: Financial Analysis / Projections
March 8, 2010
6.52 ah w:\1182\active\01 active projects\118200105 - city of whitehorse des\180-230-mechanical\05-reports\final_report\2010_03_08\rpt_001_20100308.doc
Figure 15 shows cash flow, cumulative cash flow and NPV over the study period.
Figure 15: DES Cashflow and NPV
As discussed earlier, there are two components to revenue: heating charges and the sale of
carbon offsets. Figure 16 shows the breakdown of these components. Revenue is significantly
lower in 2010 because of the assumption that customers are added in the middle of the year, so
the DES utility is only earning 50% of normal annual revenues in that year for the Initial
Buildings which form the bulk of the customer base over the study period. Heating charges
constitute the vast majority of revenues, accounting for well over 90% in the initial years and still
accounting for about 90% in year 25 (2034). The relative importance of carbon offsets grows
over time since their pricing is predicted to increase at a faster rate than fuel oil.

DISTRICT ENERGY SYSTEM PRE-FEASIBILITY STUDY CITY OF WHITEHORSE, YUKON Task 5: Financial Analysis / Projections
March 8, 2010
ah w:\1182\active\01 active projects\118200105 - city of whitehorse des\180-230-mechanical\05-reports\final_report\2010_03_08\rpt_001_20100308.doc 6.53
Figure 16: DES Revenue Breakdown
As mentioned earlier, heating charges have been modeled as a single energy charge paid by
DES customers based on heat delivered to the heat exchanger in each served building. This is
a simplification given this is a pre-feasibility study. Rate setting is a complex process and is
beyond the scope of this study.
In practice, a DES utility would typically have a rate structure with two types of charges:
• Connection charge: this monthly charge is based on floor area and is set so as to recover the DES utility’s fixed costs. It does not vary with a customer’s energy use.
• Energy use charge: This monthly charge is based on the amount of energy consumed and varies accordingly with actual energy consumption. It is set so as to recover the DES utility’s variable energy costs.
DES expenses have two components: Fuel Costs and O&M Costs which include insurance.
Figure 17 shows the breakdown between these two components. Operating and Maintenance
costs have been estimated at $400,000 annually for the Initial Buildings and have been prorated
annually to account for the projected growth in floor area served. In 2010, fuel costs are
approximately 2/3 of expenses with O&M costs making up 1/3. This is due to the fact that the
Initial Buildings are assumed to be customers for half the year only on average, therefore fuel
consumption is ½ of what it would be if they were all active customers as of January 1st. In
later years, fuel costs account for approximately 80% of expenses with O&M costs making up
the remaining 20%.

DISTRICT ENERGY SYSTEM PRE-FEASIBILITY STUDY CITY OF WHITEHORSE, YUKON Task 5: Financial Analysis / Projections
March 8, 2010
6.54 ah w:\1182\active\01 active projects\118200105 - city of whitehorse des\180-230-mechanical\05-reports\final_report\2010_03_08\rpt_001_20100308.doc
Figure 17: DES Expense Breakdown
6.3 RATE ANALYSIS
As mentioned earlier, an energy charge equal to a 10% premium above the fuel costs projected
for the BAU scenario was used in developing the DES financial projections. This results in
customer heating costs estimated to be about 6% higher than the total cost of heating under the
BAU scenario, once O&M and other costs are taken into consideration. Table 16 illustrates 4
other rate scenarios compared to the base case which has an energy charge equal to a 10%
premium and where fuel oil costs are assumed to remain constant in real dollars beyond 2013.
Table 16: Rate Analysis

DISTRICT ENERGY SYSTEM PRE-FEASIBILITY STUDY CITY OF WHITEHORSE, YUKON Task 5: Financial Analysis / Projections
March 8, 2010
ah w:\1182\active\01 active projects\118200105 - city of whitehorse des\180-230-mechanical\05-reports\final_report\2010_03_08\rpt_001_20100308.doc 6.55
The first scenario is with an energy charge premium of 0% and with all other assumptions
unchanged from the base case. The table above shows that in this case, the project is not
viable with a negative NPV of $1.3 million and a maximum cumulative deficit of $7.1 million.
The second scenario is with an energy charge premium of 5% and with all other assumptions
unchanged from the base case. In this case NPV is positive at $857,000 and the maximum
cumulative deficit is $2.9 million; this scenario is marginally viable and might be worthy of
consideration if there were other economic development advantages to the project such as
leading to the establishment of a biomass fuel manufacturing plant in Whitehorse with the
attendant job creation and tax revenue benefits that could be generated.
The third scenario illustrated is with an energy charge premium of 5% and assuming a federal
grant in the amount of $3 million is obtained; all other assumptions are unchanged from the
base case. In this scenario the maximum cumulative deficit is reduced to $1.1 million, a similar
amount to that forecast with a 10% energy charge premium. This leads to a viable project with
a 25 year NPV of $3.7 million, an IRR of 7.8%, cash flow turning positive by year 2 and
cumulative cash flow turning positive by year 9. The total cost of heating is projected to be
about 1% higher than under the BAU scenario.
The 2010 Energy Information Administration (EIA) Early Release Overview projects a 1.1% real
increase in light crude for the period 2008-203527. The fourth scenario explores what happens if
a higher rate of escalation for fuel oil is assumed, namely, a 1% real increase in fuel oil prices
from 2014 onwards. In addition, an energy charge premium of 0% and a federal grant of $3
million were assumed, leading to a viable scenario with a 25 year NPV of $4.3 million, an IRR of
8%, cash flow turning positive by year 5 and cumulative cash flow turning positive by year 13.
In this scenario, the total cost of heating is projected to be about 3% lower than under the BAU
scenario, while customer fuel costs are the same.
In conclusion, this rate analysis suggests a 10% premium is appropriate for the initial years
based on the conservative forecasts for future fuel oil costs in the Sproule forecast and that the
project proponents should investigate the possibility of securing a federal grant. Potential
sources include the FCM’s Green Municipal Fund, federal infrastructure funds and the federal
gas tax. The results of the fourth scenario based on using the EIA’s long term forecast for light
crude pricing combined with obtaining a federal grant suggests that further research should be
carried out into long-term fuel oil price forecasts for the Whitehorse area.
6.4 SENSITIVITY ANALYSIS
All of the assumptions used in this financial analysis are conservative in order to demonstrate
unequivocally that a DES system is viable. The cumulative result of using conservative
assumptions is essentially a worst case scenario. Further study to optimize the factors that are
within the Clients control and to refine the assumptions regarding factors beyond the Clients
27. US Energy Information Administration, Annual Energy Outlook 2010 Early Release Overview, http://www.eia.doe.gov/oiaf/aeo/, accessed February 3, 2010.
DISTRICT ENERGY SYSTEM PRE-FEASIBILITY STUDY CITY OF WHITEHORSE, YUKON Task 5: Financial Analysis / Projections
March 8, 2010
6.56 ah w:\1182\active\01 active projects\118200105 - city of whitehorse des\180-230-mechanical\05-reports\final_report\2010_03_08\rpt_001_20100308.doc
control is likely to result in a more favorable financial outcome. This sensitivity analysis is
intended to provide some insight into the factors that have the largest impact on the results.
Sensitivity analysis against a number of factors was carried out for the preferred DES scenario
with the results shown in Table 17. The sensitivity factors explored and the results and
discussion of the analysis are summarized below.
•••• No growth: This scenario looks at the effect of limiting the DES customers to the Initial
Buildings. Financial performance improves slightly, due to the lower capital investment
required.
•••• Fuel oil @ +/-20%, +/- 10%: This group of scenarios looks at the impact of fuel oil prices
being 20% and 10% higher and lower over the study period. The financial performance of
the project is sensitive to fuel oil pricing as the results indicate. Should fuel oil prices be
even 10% lower, it would not be viable. Conversely, fuel oil prices even 10% higher would
dramatically improve financial performance and would give the utility the ability to lower
rates below the equivalent fuel oil costs if that were deemed to be in the interests of the City
and other stakeholders.
•••• Biomass @ +/- 20%, +/- 10%: This group of scenarios looks at the impact of biomass prices
being 20% and 10% higher and lower over the study period. The financial performance of
the project is sensitive to biomass costs as the results indicate, but is not as sensitive as it is
to fuel oil prices. Should biomass costs be 10% higher, it would still be marginally viable; at
20% higher it would not be viable. Conversely, biomass costs even 10% lower would
significantly improve financial performance and would give the utility the ability to lower rates
below the equivalent fuel oil costs if that were deemed to be in the interests of the City and
other stakeholders.
•••• Capital @ +/- 20%, +/- 10%: This group of scenarios looks at the impact of capital prices
being 20% and 10% higher and lower over the study period. The financial performance of
the project is sensitive to capital costs as the results indicate, but again is not as sensitive as
it is to fuel oil prices. Should capital costs be 10% higher, it would still be viable provided a
$2.9 million maximum cumulative deficit was considered acceptable to the City of
Whitehorse as the owner; at 20% higher it would not be viable. Conversely, capital costs
even 10% lower would significantly improve financial performance and would give the utility
the ability to lower rates below the equivalent fuel oil costs if that were deemed to be in the
interests of the City and other stakeholders.
•••• City Debt (real) @ 4.25%, 5.25%, 7.25%, 8.25%: This group of scenarios looks at the
impact of the City of Whitehorse’s cost of debt being +/- 2% and +/- 1% from current
borrowing costs over the study period. The financial performance of the project is sensitive
to interest costs as the results indicate, but, once again, not as sensitive as it is to fuel oil
prices. Should interest costs be an additional 1% higher, i.e. a real rate of 7.25%, the
project would still be viable provided a $3.2 million cumulative deficit was considered
acceptable to the City of Whitehorse as the owner; at an additional 2% higher, i.e. a real rate

DISTRICT ENERGY SYSTEM PRE-FEASIBILITY STUDY CITY OF WHITEHORSE, YUKON Task 5: Financial Analysis / Projections
March 8, 2010
ah w:\1182\active\01 active projects\118200105 - city of whitehorse des\180-230-mechanical\05-reports\final_report\2010_03_08\rpt_001_20100308.doc 6.57
of 8.25%, it would not be viable. Conversely, interest costs 1% lower, i.e. a real rate of
5.25% would significantly improve financial performance and would give the utility the ability
to lower rates below the equivalent fuel oil costs if that were deemed to be in the interests of
the City and other stakeholders. IRR is unchanged for all of the scenarios because it is
calculated on project cash flow before debt service and sinking fund payments.
Table 17: Sensitivity Analysis
It may be possible to increase financial performance by negotiating agreements to sell heat to
nearby buildings at reduced rates during off-peak periods, similar to Yukon Energy’s secondary
sales rates for electricity. The objective would be to operate the DES plant as close to full
capacity as possible so as to optimize its output without requiring additional capital investment
to increase its capacity.
The sensitivity analysis on the cost of debt suggests another avenue for exploration: Yukon
Energy’s current cost of capital is 7.09% or about 1% lower than the City of Whitehorse’s cost of
borrowing. Thus it would interesting to explore whether Yukon Energy’s financial strength could
be employed to reduce the project’s cost of capital through a different governance structure,
thereby permitting the DES to set a lower energy charge while still remaining financially viable.

DISTRICT ENERGY SYSTEM PRE-FEASIBILITY STUDY CITY OF WHITEHORSE, YUKON Task 5: Financial Analysis / Projections
March 8, 2010
6.58 ah w:\1182\active\01 active projects\118200105 - city of whitehorse des\180-230-mechanical\05-reports\final_report\2010_03_08\rpt_001_20100308.doc
6.5 OWNERSHIP AND OPERATING MODELS
This section addresses options for ownership and operation of a district heating system in
Whitehorse.
6.5.1 Ownership Models
Ownership models can be distinguished at a high level in terms of the extent and type of City
ownership as follows:
a. Total
b. Majority
c. Minority
d. Non-distribution assets only
e. Distribution assets only
f. No ownership interest
When evaluating the most appropriate ownership model, as with any other strategic decision, it
is important to be clear about the objective. Objectives may be summarized as follows;
1. Financial Implications (cost and availability of capital)
2. Legal Liability Implications
3. Financial Implications (capital spending, operating costs and revenues)
4. Financial, Operational, Hazard and Strategic Risk implications
5. Potential for Third-Party Funding
6. Tax Implications
7. Expertise and Core Business Issues
8. Staffing and Administration
9. Political
10. GHG emissions liability and offset opportunities
Each of these issues is summarised in Table 18 for the different operating models. As can be
seen, there are benefits and limitations of all ownership models. It is recommended that the
City evaluate its position with respect to each of the above criteria as a next step in developing
an ownership model.
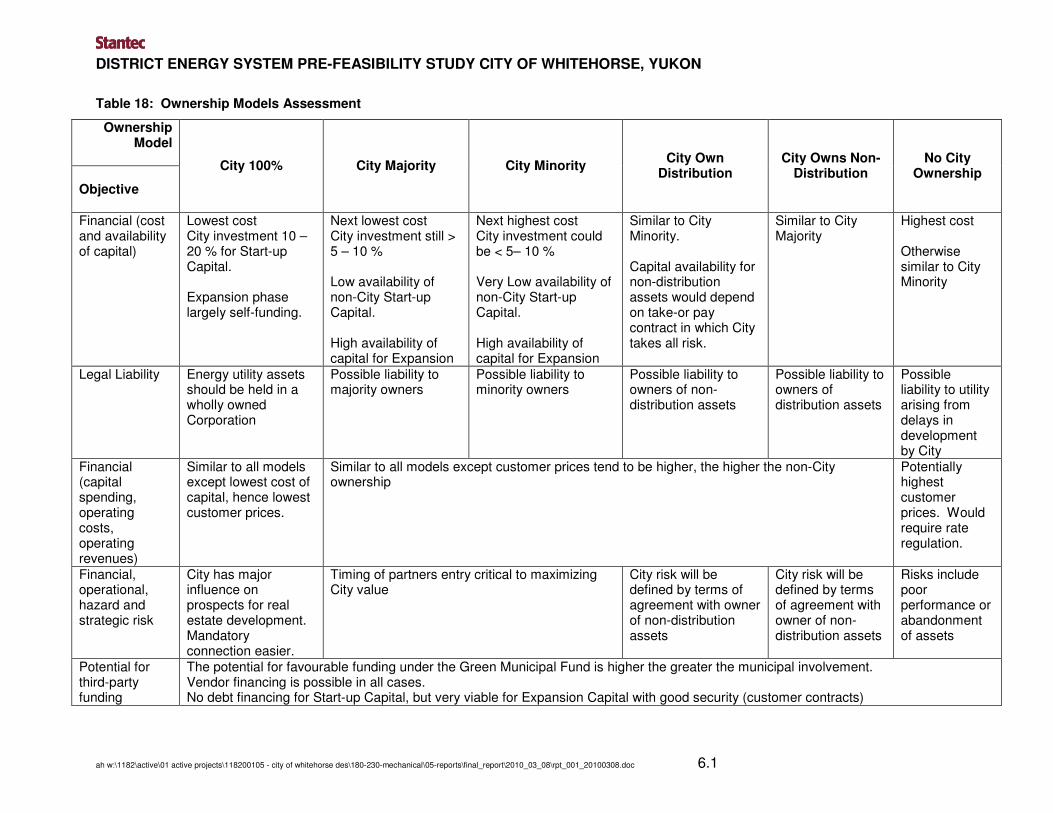
DISTRICT ENERGY SYSTEM PRE-FEASIBILITY STUDY CITY OF WHITEHORSE, YUKON
ah w:\1182\active\01 active projects\118200105 - city of whitehorse des\180-230-mechanical\05-reports\final_report\2010_03_08\rpt_001_20100308.doc 6.1
Table 18: Ownership Models Assessment
Ownership Model
Objective
City 100% City Majority City Minority City Own
Distribution City Owns Non-
Distribution No City
Ownership
Financial (cost and availability of capital)
Lowest cost City investment 10 – 20 % for Start-up Capital. Expansion phase largely self-funding.
Next lowest cost City investment still > 5 – 10 % Low availability of non-City Start-up Capital. High availability of capital for Expansion
Next highest cost City investment could be < 5– 10 % Very Low availability of non-City Start-up Capital. High availability of capital for Expansion
Similar to City Minority. Capital availability for non-distribution assets would depend on take-or pay contract in which City takes all risk.
Similar to City Majority
Highest cost Otherwise similar to City Minority
Legal Liability Energy utility assets should be held in a wholly owned Corporation
Possible liability to majority owners
Possible liability to minority owners
Possible liability to owners of non-distribution assets
Possible liability to owners of distribution assets
Possible liability to utility arising from delays in development by City
Financial (capital spending, operating costs, operating revenues)
Similar to all models except lowest cost of capital, hence lowest customer prices.
Similar to all models except customer prices tend to be higher, the higher the non-City ownership
Potentially highest customer prices. Would require rate regulation.
Financial, operational, hazard and strategic risk
City has major influence on prospects for real estate development. Mandatory connection easier.
Timing of partners entry critical to maximizing City value
City risk will be defined by terms of agreement with owner of non-distribution assets
City risk will be defined by terms of agreement with owner of non-distribution assets
Risks include poor performance or abandonment of assets
Potential for third-party funding
The potential for favourable funding under the Green Municipal Fund is higher the greater the municipal involvement. Vendor financing is possible in all cases. No debt financing for Start-up Capital, but very viable for Expansion Capital with good security (customer contracts)

DISTRICT ENERGY SYSTEM PRE-FEASIBILITY STUDY CITY OF WHITEHORSE, YUKON Task 5: Financial Analysis / Projections
March 8, 2010
6.2 ah w:\1182\active\01 active projects\118200105 - city of whitehorse des\180-230-mechanical\05-reports\final_report\2010_03_08\rpt_001_20100308.doc
Ownership Model
Objective
City 100% City Majority City Minority City Own
Distribution City Owns Non-
Distribution No City
Ownership
Tax Sales taxes similar for all models. Corporate income tax higher for higher levels of non-City ownership Expertise and core business
Energy utility management and staff would be hired. District energy is basic infrastructure for sustainable development. .
Majority owner would likely operate. City would need to check qualifications of initial owners but long-term control would be difficult. Private companies tend to change the focus of their core business over time.
Similar issues as for minority ownership.
Similar issues as for minority ownership, but less severe.
Similar issues as for minority ownership.
Staffing and administrative
No dedicated City staff after development phase. City representation on Board of energy utility.
Additional legal and administrative burden to select and negotiate with partners. .
Split ownership would result in the highest legal and administrative burden to select and negotiate with partners. There would be annual discussions on wholesale pricing, possibly involving complex true-up mechanisms.
Additional legal and administrative burden to select and regulate private proponents.
GHG Impact/ownership
The city owns the GHG credits from the DES
Subject to negotiation with partners
Subject to negotiation with partners
Subject to negotiation with partners
Subject to negotiation with partners
No GHG benefit accrues to City
Political The energy utility governance should be designed to streamline political input.
Lack of control could allow issues to arise related to choice of technology.

DISTRICT ENERGY SYSTEM PRE-FEASIBILITY STUDY CITY OF WHITEHORSE, YUKON
ah w:\1182\active\01 active projects\118200105 - city of whitehorse des\180-230-mechanical\05-reports\final_report\2010_03_08\rpt_001_20100308.doc 6.1
6.5.2 Operating Models
Depending on which ownership model is selected, there are a number of possible operating
models, including:
1. Operation by City Staff
2. Operation by a special purpose corporation
3. Out-sourcing to a specialist operating company
It is recommended that the City hold its interest in the energy utility through a corporation.
Therefore alternative 1, operation by City staff, would not apply.
Out-sourcing might be considered, but the primary disadvantage is increased cost through the
introduction of another party who has overhead and must make a profit and pay taxes.
Therefore, operation by a special purpose corporation is recommended.
The design and construction of system components are most efficiently accomplished through
the traditional client-engineer relationship in which the client would be the special purpose
district energy utility. The relatively small scale and ever evolving scope of district energy
projects are not amenable to the design-build approach.
Billing and customer service are sometimes mentioned as suitable functions to outsource.
However, our experience has been that for the relatively small number of bills that are needed,
the district energy utility itself is more competitive than firms that have the overhead in place to
send out thousands of bills.
6.6 FINANCIAL AND OPERATIONAL CONCLUSION
As noted previously, the assumptions are largely conservative; therefore, the results of the
analysis represent a worst case scenario, which can be improved with further study. In
conclusion, this high-level analysis shows that the recommended DES option is financially
viable based on the assumptions made and provided that:
1. The City of Whitehorse and the Yukon government would be willing to pay heating charges
about 6% higher than the total costs of heating they currently incur; it is sufficient for these two
large customers to accept such a rate since the project is viable without any additional
customers as examined through sensitivity analysis; and,
2. The City of Whitehorse is willing to fund the cumulative operating deficit projected to reach
$1,311,000 before cash flow after debt service and sinking fund payments turns positive; it is
recommended that should the project proceed as a City-owned utility, that the City establish a
Rate Stabilization Reserve to fund the projected initial losses and allow for rate stabilization in
later years.

DISTRICT ENERGY SYSTEM PRE-FEASIBILITY STUDY CITY OF WHITEHORSE, YUKON Task 5: Financial Analysis / Projections
March 8, 2010
6.2 ah w:\1182\active\01 active projects\118200105 - city of whitehorse des\180-230-mechanical\05-reports\final_report\2010_03_08\rpt_001_20100308.doc
It should be noted that the possibility of paying a premium has not been reviewed with either the
City of Whitehorse or the Yukon government. Exploring their willingness to do so is
recommended as one of the next steps to be undertaken as part of a follow-on Feasibility Study
as outlined in Section 7.1.2. However, it is expected that with further optimization of various
factors such as which buildings to connect, paying a premium will not be necessary.
In the course of the research on the alternative energy sources, the Consultant became aware
of several local groups interested in establishing a plant to manufacture biomass fuel in the
vicinity of Whitehorse. Such a development would have additional economic benefits to the City
and the Yukon, such as creating green jobs, increasing the City’s tax base, reducing the local
economy’s exposure to volatile international energy markets and retaining the funds currently
spent on purchasing fuel oil in the local economy. The BAU scenario forecasts that the $3
million in fuel charges in 2010 would grow to around $4 million by 2034 in real 2009$. These
potential economic benefits should also be taken into account if the decision is made to pursue
this project further.
It is recommended that the project be operated by a special purpose corporation and that the
design and construction of system components be realized through the traditional client-
engineer relationship in which the client would be the special purpose district energy utility.
DISTRICT ENERGY SYSTEM PRE-FEASIBILITY STUDY CITY OF WHITEHORSE, YUKON Conclusions, Recommendations, and Next Steps
March 8, 2010
ah w:\1182\active\01 active projects\118200105 - city of whitehorse des\180-230-mechanical\05-reports\final_report\2010_03_08\rpt_001_20100308.doc 7.3
7.0 Conclusions, Recommendations, and Next Steps
This section summarizes the conclusions with respect to whether or not a DES system would be
technically and economically viable to implement in Whitehorse; recommendations for a viable
system; and next steps toward establishing a DES in Whitehorse.
7.1 CONCLUSIONS
7.1.1 Technical
The scenarios that were considered for the District Energy System (DES) for the City of
Whitehorse included heat only systems and combined heat and power systems utilizing various
fuels including biomass, heating oil and electricity. Most of the options explored are deemed
technically viable.
The system that appears to represent the best case for the DES is the heat only system utilizing
biomass in the form of wood pucks as the fuel. This scenario was used as the basis for
financial analysis and projections.
7.1.2 Financial
As noted previously, the assumptions are largely conservative; therefore, the results of the
analysis represent a worst case scenario, which can be improved with further study. In
conclusion, this high-level analysis shows that the recommended DES option is financially
viable based on the assumptions made and provided that:
1. The City of Whitehorse and the Yukon government would be willing to pay heating charges
about 6% higher than the total costs of heating they currently incur; it is sufficient for these two
large customers to accept such a rate since the project is viable without any additional
customers as examined through sensitivity analysis; and,
2. The City of Whitehorse is willing to fund the cumulative operating deficit projected to reach
$1,311,000 before cash flow after debt service and sinking fund payments turns positive; it is
recommended that should the project proceed as a City-owned utility, that the City establish a
Rate Stabilization Reserve to fund the projected initial losses and allow for rate stabilization in
later years.
7.1.3 Other
In the course of the research on the alternative energy sources, the Consultant became aware
of several local groups interested in establishing a plant to manufacture biomass fuel in the
vicinity of Whitehorse. Such a development would have additional economic benefits to the City
and the Yukon, such as creating green jobs, increasing the City’s tax base, reducing the local

DISTRICT ENERGY SYSTEM PRE-FEASIBILITY STUDY CITY OF WHITEHORSE, YUKON Conclusions, Recommendations, and Next Steps
March 8, 2010
7.4 ah w:\1182\active\01 active projects\118200105 - city of whitehorse des\180-230-mechanical\05-reports\final_report\2010_03_08\rpt_001_20100308.doc
economy’s exposure to volatile international energy markets and retaining the funds currently
spent on purchasing fuel oil in the local economy. The BAU scenario forecasts that the $3
million in fuel charges in 2010 would grow to around $4 million by 2034 in real 2009$. These
potential economic benefits should also be taken into account if the decision is made to pursue
this project further.
It is recommended that the project be operated by a special purpose corporation and that the
design and construction of system components be realized through the traditional client-
engineer relationship in which the client would be the special purpose district energy utility.
7.2 RECOMMENDATIONS AND NEXT STEPS
7.2.1 Political
Development of a district energy concept will require direction from mayor and council, as well
as ongoing support. Creation of a board of directors comprised of elected official and senior
staff will facilitate accountability of decision making.
7.2.2 Business
Commence discussions with anchor clients such as the hospital, federal and territorial facilities
managers to assess their interest to connect to the District Energy System, as well as
characterize load and discuss potential rate structures.
Explore options for grants and loans to reduce the capital costs of the proposed system,
including the Federation of Canadian Municipalities, Infrastructure Canada, the Yukon
government and gas tax revenue.
Review and confirm the preferred ownership and operating models. Should the City choose to
explore third party involvement, development of a risk and cost sharing formula is required. A
number of private sector organizations are active in partial ownership models, and discussions
with those groups are recommended to understand the implications of outside participation.
Review of the Utilities Commission Act will provide an understanding of the territorial regulations
governing the ownership and operational requirements for a DES in Whitehorse.
7.2.3 Technical
It is recommended that the project proceed to a Feasibility Study in order to refine and confirm
all aspects of this study by going into more detail. In particular, the feasibility study should
address the following:
• Refine present and future estimates of heating energy loads
DISTRICT ENERGY SYSTEM PRE-FEASIBILITY STUDY CITY OF WHITEHORSE, YUKON Conclusions, Recommendations, and Next Steps
March 8, 2010
ah w:\1182\active\01 active projects\118200105 - city of whitehorse des\180-230-mechanical\05-reports\final_report\2010_03_08\rpt_001_20100308.doc 7.5
i. This could be accomplished by gathering more utility data and refining
estimates of potential future expansion, taking into account the impact of
changing energy codes on energy consumption of new development.
ii. Consideration should be given to demand side management (energy
conservation strategies) that might be implemented within existing
building.
iii. To this end, consider expanding the Public Buildings Energy Tracking
System (PBETS) database to include all buildings within the City through
voluntary web-based reporting
• Refine and confirm the most appropriate buildings and zones (with consideration to
connecting some non-YTG/City buildings)
i. To this end, refine the threshold for minimum heating load to make
connection viable, and consider connecting multiple neighboring buildings
with a single energy transfer station (ETS)
• Evaluate potential waste heat sources from buildings and processes
• Refine the required supply and return water temperatures
• The details of how specific buildings will be connected should be explored within a
subsequent feasibility study; for example, buildings without a variable flow operation
may require different control strategies for optimal integration with the DES
• Explore how best to take advantage of the existing plant equipment within buildings that
connect
• Confirm the quantity, cost, as well as current and future availability of a reliable biomass
fuel supply for the project
• Explore the feasibility of a waste to energy (WTE) plant option Using MSW as a
potential future energy source as part of an expanding DES
7.2.4 Financial
Should the project partners be interested in proceeding further with the project, the following
additional actions are recommended from a financial perspective:
• Given the sensitivity to fuel prices, additional research should be carried out on future
trends in fuel oil and biomass pricing for the Whitehorse area.

DISTRICT ENERGY SYSTEM PRE-FEASIBILITY STUDY CITY OF WHITEHORSE, YUKON Conclusions, Recommendations, and Next Steps
March 8, 2010
7.6 ah w:\1182\active\01 active projects\118200105 - city of whitehorse des\180-230-mechanical\05-reports\final_report\2010_03_08\rpt_001_20100308.doc
i. As noted in the sensitivity analysis, fuel oil prices even 10% higher would
dramatically improve financial performance and would give the utility the
ability to lower rates below the equivalent fuel oil costs
• Refine capital costs.
• Explore rate setting in more detail to establish appropriate connection and energy use
charges.
• Explore the possibility of federal grants
• Validate the eligibility of the GHG reductions forecast in the DES scenario for resale as
carbon offsets.
• Explore opportunities to improve the financial performance by negotiating agreements
to sell heat to nearby buildings at reduced rates during off-peak periods, similar to
Yukon Energy’s secondary sales rates for electricity. The objective would be to operate
the DES plant as close to full capacity as possible so as to optimize its output without
requiring additional capital investment to increase its capacity.
• Assess the economic benefits accruing to the City and the Yukon from establishing a
biomass production facility in the vicinity of Whitehorse.
• Determine if City ownership and operation is the preferred option by evaluating
ownership and operating options based on relevant criteria.
• Fully assess the willingness of the City and YG to pay a premium for heat in order to
assure the financial viability of the DES in the early years
7.2.5 Other
Some additional recommendations for next steps include the following:
• Consider getting the community “on board” through educational efforts to explain the
benefits of district energy and specific potential benefits to this community.
• Consider putting voluntary requirements in place to facilitate future connection of new
buildings to a growing DES network across the city

DISTRICT ENERGY SYSTEM PRE-FEASIBILITY STUDY CITY OF WHITEHORSE, YUKON Appendices
March 8, 2010
ah w:\1182\active\01 active projects\118200105 - city of whitehorse des\180-230-mechanical\05-reports\final_report\2010_03_08\rpt_001_20100308.doc 7.7
Appendices

DISTRICT ENERGY SYSTEM PRE-FEASIBILITY STUDY CITY OF WHITEHORSE, YUKON Appendices
March 8, 2010
7.8 ah w:\1182\active\01 active projects\118200105 - city of whitehorse des\180-230-mechanical\05-reports\final_report\2010_03_08\rpt_001_20100308.doc
APPENDIX A – LOAD INTENSITY DATA

DISTRICT ENERGY SYSTEM PRE-FEASIBILITY STUDY CITY OF WHITEHORSE, YUKON Appendices
March 8, 2010
ah w:\1182\active\01 active projects\118200105 - city of whitehorse des\180-230-mechanical\05-reports\final_report\2010_03_08\rpt_001_20100308.doc 7.9
YTG and City Buildings Data
The following screen captures from the interactive tool summarize the buildings that were
considered within each of the 5 zones corresponding to those identified on the Energy Intensity
Map in Appendix C – Heating Energy Intensity Map. The Annual Energy Consumption values
are colour-coded to highlight the most energy intensive buildings (>900 MWh/yr) in red, the next
most intensive (>500 MWh/yr) in orange, and the least energy intensive (<500 MWh/yr) in blue.
At the bottom of each page is a summary of total estimated heating energy consumption within
that zone (including all buildings), the total zone area, and the average heating energy intensity.

DISTRICT ENERGY SYSTEM PRE-FEASIBILITY STUDY CITY OF WHITEHORSE, YUKON Appendices
March 8, 2010
7.10 ah w:\1182\active\01 active projects\118200105 - city of whitehorse des\180-230-mechanical\05-reports\final_report\2010_03_08\rpt_001_20100308.doc
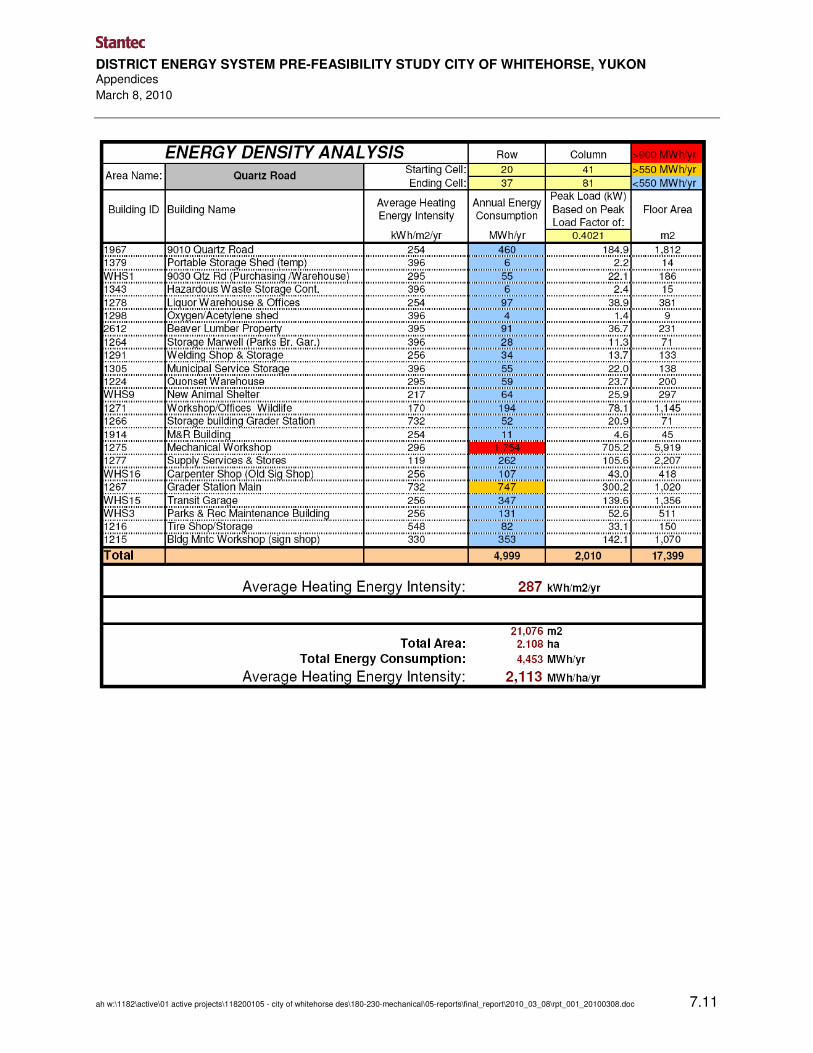
DISTRICT ENERGY SYSTEM PRE-FEASIBILITY STUDY CITY OF WHITEHORSE, YUKON Appendices
March 8, 2010
ah w:\1182\active\01 active projects\118200105 - city of whitehorse des\180-230-mechanical\05-reports\final_report\2010_03_08\rpt_001_20100308.doc 7.11

DISTRICT ENERGY SYSTEM PRE-FEASIBILITY STUDY CITY OF WHITEHORSE, YUKON Appendices
March 8, 2010
7.12 ah w:\1182\active\01 active projects\118200105 - city of whitehorse des\180-230-mechanical\05-reports\final_report\2010_03_08\rpt_001_20100308.doc

DISTRICT ENERGY SYSTEM PRE-FEASIBILITY STUDY CITY OF WHITEHORSE, YUKON Appendices
March 8, 2010
ah w:\1182\active\01 active projects\118200105 - city of whitehorse des\180-230-mechanical\05-reports\final_report\2010_03_08\rpt_001_20100308.doc 7.13

DISTRICT ENERGY SYSTEM PRE-FEASIBILITY STUDY CITY OF WHITEHORSE, YUKON Appendices
March 8, 2010
7.14 ah w:\1182\active\01 active projects\118200105 - city of whitehorse des\180-230-mechanical\05-reports\final_report\2010_03_08\rpt_001_20100308.doc

DISTRICT ENERGY SYSTEM PRE-FEASIBILITY STUDY CITY OF WHITEHORSE, YUKON Appendices
March 8, 2010
ah w:\1182\active\01 active projects\118200105 - city of whitehorse des\180-230-mechanical\05-reports\final_report\2010_03_08\rpt_001_20100308.doc 7.15
Recommended Buildings for DES
Table 19 summarizes the buildings that are recommended for connection to the DES within the
proposed service areas.
Table 19: Summary of Recommended Buildings for Connection to DES
Building Name Area Bldg Owner
DES Zone Existing Thermal Heat
Source28
Existing Heating System
Energy Consum’n Connected to DES
Peak Load
m2 MWh/yr kW
City Hall & Downtown Firehall #1 2,010 CofW Downtown Fuel Oil HW Boilers 734 295
Main Administration Building 13,963 YTG Downtown Fuel Oil HW Boilers 3,740 1,504
Yukon Justice Centre 9,665 YTG Downtown Fuel Oil* HW Boilers* 976 392
Tourism Business Centre/VRC 1,831 YTG Downtown Fuel Oil HW Boilers 596 240
Whitehorse Elementary School 5,913 YTG Downtown Fuel Oil* HW Boilers* 1,340 539
Municipal Services Building 3,783 CofW Downtown Fuel Oil Steam Boilers 872 351
Lynn Building 2,082 YTG Downtown Fuel Oil* HW Boilers* 528 212
Sarah Steele Building 1,208 YTG Downtown Fuel Oil* HW Boilers* 454 183
Prospector Building 1,394 YTG Downtown Fuel Oil* HW Boilers* 354 142
Wood Street Centre 1,991 YTG Downtown Fuel Oil* HW Boilers* 551 222
Thompson Centre 3,801 YTG Hospital Rd Fuel Oil* HW Boilers* 1,213 488
New Whitehorse Hospital 13,011 YTG Hospital Rd Fuel Oil Steam Boilers 7,088 2,850
Education Building 6,244 YTG Hospital Rd Propane HW Boilers 1,362 548
#2 Hospital Road 892 YTG Hospital Rd Fuel Oil* HW Boilers* 489 197
Macaulay Lodge 2,246 YTG Lewes Blvd Fuel Oil* HW Boilers* 1,035 416
Selkirk Elementary School 3,901 YTG
Lewes Blvd Elec & Fuel
Oil HW Boilers 1,053 423
F.H.Collins School 11,346 YTG Lewes Blvd Fuel Oil HW Boilers 4,292 1,726
Christ the King Elem School 3,085 YTG Lewes Blvd Fuel Oil* HW Boilers* 907 365
Vanier Catholic Secondary School 6,959 YTG Lewes Blvd Fuel Oil* HW Boilers* 1,866 750
Gadzoosdaa Residence 934 YTG Lewes Blvd Fuel Oil* HW Boilers* 407 163
Total 96,259 29,856 12,006
28 Fuel oil is assumed as the heating source where unknown, since this was the predominant heating source and in these cases HW boilers were also assumed??.

DISTRICT ENERGY SYSTEM PRE-FEASIBILITY STUDY CITY OF WHITEHORSE, YUKON Appendices
March 8, 2010
7.16 ah w:\1182\active\01 active projects\118200105 - city of whitehorse des\180-230-mechanical\05-reports\final_report\2010_03_08\rpt_001_20100308.doc
APPENDIX B – SITE VISIT SUMMARY

DISTRICT ENERGY SYSTEM PRE-FEASIBILITY STUDY CITY OF WHITEHORSE, YUKON Appendices
March 8, 2010
ah w:\1182\active\01 active projects\118200105 - city of whitehorse des\180-230-mechanical\05-reports\final_report\2010_03_08\rpt_001_20100308.doc 7.17
The following is a list of the buildings visited (in the order they were visited) on Sept 29th, 2009:
1. City Hall & Downtown Firehall #1 2. Municipal Services Building 3. Takhini Arena 4. Canada Games Centre 5. Mount MacIntyre Recreation Centre 6. Elijah Smith Building 7. New Whitehorse General Hospital 8. Yukon College (includes Archives and Art Centre consumption and area) 9. Takhini Elementary School 10. Law Centre 11. Main Administration Building 12. Tourism Business Centre/VRC 13. Education Building 14. F.H.Collins School 15. Whitehorse Elementary 16. Bldg Maintenance Workshop (sign shop)
The following provides a summary of notes from the site visit for the buildings that were visited
and which are included in the recommended buildings. Some of the above buildings were
excluded from the recommended buildings due to incompatibility (steam rather than hot water),
and others because the total annual energy consumption was deemed too small to make
connection worthwhile. Cell without entries were not determined during the site visit.
Table 20: Summary of Site Visit Notes for Buildings Included in DES
Heating Fuel Heat Generation Equipment
Space Htg Loop Temp (Deg C)
Building Name Space DWH Space DWH Supply Return Heat Delivery Equipment Flow Regime
City Hall & Downtown Firehall #1 Oil Elec HW Boilers HW Heater 66 54 HW coils in AHU, radiant panels, radiant bb's Constant
New Whitehorse Hospital
Oil & Elec
Steam boilers, & Elec Boilers 60 50 Glycol and hot water coils Variable
Education Building Propane Elec HW Boilers HW Heater 70 60 HW coils in unit heaters, fan coils units, reheat coils -
Main Administration Building Oil Oil HW Boilers HW Boiler - - HW coils in AHU's, reheat coils, and HW BB's -
Tourism Business Centre/VRC Oil Elec HW Boilers HW Heater - - HW coils in AHU's, perimeter BB's -
F.H.Collins School Oil Elec HW Boilers HW Heater - -
HW coils in AHU's, unit ventilators, radiant panels, radiant bb's -
Municipal Services Building Oil Oil Steam boilers HW Boiler - -
HW coils in AHU's, unit ventilators, radiant panels, radiant bb's Constant

DISTRICT ENERGY SYSTEM PRE-FEASIBILITY STUDY CITY OF WHITEHORSE, YUKON Appendices
March 8, 2010
7.18 ah w:\1182\active\01 active projects\118200105 - city of whitehorse des\180-230-mechanical\05-reports\final_report\2010_03_08\rpt_001_20100308.doc
APPENDIX C – HEATING ENERGY INTENSITY MAPS

DISTRICT ENERGY SYSTEM PRE-FEASIBILITY STUDY CITY OF WHITEHORSE, YUKON Appendices
March 8, 2010
ah w:\1182\active\01 active projects\118200105 - city of whitehorse des\180-230-mechanical\05-reports\final_report\2010_03_08\rpt_001_20100308.doc 7.19
Heating Intensity Maps
Figure 18 is developed using an interactive excel-based tool that was developed for the purpose
of this study. The figure shows a map of the study area overlaid on top of a grid of cells. Each
cell is equivalent to 22 m2 or 0.002 hectares. The approximate location of each building is
denoted by placing the Building ID number in the cell that most closely corresponds to the
building’s location on the overlain map. Each cell that represents a building is also colour-coded
to signify the energy intensity of that individual building. Three colours are used: red for those
that consume more than 900 MWh/year (3,240 GJ/year), orange for those that consume
between 550 and 900 MWh/year (between 1,908 and 3,240 GJ/year), and blue for those that
consume less than 550 MWh/year (1,908 GJ/year).
Figure 19 was developed in order to provide a sense of the heating energy intensity including all
buildings within the core study areas of City of Whitehorse. Figure 19 provides an Energy
Intensity Map for all buildings within the study area. Figure 19 represents an order of magnitude
estimate of energy intensity across most of the developed areas of the city. The intensities are
based on estimated density factors (i.e., building density in square meters of conditioned
building floor area per hectare, m2/ha) and the average HEI value estimated for Whitehorse (273
kWh/m2/year), based on the utility data provided (and correlated by statistical data).

Whitehorse Heating Energy Intensity Analysis
Figure 18: Identifying Buildings and Zones
1307 1361 1281 1346
1351 1387 1258
1234
1355
1356
1318 1222
1208 1340 1226
1221
1366
WHS10
1357 1358 1359 1420 1360 WHS4 1906 1341 1345
1964 1938 1971 1336 1335 1925 1315
1364
1910 1942 1259
1202 1948 1912 1308
1972 1918 1911 1287 1949
1262 1968
1957
1956 1954 1932 1966 1960 1209 1210
1923 1917 1213 1937
1967 1207
WHS8 1936 1386 1958
1379 WHS1 1908
1343 1278 1298 2612 1974 1973 1959 1225
1264 1291 1305 1253 1289
1224 WHS9 1271 1266 1965
1914 1275 1277
WHS16 1267 1219
WHS15
WHS3
1216
1215
1365
1306
1227 1314 1230 1296
1313 1232
1354 1279 1206 1295 1962 1344
1126 1328 1969
1400 1319 1321
WHS14
WHS5
1395 1384 1383 1394 1382 1385 5200 1380 1396
1390
1399
1408 1407 1406
1405 1403 1401
1411 1410 1409
1419 1418 WHS7 1402 1404 1316 whs16 1205 1329 1961 1397 1350
5 80
10 C
LSR
42114
648
73
6487
3
714
55
77871
567
41
6757
6
69477
5922057771
56543 583
49
7559
9
57652
42114
708
57
5715
4 C
LSR
6328
5
429936 48
73
427
32
75
016
7568
3
756
83
CLS
R
6051
5
516
80
58182
63040
64558 CLSR
64558
CL
SR
64558
CLS
R
64558
645
58 C
LSR
70526
71251
78960
6304
0
63040
CLS
R
7558
0 C
LSR
6977
8
CLS
R
69780
4273
2
42716
CLS
R
4271
6 CLS
R
4271
6 C
LSR
77710
7771
0
77710
42993
5 86 81
58681
71454
71081
710
81
6 5140
64873 CLSR
74560
56990
74559
74
559
71454
71454
56990
71454 CLSR
75292
7145 4 CLSR
537
34
5373
4 C
LSR
53734
537
34
76054 CLSR
76054 CLSR
6664
0 C
LSR
719 15 CLSR
62802 CLSR
51680
760
54 CLS
R
53734
53734
78748
83519 CLSR
63040
6051
9 C
LSR
67841 CLSR
52416
42715
85544 CLSR
83850 CLSR
62843
85669 CLSR
85558 CLSR
85587 CLSR
85
85588 C LSR
64873
8558
8
86256 CLSR
87452 CLSR89522 CLSR
3
226 (REM)
GR 5 (804)
BLOCK 312
PARCEL A-1REM
1084
10 5 D/11
11
79
21
wal
kway
27
28
25
24
23
22
19
17
1615
20
18
BLK 278
63A
63B
62A
61A
TAKHINI NORTH SUBDIVISION
TAKHINI EAST SUBDIVISION
ROBERT SERVIC
E SUBD
IVISION
WHIT
EHO
RSE IN
DUSTRIA
L SUBDIV
ISIO
N
WHITE PASS INDUSTR IAL SUBDIVISION
WHITEHORSE DOWNTOWN
HENEY SUBDIVISION
1165
1 05 D/11
BRITISH YUKON RAILWAY
105 D/11
G804
423
( REM
)
G80
4
654
(RE
M)
LAND
523 (REM)
G804
CROWN
423
(REM
)
654
( RE
M)
G80
4
305
A V E N U E
A- 11
654
(R
EM
)
12
1
448
G80
4
150
4
144
143
2
1 4
5
145
1 0
78
9
5
6
7
5
2
3
6
7
69 78
5
A
1
2
3
5
6
7
10
12
13
14
153
E I GH T H
4
L A N E
L A N E
3
1 3
3
5
6
78
9
1 0
1 2
1 3
5
6
8
9
1 0
ESC ARPMENT
18 (REM)
G 5( 804)
152
2
1 4
1 2
151
PARCEL Y
5
79
1 7 ( REM)
G5 (80 4)
12
368
66
3
4
2
1
5
7
8
9
3
2
6
4
3
78
423 (REM)
13
4
56
7
8
4
5
4
5 1
2
1
77
( REM)11
12
1 7
G5( 804 )
15
6
5
4
3
8
9
10
12
7
5
6
1
2
3
4
5
67
8
9
10
1 1
1
29
1 0
S I X T H
S E V E N T H
58
273
56
W O
O D
6
123
2
1 2
A L
E X
A N
D E
R130
B L
A C
K
6
3
2
6
7
4
56
2
4
5
7
140
1
8
7
2
31 2
1 3
1 4 1
4
5
6
80
76
1 0
9
1 1
2
3
7
9
1 0
8
1
2
3 6970
O G
I L V
I E
S E V E N T H
134
1 10
2
1
7
9
1 0
9
6
6
5
13
3
1
2
3
5
1 2
1 1
1 0
8
7
34
5
6
8
6
3
2
1
3
2
1
124
C O
O K
S I X T H
132133
1
141
1
2
4
5
4
56
7
A V E N U E
142
58
7
3
5
6
1 1
1 0
8
7
1 01
2
1 0
99
W H
E E
L E
R
A V E N U E
131
2
R A
Y
S T
.
1
3 2 1
3
1
7 6 5
4
A V E N U E
135
8
9
8
7
12
1 1
10
9
8
11
10
9
8
7
1
2
3
5
6
1
2
3
4
5
6
60
50
4
7
8
9
5
6
2
3
4
5
6
1
2
1 2
1 1
1 0
9
8
7
59
S T
R I
C K
L A
N D
49
12
5
7
1
2
1
211
9
8
7
6
1
2
4
5
6
1 2
11
9
8
7
1
3
7
6
1
S T
R E
E T
8
9
1 1
1 2
S T
R E
E T
F I F T H
122
113 112 111
1
5
6
11
9
8
7
1 1
1 01
2
4
7
5
1
2
3
12
11
1 0
4
5
6
34
1
PAR CEL A
1 4
A V E N U E
A V E N U E
120121
110
5
4
3
2
1
S T
R E
E T
L A
N
E 114
F O U R T H
C
A- 5 ( REM)
A-4 ( REM)
R A
Y
1A
S T
R E
E T
423(REM)
19
G804
3
2
1
4
8
7
5
6
9
10
1 11 2
R O
A DT
1 7
U
S
13141516
ROBERT SERVICE RD.
9
8
7
6
5
4
D
A V E N U E
E 9 .1 L 11
F O U R T H
11
10
14
5
11
1 -1
T H I R D
16
2 0 (R EM)
27
12
2 ( REM)
A V E N U E
3
35
1 3
44
43
ELL
IOTT
5
6
(CL
OS
ED
)
315
10
11
1
6
5
7
1 4
6
5
4
3
1 1
10
9
8
7
2
1
1 0- 1
LANE
1 3(REM)
3 7 36
1 3
7
814
10
11
4
3
2
1
2
3
4
1 38
9
1 0
N11
S11
1 2
47 46
12
F I F T H
45
W6. 1L11
1
A
10
9
8
76
5
4
3
23
32 3134 33
6 33
S T
R E
E T
1 3
G8 04
5
6 7
9
6
1 3
8
9
10
11
12 1
2
3
4
5
6
7
8
9
10
11
12 1
2
3
4
5
6
1 2
1 1
1 0
9
8
7
1 3
6
5
4
310
8
7
N1
2'A
1 3
PA
RC
EL
A(R
EM
)
26 2 5 24
S T
R E
E T
S T
R E
E T
S T
R E
E T
5
91
S E C O N D
5
4
3
9
8
1
2
6
F O U R T H
29
3
4
6
1
2
12
11
10
7
14
7
6
39
15
1
2
1 0
1 2
6
1 1
1
8
7
5
9
J A
R V
I S
38
7A-1
-3
A-1
-2
A-1
-1
9
6 7
4
15
LAN
E
A
A-2
S T
R E
E T
1
1 1
7
13
12
3
14
2
3
5 9
8
5
6
1 3
T H I R D
S T
R E
E T
S T
R E
E T
100 30
1 3
13
7
8
18
10
9
12
11
1 0
93
1 2
3
5
E1/2 L8
40
6
13
A V E N U E
A-3 (REM)
1 2
2
9
1 0
1 1
1
13
12
311
2
7
9
8
3
2 -2
1- 3
62 TT
203 UU
14
2 -1
1
2- 3
3
4
5
7
8
9
1 0
1 2
1
A
17
28
90
6
11
12
5
PAR CEL P
H-1
O
A V E N U E
8
6
1 2
7
W 9.1 4-13
7
8
9
1 0
1 112
14
15
16
17
54
1 2
1 1
1
2
4
5
7
8
99
1 1
12
H-2
L ANE
S E C O N D
10
20 19
2
G8 04
6 REM
316
6
1 4
B
S T
R E
E T
3
310
A V E N U E
8
7
3
2
1
1 1
1 0
9
8
4(R EM)
5
6
1 0
9
8
7 6
5
4 5
4
3 2
1
6
1 3
3
2
1
-2
1 3
12
2
1
1 3
1 0
9
8
7
12
9
8
7 6
5
4
3
13
PUL
1 1
3
15
CON 27
S T
R E
E T
1 2 12
-1
A V E N U E
13 12 11 C
21 F E
1
2
4
1
2
3
4
5
6
12
10
8
1 2
9
2
1
12
18
7
6
5
1 7
16
15
E 1/2 14
W 1/2 14
13
12
8
7
6
1 2 3
15
14
1 3
1 2 11
1 0
9
8
7
6
1 2 3 4 5
W1 0.4L 9
11 -1
11 -2
W1 /2 L10
E1 /2 L10
W 12.5 'L11
11 (REM)
A V E N U E
5 4
15
14
1
G 804
286
733
G8 04
6 01
13 1
7
15
16
17
9
8
7
6
543
15
8
1
4
1 7
1 6
1 5
1 4
1 3
1 2
2 3 4
6
7
8
9
10
1 112
6
13
14
F I R S T
7
21
17
5431 8
6
B
LANE
9
4
S T
R E
E T
L A N
E
5
6
4
911
7( REM)
1 0
S E V E N T H
A-7 -3
PAR
CE
L A
-19
BA
XTE
R
ST
.
F O U
R T H
3
2
1
1 0
3
1 5 98
9
4 (REM)
L A
N E
126
136
A-7 -1
A-7 -2
1 (REM)7
A-6
-1-1
A- 21A- 20
A-6
-2-1
A-6
-2-2
A-6
-1 (R
EM
)
G
T H I R D
A-1 4-1( REM)
A-15
A-13
A- 12
A V E N U E
A-1
4-3
-2 (
RE
M)A-1
4-7
A-1
4-6
A-1
4-5
8 REM
523 (REM)
G804
G804
BLOCK 323
LOT
1
BLO
CK
323
P.U
.L. #1
P.U
.L. #2
BLOCK 322
BLOCK 324
H I L LM I L ET W O
R O A D
BL
OC
K 3
28
BLOCK
327
J A S
P E
R
R O
A D
1145
105 D/11
PUL #2
1144 (REM)
105 D/11
O L
D
T W
O M
I L
E
H I
L L
R O
A D
435-191-3
T W
O
M I
L E
H I L
L R
O A
D
G804
262
PARCEL G
1027
1028
AH7
AH8
9 (REM)
3007
4(R
EM
)
PA
RC
EL D
9
304
5
R O A D
321
4
Q U A R T Z
R A I
L W
A Y
105
D/1
1
5
E A S E M E N T
E A
S E
M E
N T
Q U
A R
T Z
R O A D
10
( RE
M)
G5
RO
AD
115
210
5 D
/14
DRAINAGE RIGHT-OF-WAY
50
263
-2
(REM
)
2
OF
26 3
PA
RC
EL
B
OF
26
3
PA
RC
EL
B
1
263 (REM)
PARCEL C
(REM
)
263 (REM
)
15
14
13
12(R
EM)
PARCEL
A-2
11
(RE
M)
11
10
9
8
6
7
1
2
3
5
4
G80
411
PARC
EL A (R
EM)
PARCEL A (REM)
G804
11
10
PARCEL A
10-A
-1
11-A
-1
12-A
-1
10-
A-2
12-A
-2
12 (REM)
G5(804)
PARCEL B (R
EM) 1
2 G804
BLOCK
298
G804
12
PARCEL A (REM)
RAILWAY
R A I
L W A
Y
(REM)
12
G804
77
78
75 66 67
70
69
64
57
63
6
R6
R4R 3
R5
5
21
PARCEL K (REM)
14
14,
PARC
EL I
CALC
ITE
ROAD
G5
R O A D
41 40 39
22212019
C O P P E R
18
13 12 11
ROAD
10 9
23
8 7
24 25
6
Q U
A R
T Z
15
16 17
14
11D-1
D-2
11
14
PARCE
L J (
REM) PARCEL
E
11 (R
EM)
2
PARCEL B1
RO
AD
47-2
CON
19
62
R O A
D
116
CARIBOU
120
119117
115
79 78 77 76 75
96
95
94939291
8185
8687
88
89
90
MU
SK
RA
T
76
6768697374
80
707172
ROAD
TL
ING
IT
ST
.
61
63
6465 62
53
123-(REM)
12
21
21105 D/1 1
1 0 7 5
1 7
71 72
PARCEL D
1 (REM)
PARCEL D (REM)
13
4589
PLATINUM
13
ROAD
10
11 12
1816
P A R C E L G
GYPSUM ROAD
SIL
VE
R
GR
AN
ITE
RD
.
3536
PARCEL F
PARCEL J
PARCEL I
PARCEL H
33 32
JAD
E S
T.
PA
RC
EL
C
(REM)
PARCEL A
1 3 5 6 8 10
GOLD
RO
AD
2 4 97
24
25
22
15 17 20 21
28
29
30
3123-1
23-2
I N D
U S
T R
I A L
R
O A
D
GALENA
INDU
STR
IAL
ROAD
DRIVE
G804
11
PARCEL B (REM)14
(REM)
13 (REM)
G804
262(REM)
1070
105 D/11
B O U L E V A R D
L E W
E S
R O
A D
105
D/11
1 05 D/11
10
25
1035
242
-9
24
2-1
0
242-4
242
-5
242
-6
242-7
242-8
W I C K S T R O M
1001
1 05 D/11
2 35
H O S P I T A L
R O A
D
309-4
10 5 D/11
1127
G8 04
284
14
DRIVE
NISUTL
IN
BELL
CRESCENT
16
2
8
7
6
5
4
8
16
B A
T E
S C
R E
S.
7
6
5
4
3
1
35
36
13
24
37
38
1
2
3
4
5
6
7
8
3
2
8
34
9
5
G80
4
(PA
RK)
ALS
EK
19
2021
22
23
24
25
26
27
33
1
2
3
4
5
6
32
15
14
13
12
10
18
7
31
1
30
17
1918171615
14
13
12
11
10
9
(PARK)
RO
AD
33
34
35
36
37
38
39
40
14
15
1617 18 19 20
21
22
23
1
2 3
4
5
6
7
8
20
MU NICIPAL RESERVE
19
18
17
16
15
275
BLK
242
28
29
30
31
1
2
3
4
5
6
1
13
12 9
8
7
6
5
43
2
309-3
(REM
)
S E
L K
I R
K S
T R
E E
T
34 0
(R
EM)
G8
04
G804
331
334
34 1
(R
EM
)
G804
F
G804
17
PCL C
17
18
19
20
21
1
PCL D
309-1
350
349
3 (R
EM)
181920212223242526271
2
5
18
BELL CRESCENT
11
P L.
VANGORDA
2
7 7
2 7 6
2 7
4
2 7 8
2 7
9
2 7
9
8
1
317
PARCEL A
342
G804
342
1150
105 D/11
382
G804
BONANZAP L.
590 (REM)
AVENUE
ROADNORMANDY
1064 (REM)
69A
101 1
02 103 10
4
95A
96
97
98
100
A
108
107A
193
124A
123A
120
119
118 11
7A
116A
115A
114
113
112
129A
130A
131
132
134A
135
136
137
138
139
140
141A
142A
143
144
72
71
70
RO
AD
ORTONA
ANTWERP
STREET
125
56 (REM)
64
65
66A
67A
68A
60
59
58
57
NI J
ME
GA
N
195
G80
4
435-
198
Y. T. H I G H W A Y N O 1
12 (REM)
589
509
( RE
M)
G80
4
105 D/11
1108
M O U N T A I N V I E W D R I V E
R O A D R I GH T - O F - W A Y
1
2
3
4
1043
5 4 3 2 1
1044
8
7
6
5
4
3
2
1
CA
MB
RA
I
15
14
1 3
12
11
78
1 0 9
55
1111105 D/11
1110105 D/11
1038-2
1037
1062
435-191-1
435-197
R A N GE
435-199
1063
435-190-3
434 (REM)
G804
1033
105 D/11
435
-200
(R
EM
)
G80
4
435-200 (REM)
G804
PA
RK
WA
LK
WA
Y
OPEN SPACE
B L
O C
K
2 9
5
B L O C K 2 9 6
BLO
CK
297
1058 1057
10555
1056
43
2
1
BLOCK 287
3233
34
G804
G804
RIG
HT
OF
WA
Y
67
4
1
3
4
5
6
7
8
9
10
11
12
13
14
15
16
17
18
19
20
23
24
25
26
27
28
29
30
60
61
62
93
6566
67
68
69
70
LANE
71
72
74
75
77
78
79
80
81
82
85
86
87
88
89
FALA
ISE
PLA
CE
92
91
105 D/11
Road
1118
C O
L L
E G
E
121
120
113
118
115
1101
09
107
99
9 8
9 5
1 17
10310
2
90
87
R O A D R I GH T - O F - W A Y
M O U N T A I N V I E W D R I V E
G804
509
(R
EM
)
ST
RE
ET
R A N GE
R O A D
108
SEWER
LINE
UTILITY R/W
( A L A S K A H I GH W A Y )
PUL 4
RO
AD
RO
AD
1172
105 D/11
1 4
1171
1170
1169
RO
AD
1 5
1 9
82
CO
N 72
2-12
2-3
2-4
2-6
2-2
2-1
2-9
2-11
2-13
2-5
2-1
4
1178
G804
G804
G5
CO
N 5
8
1172
1 8
122A
133A
15-
4
15-3
15-
215
-1
G804
105
D/1
1
6
7
8
910
321
R O
A D
20
19
17
18
21 (
REM
)
G5
1 8
109A
110A
10
5A
99A
9 4A
105 D/11
105 D/11
1 5
G5(804)
321
321
118
3
1185
654 (REM) G804
BLK. 329
ROBER
T SERVI
CE
WAY
12-1
13-1
16-1
15-1
119
CON 4
1 4
1 5
19
A
L ANE
LAN
E
330
Road
331
85
83
86
15
1176-
1
1176
-2
1182-1 1182-2
333
87
1 6
88
ROAD
145
1
89
CON
90
105 D
/14
90
RO
AD
BLO
CK
33
5
15
3
118
0A
16
18
105
D/1
1
13
CO
N 1
07
126
127
1A
2A
RD
. A
ROAD
CON
101
90
106A-1
CON 84
CON 8
C ON 45
CON 42
CON 41
CO
N 39
CON
37
C ON 54
104
CO
N 7
5C
ON
50
CO
N 35
CON 49
CON 47
100
4140
CON 44
CO
N36
CO
N 67
CO
N 31
CON 51CON 63
CO
N 1
06
CO
N 6
C ON 82
CON
113
CON 64
C ON 29
1
CO
N 1
09
CO
N87
1074
105 D
/11
IND
US
TRIA
L
RO
AD
83
84
2
TAKHINI WEST SUBDIVISION
PARK 1
CO
N 1
14
CO
N 1
04
580
10
516
80
12 (
RE
M)
G80
4431
438
105
D/ 1
12
423 (R
EM
)
G80
4
PAR CEL D
314
L A N E
L A N E
2
12
10
1 1
7
10
11
12
N1
/2 L
7
S1/2
L7
3
1 1
D
C
B1-2
14
467
Lot
1 B
l ock
U
92 34
9 CL S
R
1 9
14
14
13
104
9
105
0
1051
654 (RE
M)
G80
4
105
4 (R
EM
)
1147
1148
H O
GE
J E
C K
E L
L
T A
Y L
O R
S
T.
S T
R E
E T
BRIT
ISH
YU
KON
RAIL
WAY
R O
A D
L O
W E
R O
GE
R S
H A
W K
I N
S
DR
UR
Y
S T
.
4
6
3
2
1
8
7
5
L
8558
8 C
LSR
110
7
65
4
3
2
1
7
6
5
4
9
8 3
5
4
2
M
G
PC
L A
PCL
B
N
5
4
6
7
8
3
1
2
A V E N U E
7
6
5
4
3
2
1
2
3
1
6
8
9
10
H
F I F T H
1 0
11
9
8
7
12 -1 12 -2
J
6
5
3
1
2
4
K
O
9
8
6
2
9
8
7
5
4
3
112
11
10
1 0
S I X T H A V E N U E
P9
5
6
8
7
4
3
1
21 1
1 0
1 2
7
8
6
5
3
4
10
1 1 2
41
11 2
319
H A
N S
O N
4
5
6
8
9
3
1
2
10
11
1 2
4 2
7L A
M B
E R
T
A V E N U E
S T
R E
E T
S T
R E
E T
S T
R E
E T
M A
I N
A V E N U E
S T
R E
E T
A V E N U E
E L
L I
O T
T
29
10
3
4
56
7
8
1
65
7
8
2
1
3
4
6
5
9
1 0
1 1
54
3 2
0
A V E N U E
1040
TU
NG
STE
N R
OA
D
RO
AD
91
92939495
96
97
98
99100
101
102
103
104 10
5
106
107
108
109 110
111
11211
3
114
115
116
117
118
11912
0
121
122 1
23
124
130
131
132
133
134
135
136 13
7
138
139
140
128
129
WALK WAY
PU
L 2
PU
L 1
ROAD(TITANIUM WAY)
(TITANIUM WAY)
16(REM)
6796
0
93520 C
LS
R
93520
C
LSR
18
42
125-1
125-2
BLOCK 325 REM
313 REM
Con
do 1
24
40
233 4
LANE 1
RO AD
39
24
25
26 2 7
28
35
3 6
3 7 38
29
30
31 32
33
B RITISH Y UKON RAILWAY
BLK 316
LANE 3
WALKW
AY
LANE 2
5(R
EM)
B L A
N C
H A
R D
C
R E
S.
G8
04244
1212
1210
1209
C R
O W
N L
A N
D
C R
O W
N L
A N
D
C R
O W
N L
A N
D
CO
N12
8
(WATERFRONT PLACE)
CONDO 131
427
-1
BYR R /W
20 ( REM)
5
4
67
8
9
10
1 1
12 1
2
3
22
3
9
8
12
1 1
10
4
5
6
1 2
1 1
1 0
7
13
9
2
1
1 3
4
12
11
10
6
8
7
5
9
3
2
1
4
8
9
1 0
11
7
12
4
5
67
8
9
1 3
55
S T
E E
L E
436
G80
4
27
28
26
25
24
23
22
21
20
19
CON 135
CON 134
B-3
P.U
.L. 18
17
16
BUFFER B2
DIEPPE
VIM
Y
PLA
CE
754
69
BUFFER B1
1
2
3
4
5
6
8
7
PLA
CE
AR
LE
UX
DRIVE
FALAISE ROAD
FALAISE
ROAD ROAD
NORMANDY
43
44
45
46
5051
47
48
49
42
41
40
39
38
3733
34
35
36
32
31
54
S E I N
E S
Q U A R E
55
56
57
58
PUL 1
LAN
E
BU
FF
ER #
1
6664
0 C
LSR
BU
FFE
R #
2
R O A D
PUL #1
114
6105
D/1
1
9 65
60
6162
6 36 4
57
58
55
53
54
52
43 44
49
50
51
42
48
4746
45
PU
L 1
4041
37
38
39
36
35
V A L L E Y V I E W
9 5165 CLSR
9516
4 C
LSR
95164 C
LSR
95164 CLSR
95478 CLSR
332 (REM)
C ON 142
CO
N 1
43
73
LEGEND = Buildings with annual heating > 900 MWh/yr (3,240 GJ/yr) = Buildings with annual heating > 550 MWh/yr (1,980 GJ/yr)
= Buildings with annual heating < 550 MWh/yr (1,980 GJ/yr)
= Buildings included in preferred scenario
= Defines area included within each zone
= Indicates conceptual piping locations
Zone 4: Quartz Road
Zone 5: Range Road
Zone 6: Airport
Zone 3: Downtown Core
Zone 2: Hospital Road
Zone 1: Lewes Blvd

Whitehorse Heating Energy Intensity Analysis
Figure 19: Estimated Heating Energy Intensity (MWh/ha)
1307 1361 1281 1346
1351 1387 1258
1234
1355
1356
1318 1222
1208 1340 1226
1221
1366
WHS10
1357 1358 1359 1420 1360 WHS4 1906 1341 1345
1964 1938 1971 1336 1335 1925 1315
1364
1910 1942 1259
1202 1948 1912 1308
1972 1918 1911 1287 1949
1262 1968
1957
1956 1954 1932 1966 1960 1209 1210
1923 1917 1213 1937
1967 1207
WHS8 1936 1386 1958
1379 WHS1 1908
1343 1278 1298 1974 1973 1959 1225
1264 1291 1305 1253 1289
1224 WHS9 1271 1266
1914 1275 1277
1267 1219
WHS3
1216
1215
1365
1306
1227 1314 1230 1296
1313 1232
1354 1279 1206 1295 1962 1344
1126 1328 1969
1400 1319 1321
WHS14
WHS5
1395 1384 1383 1394 1382 1385 5200 1380 1396
1390
1399
1408 1407 1406
1405 1403 1401
1411 1410 1409
1419 1418 WHS7 1402 1404 1316 whs16 1205 1329 1961 1397 1350
5 80
10 C
LSR
42114
648
73
6487
3
714
55
77871
567
41
6757
6
69477
5922057771
56543 583
49
7559
9
57652
42114
708
57
5715
4 C
LSR
6328
5
429936 48
73
427
32
75
016
7568
3
756
83
CLS
R
6051
55
1680
58182
63040
64558 CLSR
64558
CL
SR
64558
CLS
R
64558
645
58 C
LSR
70526
71251
78960
6304
0
63040
CLS
R
7558
0 C
LSR
6977
8
CLS
R
69780
4273
2
42716
CLS
R
4271
6 CLS
R
4271
6 C
LSR
77710
7771
0
77710
42993
5 86 81
58681
71454
71081
710
81
6 5140
64873 CLSR
74560
56990
74559
74
559
71454
71454
56990
71454 CLSR
75292
7145 4 CLSR
537
34
5373
4 C
LSR
53734
537
34
76054 CLSR
76054 CLSR
6664
0 C
LSR
719 15 CLSR
62802 CLSR
51680
760
54 CLS
R
53734
53734
78748
83519 CLSR
63040
6051
9 C
LSR
67841 CLSR
52416
42715
85544 CLSR
83850 CLSR
62843
85669 CLSR
85558 CLSR
85587 CLSR
85587 CLSR
85588 C LSR
64873
8558
8
86256 CLSR
87452 CLSR89522 CLSR
3
226 (REM)
GR 5 (804)
BLOCK 312
PARCEL A-1REM
1084
10 5 D/11
11
79
21
19
20
BLK 278
63A
63B
62A
61A
TAKHINI NORTH SUBDIVISION
TAKHINI EAST SUBDIVISION
ROBERT SERVIC
E SUBD
IVISION
WHIT
EHO
RSE IN
DUSTRIA
L SUBDIV
ISIO
N
WHITE PASS INDUSTR IAL SUBDIVISION
WHITEHORSE DOWNTOWN
HENEY SUBDIVISION
1165
1 05 D/11
BRITISH YUKON RAILWAY
105 D/11
G804
423
( REM
)
G80
4
654
(RE
M)
LAND
523 (REM)
G804
CROWN
423
(REM
)
654
( RE
M)
G80
4
305
A V E N U E
A- 11
654
(R
EM
)
12
1
448
G80
4
150
4
144
143
2
1 4
5
145
1 0
78
9
5
6
7
5
2
3
6
7
69 78
5
A
1
2
3
5
6
7
10
12
13
14
153
E I GH T H
4
L A N E
L A N E
3
1 3
3
5
6
78
9
1 0
1 2
1 3
5
6
8
9
1 0
ESC ARPMENT
18 (REM)
G 5( 804)
152
2
1 4
1 2
151
PARCEL Y
5
79
1 7 ( REM)
G5 (80 4)
12
368
66
3
4
2
1
5
7
8
9
3
2
6
4
3
78
423 (REM)
13
4
56
7
8
4
5
4
5 1
2
1
77
( REM)11
12
1 7
G5( 804 )
15
6
5
4
3
8
9
10
12
7
5
6
1
2
3
4
5
67
8
9
10
1 1
1
29
1 0
S I X T H
S E V E N T H
58
273
56
W O
O D
6
123
2
1 2
A L
E X
A N
D E
R130
B L
A C
K
6
3
2
6
7
4
56
2
4
5
7
140
1
8
7
2
31 2
1 3
1 4 1
4
5
6
80
76
1 0
9
1 1
2
3
7
9
1 0
8
1
2
3 6970
O G
I L V
I E
S E V E N T H
134
1 10
2
1
7
9
1 0
9
6
6
5
13
3
1
2
3
5
1 2
1 1
1 0
8
7
34
5
6
8
6
3
2
1
3
2
1
124
C O
O K
S I X T H
132133
1
141
1
2
4
5
4
56
7
A V E N U E
142
58
7
3
5
6
1 1
1 0
8
7
1 01
2
1 0
99
W H
E E
L E
R
A V E N U E
131
2
R A
Y
S T
.
1
3 2 1
3
1
7 6 5
4
A V E N U E
135
8
9
8
7
12
1 1
10
9
8
11
10
9
8
7
1
2
3
5
6
1
2
3
4
5
6
60
50
4
7
8
9
5
6
2
3
4
5
6
1
2
1 2
1 1
1 0
9
8
7
59
S T
R I
C K
L A
N D
49
12
5
7
1
2
1
211
9
8
7
6
1
2
4
5
6
1 2
11
9
8
7
1
3
7
6
1
S T
R E
E T
8
9
1 1
1 2
S T
R E
E T
F I F T H
122
113 112 111
1
5
6
11
9
8
7
1 1
1 01
2
4
7
5
1
2
3
12
11
1 0
4
5
6
34
1
PAR CEL A
1 4
A V E N U E
A V E N U E
120121
110
5
4
3
2
1
S T
R E
E T
L A
N
E 114
F O U R T H
C
A- 5 ( REM)
A-4 ( REM)
R A
Y
1A
S T
R E
E T
423(REM)
19
G804
3
2
1
4
8
7
5
6
9
10
1 11 2
R O
A DT
1 7
U
S
13141516
ROBERT SERVICE RD.
9
8
7
6
5
4
D
A V E N U E
E 9 .1 L 11
F O U R T H
11
10
14
5
11
1 -1
T H I R D
16
2 0 (R EM)
27
12
2 ( REM)
A V E N U E
3
35
1 3
44
43
ELL
IOTT
5
6
(CL
OS
ED
)
315
10
11
1
6
5
7
1 4
6
5
4
3
1 1
10
9
8
7
2
1
1 0- 1
LANE
1 3(REM)
3 7 36
1 3
7
814
10
11
4
3
2
1
2
3
4
1 38
9
1 0
N11
S11
1 2
47 46
12
F I F T H
45
W6. 1L11
1
A
10
9
8
76
5
4
3
23
32 3134 33
6 33
S T
R E
E T
1 3
G8 04
5
6 7
9
6
1 3
8
9
10
11
12 1
2
3
4
5
6
7
8
9
10
11
12 1
2
3
4
5
6
1 2
1 1
1 0
9
8
7
1 3
6
5
4
310
8
7
N1
2'A
1 3
PA
RC
EL
A(R
EM
)
26 2 5 24
S T
R E
E T
S T
R E
E T
S T
R E
E T
5
91
S E C O N D
5
4
3
9
8
1
2
6
F O U R T H
29
3
4
6
1
2
12
11
10
7
14
7
6
39
15
1
2
1 0
1 2
6
1 1
1
8
7
5
9
J A
R V
I S
38
7A-1
-3
A-1
-2
A-1
-1
9
6 7
4
15
LAN
E
A
A-2
S T
R E
E T
1
1 1
7
13
12
3
14
2
3
5 9
8
5
6
1 3
T H I R D
S T
R E
E T
S T
R E
E T
100 30
1 3
13
7
8
18
10
9
12
11
1 0
93
1 2
3
5
E1/2 L8
40
6
13
A V E N U E
A-3 (REM)
1 2
2
9
1 0
1 1
1
13
12
311
2
7
9
8
3
2 -2
1- 3
62 TT
203 UU
14
2 -1
1
2- 3
3
4
5
7
8
9
1 0
1 2
1
A
17
28
90
6
11
12
5
PAR CEL P
H-1
O
A V E N U E
8
6
1 2
7
W 9.1 4-13
7
8
9
1 0
1 112
14
15
16
17
54
1 2
1 1
1
2
4
5
7
8
99
1 1
12
H-2
L ANE
S E C O N D
10
20 19
2
G8 04
6 REM
316
6
1 4
B
S T
R E
E T
3
310
A V E N U E
8
7
3
2
1
1 1
1 0
9
8
4(R EM)
5
6
1 0
9
8
7 6
5
4 5
4
3 2
1
6
1 3
3
2
1
-2
1 3
12
2
1
1 3
1 0
9
8
7
12
9
8
7 6
5
4
3
13
PUL
1 1
3
15
CON 27
S T
R E
E T
1 2 12
-1
A V E N U E
13 12 11 C
21 F E
1
2
4
1
2
3
4
5
6
12
10
8
1 2
9
2
1
12
18
7
6
5
1 7
16
15
E 1/2 14
W 1/2 14
13
12
8
7
6
1 2 3
15
14
1 3
1 2 11
1 0
9
8
7
6
1 2 3 4 5
W1 0.4L 9
11 -1
11 -2
W1 /2 L10
E1 /2 L10
W 12.5 'L11
11 (REM)
A V E N U E
5 4
15
14
1
G 804
286
733
G8 04
6 01
13 1
7
15
16
17
9
8
7
6
543
15
8
1
4
1 7
1 6
1 5
1 4
1 3
1 2
2 3 4
6
7
8
9
10
1 112
6
13
14
F I R S T
7
21
17
5431 8
6
B
LANE
9
4
S T
R E
E T
L A N
E
5
6
4
911
7( REM)
1 0
S E V E N T H
A-7 -3
PAR
CE
L A
-19
BA
XTE
R
ST
.
F O U
R T H
3
2
1
1 0
3
1 5 98
9
4 (REM)
L A
N E
126
136
A-7 -1
A-7 -2
1 (REM)7
A-6
-1-1
A- 21A- 20
A-6
-2-1
A-6
-2-2
A-6
-1 (R
EM
)
G
T H I R D
A-1 4-1( REM)
A-15
A-13
A- 12
A V E N U E
A-1
4-3
-2 (
RE
M)A-1
4-7
A-1
4-6
A-1
4-5
8 REM
523 (REM)
G804
G804
BLOCK 323
LOT
1
BLO
CK
323
P.U
.L. #1
P.U
.L. #2
BLOCK 322
BLOCK 324
H I L LM I L ET W O
R O A D
BL
OC
K 3
28
BLOCK
327
J A S
P E
R
R O
A D
1145
105 D/11
PUL #2
1144 (REM)
105 D/11
O L
D
T W
O M
I L
E
H I
L L
R O
A D
435-191-3
T W
O
M I
L E
H I L
L R
O A
D
G804
262
PARCEL G
1027
1028
AH7
AH8
9 (REM)
3007
4(R
EM
)
PA
RC
EL D
9
304
5
R O A D
321
4
Q U A R T Z
R A I
L W
A Y
105
D/1
1
5
E A S E M E N T
E A
S E
M E
N T
Q U
A R
T Z
R O A D
10
( RE
M)
G5
RO
AD
115
210
5 D
/14
DRAINAGE RIGHT-OF-WAY
50
263
-2
(REM
)
2
OF
26 3
PA
RC
EL
B
OF
26
3
PA
RC
EL
B
1
263 (REM)
PARCEL C
(REM
)
263 (REM
)
15
14
13
12(R
EM)
PARCEL
A-2
11
(RE
M)
11
10
9
8
6
7
1
2
3
5
4
G80
411
PARC
EL A (R
EM)
PARCEL A (REM)
G804
11
10
PARCEL A
10-A
-1
11-A
-1
12-A
-1
10-
A-2
12-A
-2
12 (REM)
G5(804)
PARCEL B (R
EM) 1
2 G804
BLOCK
298
G804
12
PARCEL A (REM)
RAILWAY
R A I
L W A
Y
(REM)
12
G804
77
78
75 66 67
70
69
64
57
63
6
R6
R4R 3
R5
5
21
PARCEL K (REM)
14
14,
PARC
EL I
CALC
ITE
ROAD
G5
R O A D
41 40 39
22212019
C O P P E R
18
13 12 11
ROAD
10 9
23
8 7
24 25
6
Q U
A R
T Z
15
16 17
14
11D-1
D-2
11
14
PARCE
L J (
REM) PARCEL
E
11 (R
EM)
2
PARCEL B1
RO
AD
47-2
CON
19
62
R O A
D
116
CARIBOU
120
119117
115
79 78 77 76 75
96
95
94939291
8185
8687
88
89
90
MU
SK
RA
T
76
6768697374
80
707172
ROAD
TL
ING
IT
ST
.
61
63
6465 62
53
123-(REM)
12
21
21
105 D/1 1
1 0 7 5
1 7
71 72
PARCEL D
1 (REM)
PARCEL D (REM)
13
4589
PLATINUM
13
ROAD
10
11 12
1816
P A R C E L G
GYPSUM ROAD
SIL
VE
R
GR
AN
ITE
RD
.
3536
PARCEL F
PARCEL J
PARCEL I
PARCEL H
33 32
JAD
E S
T.
PA
RC
EL
C
(REM)
PARCEL A
1 3 5 6 8 10
GOLD
RO
AD
2 4 97
24
25
22
15 17 20 21
28
29
30
3123-1
23-2
I N D
U S
T R
I A L
R
O A
D
GALENA
INDU
STR
IAL
ROAD
DRIVE
G804
11
PARCEL B (REM)14
(REM)
13 (REM)
G804
262(REM)
1070
105 D/11
B O U L E V A R D
L E W
E S
R O
A D
105
D/11
1 05 D/11
10
25
1035
242
-9
24
2-1
0
242-4
242
-5
242
-6
242-7
242-8
W I C K S T R O M
1001
1 05 D/11
2 35
H O S P I T A L
R O A
D
309-4
10 5 D/11
1127
G8 04
284
32
14
DRIVE
NISUTL
IN
BELL
CRESCENT
16
2
8
7
6
5
4
8
16
B A
T E
S C
R E
S.
7
6
5
4
3
1
35
36
13
24
37
38
1
2
3
4
5
6
7
8
10
11
12
13
14
3
2
8
34
9
15
G80
4
(PA
RK)
ALS
EK
19
2021
22
23
24
25
26
27
33
1
2
3
4
5
6
32
15
14
13
12
10
18
7
31
1
30
17
2 8
0
1918171615
14
13
12
11
10
9
(PAR
K)
(PARK)
RO
AD
BOSW
ELL
22
23
24
25
26
27
19
20
21
30
31
32
33
34
35
36
37
38
39
40
14
15
1617 18 19 20
21
22
23
1
2 3
4
5
6
7
8
9
20
MU NICIPAL RESERVE
19
18
17
16
15
2 8 2
275
BLK
242
2
3
CRESCENT
4
5
6
7
8
28
29
30
31
1
2
3
4
5
6
7
8
9
10
11
12
13
1
13
12 9
8
7
6
5
43
2
4
3
2
1
309-3
(REM
)
S E
L K
I R
K S
T R
E E
T
34 0
(R
EM)
G8
04
G804
331
334
34 1
(R
EM
)
G804
F
G804
17
PCL C
17
18
19
20
21
1
PCL D
309-1
350
349
3 (R
EM)
181920212223242526271
2
5
18
BELL CRESCENT
11
P L.
VANGORDA
2
7 7
2 7 6
2 7
4
2 7 8
2 7
9
2 7
9
2 8
1
2 5 2
317
PARCEL A
342
G804
342
1150
105 D/11
382
G804
BONANZAP L.
590 (REM)
AVENUE
ROADNORMANDY
1064 (REM)
69A
101 1
02 103 10
4
95A
96
97
98
100
A
108
107A
193
124A
123A
120
119
118 11
7A
116A
115A
114
113
112
129A
130A
131
132
134A
135
136
137
138
139
140
141A
142A
143
144
72
71
70
RO
AD
ORTONA
ANTWERP
STREET
125
56 (REM)
64
65
66A
67A
68A
60
59
58
57
NI J
ME
GA
N
195
G80
4
435-
198
Y. T. H I G H W A Y N O 1
12 (REM)
589
509
( RE
M)
G80
4
105 D/11
1108
M O U N T A I N V I E W D R I V E
R O A D R I GH T - O F - W A Y
1
2
3
4
1043
5 4 3 2 1
1044
8
7
6
5
4
3
2
1
CA
MB
RA
I
15
14
1 3
12
11
78
1 0 9
55
1111105 D/11
1110105 D/11
1038-2
1037
1062
435-191-1
435-197
R A N GE
435-199
1063
435-190-3
434 (REM)
G804
1033
105 D/11
435
-200
(R
EM
)
G80
4
435-200 (REM)
G804
PA
RK
WA
LK
WA
Y
OPEN SPACE
B L
O C
K
2 9
5
B L O C K 2 9 6
BLO
CK
297
1058 1057
10555
1056
43
2
1
BLOCK 287
3233
34
G804
G804
RIG
HT
OF
WA
Y
67
4
1
3
4
5
6
7
8
9
10
11
12
13
14
15
16
17
18
19
20
23
24
25
26
27
28
29
30
60
61
62
93
6566
67
68
69
70
LANE
71
72
74
75
77
78
79
80
81
82
85
86
87
88
89
FALA
ISE
PLA
CE
92
91
105 D/11
Road
1118
C O
L L
E G
E
121
120
113
118
115
1101
09
107
99
9 8
9 5
1 17
10310
2
90
87
R O A D R I GH T - O F - W A Y
M O U N T A I N V I E W D R I V E
G804
509
(R
EM
)
ST
RE
ET
R A N GE
R O A D
108
SEWER
LINE
UTILITY R/W
( A L A S K A H I GH W A Y )
PUL 4
RO
AD
RO
AD
1172
105 D/11
1 4
1171
1170
1169
RO
AD
1 5
1 9
82
CO
N 72
2-12
2-3
2-4
2-6
2-2
2-1
2-9
2-11
2-13
2-5
2-1
4
1178
G804
G804
G5
CO
N 5
8
1172
1 8
122A
133A
15-
4
15-3
15-
215
-1
G804
105
D/1
1
6
7
8
910
321
R O
A D
20
19
17
18
21 (
REM
)
G5
1 8
109A
110A
10
5A
99A
9 4A
105 D/11
105 D/11
1 5
G5(804)
321
321
118
3
1185
654 (REM) G804
BLK. 329
ROBER
T SERVI
CE
WAY
12-1
13-1
16-1
15-1
119
CON 4
1 4
1 5
19
A
L ANE
LAN
E
330
Road
331
85
83
86
15
1176-
1
1176
-2
1182-1 1182-2
333
87
1 6
88
ROAD
89
CON
90
90
RO
AD
BLO
CK
33
5
15
3
118
0A
16
18
105
D/1
1
13
CO
N 1
07
126
127
1A
2A
RD
. A
ROAD
CON
101
90
106A-1
CON 84
CON 8
C ON 45
CON 42
CON 41
CO
N 39
CON
37
C ON 54
104
CO
N 7
5C
ON
50
CO
N 35
CON 49
CON 47
100
4140
CON 44
CO
N36
CO
N 67
CO
N 31
CON 51CON 63
CO
N 1
06
CO
N 6
C ON 82
CON
113
CON 64
C ON 29
1
CO
N 1
09
CO
N87
1074
105 D
/11
IND
US
TRIA
L
RO
AD
6
27
28
29
83
84
2
TAKHINI WEST SUBDIVISION
PARK 1
CO
N 1
14
CO
N 1
04
580
10
516
80
12 (
RE
M)
G80
4431
438
105
D/ 1
12
423 (R
EM
)
G80
4
PAR CEL D
314
L A N E
L A N E
2
12
10
1 1
7
10
11
12
N1
/2 L
7
S1/2
L7
3
1 1
D
C
B1-2
14
467
Lot
1 B
l ock
U
92 34
9 CL S
R
1 9
14
14
13
104
9
105
0
1051
654 (RE
M)
G80
4
105
4 (R
EM
)
1147
1148
H O
GE
J E
C K
E L
L
T A
Y L
O R
S
T.
S T
R E
E T
BRIT
ISH
YU
KON
RAIL
WAY
R O
A D
L O
W E
R O
GE
R S
H A
W K
I N
S
DR
UR
Y
S T
.
4
6
3
2
1
8
7
5
L
8558
8 C
LSR
110
7
65
4
3
2
1
7
6
5
4
9
8 3
5
4
2
M
G
PC
L A
PCL
B
N
5
4
6
7
8
3
1
2
A V E N U E
7
6
5
4
3
2
1
2
3
1
6
8
9
10
H
F I F T H
1 0
11
9
8
7
12 -1 12 -2
J
6
5
3
1
2
4
K
O
9
8
6
2
9
8
7
5
4
3
112
11
10
1 0
S I X T H A V E N U E
P9
5
6
8
7
4
3
1
21 1
1 0
1 2
7
8
6
5
3
4
10
1 1 2
41
11 2
319
H A
N S
O N
4
5
6
8
9
3
1
2
10
11
1 2
4 2
7L A
M B
E R
T
A V E N U E
S T
R E
E T
S T
R E
E T
S T
R E
E T
M A
I N
A V E N U E
S T
R E
E T
A V E N U E
E L
L I
O T
T
29
10
3
4
56
7
8
1
65
7
8
2
1
3
4
6
5
9
1 0
1 1
54
3 2
0
A V E N U E
1040
TU
NG
STE
N R
OA
D
RO
AD
91
92939495
96
97
98
99100
101
102
103
104 10
5
106
107
108
109 110
111
11211
3
114
115
116
117
118
11912
0
121
122 1
23
124
130
131
132
133
134
135
136 13
7
138
139
140
128
129
WALK WAYP
UL
2
PU
L 1
ROAD(TITANIUM WAY)
(TITANIUM WAY)
16(REM)
6796
0
93520 C
LS
R
93520
C
LSR
18
42
125-1
125-2
BLOCK 325 REM
313 REM
Con
do 1
24
40
233 4
LANE 1
RO AD
39
24
25
26 2 7
28
35
3 6
3 7 38
29
30
31 32
33
B RITISH Y UKON RAILWAY
BLK 316
LANE 3
WALKW
AY
LANE 2
5(R
EM)
B L A
N C
H A
R D
C
R E
S.
G8
04244
1212
1210
1209
C R
O W
N L
A N
D
C R
O W
N L
A N
D
C R
O W
N L
A N
D
CO
N12
8
(WATERFRONT PLACE)
CONDO 131
427
-1
BYR R /W
20 ( REM)
5
4
67
8
9
10
1 1
12 1
2
3
22
3
9
8
12
1 1
10
4
5
6
1 2
1 1
1 0
7
13
9
2
1
1 3
4
12
11
10
6
8
7
5
9
3
2
1
4
8
9
1 0
11
7
12
4
5
67
8
9
1 3
55
S T
E E
L E
436
G80
4
27
28
26
25
24
23
22
21
20
19
CON 135
CON 134
B-3
P.U
.L. 18
17
16
BUFFER B2
DIEPPE
VIM
Y
PLA
CE
754
69
BUFFER B1
1
2
3
4
5
6
8
7
PLA
CE
AR
LE
UX
DRIVE
FALAISE ROAD
FALAISE
ROAD ROAD
NORMANDY
43
44
45
46
5051
47
48
49
42
41
40
39
38
3733
34
35
36
32
31
54
S E I N
E S
Q U A R E
55
56
57
58
PUL 1
LAN
E
BU
FF
ER #
1
6664
0 C
LSR
BU
FFE
R #
2
R O A D
PUL #1
114
6105
D/1
1
9 65
60
6162
6 36 4
57
58
55
53
54
52
43 44
49
50
51
42
48
4746
45
PU
L 1
4041
37
38
39
36
35
V A L L E Y V I E W
9 5165 CLSR
9516
4 C
LSR
95164 C
LSR
95164 CLSR
95478 CLSR
9 5478 CLSR
102
2 (R
EM
)105 D
/11
332 (REM)
C ON 142
CO
N 1
43
73
LEGEND = Areas with annual HEI > 1,500 MWh/ha = Areas with annual HEI > 1,000 MWh/ha
= Areas with annual HEI < 1,000 MWh/ha
Zone 4: Quartz Road
Zone 5: Range Road Zone 6: Airport
Zone 3: Downtown Core
Zone 2: Hospital Road
Zone 1: Lewes Blvd
DISTRICT ENERGY SYSTEM PRE-FEASIBILITY STUDY CITY OF WHITEHORSE, YUKON Appendices
March 8, 2010
7.22 ah w:\1182\active\01 active projects\118200105 - city of whitehorse des\180-230-mechanical\05-reports\final_report\2010_03_08\rpt_001_20100308.doc
APPENDIX D – ENERGY INPUT DATA

Appendix D
Case: Base and Peak load analysis for areas 3,5,6
Electric - no
generation
Electric - no
generation
wood waste wood pellets wood pucks heating oil propane heating oil propane heating oil propane firm secondary
wood waste wood pellets wood pucks wood waste wood pellets wood pucks
1 2 3 4 5 6 7 8 9 10 11 12 13 14 15 16 17
SYSTEM ANALYSIS
Total load 131526 GJ/y
Base load 111797 GJ/y
Peak load 19729 GJ/y
BASE LOAD ANALYSIS
heat required by the system GJ/y 111797 111797 111797 111797 111797 111797 111797 111797 111797 111797 111797 111797 111797 111797 111797 111797 111797
combustion efficiency % 70% 80% 80% 82% 85% 70% 80% 80% 82% 88% 70% 80% 80% 82% 88% 95% 95%
required heat input in fuel GJ/y 159710 139746 139746 136338 131526 191652 167696 167696 163606 152451 191652 167696 167696 163606 152451 117681 117681
fuel flow
fuel cost $/GJ $19.13 $16.44 $14.26 $22.90 $31.61 $19.13 $16.44 $14.26 $22.90 $31.61 $19.13 $16.44 $14.26 $22.90 $31.61 $29.06 $20.30
$/yr $3,054,777 $2,297,049 $1,992,168 $3,122,320 $4,157,240 $3,665,733 $2,756,459 $2,390,602 $3,746,784 $4,818,619 $3,665,733 $2,756,459 $2,390,602 $3,746,784 $4,818,619 $3,419,811 $2,388,925
electrical output (Note 3) GJ/y 0 0 0 0 0 24428 24428 24428 24428 24428 20571 20571 20571 20571 20571 0 0
electricity sale price (sec) (Note 1) $/GJ $20.30 $20.30 $20.30 $20.30 $20.30 $20.30 $20.30 $20.30 $20.30 $20.30 $0.00 $0.00
Annual electrical sales (sec) $/yr 0 0 0 0 0 $495,856 $495,856 $495,856 $495,856 $495,856 $417,563 $417,563 $417,563 $417,563 $417,563 $0 $0
Annual cost (fuel - elect sales) $/yr $3,054,777 $2,297,049 $1,992,168 $3,122,320 $4,157,240 $3,169,877 $2,260,604 $1,894,746 $3,250,928 $4,322,764 $3,248,170 $2,338,897 $1,973,039 $3,329,221 $4,401,057 $3,419,811 $2,388,925
Capital cost (based on 6 MW sizing) $ $1,770,000 $1,690,000 $1,690,000 $502,000 $502,000 $8,168,000 $7,915,000 $7,915,000 $3,450,000 $3,450,000 $8,000,000 $8,000,000 $8,000,000 $6,500,000 $6,500,000 $3,000,000 $3,000,000
Annual operation cost
Fuel cost (from above) $/yr $3,054,777 $2,297,049 $1,992,168 $3,122,320 $4,157,240 $3,665,733 $2,756,459 $2,390,602 $3,746,784 $4,818,619 $3,665,733 $2,756,459 $2,390,602 $3,746,784 $4,818,619 $3,419,811 $2,388,925
Operation and maintenance (Note 2) $/yr $400,000 $400,000 $400,000 $320,000 $320,000 $400,000 $400,000 $400,000 $320,000 $320,000 $500,000 $500,000 $500,000 $450,000 $450,000 $200,000 $200,000
Financial costs $/yr $171,200 $163,500 $163,500 $48,550 $48,553 $790,000 $765,540 $765,539 $333,700 $333,700 $773,760 $773,760 $773,760 $628,680 $628,680 $290,160 $290,160
income due to electrical sales $/yr $0 $0 $0 $0 $0 $495,856 $495,856 $495,856 $495,856 $495,856 $417,563 $417,563 $417,563 $417,563 $417,563 $0 $0
total annual cost (base load) $/yr $3,625,977 $2,860,549 $2,555,668 $3,490,870 $4,525,794 $4,359,877 $3,426,144 $3,060,285 $3,904,628 $4,976,464 $4,521,930 $3,612,657 $3,246,799 $4,407,901 $5,479,737 $3,909,971 $2,879,085
PEAK LOAD ANALYSIS heating oil heating oil heating oil heating oil heating oil heating oil heating oil heating oil heating oil heating oil heating oil heating oil heating oil heating oil heating oil heating oil heating oil
heat required by the system GJ/y 19729 19729 19729 19729 19729 19729 19729 19729 19729 19729 19729 19729 19729 19729 19729 19729 19729
combustion efficiency % 82% 82% 82% 82% 82% 82% 82% 82% 82% 82% 82% 82% 82% 82% 82% 82% 82%
required heat input in fuel GJ/y 24060 24060 24060 24060 24060 24060 24060 24060 24060 24060 24060 24060 24060 24060 24060 24060 24060
fuel flow
fuel cost $22.90 $22.90 $22.90 $22.90 $22.90 $22.90 $22.90 $22.90 $22.90 $22.90 $22.90 $22.90 $22.90 $22.90 $22.90 $22.90 $22.90
$550,998 $550,998 $550,998 $550,998 $550,998 $550,998 $550,998 $550,998 $550,998 $550,998 $550,998 $550,998 $550,998 $550,998 $550,998 $551,000 $551,000
Capital cost (based on 9 MW sizing) $ $753,000 $753,000 $300,000 $753,000 $753,000 $753,000 $753,000 $753,000 $753,000 $753,000 $753,000 $753,000 $753,000 $753,000 $753,000 $753,000 $753,000
(see calc below)
Annual operation cost (peak)
Fuel cost (from above) $/yr $550,998 $550,998 $550,998 $550,998 $550,998 $550,998 $550,998 $550,998 $550,998 $550,998 $550,998 $550,998 $550,998 $550,998 $550,998 $551,000 $551,000
Operation and maint (Included above) $/yr $0 $0 $0 $0 $0 $0 $0 $0 $0 $0 $0 $0 $0 $0 $0 $0 $0
Financial costs $/yr $72,830 $72,830 $29,016 $72,830 $72,830 $72,830 $72,830 $72,830 $72,830 $72,830 $72,830 $72,830 $72,830 $72,830 $72,830 $72,830 $72,830
total annual cost (peak load) $/yr $623,828 $623,828 $580,014 $623,828 $623,828 $623,828 $623,828 $623,828 $623,828 $623,828 $623,828 $623,828 $623,828 $623,828 $623,828 $623,831 $623,831
TOTAL LOAD ANALYSIS:
total annual cost (base and peak) $/yr $4,249,805 $3,484,377 $3,135,682 $4,114,697 $5,149,621 $4,983,705 $4,049,971 $3,684,113 $4,528,456 $5,600,292 $5,145,758 $4,236,484 $3,870,627 $5,031,729 $6,103,565 $4,533,802 $3,502,916
Rank 9 2 1 7 15 12 6 4 10 16 14 8 5 13 17 11 3
Combustion and steam turbine (condensing)
biomass biomass
least capital, no generation higher capital, higher fuel cost, return from electrical sales,
moderate operational requirements
Combustion Only Co-generation
annual cost of fuel
annual cost of fuel
biomass ORC (thermal oil system)

DISTRICT ENERGY SYSTEM PRE-FEASIBILITY STUDY CITY OF WHITEHORSE, YUKON Appendices
March 8, 2010
ah w:\1182\active\01 active projects\118200105 - city of whitehorse des\180-230-mechanical\05-reports\final_report\2010_03_08\rpt_001_20100308.doc 7.23
APPENDIX E – FINANCIAL PROJECTIONS
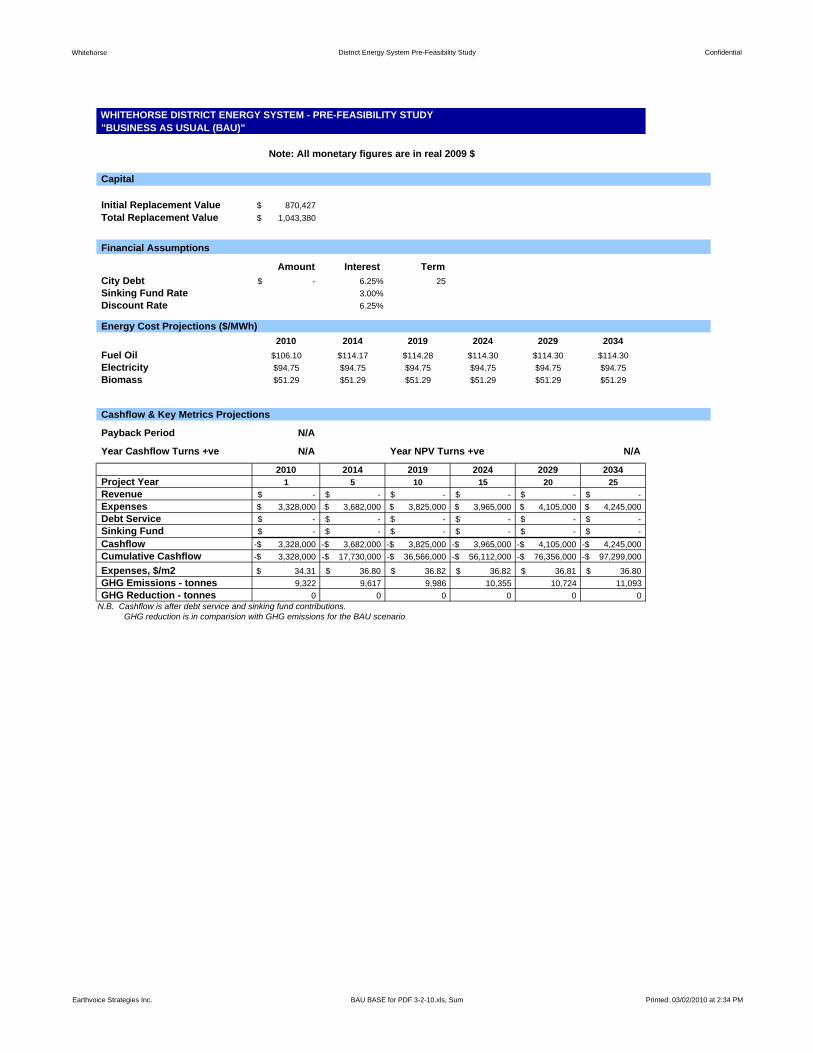
Whitehorse District Energy System Pre-Feasibility Study Confidential
Initial Replacement Value 870,427$ Total Replacement Value 1,043,380$
Amount Interest TermCity Debt -$ 6.25% 25 Sinking Fund Rate 3.00%Discount Rate 6.25%
2010 2014 2019 2024 2029 2034Fuel Oil $106.10 $114.17 $114.28 $114.30 $114.30 $114.30Electricity $94.75 $94.75 $94.75 $94.75 $94.75 $94.75Biomass $51.29 $51.29 $51.29 $51.29 $51.29 $51.29
Cashflow & Key Metrics Projections
Payback Period N/A
Year Cashflow Turns +ve N/A Year NPV Turns +ve N/A
2010 2014 2019 2024 2029 2034Project Year 1 5 10 15 20 25Revenue -$ -$ -$ -$ -$ -$ Expenses 3,328,000$ 3,682,000$ 3,825,000$ 3,965,000$ 4,105,000$ 4,245,000$ Debt Service -$ -$ -$ -$ -$ -$ Sinking Fund -$ -$ -$ -$ -$ -$ Cashflow 3,328,000-$ 3,682,000-$ 3,825,000-$ 3,965,000-$ 4,105,000-$ 4,245,000-$ Cumulative Cashflow 3,328,000-$ 17,730,000-$ 36,566,000-$ 56,112,000-$ 76,356,000-$ 97,299,000-$
Expenses, $/m2 34.31$ 36.80$ 36.82$ 36.82$ 36.81$ 36.80$ GHG Emissions - tonnes 9,322 9,617 9,986 10,355 10,724 11,093GHG Reduction - tonnes 0 0 0 0 0 0
N.B. Cashflow is after debt service and sinking fund contributions. GHG reduction is in comparision with GHG emissions for the BAU scenario
Capital
Financial Assumptions
Energy Cost Projections ($/MWh)
WHITEHORSE DISTRICT ENERGY SYSTEM - PRE-FEASIBILITY STUDY"BUSINESS AS USUAL (BAU)"
Note: All monetary figures are in real 2009 $
Earthvoice Strategies Inc. BAU BASE for PDF 3-2-10.xls, Sum Printed: 03/02/2010 at 2:34 PM

Whitehorse District Energy System Pre-Feasibility Study Confidential
INPUT ASSUMPTIONSred - input parameterblue - input parameter copied from elsewhereblack - calculated value
Parameter Value
Present Year (all $ in real $ for this year unless otherwise noted) 2009Operations Commence - Year 2010
Inflation Rate 2%Escalation Factor - Inflation 1.02
Fuel Oilcommercial price - 2009 $/MWh 84.21escalation factor 2014-2020 1.00escalation factor post 2020 1.00% of energy consumption 100%GST on fuel oil 0.0%sensitivity on fuel oil rate 0.0%GHGs tonnes/MWh 0.3110
Electricitycommercial price - 2009 $/MWh 94.75escalation factor 1.00% of energy consumption 0%GST on electricity 0.0%sensitivity on electricity rate 0.0%GHGs tonnes/MWh 0.0300
Biomasscommercial price 2009 $/MWh 51.29escalation factor 1.000% of energy consumption 0.0%GST on biomass 0.0%sensitivity on biomass rate 0.0%GHGs tonnes/MWh 0.0000
Carbon OffsetsCarbon offset/tonne - 2010 $14Carbon offset escalation factor 1.0526Sensitivity Factor - Carbon Offset 0%
CoWh Cost of Borrowing - nominal 8.25%CoWh Cost of Borrowing - real 6.25%Loan term 25Discount Rate - real 6.25%
Earthvoice Strategies BAU BASE for PDF 3-2-10.xls, Inputs Printed: 03/02/2010 at 2:34 PM
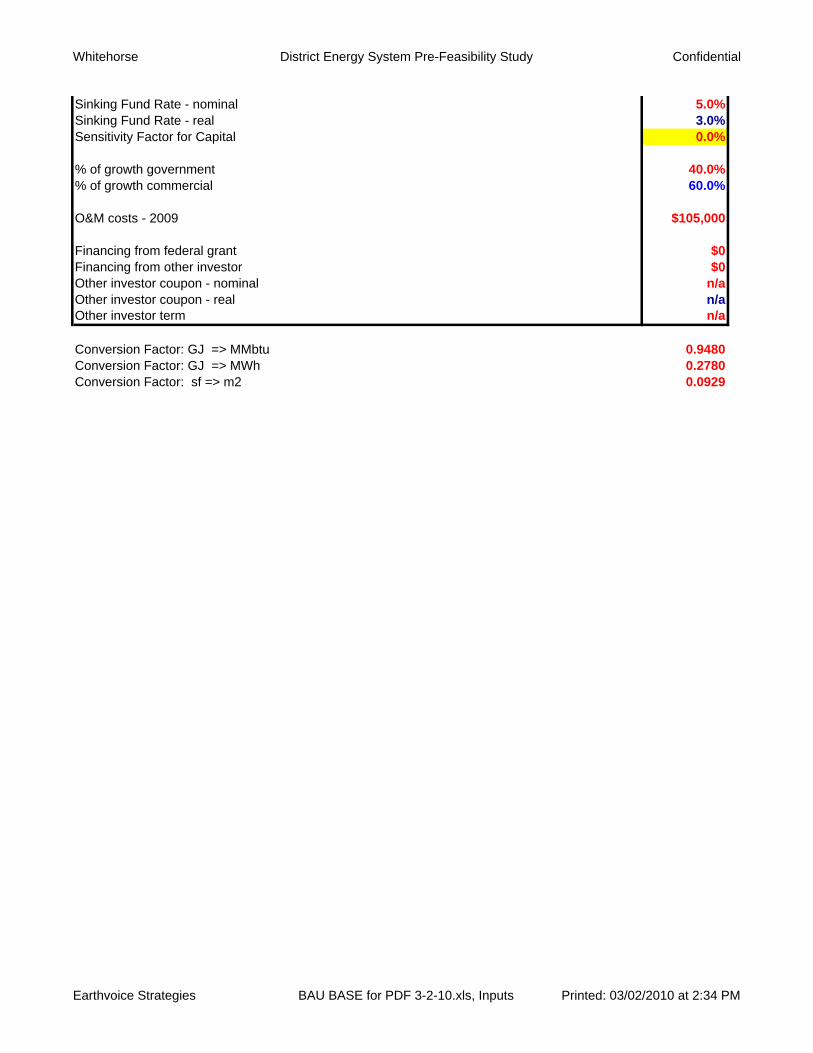
Whitehorse District Energy System Pre-Feasibility Study Confidential
Sinking Fund Rate - nominal 5.0%Sinking Fund Rate - real 3.0%Sensitivity Factor for Capital 0.0%
% of growth government 40.0%% of growth commercial 60.0%
O&M costs - 2009 $105,000
Financing from federal grant $0Financing from other investor $0Other investor coupon - nominal n/aOther investor coupon - real n/aOther investor term n/a
Conversion Factor: GJ => MMbtu 0.9480Conversion Factor: GJ => MWh 0.2780Conversion Factor: sf => m2 0.0929
Earthvoice Strategies BAU BASE for PDF 3-2-10.xls, Inputs Printed: 03/02/2010 at 2:34 PM
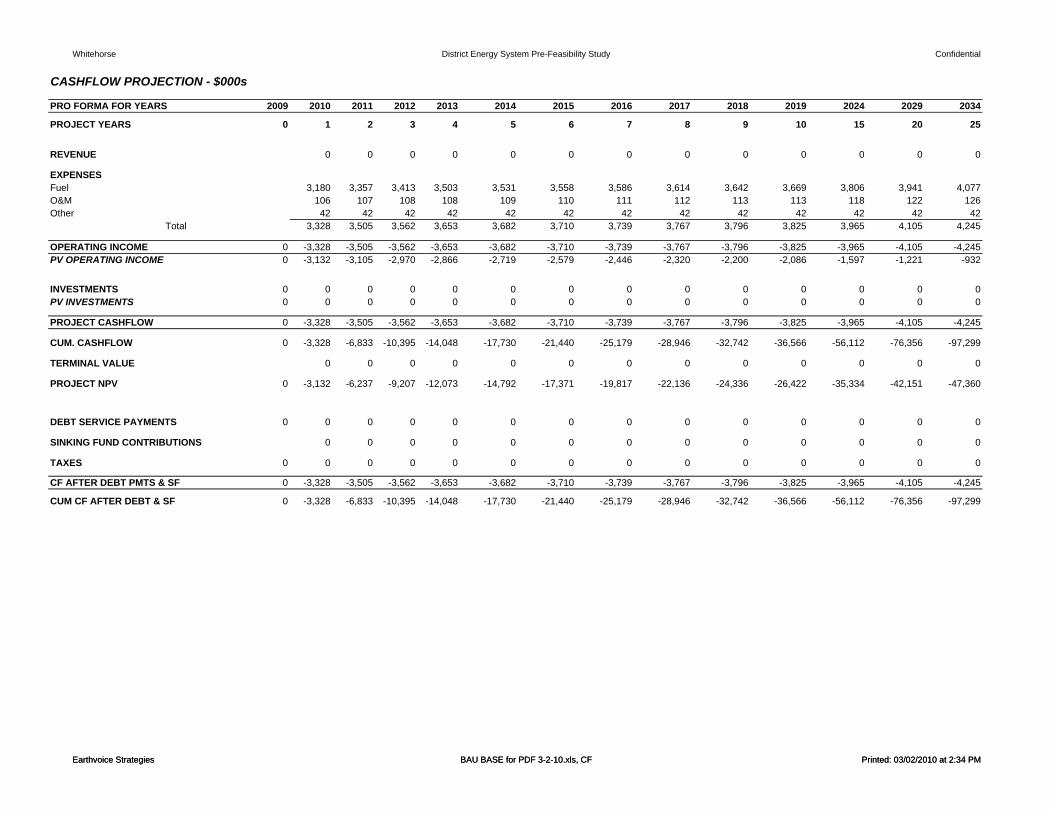
Whitehorse District Energy System Pre-Feasibility Study Confidential
CASHFLOW PROJECTION - $000s
PRO FORMA FOR YEARS 2009 2010 2011 2012 2013 2014 2015 2016 2017 2018 2019 2024 2029 2034
PROJECT YEARS 0 1 2 3 4 5 6 7 8 9 10 15 20 25
REVENUE 0 0 0 0 0 0 0 0 0 0 0 0 0
EXPENSESFuel 3,180 3,357 3,413 3,503 3,531 3,558 3,586 3,614 3,642 3,669 3,806 3,941 4,077O&M 106 107 108 108 109 110 111 112 113 113 118 122 126Other 42 42 42 42 42 42 42 42 42 42 42 42 42
Total 3,328 3,505 3,562 3,653 3,682 3,710 3,739 3,767 3,796 3,825 3,965 4,105 4,245
OPERATING INCOME 0 -3,328 -3,505 -3,562 -3,653 -3,682 -3,710 -3,739 -3,767 -3,796 -3,825 -3,965 -4,105 -4,245PV OPERATING INCOME 0 -3,132 -3,105 -2,970 -2,866 -2,719 -2,579 -2,446 -2,320 -2,200 -2,086 -1,597 -1,221 -932
INVESTMENTS 0 0 0 0 0 0 0 0 0 0 0 0 0 0PV INVESTMENTS 0 0 0 0 0 0 0 0 0 0 0 0 0 0
PROJECT CASHFLOW 0 -3,328 -3,505 -3,562 -3,653 -3,682 -3,710 -3,739 -3,767 -3,796 -3,825 -3,965 -4,105 -4,245
CUM. CASHFLOW 0 -3,328 -6,833 -10,395 -14,048 -17,730 -21,440 -25,179 -28,946 -32,742 -36,566 -56,112 -76,356 -97,299
TERMINAL VALUE 0 0 0 0 0 0 0 0 0 0 0 0 0
PROJECT NPV 0 -3,132 -6,237 -9,207 -12,073 -14,792 -17,371 -19,817 -22,136 -24,336 -26,422 -35,334 -42,151 -47,360
DEBT SERVICE PAYMENTS 0 0 0 0 0 0 0 0 0 0 0 0 0 0
SINKING FUND CONTRIBUTIONS 0 0 0 0 0 0 0 0 0 0 0 0 0
Earthvoice Strategies BAU BASE for PDF 3-2-10.xls, CF Printed: 03/02/2010 at 2:34 PM
TAXES 0 0 0 0 0 0 0 0 0 0 0 0 0 0
CF AFTER DEBT PMTS & SF 0 -3,328 -3,505 -3,562 -3,653 -3,682 -3,710 -3,739 -3,767 -3,796 -3,825 -3,965 -4,105 -4,245
CUM CF AFTER DEBT & SF 0 -3,328 -6,833 -10,395 -14,048 -17,730 -21,440 -25,179 -28,946 -32,742 -36,566 -56,112 -76,356 -97,299
Earthvoice Strategies BAU BASE for PDF 3-2-10.xls, CF Printed: 03/02/2010 at 2:34 PM

Whitehorse District Energy System Pre-Feasibility Study Confidential
REVENUE PROJECTION - real 2009$
REVENUE FOR YEARS 2009 2010 2011 2012 2013 2014 2015 2016 2017 2018 2019 2024 2029 20340 1 2 3 4 5 6 7 8 9 10 15 20 25
Markets
Yukon Government 0 0 0 0 0 0 0 0 0 0 0 0 0
City of Whitehorse 0 0 0 0 0 0 0 0 0 0 0 0 0
Commerical 0 0 0 0 0 0 0 0 0 0 0 0 0
0 0 0 0 0 0 0 0 0 0 0 0 0
Heating Revenue $/year $0 $0 $0 $0 $0 $0 $0 $0 $0 $0 $0 $0 $0
Carbon Offset Revenues
GHGs for BAU - tonnes 9,322 9,396 9,470 9,543 9,617 9,691 9,765 9,839 9,912 9,986 10,355 10,724 11,093
GHGs for this scenario - tonnes 9,322 9,396 9,470 9,543 9,617 9,691 9,765 9,839 9,912 9,986 10,355 10,724 11,093
GHG reduction - tonnes 0 0 0 0 0 0 0 0 0 0 0 0 0
Carbon Offset Revenues $/year $0 $0 $0 $0 $0 $0 $0 $0 $0 $0 $0 $0 $0
Total Revenues
Total System Revenues - $/year 0 0 0 0 0 0 0 0 0 0 0 0 0
Earthvoice Strategies Inc. BAU BASE for PDF 3-2-10.xls, Rev03/02/20102:34 PM Printed: 03/02/2010 at 2:34 PM
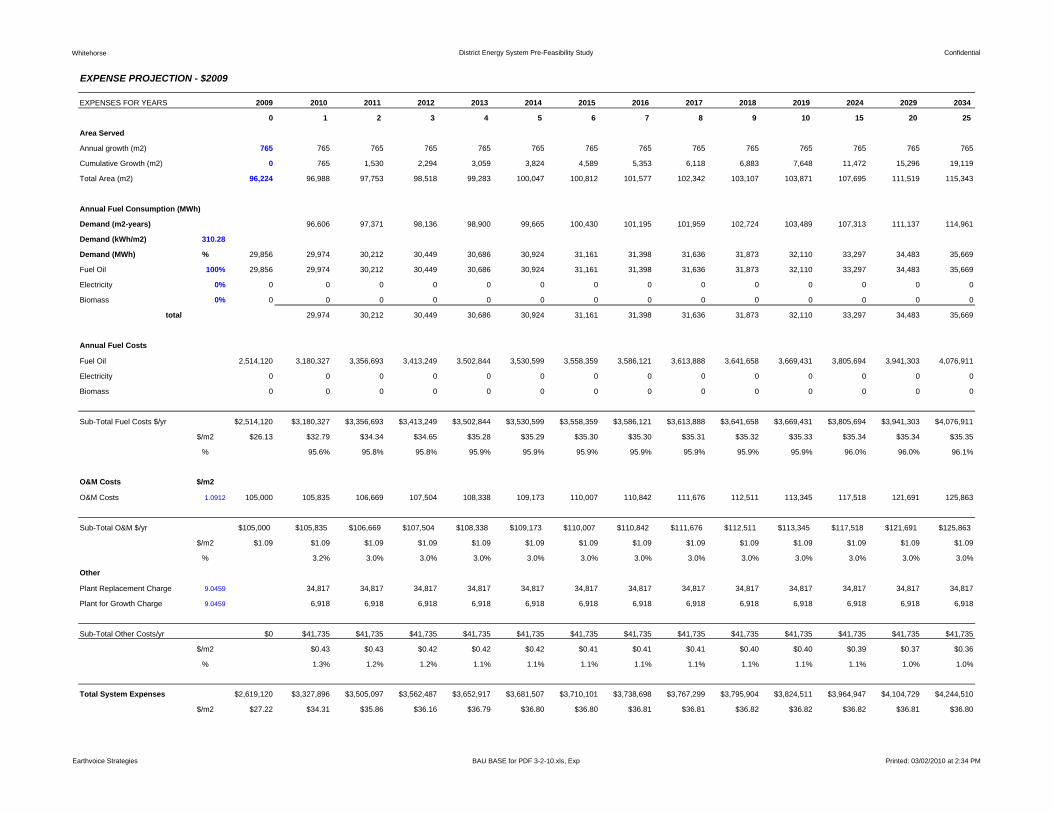
Whitehorse District Energy System Pre-Feasibility Study Confidential
EXPENSE PROJECTION - $2009
EXPENSES FOR YEARS 2009 2010 2011 2012 2013 2014 2015 2016 2017 2018 2019 2024 2029 2034
0 1 2 3 4 5 6 7 8 9 10 15 20 25
Area Served
Annual growth (m2) 765 765 765 765 765 765 765 765 765 765 765 765 765 765
Cumulative Growth (m2) 0 765 1,530 2,294 3,059 3,824 4,589 5,353 6,118 6,883 7,648 11,472 15,296 19,119
Total Area (m2) 96,224 96,988 97,753 98,518 99,283 100,047 100,812 101,577 102,342 103,107 103,871 107,695 111,519 115,343
Annual Fuel Consumption (MWh)
Demand (m2-years) 96,606 97,371 98,136 98,900 99,665 100,430 101,195 101,959 102,724 103,489 107,313 111,137 114,961
Demand (kWh/m2) 310.28
Demand (MWh) % 29,856 29,974 30,212 30,449 30,686 30,924 31,161 31,398 31,636 31,873 32,110 33,297 34,483 35,669
Fuel Oil 100% 29,856 29,974 30,212 30,449 30,686 30,924 31,161 31,398 31,636 31,873 32,110 33,297 34,483 35,669
Electricity 0% 0 0 0 0 0 0 0 0 0 0 0 0 0 0
Biomass 0% 0 0 0 0 0 0 0 0 0 0 0 0 0 0
total 29,974 30,212 30,449 30,686 30,924 31,161 31,398 31,636 31,873 32,110 33,297 34,483 35,669
Annual Fuel Costs
Fuel Oil 2,514,120 3,180,327 3,356,693 3,413,249 3,502,844 3,530,599 3,558,359 3,586,121 3,613,888 3,641,658 3,669,431 3,805,694 3,941,303 4,076,911
Electricity 0 0 0 0 0 0 0 0 0 0 0 0 0 0
Biomass 0 0 0 0 0 0 0 0 0 0 0 0 0 0
Sub-Total Fuel Costs $/yr $2,514,120 $3,180,327 $3,356,693 $3,413,249 $3,502,844 $3,530,599 $3,558,359 $3,586,121 $3,613,888 $3,641,658 $3,669,431 $3,805,694 $3,941,303 $4,076,911
$/m2 $26.13 $32.79 $34.34 $34.65 $35.28 $35.29 $35.30 $35.30 $35.31 $35.32 $35.33 $35.34 $35.34 $35.35
% 95.6% 95.8% 95.8% 95.9% 95.9% 95.9% 95.9% 95.9% 95.9% 95.9% 96.0% 96.0% 96.1%
O&M Costs $/m2
O&M Costs 1.0912 105,000 105,835 106,669 107,504 108,338 109,173 110,007 110,842 111,676 112,511 113,345 117,518 121,691 125,863
Sub-Total O&M $/yr $105,000 $105,835 $106,669 $107,504 $108,338 $109,173 $110,007 $110,842 $111,676 $112,511 $113,345 $117,518 $121,691 $125,863
$/m2 $1.09 $1.09 $1.09 $1.09 $1.09 $1.09 $1.09 $1.09 $1.09 $1.09 $1.09 $1.09 $1.09 $1.09
% 3.2% 3.0% 3.0% 3.0% 3.0% 3.0% 3.0% 3.0% 3.0% 3.0% 3.0% 3.0% 3.0%
Other
Plant Replacement Charge 9.0459 34,817 34,817 34,817 34,817 34,817 34,817 34,817 34,817 34,817 34,817 34,817 34,817 34,817
Plant for Growth Charge 9.0459 6,918 6,918 6,918 6,918 6,918 6,918 6,918 6,918 6,918 6,918 6,918 6,918 6,918
Sub-Total Other Costs/yr $0 $41,735 $41,735 $41,735 $41,735 $41,735 $41,735 $41,735 $41,735 $41,735 $41,735 $41,735 $41,735 $41,735
$/m2 $0.43 $0.43 $0.42 $0.42 $0.42 $0.41 $0.41 $0.41 $0.40 $0.40 $0.39 $0.37 $0.36
% 1.3% 1.2% 1.2% 1.1% 1.1% 1.1% 1.1% 1.1% 1.1% 1.1% 1.1% 1.0% 1.0%
Total System Expenses $2,619,120 $3,327,896 $3,505,097 $3,562,487 $3,652,917 $3,681,507 $3,710,101 $3,738,698 $3,767,299 $3,795,904 $3,824,511 $3,964,947 $4,104,729 $4,244,510
$/m2 $27.22 $34.31 $35.86 $36.16 $36.79 $36.80 $36.80 $36.81 $36.81 $36.82 $36.82 $36.82 $36.81 $36.80
Earthvoice Strategies BAU BASE for PDF 3-2-10.xls, Exp Printed: 03/02/2010 at 2:34 PM

Whitehorse District Energy System Pre-Feasibility Study Confidential
GHG Emissions
Fuel Oil 9,322 9,396 9,470 9,543 9,617 9,691 9,765 9,839 9,912 9,986 10,355 10,724 11,093
Electricity 0 0 0 0 0 0 0 0 0 0 0 0 0
Biomass 0 0 0 0 0 0 0 0 0 0 0 0 0
9,322 9,396 9,470 9,543 9,617 9,691 9,765 9,839 9,912 9,986 10,355 10,724 11,093
Earthvoice Strategies BAU BASE for PDF 3-2-10.xls, Exp Printed: 03/02/2010 at 2:34 PM

Whitehorse District Energy System Pre-Feasibility Study Confidential
PROJECT CAPITAL AND FINANCINGOUTLAYS FOR YEARS 2007 2008 2009 2010 2011 2012 2013 2014 2015 2016 2017 2018 2019 2024 2029 2034Year of First Outlay -2 -1 0 1 2 3 4 5 6 7 8 9 10 15 20 25
PROJECT CAPITAL:
Total Capital Cost 0 0 0 0 0 0 0 0 0 0 0 0 0 0 0Cum Total Capital Cost 0 0 0 0 0 0 0 0 0 0 0 0 0 0 0 0Assets at Cost 0 0 0 0 0 0 0 0 0 0 0 0 0Cumulative Depreciation 0 0 0 0 0 0 0 0 0 0 0 0 0Book Value 0 0 0 0 0 0 0 0 0 0 0 0 0
SOURCES OF FINANCING: FundingFederal Grant 0Other Investor n/a 0City Debt 6.25% 0
0
CAPITAL SCHEDULE2007 2008 2009 2010 2011 2012 2013 2014 2015 2016 2017 2018 2019 2024 2029 2034
-2 -1 0 1 2 3 4 5 6 7 8 9 10 15 20 25Equipment Total Cost Lifetime Year in Service
25 1 0 - - - - - - - - - - - - 0
Total 0 0 0 0 0 0 0 0 0 0 0 0 0 0 0
DEPRECIATION SCHEDULE
Equipment Total Cost Lifetime Service Starts Service Ends
0 0 25 1 25 0 0 0 0 0 0 0 0 0 0 0 0 0
Total Cost 0 check Annual Depreciation 0 0 0 0 0 0 0 0 0 0 0 0 0Cumulative Depreciation 0 0 0 0 0 0 0 0 0 0 0 0 0
SENSITIVITY ON CAPITAL 0%
Earthvoice Strategies BAU BASE for PDF 3-2-10.xls, C&F Printed: 03/02/2010 at 2:34 PM

Whitehorse District Energy System Pre-Feasibility Study Confidential
ENERGY COST PROJECTION - REAL 2009 $
PRICING FOR YEARS 2009 2010 2011 2012 2013 2014 2015 2016 2017 2018 2019 2020 2021 2022 2023 2024 2029 2034
0 1 2 3 4 5 6 7 8 9 10 11 12 13 14 15 20 25
Fuel Oil
sensitivity
Commodity price/MWh 0.0% 84.21 106.10 111.11 112.10 114.15 114.17 114.19 114.21 114.24 114.26 114.28 114.30 114.30 114.30 114.30 114.30 114.30 114.30
GST 0.00% 0.00 0.00 0.00 0.00 0.00 0.00 0.00 0.00 0.00 0.00 0.00 0.00 0.00 0.00 0.00 0.00 0.00 0.00
Fuel Oil Cost $/MWh 84.21 106.10 111.11 112.10 114.15 114.17 114.19 114.21 114.24 114.26 114.28 114.30 114.30 114.30 114.30 114.30 114.30 114.30
$/GJ 23.41 29.50 30.89 31.16 31.73 31.74 31.75 31.75 31.76 31.76 31.77 31.77 31.77 31.77 31.77 31.77 31.77 31.77
Electricity
sensitivity
Commodity price/MWh 0.0% 94.75 94.75 94.75 94.75 94.75 94.75 94.75 94.75 94.75 94.75 94.75 94.75 94.75 94.75 94.75 94.75 94.75 94.75
GST 0.00% 0.00 0.00 0.00 0.00 0.00 0.00 0.00 0.00 0.00 0.00 0.00 0.00 0.00 0.00 0.00 0.00 0.00 0.00
Electricity Cost $/MWh 94.75 94.75 94.75 94.75 94.75 94.75 94.75 94.75 94.75 94.75 94.75 94.75 94.75 94.75 94.75 94.75 94.75 94.75
$/GJ 26.34 26.34 26.34 26.34 26.34 26.34 26.34 26.34 26.34 26.34 26.34 26.34 26.34 26.34 26.34 26.34 26.34 26.34
Biomass
sensitivity
Commodity price/MWh 0.0% 51.29 51.29 51.29 51.29 51.29 51.29 51.29 51.29 51.29 51.29 51.29 51.29 51.29 51.29 51.29 51.29 51.29 51.29
GST 0.00% 0.00 0.00 0.00 0.00 0.00 0.00 0.00 0.00 0.00 0.00 0.00 0.00 0.00 0.00 0.00 0.00 0.00 0.00
Biomass Cost $/MWh 51.29 51.29 51.29 51.29 51.29 51.29 51.29 51.29 51.29 51.29 51.29 51.29 51.29 51.29 51.29 51.29 51.29 51.29
$/GJ 14.26 14.26 14.26 14.26 14.26 14.26 14.26 14.26 14.26 14.26 14.26 14.26 14.26 14.26 14.26 14.26 14.26 14.26
Carbon Offsets sensitivity 2010 value
Carbon offset/tonne 0.0% 14.00 14 00 14 74 15 51 16 33 17 18 18 09 19 04 20 04 21 09 22 20 23 37 24 59 25 89 27 25 28 68 37 05 47 87Carbon offset/tonne 0.0% 14.00 14.00 14.74 15.51 16.33 17.18 18.09 19.04 20.04 21.09 22.20 23.37 24.59 25.89 27.25 28.68 37.05 47.87
Earthvoice Strategies BAU BASE for PDF 3-2-10.xls, Energy Printed: 03/02/2010 at 2:34 PM

Whitehorse District Energy System Pre-Feasibility Study Confidential
Initial Capital Cost 18,395,443$ Total Capital Cost 21,477,217$
2010 2014 2019 2024 2029 2034Fuel Oil $103.79 $111.68 $111.79 $111.81 $111.81 $111.81Electricity $94.75 $94.75 $94.75 $94.75 $94.75 $94.75Biomass $51.29 $51.29 $51.29 $51.29 $51.29 $51.29DES Energy Charge $151.57 $163.10 $163.25 $163.28 $163.28 $163.28Carbon Offsets ($/tonne) $14.00 $17.18 $22.20 $28.68 $37.05 $47.87Model Growth yesMonetize Carbon Offsets yes DES/BAU total heating costPremium for Energy Sales 10% ratio, year 25 106.0%
Cashflow & Key Metrics Projections
Payback Period, years 12 IRR, year 25 7.3%
Year Cashflow Turns +ve 4 Year Cum. Cashflow Turns +ve 17
Max Cumulative Deficit -$1,311,000 Year NPV Turns +ve 13
2010 2014 2019 2024 2029 2034Project Year 1 5 10 15 20 25Revenue 1,812,000$ 4,026,000$ 4,227,000$ 4,441,000$ 4,677,000$ 4,941,000$ Expenses 1,365,000$ 2,298,000$ 2,386,000$ 2,475,000$ 2,563,000$ 2,651,000$ Debt Service 1,150,000$ 1,150,000$ 1,193,000$ 1,237,000$ 1,311,000$ 1,355,000$ Sinking Fund 505,000$ 505,000$ 524,000$ 543,000$ 575,000$ 595,000$ Cashflow 1,207,000-$ 74,000$ 124,000$ 188,000$ 227,000$ 340,000$ Cum. Cashflow 1,207,000-$ 1,185,000-$ 799,000-$ 123,000-$ 704,000$ 2,037,000$ NPV 1,232,000-$ 1,260,000-$ 544,000-$ 563,000$ 1,770,000$ 3,054,000$ ROIC -0.9% 6.1% 6.3% 6.6% 6.8% 7.3%
Expenses, $/m2 28.16$ 23.06$ 23.06$ 23.06$ 23.06$ 23.06$ GHG Emissions - tonnes 5,302 1,355 1,407 1,459 1,511 1,563GHG Reduction - tonnes 4,020 8,263 8,580 8,897 9,214 9,531
N B Cashflo is after debt ser ice and sinking f nd contrib tions
Capital
Rate Projections ($/MWh)
WHITEHORSE DISTRICT ENERGY SYSTEM - PRE-FEASIBILITY STUDY"DISTRICT ENERGY SYSTEM (DES)"
Note: All monetary figures are in real 2009 $
Earthvoice Strategies Inc. DES BASE for PDF 3-2-10.xls, Sum Printed: 03/02/2010 at 2:40 PM
N.B. Cashflow is after debt service and sinking fund contributions. ROIC or Return on Invested Capital = EBIT * (1 - tax rate) / (interest bearing debt + equity) GHG reduction is in comparision with GHG emissions for the BAU scenario
Earthvoice Strategies Inc. DES BASE for PDF 3-2-10.xls, Sum Printed: 03/02/2010 at 2:40 PM

Whitehorse District Energy System Pre-Feasibility Study Confidential
INPUT ASSUMPTIONSred - input parameterblue - input parameter copied from elsewhereblack - calculated value
Parameter Value
Present Year (all $ in real $ for this year unless otherwise noted) 2009Operations Commence - Year 2010
Inflation Rate 2%Escalation Factor - Inflation 1.02
Fuel Oilwholesale price - 2009 $/MWh 82.37commercial price - 2009 $/MWh 84.21escalation factor post 2014-20 1.000escalation factor post 2020 1.000% of energy consumption 15%GST on fuel oil 0.0%sensitivity on fuel oil rate 0.0%GHGs tonnes/MWh 0.3110premium for energy sales 10%
Electricitycommercial price - 2009 $/MWh 94.75escalation factor 1.00energy consumption at buildout (MWh) 1,033GST on electricity 0.0%sensitivity on electricity rate 0.0%GHGs tonnes/MWh 0.0300
Biomasscommercial price 2009 $/MWh 51.29escalation factor 1.000% of energy consumption 85.0%GST on biomass 0.0%sensitivity on biomass rate 0.0%GHGs tonnes/MWh 0.0000
Carbon OffsetsCarbon offset/tonne - 2010 $14Carbon offset escalation factor 1.0526Sensitivity Factor - Carbon Offset 0%Monetize Carbon Reduction (yes/no) yes
Insurance, $/$1000 insured $1.50Fuel Oil Boiler Efficiency 77%
Earthvoice Strategies DES BASE for PDF 3-2-10.xls, Inputs Printed: 03/02/2010 at 2:40 PM

Whitehorse District Energy System Pre-Feasibility Study Confidential
DES Efficiency 82%
CoWh Cost of Borrowing - nominal 8.25%CoWh Cost of Borrowing - real 6.25%Loan term 25Discount Rate - real 6.25%Sinking Fund Rate - nominal 5.0%Sinking Fund Rate - real 3.0%Sensitivity Factor for Capital 0.0%
Model growth (yes/no) yes% of growth government 40.0%% of growth commercial 60.0%
O&M costs - 2009 $400,000
Financing from federal grant $0Financing from other investor $0Other investor coupon - nominal n/aOther investor coupon - real n/aOther investor term n/a
Conversion Factor: GJ => MMbtu 0.9480Conversion Factor: GJ => MWh 0.2780Conversion Factor: sf => m2 0.0929
Earthvoice Strategies DES BASE for PDF 3-2-10.xls, Inputs Printed: 03/02/2010 at 2:40 PM

Whitehorse District Energy System Pre-Feasibility Study Confidential
CASHFLOW PROJECTION - $000s
PRO FORMA FOR YEARS 2009 2010 2011 2012 2013 2014 2015 2016 2017 2018 2019 2024 2029 2034
PROJECT YEARS 0 1 2 3 4 5 6 7 8 9 10 15 20 25
REVENUEHeating 1,756 3,692 3,755 3,853 3,884 3,914 3,945 3,975 4,006 4,036 4,186 4,335 4,485Carbon Offsets 56 119 126 134 142 151 160 169 180 190 255 341 456
Total 1,812 3,811 3,881 3,987 4,026 4,065 4,104 4,145 4,185 4,227 4,441 4,677 4,941
EXPENSESFuel 935 1,799 1,817 1,840 1,854 1,869 1,883 1,897 1,912 1,926 1,997 2,068 2,139O&M 431 434 437 440 443 448 451 454 457 460 477 495 512
Total 1,365 2,233 2,254 2,280 2,298 2,316 2,334 2,351 2,369 2,386 2,475 2,563 2,651
OPERATING INCOME 0 447 1,578 1,626 1,707 1,728 1,748 1,771 1,793 1,817 1,841 1,967 2,113 2,289PV OPERATING INCOME 0 421 1,398 1,356 1,339 1,276 1,215 1,158 1,104 1,053 1,004 792 629 503
DEPRECIATION 607 607 607 607 607 630 630 630 630 630 653 693 716EBIT -160 972 1,020 1,100 1,121 1,119 1,141 1,164 1,187 1,211 1,314 1,421 1,573
INVESTMENTS 18,395 0 0 0 0 695 0 0 0 0 695 1,195 695 0PV INVESTMENTS 18,395 0 0 0 0 514 0 0 0 0 379 481 207 0
PROJECT CASHFLOW -18,395 447 1,578 1,626 1,707 1,032 1,748 1,771 1,793 1,817 1,145 771 1,418 2,289
CUM. CASHFLOW -18,395 -17,948 -16,370 -14,744 -13,037 -12,004 -10,256 -8,485 -6,692 -4,875 -3,730 4,648 14,213 25,293
TERMINAL VALUE 16,743 15,220 13,819 12,531 11,859 10,724 9,681 8,724 7,846 7,420 4,647 2,608 1,140
PROJECT NPV -18 395 -1 232 -1 356 -1 401 -1 351 -1 260 -1 180 -1 064 -917 -743 -544 563 1 770 3 054
Earthvoice Strategies DES BASE for PDF 3-2-10.xls, CF Printed: 03/02/2010 at 2:40 PM
PROJECT NPV -18,395 -1,232 -1,356 -1,401 -1,351 -1,260 -1,180 -1,064 -917 -743 -544 563 1,770 3,054
CASHFLOW + YR 25 TERMINAL VALUE -18,395 447 1,578 1,626 1,707 1,032 1,748 1,771 1,793 1,817 1,145 771 1,418 3,429
IRR, YEAR 25 7.3%
ROIC -0.9% 5.3% 5.5% 6.0% 6.1% 5.9% 6.0% 6.1% 6.2% 6.3% 6.6% 6.8% 7.3%
DEBT SERVICE PAYMENTS 0 1,150 1,150 1,150 1,150 1,150 1,193 1,193 1,193 1,193 1,193 1,237 1,311 1,355
SINKING FUND CONTRIBUTIONS 505 505 505 505 505 524 524 524 524 524 543 575 595
TAXES 0 0 0 0 0 0 0 0 0 0 0 0 0 0
CF AFTER DEBT PMTS & SF 0 -1,207 -76 -28 52 74 32 54 77 100 124 188 227 340
CUM CF AFTER DEBT & SF 0 -1,207 -1,283 -1,311 -1,258 -1,185 -1,153 -1,099 -1,023 -923 -799 -123 704 2,037
Earthvoice Strategies DES BASE for PDF 3-2-10.xls, CF Printed: 03/02/2010 at 2:40 PM

Whitehorse District Energy System Pre-Feasibility Study Confidential
REVENUE PROJECTION - real 2009$
REVENUE FOR YEARS 2009 2010 2011 2012 2013 2014 2015 2016 2017 2018 2019 2024 2029 20340 1 2 3 4 5 6 7 8 9 10 15 20 25
Markets
Area (m2) 96,988 97,753 98,518 99,283 100,047 100,812 101,577 102,342 103,107 103,871 107,695 111,519 115,343
Demand (MWh)
Demand (m2-years) 48,494 97,371 98,136 98,900 99,665 100,430 101,195 101,959 102,724 103,489 107,313 111,137 114,961
Demand (kWh/m2) 238.91 11,586 23,263 23,446 23,629 23,811 23,994 24,177 24,359 24,542 24,725 25,638 26,552 27,466
Pricing premium
rate parity factor 1.30
DES customers $/MWh 10% 151.57 158.72 160.14 163.07 163.10 163.13 163.16 163.19 163.22 163.25 163.28 163.28 163.28
Customer Revenues
Heating Revenue $/year $1,756,103 $3,692,362 $3,754,573 $3,853,128 $3,883,659 $3,914,194 $3,944,734 $3,975,277 $4,005,823 $4,036,374 $4,186,264 $4,335,433 $4,484,603
Customer Costs $/m2 $36.21 $37.92 $38.26 $38.96 $38.97 $38.97 $38.98 $38.99 $39.00 $39.00 $39.01 $39.01 $39.01
Carbon Offset Revenues
GHGs for BAU - tonnes 9,322 9,396 9,470 9,543 9,617 9,691 9,765 9,839 9,912 9,986 10,355 10,724 11,093
GHGs for this scenario - tonnes 5,302 1,323 1,334 1,344 1,355 1,365 1,375 1,386 1,396 1,407 1,459 1,511 1,563
GHG reduction - tonnes 4,020 8,072 8,136 8,199 8,263 8,326 8,389 8,453 8,516 8,580 8,897 9,214 9,531
Carbon Offset Revenues $/year yes $56,285 $118,954 $126,190 $133,857 $141,982 $150,591 $159,714 $169,379 $179,618 $190,467 $255,159 $341,390 $456,222
Total Revenues
Total System Revenues - $/year $1,812,388 $3,811,316 $3,880,763 $3,986,985 $4,025,641 $4,064,786 $4,104,447 $4,144,655 $4,185,442 $4,226,841 $4,441,422 $4,676,823 $4,940,825
Earthvoice Strategies Inc. DES BASE for PDF 3-2-10.xls, Rev03/02/20102:40 PM Printed: 03/02/2010 at 2:40 PM

Whitehorse District Energy System Pre-Feasibility Study Confidential
EXPENSE PROJECTION - $2009
EXPENSES FOR YEARS 2009 2010 2011 2012 2013 2014 2015 2016 2017 2018 2019 2024 2029 2034
0 1 2 3 4 5 6 7 8 9 10 15 20 25
Area Served
Annual growth (m2) 765 765 765 765 765 765 765 765 765 765 765 765 765 765
Cumulative Growth (m2) 0 765 1,530 2,294 3,059 3,824 4,589 5,353 6,118 6,883 7,648 11,472 15,296 19,119
Total Area (m2) 96,224 96,988 97,753 98,518 99,283 100,047 100,812 101,577 102,342 103,107 103,871 107,695 111,519 115,343
Annual Fuel Consumption (MWh)
Demand (m2-years) 48,494 97,371 98,136 98,900 99,665 100,430 101,195 101,959 102,724 103,489 107,313 111,137 114,961
Demand (kWh/m2) 291.36
Demand (MWh) % 28,035 14,129 28,370 28,592 28,815 29,038 29,261 29,484 29,707 29,929 30,152 31,266 32,380 33,495
Fuel Oil 15% 4,205 2,119 4,255 4,289 4,322 4,356 4,389 4,423 4,456 4,489 4,523 4,690 4,857 5,024
Biomass 85% 23,830 12,010 24,114 24,304 24,493 24,682 24,872 25,061 25,251 25,440 25,629 26,576 27,523 28,470
Electricity (kWh/m2) 10.74 1,033 1,041 1,049 1,058 1,066 1,074 1,082 1,090 1,099 1,107 1,115 1,156 1,197 1,238
total 29,068 15,170 29,419 29,650 29,881 30,112 30,343 30,574 30,805 31,036 31,267 32,422 33,578 34,733
Annual Fuel Costs
Fuel Oil 346,408 219,968 462,502 470,295 482,640 486,464 490,289 494,114 497,940 501,766 505,593 524,368 543,053 561,738
Biomass 1,222,362 616,039 1,236,935 1,246,650 1,256,366 1,266,081 1,275,796 1,285,511 1,295,227 1,304,942 1,314,657 1,363,233 1,411,809 1,460,386
Electricity 97,877 98,655 99,433 100,211 100,988 101,766 102,544 103,322 104,100 104,878 105,656 109,546 113,435 117,325
Sub-Total Fuel Costs $/yr $1,666,647 $934,661 $1,798,870 $1,817,156 $1,839,994 $1,854,311 $1,868,629 $1,882,947 $1,897,266 $1,911,586 $1,925,906 $1,997,147 $2,068,297 $2,139,448
O&M Costs $/m2O&M Costs $/m2
O&M Costs 4.1570 400,000 403,179 406,358 409,538 412,717 415,896 419,075 422,254 425,433 428,613 431,792 447,688 463,583 479,479
Insurance 27,593 27,593 27,593 27,593 27,593 28,636 28,636 28,636 28,636 28,636 29,679 31,473 32,516
Sub-Total O&M $/yr $400,000 $430,772 $433,952 $437,131 $440,310 $443,489 $447,711 $450,891 $454,070 $457,249 $460,428 $477,367 $495,056 $511,995
Other
Sub-Total Other Costs/yr 0 $0 $0 $0 $0 $0 $0 $0 $0 $0 $0 $0 $0 $0
Total System Expenses $2,066,647 $1,365,434 $2,232,821 $2,254,286 $2,280,303 $2,297,800 $2,316,340 $2,333,838 $2,351,336 $2,368,835 $2,386,334 $2,474,514 $2,563,353 $2,651,443
$/m2 $28.16 $22.93 $22.97 $23.06 $23.06 $23.06 $23.06 $23.06 $23.06 $23.06 $23.06 $23.06 $23.06
Earthvoice Strategies DES BASE for PDF 3-2-10.xls, Exp Printed: 03/02/2010 at 2:40 PM
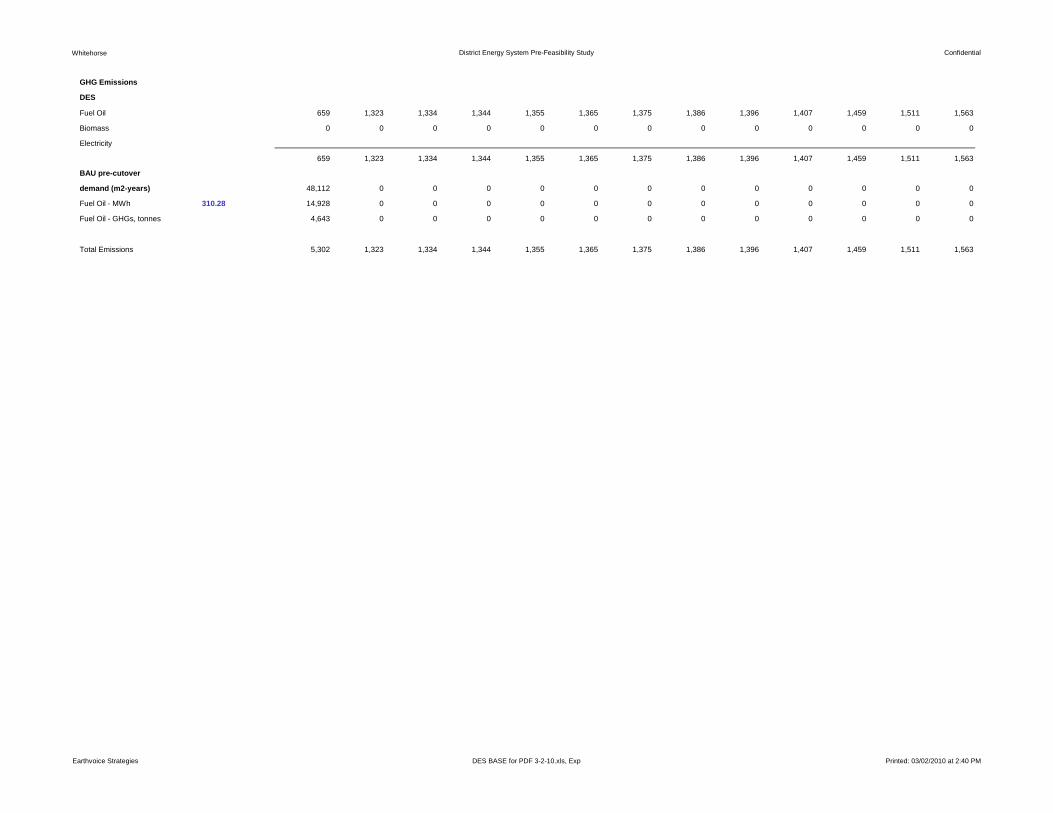
Whitehorse District Energy System Pre-Feasibility Study Confidential
GHG Emissions
DES
Fuel Oil 659 1,323 1,334 1,344 1,355 1,365 1,375 1,386 1,396 1,407 1,459 1,511 1,563
Biomass 0 0 0 0 0 0 0 0 0 0 0 0 0
Electricity
659 1,323 1,334 1,344 1,355 1,365 1,375 1,386 1,396 1,407 1,459 1,511 1,563
BAU pre-cutover
demand (m2-years) 48,112 0 0 0 0 0 0 0 0 0 0 0 0
Fuel Oil - MWh 310.28 14,928 0 0 0 0 0 0 0 0 0 0 0 0
Fuel Oil - GHGs, tonnes 4,643 0 0 0 0 0 0 0 0 0 0 0 0
Total Emissions 5,302 1,323 1,334 1,344 1,355 1,365 1,375 1,386 1,396 1,407 1,459 1,511 1,563
Earthvoice Strategies DES BASE for PDF 3-2-10.xls, Exp Printed: 03/02/2010 at 2:40 PM
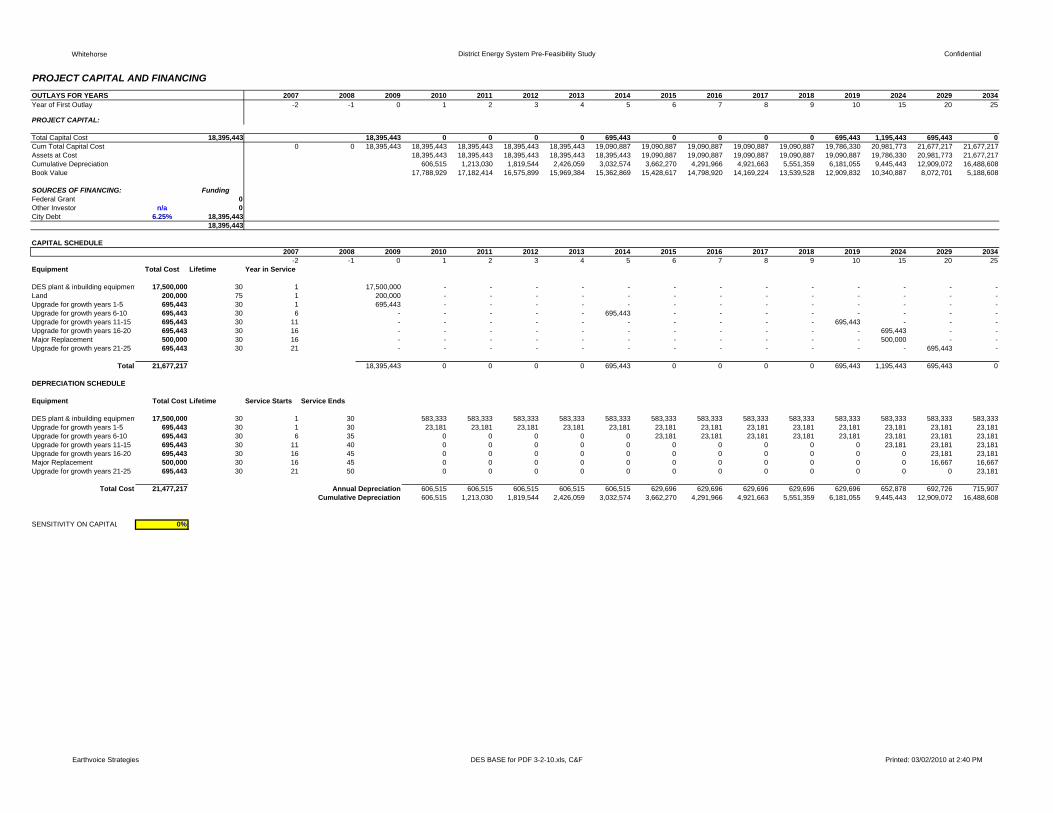
Whitehorse District Energy System Pre-Feasibility Study Confidential
PROJECT CAPITAL AND FINANCINGOUTLAYS FOR YEARS 2007 2008 2009 2010 2011 2012 2013 2014 2015 2016 2017 2018 2019 2024 2029 2034Year of First Outlay -2 -1 0 1 2 3 4 5 6 7 8 9 10 15 20 25
PROJECT CAPITAL:
Total Capital Cost 18,395,443 18,395,443 0 0 0 0 695,443 0 0 0 0 695,443 1,195,443 695,443 0Cum Total Capital Cost 0 0 18,395,443 18,395,443 18,395,443 18,395,443 18,395,443 19,090,887 19,090,887 19,090,887 19,090,887 19,090,887 19,786,330 20,981,773 21,677,217 21,677,217Assets at Cost 18,395,443 18,395,443 18,395,443 18,395,443 18,395,443 19,090,887 19,090,887 19,090,887 19,090,887 19,090,887 19,786,330 20,981,773 21,677,217Cumulative Depreciation 606,515 1,213,030 1,819,544 2,426,059 3,032,574 3,662,270 4,291,966 4,921,663 5,551,359 6,181,055 9,445,443 12,909,072 16,488,608Book Value 17,788,929 17,182,414 16,575,899 15,969,384 15,362,869 15,428,617 14,798,920 14,169,224 13,539,528 12,909,832 10,340,887 8,072,701 5,188,608
SOURCES OF FINANCING: FundingFederal Grant 0Other Investor n/a 0City Debt 6.25% 18,395,443
18,395,443
CAPITAL SCHEDULE2007 2008 2009 2010 2011 2012 2013 2014 2015 2016 2017 2018 2019 2024 2029 2034
-2 -1 0 1 2 3 4 5 6 7 8 9 10 15 20 25Equipment Total Cost Lifetime Year in Service
DES plant & inbuilding equipment 17,500,000 30 1 17,500,000 - - - - - - - - - - - - -Land 200,000 75 1 200,000 - - - - - - - - - - - - -Upgrade for growth years 1-5 695,443 30 1 695,443 - - - - - - - - - - - - -Upgrade for growth years 6-10 695,443 30 6 - - - - - 695,443 - - - - - - - -Upgrade for growth years 11-15 695,443 30 11 - - - - - - - - - - 695,443 - - -Upgrade for growth years 16-20 695,443 30 16 - - - - - - - - - - - 695,443 - -Major Replacement 500,000 30 16 - - - - - - - - - - - 500,000 - -Upgrade for growth years 21-25 695,443 30 21 - - - - - - - - - - - - 695,443 -
Total 21,677,217 18,395,443 0 0 0 0 695,443 0 0 0 0 695,443 1,195,443 695,443 0
DEPRECIATION SCHEDULE
Equipment Total Cost Lifetime Service Starts Service Ends
DES plant & inbuilding equipment 17,500,000 30 1 30 583,333 583,333 583,333 583,333 583,333 583,333 583,333 583,333 583,333 583,333 583,333 583,333 583,333Upgrade for growth years 1-5 695,443 30 1 30 23,181 23,181 23,181 23,181 23,181 23,181 23,181 23,181 23,181 23,181 23,181 23,181 23,181Upgrade for growth years 6-10 695,443 30 6 35 0 0 0 0 0 23,181 23,181 23,181 23,181 23,181 23,181 23,181 23,181Upgrade for growth years 11-15 695,443 30 11 40 0 0 0 0 0 0 0 0 0 0 23,181 23,181 23,181Upgrade for growth years 16-20 695,443 30 16 45 0 0 0 0 0 0 0 0 0 0 0 23,181 23,181Major Replacement 500,000 30 16 45 0 0 0 0 0 0 0 0 0 0 0 16,667 16,667Upgrade for growth years 21-25 695,443 30 21 50 0 0 0 0 0 0 0 0 0 0 0 0 23,181
Total Cost 21,477,217 Annual Depreciation 606,515 606,515 606,515 606,515 606,515 629,696 629,696 629,696 629,696 629,696 652,878 692,726 715,907Cumulative Depreciation 606,515 1,213,030 1,819,544 2,426,059 3,032,574 3,662,270 4,291,966 4,921,663 5,551,359 6,181,055 9,445,443 12,909,072 16,488,608
SENSITIVITY ON CAPITAL 0%
Earthvoice Strategies DES BASE for PDF 3-2-10.xls, C&F Printed: 03/02/2010 at 2:40 PM

Whitehorse District Energy System Pre-Feasibility Study Confidential
ENERGY COST PROJECTION - REAL 2009 $
PRICING FOR YEARS 2009 2010 2011 2012 2013 2014 2015 2016 2017 2018 2019 2024 2029 2034
0 1 2 3 4 5 6 7 8 9 10 15 20 25
Fuel Oil
Wholesale sensitivity
Commodity price/MWh 0.0% 82.37 103.79 108.68 109.65 111.66 111.68 111.71 111.73 111.75 111.77 111.79 111.81 111.81 111.81
GST 0.00% 0.00 0.00 0.00 0.00 0.00 0.00 0.00 0.00 0.00 0.00 0.00 0.00 0.00 0.00
Fuel Oil Cost $/MWh 82.37 103.79 108.68 109.65 111.66 111.68 111.71 111.73 111.75 111.77 111.79 111.81 111.81 111.81
$/GJ 22.90 28.85 30.21 30.48 31.04 31.05 31.05 31.06 31.07 31.07 31.08 31.08 31.08 31.08
Commercial sensitivity
Commodity price/MWh 0.0% 84.21 106.10 111.11 112.10 114.15 114.17 114.19 114.21 114.24 114.26 114.28 114.30 114.30 114.30
GST 0.00% 0.00 0.00 0.00 0.00 0.00 0.00 0.00 0.00 0.00 0.00 0.00 0.00 0.00 0.00
Fuel Oil Cost $/MWh 84.21 106.10 111.11 112.10 114.15 114.17 114.19 114.21 114.24 114.26 114.28 114.30 114.30 114.30
$/GJ 23.41 29.50 30.89 31.16 31.73 31.74 31.75 31.75 31.76 31.76 31.77 31.77 31.77 31.77
Electricity
sensitivity
Commodity price/MWh 0.0% 94.75 94.75 94.75 94.75 94.75 94.75 94.75 94.75 94.75 94.75 94.75 94.75 94.75 94.75
GST 0.00% 0.00 0.00 0.00 0.00 0.00 0.00 0.00 0.00 0.00 0.00 0.00 0.00 0.00 0.00
Electricity Cost $/MWh 94 75 94 75 94 75 94 75 94 75 94 75 94 75 94 75 94 75 94 75 94 75 94 75 94 75 94 75Electricity Cost $/MWh 94.75 94.75 94.75 94.75 94.75 94.75 94.75 94.75 94.75 94.75 94.75 94.75 94.75 94.75
$/GJ 26.34 26.34 26.34 26.34 26.34 26.34 26.34 26.34 26.34 26.34 26.34 26.34 26.34 26.34
Biomass
sensitivity
Commodity price/MWh 0.0% 51.29 51.29 51.29 51.29 51.29 51.29 51.29 51.29 51.29 51.29 51.29 51.29 51.29 51.29
GST 0.00% 0.00 0.00 0.00 0.00 0.00 0.00 0.00 0.00 0.00 0.00 0.00 0.00 0.00 0.00
Biomass Cost $/MWh 51.29 51.29 51.29 51.29 51.29 51.29 51.29 51.29 51.29 51.29 51.29 51.29 51.29 51.29
$/GJ 14.26 14.26 14.26 14.26 14.26 14.26 14.26 14.26 14.26 14.26 14.26 14.26 14.26 14.26
Carbon Offsets sensitivity 2010 value
Carbon offset/tonne 0.0% 14.00 14.00 14.74 15.51 16.33 17.18 18.09 19.04 20.04 21.09 22.20 28.68 37.05 47.87
Earthvoice Strategies DES BASE for PDF 3-2-10.xls, Energy Printed: 03/02/2010 at 2:40 PM