distribution of picophytoplankton and … · annie fiandrino 2, laurent benau , ... 1université...
TRANSCRIPT

AQUATIC MICROBIAL ECOLOGYAquat Microb Ecol
Vol. 63: 29–45, 2011doi: 10.3354/ame01480
Published online February 23
INTRODUCTION
In estuarine and coastal ecosystems, communitystructure and the dynamics of phytoplankton are heav-ily shaped by a wide variety of environmental parame-ters, including nutrient inputs, salinity, turbidity and
other optical properties of the water column. In thesecoastal waters, anthropogenic nutrient enrichment andhydrological perturbations related to freshwater dis-charges are the major stressors that cause significantchanges in phytoplankton biomass and in the composi-tion of the community (Phlips et al. 2002, Paerl et al.
© Inter-Research 2011 · www.int-res.com*Corresponding author. Email: [email protected]
Distribution of picophytoplankton andnanophytoplankton along an anthropogenic
eutrophication gradient in FrenchMediterranean coastal lagoons
Béatrice Bec1, Yves Collos1,*, Philippe Souchu2, 4, André Vaquer1, Jacques Lautier1, Annie Fiandrino2, Laurent Benau2, Valérie Orsoni3, Thierry Laugier2
1Université Montpellier 2, Laboratoire Ecosystèmes Lagunaires, UMR 5119 CNRS-Université Montpellier II-Ifremer, IRD, Place Eugène Bataillon, CC093, 34095, Montpellier Cedex 5, France
2Ifremer LER LR, BP 171, Avenue Jean Monnet, 34203 Sète Cedex, France3Ifremer, LER Corse, Zone industrielle de Furiani, 20600 Bastia, France
4Present address: Ifremer, LER/MPL/NT, Rue de l’Ile d’Yeu, BP 21105, Nantes, France
ABSTRACT: We explored the role of natural and anthropogenic environmental perturbations inshaping the community structure and dynamics of pico- and nanophytoplankton in coastal waters.The distribution patterns of phycoerythrin-rich picocyanobacteria (PE-CYAN) and phycocyanin-richpicocyanobacteria (PC-CYAN), autotrophic picoeukaryotes (PEUK) and nanophytoplankton (NANO)were examined over a period of 3 yr in 24 Mediterranean coastal lagoons displaying wide trophicgradients (from 0.2 to 630 µg chlorophyll a [chl a] l–1) and salinity gradients (from fresh to marinewaters). In summer, picoplanktonic abundances reached 3 × 10⁸ cells l–1, 5 × 10⁹ cells l–1 and 6 × 10¹⁰
cells l–1 for PE-CYAN, PC-CYAN and PEUK, respectively. PE-CYAN and PC-CYAN showedopposing responses to environmental gradients, resulting in a restricted dominance of PE-CYAN inoligotrophic marine lagoons and a dominance of PC-CYAN in some eutrophic brackish lagoons. Mostlagoons exhibited steady-state nutrient conditions, giving competitive advantages to small eukary-otic algae, even in eutrophic and hypertrophic waters. Among the picophytoplankton, picoeukary-otes (ca. 2 to 3 µm) are the most competitive with increasing nutrient availability; in terms of abun-dance and biomass, their relative and absolute importance tended to increase with increasing totalchl a biomass. Freshwater discharges resulted in large pulses of nutrient and more turbulent systemsthat altered the structure of the phytoplankton community and stimulated fast-growing NANO com-posed of phytoflagellates and diatoms (ca. 3 to 6 µm, up to 1.6 × 10⁹ cells l–1). Members of the micro-phytoplankton (ca. 20 to 200 µm) were rarely observed in eutrophic and hypertrophic lagoons andwere composed of harmful dinoflagellates in oligotrophic lagoons. These results show that anthro-pogenic and meteorological changes are highly influential on the composition and size structure ofphytoplankton communities.
KEY WORDS: Autotrophic picoeukaryotes · Picocyanobacteria · Nanophytoplankton · Abundance ·Biomass · Eutrophication · Mediterranean lagoons
Resale or republication not permitted without written consent of the publisher

Aquat Microb Ecol 63: 29–45, 2011
2003, 2006). Freshwater discharges are the mainsources of nutrients in coastal waters and they influ-ence multiple hydrologic parameters, such as salinityand water residence time. Residence time plays an im-portant role in determining the availability and utiliza-tion of nutrients by phytoplankton (Paerl et al. 2006). Itis well known that nutrient availability influences thesize structure of the phytoplankton community (Malone1980, Chisholm 1992). Therefore, changes in phyto-plankton community structure, in terms of compositionand size, can reflect phytoplankton responses to naturaland anthropogenic environmental perturbations.
The size distribution of the phytoplankton commu-nity — particularly the partitioning between smallphytoplankton (picoplankton and nanoplankton:<20 µm in size) and larger cells — plays an essentialrole in carbon flux and food webs in pelagic systems(Legendre & Rassoulzadegan 1995). The abundanceand biomass of the picophytoplankton (≤3 µm) gener-ally increases with trophic status while their relativecontribution to total autotrophic biomass declines(Weisse 1993, Agawin et al. 2000, Bell & Kalff 2001). Athin diffusion boundary layer and a high surface-to-volume ratio, due to small size, confer on picoplank-tonic cells a greater capacity to acquire and use nutri-ents in resource-limited areas — leading to competitiveadvantages over larger cells in oligotrophic waters(Raven 1986, Chisholm 1992). When nutrient availabil-ity increases, the larger phytoplankton could outcom-pete the picophytoplankton because they are releasedfrom the constraints of nutrient diffusion limitation(Agawin et al. 2000). Among the autotrophic pico-plankton community, the distribution of prokaryoticand eukaryotic components overlaps along the gradi-ent of a land–sea transect from offshore to nearshorewaters. Prochlorococcus (ca. 0.5 to 0.7 µm in size) is thedominant genus of picocyanobacteria in offshore nutri-ent-depleted waters, while Synechococcus (ca. 1 µm insize) generally thrives in moderately oligotrophic andmesotrophic waters (Partensky et al. 1999, Gin et al.2003, Pan et al. 2007). Autotrophic picoeukaryotes (ca.2 to 3 µm in size) show a clear trend in enhanced abun-dance in coastal waters where they can surpass pico-cyanobacteria in terms of biomass (Vaquer et al. 1996,Gobler et al. 2002, Calvo-Diaz & Morán 2006, Pan et al.2007). These distribution patterns show that the nutri-ent availability could potentially shape the size struc-ture of the phytoplankton community, even in thepicoplanktonic cell range. In addition to nutrients, gra-dients of salinity and optical properties of the watercolumn (from blue offshore waters to green coastalwaters) can also shape the distribution of picoplank-tonic organisms in oceanic waters (Morel et al. 1993,Partensky et al. 1999). Hence, picocyanobacteria andpicoeukaryotes show differential responses to environ-
mental gradients. In particular, it can be hypothesizedthat the relative importance of prokaryotic andeukaryotic picoplanktonic components could differ interms of abundance and biomass along the trophic gra-dient. Given the functional importance of autotrophicpicoeukaryotes in microbial food webs and carbon fluxin coastal marine waters (Worden et al. 2004, Bec et al.2005), there is a need to clarify the relative andabsolute importance of picocyanobacteria and pico-eukaryotes as a function of trophic status, and to exam-ine the main factors that regulate their distribution incoastal systems.
Among coastal zones, lagoons are highly productiveand dynamic systems (Kjerfve 1994) but they are par-ticularly sensitive to anthropogenic and climatic per-turbations. On the one hand, their restricted waterexchanges with the sea, and the potential accumula-tion of elevated levels of nutrients supplied by water-sheds and internal cycling, may amplify the eutrophi-cation processes (Kjerfve 1994, Glibert et al. 2010). Onthe other hand, due to their location at the land–seainterface, and their shallowness, they exhibit greatphysical and chemical variability related to naturalconstraints (e.g. freshwater discharges, wind andtides). All of these environmental perturbations havebroad impacts on the patterns of phytoplankton bio-mass and community composition (Knoppers 1994,Phlips et al. 2002).
Several studies have shown that picophytoplanktoncan be a major component of phytoplankton communi-ties in coastal lagoons (Sorokin et al. 1996, Vaquer etal. 1996, Phlips et al. 1999). In these systems, it isexpected that changes in the structure of the picophy-toplankton community could reflect picoplanktonicresponses to natural and anthropogenic environmentalperturbations. In this context, we investigated the dis-tribution patterns and the size structure of phytoplank-ton communities with a specific emphasis on pico-phytoplankton and nanophytoplankton in 24 FrenchMediterranean lagoons characterized by large trophicgradients (from oligotrophy to massive eutrophication)and salinity gradients (from fresh to marine waters).The objectives of the present study were: (1) to assessthe relative and absolute importance of abundanceand biomass of picocyanobacteria, picoeukaryotes andnanophytoplankton along the anthropogenic trophicgradient, and (2) to determine the main environmentalfactors driving the distribution of these organisms incoastal waters. Various geomorphological features(volume, size, depth) of the lagoons provided contrast-ing hydrological conditions (e.g. episodic or continu-ous freshwater discharges) which have allowed us toexplore how phytoplankton communities respond andadapt to anthropogenic and climate changes in coastalecosystems.
30

Bec et al.: Picoeukaryotes in Mediterranean coastal lagoons
MATERIALS AND METHODS
Study sites. We included 24 Mediterranean coastallagoons from the Languedoc–Roussillon region (south-ern French Mediterranean coast) and from Corsica(Fig. 1). Depending on the lagoon geomorphology (sur-face and depth), 1 to 4 stations were sampled (Table 1).Eight lagoons, named the ‘Palavasian’ series (Table 1),were located near the Montpellier city district (popula-tion 250 000). One site (Sea station, Fig. 1), located inthe Mediterranean Sea offshore of the Diana lagoon(D), was defined as ‘reference marine waters’. The hy-drological characteristics of the studied lagoons are de-scribed in Table 1. All stations were sampled monthlyin different years between 1998 and 2002 in the frame-work of the Lagoon Monitoring Network (Réseau deSuivi Lagunaire). For all lagoon stations, summer sam-pling was also carried out once a month from June toAugust in 2001 (except for Corsican lagoons) and 2002.On each date, subsurface water samples were collectedbetween 10:00 and 16:00 h with 2 l polypropylene bot-tles. Temperature and salinity were recorded with aWTW LF 197 field sensor (precision ±0.5%). Several
lagoons with 2 or 4 stations (Table 1) did not exhibit sig-nificant spatial variations of salinity, leading to pooledstation data for each lagoon (Lagoons C, L, T, PR, D andU; see Table 1). We also exploited data from a nutrientdatabase, developed by the Lagoon Monitoring Net-work (Souchu et al. 2010), which records concentra-tions of dissolved inorganic phosphorus (DIP), dissolvedinorganic nitrogen (DIN = NO3
+ + NO2+ + NH4
+) anddissolved silicates (DSi). For each lagoon (Souchu et al.2010), the eutrophication status was estimated accord-ing to the succession from phanerogams to macroalgaeand/or phytoplankton (Schramm 1999) that has allowedus to distinguish 4 levels of trophic status (Table 1). Theoligotrophic lagoons display transparent waters and adominance of marine phanerogams with associatedmacroalgae. The mesotrophic state still includes climaxspecies but also contains proliferating macroalgae. Theeutrophic state leads to the disappearance of climaxspecies, but proliferating macroalgae can still develop.Hypertrophic lagoons are characterized by quasi-exclusive dominance of phytoplankton.
Phytoplankton biomass. Chlorophylls a, b and c(chl a, chl b and chl c, respectively) and pheopigments
a (phe a) were analyzed in all samples(annual cycles and additional sum-mers). Upon return to the laboratory, 5to 50 ml (depending on phytoplanktonabundance) were filtered under vac-uum (<10 cm Hg) on Whatman GF/Fmembranes (0.7 µm porosity) andstored at –20°C in glass tubes. Filterswere ground in acetone (90%) andextracted during 24 h in the dark at4°C. Pigments were measured by spec-trofluorimetry (Neveux & Lantoine1993). Concentrations are expressed inµg l–1 (precision ±5%).
Flow cytometric determination ofphytoplankton abundance. A volumeof 1 ml of sample was fixed with 2%formaldehyde (final conc.) and storedin liquid nitrogen (Troussellier et al.1995). For samples from the period1998 to 1999, counts were performedwith an ACR-1400-SP flow cytometer(Bruker Spectrospin) fitted with a mer-cury-arc lamp with an excitation wave-length of 470 to 490 nm; for countingsamples from the period 2001 to 2002,we used a FACSCalibur flow cytometer(Becton Dickinson) fitted with a 15 mWargon laser (488 nm excitation). Sam-ples were analyzed with a mixture offluorescent beads (‘Fluoresbrite’ YG,Polysciences) of various nominal sizes
31
Fig. 1. The 21 lagoons along the French Mediterranean coast, the 3 lagoonsin Corsica, and the Sea station offshore of the Diana lagoon with the sampling
points. Table 1 gives further information on the individual stations

Aquat Microb Ecol 63: 29–45, 201132
Lagoon Mean Area Opening Main Stn Salinity Chl a Trophic(code) depth (km2) to the sea freshwater (µg l–1) status
(m) sources
Canet-St. Nazaire 0.35 6.0 Direct River CS 22.0 (4.9–32.6) 19.5 (3.0–204) Hypertrophic(C) CN 20.4 (6.2–37.8) 16.8 (3.5–122)
Salses-Leucate (L) 2.0 54 Direct Karst LS 35.4 (33.3–38.1) 1.6 (1.0–3.0) OligotrophicLN 37.2 (34.0–40.3) 1.3 (0.5–3.4)
La Palme (LP) 0.5 6.0 Direct Karst LP 37.0 (30.2–41.2) 1.6 (0.4–3.4) Oligotrophic
Bages-Sigean (B) 1.3 37 Direct Channel BS 37.7 (31.9–39.7) 1.6 (0.6–6.2) OligotrophicBM 34.7 (29.4–40.7) 2.7 (0.8–23.6) MesotrophicBN 32.7 (28.2–37.5) 4.8 (0.8–20.1) Eutrophic
Campignol (CA) 0.5 1.1 Lagoon Channel CA 12.8 (2.5–24.8) 5.6 (2.3–27.7) Hypertrophic
Ayrolle (AY) 0.5 13.2 Direct Lagoon AY 35.3 (20.6–38.1) 1.1 (0.2–4.8) Oligotrophic
Gruissan (GR) 0.5 1.4 Channel Channel GR 35.7 (17.8–44.0) 1.6 (0.3–24.5) Mesotrophic
Vendres (VE) 0.9 4.8–10 Channel* Wetland VE 23.7 (21.7–35.2) 189 (55–402) Hypertrophic
Bagnas (BA) 0.4 1.5 – Wetland BA 5.2 (0.6–18.3) 7.6 (1.5–119) Hypertrophic
Thau (T) 4.0 75 Direct River TWS 38.8 (36.4–40.2) 1.0 (0.4–7.2) MesotrophicTWB 38.9 (36.6–40.2) 1.1 (0.4–7.1)TES 38.7 (36.7–39.9) 2.3 (0.4–6.9)TEB 38.7 (37.0–40.0) 1.6 (0.6–6.1)
Palavasian lagoonsSouth-Ingril (IS) 0.6 3.6 Direct Channel IS 36.1 (28.7–40.0) 4.7 (0.7–20.5) Mesotrophic
North-Ingril (IN) 0.6 3.2 Channel Channel IN 35.6 (23.4–39.8) 9.4 (0.9–27.7) Mesotrophic
Pierre-Blanche (PB) 0.4 3.7 Channel Channel PB 29.7 (17.4–45.1) 30.6 (4.9–56.8) Eutrophic
Vic (VC) 1.2 11.5 Channel Channel VC 29.4 (19.3–46.4) 39.7 (3.1–71.7) Eutrophic
Prévost (PR) 0.75 3.8 Direct Channel PRW 31.5 (14.7–40.8) 15 (1.8–77.6) EutrophicPRE 33.9 (21.8–39.3) 15.5 (1.1–79.5)
Arnel (AR) 0.4 4.7 Channel River AR 29.8 (7.8–40.0) 16.4 (2.5–310) Hypertrophic
Méjean (M) 0.75 5.5 Channel Channel MW 19.7 (12.1–32.4) 170 (57–630) HypertrophicME 22.1 (12.2–32.5) 64.3 (14.0–377)
Grec (GE) 0.3 2.7 Channel Channel GE 26.8 (12.1–32.7) 72.9 (12.6–206) Hypertrophic
Or (O) 0.8 32 Channel Wetland OW 24.6 (20.6–26.5) 56.1 (3.0–84.9) HypertrophicOE 22.1 (18.0–24.5) 17.6 (4.8–85.7)
Ponant (PO) 2.7 2.0 Direct River PO 18.7 (0.5–30.4) 11.4 (1.5–22.3) Eutrophic
Médard (MD) 0.6 1.4 Channel Channel MD 20.0 (15.6–23.4) 8.6 (1.0–86.4) Eutrophic
CorsicaBiguglia (BI) 1.5 14.5 Direct* Wetland BI1 20.0 (14.0–37.1) 5.0 (1.0–37.7) Mesotrophic
BI2 17.8 (13.2–33.1) 4.4 (0.9–77.1)BI3 16.8 (12.6–29.5) 4.1 (1.4–70.6)BI4 15.0 (11.5–29.3) 3.9 (2.0–30.2)
Diana (D) 6.0 5.7 Direct River DSS 37.5 (35.1–39.1) 3.2 (1.1–9.4) OligotrophicDSB 37.9 (36.0–38.9) 3.1 (0.8–8.2)DNS 37.3 (35.5–38.6) 1.6 (0.7–6.5)DNB 37.8 (36.0–39.0) 1.7 (0.8–4.6)
Urbino (U) 5.0 7.6 Direct* River USS 36.6 (32.8–39.6) 2.9 (1.2–5.9) OligotrophicUSB 37.2 (35.5–39.6) 3.1 (1.4–5.1)UNS 36.5 (33.0–39.5) 3.1 (1.1–4.9)UNB 36.8 (25.5–39.6) 3.1 (1.3–4.6)
Mediterranean Sea 40 – – – Sea 37.5 (36.8–38.7) 0.4 (0.1–1.0) –
Table 1. Morphometric and hydrological characteristics of the 24 Mediterranean coastal lagoons. For each station, median,minimum and maximum (in parentheses) values of salinity and chlorophyll a (chl a) based on annual period are indicated.
Eutrophication status of each lagoon is also indicated (Souchu et al. 2010). *Not permanently open

Bec et al.: Picoeukaryotes in Mediterranean coastal lagoons
(1, 2, 3, 6 and 10 µm) to identify the size range of phy-toplanktonic populations (Fig. 2). Size classes havebeen estimated from the average of forward scatter(FSC) values of natural populations relative to the FSCof fluorescent beads. They were also calibrated withcultures of unicellular algae whose cell diameter hadbeen determined by optical microscopy and analyzedby Optilab Pro software (Bec et al. 2008). Cytometricanalysis by size classes was carried out on data from2001 and 2002. For sample processing, the sheath fluidwas prepared from filtered (pore size 0.2 µm) artificialseawater (NaCl) whose salinity was adjusted to that ofthe samples (±2 units) in order to avoid alterations ofrefractive indices of the cells and changes in the mea-sured FSC (Marie et al. 1999). Two protocols have been
used depending on cell size: one instrument setting foranalysis of cells ≤3 µm, and another for cells >3 µm.Sample acquisition was done at a flow rate of 25 to30 µl min–1. Samples were diluted when eventsreached 1000 s–1. Data were logged using Cell Questsoftware and analyzed with Attractors software (Bec-ton Dickinson). Eukaryotic phytoplankton were distin-guished on the basis of red fluorescence (FL3, relatedto chl a fluorescence; wavelength >650 nm) and lightdiffraction (FSC, related to cell size). Two groups weredefined depending on the cell size: ≤3 µm (autotrophicpicoeukaryotes, PEUK) and >3 µm (nanophytoplank-ton, NANO). Phycoerythrin-rich picocyanobacteria(PE-CYAN; Fig. 2a,b) were discriminated from otherphotosynthetic organisms by their strong orange fluo-
33
Fig. 2. Dotplots of flow cytometric analysis of phytoplankton from marine and freshwater samples collected in (a,b) Thau and (c,d)Bagnas lagoons, respectively. (a,c) Forward scatter vs. red fluorescence. (b,d) Forward scatter vs. orange fluorescence. These dot-plots allow phycoerythrin-rich picocyanobacteria (PE-CYAN), phycocyanin-rich picocyanobacteria (PC-CYAN), autotrophic
picoeukaryotes (PEUK) and nanophytoplankton (NANO) to be distinguished

Aquat Microb Ecol 63: 29–45, 2011
rescence (FL2, wavelength 542 to 585 nm) and light-scattering properties (FSC). The identification of phy-cocyanin-rich picocyanobacteria (PC-CYAN) requiresa red excitation wavelength (635 nm; Collier 2000,Murrell & Lores 2004). However, flow cytometers fittedwith a blue laser can detect them (Collier 2000, Li &Dickie 2001), but PC-CYAN present low red fluores-cence and light-scattering characteristics very close tothose of Prochlorococcus, a typical picocyanobac-terium of ultra-oligotrophic ocean waters. In the pre-sent study, small (<1 µm) cells with a near-backgroundred fluorescence were detected (Fig. 2c,d) in fewlagoons (Lagoons CA, BA, BI; see Table 1). Due to thehydrological characteristics of those systems (Table 1),we assumed that those were PC-CYAN rather thanProchlorococcus. Molecular analyses have confirmedthe presence of PC-CYAN in those lagoons (E. Mas-seret unpubl. data). Thus, 4 groups (PEUK, NANO, PE-CYAN and PC-CYAN) were distinguished by flowcytometry for the whole data set (Fig. 2).
Phytoplankton identification. The composition ofNANO and microphytoplankton was determined byoptical microscopy. Identification of the main phyto-plankton genera was done using a Zeiss Axiolabmicroscope after sedimentation (Utermöhl 1958). Sam-ples (1 l) were fixed with Lugol’s solution and pre-served in the dark. A total of 150 sample identificationswere performed from lagoons monitored during theperiod 1998 to 1999 and the period 2001 to 2002. Theemphasis was on identification of the phytoplanktoncommunity from lagoons with contrasting hydrologicalfeatures (freshwater, brackish and marine), with recur-rent cohabitation of primary producers (opportunisticmacroalgae vs. phytoplankton), and with contrastingclimatic events (floods or rainy periods vs. summerperiods). Samples with discrepancies between chl abiomass and abundance were also examined. Theseidentifications have allowed us to characterize theglobal community structure of phytoplankton in the 24Mediterranean lagoons.
Contribution to chl a biomass. The contribution ofthe 4 phytoplankton groups to total chl a biomass wasestimated using chlorophyll cell content from the liter-ature. The picocyanobacterial biomass was estimatedusing a chlorophyll cell content of 1.4 fg chl a cell–1
(Kana & Glibert 1987). For eukaryote microalgae, thechlorophyll cell content depends on taxonomic group(Vaillancourt et al. 2004). Based on our results frommicroscopic observations, accessory pigment concen-tration (chl b and chl c) and cell size, a content of 10 fgchl a cell–1 for prasinophyte picoalgae (Vaillancourt etal. 2004) and a mean content of 200 fg chl a cell–1 fordiatoms, cryptophytes and prymnesiophytes (Vaillan-court et al. 2004) were used to estimate PEUK and theNANO biomass contribution. We excluded estimated
biomass values <0.001 µg chl a l–1 (i.e. less than thetheoretical detection limit of chlorophyll).
Statistical analysis. Statistical analyses were donewith JMP 5.0.1 software. Non-parametric tests(Wilcoxon test for n = 2 and Kruskal–Wallis test forn >2) were used to compare spatial variations of envi-ronmental and biological parameters in lagoons with 2or 4 stations. Relationships between environmentalparameters and biological variables were studiedusing Spearman’s rank correlation. The relationshipsbetween the total biomass and phytoplankton abun-dances were described by linear regression of log-transformed values of the variables. The varianceexplained by the fitted models and the significance ofthe fit were tested by analysis of variance (Sokal &Rohlf 1981).
RESULTS
Salinity and nutrient regimes
The lagoon waters ranged in salinity from freshwater(salinity <1), linked to high river run-off in the rainyseason (Lagoon PO; Fig. 3), to hypersaline (salinity>40) in the dry season in shallow lagoons as a result ofevaporation (LP, GR; Fig. 3). Most lagoons were char-acterized by brackish waters (salinity <30). Amongthem, lagoons surrounded by wetlands (BA, VE, O;Table 1) had relatively stable salinities throughout theyear. Shallow lagoons exposed regularly to largeinputs of freshwater (C, CA, AR, PO; Table 1) pre-
34
Fig. 3. Distribution of salinity in the 24 Mediterranean coastallagoons/stations and the Sea station. Box-and-whisker plotsfrom annual data: the whiskers represent the 5th and the 95thpercentiles, the outer edges of the boxes represent the 25thand 75th percentiles, and the horizontal line within the boxesrepresents the median. Salinity range for hypersaline, sea-water, brackish waters and freshwaters was defined as inContreras & Kerekes (1993). See Table 1 for station identifi-
cations and their median salinity values

Bec et al.: Picoeukaryotes in Mediterranean coastal lagoons
sented large ranges in salinity and annual median val-ues below 30. In contrast, deep lagoons (mean depth>4 m; T, U and D) exhibited small ranges in salinity,with annual median values (from 36.6 to 38.9; Table 1)close to that observed at the Sea station (37.5).
The inverse correlation between nutrient concen-trations and salinity (Table 2) indicates that nutrientloads were due mostly to freshwater discharges.Nutrient concentrations increased especially duringthe cold season, corresponding to the flood period inlagoons, while concentrations decreased in summer.Based on annual data, median values of DIP (dis-solved inorganic phosphorus) and DIN (dissolvedinorganic nitrogen) were low (0.14 and 1.3 µM,respectively) and NH4
+ represented the main sourceof DIN (70%).
Chlorophyll a gradient
Chl a ranged from 0.2 µg l–1 (Lagoon AY) to 630 µg l–1
(Lagoon MW) in lagoons, and from 0.1 to 1.0 µg l–1 atthe Sea station (Table 1). Large differences in annualranges of chl a were observed between the 24 lagoons.Marine lagoons (L, T, U and D; Fig. 3) exhibited lowvalues of chl a, with annual median values <3 µg chl al–1 (Table 1). In contrast, high values of chl a were mea-sured throughout the year in shallow ‘Palavasian’lagoons receiving regular effluents from the sewagetreatment plants of the Montpellier city district.Lagoons exposed to high and irregular inputs of fresh-water (CA and PO; Fig. 3) had relatively low annualmedian values (5.6 and 12.4 µg chl a l–1, respectively)compared to ‘Palavasian’ series. Among hypertrophic
lagoons, 2 stood out by their high levels of biomass (upto 630 µg l–1 and 400 µg l–1 in MW and VE, respec-tively) and highest annual median values (170 µg l–1
and 189 µg l–1 in MW and VE, respectively). Based onannual data, chl a was inversely correlated with salin-ity and was highly correlated with turbidity (Table 2).
Distribution and community structure ofpicophytoplankton
Phycoerythrin-rich picocyanobacteria (PE-CYAN)
PE-CYAN presented a wide range of abundances(from 103 to 108 cells l–1) that increased as total chl abiomass increased, leading to a significant positive re-lationship between these 2 variables (Fig. 4a, Table 3).PE-CYAN were not observed in all lagoons (Fig. 5),and maximal densities were generally measured insummer. In particular, high densities (up to 2 × 10⁸ cellsl–1) were observed in summer in 3 oligotrophic marinelagoons (L, D and U; Table 1). PE-CYAN were numeri-cally dominant only in those 3 lagoons (>60% of totalpicoplanktonic abundances; Fig. 5) but they were pre-sent in other lagoons (T, IS, PO; Fig. 5) directly con-nected to the sea. Summer median densities rangedbetween 3.8 and 6.8 × 10⁷ cells l–1 in the first ones whilemedian values were near 1 × 10⁷ cells l–1 in the latter.Blooms of PE-CYAN (>108 cells l–1) occurred also in la-goons presenting strong salinity variations and a largebiomass of chl a, such as the ’Palavasian’ series. How-ever, their relative importance in terms of densitieswas low (<2% of total picoplanktonic abundances;Fig. 5). Based on all lagoon data, PE-CYAN densities
35
chl a chl b chl c PE-CYAN PC-CYAN PEUK NANO Temp. Salinity Turbidity DIN DIP DSi
Chl a 1.00 .– .– .– .– .– .– .– .– .– .– .– .–Chl b 0.76*** 1.00 .– .– .– .– .– .– .– .– .– .– .–Chl c 0.86*** 0.59*** 1.00 .– .– .– .– .– .– .– .– .– .–PE-CYAN 0.19*** 0.23** 0.23*** 1.00 .– .– .– .– .– .– .– .– .–PC-CYAN 0.14* 0.05ns 0.10ns 0.02ns 1.00 .– .– .– .– .– .– .– .–PEUK 0.72*** 0.67*** 0.49*** 0.34*** 0.01ns 1.00 .– .– .– .– .– .– .–NANO 0.32*** 0.29*** 0.45*** 0.10** 0.01ns 0.14*** 1.00 .– .– .– .– .– .–Temp. 0.14*** 0.09* 0.18*** 0.12* 0.17** 0.11* –0.01ns 1.00 .– .– .– .– .–Salinity –0.49*** –0.31*** –0.32*** –0.01ns –0.29*** –0.33*** –0.23*** 0.06ns 1.00 .– .– .– .–Turbidity 0.66*** 0.45*** 0.48*** 0.09* 0.04ns 0.49*** 0.23*** –0.14*** –0.52*** 1.00 .– .– .–DIN 0.13*** 0.14*** 0.06ns 0.10ns –0.07ns 0.09ns 0.24*** –0.26*** –0.48*** 0.34*** 1.00 .– .–DIP 0.30*** 0.16*** 0.24*** 0.00ns 0.13ns 0.05ns 0.24*** –0.01ns –0.33*** 0.33*** 0.29*** 1.00 .–DSi 0.50*** 0.47*** 0.32*** 0.09* 0.10ns 0.46*** 0.11* 0.11* –0.58*** 0.35*** 0.31*** 0.32*** 1.00
Table 2. Spearman’s rank correlations between biological, physical and chemical variables at the 95% confidence interval (ns = not sig-nificant, ***p < 0.001, **p < 0.01, *p < 0.05). Correlations were computed with data from annual periods. Relatively strong correlations(–0.50 ≥ r ≥ +0.50) are in bold. Number of data points, n = 624. PE-CYAN = phycoerythrin-rich picocyanobacteria; PC-CYAN = phycocyanin-rich picocyanobacteria; PEUK = autotrophic picoeukaryotes; NANO = nanophytoplankton. Temp. = temperature; DIN = dissolved
inorganic nitrogen; DIP = dissolved inorganic phosphorus; DSi = dissolved silicates; chl a, b, c = chlorophyll a, b and c, respectively

Aquat Microb Ecol 63: 29–45, 2011
were an order of magnitude lower than those of PC-CYAN (Fig. 4b) and PEUK (Fig. 4c), and represented9% of the total picoplanktonic abundance but 50% ofthe total abundance of picoplanktonic cells <1 µm insize. PE-CYAN densities were not significantly corre-lated with salinity, while other phytoplankton groupswere inversely correlated with this variable (Table 2).As for the other picoplanktonic groups, PE-CYAN den-sities were positively correlated with temperature.
Phycocyanin-rich picocyanobacteria (PC-CYAN)
PC-CYAN presented a narrower range of abun-dances than did other phytoplankton groups (107 to1010 cells l–1; Fig. 4b) but they reached densities of
the same order of magnitude as PEUK (Fig. 4c). Theirabundances increased as the total chl a biomassincreased, leading to a significant positive relation-ship between these 2 variables (Table 3). Similar toPE-CYAN, PC-CYAN were not present in all lagoons(Fig. 5), and their abundance clearly increased insummer (reaching 5 × 10⁹ cells l–1 at BA) but declinedconsiderably in winter. They contributed 7% of thetotal picoplanktonic abundance and 23% of theabundance of picoplanktonic cells <1 µm in size. Insummer, PC-CYAN were numerically dominant inonly 2 lagoons (BI and BA; Fig. 5) characterized bybrackish waters (Fig. 3). The hypertrophic wetland-like lagoon (BA) stood out by the highest medianvalue of PC-CYAN densities (3.5 × 10⁹ cells l–1).PC-CYAN contributed significantly to the total pico-
36
Fig. 4. Relationship between picophytoplankton and nanophytoplankton abundances (106 cells l–1) and total phytoplanktonbiomass (µg chl a l–1) in the 24 Mediterranean coastal lagoons. (a) phycoerythrin-rich picocyanobacteria (PE-CYAN), (b) phyco-cyanin-rich picocyanobacteria (PC-CYAN), (c) autotrophic picoeukaryotes (PEUK) and (d) nanophytoplankton (NANO). Fitted
linear regression lines are described in Table 3

Bec et al.: Picoeukaryotes in Mediterranean coastal lagoons
planktonic abundance in lagoons exposed to conti-nuous inputs of freshwater (25 to 40% in CA andPO; Fig. 5) or eutrophic and hypertrophic lagoonssuch the ’Palavasian’ series and the Or lagoon (15to 30%; Fig. 5). Based on annual data, blooms ofPC-CYAN often occurred after floods when minimumsalinities were reached in lagoonal waters. All ofthese observations were strengthened by correlationsshowing that PC-CYAN densities were positively cor-related to temperature and inversely correlated tosalinity (Table 2). Nevertheless, PC-CYAN could alsocontribute significantly to the autotrophic picoplank-
ton community in oligotrophic marinelagoons (U and AY; Table 1, Fig. 5).
Autotrophic picoeukaryotes (PEUK)
PEUK presented the widest range ofabundances, from 105 to 1010 cells l–1
(Fig. 4c) and showed a significant pos-itive relationship with total chl a bio-mass (Table 3). They were repeatedlyobserved in all lagoons and dominatedthe picoplanktonic community with acontribution of 84% of total abun-dances. Except for oligotrophic marinelagoons (L, D and U; Fig. 5) and wet-land-like lagoons (BA and BI; Fig. 5),where PE-CYAN and PC-CYAN,respectively, were dominant, thePEUK were numerically dominant inall other lagoons (Fig. 5). Extremelyhigh densities (6.4 × 10¹⁰ cells l–1) wereobserved in the summer in a hyper-trophic lagoon where chl a was above55 µg l–1 throughout the year (VE;Table 1). In this lagoon, PEUK densi-ties were higher than in other lagoonsby an order of magnitude (summermedian value: 2.6 × 10¹⁰ cells l–1). Inother eutrophic and hypertrophiclagoons (‘Palavasian’ series; Table 1),median abundances ranged from 1.8 to47 × 108 cells l–1 in summer. In manylagoons, PEUK abundances increasedwith chl b, as in the VE lagoon, whichstood out with high values of chl b(up to 83 µg l–1) and undetectablevalues of chl c for most of the year.A strong positive correlation wasobserved between PEUK abundancesand chl b (Table 2). In other lagoons,PEUK increases also coincided withchl c increases. Among the 4 phyto-
plankton groups, PEUK densities were the moststrongly correlated to turbidity (Table 2). The PEUKcommunity was numerically represented by cells of the2–3 µm size class (59% of total picoeukaryote densi-ties). This size class was dominant in eutrophic lagoons(‘Palavasian’ series) and was composed mainly of Nan-nochloris and Chlorella-like green algae. Picoeukary-otes belonging to the <1 µm and the 1–2 µm classesrepresented 16 and 25% of total PEUK densities,respectively. These size classes were observed alongthe eutrophication gradient. In the lagoon (VE) whererecord PEUK densities were observed, the picoeukary-
37
Fig. Log-log regression model r2 n p
Log(PPPabund) = 2.07 + 1.22 log(chl a) 0.60 606 <0.00014a Log(PE-CYANabund) = –0.87 + 0.77 log(chl a) 0.20 375 <0.00014b Log(PC-CYANabund) = 3.67 + 0.78 log(chl a) 0.35 80 <0.00014c Log(PEUKabund) = 1.62 + 1.23 log(chl a) 0.58 606 <0.00014d Log (NANOabund) = –0.38 + 0.88 log(chl a) 0.58 530 <0.00016a Log(PE-CYANchl a) = –3.47 + 0.01 log(chl a) 0.00 156 0.876b Log(PC-CYANchl a) = –2.90 + 0.78 log(chl a) 0.35 80 <0.00016c Log(PEUKchl a) = –2.91 + 1.21 log(chl a) 0.59 600 <0.00016d Log(NANOchl a) = –2.00 + 0.88 log(chl a) 0.59 530 <0.00017a Log(%PE-CYANchl a) = 1.13 – 0.99 log(chl a) 0.66 156 <0.00017b Log(%PC-CYANchl a) = 1.71 – 0.22 log(chl a) 0.04 80 0.077c Log(%PEUKchl a) = 1.67 + 0.22 log(chl a) 0.05 600 0.00017d Log(%NANOchl a) = 2.61 – 0.12 log(chl a) 0.04 530 <0.0001
Table 3. Summary of relationships between total biomass (chl a, µg l–1) andphytoplankton abundances (cells l–1) for the 24 Mediterranean coastal lagoons.PPP = total picophytoplankton, PEUK = autotrophic picoeukaryotes, PE-CYAN =phycoerythrin-rich picocyanobacteria, PC-CYAN = phycocyanin-rich pico-cyanobacteria, NANO = nanophytoplankton. The linear model was studied,including all data sets (annual periods and additional summer data) and is
represented in Figs. 4, 6 & 7
Fig. 5. Relative contribution of picocyanobacteria and autotrophic picoeukary-otes to total picoplanktonic abundances in summer in the 24 Mediterraneancoastal lagoons (see Table 1). Phycoerythrin-rich picocyanobacteria (light-greybars), phycocyanin-rich picocyanobacteria (medium-grey bars) and autotrophic
picoeukaryotes (dark-grey bars)
Aquat Microb Ecol 63: 29–45, 2011
ote size was >2 µm. The smallest picoeukaryotes(<1 µm) were dominant in oligo-mesotrophic marinewaters (T and D; Fig. 3), with summer median abun-dances of an order magnitude of 1 × 10⁷ cells l–1.
Distribution and community structure ofnanophytoplankton and microphytoplankton
Nanophytoplankton (NANO)
NANO abundances were lower than those of PEUKand PC-CYAN by 2 or 3 orders of magnitude, but werenear those of PE-CYAN (Fig. 4a,d). NANO densitiesshowed a significant positive relationship with totalchl a biomass (Table 3). NANO abundances were neg-atively correlated to salinity and, in contrast topicoplanktonic groups, were positively correlated toconcentrations of DIN and DIP (Table 2). Typically,NANO expanded after floods that induced a nutrientincrease in lagoonal waters in the cold season. Thus,the highest densities were generally observed inlagoons under freshwater influence (‘Palavasian’series). NANO numerically dominated the phytoplank-ton community in only 1 shallow lagoon subjected toriver floods (C; Fig. 3). In terms of size, the NANO com-munity was numerically dominated by the 3–6 µm sizeclass (49% of NANO abundances) composed mainly ofcentric and pennate diatoms, and various phytoflagel-lates (cryptophytes, chrysophytes, prymnesiophytes).NANO abundances were positively correlated withchl c and chl b (Table 2). The 6–10 µm and >10 µm sizeclasses represented 29 and 22% of NANO abun-dances, respectively. Freshwater taxa such as Scene-desmus, Monoraphidium (chlorophytes) and Trache-lomonas (euglenophytes) were observed in a lagoon(CA) subjected to permanent freshwater inputs.
Microphytoplankton
In a way similar to the NANO, microphytoplankton,composed mainly of chain-forming diatoms (Chaeto-ceros, Rhizosolenia, Pseudo-Nitzschia), were observedafter inputs of freshwater following rain events on thewatersheds in oligo-mesotrophic lagoons (GR, BS andT; Table 1). In these lagoons, dinoflagellates (Prorocen-trum, Dinophysis and Gymnodinium) appeared, ingeneral, in summer after the spring diatom blooms. Onthe contrary, in oligotrophic marine lagoons, dinofla-gellates dominated throughout the year, as in LagoonsU (Dinophysis, Ceratium), D (Prorocentrum) and L(Prorocentrum, Dinophysis). A particularly confinedlagoon (BI) stood out by a biomass dominance of chain-forming diatoms (Chaetoceros, Nitzschia) all year
round. In addition, filamentous Cyanobacteria weresporadically observed in lagoons exposed to continu-ous inputs of freshwaters (Anabaena and Spirulina inPO and CA, respectively) and in the wetland-likelagoon (Gloeotrichia in BA).
Contribution of the phytoplankton communityto chl a biomass
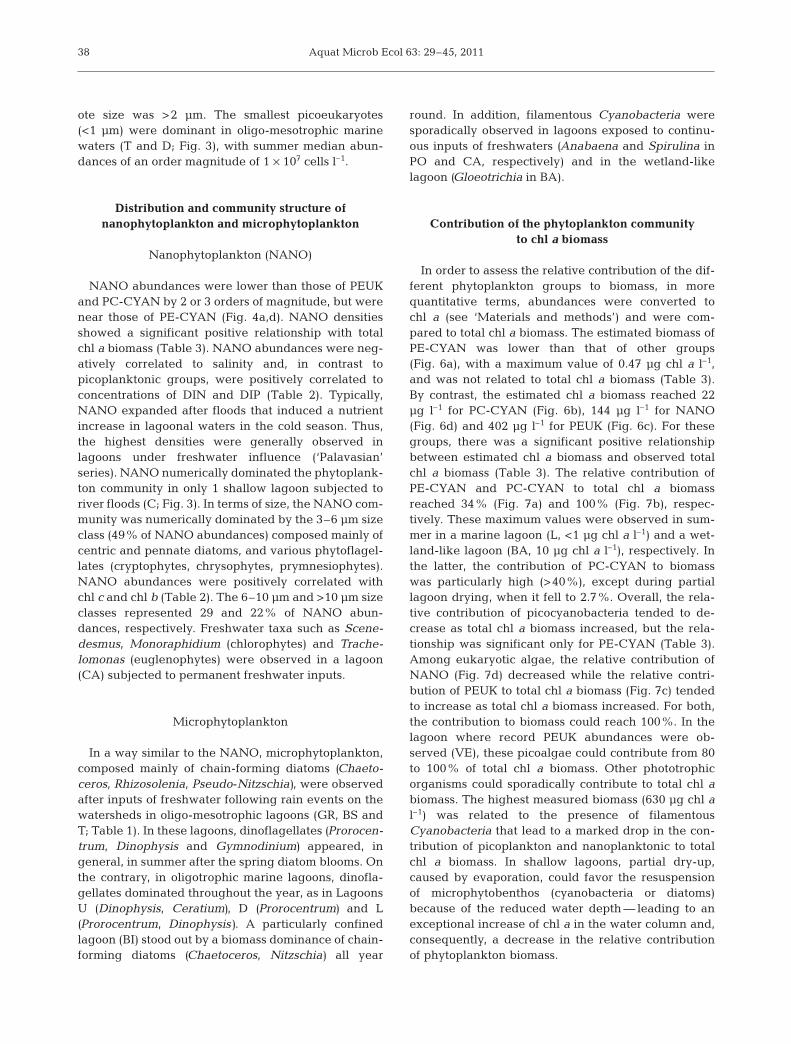
In order to assess the relative contribution of the dif-ferent phytoplankton groups to biomass, in morequantitative terms, abundances were converted tochl a (see ‘Materials and methods’) and were com-pared to total chl a biomass. The estimated biomass ofPE-CYAN was lower than that of other groups(Fig. 6a), with a maximum value of 0.47 µg chl a l–1,and was not related to total chl a biomass (Table 3).By contrast, the estimated chl a biomass reached 22µg l–1 for PC-CYAN (Fig. 6b), 144 µg l–1 for NANO(Fig. 6d) and 402 µg l–1 for PEUK (Fig. 6c). For thesegroups, there was a significant positive relationshipbetween estimated chl a biomass and observed totalchl a biomass (Table 3). The relative contribution ofPE-CYAN and PC-CYAN to total chl a biomassreached 34% (Fig. 7a) and 100% (Fig. 7b), respec-tively. These maximum values were observed in sum-mer in a marine lagoon (L, <1 µg chl a l–1) and a wet-land-like lagoon (BA, 10 µg chl a l–1), respectively. Inthe latter, the contribution of PC-CYAN to biomasswas particularly high (>40%), except during partiallagoon drying, when it fell to 2.7%. Overall, the rela-tive contribution of picocyanobacteria tended to de-crease as total chl a biomass increased, but the rela-tionship was significant only for PE-CYAN (Table 3).Among eukaryotic algae, the relative contribution ofNANO (Fig. 7d) decreased while the relative contri-bution of PEUK to total chl a biomass (Fig. 7c) tendedto increase as total chl a biomass increased. For both,the contribution to biomass could reach 100%. In thelagoon where record PEUK abundances were ob-served (VE), these picoalgae could contribute from 80to 100% of total chl a biomass. Other phototrophicorganisms could sporadically contribute to total chl abiomass. The highest measured biomass (630 µg chl al–1) was related to the presence of filamentousCyanobacteria that lead to a marked drop in the con-tribution of picoplankton and nanoplanktonic to totalchl a biomass. In shallow lagoons, partial dry-up,caused by evaporation, could favor the resuspensionof microphytobenthos (cyanobacteria or diatoms)because of the reduced water depth — leading to anexceptional increase of chl a in the water column and,consequently, a decrease in the relative contributionof phytoplankton biomass.
38

Bec et al.: Picoeukaryotes in Mediterranean coastal lagoons
DISCUSSION
Phytoplankton community structure along thetrophic chl a gradient
The 24 Mediterranean coastal lagoons present a widerange of chl a biomass (0.21 to 630 µg l–1), varying fromvalues reported for oligotrophic Mediterranean coastalwaters (Thingstad et al. 1998) to those for hypertrophiclakes (Vörös et al. 1998, Bell & Kalff 2001). This widerange reflects the variability in the amplitude of the nu-trient enrichment and efficiency of assimilating nutrientsinto phytoplankton biomass (Cloern & Jassby 2008). Inthe lagoons, nutrients are efficiently converted intoplanktonic primary producers, particularly during thewarm season in which maximum chl a biomass leads tolow nutrient concentrations due to continuous uptake ofnutrients by massive phytoplankton blooms. In the cold
season, light and temperature limitation induces a re-duction in biomass, and consequently, an accumulationof nutrients that is particularly high when floods occur.Picoplanktonic abundances exhibit a seasonality similarto total chl a biomass. The temperature-dependence ofgrowth and density of PE-CYAN (Agawin et al. 1998,Murrell & Lores 2004, Collos et al. 2009) and PEUK (Becet al. 2005) has been demonstrated. However, the rela-tive and absolute importance of prokaryotic and eukary-otic autotrophic components, in terms of abundance andbiomass, differ along the trophic gradient of lagoonalwaters.
PE-CYAN and PC-CYAN
The abundance of picocyanobacteria significantlyincreases with increasing total chl a biomass. Maxi-
39
Fig. 6. Relationship between picophytoplankton and nanophytoplankton biomass (µg chl a l–1) to total phytoplankton biomass (µgchl a l–1) in the 24 Mediterranean coastal lagoons. (a) Phycoerythrin-rich picocyanobacteria (PE-CYAN), (b) phycocyanin-richpicocyanobacteria (PC-CYAN), (c) autotrophic picoeukaryotes (PEUK) and (d) nanophytoplankton (NANO). Fitted linear
regression lines are described in Table 3
Aquat Microb Ecol 63: 29–45, 2011
mum abundances of PE-CYAN (3 × 10⁸ cells l–1) andPC-CYAN (5 × 10⁹ cells l–1) are close to maximaobserved in lagoonal and estuarine systems (Caroppo2000, Ning et al. 2000) and in hypertrophic lakes(Camacho et al. 2003), respectively. The numericaldominance of PE-CYAN is restricted to marine oligo-trophic lagoons (≤3 µg chl a l–1; Lagoons, L, D and U).Because of their small size and high surface-to-volumeratios, these picocyanobacteria appear to be morecompetitive than PEUK and the larger phytoplanktonin acquiring nutrients in resource-limited systems(Raven 1986, Weisse 1993). The numerical dominanceof PE-CYAN can thus reflect oligo-mesotrophic condi-tions in marine coastal waters (Jacquet et al. 1998,Caroppo 2000, Gin et al. 2003). This dominance couldbe related to the ability of PE-CYAN, such as Syne-chococcus, to acquire phosphorus (P) when concentra-
tions are very low (Collos et al. 2009 and referencestherein) because P is the limiting nutrient in the olig-otrophic lagoons where PE-CYAN dominate (Souchuet al. 2010). Conversely, the numerical dominance ofPC-CYAN observed in brackish lagoons is consistentwith previous studies showing their predominance inestuarine and freshwater systems (Pick 1991, Camachoet al. 2003, Murrell & Lores 2004). In terms of chl a, thedecreasing contribution of the 2 types of picocyano-bacteria to total biomass along the trophic gradient(Fig. 7a,b) supports the conclusions drawn for marinesystems (Agawin et al. 2000, Bell & Kalff 2001) andfreshwater systems (Takamura & Nojiri 1994, Callieri &Stockner 2002). The maximum chl a contribution ofPE-CYAN observed in summer in an oligotrophiclagoon (34%; Lagoon L) confirms that their relativeimportance is greatest in warm and nutrient-poor
40
Fig. 7. Relationship between the percentage contribution of picophytoplankton and nanophytoplankton to total phytoplanktonbiomass (µg chl a l–1) in the 24 Mediterranean coastal lagoons. (a) Phycoerythrin-rich picocyanobacteria (PE-CYAN), (b) phyco-cyanin-rich picocyanobacteria (PC-CYAN), (c) autotrophic picoeukaryotes (PEUK) and (d) nanophytoplankton (NANO). Fitted
linear regression lines are described in Table 3

Bec et al.: Picoeukaryotes in Mediterranean coastal lagoons
waters of oceanic and coastal zones (Agawin et al.2000, Collos et al. 2009). In contrast, the large contribu-tion of PC-CYAN to biomass (up to 100%) observed ina hypertrophic wetland-like lagoon (BA) tends to standout from the general trend. A similar pattern of PC-CYAN dominance (>90%) has been observed in thePensacola Bay estuarine system (Murrell & Lores2004). The large contribution of PC-CYAN in thesesystems could be controlled by factors other than nutri-ent availability and/or temperature (Agawin et al.2000).
Eukaryotic algae
The abundance of PEUK increases along theanthropogenic trophic gradient. PEUK are numeri-cally dominant in most lagoons, contrasting withmany coastal waters (Jacquet et al. 1998, Grégori etal. 2001, Gin et al. 2003). Their abundance rangesfrom values reported in Mediterranean coastal waters(106 to 107 cells l–1; Jacquet et al. 1998, Grégori et al.2001) to values similar to those measured in hyper-trophic freshwater lakes (>109 cells l–1; Hepperle &Krienitz 2001). To our knowledge, the record densities(>1010 cells l–1) measured in the most hypertrophiclagoon (VE) have never been observed in otheraquatic systems. Along the trophic gradient, PEUKbecome numerically dominant in mesotrophic lagoons(3 to 10 µg chl a l–1) where densities are of the sameorder of magnitude as those previously measured inthe Thau lagoon (107 to 108 cells l–1; Vaquer et al.1996, Bec et al. 2005). This numerical dominancecould be explained by the growth capacities ofPEUK — which have growth rates higher than those ofpicocyanobacteria (Bec et al. 2005). With increasing Nand P loads, the difference in size between eukaryoticpicoplankton (ca. 2 to 3 µm) and prokaryotic pico-plankton (ca. 1 µm) could favor nutrient uptake byPEUK (Raven 1986, Weisse 1993). This PEUK sizeclass exhibits the highest growth rates (up to 3.3 d–1)within the ultraphytoplankton (<10 µm) under bothnutrient sufficiency and deficiency (Bec et al. 2008),and appears particularly adapted to steady-statenutrient conditions in most lagoons. In terms of size,dense PEUK blooms are represented mainly by smallchlorophytes (2 to 3 µm) in eutrophic and hyper-trophic lagoons, while smaller PEUK (<1 µm) arerestricted to marine oligo-mesotrophic lagoons (U andT). In the Thau lagoon (T), the picophytoplankton isdominated by Ostreococcus tauri (Prasinophyte), thesmallest-known autotrophic eukaryote (Courties et al.1994). These results show that the size-dependence ofnutrient acquisition could shape the phytoplanktonsize structure even among the PEUK community.
Continued nutrient uptake by massive blooms ofPEUK can lead to permanent nutrient exhaustion,particularly in summer, preventing the developmentof larger microalgae (Sorokin et al. 1996). This is rein-forced by the relative contribution of PEUK andNANO to total chl a biomass (increasing and decreas-ing trend, respectively) with increasing trophic statusof lagoons (Fig. 7). For the PEUK fraction, theseresults contrast with the general trend of many marineand freshwater systems (Agawin et al. 2000, Bell &Kalff 2001, Callieri & Stockner 2002). An especiallyimportant contribution of the PEUK (>80% of totalchl a biomass) is estimated here in hypertrophiclagoons, whereas the contribution of the picophyto-plankton to the phytoplankton biomass is generallyreduced in hypertrophic systems (Takamura & Nojiri1994, Sommaruga & Robarts 1997). A similar result isobserved in hypertrophic freshwater lakes wherePEUK numerically dominate (Hepperle & Krienitz2001). NANO are decreasingly important as lagooneutrophication proceeds, similarly to freshwater lakes(Masson et al. 2000). The growth of large phytoplank-ton (>3 µm) is strongly regulated by nutrient avail-ability (Chisholm 1992, Bec et al. 2005). The relativeimportance of NANO increases in lagoon waterswhen these microalgae are released from the limita-tion of nutrient diffusion (e.g. allochthonous nutrientpulses). As reported in productive estuarine systems(Gobler et al. 2002), the large phytoplankton (>3 µm)are dominated in terms of abundance and biomass(B. Bec unpubl. data) by small diatoms and phytofla-gellates (ca. 3 to 6 µm), particularly in eutrophic andhypertrophic lagoons. The pulses of NH4
+, the majorsource of DIN entering lagoons from sewage treat-ment plants (Souchu et al. 2010), could also favor thesignificance of small eukaryotic algae because PEUK(Boutière et al. 1982, Gobler et al. 2002) and NANO(Collos et al. 2003, Wafar et al. 2004) have the abilityto use, and generally prefer, reduced forms of nitro-gen for growth. Rain events may support chain-form-ing diatom blooms in oligo- and mesotrophic lagoons(L, T, GR, BS) where PEUK abundances arerestrained. Microphytoplankton are the main contrib-utor to total chl a biomass in these lagoons (Collos etal. 2003, Bec et al. 2005).
Influence of freshwater discharge
In coastal waters, freshwater inputs can affect hydro-logical conditions, salinity and nutrient availability thatalter phytoplankton biomass and community structure(Phlips et al. 2002, Puigserver et al. 2002, Paerl et al.2003). Lagoons exposed to large and continuous inputsof freshwater (CA and PO) were distinguished by par-
41

Aquat Microb Ecol 63: 29–45, 2011
tial consumption of nutrients and reduced phytoplank-ton biomass. Repeated periods of instability of thewater column in systems exposed to high tides or con-tinuous freshwater runoff lead to a decrease in chl abiomass compared to less turbulent systems (Monbet1992, Puigserver et al. 2002). Rapid changes in salinitycould also be a stress factor for phytoplankton commu-nities (Phlips et al. 2002). In other lagoons, long resi-dence time (several months), due to low tidal ampli-tudes, could contribute to biomass accumulation andhigh standing crops of phytoplankton (Knopper 1994)and, in particular, to the accumulation of picoplank-tonic populations (Sorokin et al. 1996, Phlips et al.1999). Hydrological variations can also alter the phyto-plankton community structure by differentially affect-ing taxonomic groups depending on their growth char-acteristics (Paerl et al. 2003). The relative importanceof NANO, composed of small diatoms and phytoflagel-lates (ca. 3 to 6 µm), increases in shallow lagoonsexposed to high nutrient loads from continuous inputsof freshwater or discontinuous floods. In contrast,dinoflagellates (>20 µm) are observed mainly in deeplagoons (>2 m) typified by the greatest water-columnstability and exposed to low inputs of nutrients, andharmful dinoflagellates occur particularly in oligo-trophic and mesotrophic lagoons (Collos et al. 2009). Asimilar situation is observed in the Seto Inland Seawhere Alexandrium tamarense and Karenia mikimotoideveloped as nutrient levels decreased (Nishikawa etal. 2010). As the development of harmful dinoflagel-lates also occurred in nutrient-enriched conditions(Anderson et al. 2002, Brand & Compton 2007), othervariables must play a role in such blooms. Water insta-bility and pulsed inputs of nutrients related to highriver discharge favor fast-growing phytoplankton(Margalef 1978) such as diatoms, chlorophytes andcryptophytes (Paerl et al. 2003). In contrast, slower-growing organisms such as dinoflagellates are betteradapted under low-nutrient, low-turbulence condi-tions (Margalef 1978). In brackish lagoons, the periodicdevelopment of filamentous or colonial cyanobacteria(Spirulina, Anabaena and Gloeotrichia) could befavored by reduced flushing and large inputs of nutri-ents (Paerl et al. 2003). These cyanobacterial bloomsare often symptomatic of eutrophication of freshwatersas well as estuaries and coastal lagoons subjected tolarge nutrient loads (Knopper 1994).
Influence of salinity
The 24 coastal lagoons exhibit a large salinity gradi-ent that partly drives the dynamics of 2 types of pico-cyanobacteria. PC-CYAN are sporadically observed,except for a wetland-like lagoon (BA) that stands out
by its low salinity (<5) and massive PC-CYAN blooms(5 × 10⁹ cells l–1). In other lagoons, their developmentcoincides with decreases in salinity (salinity range:6 to 20) following floods. PC-CYAN are commonlyobserved in freshwater and estuarine systems (Vöröset al. 1998, Collier 2000) where their distribution andcontribution to the picoplankton community have oftenbeen associated with a salinity gradient (Tamigneauxet al. 1995, Robineau et al. 1999, Murrell & Lores 2004).In estuaries, a shift in dominance from PE-CYAN toPC-CYAN is observed for a salinity below 20 to 25(Robineau et al. 1999, Murrell & Lores 2004). PE-CYAN numerically dominate the picoplanktonic com-munity only in deep marine lagoons (L, D and U) pre-senting low annual salinity variations and salinitiesclose to that of the Mediterranean Sea. Strong varia-tions in salinity in other lagoons (e.g. the ‘Palavasian’series) do not prevent their development, but maxi-mum densities remain 10 to 40 times lower than PEUKdensities. These results point out the ubiquity andresilience of picocyanobacteria and suggest the pres-ence of different strains that are physiologicallyadapted to lagoonal environmental conditions.
Influence of underwater light quality
The distribution of the 2 types of picocyanobacteria inlagoons could be due to physiological adaptations toother factors co-varying with salinity (Murrell & Lores2004). In particular, their distribution patterns could bedriven by the underwater light field (Stomp et al. 2007).PE-CYAN dominate in marine oligotrophic lagoonswhereas high densities of PC-CYAN are observed inbrackish and hypertrophic lagoons. PE-CYAN stronglyabsorb radiation of wavelengths between 500 and575 nm and are thus better adapted than othercyanobacteria (PC-CYAN or the genus Prochlorococcus)to benefit from green light in coastal waters (Kirk 1994,Stomp et al. 2007). This leads to their predominancewithin the picoplankton community in clear waterswhere concentrations of suspended particles and dis-solved organic matter are low (Tamigneaux et al. 1995,Vörös et al. 1998, Gin et al. 2003). In contrast, PC-CYANstrongly absorb radiation of wavelengths between 600and 650 nm (Kirk 1994, Stomp et al. 2007) and are welladapted to freshwater and coastal marine systems wherethe spectral light quality is altered (from green to red) byturbid waters that are loaded with dissolved and partic-ulate organic matter or rich in chlorophyll (Vörös et al.1998, Camacho et al. 2003). As a consequence, the shiftfrom PE-CYAN dominance in lagoons characterized bylow turbidity and low chl a (<3 µg chl a l–1) to PC-CYANdominance in waters rich in chl a (>30 µg chl a l–1) couldbe driven by a high attenuation of light and a change in
42

Bec et al.: Picoeukaryotes in Mediterranean coastal lagoons
the underwater light quality along the trophic gradient(Pick 1991, Vörös et al. 1998). Nevertheless, PC-CYANand PE-CYAN co-occur in low-chl a lagoons undermarine influence (U, AY and GR) as well as in brackishturbid waters (the ’Palavasian’ series), as observed inestuarine and coastal systems (Robineau et al. 1999,Murrell & Lores 2004, Haverkamp et al. 2008) and fresh-water lakes (Vörös et al. 1998, Mózes et al. 2006).
In summary, the wide anthropogenic and salinitygradients observed in 24 Mediterranean coastallagoons showed that picocyanobacteria, PEUK andNANO respond differently to environmental perturba-tions (nutrients, salinity), and that nutrient availabilityis a major factor in structuring the communities. Thecell size is a key morphological trait that impacts nutri-ent acquisition and growth, and finally shapes thestructure of the phytoplankton community, even in thepicoplanktonic cell range. Steady-state nutrient condi-tions observed in most eutrophic and hypertrophiclagoons resulted in the dominance of small eukaryoticalgae. PEUK belonging mainly to the upper picoplank-tonic size limit (ca. 2 to 3 µm) are the most competitivegroup among pico- and nanophytoplankton. Their rel-ative importance, in terms of abundance and biomass,generally increases with increasing trophic status, con-trasting with the general trend of many marine andfreshwater systems. These results confirm that PEUKare able to thrive in coastal ecosystems, not only inoligo-mesotrophic marine waters but also in eutrophicand hypertrophic brackish waters.
Acknowledgements. This paper uses data from the LagoonMonitoring Network (Réseau de Suivi Lagunaire) funded byAgence de l’Eau, Région Languedoc-Roussillon and Ifremer.Data from Corsican lagoons were supported by Office del’Environnement de la Corse (Grant 98/162) and InterregFrance–Italy project (Grant 98/474). We thank the staff of theIfremer laboratories in Corsica and Languedoc-Roussillon,the Parc Naturel Régional de la Narbonnaise and the RéserveNaturelle de Biguglia for data collection. The authors aregrateful to anonymous reviewers for their comments on themanuscript. We also thank W. K. W. Li for help in flowcytograms analysis and V. H. Smith for comments on earlierversions of this manuscript.
LITERATURE CITED
Agawin NSR, Duarte CM, Agusti S (1998) Growth and abun-dance of Synechococcus sp. in a Mediterranean Bay: sea-sonality and relationship with temperature. Mar Ecol ProgSer 170:45–53
Agawin NSR, Duarte CM, Agusti S (2000) Nutrient and tem-perature control of the contribution of picoplankton tophytoplankton biomass and production. Limnol Oceanogr45:591–600
Anderson DA, Glibert PM, Burkholder JM (2002) Harmfulalgal blooms and eutrophication: nutrient sources, compo-sition, and consequences. Estuaries 25:704–726
Bec B, Husseini-Ratrema J, Collos Y, Souchu P, Vaquer A(2005) Phytoplankton seasonal dynamics in a Mediter-ranean coastal lagoon: emphasis on the picoeukaryotecommunity. J Plankton Res 27:881–894
Bec B, Collos Y, Vaquer A, Mouillot D, Souchu P (2008)Growth rate peaks at intermediate cell size in marinephotosynthetic picoeukaryotes. Limnol Oceanogr 53:863–867
Bell T, Kalff J (2001) The contribution of picophytoplankton inmarine and freshwater systems of different trophic statusand depth. Limnol Oceanogr 46:1243–1248
Boutière H, de Bovée F, Delille D, Fiala M and others (1982)Effect of a dystrophic crisis in the Salses-Leucate lagoon.Oceanol Acta Actes Symp Int sur les lagunes côtières,SCOR/IABO/UNESCO, Bordeaux, 8–14 September1981:231–242
Brand LE, Compton A (2007) Long-term increase in Kareniabrevis abundance along the Southwest Florida coast.Harmful Algae 6:232–252
Callieri C, Stockner J (2002) Freshwater autotrophic pico-plankton: a review. J Limnol 61:1–14
Calvo-Díaz A, Morán XAG (2006) Seasonal dynamics ofpicoplankton in shelf waters of the southern Bay of Biscay.Aquat Microb Ecol 42:159–174
Camacho A, Miracle MR, Vicente E (2003) Which factorsdetermine the abundance and distribution of pico-cyanobacteria in inland waters? A comparison among dif-ferent types of lakes and ponds. Arch Hydrobiol 157:321–338
Caroppo C (2000) The contribution of picophytoplankton tocommunity structure in a Mediterranean brackish envi-ronment. J Plankton Res 22:381–397
Chisholm SW (1992) Phytoplankton size. In: Falkowski PG,Woodhead AD (eds) Primary productivity and biogeo-chemical cycles in the sea. Plenum Press, New York, NY,p 213–237
Cloern JE, Jassby AD (2008) Complex seasonal patterns ofprimary producers at the land–sea interface. Ecol Lett 11:1294–1303
Collier JL (2000) Flow cytometry and the single cell in phycol-ogy. J Phycol 36:628–644
Collos Y, Vaquer A, Bibent B, Souchu P, Slawyk G, Garcia N(2003) Response of coastal phytoplankton to ammoniumand nitrate pulses: seasonal variations of nitrogen uptakeand regeneration. Aquat Ecol 37:227–236
Collos Y, Bec B, Jauzein C, Abadie E and others (2009) Oligo-trophication and emergence of picocyanobacteria and atoxic dinoflagllate in Thau lagoon, southern France. J SeaRes 61:68–75
Contreras F, Kerekes J (1993) Total phosphorus–chlorophyllrelationship in tropical coastal lagoons in Mexico. Verh IntVer Limnol 25:448–451
Courties C, Vaquer A, Troussellier M, Lautier J and others(1994) Smallest eukaryotic organism. Nature 370:255
Gin KYH, Zhang S, Lee YK (2003) Phytoplankton communitystructure in Singapore’s coastal waters using HPLC pig-ment analysis and flow cytometry. J Plankton Res 25:1507–1519
Glibert PM, Boyer JN, Heil CA, Madden C, Sturgis B, Waz-niak CS (2010) Blooms in lagoons: different from those ofriver-dominated estuaries. In: Kennish M, Paerl H (eds)Coastal lagoons: critical habitats of environmentalchange. CRC Press, Boca Raton, FL
Gobler CJ, Renaghan MJ, Buck NJ (2002) Impacts of nutri-ents and grazing mortality on the abundance of Aureococ-cus anophagefferens during a New York brown tidebloom. Limnol Oceanogr 47:129–141
43

Aquat Microb Ecol 63: 29–45, 2011
Grégori G, Colosimo A, Denis M (2001) Phytoplankton groupdynamics in the Bay of Marseilles during a 2-year surveybased on analytical flow cytometry. Cytometry 44:247–256
Haverkamp T, Acinas SG, Doeleman M, Stomp M, HuismanJ, Stal LJ (2008) Diversity and phylogeny of Baltic Seapicocyanobacteria inferred from their ITS and phyco-biliprotein operons. Environ Microbiol 10:174–188
Hepperle D, Krienitz L (2001) Systematics and ecology ofchlorophyte picoplankton in German inland waters alonga nutrient gradient. Int Rev Hydrobiol 86:269–284
Jacquet S, Lennon JF, Marie D, Vaulot D (1998) Picoplanktonpopulation dynamics in coastal waters of the northwesternMediterranean Sea. Limnol Oceanogr 43:1916–1931
Kana TM, Glibert PM (1987) Effect of irradiances up to 2000µE m–2 s–1 on marine Synechococcus WH7803. Deep-SeaRes 34:497–516
Kirk JTO (1994) Light and photosynthesis in aquatic ecosys-tems. Cambridge University Press, Cambridge
Kjerfve B (1994) Coastal lagoons. In: Kjerfve B (ed) Coastallagoon processes. Elsevier Oceanography Series 60,Amsterdam, p 1–8
Knoppers B (1994) Aquatic primary production in coastallagoons In: Kjerfve B (ed) Coastal lagoon processes. Else-vier Oceanography Series 60, Amsterdam, p 243–287
Legendre L, Rassoulzadegan F (1995) Plankton and nutrientdynamics in marine waters. Ophelia 41:153–172
Li WKW, Dickie PM (2001) Monitoring phytoplankton, bacte-rioplankton, and virioplankton in a coastal inlet (BedfordBasin) by flow cytometry. Cytometry 44:236–246
Malone TC (1980) Algal size. In: Morris I (ed) The physio-logical ecology of phytoplankton. Blackwell, Oxford,p 433–463
Margalef R (1978) Life-forms of phytoplankton as survivalalternatives in an unstable environment. Oceanol Acta 1:493–510
Marie D, Partensky F, Vaulot D, Brussaard C (1999) Enumer-ation of phytoplankton, bacteria and viruses in marinessamples. In: Robinson JP, Darzynkiewicz D, Dean PN,Orfao A and others (eds) Current protocols in cytometry.John Wiley, New York, NY, p 1–15
Masson S, Pinel-Alloul B, Smith VH (2000) Total phospho-rus–chlorophyll: size fraction relationships in southernQuébec lakes. Limnol Oceanogr 45:732–740
Monbet Y (1992) Control of phytoplankton biomass in estuar-ies: a comparative analysis of microtidal and macrotidalestuaries. Estuaries 15:563–571
Morel A, Ahn YH, Partensky F, Vaulot D, Claustre H (1993)Prochlorococcus and Synechococcus: a comparative studyof their optical properties in relation to their size and pig-mentation. J Sea Res 51:617–649
Mózes A, Présing M, Vörös L (2006) Seasonal dynamics ofpicocyanobacteria and picoeukaryotes in a large shallowlake (Laka Balaton, Hungary). Int Rev Hydrobiol 91:38–50
Murrell MC, Lores EM (2004) Phytoplankton and zooplank-ton seasonal dynamics in a subtropical estuary: impor-tance of cyanobacteria. J Plankton Res 26:371–382
Neveux J, Lantoine F (1993) Spectrofluorimetric assay ofchlorophylls and phaeopigments using the least squaresapproximation technique. Deep-Sea Res 40:1747–1765
Ning X, Cloern JE, Cole BE (2000) Spatial and temporal vari-ability of picoyanobacteria Synechococcus sp. in SanFrancisco Bay. Limnol Oceanogr 45:695–702
Nishikawa T, Hori Y, Nagai S, Miyahara K and others (2010)Nutrient and phytoplankton dynamics in Harima-Nada,eastern Seto Inland Sea, Japan, during a 35-year periodfrom 1973 to 2007. Estuar Coast 33:417–427
Paerl HW, Dyble J, Moisander PH, Noble RT and others(2003) Microbial indicators of aquatic ecosystem change:current application to eutrophication studies. FEMSMicrobiol Ecol 46:233–246
Paerl HW, Valdes LM, Peierls BL, Adolf JE, Harding LW(2006) Anthropogenic and climatic influences on theeutrophication of large estuarine ecosystems. LimnolOceanogr 51:448–462
Pan LA, Zhang J, Zhang LH (2007) Picophytoplankton,nanophytoplankton, heterotrophic bacteria and viruses inthe Chanjiang Estuary and adjacent coastal waters.J Plankton Res 29:187–197
Partensky F, Blanchot J, Vaulot D (1999) Differential distri-bution and ecology of Prochlorococcus and Synechococ-cus in oceanic waters: a review. Bull Inst Oceanogr 19:457–476
Phlips EJ, Badylak S, Lynch TC (1999) Blooms of thepicoplanktonic cyanobacterium Synechococcus in FloridaBay, a subtropical inner-shelf lagoon. Limnol Oceanogr44:1166–1175
Phlips EJ, Badylak S, Grosskopf T (2002) Factors affecting theabundance of phytoplankton in a restricted subtropicallagoon, the Indian river lagoon, Florida, USA. EstuarCoast Shelf Sci 55:385–402
Pick FR (1991) The abundance and composition of freshwaterpicocyanobacteria in relation to light penetration. LimnolOceanogr 36:1457–1462
Puigserver M, Ramon G, Moyà G, Martínez-Taberner A(2002) Planktonic chlorophyll a and eutrophication in twoMediterannean litorral systems (Mallorca Island, Spain).Hydrobiologia 475/476:493–504
Raven JA (1986) Physiological consequences of extremelysmall size for autotrophic organisms in the sea. In: Platt T,Li WKW (eds) Photosynthetic picoplancton. Can Bull FishAquat Sci 214, Fisheries and Oceans, Ottawa
Robineau B, Legendre L, Michel C, Budeus G, Kattner G,Schneider W, Pesant S (1999) Ultraphytoplankton abun-dances and chlorophyll a concentrations in ice-coveredwaters of northern seas. J Plankton Res 21:735–755
Schramm W (1999) Factors influencing seaweed responses toeutrophication: some results from EU-project EUMAC.J Appl Phycol 11:69–78
Sokal RR, Rohlf FJ (1981) Biometry, 2nd edn. WH Freeman,San Francisco, CA
Sommaruga R, Robarts RD (1997) The significance ofautotrophic and heterotrophic picoplankton in hyper-trophic ecosystems. FEMS Microbiol Ecol 24:187–200
Sorokin YI, Sorokin YP, Gnes A (1996) Structure and function-ing of the anthropogenically transformed Comacchiolagoonal ecosystem (Ferrara, Italy). Mar Ecol Prog Ser 133:57–71
Souchu P, Bec B, Smith VH, Laugier T and others (2010) Pat-terns in nutrient limitation and chlorophyll a along ananthropogenic eutrophication gradient in French Mediter-ranean coastal lagoons. Can J Fish Aquat Sci 67:743–753
Stomp M, Huisman J, Vörös L, Pick F, Laamanen M,Haverkamp T, Stal L (2007) Colourful coexistence of redan green picocyanobacteria in lakes and seas. Ecol Lett10:290–298
Takamura N, Nojiri Y (1994) Picophytoplankton biomass inrelation to lake trophic state and the TN:TP ratio of lakewater in Japan. J Phycol 30:439–444
Tamigneaux E, Vazquez E, Mingelbier M, Klein B, LegendreL (1995) Environmental control of phytoplankton assem-blages in nearshore marine waters, with special emphasison phototrophic ultraplankton. J Plankton Res 17:1421–1447
44

Bec et al.: Picoeukaryotes in Mediterranean coastal lagoons
Thingstad TF, Zweifel UL, Rassoulzadegan F (1998) P limi-tation of heterotroph bacteria and phytoplankton in thenorthwest Mediterranean. Limnol Oceanogr 43:88–94
Troussellier M, Courties C, Zettelmaier S (1995) Flow cyto-metric analysis of coastal lagoon bacterioplankton andpicophytoplankton: fixation and storage effects. EstuarCoast Shelf Sci 40:621–633
Utermöhl H (1958) Zur Vervollkommnung der quantitativenPhytoplankton-Methodik. Mitt Int Ver Theor Angew Lim-nol 9:1–38
Vaillancourt RD, Brown CW, Guillard RRL, Balch WM (2004)Light scattering properties of marine phytoplankton: rela-tionships to cell size, chemical composition and taxonomy.J Plankton Res 26:191–212
Vaquer A, Troussellier M, Courties C, Bibent B (1996) Stand-ing stock and dynamics of picophytoplankton in the
Thau lagoon (northwest Mediterranean coast). LimnolOceanogr 41:1821–1828
Vörös L, Callieri C, Balogh KV, Bertoni R (1998) Freshwaterpicocyanobacteria along a trophic gradient and light qual-ity range. Hydrobiologia 369/370:117–125
Wafar M, L’Helguen S, Raikar V, Maguer JF, Le Corre P(2004) Nitrogen uptake by size-fractionated plankton inpermanently well-mixed temperate coastal waters.J Plankton Res 26:1207–1218
Weisse T (1993) Dynamics of autotrophic picoplankton inmarine and freshwater ecosystems. In: Jones JG (ed)Advances in microbial ecology. Plenum Press, New York,NY, p 327–370
Worden A, Nolan JK, Palenik B (2004) Assessing the dynamicsand ecology of marine picophytoplankton: the importance ofthe eukaryotic component. Limnol Oceanogr 49:168–179
45
Editorial responsibility: Patricia Glibert,Cambridge, Maryland, USA
Submitted: July 29, 2010; Accepted: November 30, 2010Proofs received from author(s): February 14, 2011