distribution of long-range linkage disequilibrium and ...634511/fulltext01.pdf · gene n length of...
TRANSCRIPT

INVESTIGATION
Distribution of Long-Range Linkage Disequilibriumand Tajima’s D Values in Scandinavian Populationsof Norway Spruce (Picea abies)Hanna Larsson,*,1 Thomas Källman,* Niclas Gyllenstrand,† and Martin Lascoux**Department of Ecology and Genetics, EBC, Uppsala University, 752 36 Uppsala, Sweden, and †Department of PlantBiology and Forest Genetics, Swedish University of Agricultural Sciences, Uppsala, 750 07 Uppsala, Sweden
ABSTRACT The site frequency spectrum of mutations (SFS) and linkage disequilibrium (LD) are the twomajor sources of information in population genetics studies. In this study we focus on the levels of LD andthe SFS and on the effect of sample size on summary statistics in 10 Scandinavian populations of Norwayspruce. We found that previous estimates of a low level of LD were highly influenced by both samplingstrategy and the fact that data from multiple loci were analyzed jointly. Estimates of LD were in factheterogeneous across loci and increased within individual populations compared with the estimate from thetotal data. The variation in levels of LD among populations most likely reflects different demographichistories, although we were unable to detect population structure by using standard approaches. As inprevious studies, we also found that the SFS-based test Tajima’s D was highly sensitive to sample size,revealing that care should be taken to draw strong conclusions from this test when sample size is small. Inconclusion, the results from this study are in line with recent studies in other conifers that have revealeda more complex and variable pattern of LD than earlier studies suggested and with studies in trees andhumans that suggest that Tajima’s D is sensitive to sample size. This has large consequences for the designof future association and population genetic studies in Norway spruce.
KEYWORDS
linkagedisequilibrium
coniferrecombinationTajima’s Dresampling
Population genetics inferences are primarily based on two sources ofinformation: the site frequency spectrum of mutations (SFS) and thestatistical association among those, that is, linkage disequilibrium (LD).The SFS has been the main source of information for demographicinferences and tests of selection, whereas LD is the key parameter inassociation mapping studies, impacting their feasibility, cost, and res-olution. In the presence of long-range LD, fewer markers are requiredfor mapping purposes, but mapping precision will be low. Conversely,if LD decays quickly, a large number of markers will be needed to coverthe genome leading to a high cost but also to a high precision. Both theSFS and LD are influenced by the joint effect of biological factors, such
as the rates of recombination and mutation, the demographic historyof the population, and natural selection. They are therefore both highlydependent on which species, which part of the range within thatspecies, and which parts of the genome are considered. In the presentstudy we will focus on LD and the SFS estimated in Scandinavianpopulations of Norway spruce (Picea abies).
In general, conifers are expected to have a low level of LD or,conversely, a high population recombination rate, because theirrepresentatives are mostly outcrossing species with large effectivepopulation sizes (e.g., Chen et al. 2010). Consistent with this notion,several multilocus studies have found LD decaying rapidly with dis-tance between segregating sites in conifers (Brown et al. 2004;Krutovsky and Neale 2005; González-Martínez et al. 2006; Heuertzet al. 2006; Pyhäjärvi et al. 2007). This has led to the conclusion thattoo many markers would be required in conifers to make genome-wide association studies cost-effective (Neale and Savolainen 2004).These earlier studies were, however, based on relatively short loci(generally around 500 bp and up to 2.5 kb), and a recent review foundthat genome-wide recombination rates inferred from genetic mappingefforts were in fact lower in conifers than angiosperms (Jaramillo-Correa et al. 2010). In model plants, genome regions rich in repetitiveelements have reduced levels of recombination (e.g., Gaut et al. 2007)
Copyright © 2013 Larsson et al.doi: 10.1534/g3.112.005462Manuscript received December 20, 2012; accepted for publication March 5, 2013This is an open-access article distributed under the terms of the CreativeCommons Attribution Unported License (http://creativecommons.org/licenses/by/3.0/), which permits unrestricted use, distribution, and reproduction in anymedium, provided the original work is properly cited.Supporting information is available online at http://www.g3journal.org/lookup/suppl/doi:10.1534/g3.112.005462/-/DC11Corresponding author: Department of Ecology and Genetics, EBC, UppsalaUniversity, Norbyvägen 18D, 752 36 Uppsala, Sweden. E-mail: [email protected] and [email protected]
Volume 3 | May 2013 | 795

and the low genome-wide estimate in Jaramillo-Correa et al. (2010) ishypothesized to be, at least in part, the result of averaging recombi-nation rates across conifer genomes rich in repetitive and transposableelements.
Indeed, in a recent study in the conifer Cryptomeria japonica theauthors measured extensive LD at a distance of .100 kb in mostlynoncoding DNA consisting of ~50% repetitive sequences (Moritsukaet al. 2012). The approach of using several loci and sampling individ-uals from a large distribution range to estimate a common level of LDmay also have masked the variability of LD among genes that is nowemerging as whole gene studies report high levels of LD in some of thegenes examined (Lepoittevin et al. 2012; Namroud et al. 2010; Pavyet al. 2012). Notably, in Pinus sylvestris, in which previous studies
suggested a rapid breakdown of LD, the sequencing of a group ofallozyme coding loci revealed reduced recombination rates and com-plete linkage extending over several kilobases, possibly reflecting thepresence of selection at some of those genes (Pyhäjärvi et al. 2011).Clearly, the genomes of conifers are less than homogenous withregards to patterns of LD, and more data on the variability of LDacross species and the genome are needed to fully evaluate the appro-priate method for association mapping studies.
Tajima’s D (Tajima 1989) is one of the most popular summarystatistics of the SFS. It belongs to a large family of “neutrality” teststhat compare different estimates of the population mutation rate, u =4Nem (Zeng et al. 2006), where Ne is the effective population size andm is the mutation rate. The key idea behind these tests is that some
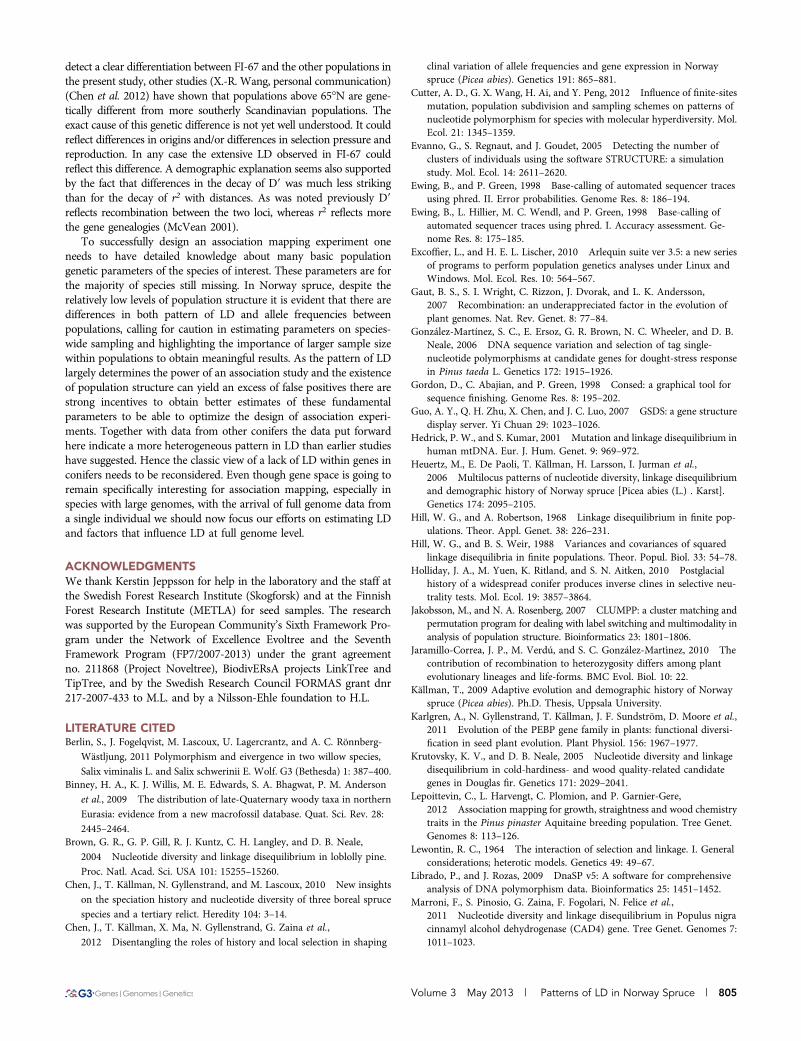
Figure 1 Map of Scandinaviawith the locations of sampledpopulations.
796 | H. Larsson et al.

estimators of u = 4Nem will be more sensitive than others to specificdepartures from the standard neutral model. Comparing two estima-tors of u should then indicate the type of departure experienced by thepopulation. For example, Tajima’s D is calculated by taking the dif-ference between the average pairwise nucleotide diversity (up), and thenumber of segregating sites as measured by uW, the latter being moresensitive than the former to an excess of rare variants (Tajima 1989).Hence, Tajima´s D values are negative when there is an excess of rarevariants and positive values are obtained when there is an excess ofintermediate frequency variants. Tajima’s D, as well as other teststatistics of the same family, is inherently sensitive to sample size, asuW is defined as a function of the number of segregating sites (S) andthe number of individuals (n). The impact of difference in sample sizeon estimates of Tajima’s D is difficult to track analytically becauseboth sampling strategy and species demographic history can haveimpact on the estimate (see, for example, Städler et al. 2009). In a studyof climate-related candidate genes in six populations of Sitka spruce,Holliday et al. (2010) showed that estimates of Tajima’s D becamemore positive toward the northern leading edge of the species distri-bution. They suggested that sequential population bottlenecks duringpostglacial recolonization created this pattern with rare variants morecommon in the south and medium-frequency variants more commonin the north.
Here, we investigate variation in estimated Tajima’s D values andthe level of LD at eleven loci in 10 Scandinavian populations of Nor-way spruce. In a previous study of nucleotide diversity, we concludedthat the species has low-to-moderate level of nucleotide diversity and
a low level of LD (Heuertz et al. 2006). However, these data includedonly two loci longer than 1 kb and results were therefore mostly basedon loci of short length (~500 bp). In light of the variability of LDrecently revealed in other conifer species, our first aim was to examinelevels of LD within longer fragments. The 10 populations used in thisstudy are located along a north to south gradient on both sides of theBaltic Sea. Earlier studies of spruce populations from this geographicalarea have revealed a weak, though biologically significant, populationstructure, likely reflecting recolonization routes within Scandinaviafollowing the last glacial maximum (Chen et al. 2012). Norway sprucerecolonized Scandinavia after the last glacial maximum from Russianpopulations located south of the ice sheet and, possibly, from crypticrefugia in the northern part of European Russia too (Binney et al.2009; Väliranta et al. 2011). The spread westwards followed two mainrecolonization routes (Tollefsrud et al. 2009), today reflected in a com-plex population genetic structure despite the generally high levels ofgene flow (Heuertz et al. 2006; Chen et al. 2012).
The second aim of our study was to investigate if estimated valuesof Tajima’s D from different populations varied and whether the var-iation varied in a clinal fashion as reported from Sitka spruce. BecauseTajima’s D estimates depend on sample size (Marroni et al. 2011;Nelson et al. 2012), three populations were sampled more denselyand we used a resampling approach within these populations to checkthe reliability of Tajima´s D values obtained from small sample sizes.
MATERIAL AND METHODSThe 11 genomic loci for this study were chosen from previous studiesof sequence variation and gene expression in P. abies and the selectionwas based on length of locus, available primer sequences, and ease ofamplification. PaCOL1 (Heuertz et al. 2006), PaMFT1, PaFTL1(Karlgren et al. 2011), PaPRR1, and PaPRR7 (Källman 2009) arehypothesized to be involved in the regulation of bud set due to se-quence similarity to known genes involved in the regulation of flower-ing time in the model species Arabidopsis thaliana. The remaining locicorrespond to genes exhibiting a significant differential expressionunder a bud set experiment in which plants were transferred fromconstant light to short day conditions (Källman 2009). Of these loci,PaCCA1, PaCDF1, and PaAP2L3 also show similarity to floweringtime genes. The length of the genes ranges from 1.5 kb to 7.2 kb,with a mean of 3.7 kb.
Ten natural populations from the Scandinavian distribution ofP. abies were chosen along a latitudinal gradient on both sides of the
n Table 1 Location of the populations used in this study andsample size
Population Name Latitude LongitudeNo. SampledIndividuals
Saleby SE-58 58� 369N 13� 12’E 8SörAmsberg SE-60 60� 459N 15� 42’E 8Fulufjället SE-61 61� 579N 12� 78’E 24Strängsund SE-62 62� 639N 15� 12’E 8Höglunda SE-64 64� 089N 18� 74’E 24Jock/Erkinvinsa SE-66 66� 589N 22� 70’E 8Punkaharju FI-61 61� 729N 29� 39’E 8Vilpuula FI-62 62� 029N 24� 63’E 8St2 FI-66 66� 249N 26� 53’E 8Sodankylä FI-67 67� 419N 26� 62’E 24
n Table 2 Nucleotide diversity and summary statistics for the 11 loci used to estimate long-range LD and structure in populationsof P. abies
Gene N Length of Amplicon, bp Bp Sequenced S (Singletons) H Hd uw p Tajima’s D
PaAP2L3 74 4681 457 5 (1) 7 0.58 2.2 1.8 20.42PaCDF1 107 1585 1028 23 (4) 22 0.92 4.3 2.9 20.94PaCOL1 81 2970 2449 64 (26) 39 0.97 5.3 3.3 21.22PaMFT1 96 4328 1597 62 (34) 54 0.95 7.6 3.3 21.81a
PaFTL1 109 2742 748 14 (4) 14 0.82 3.6 3.3 20.18PaCCA1 88 4126 742 24 (5) 21 0.90 6.4 4.1 21.1PaPRR7 93 7271 1796 31 (21) 23 0.88 3.4 1.6 21.65PaPRR1 114 1859 986 25 (8) 20 0.89 4.8 4.8 0.02PaWS02746 97 4411 470 34 (13) 40 0.96 14.1 12 20.43PaWS02749 100 3189 605 53 (20) 23 0.82 16.9 10.5 21.21PaZIP 113 4107 803 21 (6) 15 0.74 4.9 3.6 20.78
LD, linkage disequilibrium; N, Sample size; S, Number of segregating sites; H, Number of observed haplotypes; Hd, Observed haplotype diversity; uw, Watterson’sestimate of u (·10-03); p, Average nucleotide diversity (·10-03).aSignificant deviation from the standard neutral model.
Volume 3 May 2013 | Patterns of LD in Norway Spruce | 797

Baltic Sea, ranging from 58�N to 67�N (Figure 1). Seeds from eighttrees were sampled from each population except for two Swedishpopulations, Fulufjället (SE-61) and Höglunda (SE-64), and the mostnorthern Finnish population of Sodankylä (FI-67), where 24 treeswere sampled (Table 1). Total genomic DNA was extracted fromthe haploid megagametophyte tissue of one seed per individual usingDNeasy plant mini kit (QIAGEN). Because the aim was to obtainlong-range estimates of LD, we chose to amplify genes of considerablelength in full, or as overlapping fragments when total length exceededsuccessful amplification, and to sequence only the ends of amplifiedfragments to reduce cost (Voight et al. 2005; Berlin et al. 2011). Agraphical representation of the genes with exon and intron structurewas produced using the GSDS server (Guo et al. 2007). Amplificationswere performed with primer sequences and conditions as described inSupporting Information, Table S1. This paired-end sequencing ap-proach was performed using an ABI3730XL sequencer (MacrogenInc., Seoul, Korea). Sequences were base-called, assembled, and visu-alized for manual inspection and editing using the PHRED/PHRAP/CONSED program suite (Ewing et al. 1998; Ewing and Green 1998;Gordon et al. 1998). Bases with a Phred score .20 were retained foranalyses. Sequenced fragments were aligned to existing full-lengthsequences of all genes to determine the length between sequencedends. An alignment file containing sequence data for all loci andindividuals is available as File S1.
Population structureFor each locus, Arlequin v 3.5 (Excoffier and Lischer 2010) and R (RDevelopment Core Team 2012) were used to identify linked SNPswith a significant r2 of . 0.2 after Bonferroni correction. These SNPswere subsequently removed from a multilocus data set of all haplo-types and the population genetic structure was investigated usingSTRUCTURE v 2.3.2 (Pritchard et al. 2000). All 11 genes and allindividuals (in total 255 SNPs) were used in one analysis whereas
a more stringent approach, excluding 15 individuals for which onlya few genes were successfully sequenced and filtering loci with morethan 15% missing data, left loci from seven genes represented by 112SNPs to be analyzed. For both data sets, we used the LOCPRIORmodel with correlated allele frequencies among populations to per-form the analysis for a number of clusters ranging from K = 2 to K =10 with 10 independent runs for each K. A burn-in period of 100,000iterations and a run length of 1,000,000 iterations were used. Wemerged data from the 10 runs using the software CLUMP (Jakobssonand Rosenberg 2007). Global FST was calculated between the 10 pop-ulations for each locus in DnaSP v 5.10 (Librado and Rozas 2009).
Nucleotide diversity and sampling effect on Tajima’s DStandard population genetics parameters were calculated using DnaSPv 5.10 (Librado and Rozas 2009) for the combined data set as well asfor each of the three populations with larger sample size. Indels wereexcluded from all analyses. Tajima’s D was computed for all 10 pop-ulations to evaluate deviations from the standard neutral model. Toexamine the effect of sample size on estimates of neutrality in P. abies,eight individuals were resampled randomly from each of the threepopulations with larger sample size. The resampling was repeated 100times in each population and COMPUTE (Thornton 2003) was usedto calculate Tajima’s D for each of the resampled data sets, excludingmissing data to get comparable results to those obtained with DnaSP v5.10 (Librado and Rozas 2009).
Levels of LDThe squared correlation of allele frequencies (r2; Hill and Robertson1968) and D9 (Lewontin 1964) were used to estimate the degree of LDper locus and calculated based on pairwise comparisons between in-formative sites only in DnaSP v 5.10 (Librado and Rozas 2009). Thetwo measures of LD provide different information about the associa-tion between alleles: D9 reflects recombination between the two loci
Figure 2 A schematic representation of the eleven genes amplified in this study. The regions sequenced and analyzed are indicated underneatheach gene (see Legend).
798 | H. Larsson et al.
whereas r2 is more informative on the power to predict allele identitiesat one locus given allelic states at another locus. Fisher’s exact test wasused to determine the statistical significance of each pairwise test ata level of P, 0.05 after Bonferroni’s correction. The decay of LD overdistance was investigated by plotting r2 values between all informativesites against the distance between sites and fitting the expectation of r2
to the observed data, applying the formula from Hill and Weir (1988)in R (R core team 2012). The same was done with D9. In this case thedecay of D9 was fitted to the function D9(t) = (1-r)t where r is therecombination fraction between pairs of SNP and t, the parameter tobe estimated, is the number of generations since D9 = 1. In order tocompare patterns over populations we assumed 1 cM = 1 Mb. How-ever, because there are no data available on the relationship betweengenetic distance (centiMorgan) and physical distance (base pairs) forspruce species we also performed the analysis assuming 1 cM = 10Mb, 1 cM = 20 Mb and 1 cM = 0.5 Mb, but because the comparisonsamong populations were not altered we only report results for 1 cM =1 Mb. R code written by F. Marroni and available at http://fabiomarroni.wordpress.com/ was used to estimate t. The results were computed foreach gene separately and for the complete data set. Finally, all genes wereused to investigate the decay of LD within each of the populations witha larger sample size.
RecombinationThe composite likelihood method implemented in LDhat (McVeanet al. 2002) was used to estimate the population recombination pa-rameter r = 4Ner for each locus, where Ne is the effective populationsize and r is the per locus recombination rate per generation. Becauseour data set contained missing data, we took advantage of the pre-calculated likelihood files that are included with the software andassumed a fixed u = 4Nem οf 0.001 for all loci. The per-locus estimatewas calculated using the data set including all population, and usingthe three populations of larger sample size separately.
RESULTSBased on the individuals with shortest read length in every locus,a total of ~1.11 Mbp (1,118,584 bp) of sequence was used for theestimation of population genetics parameters (Table 2). A schematicrepresentation of the genes and the regions screened for variation canbe found in Figure 2. On average, 97 individuals per gene were suc-cessfully sequenced (ranging from 74 to 114 individuals) and 1062 bpwere sequenced per gene (ranging from 457 to 2449 nucleotides),yielding ~103,400 bp of sequence data per gene. For analyses allowingfor missing data the full range of read lengths among individualswas used, increasing the amount of sequence data analyzed. In
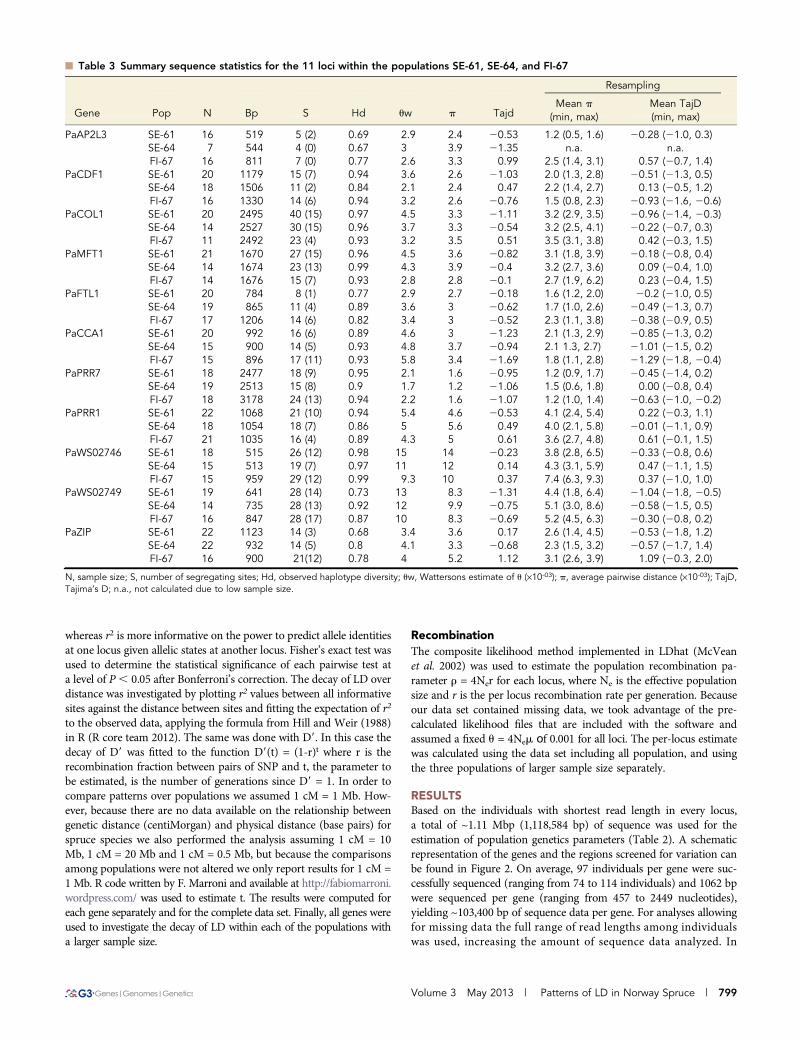
n Table 3 Summary sequence statistics for the 11 loci within the populations SE-61, SE-64, and FI-67
Gene
Resampling
Pop N Bp S Hd uw p TajdMean p
(min, max)Mean TajD(min, max)
PaAP2L3 SE-61 16 519 5 (2) 0.69 2.9 2.4 20.53 1.2 (0.5, 1.6) 20.28 (21.0, 0.3)SE-64 7 544 4 (0) 0.67 3 3.9 21.35 n.a. n.a.FI-67 16 811 7 (0) 0.77 2.6 3.3 0.99 2.5 (1.4, 3.1) 0.57 (20.7, 1.4)
PaCDF1 SE-61 20 1179 15 (7) 0.94 3.6 2.6 21.03 2.0 (1.3, 2.8) 20.51 (21.3, 0.5)SE-64 18 1506 11 (2) 0.84 2.1 2.4 0.47 2.2 (1.4, 2.7) 0.13 (20.5, 1.2)FI-67 16 1330 14 (6) 0.94 3.2 2.6 20.76 1.5 (0.8, 2.3) 20.93 (21.6, 20.6)
PaCOL1 SE-61 20 2495 40 (15) 0.97 4.5 3.3 21.11 3.2 (2.9, 3.5) 20.96 (21.4, 20.3)SE-64 14 2527 30 (15) 0.96 3.7 3.3 20.54 3.2 (2.5, 4.1) 20.22 (20.7, 0.3)FI-67 11 2492 23 (4) 0.93 3.2 3.5 0.51 3.5 (3.1, 3.8) 0.42 (20.3, 1.5)
PaMFT1 SE-61 21 1670 27 (15) 0.96 4.5 3.6 20.82 3.1 (1.8, 3.9) 20.18 (20.8, 0.4)SE-64 14 1674 23 (13) 0.99 4.3 3.9 20.4 3.2 (2.7, 3.6) 0.09 (20.4, 1.0)FI-67 14 1676 15 (7) 0.93 2.8 2.8 20.1 2.7 (1.9, 6.2) 0.23 (20.4, 1.5)
PaFTL1 SE-61 20 784 8 (1) 0.77 2.9 2.7 20.18 1.6 (1.2, 2.0) 20.2 (21.0, 0.5)SE-64 19 865 11 (4) 0.89 3.6 3 20.62 1.7 (1.0, 2.6) 20.49 (21.3, 0.7)FI-67 17 1206 14 (6) 0.82 3.4 3 20.52 2.3 (1.1, 3.8) 20.38 (20.9, 0.5)
PaCCA1 SE-61 20 992 16 (6) 0.89 4.6 3 21.23 2.1 (1.3, 2.9) 20.85 (21.3, 0.2)SE-64 15 900 14 (5) 0.93 4.8 3.7 20.94 2.1 1.3, 2.7) 21.01 (21.5, 0.2)FI-67 15 896 17 (11) 0.93 5.8 3.4 21.69 1.8 (1.1, 2.8) 21.29 (21.8, 20.4)
PaPRR7 SE-61 18 2477 18 (9) 0.95 2.1 1.6 20.95 1.2 (0.9, 1.7) 20.45 (21.4, 0.2)SE-64 19 2513 15 (8) 0.9 1.7 1.2 21.06 1.5 (0.6, 1.8) 0.00 (20.8, 0.4)FI-67 18 3178 24 (13) 0.94 2.2 1.6 21.07 1.2 (1.0, 1.4) 20.63 (21.0, 20.2)
PaPRR1 SE-61 22 1068 21 (10) 0.94 5.4 4.6 20.53 4.1 (2.4, 5.4) 0.22 (20.3, 1.1)SE-64 18 1054 18 (7) 0.86 5 5.6 0.49 4.0 (2.1, 5.8) 20.01 (21.1, 0.9)FI-67 21 1035 16 (4) 0.89 4.3 5 0.61 3.6 (2.7, 4.8) 0.61 (20.1, 1.5)
PaWS02746 SE-61 18 515 26 (12) 0.98 15 14 20.23 3.8 (2.8, 6.5) 20.33 (20.8, 0.6)SE-64 15 513 19 (7) 0.97 11 12 0.14 4.3 (3.1, 5.9) 0.47 (21.1, 1.5)FI-67 15 959 29 (12) 0.99 9.3 10 0.37 7.4 (6.3, 9.3) 0.37 (21.0, 1.0)
PaWS02749 SE-61 19 641 28 (14) 0.73 13 8.3 21.31 4.4 (1.8, 6.4) 21.04 (21.8, 20.5)SE-64 14 735 28 (13) 0.92 12 9.9 20.75 5.1 (3.0, 8.6) 20.58 (21.5, 0.5)FI-67 16 847 28 (17) 0.87 10 8.3 20.69 5.2 (4.5, 6.3) 20.30 (20.8, 0.2)
PaZIP SE-61 22 1123 14 (3) 0.68 3.4 3.6 0.17 2.6 (1.4, 4.5) 20.53 (21.8, 1.2)SE-64 22 932 14 (5) 0.8 4.1 3.3 20.68 2.3 (1.5, 3.2) 20.57 (21.7, 1.4)FI-67 16 900 21(12) 0.78 4 5.2 1.12 3.1 (2.6, 3.9) 1.09 (20.3, 2.0)
N, sample size; S, number of segregating sites; Hd, observed haplotype diversity; uw, Wattersons estimate of u (·10-03); p, average pairwise distance (·10-03); TajD,Tajima’s D; n.a., not calculated due to low sample size.
Volume 3 May 2013 | Patterns of LD in Norway Spruce | 799

the restricted dataset, we identified a total of 356 segregating sites, ofwhich 142 were singletons and 209 were parsimony informativesites. Five sites were found to be multi allelic and were not includedin the analyses.
In the three populations of larger sample size, the average numberof sequenced individuals was 20 in SE-61 and 16 in both SE-64 and FI-67. The average length of sequence analyzed per gene was 1224 bp inSE-61, 1251 bp in SE-64, and 1393 bp in SE-67, with a total of 218, 187and 208 segregating sites identified respectively, for details see Table 3.
Population structureThere was no clear population structure among the populationssampled in this study. The DK method (Evanno et al. 2005) suggeststhat the data set most likely consists of two clusters, whereas thelikelihood values suggest that the data set is made up of five, seven,or eight clusters with generally small differences in likelihood betweendifferent K values. Plotting individual cluster assignments for both K =2 and K = 3 (the number of possible clusters suggested by Chen et al.2012) further vindicate the lack of meaningful structure as most indi-viduals look admixed and there is no clear geographic pattern emerging
(Figure S1). There was no difference between using all loci (includingthose with missing data) and the more conservative approach whereless missing data were allowed.
In line with these results, observed global FST values at individualgenes between all populations varied between virtually 0 and 0.049.Using only the three populations with larger sample size led to a slightincrease in FST values and for PaFTL1 an FST of close to 0.2 wasobtained (Table S2).
Nucleotide diversity and Tajima’s DPolymorphisms from both coding and noncoding regions of the geneswere used to estimate nucleotide diversity. We chose to analyze themjointly because the amount of coding sequence was limited andtreating synonymous and nonsynonymous sites separately would haveled to estimates based on only a small number of sites. For the totaldata set, the mean nucleotide diversity (p) was 0.0047 (SD = 0.0034),the mean value of Watterson’s estimator (u) was 0.0067 (SD =0.0046), and the average haplotype diversity was 0.86 (SD = 0.16).Overall, PaAP2L3 was the least variable gene, with only five polymor-phic sites. PaWS02746 and PaWS02749 both had greater p and u
Figure 3 Within population estimates of mean Tajima’sD across eleven loci plotted against latitude of origin.Boxes denote estimates from the number of individualssampled from the population. The mean across elevenloci within resampled populations SE-61, SE-64 andFI-67 is plotted with circles, triangles and crosses re-spectively (see legend).
800 | H. Larsson et al.

values than all other genes but similar values of haplotype diversity,whereas PaZIP had lower haplotype diversity with average values ofnucleotide diversity. The mean Tajima’s D was 20.88 (SD = 0.59),with PaPRR1 being the only gene with a positive value (Table 2). Theonly significant Tajima’s D, 21.81, was found in PaMFT1. MeanTajima’s D over all genes was plotted for each population againstlatitude of origin, revealing a weak trend toward more positive valuesas one moves north. The pattern was clear when looking at the threepopulations with larger sample size, but for the populations with fewerindividuals there was no such pattern (Figure 3). Reducing the data set
to include only candidate genes for bud set did not alter the outcome(data not shown).
Despite an added amount of sequence data and reduced samplesize, the mean p in populations FUL, HOG, and SOD was very similarto the mean obtained over the total data set and single gene estimatesvaried only slightly between populations (Table 3). In contrast, valuesof Tajima’s D obtained in the three populations differed from esti-mates obtained from the total data set and were also quite variableamong populations. Several genes had a positive Tajima’s D, withSOD being the population with the most positive values.
Figure 4 Plot of the squaredcorrelation of allele frequencies(r2) vs. distance in base pairsacross 11 loci for different sub-sets of populations. (Top left) allten populations n=97, (top right)SE-61 n=20, (bottom left) SE-64n=16, and (bottom right) FI-67n=16.
Volume 3 May 2013 | Patterns of LD in Norway Spruce | 801

Effect of sample sizeAs expected, resampling showed that estimates of p were fairly robustto variation in sample size. In contrast, Tajima´s D showed largefluctuations across the resampled data sets. In some instances, themean of the 100 resampled estimates was close to the estimate basedon all individuals in the same population, but in many instances theestimated Tajima’s D value was even reversed, shifting from negativeto positive or vice versa. The largest difference in values of Tajima’s Dwas for PaZIP in HOG, where resampled population values rangedfrom 21.74 to 1.43 (Table 3).
Levels of LD and recombinationThe informative sites of all 11 genes generated 2378 pairwisecomparisons, 272 (11.4%) of which remained significant after Fisher’sexact test with Bonferroni’s correction. The average r2 over all pairwisecomparisons was 0.11 (SD = 0.05) and LD decreased rapidly withdistance between pairs of SNPs, reaching an r2 value of less than 0.2within 80 bp (Figure 4A). The decrease was slower when D9 wasconsidered (Figure S2).
PaAP2L3, with only six pairwise comparisons between infor-mative sites, was excluded from the per gene estimates of r2. Theremaining 10 genes, with 45 pairwise comparisons or more, hadmean r2 values from 0.04 in PaCDF1 to 0.2 in PaZIP, with fivegenes having a mean r2 . 0.11 (Table 4). The mean r2 value was0.15 for the above-average group of genes and 0.08 for the below-average group, with r2 values being differently distributed in thetwo groups (Wilcoxon’s rank sum test: P , 0.01). There was nosignificant correlation between p and mean r2 (Spearman’s rankcorrelation: r = 0.56, P = 0.07). The decay of LD with distancevaried between genes, again with PaCDF1 in the low extreme,where the fitted curve never reached an r2 value of 0.2, and PaZIPstanding out as LD extended for 353 bp before declining to valuesless than 0.20. Roughly, the genes can also be divided into twogroups based on their pattern of LD. The first consists of PaCCA1,PaCDF1, PaCOL1 and PaWS02746, where most SNPs are in weaklinkage and few SNPs in high linkage appear at distances greaterthan 1kb (Figure S3). The other group, including the rest of thegenes, also displays a great number of SNPs in weak LD but, inaddition, displays SNPs in complete LD at distances of severalthousand base pairs and SNPs in high LD throughout the lengthof the genes (Figure S3).
The recombination estimate r per site ranged from 0 in PaZIP to0.0071 in PaFTL1, with a mean value for all loci of 0.0033 (Table 4).The likelihood curves indicate good estimates of r in all genes exceptPaCOL1, PaFTL1, PaMFT1, and PaWS02746 (Figure S4). There wasno significant correlation between r per site and mean r2 (Spearman’srank correlation: r =20.3, P = 0.34). The estimate of r over u was.1for all loci except PaPRR1 and PaZIP (Table 4).
Mean r2 was elevated for all genes in all within population esti-mates compared to the merged data set (Table 5). A multilocus esti-mate of the decay of LD within populations was strikingly differentfrom the merged data set, with LD extending from 705 bp in SE-61 to4580 bp in FI-67 before falling under r2 values of 0.2 (Figure 4, B2D).The difference was not as striking when the decay of D´ was consid-ered (Figure S2). The population recombination rates varied greatly,but likelihood curves for the smaller sample sizes were not showingdistinct peaks at estimated values (Figure S4).
DISCUSSION
Population structureDespite of the fact that the populations covered up to 9º of latitude(from 58� 369N to 67� 419N) we were unable to detect a clear geneticstructure among the populations sampled within the Scandinaviandistribution of P. abies. This confirms the lack of structure generallyobserved in central Scandinavia in Norway spruce, but is slightlydifferent from the results of Chen et al. (2012) where populationsabove 67�N tended to form a separate cluster. The lack of populationstructure here could simply reflect a lower power in the present studythan in Chen et al. (2012) and the presence of a smaller number ofpopulations at high latitudes in this study.
Nucleotide diversity and Tajima’s DThe overall level of nucleotide diversity was for the most partcomparable with previous results in P. abies (Heuertz et al. 2006; Chenet al. 2010), with greater values for PaWS02746 and PaWS02749 andits estimate was not sensitive to sampling. The mean Tajima’s D wasnegative, again consistent with previously reported results and anexpanding population size (Heuertz et al. 2006; Chen et al. 2010).Because we did not detect any meaningful population structure, theoverall estimate of Tajima’s D is unlikely to have been strongly af-fected by pooling of samples from different populations (Städler et al.
n Table 4 Mean linkage disequilibrium and recombination rate parameters estimated per locus for the merged data set of 10 populationswith a mean of 97 individuals
Number of Sites r2
Gene Informative Pairwisea Sign. Pairwise, %a Mean ,0.2b r r/site r/u
PaAP2L3 4 6 16.7 n.a. n.a. 2.04 0.0004 1.98PaCDF1 19 171 6.4 0.041 0 5.10 0.003 1.16PaCOL1 38 703 6.3 0.079 74 18.4 0.006 1.42PaMFT1 28 378 15 0.056 12 25.5 0.006 2.11PaFTL1 10 45 28.9 0.13 5 19.4 0.007 7.29PaCCA-1 18 153 8.5 0.069 7 11.2 0.003 2.36PaPRR7 10 45 20 0.097 88 8.16 0.001 1.34PaPRR1 17 136 30.9 0.17 96 3.06 0.002 0.65PaWS02746 19 171 21.6 0.14 118 21.4 0.005 3.24PaWS02749 31 465 11.8 0.12 59 11.2 0.004 1.10PaZIP 15 105 26.7 0.2 353 0 0 0All Loci 209 2378 11.4 0.1 46 11.4 0.003 1.81
n.a., not applicable.aNumber of pairwise comparisons and the fraction of these that are significant.
bNumber of base pairs where estimated r2 falls below 0.2.
802 | H. Larsson et al.

2009) and given the size of the total sample the estimate of Tajima’s Dshould be close to its true value (Marroni et al. 2011). In line with theresults of Marroni et al. (2011) and in contrast to estimates of p,estimates of Tajima’s D value and its significance were quite sensitiveto the reduction in sample size and, apart from the general trend of anincrease in positive values associated with smaller sample sizes, resam-pling displayed a wide range of values depending on the randomlysampled representatives of the population. The trend of more negativevalues of Tajima’s D with increasing number of individuals is contraryto neutral expectations under a fixed number of segregating sites,where adding individuals should cause Tajima’s D to become morepositive. However, as Norway spruce reveals signs of population expan-sion throughout the distribution range (Heuertz et al. 2006; Chen et al.2010), increasing the sample size in this species, in effect, means in-troducing new mutations occurring in low frequencies or even as single-tons, leading to more negative values of Tajima’s D and a more accuratereflection of the demographic history of Norway spruce. It seems,therefore, that estimates of Tajima’s D based on small samples (,50according to Table 5 in Marroni et al. 2011) should be considered with
caution, especially in populations that putatively depart from the stan-dard neutral model and harbor a large number of rare variants. Astriking example of the increase of the number of segregating sites withincreased sample size is provided by the recent study of Nelson et al.(2012) in humans, where uW, which is based on S, increased fivefoldwhen sample size went from 500 to 10,000 whereas up remained stable.Finally, as we would expect sampling to affect Tajima’s D more stronglywhen populations are structured and depart from the standard neutralmodel, resampling can in itself be a new source of information on pastdemographics that warrants further investigation (Cutter et al. 2012; St.Onge et al. 2012).
We were unable to detect a clear latitudinal gradient of Tajima’s Dvalues among the 10 populations, but as resampling clearly showed,a sample size of eight individuals was not sufficient for this data set toyield robust estimates of Tajima’s D within populations. The threepopulations with a larger sample size did reflect a pattern of morepositive values of Tajima’s D with increased latitude similar to thepattern observed in P. sitchensis (Holliday et al. 2010), but with onlythree populations of sufficient sample size it is difficult to accurately
n Table 5 Mean linkage disequilibrium and recombination rate parameters estimated per locus for each of the three populationsSE-61, SE-64, and FI-67
Number of Sites r2
Gene Pop Informative Pairwisea Sign. Pairwise, %a Mean ,0.2b r r/site r/u
PaAP2L3 SE-61 3 3 0 20.16 n.a. 2.04 0.4 1.35SE-64 4 6 0 20.69 n.a. 10.2 2.2 6.25FI-67 7 21 9.5 0.32 n.a. 2.04 0.4 0.97
PaCDF1 SE-61 8 28 3.6 0.14 n.a. 6.12 3.9 1.45SE-64 9 36 8.3 0.25 n.a. 0 0 0FI-67 8 28 0 0.15 n.a. 13.3 8.4 3.14
PaCOL1 SE-61 25 300 0 0.16 n.a. 23.5 7.9 2.08SE-64 15 105 0 0.29 n.a. 12.2 4.1 1.3FI-67 19 171 0 0.37 n.a. 4.08 1.4 0.52
PaMFT1 SE-61 11 55 10.9 0.25 n.a. 20.4 4.7 2.72SE-64 10 45 13.3 0.37 n.a. 2.04 0.5 0.28FI-67 8 28 21.4 0.44 n.a. 3.06 0.7 0.65
PaFTL1 SE-61 7 21 9.5 0.29 n.a. 7.14 2.6 3.17SE-64 7 21 4.8 0.2 n.a. 2.04 0.7 0.65FI-67 8 28 14.3 0.34 n.a. 8.16 3 1.97
PaCCA1-l SE-61 10 45 2.2 0.19 n.a. 7.14 1.7 1.58SE-64 8 28 0 0.2 n.a. 0 0 0FI-67 6 15 0 0.29 n.a. 0 0 0
PaPRR7 SE-61 9 36 5.6 0.22 n.a. 3.06 0.4 0.58SE-64 7 21 9.5 0.2 n.a. 3.06 0.4 0.71FI-67 11 55 1.8 0.16 n.a. 5.1 0.7 0.73
PaPRR1 SE-61 11 55 12.7 0.29 n.a. 2.04 1.1 0.35SE-64 11 55 23.6 0.52 n.a. 0 0 0FI-67 12 66 16.7 0.37 n.a. 2.04 1.1 0.46
PaWS02746 SE-61 14 91 17.6 0.38 n.a. 8.16 1.9 1.08SE-64 12 66 6.1 0.32 n.a. 18.4 4.2 3.14FI-67 16 120 23.3 0.5 n.a. 12.2 2.8 1.37
PaWS02749 SE-61 14 91 11 0.39 n.a. 3.06 1 0.38SE-64 15 105 0 0.37 n.a. 2.04 0.6 0.23FI-67 11 55 29.1 0.55 n.a. 7.14 2.2 0.85
PaZIP SE-61 11 55 40 0.54 n.a. 0 0 0SE-64 9 36 58.3 0.55 n.a. 0 0 0FI-67 9 36 44.4 0.66 n.a. 0 0 0
Mean SE-61 123 780 8.6 0.261 705 7.5 2.3 1.34SE-64 107 524 9.5 0.348 2549 4.5 1.2 0.88FI-67 115 623 13.5 0.398 4580 5.2 1.9 0.94
n.a., not applicable.aNumber of pairwise comparisons and the fraction of these that are significant.
bNumber of base pairs where estimated r2 falls below 0.2.
Volume 3 May 2013 | Patterns of LD in Norway Spruce | 803

determine if the pattern is true. Obviously, to assess reliably the pres-ence of a latitudinal cline in Tajima’s D, a larger number of individualsper population as well as a larger number of loci would be required.
Level of LD and recombinationThe within gene level of LD in this study was generally low. However,P. abies does not seem to be an exception to the pattern of LD varyingbetween genes shown in other conifers. Estimating the decay of LDwith distance using the pooled r2 estimates for all genes failed to reflectthe heterogeneous levels of LD among the genes, evident in the vari-able estimates of linkage and recombination across genes. PaZIP andPaPRR1 in particular displayed high mean r2 values. Plotting thesquared correlation of allele frequencies against distance in PaZIPreveals that SNPs in complete LD extend throughout the length ofthe gene, a total of 4 kb (Figure 5), resembling the pattern found forallozyme coding loci in pine (Pyhäjärvi et al. 2011). More sequencedata may reveal a consistent pattern of LD along the whole length ofPaZIP. In Pinus pinaster, a gene coding for transcription factor fromthe HD-ZIP family, HD-ZIPIII, showed high levels of LD across morethan 3.2 kb (Lepoittevin et al. 2012).
For PaZIP, the high mean r2 value of 0.2 was matched by a pop-ulation recombination rate of 0, but contrary to expectations this wasnot a general occurrence because we could not find a significant cor-relation between mean r2 and r per site across genes. The flat likeli-hood curves for four of the genes, indicating some uncertainty in theestimate of r, may explain the lack of correlation. Less surprising wasthe lack of correlation between mean r2 and p, as previous studieshave obtained the same result in both P. glauca and P. abies (Pavyet al. 2012). The ratio of r to u revealed that recombination was themajor force behind the variation in all loci except PaPRR1 and PaZIP,which is consistent with their high mean r2 values and relatively slowdecay of LD, maintaining mean r2 values. 0.2 over more than 100 bp.
Despite the lack of population structure between the Scandinavianpopulations, LD and recombination were quite variable between thethree populations more intensely sampled. In part, the inflated values
of LD can be explained by the reduced sample size in withinpopulation estimates because r2 depends on allele frequencies andan absence of rare alleles will tend to inflate LD estimates slightly(Hedrick and Kumar 2001). However, it seems unlikely that the in-creased distances of LD decay evident in individual populationsshould only be a result of a reduction in sample size. In a study onthe effect of minor allele frequency thresholds on estimates of LD inPopulus nigra the decay of LD estimated with r2 increased by a dis-tance of ~400 bp when increasing the threshold from 0.05 to 0.1(Marroni et al. 2011).
Because we only used parsimony informative sites in thecalculation of r2, the minor allele frequency would increase from0.02 in the merged data set with a mean sample size of 97 individualsto 0.125 in the mean sample size of 16 individuals in FI-67. This doesnot seem sufficient to explain the increase in distance of LD decayfrom 46 bp in the merged data set to 4580 bp in FI-67. Perhaps a moreplausible explanation to the difference in the extent of LD between thepooled sample and the individual populations is that, despite theapparent lack of population structure, the three subpopulations havehad different histories. Boreal forest tree species, and Norway sprucein particular, have had complex histories and have undergone periodicfragmentation and admixture due to glaciation cycles in some parts oftheir current range. Simulations have shown that LD created throughpostglaciation admixture can be elevated and will be maintained inspecies with long generation times (Tachida 2012) and the differencein LD levels between populations may be the result of subtle differ-ences in past fragmentation-admixture events. Partial admixture, orpopulation structure, could also be an explanation as Tachida (1994)in a finite island model showed that the initial rate of decay of LD isincreased by finiteness of the population but that the ultimate rate ofdecay is decreased. Hence, LD created in the past may persist longer insmaller subdivided populations (Tachida 1994). If the populationshave a different past then we would expect different levels of LD. Wenote that there is a cline in LD with the lowest value found in SE-61 andthe highest in FI-67 (Figure 4, B2D and Table 5). Although we did not
Figure 5 Plot of the squaredcorrelation of allele frequencies (r2)vs. distance in base pairs in thegene PaZIP using all populations.
804 | H. Larsson et al.
detect a clear differentiation between FI-67 and the other populations inthe present study, other studies (X.-R. Wang, personal communication)(Chen et al. 2012) have shown that populations above 65�N are gene-tically different from more southerly Scandinavian populations. Theexact cause of this genetic difference is not yet well understood. It couldreflect differences in origins and/or differences in selection pressure andreproduction. In any case the extensive LD observed in FI-67 couldreflect this difference. A demographic explanation seems also supportedby the fact that differences in the decay of D9 was much less strikingthan for the decay of r2 with distances. As was noted previously D9reflects recombination between the two loci, whereas r2 reflects morethe gene genealogies (McVean 2001).
To successfully design an association mapping experiment oneneeds to have detailed knowledge about many basic populationgenetic parameters of the species of interest. These parameters are forthe majority of species still missing. In Norway spruce, despite therelatively low levels of population structure it is evident that there aredifferences in both pattern of LD and allele frequencies betweenpopulations, calling for caution in estimating parameters on species-wide sampling and highlighting the importance of larger sample sizewithin populations to obtain meaningful results. As the pattern of LDlargely determines the power of an association study and the existenceof population structure can yield an excess of false positives there arestrong incentives to obtain better estimates of these fundamentalparameters to be able to optimize the design of association experi-ments. Together with data from other conifers the data put forwardhere indicate a more heterogeneous pattern in LD than earlier studieshave suggested. Hence the classic view of a lack of LD within genes inconifers needs to be reconsidered. Even though gene space is going toremain specifically interesting for association mapping, especially inspecies with large genomes, with the arrival of full genome data froma single individual we should now focus our efforts on estimating LDand factors that influence LD at full genome level.
ACKNOWLEDGMENTSWe thank Kerstin Jeppsson for help in the laboratory and the staff atthe Swedish Forest Research Institute (Skogforsk) and at the FinnishForest Research Institute (METLA) for seed samples. The researchwas supported by the European Community’s Sixth Framework Pro-gram under the Network of Excellence Evoltree and the SeventhFramework Program (FP7/2007-2013) under the grant agreementno. 211868 (Project Noveltree), BiodivERsA projects LinkTree andTipTree, and by the Swedish Research Council FORMAS grant dnr217-2007-433 to M.L. and by a Nilsson-Ehle foundation to H.L.
LITERATURE CITEDBerlin, S., J. Fogelqvist, M. Lascoux, U. Lagercrantz, and A. C. Rönnberg-
Wästljung, 2011 Polymorphism and eivergence in two willow species,
Salix viminalis L. and Salix schwerinii E. Wolf. G3 (Bethesda) 1: 387–400.Binney, H. A., K. J. Willis, M. E. Edwards, S. A. Bhagwat, P. M. Anderson
et al., 2009 The distribution of late-Quaternary woody taxa in northern
Eurasia: evidence from a new macrofossil database. Quat. Sci. Rev. 28:
2445–2464.Brown, G. R., G. P. Gill, R. J. Kuntz, C. H. Langley, and D. B. Neale,
2004 Nucleotide diversity and linkage disequilibrium in loblolly pine.
Proc. Natl. Acad. Sci. USA 101: 15255–15260.Chen, J., T. Källman, N. Gyllenstrand, and M. Lascoux, 2010 New insights
on the speciation history and nucleotide diversity of three boreal spruce
species and a tertiary relict. Heredity 104: 3–14.Chen, J., T. Källman, X. Ma, N. Gyllenstrand, G. Zaina et al.,
2012 Disentangling the roles of history and local selection in shaping
clinal variation of allele frequencies and gene expression in Norwayspruce (Picea abies). Genetics 191: 865–881.
Cutter, A. D., G. X. Wang, H. Ai, and Y. Peng, 2012 Influence of finite-sitesmutation, population subdivision and sampling schemes on patterns ofnucleotide polymorphism for species with molecular hyperdiversity. Mol.Ecol. 21: 1345–1359.
Evanno, G., S. Regnaut, and J. Goudet, 2005 Detecting the number ofclusters of individuals using the software STRUCTURE: a simulationstudy. Mol. Ecol. 14: 2611–2620.
Ewing, B., and P. Green, 1998 Base-calling of automated sequencer tracesusing phred. II. Error probabilities. Genome Res. 8: 186–194.
Ewing, B., L. Hillier, M. C. Wendl, and P. Green, 1998 Base-calling ofautomated sequencer traces using phred. I. Accuracy assessment. Ge-nome Res. 8: 175–185.
Excoffier, L., and H. E. L. Lischer, 2010 Arlequin suite ver 3.5: a new seriesof programs to perform population genetics analyses under Linux andWindows. Mol. Ecol. Res. 10: 564–567.
Gaut, B. S., S. I. Wright, C. Rizzon, J. Dvorak, and L. K. Andersson,2007 Recombination: an underappreciated factor in the evolution ofplant genomes. Nat. Rev. Genet. 8: 77–84.
González-Martínez, S. C., E. Ersoz, G. R. Brown, N. C. Wheeler, and D. B.Neale, 2006 DNA sequence variation and selection of tag single-nucleotide polymorphisms at candidate genes for dought-stress responsein Pinus taeda L. Genetics 172: 1915–1926.
Gordon, D., C. Abajian, and P. Green, 1998 Consed: a graphical tool forsequence finishing. Genome Res. 8: 195–202.
Guo, A. Y., Q. H. Zhu, X. Chen, and J. C. Luo, 2007 GSDS: a gene structuredisplay server. Yi Chuan 29: 1023–1026.
Hedrick, P. W., and S. Kumar, 2001 Mutation and linkage disequilibrium inhuman mtDNA. Eur. J. Hum. Genet. 9: 969–972.
Heuertz, M., E. De Paoli, T. Källman, H. Larsson, I. Jurman et al.,2006 Multilocus patterns of nucleotide diversity, linkage disequilibriumand demographic history of Norway spruce [Picea abies (L.) . Karst].Genetics 174: 2095–2105.
Hill, W. G., and A. Robertson, 1968 Linkage disequilibrium in finite pop-ulations. Theor. Appl. Genet. 38: 226–231.
Hill, W. G., and B. S. Weir, 1988 Variances and covariances of squaredlinkage disequilibria in finite populations. Theor. Popul. Biol. 33: 54–78.
Holliday, J. A., M. Yuen, K. Ritland, and S. N. Aitken, 2010 Postglacialhistory of a widespread conifer produces inverse clines in selective neu-trality tests. Mol. Ecol. 19: 3857–3864.
Jakobsson, M., and N. A. Rosenberg, 2007 CLUMPP: a cluster matching andpermutation program for dealing with label switching and multimodality inanalysis of population structure. Bioinformatics 23: 1801–1806.
Jaramillo-Correa, J. P., M. Verdú, and S. C. González-Martìnez, 2010 Thecontribution of recombination to heterozygosity differs among plantevolutionary lineages and life-forms. BMC Evol. Biol. 10: 22.
Källman, T., 2009 Adaptive evolution and demographic history of Norwayspruce (Picea abies). Ph.D. Thesis, Uppsala University.
Karlgren, A., N. Gyllenstrand, T. Källman, J. F. Sundström, D. Moore et al.,2011 Evolution of the PEBP gene family in plants: functional diversi-fication in seed plant evolution. Plant Physiol. 156: 1967–1977.
Krutovsky, K. V., and D. B. Neale, 2005 Nucleotide diversity and linkagedisequilibrium in cold-hardiness- and wood quality-related candidategenes in Douglas fir. Genetics 171: 2029–2041.
Lepoittevin, C., L. Harvengt, C. Plomion, and P. Garnier-Gere,2012 Association mapping for growth, straightness and wood chemistrytraits in the Pinus pinaster Aquitaine breeding population. Tree Genet.Genomes 8: 113–126.
Lewontin, R. C., 1964 The interaction of selection and linkage. I. Generalconsiderations; heterotic models. Genetics 49: 49–67.
Librado, P., and J. Rozas, 2009 DnaSP v5: A software for comprehensiveanalysis of DNA polymorphism data. Bioinformatics 25: 1451–1452.
Marroni, F., S. Pinosio, G. Zaina, F. Fogolari, N. Felice et al.,2011 Nucleotide diversity and linkage disequilibrium in Populus nigracinnamyl alcohol dehydrogenase (CAD4) gene. Tree Genet. Genomes 7:1011–1023.
Volume 3 May 2013 | Patterns of LD in Norway Spruce | 805

McVean, G. A., 2001 What do patterns of genetic variability reveal aboutmitochondrial recombination? Heredity 87: 613–620.
McVean, G. A., P. Awadalla, and P. Fearnhead, 2002 A coalescent-basedmethod for detecting and estimating recombination from gene sequences.Genetics 160: 1231–1241.
Moritsuka, E., Y. Hisataka, M. Tamura, K. Uchiyama, A. Watanabe et al.,2012 Extended linkage disequilibrium in noncoding regions in a coni-fer, Cryptomeria japonica. Genetics 190: 1145–1148.
Namroud, M.-C., C. Guillet-Claude, J. Mackay, N. Isabel, and J. Bousquet,2010 Molecular evolution of regulatory genes in spruces from differentspecies and continents: heterogeneous patterns of linkage disequilibriumand selection but correlated recent demographic changes. J. Mol. Evol. 70:371–386.
Neale, D. B., and O. Savolainen, 2004 Association genetics of complex traitsin conifers. Trends Plant Sci. 9: 325–330.
Nelson, M. R., D. Wegmann, M. G. Ehm, D. Kessner, P. St Jean et al.,2012 An abundance of rare functional variants in 202 drug target genessequenced in 14,002 people. Science 337: 100–104.
Pavy, N., M. C. Namroud, F. Gagnon, N. Isabel, and J. Bousquet, 2012 Theheterogeneous levels of linkage disequilibrium in white spruce genes andcomparative analysis with other conifers. Heredity 108: 273–284.
Pritchard, J. K., M. Stephens, and P. Donnelly, 2000 Inference of populationstructure using multilocus genotype data. Genetics 155: 945–959.
Pyhäjärvi, T., M. R. García-Gil, T. Knürr, M. Mikkonen, W. Wachowiaket al., 2007 Demographic history has influenced nucleotide diversity inEuropean Pinus sylvestris populations. Genetics 177: 1713–1724.
Pyhäjärvi, T., S. T. Kujala, and O. Savolainen, 2011 Revisiting proteinheterozygosity in plants - nucleotide diversity in allozyme coding genes ofconifer Pinus sylvestris. Tree Genet. Genomes 7: 385–397.
R Development Core Team, 2012 R: A Language and Environment forStatistical Computing. Available at: http://www.R-project.org. Accessed:March 18, 2013.
Städler, T., B. Haubold, C. Merino, W. Stephan, and P. Pfaffelhuber,2009 The impact of sampling schemes on the site frequency spectrumin nonequilibrium subdivided populations. Genetics 182: 205–216.
St. Onge, K., A. E. Palmé, S. I. Wright, and M. Lascoux, 2012 Impact ofsampling schemes on demographic inference: an empirical study in twospecies with different mating systems and demographic histories. G3(Bethesda) 2: 803–814.
Tachida, H., 1994 Decay of linkage disequilibrium in a finite island model.Genet. Res. 64: 137–144.
Tachida, H., 2012 Linkage disequilibrium in a population undergoing pe-riodic fragmentation and admixture. Genes Genet. Syst. 87: 125–135.
Tajima, F., 1989 Statistical method for testing the neutral mutation hy-pothesis by DNA Polymorphism. Genetics 123: 585–595.
Thornton, K., 2003 libsequence: a C++ class library for evolutionary geneticanalysis. Bioinformatics 19: 2325–2327.
Tollefsrud, M. M., J. H. Sonstebo, C. Brochmann, O. Johnsen, T. Skroppaet al., 2009 Combined analysis of nuclear and mitochondrial markersprovide new insight into the genetic structure of North European (Piceaabies). Heredity 102: 549–562.
Väliranta, M., A. Kaakinen, P. Kuhry, S. Kultti, J. S. Salonen et al.,2011 Scattered late-glacial and early Holocene tree populations as dis-persal nuclei for forest development in north-eastern European Russia. J.Biogeogr. 38: 922–932.
Voight, B. F., A. M. Adams, L. A. Frisse, Y. Qian, R. R. Hudson et al.,2005 Interrogating multiple aspects of variation in a full resequencingdata set to infer human population size changes. Proc. Natl. Acad. Sci.USA 102: 18508–18513.
Zeng, K., Y. X. Fu, S. Shi, and C. I. Wu, 2006 Statistical tests for detectingpositive selection by utilizing high-frequency variants. Genetics 174:1431–1439.
Communicating editor: J. B. Holland
806 | H. Larsson et al.