distribution of income and among perspectives · theoretical perspectives ... • more people in...
TRANSCRIPT

Distributionofincomeandwealthamongindividuals:theoreticalperspectives
Joseph E. Stiglitz BangaloreAdvanced Graduate WorkshopJuly 2016

Outline• Description of growth of inequality• Brief description of some of major changes in perspectives on inequality
• Theories of the determinants of inequality
2
I.Enormousgrowthininequality• Especially in US, and countries that have followed US model
• Multiple dimensions of inequality• More money at the top• More people in poverty• Evisceration of the middle• Inequalities in wealth exceed those in income• Inequality in health—especially large in US• Inequality in access to justice
3

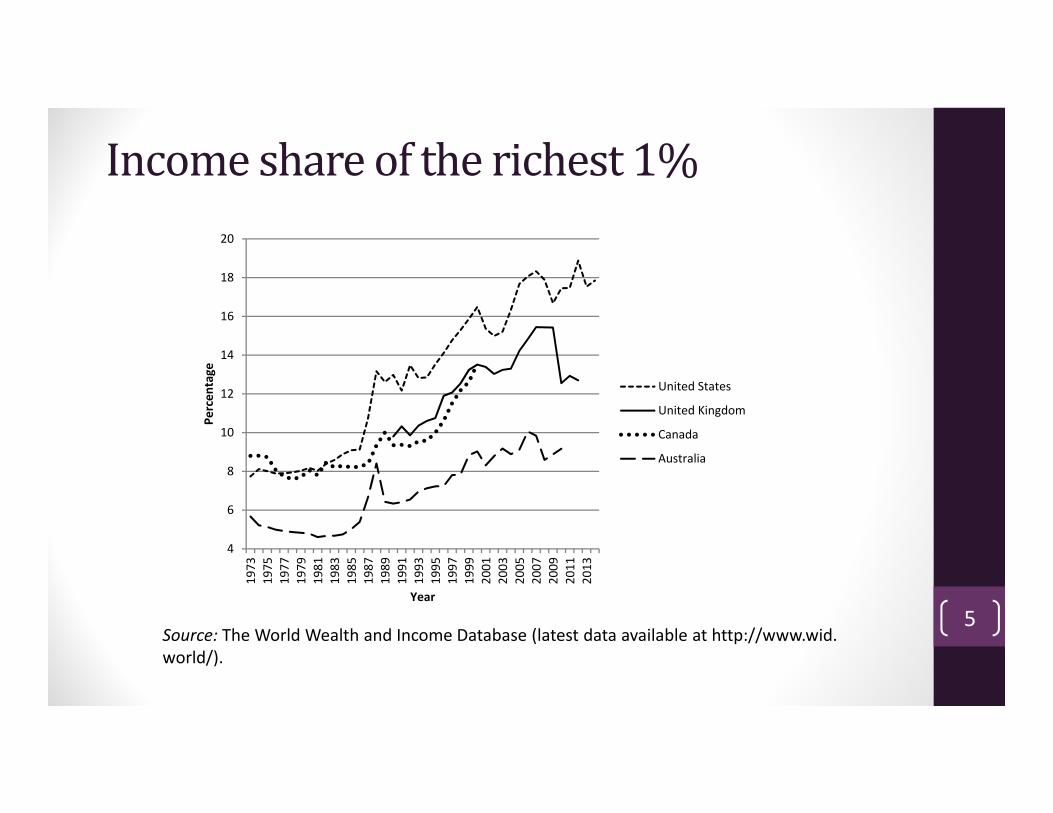
Source: The World Wealth and Income Database (latest data available at http://www.wid.world/).
0
200000
400000
600000
800000
1000000
1200000
1400000
1600000
18000001973
1975
1977
1979
1981
1983
1985
1987
1989
1991
1993
1995
1997
1999
2001
2003
2005
2007
2009
2011
2013
Real 201
4 US Dollars
Year
Top 1% Average Income (incl. capitalgains)
Bottom 90% average income (incl.capital gains)
Top1%vsBottom90%AverageIncomeintheUS
4
Source: The World Wealth and Income Database (latest data available at http://www.wid.world/).
Incomeshareoftherichest1%
4
6
8
10
12
14
16
18
201973
1975
1977
1979
1981
1983
1985
1987
1989
1991
1993
1995
1997
1999
2001
2003
2005
2007
2009
2011
2013
Percen
tage
Year
United States
United Kingdom
Canada
Australia
5
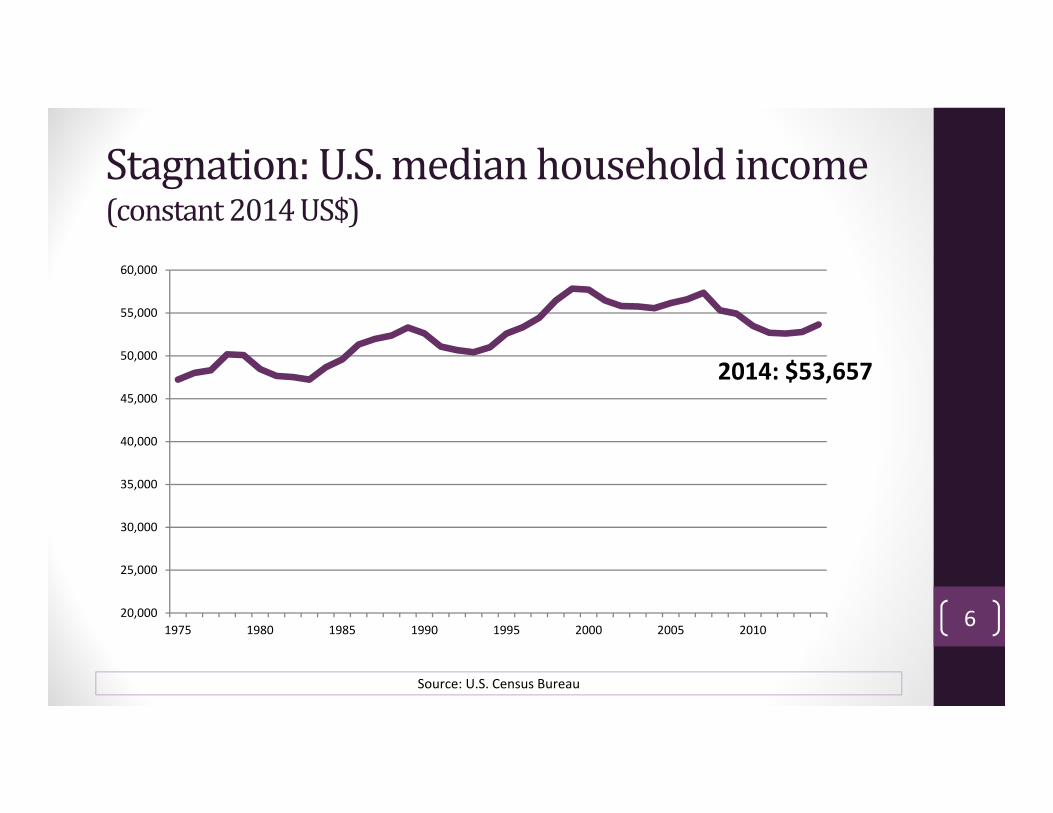
Stagnation:U.S.medianhouseholdincome(constant2014US$)
Source: U.S. Census Bureau
20,000
25,000
30,000
35,000
40,000
45,000
50,000
55,000
60,000
1975 1980 1985 1990 1995 2000 2005 2010
2014: $53,657
6
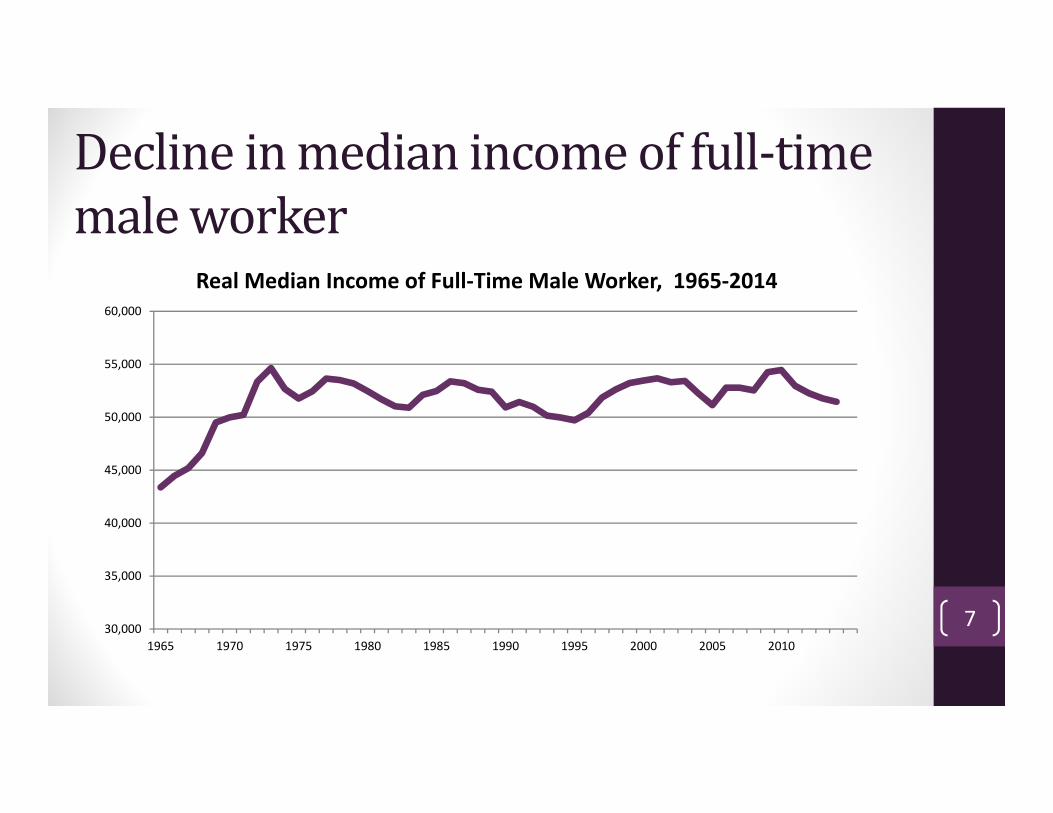
Declineinmedianincomeoffull‐timemaleworker
30,000
35,000
40,000
45,000
50,000
55,000
60,000
1965 1970 1975 1980 1985 1990 1995 2000 2005 2010
Real Median Income of Full‐Time Male Worker, 1965‐2014
7
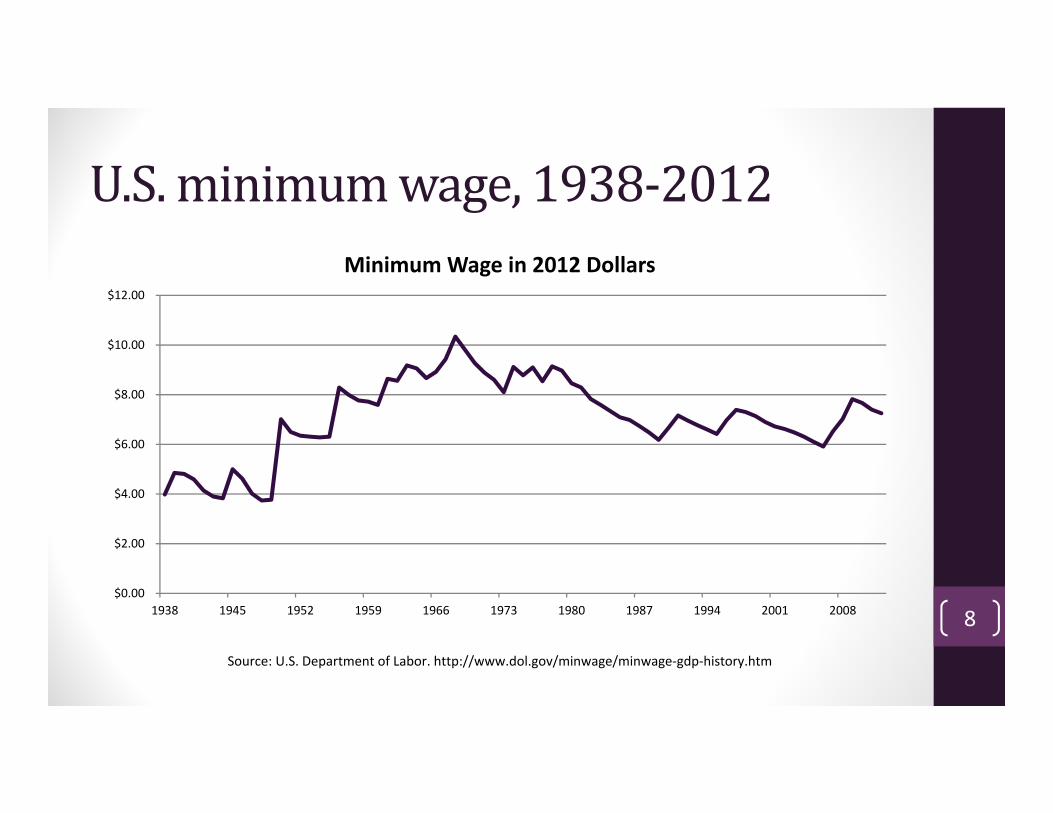
U.S.minimumwage,1938‐2012
Source: U.S. Department of Labor. http://www.dol.gov/minwage/minwage‐gdp‐history.htm
$0.00
$2.00
$4.00
$6.00
$8.00
$10.00
$12.00
1938 1945 1952 1959 1966 1973 1980 1987 1994 2001 2008
Minimum Wage in 2012 Dollars
8

9

InequalityinAsia:ontherisesinceearly1990s
10
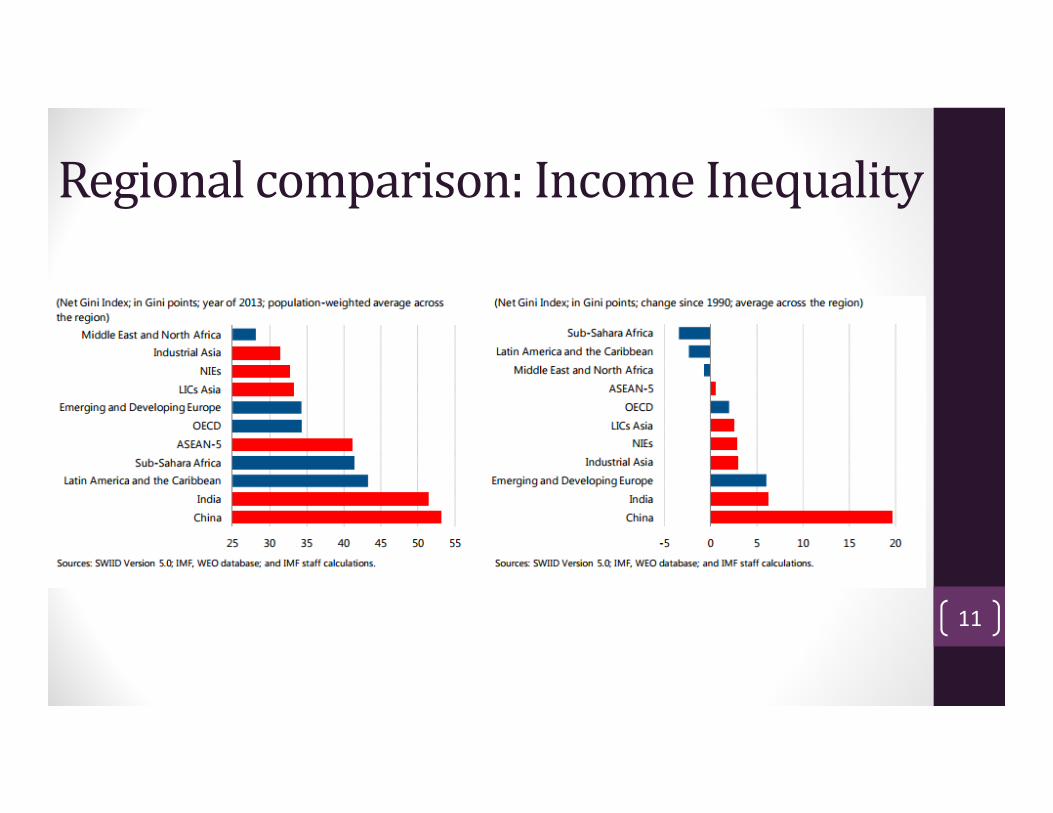
Regionalcomparison:IncomeInequality
11

Mostinvidiousaspect:inequalityinopportunity
• Not a surprise: systematic relationship between inequality in incomes (outcomes) and inequality of opportunity
12

Incomeinequalityandearningsmobility
Source: “United States, Tackling High Inequalities Creating Opportunities for All”, June 2014, OECD.
Income inequality and intergenerational earnings mobility, mid‐2000s
13
Globalinequality• Almost all OECD countries have seen increased inequality in last 30 years
• The trend around the world is somewhat mixed, but remains a concern almost everywhere
14

Gini changesinOECD
Source: OECD 2015, In It Together: Why Less Inequality Benefits All, http://www.oecd.org/els/soc/OECD2015‐In‐It‐Together‐Chapter1‐Overview‐Inequality.pdf
15

Globalinequality:Ginisworseinmanycountries,late2000svs.1980s
Source: Branko Milanovic, http://glineq.blogspot.co.ke/2015/02/trends‐in‐global‐income‐inequality‐and.html
16
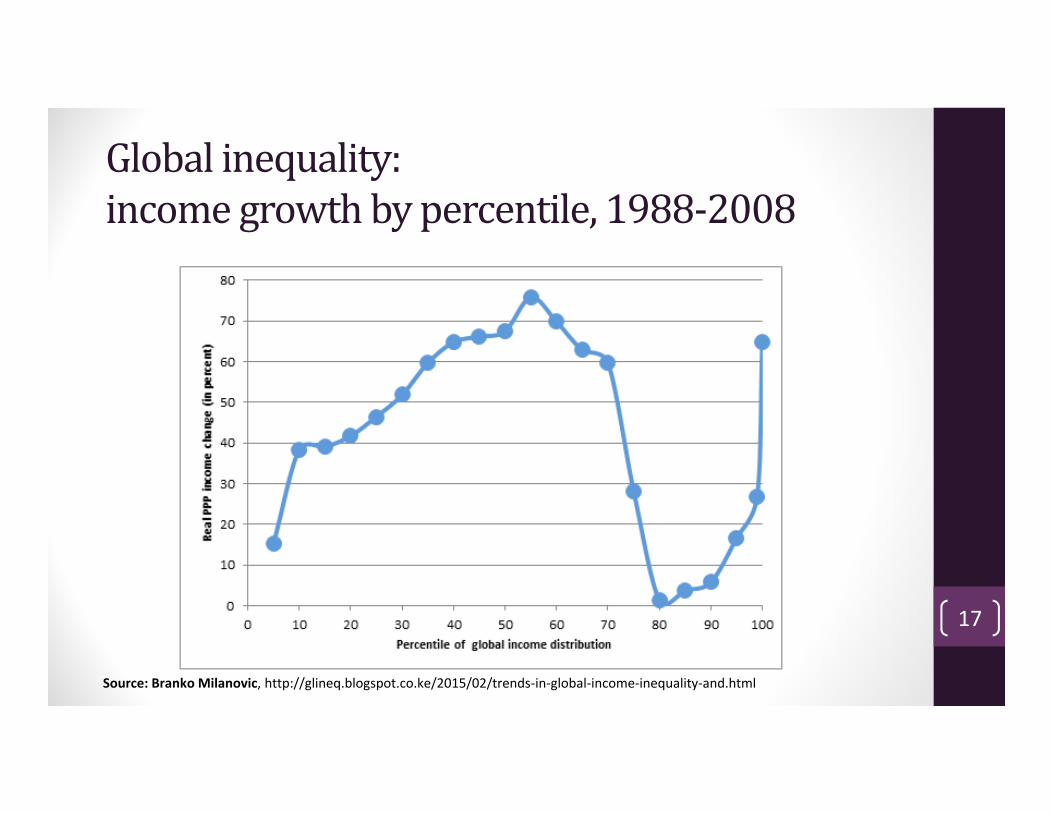
Globalinequality:incomegrowthbypercentile,1988‐2008
Source: Branko Milanovic, http://glineq.blogspot.co.ke/2015/02/trends‐in‐global‐income‐inequality‐and.html
17

Globalinequality:incomegrowthbypercentile
• What previous chart means is that, globally:• Very rich—those at far right of graph—have seen their incomes grow at a high rate
• Developing Asian middle class (especially China) has also grown at a fast rate. This is represented by those in middle‐left of the graph.
• The incomes of the world’s very poor—those on the far left of the chart—have not kept pace.
• Advanced country middle class incomes—those around the 80thpercentile—have stagnated completely
• (This is the analysis that Branko Milanovic has put forward) 18
II.Majorchangesinunderstandingsofinequality
1. Trickle down economics doesn’t work• There never was good theory or empirical evidence in support• In a way, Obama administration and Fed tried it again: bail‐out to banks was supposed to benefit all; QE would work by increasing stock market prices, benefitting mostly those at top
2. “Repeal” of Kuznets law• Was period after WWII, the “golden age of capitalism,” an aberration, the result of the social cohesion brought on by the war?
• With the economy now returning to the natural state of capitalism?
• Or is the increase in inequality after 1980 a result of a change in policies? 19
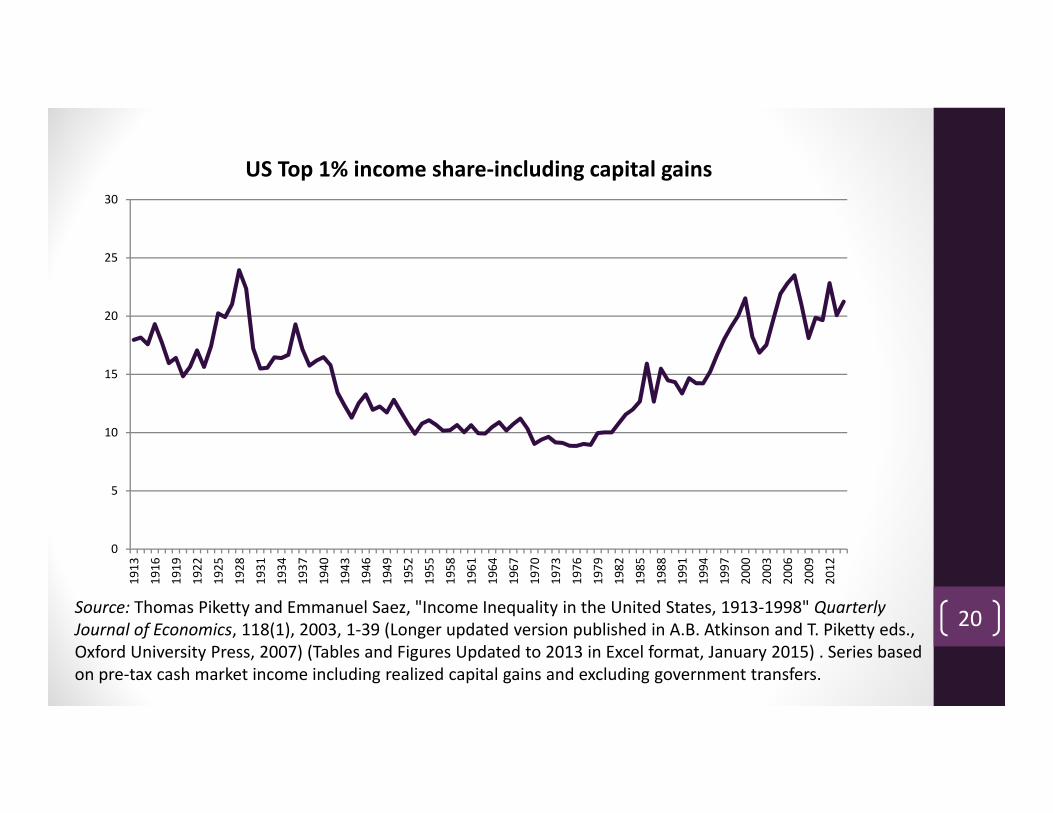
Source: Thomas Piketty and Emmanuel Saez, "Income Inequality in the United States, 1913‐1998" Quarterly Journal of Economics, 118(1), 2003, 1‐39 (Longer updated version published in A.B. Atkinson and T. Piketty eds., Oxford University Press, 2007) (Tables and Figures Updated to 2013 in Excel format, January 2015) . Series based on pre‐tax cash market income including realized capital gains and excluding government transfers.
0
5
10
15
20
25
30
1913
1916
1919
1922
1925
1928
1931
1934
1937
1940
1943
1946
1949
1952
1955
1958
1961
1964
1967
1970
1973
1976
1979
1982
1985
1988
1991
1994
1997
2000
2003
2006
2009
2012
US Top 1% income share‐including capital gains
20
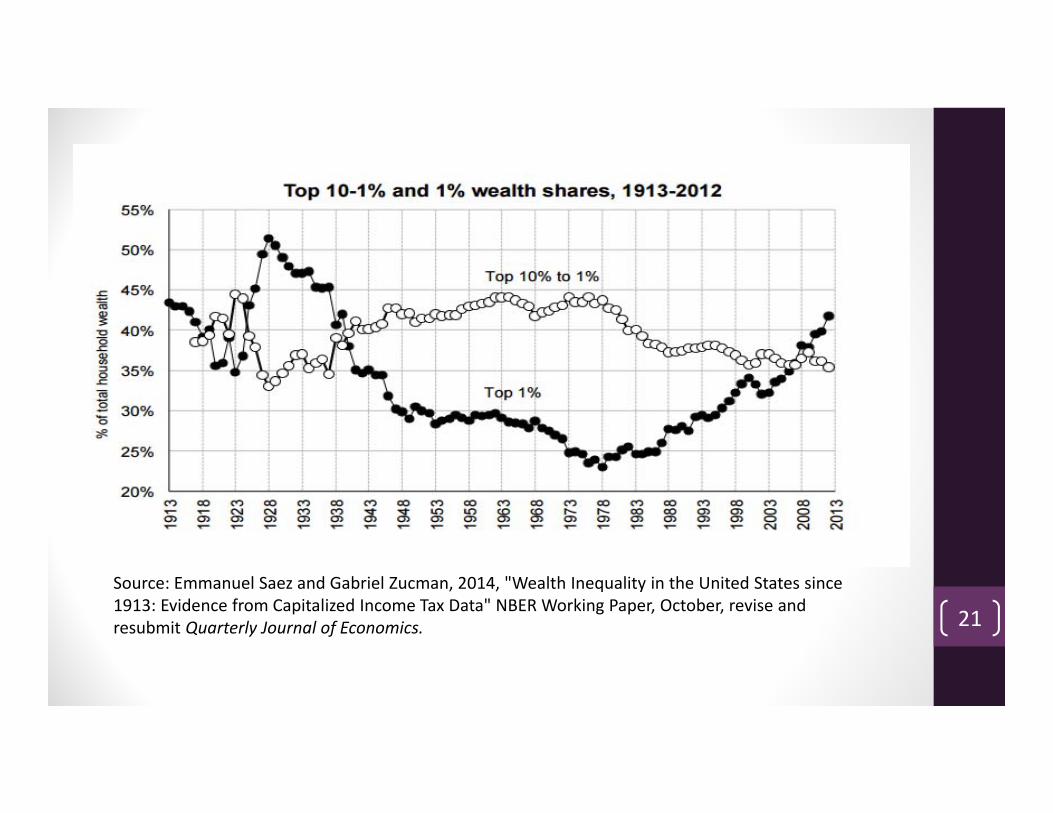
Source: Emmanuel Saez and Gabriel Zucman, 2014, "Wealth Inequality in the United States since 1913: Evidence from Capitalized Income Tax Data" NBER Working Paper, October, revise and resubmit Quarterly Journal of Economics. 21
3. Large differences in outcomes/opportunities among advanced countries
• Suggesting that it is policies, not inexorable economic forces that are at play
• Inequality is a choice
• A result of how we structure the economy through tax and expenditure policies, through our legal framework, our institutions, even the conduct of monetary policy
• All of these affect market power, bargaining power of different groups
• Even access to jobs and able to participate in labor market• Resulting in different distributions of income and wealth before taxes and transfers
Majorchangesinunderstandingsofinequality
22

• Beginning about a third of a century ago, we began a process of rewriting the rules
• Lowering taxes and deregulation was supposed to increase growth and make everyone better off
• In fact, only the very top was better off—incomes of the rest stagnated, performance of the economy as a whole slowed
• Resulting in basic necessities of a middle class society being increasingly out of reach of large proportion of population
• Retirement security, education of one’s children, ability to own a home
J. E. Stiglitz, Rewriting the Rules of the American Economy, 2016 23

4. Equality and economic performance are complements
• Economies with less inequality and less inequality of opportunity perform better
• Implication: 2nd welfare theorem “repealed”• Markets on their own won’t be efficient—will not pay any attention to
distributive consequences
• Many reasons for this• Lack of opportunity means that we are wasting most valuable resource• Macro‐economic
• Instability: Link between inequality and frequency of crises has been shown by IMF as well as others.
• Weaker growth• Richest consume a smaller proportion of their incomes than the poor or
middle• Greater equality would strengthen aggregate demand• Small and medium‐sized businesses, buoyed by strong middle class, are
drivers of economic growth (Cont’d)
Majorchangesinunderstandingsofinequality
24

• Weaker growth (cont’d)
• Political economy• Harder for divided society to make needed public investments in infrastructure, technology, education, etc.
• As democratic processes are skewed (e.g. in U.S.), policies that protect interests and rents of wealthiest replace those that support broad‐based growth
• Erosion of trust
• Direct effects of inequality when behavior is affected by relative position
• May lead to excessive indebtedness 25

• We can afford to have more equality• In fact, it would help our economy• Some much poorer economies have chosen more equalitarian policies
5. Because inequality is the result of policies, it is shaped by politics
• Economic inequality gets translated into political inequality• Political inequality leads to economic inequality• Vicious circle
Majorchangesinunderstandingsofinequality
26
Broaderconsequences• Undermining democracy
• Dividing society
• Especially when inequalities are on racial and ethnic lines—can give rise to ethnic strife
27

III.Alternativeinterpretationsofgrowthininequality:Marketforces—basedoncompetitivemarkets
(a) Changes in supply and demand for different factors just turned out badly for poor—decreasing wages of unskilled workers and increasing returns to capital and skilled workers
(b) Increased inequality in the intergenerational transmission of advantages leading to increased inequality in ownership of productive assets (human and financial capital)
28
Changesinfactorreturns(a) Skill biased technological changeUnpersuasive• Skilled workers’ wages going down• Doesn’t explain gap between average productivity and average wages
(b) Globalization• Predicted by standard theory• Evidence that it has played an especially important role since 2000 29

Alloftheseareaffectedbypolicy,byrulesofgame• Incentives for skilled biased technological change vs. resource saving technological change• Fed policy—low interest rates—encourage capital intensive technologies
• Absence of climate change undermines incentives for resource saving technological change
• The way we structured globalization encouraged outsourcing of jobs
• Especially in absence of industrial policies
• And weakened bargaining power of workers• Just as we were weakening unions
30

Intergenerationaltransmissionofadvantage
• Rich leave their children with more human and financial capital
• Equilibrium wealth distribution reflects balance between centrifugal and centripetal forces
• Increased inequality reflects an upsetting of previous balance
• Contrary to principle of equal opportunity
31
A.Keyquestions• How do we explain distribution of income and wealth among individuals and changes in those distributions
• Is there an equilibrium distribution?• Are recent observed patterns likely to continue?
• Are we moving from one equilibrium to another?• Or is inequality likely to continue to grow
• If so, what can be done about them
Macro‐theory has to be consistent with behavior at the microeconomic level• Can we explain certain stylized macro and distributional “facts”?
32
B.BasicModelDynastic families, leaving bequests among children • Outcomes depend on extent of assortive mating, rules of inheritance (equal vs. primogeniture)
• Ignoring technical change, wealth per capita ki described by• dln ki /dt = si yi – ni
Where s is savings rate, y income, n reproduction rate• What matters is after tax rates of return, wages• Macro‐ and micro‐ consistency: aggregate k determines r (and wages and interest rates, and expectations concerning those variables may affect s), and
• K = ∑ Ki(K is capital stock)
33

B1.Specialcases(studiedinearlierliterature):SolowModelNote that if yi = wi + ri ki and w, s, r, and n are the same, • dln ki/dt – dln kj/dt = sw(1/ki – 1/kj),So regardless of initial distribution of wealth, there will eventually be equality of wealth.If s, r, and n are the same, but wi differ, then in steady state the wealth distribution corresponds precisely to the wage distributionki/kj = wi/wj
(Stiglitz, “Equilibrium distribuiton of wealth and income among individuals,” Econometrica 1969)
34
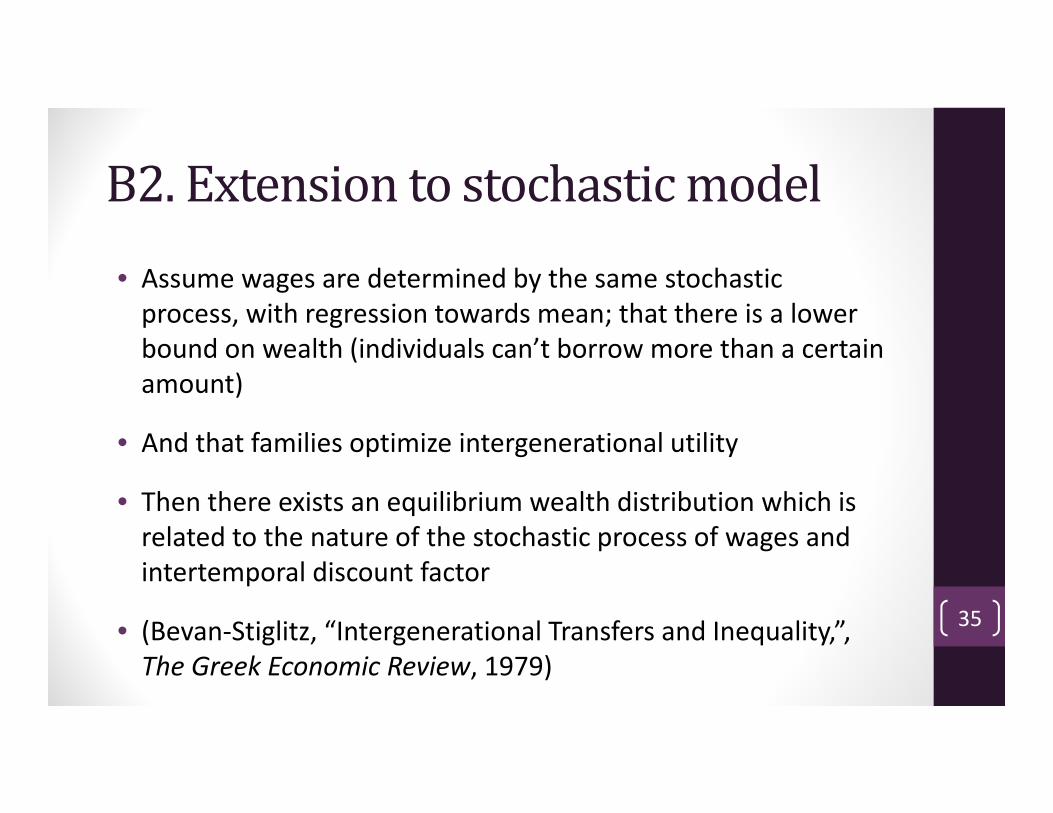
B2.Extensiontostochasticmodel• Assume wages are determined by the same stochastic process, with regression towards mean; that there is a lower bound on wealth (individuals can’t borrow more than a certain amount)
• And that families optimize intergenerational utility
• Then there exists an equilibrium wealth distribution which is related to the nature of the stochastic process of wages and intertemporal discount factor
• (Bevan‐Stiglitz, “Intergenerational Transfers and Inequality,”, The Greek Economic Review, 1979)
35

DiffusionModelAssume a diffusion process where the law of motion of wealth per capita is:
where the risk is associated with the return on capital and is proportional to :
and where μ is the drift in the stochastic process
sr
n sr 036

(a) n is rate of growth (rate of reproduction) (in Piketty’s model, g)
If s = 1, Stability (existence of equilibrium) requires rate of growth greater than the rate of interest: well known result(b) In long run equilibrium r < Y/K = n/s
Condition on previous slide is always satisfied
37
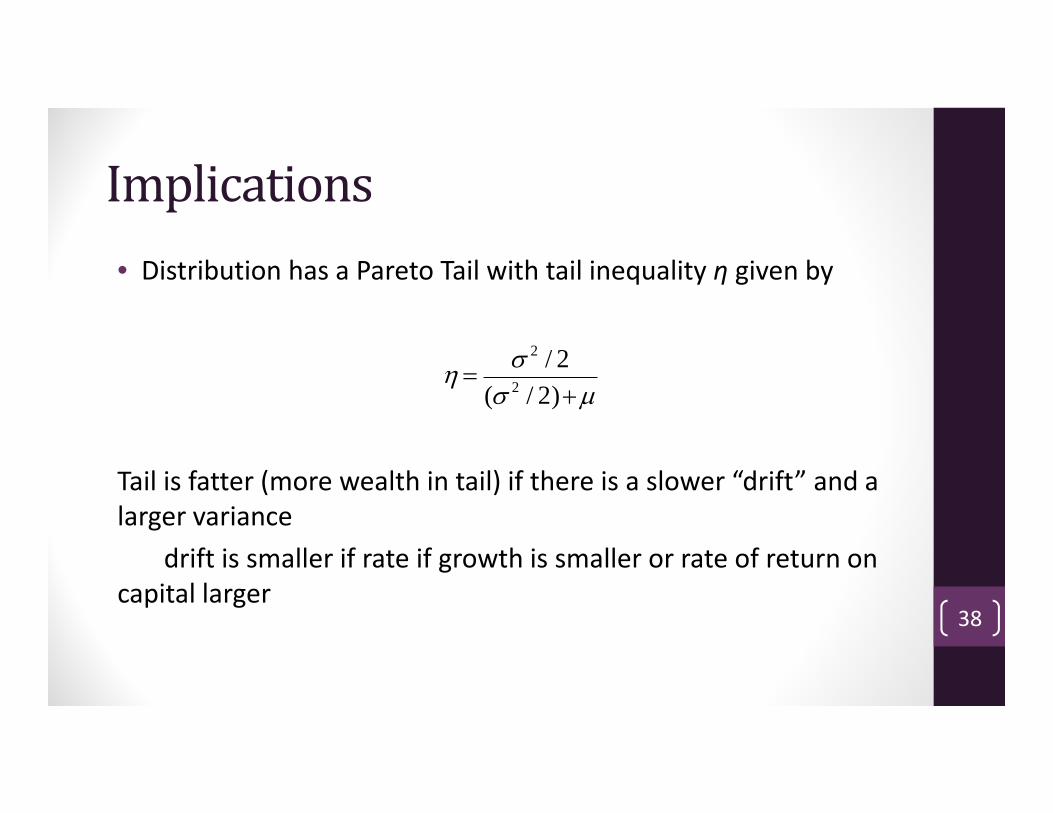
Implications• Distribution has a Pareto Tail with tail inequality η given by
Tail is fatter (more wealth in tail) if there is a slower “drift” and a larger variance
drift is smaller if rate if growth is smaller or rate of return on capital larger
2 / 2( 2 / 2)
38
Forcescreatingmoreunequalwealthdistribution• Differences in wi, si, ri , and ni and the stochastic processes for these variables determine differences in relative wealth positions• “Rags to riches in three generations”
• More dispersion of returns and persistence of differences in returns will lead to a more dispersion of wealth
• More wage dispersion leads to more wealth inequality• If each generation cares a great deal about future generations (low discount factor) then wealth will become more concentrated (but inequality of consumption across generations will be lower)
• If richer have smaller families, then there will be more wealth inequality
39
Othersourcesof“momentum”(trendreinforcement)willleadtogreaterwealthinequality• If very rich can use position to get higher returns (more investment in information, more extraction of rents) and if very rich have equal or higher savings rates, then wealth will become more concentrated• Differential access to credit markets• Differential access to political rents• Can mitigate agency costs of investing• (Paper shows that even the simple Solow model can give rise to persistent
wealth inequalities under these conditions)• Similar results if those near lower bound of wealth get especially low returns on
capital, or if they borrow, have to pay especially high interest rates
• If richer individuals (high wage individuals) invest more in human capital, so their children have higher wages (lowering pace of regression towards mean), then there will be more wealth inequality• Local public education with more economic segregation will have similar effect• If the force of regression towards mean of wages is weak, then wealth will
become more concentrated
40
Centripetalforces• Limited• “Rags to riches”• Division of wealth among heirs• In societies with good public education—equal provision of (access to) human capital
41
Factorscontributingtochangingwealth/incomedistribution• Increased intergenerational “inertia”
• Increase in assortive mating• Economic segregation seems to have much of the same effect• Lower inheritance taxes (lower capital taxes)• Changes in “norms” of inheritance (primogeniture, charitable giving)
• Increased variance in life expectancy, poorer social security will result in more wealth inequality• Individuals have to save for retirement• Those whose parents die early inherit more• Better annuity markets will lead to less wealth inequality
42

B3.Kaldorian savingsAssume s, r, and n are the same. Then• relative wealth of all families would remain the same; any initial inequality of wealth would be perpetuated• Magnitude of wealth inequality (in short or long run) does not depend on relationship between r and g
Assume siri for some family is greater than for some other family
• Then its relative wealth will grow• If siri – ni is greater for some family than others, then its per capita wealth will relative to that of others 43
Inlongrunequilibrium• s*r = n,So r is greater than rate of growth so long as s < 1.But there is no further concentration increase in wealth income ratio • What matters is relation between sr and growth rate, not r and growth rate
• Savings rate for even rich is less than unity (especially once one accounts for consumption of housing)
• What matters is return of capital of rich—which can be greater than that of others
• Can add life‐cycle savers to model without changing results• In the long run, there is a stable share of wealth of life‐cycle savers, capitalists
• Wealth‐income ratio is stable
44

Policy• Regressive taxation and weakening public schools leads to increased intergenerational transmission of advantage and more inequality
• Capital taxation is shifted. In Kaldor model, after tax return is unchanged• sr(1‐t) = n• Wages will be lowered• Distributive effect depends on how proceeds are spent• Even when distributed to workers, share of income going to workers may be reduced 45
IV.Alternativeexplanation:increaseinrents• Increased monopoly, monopsony power shifts distribution of income and wealth to those with these powers
• But also other reasons for an increase of rent—with increased income and wealth to those who control assets generating rents• Land rents• Intellectual property rents• Rent extraction from government• Rent extraction from consumers 46

Oureconomyismarkedbyincreasingrents• Some a result of technology
• Network effects• Localized services
• Some a result of changes in economy• Urban land rents
• Some a result of policies• Change in IPR laws• Deregulation—allowing extraction of more rents from government and consumers
• Some a result of market “innovation”• Better ways of exploiting consumers
47
Strongrelationsbetweentheserentsandinequality
• Some firms have persistently higher profitability than others
• Firms with higher profitability pay higher compensation
48
Piketty’sexplanationisavariantofintergenerationaltransmissionhypothesis
• Two classes, capitalists save everything, wealth grows at r, return on capital• Workers save little
• With r > g, growth of economy, if r does not fall, share of income of capitalists grows
49
CritiqueofPiketty• Savings rate of capitalists far less than 1
• Return on capital endogenous, and should be declining as capitalists accumulate• Models need to have macro‐/micro‐ consistency• If W were K (wealth and K were same), then law of diminishing returns would imply r would fall
• And wages would rise
• The assumption that r > g is not consistent with long run equilibrium: Virtually all models show that in long run sr < g: Piketty’s result cannot hold• In fact, Piketty’s model had been well‐studied in older growth literature
50

WhatPiketty’smodelcannotexplain• Ignores growth in life‐cycle wealth
• Cannot explain gap between average wages and productivity• Even if technical change is skill‐biased
• Cannot explain growth in overall wealth/income ratio• Can only explain ½ to ¾ of growth in wealth income ratio by national savings
• Wealth “residual” explained best by growth of rents• Land rents• Exploitation rents (monopoly power, political power)• Intellectual property rents
• Wealth can go up even if “K” is going down• And many increases in wealth associated with rents lead to decreased
productivity
51
WhatPiketty’smodelcannotexplain
• Distributive effects of QE• In modern economy, key distinction is not so much between debtors and creditors, but between life cycle savers and inherited wealth
• Differences in portfolio composition
• QE has benefits inherited wealth at expense of life cycle savers, contributing to inequality
52

V.Consequencesofinequalityfortheglobaleconomy• Growth in 2015 weakest since Global Financial Crisis and one of poorest performances in recent decades; 2016 on track for being equally weak
• Underlying problem: lack of global aggregate demand
• One of reasons: high level of inequality
• Inequality also affects aggregate demand indirectly
• Increases instability
• Realization of this creates uncertainty
• Uncertainty leads to lower investment
• Policies that reduce inequality would increase aggregate demand53
Concludingcomments• Explaining changes in inequality and its consequences are among the most important challenges facing economic theory
• One can explain some key aspects of the increase in inequality, especially in wealth, using models presented here, based on competitive equilibrium• With strong policy implications
• But there are many aspects of inequality that such models cannot explain• Increasing evidence that competitive model does not provide good description of the economy
• And Piketty explanation unpersuasive• Understanding these deviations, how they are evolving, and the implications for inequality is key research question
• With important implications for policy—potentially quite different from those suggested by competitive model
54