distribution categories: rort chemical separations...
TRANSCRIPT

NOTICE
PORTIONS OF THIS RORThas been reproduced from the best ava.lgopY to permit the broadest possible 3yil-
ability.
Distribution Categories:Chemical Separations Processes forPlutonium and Uranium (UC-10)
Nuclear Waste Management (UC-70)
ANL-84-45
ARGONNE NATIONAL LABORATORY9700 South Cass Avenue
Argonne, Illinois 60439
AUL--84-45
DEB4 016019
TRANSURANIC DECONTAMINATIONOF NITRIC ACID SOLUTIONS BY THE
TRUEX SOLVENT EXTRACTION PROCESS--PRELIMINARY DEVELOPMENT STUDIES
by
George F. Vandegrift, Ralph A. Leonard,and Martin J. Steindler
Chemical Technology Division
and
E. Philip Horwitz, Louis J. Basile,Herbert Dihmond, Dale G. Kalina,
and Louis Kaplan
Chemistry Division
July 1984
DISCLAIMER
This report was prepared as an account of work sponsored by an agency of the United States" Government. Neither the United States Government nor any agency thereof, nor any of their
employees, makes any warranty, express or implied, or assumes any legal liability or responsi-bility for the accuracy, completeness, or usefulness of any information, apparatus, product, orprocess disclosed, or represents that its use would not infringe privately owned rights. Refer-ence herein to any specific commercial product, process, or service by trade name, trademark,manufacturer, or otherwise does not necessarily constitute or imply its endorsement, recom-mendation, or favoring by the United States Government or any agency thereof. The viewsand opinions of authors expressed herein do not necessarily state or reflect those of theUnited States Government or any agency thereof.
MASTER.
PrST'}i~liTk'fl4 J 1 Y; : CEIJ!tT S I

TABLE OF CONTENTS
Page
ABSTRACT . . . . . . . . . . . . . . . . . . . . . . . . . . . . . .
I. INTRODUCTION . . . . . . . . . . . . . . . . . . . . . . . .
II. SUMMARY AND CONCLUSIONS . . . . . . . . . . . . . . . . . . . . .
III. GENERIC TRUEX PROCESS..................... ......... .0. ..
A. Extraction/Scrub Step . . . . . . . . . .
B. Strip Step . . . 9. . . .0.0 . . .0.0 . .
C. Solvent Wash . .0 0.. .0 .. . 0 . . . 0. ..0 0 . .
D. Solvent Cleanup...................0....
IV. TRUEX PROCESS FLOWSHEETS FOR DSW AND CAW FEEDS
A. Flowsheets .. . . . . . . . . . . . .. .
1. Design Basis . . . . . . . . . . . .
2. DSW . . . . . . . . . . . . . . . . . .3. CAW . . . . . . . . ........... ....
B. Experimental Verification of Reference Flowsheets . .
1. Extraction and Scrub Behavior of DSW Components2. Stripping Behavior of DSW Components . . . .3. Relevance of Results to TRU Decontamination . .4. The TRU Product Composition . . . . . . . . . .
C. Modifications for an Improved TRUEX Flowsheet . .
V. TRUEX PROCESS CHEMISTRY AND FLOWSHEET FEATURES
A. Process Flexibility . . . . . . . . . . . .
1.2.3.4.
Nitric Acid Concentration . . . . . . . .Oxalic Acid Concentration . . . . . .Temperature . . . . . . . . . . . . . . .
Tributyl Phosphate . . . . . . . . . .
B. Diluent Properties and Phase Compatibility . .
1.2.3.
4.5.6.
Choice of Diluent . . . . . . . . . .
TBP Concentration . . . . . . . . . .Nature and Concentration of BifunctionalExtractant . . . . . . . . . . . . .
Aqueous Phase Nitric Acid ConcentrationTemperature . . . . . . . . . . . . .
Other Considerations . . . . . . . . .7. Summary of Observations on Third-Phase Formation . . . .
1
1
3
4
. . . . . . . . .
. . . . . . . . .
iii
4
4
6
7
8
8
81119
24
27374141
43
45
45
45475151
52
5353
5456565757
. ." ." ." ." . . . .
. ." . ". .
" ." ." . .
...
...
...
...
. .0 .0 .0
....
....
....
....
.s
. .0.0.0.0.0.0.0
. . ." ."
. ." ." ."
. ." ." ."
. ." ." ."
."."
."
."
....
."
."
. ." ." ." ." ." ."
. ." ." ." ." ." ."
. ." ." ." ." ." ."
. ." ." ."
. ." ." ."
. ." ." ."
. ." ." ."
."
."
."
."
."
."
."
."
."
."
."
."
."
."

TABLE OF CONTENTS (Contd)
Page
C. Physical Properties of Extractants
1. DHDECMP.... .. ....................... .. .. ...2. OmD[IB]CMPO........... .. ........
D. Aqueous Phase Solubilities and Partitioning ofExtractants. ............ . ........
1. DHDECMP.... .. ....................... .. .. ...2. 0 D[IB]CMPO....... . . ...........
E. Chemical and Radiolytic Degradation of TRUEX ProcessExtractants and Solvent Cleanup... ...... ....
1. DHDECMP.... .. ....................... .. .. ...2. 0$D[IB]CMPO....... . . ...........
F. Potential Suppliers and Estimated Unit Prices ofExtractants. ............ . ........
G. Evaluation of Extractant Inventory and Loss ... ...
H. Process Equipment for Solvent Extraction
I. Process Safety . . . . . . . . . . . . . . . . . . . . .
VI. RECOMMENDATIONS FOR ADDITIONAL R&D .0. . .. 0.0 . 0.0.. .ACKNOWLEDGMENTS. . . . . . . . . . . . .0...0.0 . . . . . . .
REFERENCES . . . . . . . . . . . . . 0. 0. 0. 0. 0. 0. 0. 0. 0. 0. 0. . . . 0. . .
APPENDIX A.
APPENDIX B.
APPENDIX C.
TRUEX FLOWSHEET CALCULATIONS ....... .0. .....
COUNTERCURRENT TESTS OF TRUEX PROCESS FLOWSHEETS--EXPERIMENTAL DETAILS .............. 0..... ...
OXALIC ACID COMPLEXING OF CAW AND DSW COMPONENTS . . .
iv
. ."
. ."
83
89
107
57
5758
62
6262
65
6565
67
70
71
74
76
77
78
. .0.0

LIST OF FIGURES
No. Title Page
I-1. Chemical Structures of the TRUEX BifunctionalExtractants . . . . . . . . . . . . . . . . . . . . . . . . . . 2
III-1. Generic TRUEX Process Flowsheet . . . . . . . . . . . . . . . . 5
IV-1. CMP-TRUEX Process Flowsheet for Extraction of TRU Elementsfrom DSW Solution . . . . . . . . . . . . . . . . . . . . . . . 16
IV-2. CMPO-TRUEX Process Flowsheet for Extraction of TRUElements from DSW Solution . . . . . . . . . . . . . . . . . . 18
IV-3. CMP-TRUEX Process Flowsheet for Extraction of TRU Elementsfrom CAW Solution . . . . . . . . . . . . . . . . . . . . . . . 22
IV-4. CMPO-TRUEX Process Flowsheet for Extraction of TRUElements from CAW Solution . . . . . . . . . . . . . . . . . . 25
IV-5. The Americium Concentration in the Organic and AqueousPhases of Each Stage of the Countercurrent Experimentat Near-Steady-State . . . . . . . . . . . . . . . . . . . . . 28
IV-6. The Neptunium Concentration in the Organic and AqueousPhases of Each Stage of the Countercurrent Experiment atNear-Steady-State . . . . . . . . . . . . . . . . . . . . . . 28
IV-7. The Plutonium Concentration in the Organic and AqueousPhases of Each Stage of the Countercurrent Experimentat Near-Steady-State . . . . . . . . . . . . . . . . . . . . . 29
IV-8. The Americium Concentration in a Raffinate Sample vs. theRaffinate Sample Number . . . . . . . . . . . . . . . . . . . . 31
IV-9. The Neptunium Concentration in a Raffinate Sample vs. theRaffinate Sample Number . . . . . . . . . . . . . . . . . . . . 32
IV-10. The Raffinate Concentration of 9 9 Tc vs. the RaffinateSample Number . . . . . . . . . . . . . . . . . . . . . . . . . 37
IV-ll. An Improved CMPO-TRUEX Flowsheet for DSW Feed . . . . . . . . . 44
V-1. The Distribution Ratio of Am vs. HNO 3 for the TRUEXSolvents . . . . . . . . . . . . . . . . . . . . . . . . . . . 46
V-2. The Organic-Phase [HNO3] and the Distribution Ratios ofOxalic Acid and Pertechnitic Acid vs. theAqueous-Phase [HNO3 ] for CMPO-TRUEX Solvent . . . . . . . . . 47
V

LIST OF FIGURES (Contd)
No. Title Pag
V-3. Acid Dependency of DAm for 0.25M O#D[IBJCMPO inDecalin as a Function of Added TBP at 25 C . . . . . . . . . . 52
B-s.. The Experimental Design and Flow Ratios of the TwoCountercurrent Experiments . .. 0.......0.......... 98
vi

LIST OF TABLES
No. Title Page
IV-1. Waste Feed Solutions . . . . . . . . . . . . . . . . . . . . . . 10
IV-2. Maximum Allowable Am Concentration in an AqueousRaffinate . . . . . . . . . . . . . . . . . . . . . . . . . . . 11
IV-3. Distribution Coefficients for Various DSW Constituents
Using CMPO-TRUEX Process Solvent at 40 C . . . . . . . . . . . . 12
IV-4. Distribution Coefficients for Various CAW Constituents
Using CMPO-TRUEX Solvent at 40*C . . . . . . . . . . . . . . . . 13
IV-5. Distribution Coefficients for Various CAW or MDSWConstituents Using CMP-TRUEX at 40 C . . . . . . . . . . . . . . 14
IV-6. CMP-TRUEX Process Flowsheet for Removal of TRU Elementsfrom DSW Solution . . . . . . . . . . . . . . . . . . . . . . . 17
IV-7. CMPO-TRUEX Process Flowsheet for Removal of TRU Elementsfrom DSW Solution . . . . . . . . . . . . . . . . . . . . . . . 20
IV-8. CMP-TRUEX Process Flowsheet for the Removal of TRU Elementsfrom CAW Solution . . . . . . . . . . . . . . . . . . . . . . . 23
IV-9. CMPO-TRUEX Process Flowsheet for Removal of TRU Elementcfrom CAW Solution . . . . . . . . . . . . . . . . . . . . . . . 26
IV-10. Distribution Ratios of Actinide Elements in Each Stage ofthe Countercurrent Experiment . . . . . . . . . . . . . . . . . 30
IV-ll. Raffinate Concentrations of Np for the Mini-CountercurrentExperiment . . . . . . . . . . . . . . . . . . . . . . . . . . 30
IV-12. Distribution Ratio of Neptunium in Each Stage of theMini-Countercurrent Experiment . . . . . . . . . . . . . . . . . 31
IV-13. Steady-State Decontamination Factors of TRU Elementsand Uranium from Simulated DSW . . . . . . . . . . . . . . . . . 32
IV-14. Distribution Ratios of Nonfission Products in Each Stageof the Countercurrent Experiment . . . . . . . . . . . . . . . . 34
IV-15. Distribution Ratios of Fission Products in Each Stageof the Countercurrent Experiment . . . . . . . . . . . . . . . . 35
IV-16. Americium and Neptunium Stripping Behavior . . . . . . . . . . . 38
vii

LIST OF TABLES (Contd)
No. Title
IV-17. A Qualitative Summary of the Stripping Behavior of TRUElements from Loaded CMPO-TRUEX Solvent . . . . . . . . .
IV-18. Composition of the Combined Dilute Nitric Acid Stripsof Loaded Organic from Cold Countercurrent Run . . . . . .
IV-19. Composition of Rare Earths and Yttrium in the Feedand the Combined Strip . . . . . . . . . . . . . . . . . .
IV-20. Concentration of TRU Elements and Uranium in HanfordCAW and DSW . . . . . . . . . . . . . . . . . . . . . . .
IV-21. Probable Species in Solidified Raffinate and TheirMasses per Volume of Feed . . . . . . . . . . . . . . . .
IV-22. Summary of Calculations for TRU Content of SolidifiedRaffinate . . . . . . . . . . . . . . . . . . . . . . . .
IV-23. Calculation of the Non-TRU Composition of SolidifiedTRU Product . . . . . . . . . . . . . . . . . . . . . . .
V-1. Distribution Ratios of DSW Components vs. Aqeuous-Phase[H 2C204 ] for a CMP-TRUEX Process Solvent . . . . . . . . .
V-2. Distribution Ratios of DSW Components vs. Aqeuous-Phase[H 2C204 ] for a CMPO-TRUEX Process Solvent . . . . . . . .
V-3. Distribution Ratios of DSW Components vs. Aqeuous-Phase[H2C204 ] under Conditions Used for FlowsheetVerification by the Batch Countercurrent Experiment . . .
V-4. Influence of Temperature on the Extraction of Americiumand Europium by TRUEX Process Solvents . . . . . . . . .
V-5. Composition of NPH Diluents . . . . . . ... . . . . .
V-6. Effect of Diluent on the Loading Capacity of CMPO-TRUEXProcess Solvents.. . . . . . . . . . . . . . . . . . . .
V-7. Loading Capacities of Preconditioned 0.2M O$D[IB]CMPO inConoco C1 2 -C1 4 Solutions Containing TPB . . . . . . .
V-8. Loading Capacity of O$D[IB]CMPO/1.2M TBP Solutions inNorpar-12 .. . . . . . . . . . . . . . . . . . . . . . .
viii
Page
39
40
40
41
42
42
43
48
49
50
52
53
54
55
55
. . .
. . .
. . .
. . .
. . .
. . .
. . .
. . .
. ." ."
. ." ."
. ." ."
. ." ."
. ." ."

LIST OF TABLES (Contd)
No. Title Page
V-9. Effect of Diluent on the Loading Capacity of CMPO-TRUEXProcess Solvent at 1.OM HNO3 .-. . . . . . . . . . . .. . . . .. . . . 56
V-10. Estimated Physical Properties of TRUEX Solvents and TheirConstituents . . . . . . . . . . . . . . . . . . . . . . . . . 59
V-11. Aqeuous Phase Solubility and Partitioning of DHDECMP . . . . 63
V-12. Partitioning of CMPO Extractants under VariousConditions . . . . . . . . . . . . . . . . . . . . . . . . . . 64
V-13. Possible Impurities in Crystallized O*D[IB]CMPO . . . . . . . 68
V-14. Potential Suppliers of DHDECMP and/or OD[IB]CMPO . . . . . . 69
V-15. Evaluation of Extractant Loss . . . . . . . . . . . . . . . 72
V-16. Comparison of Pulsed Columns and Annular ContrifugalContactors for Solvent Extraction . . . . . . . . . . . . . . 73
V-17. Number of Transfer Units (NTU) Required for AmericiumExtraction . . . . . . . . . . . . . . . . . . . . . . . . . . 74
A-1. Application of Extraction Fact' Analysis to the Elementsin the DSW or CAW Solutions wi, 'i CMPO- or CMP-TRUEXProcess Solvents . . . . . . . . . . . . . . . . . . . . . . . 85
B-1. Composition of the Synthetic DSW: Nonfission Products . . . . 90
B-2. Composition of Synthetic DSW Solutions: FissionProducts . . . . . . . . . . . . . . . . . . . . . . . . . . . 91
B-3. Composition of Synthetic DSW Feed Solutions: Actinides . . . . 92
B-4. Solid Additions in Preparation of Four Liters of SyntheticDSW Solution . . . . . . . . . . . . . . . . . . . . . . . . . 93
B-5. Liquid Additions in Preparation of Four Liters of SyntheticDSW Solution . . . . . . . . . . . . . . . . . . . . . . . . . 94
B-6. Volume Additions in the Two Countercurrent Experiments . . . . 99
B-7. Elements Measured by ICP/AES Analysis and Their DetectionLimits . . . . . . . . . . . . . . . . . . . . . . . . . . . . 102
B-8. 2 3 9 Pu Addition to Samples of 2 4 2 Pu for IsotopicDilution/Mass Spectrometric Analysis . . . . . . . . . . . . 104
ix

LIST OF TABLES (Contd)
No. Title Page
C-1. The Hydrogen Ion Activity and the Fraction of H2 0x, HOx',and 0x2 - for Uncomplexing Oxalic Acid in Various NitricAcid Media . . . . . . . . . . . . . . . . . . . . . . . . . . 108
C-2. Logarithms of Oxalato-Complex Stab! lity Constants forMetal Ions in High Concentration in CAW and DSW . . . . . . . 109
C-3. Logarithms of Oxalato-Complex Stability Constants forActinide Element Species........ . . . . . ........ . 109
C-4. Logarithms of Oxalato-Complex Stability Constants forLanthanide Elements and Yttrium Species . . . . . . . . . . . 110
C-5. Logarithms of Oxalato Complex Stability Constants forNoble Metal Ion and Other Metal Ion Species . . . . . . . . . 110
C-6. Logarithms for Fluoride Complex Stability Constants forMetal Ions in CAW and DSW ................... 111
C-7. Speciation in CAW Solution..... ... .......... . 113
x

TRANSURANIC DECONTAMINATION OF NITRIC ACID SOLUTIONS BY THE TRUEX
SOLVENT EXTRACTION PROCESS--PRELIMINARY DEVELOPMENT STUDIES
by
George F. Vandegrift,* Ralph A. Leonard,*Martin J. Steindler,* E. Philip Horwitz,t
Louis J. Basile,t Herbert Diamond,t
Dale G. Kalina,t and Louis Kaplant
ABSTRACT
This report summarizes the work that has been performed todate at Argonne National Laboratory on the development of the TRUEXprocess, a solvent extraction process employing a bifunctionalorganophosphorous reagent in a PUREX process solverc (tributylphosphate-normal paraffinic hydrocarbons). The purpose of thisextraction process is to separate and concentrate transuranic (TRU)elements from nuclear waste. Assessments were made of the use oftwo TRUEX solvents: one incorporating the well-studied dihexyl-N,N-diethylcarbamoylmethylphosphonate (DHDECMP) and a second incorpor-
ating an extractant with superior properties for a 1M HNO3 acidfeed, octyl(phenyl)-N,N-diisobutylcarbamoylme thylphosphine oxide(O D[IBJCMPO). In this report, conceptual flowsheets for theremoval of soluble TRUs from high-level nuclear wastes using thesetwo TRUEX process solvents are presented, and flowsheet featuresare discussed in detail. The conceptual flowsheet for TRU-element
removal from a PUREX waste by the O*DIB]CMPO-TRUEX process solvent
was tested in a bench-scale countercurrent experiment, and resultsof that experiment are presented and discussed. The conclusion of
this study is that the TRUEX process is able to separate TRUs fromhigh-level wastes so that the major portion of the solid waste(99%) can be classified as non-TRU. Areas where more experimentationis needed are listed at the end of the report.
I. INTRODUCTION
Described in this report is a solvent extraction process (named the TRUEXprocess) that can remove and concentrate soluble actinide elements+ (U, Np, Pu,Am) from nitrate solutions under a wide range of chemical compositions for theaqueous media. TRUEX process, which is being developed at Argonne NationalLaboratory (ANL), employs as the organic solvent a bifunctional organophospho-rus extractant dissolved in ' PUREX process solvent, tributyl phosphate-normalparaffinic hydrocarbons (TLP-NPH). The effectiveness of the TRUEX process in
*Chemical Technology Division, ANL.
tChemistry Division, ANL.
*If insoluble transuranic elements (e.g., Pu0 2 ) are present in the feed,there must be a solid-liquid separation to remove the insoluble fraction.
1

2
separating and concentrating transuranic (TRU) elements from Hanford currentacid waste (CAW)* and dissolved sludge waste (DSW)t has been the thrust ofthis ANL effort.
The use of two TRUEX process solvents was examined: one incorporating thewell-studied dihexyl-N,N-diethylcarbamoylmethylphosphonate (DHDECMP) and asecond incorporating an extractant with superior properties for a 1M HNO3 acidfeed, namely, octyl(phenyl)-N,N-diisobutylcarbamoylmethylphosphine oxide(O D[IB]CMPO). Throughout this report, the former organic solvent is desig-
nated CMP-TRUEX, the latter CMPO-TRUEX. The chemical structures of these com-pounds are illustrated in Fig. I-1.
Chu 13-0 O
P/ 0
C6 13-0CH2-C
N C2 H5 Fig. 1-1.
C2HS Chemical Structures of the TRUEX
DHDECMP Bifunctional Extractants
CDHDECMP
P 0
2 \ CH2CH(CH3 2
CH 2CH(CH 3)2
0D[ IB]CMPO
*CAW represents typical PUREX high-level acid waste that has been denitratedby sugar.
tAt Hanford, PUREX process CAW is made alkaline and s ored in double-shell
tanks. The neutralized waste contains a solid phase (sludge) with almost allof the 90Sr and actinide elements in the waste. Dissolved sludge waste refersto a solution that might be produced if the sludge, when eventually retrieved,were to be dissolved by oxalic acid and/or nitric acid. Current waste manage-ment plans at Hanford call for retrieval and vitrificatiornof the sludge with-out production of the DSW.

3
II. SUMMARY AND CONCLUSIONS
Four reference TRUEX process flowsheets were devised for TRU removal fromCAW and DSW by either CMP-TRUEX or CMPO-TRUEX process solvents. These flow-sheets were calculated from batch distribution ratios with simulated wastesolutions. Based on these reference flowsheets, the number of requisiteextraction stages to reduce TRU element concentrations to or below 1000 nCi/g
and 100 nCi/g solidified raffinate was calculated. Appropriate conditions forstripping the loaded organic solvent were also determined from batch distribu-
tion ratios.
The CMPO-TRUEX process flowsheet for use with DSW was successfullydemonstrated in an extensive batch countercurrent test using synthetic DSWspiked with appropriate radionuclides. This batch countercurrent experimentdemonstrated convincingly that the CMPO-TRUEX flowsheet would reduce solubleTRU element concentration below 100 nCi/g in the solidified raffinate ('99%of the mass of the solidified feed would be non-TRU).
In this report, pertinent data and results are presented for importantTRUEX process factors, including (1) process flexibility, (2) diluent proper-
ties and phase compatibility, (3) physical properties of extractants,(4) aqueous phase solubilities and partitioning of extractants, and (5) chem-ical and radiolytic degradation of extractants and solvent cleanup. Alodiscussed are potential suppliers and estimated unit prices of extractatts,extractant inventory and loss, process equipment for solvent extraction, andprocess safety.
For use with either DSW or CAW solutions, the CMPO-TRUEX flowsheet is pre-
ferred over that of CMP-TRUEX because:
" The CMPO-TRUEX solvent is more efficient than CMP-TRUEX and, therefore,
requires fewer extraction stages.
" CMPO-TRUEX does not require the addition of Al(N03 )3 to DSW to remove
soluble TRU.
p The extracting power of CMPO-TRUEX solvent is far less affected by HNO3concentrations in the range of 0.5-6M nitrate than is that ofCMP-TRUEX; great variations in feed composition are easily handled.
" O$D[IB]CMPO Is easier to purify than DHDECMP.
" The much lower aqueous phase solubility and much higher chemical andradiolytic stability of 0$D[IB]CMPO make it an economic favorite overDHDECMP, even though it has a higher unit price.

4
III. GENERIC TRUEX PROCESS
Development work on the TRUEX process has been centered thus far on twofeed solutions, CAW and DSW. Because of its flexibility, however, the TRUEXprocess shows potential for removing and concentrating TRU elements fromvarious HNO3 solutions. A generic TRUEX process flowsheet for handling a widevariety of feeds is presented in Fig. III-1. Important flowsheet features arecalled out in the following discussion.
A. Extraction/Scrub Step
" The choice of which bifunctional organophosphorus extractant to use isdependent primarily on the nitric acid concentration of the feed and, to alc3ser extent, on the total concentration of dissolved nitrate ion. Because,in using 0OD[IB]CMPO, distribution ratios of TRU elements are insensitive to[HNO 3 ] in the range of 0.7 to 5M, it is the preferred extractant in this[HNO3J range. Above 3M HNO3, the CMP-TRUEX solvent becomes more selectivefor TRU elements than the CMPO-TRUEX solvent; the latter solvent, however,still has higher distribution ratios for TRU element extraction.
" The ratio of [TBP] to [OOD[IB]CMPO] or [DHDECMP] in the TRUEX processsolvent is set primarily to avoid third-phase formation. Requirements of lowtemperature, high [HNO3 ], and high solvent loading necessitate the highestratio of [TBP] to [OOD[IB]CMPO] or [DHDECMP].
" Oxalic acid is added to feeds containing fission products to improveselectivity of the extractant for TRU elements.
" High concentrations of inerts (e.g., Na, Al, Fe, Cr, Ni, SO4 , F-)generally require no special adjustments in feed composition.
* The fate of Tc in the TRUEX process is dependent on the feed composi-tion and on 0/A flow ratios. Technetium extractability is increased by thepresence of rare earth elements and has a parabolic dependency on the aqueousphase acidity, reaching a maximum in the range of 0.25-1.OM HNO3 .
" Scrub composition depends primarily on the desired purity of TRU ele--ments and on the concentration of fission products in the feed. Oxalic acidin the scrub solution is useful for removing Zr and Mo from the loaded organicphase. The presence of H2C204 forces the use of higher HNO3 concentra-tions in the scrub solution and may necessitate the use of a second scrub sectionto remove H2C204 and HNO3 from the loaded organic before stripping.
" If a second scrub section is necessary, the back extraction of H2 C2 04
can be facilitated by adding Fe(III) to that scrub solution.
B. Strip Step
" The required [HNO3J of the strip solution is dependent on which TRUEXprocess solvent is used. Because DHDECMP is a less powerful extractant than

Y--------------------------------------------------------------------------------------------Y
Solvent
Extraction Scrub
I|
Extraction Feed
HNO 3 0.7-5MH2C2C 4 0-0.3M100% Actinidesb100% F.P.R.E.C
100% F.P.d100% Inerts'
AqueousRaffincte
''100% F.P.0-90% Tc'
~100% Inerts100% H2 C2 04
To Recovery ofSelected FissionProducts and/or
Disposal
Str
TRU Product
~100% Am, Np, Pu10% U
~100% F.P.R.E.<2% F.P.
<2% Inerts10-100%Tc
To Recovery ofActinides and/or
Disposal
trip-Wash
0.05-0.1Mp-
H2C204
Solvent Wash
Spent Solvent SWashk Cle
90% U<1% Np, Pu
<2% Zr
To Disposal
MacrAnion
olventean-up'
roporousExchange
Resin
Fig. III-1. Generic TRUEX Process Flowsheet(footnotes to figure are on on page 6)
Scrubs
0.5-1.5M HNO30-0.03M H2C 204
-"- Solvent
Make-up
5trip9
0.01-OM HNO3
0.005MHANh
I

6
Footnotes
aEither 0.1-0.3M 0*D[IB]CMPO/1.0-1.4M TBP/NPH or 0.4-0.5M DHDECMP/1.2-1.4M TBP/NPH. Ranges of the bifunctional organophosphorus extrac-
tants and TBP are functions of the diluent. An NPH mixture with a
lower average carbon chain length will allow the use of higher concen-
trations of extractant and lower concentrations of TBP without third-phase formation problems.
bActinides = soluble species of U, Np, Pu, and Am.
cF.P.R.E. = fission product rare earths.
dF.P = fission products (except F.P.R.E.).
eFor example, Na+, A13+, Fe3 +, Cr3 +, Ni2 +, SO 42 -, F-.
FLower HNO3 concentration for the CMPO-TRUEX process; higher concen-
trations for the CMP-TRUEX process. Oxalic acid only required when fis-sion products are in the feed.
gLower concentrations of HNO3 for CMPO-TRUEX processes; higher ones
for CMP-TRUEX processes.
hHydroxylammonium nitrate.
!The actinide activity level in this stream is less than 100 nCi/gof solidified waste form.
JThe solvent extraction behavior of technetium is greatly dependent
on the TRUEX process solvent and th relative stream flows.
kNon-TRU waste stream.1An optional operation where resin would be removed for recycle or
disposal.
0$D[IB]CMPO, TRU elements cain be stripped from CMP-TRUEX process solvent at
higher [HNO3].
* Stripping of Am and Pu is much easier than stripping Np, and far easier
than stripping G.
* The addition of HAN to the stripping solution reduces Pu(IV) to Pu(III)
and thus increases the ability to strip Pu.
* It may be possible to selectively strip Am (III) from Pu (IV) in a
two-part stripping operation by (1) stripping Am with dilute HNO 3 followedby (2) a dilute HNO3-HAN strip of Pu.
C. Solvent Wash
* An oxalic acid wash will be necessary to cleanse the spent solvent ofelements not removed by stripping (most of thelU and traces of Np, Pu, and Zr).
* The waste solution from this process step would generally be non-TRU.

7
D. Solvent Cleanup
" Aqueous NaOH or Na 2 CO 3 washes are not sufficient to remove the highmolecular weight, acidic compounds generated by the hydrolysis/radiolysis ofDHDECMP and O6DIIB]CMPO and their associated impurities, but alkaline washingwould be useful in removing the dibutylphosphoric acid produced from TBPdegradation.
" An optional operation employing macroporous anion exchange resin (inthe OH- form) should be effective in removing the acidic degradation productsof high molecular weight in the CMP-TRUEX and CMPO-TRUEX process solvents.
* The spent anion exchange resin could either be recycled or disposed ofas non-TRU weste.

8
IV. TRUEX PROCESS FLOWSHEETS FOR DSW AND CAW FEEDS
A. Flowsheets
1. Design Basis
The basis for the flowsheet designs given in Sections IV.A.2 and 3 is
described in this section. The factors considered in flowsheet design were
process constraints, given process parameters, calculated process parameters,
and distribution coefficient data. Computational procedures are given in
Appendix A.
a. Process Constraints
" The first process constraint is to separate enough of the TRU
elements from the bulk of the waste to make it non-TRU waste.
I The second process constraint is to keep the organic-to-aque-
ous (0/A) ratio within the ranges typically used for good operation of pulsedcolumns. This 0/A range is 0.5 to 2.5 for the extraction section, 0.33 to 10
for the scrub section, and 0.5 to 4 for th stripping section. The 0/A ratio
is not a constraint with the use of annular centrifugal contactors since suchcontactors work well over a wide range of 0/A flow ratios.
* A further constraint to the 0/A ratio comes from the dynamics
of the process itself. Two competing factors are at work. On the one hand,
the 0/A ratio should be low to minimize the organic phase inventory, since the
extractant is expensive. On the other hand, the number of extraction stages
should be minimized by keeping the 0/A ratio high. Since the volume of extrac-
tant in the extraction units will be less than 10% of the extractant needed forthe process (see Section V), the number of stages was minimized by making the
0/A ratio as large as possible consistent with the other constraints. Infact, limiting the amount of Pd, Zr, and Mo in the organic phase (discussed in
the following constraint) actually fixed the 0/A flow ratio in the extra'ztionsection for all flowsheets.
* A fourth constraint is to minimize the concentration of Pd,
Zr, and Mo in the organic effluent (product) from the extraction/scrub unit.
These metal ions cause problems when the organic product is fed to the strip-
ping unit; scums form and greatly retard the coalescence of the dispersion. Toprevent this, the concentration of these metal ions is kept low, i.e.,
<1 x 10⁻⁴ M in the organic product. This is done by adding oxalic acid, which
keeps these metal ions in the aqueous phase as inextractable oxalato-complexes.
* A fifth constraint is to minimize the concentration of
oxalate in the organic effluent (product) from the extraction/scrub unit so thatlanthanide oxalates do not precipitate when the organic phase is stripped.The process should be operated so that the concentration of oxalate ions in theorganic product is less than that of the lanthanide ions. Since the concentra-tion of rare earths in the organic porduct is about 0.02M, the maximum oxalateconcentration was set at 0.OO1M, 5% of the rare earth concentration. WhenO.D[Ib]CMPO is the extractant, oxalate is added to the first aqueous scrub feedso that Pd, Zr, and Mo are kept out of the organic product. Then a secondscrub section with a low nitric acid concentration (0.5M) and a small amount of
Fe (0.01M) is used to obtain the desired low oxalate concentration in the

9
organic product. When DHDECMP is the extractant, a high nitric acid concentra-
tion in the scrub is required to maintain a reasonably high distribution coef-
ficient for the americium. The oxalic acid distribution coefficient is muchlower at the higher nitric acid concentration; therefore, only one scrub sec-
tion is needed.
* A sixth constraint is to keep the metal ion loading in theorganic phase at a level where a second organic phase will not form. As a
design guide, the maximum loading of the solvent was kept to 50% of thatrequired to form a second organic phase. This was done by choosing the properdiluent and concentrations of the TBP and each bifunctional extractant.
" A final constraint (perhaps more of a guideline than a con-straint) is to keep technetium with the organic produce from the extraction/scrub unit.
b. Given Process Parameters
For the flowsheets described below, the organic phase extractantis either DHDECMP or 0$D[IB]CMPO. The diluent is a commercial mixture of NPHwith carbon chain lengths in the range of 12 to 14, Conoco 12-14. For theCMP-TRUEX process solvent, the DHDECMP extractant has a concentration of 0.4Mand is modified by adding TBP with a concentration of 1.2M. Since commercialDHDECMP actually contains 86% DHDECMP, with the other 14% being a neutralspecies with properties much like TBP, only 1.1M TBP is added to make up theCMP-TRUEX solvent; the additional 0.lM concentration of TBP-like materialcomes from the commercial DHDECMP. Thus, the 1.2M value for TBP in the
CMP is actually an effective TBP concentration. For the CMPO-TRUEX processsolvent, the 0$D[IB]CMPO extractant has a concentration of 0.2M and is modifiedby adding TBP with a concentration of 1.4M.
In the four flowsheets given in Sections IV.A.2 and 3, threewaste solutions are used as aqueous feed streams. These three waste feed
solutions are identified in Table IV-1, with the concentrations of the majorcomponents given. When DHDECMP is used with DSW to which Ai(NO3)3 has beenadded, the distribution coefficient for Am is higher than would otherwise bethe case. This greatly helps in the efficient removal of Am from the feed.Oxalic acid is added to the CAW to give the concentration shown in Table IV-1.For DSW, oxalic acid will already be present since oxalic acid is used to
dissolve the sludge.
All flowsheets are intended to be operated at 40*C.
c. Calculated Process Parameters
Since the concentration of americium in terms of Ci/L is largerelative to Np and Pu, it is the key component in TRU removal. For this
reason, the maximum allowable TRU concentration in the aqueous raffinate wascalculated in terms of the maximum allowable Am concentration. The results,given in Table IV-2, show that DSW requires a lower concentration in theraffinate than does the modified DSW (MDSW) or CAW. This is the result of thehigher aluminum nitrate content of the MDSW and CAW, which dilutes the TRU con-centration. For the same reason, the required decontamination factor (D.F.)is less for MDSW and CAW than for DSW. If the solids are metal nitrates rather

10
Table IV-1. Waste Feed Solutions
Concentration, M
ModifiedDSW DSWa CAW
Acids
HNO3 1.0 1.0 1.0H2C204 0.2 0.2 0.18
Non-Fission Product Cations
Fe 0.15 0.136 0.13Al 0.046 0.70 0.71Na 0.15 0.136 0.18Othersb (Cr, Ni, Be,c Ca, Cu, Mg,
Mn, Si,c Ti) 0.031 0.028 0.036
Anions
NO3d 1.9 3.8 3.0F' 2- 3-c 0.008 0.007 0.15Others (S04 , P04 ) 0.012 0.011 0.27
Fission Products
Zr 5.6E-3 5.1E-3 5.6E-3Eo 1.8%-4 1.6E-4 1.8E-4
Y 7.3 -4 6.6E-4 7.3E-4Ru 2.1E-3 1.9E-3 2.1E-3Pd 5.4E-4 4.9E-4 5.4E-4Tcc 0.0 0.0 9.8E-4Othersb (Cd, Nb, Se, Rb,c Sr, Rh,
Ag, Sn, Sb, Te, Cs,c Ba)
3.6E-3 3.3E-3 6.5E-3
Fission Product Rare Earths
La 1.0E-3 9.1E-4 1.0E-3Ce 2.4E-3 2.2E-3 2.4E-3Pr 9.2E-4 8.4E-4 9.2E-4Nd 2.7E-3 2.5E-3 2.7E-3Othersb (Pm, Sm, Eu, Gd) 7.4E-4 6.7E-4 7.4E-4
Actinides Including TRU
Am 1.7E-4 1.5E-4 1.7E-4Others (U, Np, Pu) 3.4E-4 3.1E-4 3.4E-4
aAl(N0 3 ) 3 .9H 2 0 added when processing DSW with DHDECMP extractant.
bThe sum of the concentrations of all constituents in this category.cThis constituent is not found in DSW waste feed solutions.
dlncludes nitrate from nitric acid.

11
Table IV-2. Maximum Allowable Am Concentration inthe Aqueous Raffinate
AmDecontamination
Level of Factor inType of Decontamination,a Amb in Aqueous Extraction
Aqueous Feed nCi/g Raffinate, M Section
DSW 100 3 x 10⁻⁹ 7 x 10⁴
1000 3 x 10⁻⁸ 7 x 10³MDSW,c CAW 100 5 x 10⁻⁹ 3 x 10⁴
1000 5 x 10⁻⁸ 3 x 10³
aIn the calculation, it is assumed that the products are present as
solid metal oxides.
bAmericium concentration in aqueous waste solution is 1.7 x 10⁻⁴M.
cModified DSW as given in Table IV-1.
than metal oxides, the required D.F. will be lower by a factor of about two forall cases. If concentrated aqueous raffinate is mixed with grout such that the
grout contains 12.5 to 25 wt % solids from the raffinate, the required D.F forTRU removal will be lower by another factor of 4 to 8. For the flowsheetsgiven in Sections IV.A.2 and 3, the D.F's given in Table IV-2 were used.
For the flowsheets, it is assumed that the organic feed to theextraction/scrub unit has only the organic diluent and extractants. Thus, the
solvent stripping and washing operations are treated as if they removed all themetal ions. The hardest metal ions to remove will be those that are extractedmore easily. Americium is of particular interest because its concentration inthe aqueous raffinate must be reduced to such a low value that the raffinatecan be converted into non-TRU waste. Using the McCabe-Thiele method of analy-
sis discussed in Appendix A, one can show that the metal ion concentration in the
organic feed is effectively zero if it is lower than the desired concentrationin the aqueous raffinate by the factor (ReD)/10, where Re is the 0/A flow ratioin the extraction section and D is the distribution coefficient for themetal ion.
d. Distribution Coefficient Data
The distribution coefficient data used to calculate conditionsfor the the various flowsheets are given in Tables IV-3 to -5.
2. DSW
a. Introduci.ion
Flowsheets are presented for removal of TRU elements from DSWsolution by using CMP- and CMPO-TRUEX process solvents. For each flowsheet,a six-stage scrub section is assumed. If two scrub sections (split scrub) areused, each scrub section has three stages. With six scrub stages and six ormore extraction stages, the elements in Regimes II and IV (the separationregimes, from I to V, and the constituents in each regime are presented inAppendix A) are concentrated predominantly (90 % to 95%) in the organic andaqueous effluents, respectively.

12
Table IV-3. Distribution Coefficients for Various DSWConstituents Using CMPO-TRUEX ProcessSolvent at 40 C
Distribution Coefficientsa
Extraction Scrub
Other Next to FeedStages Feed Stage Stage First Seond
Acids
HNO 3H 2C 204
0.30.06
Non-Fission Product Cations
FeCrNiAlNaCaCuMgMnTi
Fission Products
ZrCdNbMoSeSrYRuRh
PdAgSnSbTeBaTc 2.5 2.5
Fission Product Rare Earths
LaCePrNdPmSmEuGd
Actinides Including TRU
UNpPuAm
6.4111210.3(8.8)b
7.59.05.8
12
aIf one value applies to all stages, this
column.
bEstimeted.
value is shown in the feed stage
4.00.10
0.40
3.30.15
0.40
0.04<0.001<0.001<0.01<0.001<0.01<0.01(<0.01)b<0.01
(<0.01)b
0.04<0.1(0.04 )b0.28
(<0.01)b<0.01
1.80.3
<0.10.50<0.1
(<0.0 1 )b(<0.01)b(<0.01)b<0.01
3.0
2.94.85.44.6(4.6)b
4.64.12.6
>100>100>100
5.4
1.97 1.04 4
0.5 0.5
3.0 3.3
3.35.25.95.1(5 .1)b5.14.52.9
5.48.8
108.6(8.6)b
8.67.54.8
10
1.72.63.02.5(2.5)b2.52.21.5
6.0 3

13
Table IV-4. Distribution Coerticients for Various CAWConstituents Using CMPO-TRUEX Solvent at40C
Distribution Coefficients&
Extraction Scrub
Other Next to FeedStages Feed Stage Stage First Second
Acids
HN03H2C204
Non-Fission Product Cations
0.30.06
FeCrNiAlBeNaCaCuMgMnSiTi
Fission Products
ZrCdNbMoSeRbSrYRuRhPdAgSnSbTeCsBaTc 3.0 3.0
Fission Product Rare Earths
LaCePrNdPmSmEuGd
7.713.214.412.4
(10. 6)b9.0
10.87.0
Actinides Including TRU
UNpPuAm
aef one value applies to . l stages, this value is showncolumn.
bEstimated.
in the feed stage
0.34
4.80.12
0.48
0.34
3.960.18
0.48
0.048<0.001<0.001<0.01
(<0.01)b<0.001<0.01<0.01
(<0.01)b<0.01
(<0. 01 )b(<0.01)b
0.048<0.1(0.048)b0.34
(<0.01)b(<0.01)b<0.01
2.160.36
<0.10.60
<0.1(<0.0 1 )b(<0.01)b(<0.01)b(<0.01)b
<0.01
3.6
3.55.86.55.5(5.5)b5.54.93.1
>100>100>100
6.5
0.28 0.28
1.97 1.04 4
0.5 0.5
3.0 3.3
6.510.612.010.3
(10.3)b10.39.05.8
3.35.25.95.1(5.1)b5.14.52.9
1.72.63.02.5
(2.5)b
2.52.21.5
4 12.0 6.0 3

14
Table IV-5. Distribution Coefficients forVarious CAW or MDSW ConstituentsUsing CMP-TRUEX at 40 C
Distribution Coefficientsa
Extraction Scrub
Acids
HNO3 0.3H2C204 0.06
Non-FissionProduct Cations
Fe 0.0035Cr <0.001Ni <0.001Al <0.001Be (<0.01)b
Na (< 0.01)bCa <0.01Cu <0.001Mg (<0.01 )bMn <0.001
Si (<0.01)bTi (<0.01)b
FissionProducts
Zr 0.035Cd <0.01Nb (<0.01)bMo 0.025Se (<0.01 )bRb (<0.01)bSr <0.01Y 3.0Ru 0.3Rh <0.01Pd 0.63Ag <0.01Sn (<0.01)bSb (<0.01)bTe (<0.01)bCs (<0.01)bBa <0.01Tc 1.0 0.15
Fissicn ProductRare Earths
La 3.8 1.9Ce 4.1 2.0Pr 4.1 2.0Nd 4.1 2.0Pm (3.8 )b (1.8)bSm 3.5 1.7Eu 3.1 1.5Gd 2.0 1.0
Actinides Including TRU
U >4Np >4Pu >4Am 4.0 2.0
alf one value applies to all stages, this
value is shown in the extraction column.
bEs tima ted

15
b. DHDECMP Extractant
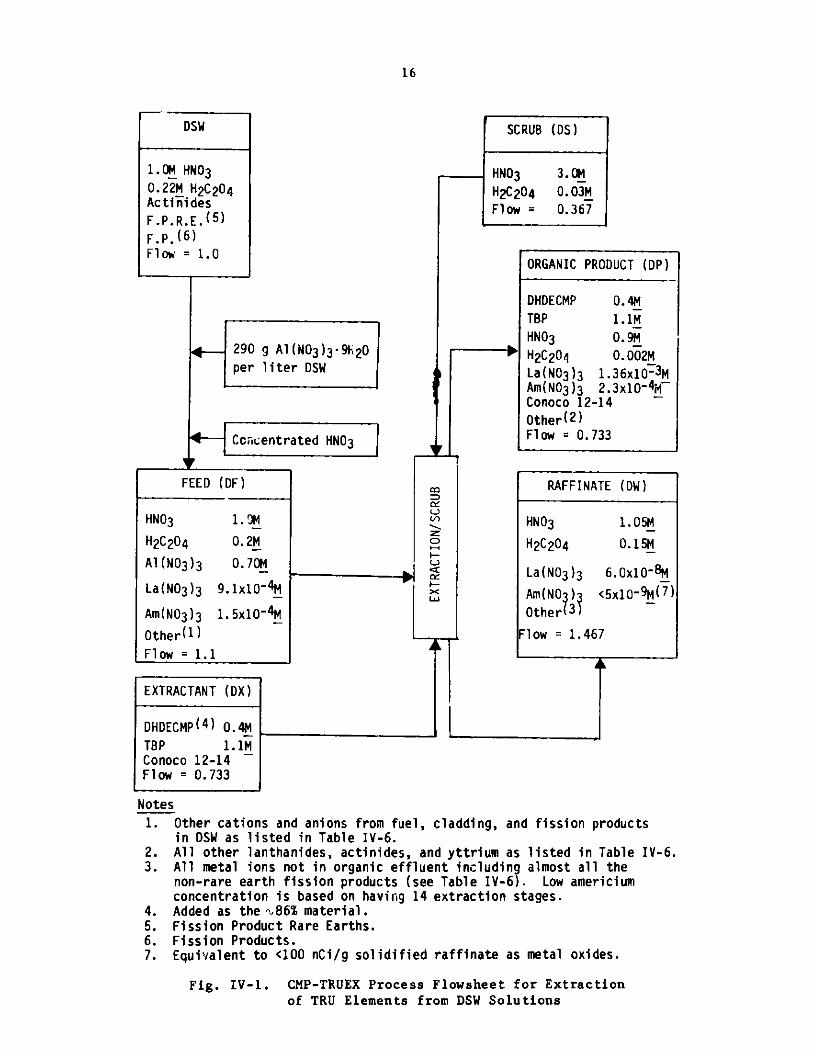
Table IV-5 lists the distribution coefficient data used toderive the flowsheet for CMP-TRUEX with modified DSW solution (MDSW)(Fig. IV-1). The MDSW solution has been prepared from the DSW feed by the
addition of 0.7M Al(N0 3 ) 3 so that the distribution coefficient foramericium is four rather than one. Because addition of Al(N03)3 increasesthe volume of the DSW feed by about 10%, concentrated HNO3 is also added tokeep the feed HNO3 concentration at 1.0M.
(1) TRU Decontamination
The process flowsheet, Fig. IV-1 and Table IV-6, willremove enough of the soluble TRU elements from the DSW feed to make its TRUconcentration less than 100 nCi/g. The process requires 14 extraction stagesand 6 scrub stages. The large number of extraction stages is required becauseof the low extraction factor for the americium. The extraction factor could bemade higher by increasing the 0/A flow ratio; but, as shown in Table A-1(Appendix A), a higher 0/A ratio allows palladium into the organic product.
To achieve a TRU concentration below 1000 nCi/g in the DSWsolution, 11 extraction stages and 6 scrub stages are sufficient.
(2) Stripping of TRU Elements
Americium is easy to strip from the CMP-TRUEX solvent.Typical stripping conditions include an 0/A flow ratio (Rst) of 2, 0.1MHNO3 , and 0.01M HAN (hydroxylammonium nitrate) to maintain reducing condi-
tions in the scrub. The distribution coefficient for americium under thesestripping conditions is 0.0085. To effectively strip the americium from theorganic phase, the stripping unit is designed to provide a decontaminationfactor which is ten times greater than that for the corresponding extractionsection. (This decontamination factor for stripping can actually be slightlylower, as noted in Section IV.A.l.c above.) Thus, when it is desired to havean Am concentration in the aqueous raffinate below 5x10⁻⁸ M (below 1000 nCiof TRU per gram of solid raffinate as metal oxide), the Am concentration inthe organic feed to the extraction/scrub unit should be 5xl0- 9 M. Calculationswith Eq. A-2 (Appendix A) indicate that four strip stages are required toachieve this Am concentration in the organic feed for the extraction/scrubunit. Five stages are required if the Am concentration in the aqueous raffinatis to be below 5x10- 9 M (below 100 nCi of TRU per gram of solidraffinate asmetal oxide). Since the organic feed to the strip unit contains HNO3 ,it may be necessary to have one cr two additional strip stages.
c. OOD[IB]CMPO Extractant
Table IV-3 lists the distribution coefficient data used toderive the CMPO-TRUEX flowsheet for use with DSW solution (Fig. IV-2).
16
DSW
1.0M HNO30.22M H 2C204Actinides
F.P.R.E. (5)F.P. (6)Flow = 1.0
290 g Al(N03)3 -9h20per liter DSW
Cclcentr
FEED (DF)
HNO3 1- M
Flow = 1.1 ]
EXTRACTANT (DX)
DHDECMP( 4 ) 0.4MTBP 1.1MConoco 12-14Flow = 0.733
Notes
1.
2.3.
4.5.6.7.
rated HNO3 d
C
I-
LW
SCRUB (DS)
HNO3
H2C204Flow =
3.0M0.03M
0.367
ORGANIC PRODUCT (DP)
DHDECMP 0.44MTBP 1.1M
HNO3 0.9MH2 C20 4 0.002MLa(N03)3 1.36x10~ 3MAm(N03)3 2.3x10⁻⁴W~Conoco 12-14 ~Other(2 )Flow = 0.733
RAFFINATE (DW)
HNO3 1.05M
H2C2 04 0.15M
La(N03)3 6.0x10⁻⁸M
Am(NO )3 <5x10⁻⁹M(7 )
Other 3)
Flow = 1.467
k
Other cations and anions from fuel, cladding, and fission productsin DSW as listed in Table IV-6.All other lanthanides, actinides, and yttrium as listed in Table IV-6.All metal ions not in organic effluent including almost all thenon-rare earth fission products (see Table IV-6). Low americiumconcentration is based on having 14 extraction stages.Added as the %86% material.Fission Product Rare Earths.Fission Products.Equivalent to <100 nCi/g solidified raffinate as metal oxides.
Fig. IV-1. CMP-TRUEX Process Flowsheet for Extractionof TRU Elements from DSW Solutions
H2C2 04
Al (NO3)3La(NO3)3
Am(N03 )3
Other (1)
0.2M_
0-.70M
9.1x10A4
1.5x10⁻⁴M
-- I
-- i
b
I
b6-pp,
F

17
Table IV-6. CMP-TRUEX Process Flowsheet for Removalof TRU Elements from DSW Solution
DF DS DX DW DP Notes
PhaseRel. Vol. Flow
Aqueous Aqueous Organic1.1 0.367 0.733
Aqueous Organic1.467 0.733
Acids
1.0 3.00.2 0.03
0.0 1.05 0.9 a0.0 0.157 0.0018 b
Non-Fission Product Cationi
Fe, NCr, MNi, MAl, NNa, MCa, NCu, NMg, NMn, NTi, _
Anions
NO3 , M
F, N_
Fission Products
0.1360.01220.0070.700. 1360.001231.6E-31.5E-34.1E-31.8E-5
0.00.00.00.00.00.00.00.00.00.0
3.8 3.0
0.007 0.0
0.00.00.00.00.00.00.00.00.00.0
0.0
0.0
0.1020.0090.0050.5250.1020.00091.2E-31.1E-33.1E-31.4E-5
3.1 0.956
0.005 0.0
0.011 0.0 0.0 0.008 0.0
Zr, _
Cd, NNb, N14, N_Se, NSr, _
Y, NRu, _
Rh, MPd, NAg, NSn, NSb, MTe, NBa, N
Fision Product Rare Earths
La,Ce,Pr,Nd,Pm,Sm,Eu,Gd,
Mf_M1_Mf_Mf_M1_Mi_ht_m1_
Actinides Includinj
U, _
Np, NPu, tAm, N
9. 1E-42.2E-38.4E-42.5E-32.6E-43.5E-44.4E-51.1E-5
g TRU
1.2E-41.9E-41.5E-61.5E-4
HNO3 , MH2 C2 04 , M
0.00.00.00.00.00.00.00.00.00.0
c
5. 1E-34.5E-51.3E-51.6E-48.6E-51.3E-36.6E-41.9E-35.2E-44.9E-43.3E-52.2E-51. 1E-53.0E-41.0E-3
0.00.00.00.00.00.00.0o.e0.0.00.00.00.00.00.0
0.00.00.00.00.00.00.00.0
0.00."10.00.0
0.00.00.00.00.00.00.00.00.00.00.00.00.00.00.0
0.00.00.00.00.00.00.00.0
0.00.00.00.0
3.8E-33.4E-51.0E-51.2E-46.4E-51.0E-31.5E-61.4E-33.9E-43.4E-42.5E-51.6E-58.2E-62.2E-47.5E-4
6.0E-84.7E-81.8E-85.3E-81.7E-88.0E-86.2E-87.2E-7
<.8E-9<6. 1E-9<4.8E-114.8E-9
0.00.00.00.00.00.09.9E-49.7E-60.05.9E-50.00.00.00.00.0
1.36E-33.3E-31.26E-33.8E-33.9E-45.2E-46.6E-51.51E-5
1.8E-42.8E-42.3E-62.27E-4
aConcentration is reported as hydrogen ion in DW and DP.
bConcentration is reported as oxalate ion in DW and DP.
clncludes nitrate from HNO3 .

18
DSW
1.0OM HNO30.18M H2C204ActinidesF.P.R.E.(4)F.P.( 5 )Flow = 1.0
FEED (DF)
HNO3 1.0M4
H 2C 204 0.18M.
Fe(N03)3 0.15M_
Al (NO3)3 0.046M_
La(N03 )3 1.0x10⁻³M
Am(N03)3 1.7x10⁴Mt
Other(1 )Flow = 1.0
FIRST SCRUB (DT)
HNO3 2.5MH2C204 0.06MFlow = 0.1667
GC
I-DC
I-X
SECOND SCRUB (DS)
HN03 0.5MFe(N03)3 0.01MFlow = 0.1667
ORGANIC PRODUCT (DP)
OQDLIB]CMPO 0.2MTBP 1.44M
HNO3 0.28MH2C204 2x10⁵ 5M
Fe(N03)3 4x10⁻⁴ M
La(N03)3 1.5x10⁻³M
Am(N03)3 2.5x10⁻⁴M
Conoco 12-14
Other(2 )Flow = 0.667
RAFFINATE (DW)
HNO3 0.98M
H2C204 0.14M_Fe(N03)3 0.11M
La(N03)3 5x10- 7 M
Am <3x10⁻⁹M(6 )Other( 3 )Flow = 1.333
NOTES1. Other cations and anions from fuel, cladding, and fission products in DSW
as listed in Table IV-7.2. All other lanthanides, actinides, technetium, and yttrium, as listed in
Table IV-7.3. All metal ions not in organic effluent including almost all the non-rare
earth fission products (see Table IV-7). Low americium concentrationis based on having seven extraction stages.
4. Fission Product Rare Earths.5. Fission Products6. Equivalent to <100 nCi/g solidified raffinate as metal oxides.
Fig. IV-2. CMPO-TRUEX Process Flowsheet for Extractionof TRU Elements from DSW Solution
EXTRACTANT (DX)
OOD[IB]CMPO 0.2M
TBP 1.4M.Conoco 12-14Flow = 0.667
'

19
(1) TRU Decontamination
The process flowsheet, in Fig. IV-2 and Table IV-7, willremove enough of the. soluble TRU elements from the DSW feed to make its TRUconcentration less than 100 nCi/g. The process requires seven extractionstages and six scrub stages. The small number of extraction stages is theresult of a high extraction factor for the americium. The extraction factor
could be made higher by increasing the 0/A flow ratio, but, as shown inTable A-1 (Appendix A), a higher 0/A ratio allows Pd into the organic product.
To achieve a TRU concentration below 1000 nCi/g in the DSW,six extraction stages and six scrub stages are sufficient.
(2) Stripping of TRU Elements
Americium is fairly easy to strip from CMPO-TRUEX olvent.Compared with the CMP--TP'JEX solvent, the CMPO-TRUEX solvent requires a lowerHNO3 concentration in the aqueous feed to get comparable distribution coeffi-
cients. For CMrO-TRUEX solvent, typical stripping conditions are an 0/A flow
ratio (Rst) of 2, 0.02M HNO3 , and a 0.O1M HAN concentration to maintain reduc-ing conditions in the scrub. The distribution coefficient for americium
under these stripping conditions is 0.02. To effectively strip the americiumfrom the organic phase, the stripping unit is designed to provide a decon-
tamination factor which is ten times greater than that for the correspondingextraction section. (This contamination factor for stripping can actually beslightly lower as noted in Section IV.A.l.c above.) Thus, when it is desired
to have an Am concentration in the aqueous raffinate below 5x10⁻⁸ M (below1000 nCi of TRU per gram of solid raffinate as metal oxide), the Am concentra-tion in the organic feed to the extraction/scrub unit should be 5x10⁻⁹M.Calculations using Eq. A-2 (Appendix A) indicate that five strip stages are
required to achieve this Am concentration in the organic feed for the extraction,
scrub unit. Six stages are req uired if the Am concentration in the aqueous
raffinate is to be below 5x10- 9 M (below 100 nCi of TRU per gram of solidraffinate as metal oxide). Since the organic feed to the strip contactorcontains some HNO3 from the extraction/scrub contactor, the acid level inthe first stages of the stripping unit will be higher. This higher acid levelwill increase the distribution coefficient for Am and it may be necessary toincrease the number of stripping stages by one or two.
3. CAW
a. Introduction
In this section, flowsheets are presented for the removal of TRUelements from CAW solution by using CMP- and CMPO-TRUEX solvents. For eachflowsheet, a six-stage scrub section is assumed. If two scrub sections (splitscrub) are used, each scrub section has three stages. With six scrub stagesand five or more extraction stages, the elements in Regimes II and IV (definedin Appendix A) are concentrated predominantly (90% to 95%) in the organic andaqueous effluents, respectively. Oxalic acid is added to the CAW.

20
Table IV-7. CMPO-TRUEX Process Flowsheet for Removalof TRU Elements from DSW Solution
DF DT DS DX DW DP Notes
PhaseRel. Vol. Flow
Aqueous Aqueous Aqueous Organic Aqueous Organic1.0 0.1667 0.1667 0.667 1.333 0.667
Acids
1.0 2.5 0.5 0.00.18 0.06 0.0 0.0
0.985 0.28 a0.143 2.1E-5 b
Non-Fission Product Cations
Fe, MCr, MNi, MAl, MNa, M
Ca, MCu, NMg, MMn, MTi, M
Anions
NO3, -
F", N
SO , NM
Fission Products
Zr, NCd, NNb, NMo, NSe, NSr, _Y, NRu, MRh, NPd, NAg, NSn, NSb, _Te, MBa, N
Fission ProductILa, MCe, NPr, HNd, NPm, MSm, NEu, MGd, N
0.150.01350.0080.0460.150.001351.75E-31.6E-34.5E-32.0E-5
0.00.00.00.00.00.00.00.00.00.0
1.912 2.5
0.008 0.0
0.010.00.00.00.00.00.00.00.00.0
0.5
0.0
0.00.00.00.00.00.00.00.00.00.0
0.0
0.0
0.1140.0100.0060.0340.1120.0011. 31E-31.2E-33.4E-31.5E-5
1.602 0.37
0.006 0.0
0.012 0.0 0.0 0.0 0.009 0.0
5.6E-35.0E-51.4E-51.8E-49.5E-51.4E-37.3E-42.1E-35.7E-45.4E-43.6E-52.4E-51.2E-53.3E-41.1E-3
Rare Earths1.0E-32.4E-39.2E-42.7E-32.9E-43.9E-44.8E-51.2E-5
Actinides Including TRU
U, MNp, MPu, MAm, N
1.3E-42.1E-41.7E-61.7E-4
0.00.00.00.00.00.00.00.00.00.00.00.00.00.00.0
0.00.00.00.00.00.00.00.0
0.00.00.00.0
0.00.00.00.00.00.00.00.00.00.00.00.00.00.00.0
0.00.00.00.00.00.00.00.0
0.00.00.00.0
0.00.00.00.00.00.00.00.00.00.00.00.00.00.00.0
0.00.00.00.00.00.00.00.0
0.00.00.00.0
4.2E-33.8E-51.05E-51.34E-47.1E-51.05E-36.6E-61.38E-34.3E-43.8E-42.7E-51.8E-59.0E-62.5E-48.2E-4
4.9E-7<l.2E-6<4.5E-7<1.3E-6<1.4E-7<1.9E-7<2.3E-8<5.9E-9
<1.9E-9<3.1E-9<2.5E-112.5E-9
aConcentration is reported as hydrogen ion in DW and DP.
bConcentration is reported as oxalate ion in DW and DP.
cIncludes nitrate from HNO 3 acid.
HNO3 , MH2C204 , M
4.0E-4<2.6E-6<1.5E-6<8.9E-6<2.9E-5<2.6E-7<3.3E-70.0
<8.7E-70.0
C
<6.2E-90.00.02.2E-60.0<2.7E-71.08E-33.9E-40.05.0E-50.00.00.00.0
<2.1E-7
1.5E-33.6E-31.4E-34.0E-34.4E-45.8E-47. E-51.8E-5
1.95E-43.15E-42.5E-62.5E-4

21
b. DHDECMP Extractant
Table IV-5 lists the distribution coefficient data used toderive the CMP-TRUEX flowsheet for use with CAW solution (Fig. IV-3).
(1) TRU Decontamination
The process flowsheet, Fig. IV-3 and Table IV-8, willremove enough of the soluble TRU elements from the CAW feed to make its TRU
concentration less than 100 nCi/g. The process requires 14 extraction stages
and six scrub stages. The large number of extraction stages is requiredbecause of the low extraction factor for the americium. The extraction factorcould be made higher by increasing the 0/A flow ratio; but, as shown in TableA-1 of Appendix A, a higher 0/A ratio drives Pd into the organic product andresults in a large buildup of Tc at the feed stage (several orders of magnitudeabove its feed composition). At this level, HTc0 4 could tie up most of the
extractant and ruin the process chemistry. With the specified 0/A ratio, Tcexits in the aqueous raffinate and reaches a concentration in the feed stage
which is only three times higher than its concentration in the aqueous feed.
To achieve a TRU concentration below 1000 nCi/g in the CAW
solution, 11 extraction stages and six scrub stages are sufficient.
(2) Stripping of TRU Elements
The discussion given in Section IV.A.2.b.(2) applies herealso.
c. 0,D[IB]CMPO Extractant
The distribution coefficients listed in Table IV-4 were used toderive the CMPO-TRUEX process flowsheet for use with CAW solution (Fig. IV-4).
(1) TRU Decontamination
The process flowsheet, Fig. IV-4 and Table IV-9, willremove enough of the soluble TRU elements from the CAW feed to make its TRUconcentration less than 100 nui/g. The process requires six extraction stagesand six scrub stages. The small number of extraction stages is the result of ahigh extraction factor for the americium. The extraction factor could be made
higher by increasing the 0/A flow ratio; but, as shown in Table A-1 in AppendixA, a higher 0/A ratio drives Pd into the organic product. Table A-1 also showsthat, at the higher 0/A ratio, the Tc in the CAW will exit mainly with theorganic stream in the extraction/scrub unit.
To achieve a TRU concentration less than 1000 nCi/g in theCAW solution, five extraction stages and six scrub stages are sufficient.

22
CAW
1.OM HNO3ActinidesF.P.R.E. (5)
F.P.( 6 )Flow = 1.0
18 g H2C204 perliter CAW
FEED (DF)
HNO3H2C204
1. CM0.2Mn 71u
SCRUB (DS)
HNO3H2C204
Flow =
3.OM
0.03Mx.333
AI (NU3 )3 U- 71M
La(N03)3 1x10⁻³ M
Am(N0 3)3 1.7x10- 4M
0 her1). RAFFINATE (DW)
HN03 1.05M_
H2C204 0.16MLa(N03 )3 6.6x10~ 8M
EXTRACTANT (DX) x Am(N03)3 <5x10⁻⁹M(7 )
Other(3)
DHDECMP( 4 ) 0.4MTBP 1.1MConoco 12-14~Flow = 0.667
Notes1. Other cations and anions from fuel, cladding, and fission products
in CAW as listed in Table IV-8.2. All other lanthanides, actinides, and yttrium as listed in Table IV-8.3. All metal ions not in organic effluent including almost all the
non-rare earth fission products (see Table IV-8). Low americiumconcentration is based on having 14 extraction stages.
4. Added as the %86% material.5. Fission Product Rare Earths.6. Fission Products.7. Equivalent to <100 nCi/g solidified raffinate as metal oxides.
Fig. IV-3. CMP-TRUEX Process Flowsheet forExtraction of TRU Elements from CAW Solution
ORGANIC PRODUCT (DP)
DHDECMP 0.4MTBP 1.1MHNO3 <0.9M
H2C204 0.002MLa(N0 3) 3 1.5x1O-3M
Am(N0 3 )3 2.5x10 4
Conoco 12-14 ~Other( 2 )Flow = 0.667
=-j

23
Table IV-8. CMP-TRUEX Process F lowshee t for theRemoval of TRU Elements from CAW Solution
DF DS DX DW DP Notes
Phase
Rel. Vol. FlowAqueous Aqueous Organic Aqueous Organic1.0 0.333 0.667 1.333 0.667
Acids
HNO 3 , !MH 2 C2 04 , M
1.00.2
3.00.03
0.00.0
1.050.157
Non-Fission Product Cations
Fe,
Cr,Ni,
Al,Be,
Na,Ca,Cu,Mg,Mn,Si,Ti,
MM
M
M
M_MMM_M
M
M
M
0.130.0130.00690.710.00130.180.0011.4E-31.3E-31.4E-39.2E--32.0E-5
Anions
3.00
0.15
0.27
3.0
0.0
0.0
0.0013 0.0
Fission Products
5.6E-35.0E-59.4E-51.8E-49.5E-55.2E-41.4E-37.3E-42.1E-35.7E-45.4E-43.6E-5
0.00.00.00.00.00.00.00.00.00.00.00.0
0.0
0.0
0.0
0.0
0.00.00.00.00.00.00.00.00.00.00.00.0
2.55
0.11
0.20
0.962
0.0
0.0
0.0010 0.0
4.2E-33.8E-57.0E-51.35E-47.1E-53.9E-41.05E-31.7E-61.6E-34.3E-43.7E-42.7E-5
0.00.00.00.00.00.00.01.10E-31.07E-50.06.5E -50.0
(Contd,
0.9 a0.0018 b
0.00.00.00.00.00.00.00.00.00.00.00.0
0.00.00.00.00.00.00.00.00.00.00.00.0
0.100.0100.0050.530.0010.1350.00081.05E-39.8E-41.05E-36.9E-31.5E-5
0.00.00.00.00.00.00.00.00.00.00.00.0
NO3, M
F-, M
2 '-SO4
P04 , _
c
Zr, M
Cd, MNb, MMo, MSe, MRb, MSr, MY, MRu, MRh, MPd, MAg, M

Table IV-8.
DW
1.8E-59.0E-62.5E-41. 72E-38.2E-47.4E-4
DP Notes
0.00.00.00.00.07.5E-7
Fission Product Rare Earths
6.6E-85. 1E-82.0E-85.7E-81.9E-88.9E-86.8E-87.8E-7
1.5E-33.6E-31.38E-34.0E-34.4E-45.8E-47.2E-51.64E-5
Actinides Including TRU
<4.2E-9<6.7E-9<5.3E-115.3E-9
2.0E-43.2E-42.5E-62.5E-4
aConcentration is reported as hydrogen ion in DW and DP.
bConcentration is
concludes nitrate
report d as oxalate ion in DW and DP.
from 03.
(2) Stripping of TRU Elements
The discussion given in Section IV.A.2.c.(2) applies here
also.
B. Experimental Verification of Reference Flowsheets
Two countercurrent experiments were designed and carried out to verify
the reference flowsheet for TRU decontamination of DSW by the CMPO-TRUEXprocess. The first countercurrent experiment was run in the absence of TRU
elements and Tc in a ten-stage apparatus that allowed establishment of the
behavior of fission and corrosion product species and chemical reagent species
(e.g., Fe and Al) present in DSW. After this experiment had been continuedlong enough to assure that most species in the apparatus had reached a nearsteady-state condition, samples of both phases were removed from each stage,and the remaining volumes were left in the apparatus for initiating the
24
DF
M
M
M
M1_
M
M
(Contd)
Sn,Sb,Te,Cs,Ba,Tc,
2.4E-51.2E-53.3E-42.3E-31.1E-39.8E-4
DS
0.00.00.00.00.00.0
DX
0.00.00.00.00.00.0
M
i_M
M
M
M
M1_
La,Ce,
Pr,Nd,
Pm,Sm,Eu,Gd,
1.0E-32.4E-39.2E-42.7E-32.9E-43.9E-44.8E-51.2E-5
0.00.00.00.00.00.00.00.0
0.00.00.00.00.00.00.00.0
U, MNp, MPu, MAm, M
1.3E-42. 1E-41.7E-61.7E-4
0.00.00.00.0
0.00.00.00.0

25
CAW
1.OM HNO3ActinideF.P.R.E.t4)F.P. (5)Flow = 1.0
16 g H2C204
per liter CAW
FEED (DF)
HNO3 1.0M
H2C204 O.18M
Fe(N03 )3 0.13MAl(N03 )3 0.71M
La(N03 )3 1.Ox10-3MAm(N03 )3 1.7x101 -
Other(')Flow = 1.0
EXTRACTANT (DX)
0OD[IB]CMPO 0.2M
TBP 1.4MConoco 12-14Flow = 0.667
NOTES
HNO3 2.5M HNO3 0.5MH2C204 O.06M Fe(N03)3 0.01M
Flow = 0.1667 Flow = 0.1667
ID
F-U&
4,
1. Other cations and anions from fuel, cladding, and fission products inCAW as listed in Table IV-9.
2. All other lanthanides, actinides, technetium, and yttrium, as listedin Table IV-9.
3. All metal ions not in organic effluent including almost all the non-rare earth fission products (see Table IV-9). Low americium concen-tration is based on having six extraction stages.
4. Fision Product Rare Earths.5. Fission Products.6. Equivalent to <100 nCi/g solidified raffinate as metal oxides;
Fig. IV-4. CMPO-TRUEX Process Flowsheet for Extractionof TRU Elements from CAW Solution
FIRST SCRUB (DT) SECOND SCRUB (DS)
ORGANIC PRODUCT (DP)
ODD[ IB ]CMPO 0.2M
TBP 1. 4M
HNO3 0.28MH2C204 2x10⁵MFe(N03)3 4x10⁴MLa(N03 )3 1.5x10⁻³MAm(NO3 )3 2.5x1O-4Conoco 12-14
Other(2 )
Flow = 0.667
RAFFINATE (DW)
HNO3 0.98MH2C204 0.14MFe(N03)3 0.10M
La(N03)3 6x1IY7 MAm <5x10⁻⁹M(6)Other(3 )Flow = 1.333
10
1

26
Table IV-9. CMPO-TRUEX Process Flowsheet for Removalof TRU Elements from CAW Solution
DF DT DS DX DW DP Notes
PhaseRel. Vol. Flow
Aqueous Aqueous Aqueous Organic Aqueous Organic
1.0 0.1667 0.1667 0.667 1.333 0.667
Acids
HNO3 , MH2 C2 04 , M
1.00.18
2.50.06
0.50.0
0.00.0
0.9850.143
Non-Fission Product Cations
Fe,
Cr,
Ni,
Al,Be,
Na,Ca,Cu,Mg,Mn,Si,Ti,
M
Mi
Mi
MiMf
Mi
Mi
Mi
Mi
Mi
Mi
0.130.0130.00690.710.00130.180.0011.4E-31.3E-31.4E-39.2E-32.0E-5
Anions
3.00
0.15
0.27
2.5
0.0
0.0
0.0013 0.0
Fission Products
5.6E-35.0E-59.4E-51.8E-49.5E-55.2E-41.4E-37.3E-42.1E-35.7E-45.4E-43.6E-52.4E-5
0.00.00.00.00.00.00.00.00.00.00.00.00.0
0.5
0.0
0.0
0.0
0.00.00.00.00.00.00.00.00.00.00.00.00.0
0.0
0.0
0.0
0.0
0.00.00.00.00.00.00.00.00.00.00.00.00.0
2.44
0.11
0.20
0.37
0.0
0.0
0.0010 0.0
4.2E-33.8E-57.OE-51.34E-47.1E-53.9E-41.05E-35.3E-61.34E-34.3E-43.7E-42.7E-51.8E-5
<6.2E-90.00.02.6E-60.00.0
<2.7E-71.08E-34.6E-40.06.4E-50.00.0
(Contd)
0.28 a2.1E-5 b
0.00.00.00.00.00.00.00.00.00.00.00.0
0.010.00.00.00.00.00.00.00.00.00.00.0
0.00.00.00.00.00.00.00.00.00.00.00.0
0.0990.0100.0050.530.00100.1350.00081.05E-31.0E-31.05E-36.9E-31.5E-5
4.0E-4<2.5E-6<1.3E-6<1.4E-40.0
<3.5E-5<1.9E-7<2.7E-70.0
<2.7E-70.00.0
NO, M
F-, M
SO , M4
P0 , M4'
c
Zr, MCd, MNb, MMo, MSe, MRb, MSr, MY, M
Ru, MRh, MPd, MAg, MSn, H

27
Table IV-9. (Contd)
DF DT DS DX DW DP Notes
Sb, M 1.2E-5 0.0 0.0 0.0 9.0E-6 0.0Te, M 3.3E-4 0.0 0.0 0.0 2.5E-4 0.0Cs, M 2.3E-3 0.0 0.0 0.0 1.7E-3 0.0Ba, M 1.1E-3 0.0 0.0 0.0 8.2E-4 <2.1E-7Tc, M 9.8E-4 0.0 0.0 0.0 2.3E-5 1.42E-3
Fission Product Rare Earths
La, M 1.0E-3 0.0 0.0 0.0 5.6E-7 1.5E-3Ce, M 2.4E-3 0.0 0.0 0.0 <1.3E-6 3.6E-3Pr, M 9.2E-4 0.0 0.0 0.0 <5.1E-7 1.4E-3Nd, M 2.7E-3 0.0 0.0 0.0 <1.5E-6 4.0E-3Pm, M 2.9E-4 0.0 0.0 0.0 <1.6E-7 4.4E-4Sm, M 3.9E-4 0.0 0.0 0.0 <2.2E-7 5.8E-4Eu, M 4.8E-5 0.0 0.0 0.0 <2.7E-8 7.2E-5Gd, M 1.2E-5 0.0 0.0 0.0 <6.7E-9 1.8E-5
Actinides Including TRU
U, M 1.3E-4 0.0 0.0 0.0 <4.2E-9 1.95E-4Np, 1 2.1E-4 0.0 0.0 0.0 <6.7E-9 3.15E-4Pu, M 1.7E-6 0.0 0.0 0.0 <5.3E-11 2.5E-6Am, M 1.7E-4 0.0 0.0 0.0 5.3E-9 2.5E-4
aConcentration is reported as hydrogen ion in DW and DP.
bConcentration is reported as oxalate ion in DW and DP.
concludes nitrate from HNO 3 .
second experiment. Subsequently, the inactive feed solution was replaced byone of the same composition except for the addition of Am, Pu, Np, and Tc.The volume of the feed additions, however, was decreased to that commensuratewith the lower phase volumes in each stage. The experiment was continued
until the calculated requisite number of raffinate samples were collected; athis point, the TRU concentrations in the raffinate samples were within >90%-of their steady-state concentrations. Experimental details of these experimentsare given in Appendix B.
F
1. Extraction and Scrub Behavior of DSW Components
a. TRU Elements and Uranium
Figures IV-5 to IV-7 show the aqueous and organic phase con-centrations of Am, Np, and Pu in each stage of the countercurrent experiment attheir near-steady-state condition. Figure IV-5 also shows americium data forthe final batch extraction stage (stage 0). Data for batch scrubbing stages11-13 are shown for Am and Np in Figs. IV-5 and IV-6. The plutonium concentra-tion was below its detectAbility in the aqueous phases in stages 1-3.

28
10'
1d
id
10'
10'
Fig. IV-5. The Americium Concentration in theOrganic and Aqueous Phases of ERch Stageof the Countercurrent Experiment atNear-Steady-State. (Darkened symbols,not connected by line, were batch con-tacts.)
II I I I |
9 x 10⁴D.F.(Np) = 4 = 6
1.5 x 10
1 T
0
LI
"
Extraction Stages .
I I I I I I
I I I I
Organic PhaseAqueous Phase
Scrub Stages
I I I I I |
O 1 2 3 4 5 6 7 d 9 10 11 12 13 14Stage Number
Fig. IV-b. The Neptunium Concentration in theOrganic and Aqueous Phases of Each Stageof the Countercurrent Experiment atNear-Steady-State. (Darkened symbols,not connected by lines, were batch con-tacts.)
Feed
3.2 x 10 4D.F.(Amn) 7x1-=4.6 x10 -
0 Organic Phase-0 Aqueous Phase
"S
Extraction Stages U. Scrub Stages
0 1 2 3 4 5 6 7 8 9 10 11 12 13 14
Stage Number
E
E
%o
C.0
C'0C0V
E
10
10a
10,
-JE
CE
0
C0
C00
zid'
-~~~
Feed-------------------------
-
29
S10 - Feed16 - --
0 10's
* 10
0 10' o Organic Phase
V 310 oo Aqueous Phase
E -
E 101O
10 ExtractionAStagesq ScrubS stagesC 101
0 1 2 3 4 5 6 7 8 9 10 11 12 13 14
Stage Number
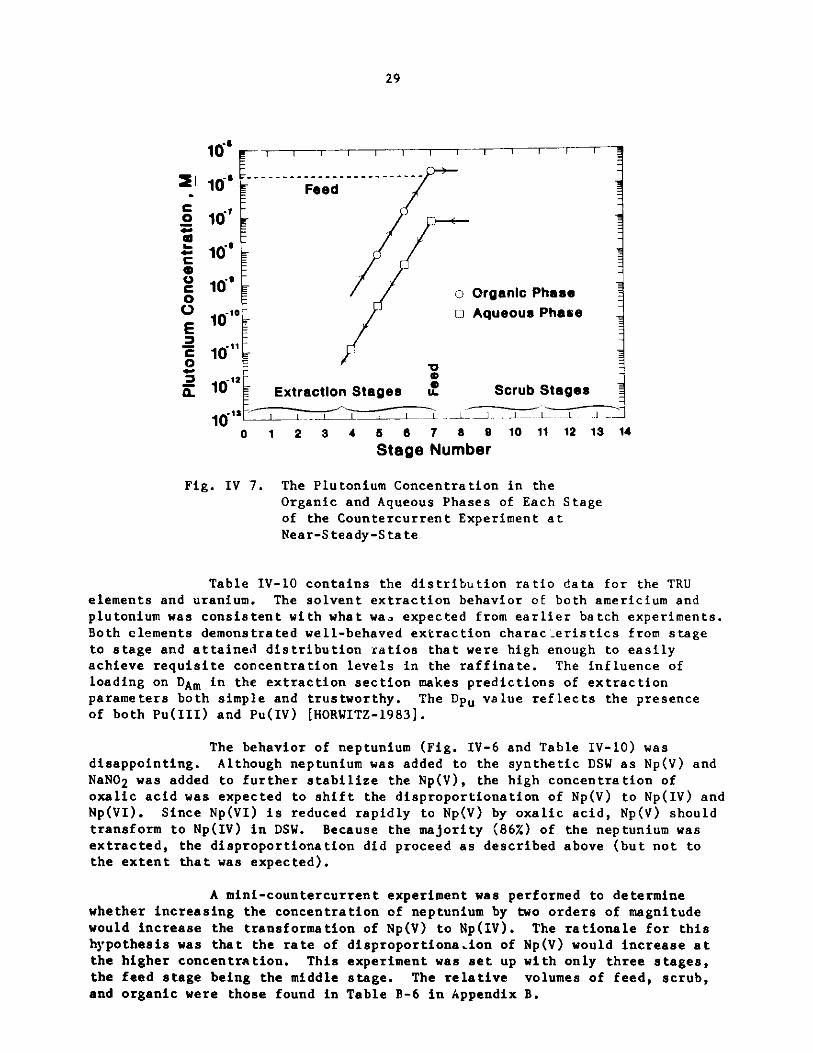
Fig. IV 7. The Plutonium Concentration in theOrganic and Aqueous Phases of Each Stageof the Countercurrent Experiment atNear-Steady-State
Table IV-10 contains the distribution ratio data for the TRUelements and uranium. The solvent extraction behavior of both americium and
plutonium was consistent with what wa3 expected from earlier batch experiments.Both elements demonstrated well-behaved extraction characteristics from stageto stage and attained distribution ratios that were high enough to easilyachieve requisite concentration levels in the raffinate. The influence of
loading on DAm in the extraction section makes predictions of extractionparameters both simple and trustworthy. The Dpu value reflects the presenceof both Pu(III) and Pu(IV) [HORWITZ-1983].
The behavior of neptunium (Fig. IV-6 and Table IV-10) wasdisappointing. Although neptunium was added to the synthetic DSW as Np(V) andNaNO2 was added to further stabilize the Np(V), the high concentration of
oxalic acid was expected to shift the disproportionation of Np(V) to Np(IV) andNp(VI). Since Np(VI) is reduced rapidly to Np(V) by oxalic acid, Np(V) shouldtransform to Np(IV) in DSW. Because the majority (86%) of the neptunium wasextracted, the disproportionation did proceed as described above (but not tothe extent that was expected).
A mini-countercurrent experiment was performed to determinewhether increasing the concentration of neptunium by two orders of magnitudewould increase the transformation of Np(V) to Np(IV). The rationale for thishypothesis was that the rate of disproportionaion of Np(V) would increase atthe higher concentration. This experiment was set up with only three stages,the feed stage being the middle stage. The relative volumes of feed, scrub,and organic were those found in Table B-6 in Appendix B.

30
Table IV-10. Distribution Ratios of Actinide Elementsin Each Stage of the CountercurrentExperiment
Distribution Ratio
Stage U Np Pub Am
0 NAC NA NA 7.6
1 NA 0.36 NA 7.52 NA 0.68 NA 7.43 NA 0.96 NA 7.34 NA 1.2 NA 7.25 NA 1.7 34 7.16 <102 1.9 39 6.57 2.6 x 10² 3.3 32 5.28 5.1 x 10² 4.2 NA 9.49 6.1 x 10 2 2.3 NA 9.7
10 6.5 x 10² 4.1 NA 9.111 6.5 x 10² 3.1 NA 10.012 NA 2.3 NA 6.713 NA 2.3 NA 3.0
aStage 7 is the feed stage; stages 0-7 are extractionstages; stages 8 and 9 are scrub one stages; andstages 10-13 are scrub two stages.
bOrganic phase concentrations were not measured; dis-tribution ratios were estimated by material balance.
cNA means not analyzed.
Compiled in Table IV-ll are the raffinate neptunium concentra-
tion data for this experiment. Because the concentration of Np does notappear to vary with each feed addition step (i.e., raffinate sample number),
these data indicate that near to steady-state conditions were reached. Thedistribution ratios in Table IV-12 show some improvement in DNp for thescrub and feed stages, but DNp was lower in the extraction stage.
Table IV-ll.
RaffinateaSample No.
Raffinate Concentrationsof Np for the Mini-Coun-tercurrent Experiment
[Np]Raf/[Np]Feedb
1 0.272 0.183 0.214 0.22
aAfter all stages of the apparatus areoperational, a raffinate sample exitsthe countercurrent extraction systemeach time a fresh feed solution isadded.
bThe ratio of [Np] in each raffinatesample to that of [Np] in the feed.

31
Figures IV-8 and IV-9 show the approach of americium and nep-tunium to steady state in the batch countercurrent experiment. The line ineach figure was calculated using the experimental distribution ratios presentedin Table IV-10 and the spread sheet calculation discussed in Appendix A. Thesecalculations assumed a 3% increase in the relative volume of the organic phaseto that of the aqueous phase.
Table IV-12. Distribution Ratioof Neptunium (DNp);n Each Stage ofthe Mini-Counter-current Experiment
Stage DNp
Scrub 10.2Feed 4.6Extraction 0.56
400Steady State
300 -
0oo
100 -
I I I I I I
1 2 3 4 5 6Raffinate Sample Number
7 8
Fig. IV-8. The Americium Concentration in a Raf-finate Sample vs. the Raffinate SampleNumber. The data points are raffinatesamples of the double-diamond countercur-rent experiment discussed in Appendix B(the two sets of raffinate samples aredifferentiated by the symbol type); theline is calculated based on the near-steady-state distribution ratios measuredfor each stage of the experiment.
J1Ec
EV
ac
e
0
0
C0VC00E -

32
- I I I I I
Steady StateE
-J
c
E
O
aC
e
C
0
e
COVC0VCLz
III I
2 3 4 5 6Raffinate Sample Number
Fig. IV-9. The Neptunium Concentration in a Raffi-nate Sample vs. the Raffinate SampleNumber. The data points are raffinatesamples of the double-diamond counter-current experiment (the two sets of raf-finate are differentiated by the symboltype); the line is calculated based onthe near-steady-state distribution ratiosmeasured for each stage.
The good fit between the curve derived from distribution-ratiomeasurements and the raffinate data indicates a consistency in the experimentthat makes an extrapolation to a steady-state condition valid. Thesteady-state decontamination factors for the TRU elements in this experimentare presented in Table IV-13.
Table IV-13. Steady-State Decontamination Factors of TRU Elements and Uraniumfrom Simulated DSW
Number of Extraction D.F. Calculated orStages to Measured Measured Measured after Seven
Element D.F. D.F. Extraction Stages
U 2 1.3x10⁴ 1.0x10¹⁶aNp 7 6 6Pu 4 1.0 x10⁵ 5.0 x10¹⁴
Am 8 4.6x10⁴ 1.0x10⁴
aBecause stripping of solvent is never perfect, some residual'concentrationof these species will be in the recycled solvent; therefore, these valueswould not be achieved in actual practice.
1s
16
14
12 -
10 -Q100
S
6 -
20
0I 7 d

33
b. Other DSW Components
Tables IV-14 and IV-15 contain the distribution ratios for the
nonactinide species that were measured in each stage of the countercurrentexperiment. Distribution ratios were close to what was predicted from batchdistribution ratio measurements (shown in Fig. V-3). Data for ruthenium and
palladium indicate the presence of at least two species with different distri-bution ratios.
Distribution ratios for technetium were measured by spiking the
near steady-state solutions from the cold run with 9 9 Tc04- and, afterequilibration at 40 C, measuring radiometrically the concentration of 9 9 Tcin each phase. The raffinate concentration of Tc was measured for eachraffinate sample of the hot run, and a fit of these data to a calculatedline based on the measured DTc values was attempted (Fig. IV-10). The
calculated line, shown as the solid line far below the data points, is a poorfit to the data. The procedure of chemical separation and radiometric analysiswas shown to be quantitative with its determination of the [99Tc] in thefeed, which was accurately known from a careful assay of its stock solution;therefore, the raffinate data are not in question.
The dashed line through the data points in Fig. IV-10 is an
empirical attempt to fit the data. The assumptions made in arriving at this
line were:
The distribution ratio was constant through the extraction
s ction (stages 1-7).
The distribution ratio in the first scrub section (stages 8
and 9) was the product of (1) the distribution ratio in the extraction section
and (2) the ratio of the distribution ratio of Tc04- at 1.5 and l.1M HNO3 fromFig. V-2; [DTc(Extraction) x 0.60].
The distribution ratio in the second scrub section (stage 10)was the product of (1) the distribution ratio in the extraction section and (2)
the ratio of the distribution ratio of Tc04- at 0.5 and l.lM HNO3 fromFig. V-2; [DTc(Extraction) x 1.91.
The best-fit distribution ratio was 2.2 for the extractionsection, not that far from the %2.5 value measured for most of the extractionsection. This calculation predicts a steady-state raffinate Tc04-concentration of 7.9% of that in the undiluted feed, for a decontaminationfactor of 9.5. Based on the steady-state value derived from this fit, 89% ofthe technetium from the feed will be in the TRU product.
c. Disengagement Behavior
The phase separations for the countercurrent experimentswere all very good. Within one minute the large volumes of phases (Table B-6,Appendix B) broke up to form two c tal clear solutions; there was no visiblesign of cloudiness due to entrainment of one phase in the other, or any changeof these properties with throughput. No interfacial crud was observed in anyof the stages throughout the two experiments.
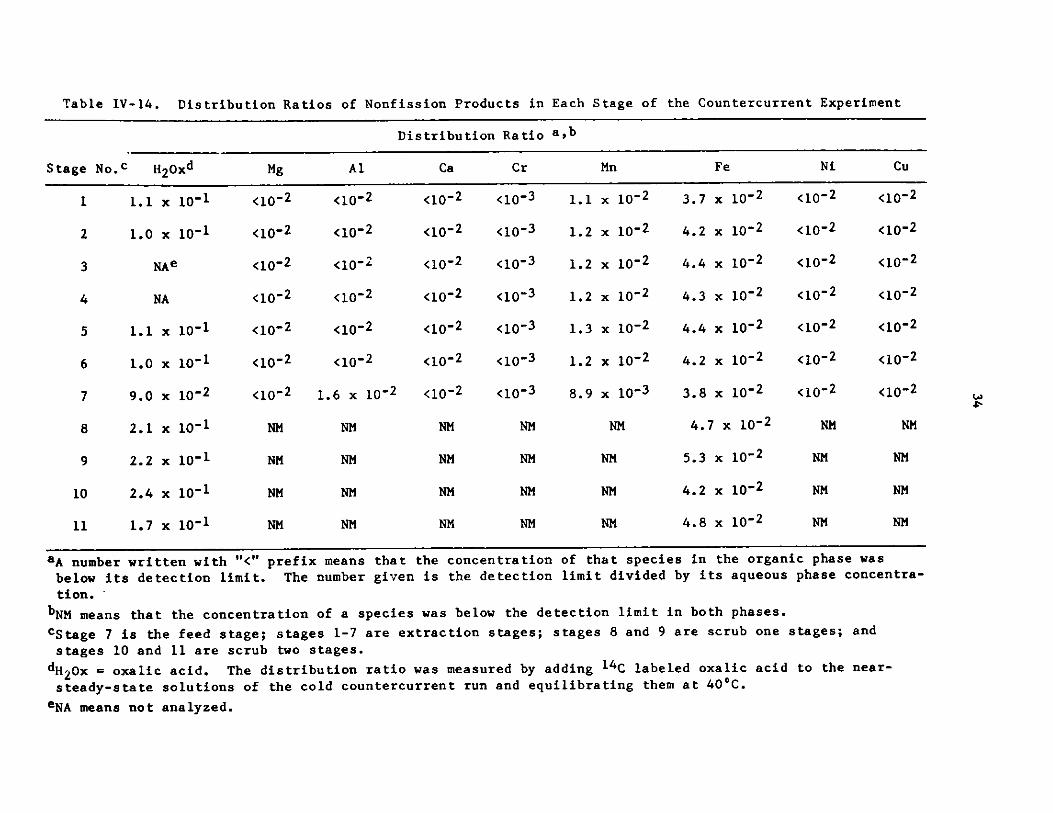
Table IV-14. Distribution Ratios of Nonfission Products in Each Stage of the Countercurrent Experiment
Stage
1
2
3
4
5
6
7
8
9
10
11
aA nul
No. H2Oxd
1.1 x 10⁻¹
1.0 x 10⁻¹
NAe
NA
1.1 x 10⁻¹
1.0 x 10⁻¹
9.0 x 10⁻²
2.1 x 10⁻¹
2.2 x 10'1
2.4 x 10⁻¹
1.7 x 10⁻¹
nber written with
Mg
<10-2
<10-2
<10-2
<10-2
<10-2
<10-2
<10-2
NM
NM
NM
NM
"<" prefix
below its detection limit. The number given is the detection
Al
<10-2
<10-2
<10-2.
<10-2
<10-2
<10-2
1.6 x 10⁻²
NM
NM
NM
NM
means tha
Distribution Ratio 8
Ca Cr
<10-2 <10-3
<10-2 <10- 3
<10-2 <10-3
<10-2 <10-3
<10-2 <10-3
<10-2 <10- 3
<10-2 <10- 3
NM NM
NM NM
NM NM
NM NM
t the concentration
Mn
x 10- 2
x 10-2
x 10-2x 10-2
x 10'2
x 10-2
x 10-2
x 10-3
NM
NM
NM
NM
I Fe
x
x
x
x
x
x
x
x
x
x
x
Ni
<10-2
<10-2
<10-2
<10-2
<10-2
<10-2
<10-2
NM
NM
NM
NM
of that species in the organic phase was
limit divided by its aqueous phase concentra-
tion.
bNM means that the concentration of a species was below the detection limit in both phases.
cStage 7 is the feed stage; stages 1-7 are extraction stages; stages 8 and 9 are scrub one stages; and
stages 10 and 11 are scrub two stages.
dH20x = oxalic acid. The distribution ratio was measured by adding 1 4C labeled oxalic acid to the near-
steady-state solutions of the cold countercurrent run and equilibrating them at 40 C.
eNA means not analyzed.
alb
1.1
1.2
1.2
1.2
1.3
1.2
8.9
_
3.7
4.2
4.4 ,
4.3
4.4
4.2
3.8
4.7
5.3
4.2 3
4.8
Cu
<10-2
<10-2
<10-2
<10-2
<10-2
<10-2
<10-2
NM
NM
NM
NM
10-2
10-2
10-2
10-2
10-2
10-2
10-2
10-2
10-2
10-2
10-2

Table IV-15. Distribution Ratios of Fission Products in Each Stage of the Countercurrent Experiment
Distribution Ratioa,b
Stage No. Sr Y Zr Mo Tcc Ru Rh Pd Ag
1 <10-2 1.4 3.3 x 10⁻³ <10-1 2.7 3.4 x 10⁻² <10-1 <10-1 <10-1
2 <10-2 1.4 7.1 x 10⁻³ <10-1 2.2 3.4 x 10⁻² <10-1 <10-1 <10-1
3 <10-2 1.4 1.2 x 10⁻² <10-1 NAd 3.4 x 10⁻² <10- 1 <10-1 <10- 1
4 <10-2 1.4 1.2 x 10⁻² <10-1 NA 3.3 x 10⁻² <10-1 <10-1 <10-
5 <10- 2 1.4 1.7 x 10⁻² <10-1 2.6 6.8 x 10⁻² <10-1 <10- 1 <10-
6 <10-2 1.3 1.6 x 10⁻² 1.0 x 10⁻¹ 2.9 1.1 x 10⁻¹ <10-1 1.7 x 10⁻¹ <10-1
7 <10-2 1.1 1.1 x 10⁻² 1.1 x 10⁻¹ 3.6 3.5 x 10⁻¹ 1.1 x 10- 1 2.6 x 10⁻¹ <10-1
8 NM 1.2 1.6 x 10⁻¹ NM 2.3 1.2 NM 5.4 x 10⁻¹ NM
9 NM 1.3 NM NM 2.0 2.3 NM 1.0 NM
10 NM 1.2 NM NM 7.0e 3.0 NM 1.0 NM
11 NM 1.0 NM NM NA 3.0 NM 1.0 NM
(Contd)

Table IV-15. (Contd)
Distribution Ratioa,b
Stage No. Cd Te Ba La Ce Pr Nd Sm Eu
1 <10-2 <10-2 <10-2 NM NM NM NM NM NM
2 <10-2 <10-2 <10-2 NM NM NM NM NM NM
3 <10-2 <10-2 <10-2 3.2 NM NM NM NM NM
4 <10-2 <10-2 <10-2 3.4 NM NM NM NM NM
5 <10-2 <10-2 <10-2 3.7 4.6 NM NM 5.3 4.0
6 <10-2 <10-2 <10-2 3.5 5.1 6.4f 4.4f 5.8 4.2
7 <10-2 <10-2 <10-2 2.9 4.5 5. 2 f 4.7f 5.1 4.2
8 NM NM NM 3.7 6.3 7.0 7.0 7.0 5.6
9 NM NM NM 4.2 7.3 8.1 8.3 8.2 7.0
10 NM NM NM 4.2 8.7 9.6 9.5 9.5 7.7
11 NM NM NM 4.8 7.7 8.1 7.8 7.8 6.2
aA number written with "<" prefix means that the concentration of that species in the organic phase was
belowits detection limit. The number given is the detection limit divided by its aqueous phase concen-
tration.bNM means that the concentration of a species was below the detection limit in both phases.
CTc distribution ratio analysis was performed by taking the near-steady-state solutions from the cold
countercurrent run, spiking them with 9 9 Tc and equilibrating them at 40 C.
dNA means not analyzed.
eA second contact of the organic with unspiked, fresh aqueous phase gave a Tc distribution ratio of 11.7.
(There was an interference in the atomic emission lines for these elements that puts these values in doubt.
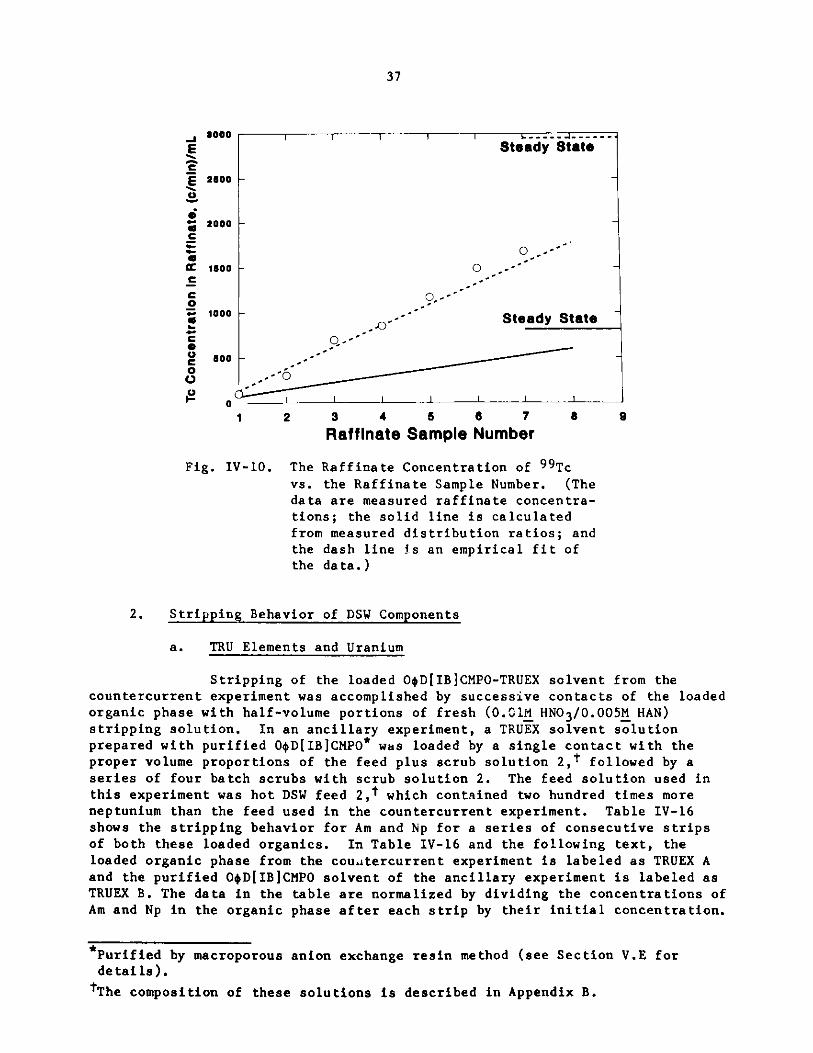
37
$000 __ _ _ ___
E Steady State
E 2500V
2000C
01500 0 ,-
CC--
O.--1000'
1.0 - -- ' Steady S tate
C50
U -'
1 2 3 4 5 6 7 8 9
Raffinate Sample Number
Fig. IV-10. The Raffinate Concentration of 9 9 Tcvs. the Raffinate Sample Number. (Thedata are measured raffinate concentra-
tions; the solid line is calculatedfrom measured distribution ratios; andthe dash line is an empirical fit ofthe data.)
2. Stripping Behavior of DSW Components
a. TRU Elements and Uranium
Stripping of the loaded O D[IB]CMPO-TRUEX solvent from thecountercurrent experiment was accomplished by successive contacts of the loadedorganic phase with half-volume portions of fresh (0.01M HNO3/0.005M HAN)stripping solution. In an ancillary experiment, a TRUEX solvent solutionprepared with purified O.D[IB]CMPO* was loaded by a single contact with theproper volume proportions of the feed plus scrub solution 2,t followed by aseries of four batch scrubs with scrub solution 2. The feed solution used inthis experiment was hot DSW feed 2 ,t which contained two hundred times moreneptunium than the feed used in the countercurrent experiment. Table IV-16shows the stripping behavior for Am and Np for a series of consecutive stripsof both these loaded organics. In Table IV-16 and the following text, theloaded organic phase from the couaitercurrent experiment is labeled as TRUEX Aand the purified O.D[IB]CMPO solvent of the ancillary experiment is labeled asTRUEX B. The data in the table are normalized by dividing the concentrations ofAm and Np in the organic phase after each strip by their initial concentration.
*Purified by macroporous anion exchange resin method (see Section V.E fordetails).
tThe composition of these solutions is described in Appendix B.

38
Table IV-16. Americium and Neptunium Stripping Behavior
[Am]/[Am]initial [Np]/[Np]initialContact Solvent Solvent
Number Aa Bb Aa Bb
1 0.69 0.77 0.95 0.95
2 0.37 0.34 0.91 0.88
3 0.048 0.045 0.64 0.65
4 7.1 x 10⁻³ 4.2 x 10⁻³ NAc 0.48
5 1.4 x 10⁻³ 9.7 x 10⁻⁴ NA 0.38
6 5.5 x 10 4 5.3 x 10⁻⁴ NA 0.29
7 1.8 x 10⁻⁴ d NA -
8 7.1 x 10⁻⁵ - 0.44 -
9 3.1 x 10- 5 - NA -
10 <2 x10⁻⁶ - NA -
aLoaded organic solvent from the countercurrent experiment.
bLoaded organic phase of purified 0 D[IB]CMPO TRUEX solventloaded with a single contact of hot DSW feed solution 2(Appendix B, Table A-3) followed by multiple scrubs.
cNA means not analyzed.
dStripping of TRUEX B by dilute HNO3 -HAN strip solutionwas terminated after six contacts.
The stripping characteristics of Am for both loaded organicphases seem adequate, although the presence of acid extractants is probablyresponsible for the large number of contacts required to reduce the Am countrate to background. Neptunium stripping, although slightly better in thepurified CMPO solvent, is not adequate for either solvent.
There were, however, striking differences between the two TRUEXsolvents with respect to their plutonium stripping behavior and their disengage-ment times and crud forming properties. Only 5% of the plutonium was strippedfrom the TRUEX A organic phase after seven contacts; however, >99% Pu was
stripped from TRUEX B organic phase after six contacts. This differencecould be due to (1) the much lower level of acidic impurity in the purifiedsolvent or (2) the higher concentration of neptunium in the organic phase tyingup acidic extractants or (3), most probably, a combination of both (1) and (2).
As a backup stripping and possible solvent cleanup procedure, a
portion of TRUEX A, which had received eight contacts with the diluent nitric

39
acid/HAN strip solution, was contacted with e 0.1M H2 C2 04 solution (strip solu-tion 2). After two contacts using an 0/A phase ratio of 4:1, the neptuniumconcentration in the organic phase dropped by two orders of magnitude. Pluto-nium, by analogy, should show a similar behavior. The oxalic acid strip also
effectively removed the remaining uranium from the TRUEX solvent (the contactswith the 0.O1M HNO3 /0.005M HAN strip solution removed <10% of the uranium in
the TRUEX A solution).
A qualitative description of the stripping behavior of the TRU
elements is presented in Table IV-17.
Table IV-17. A Qualitative Summary of the StrippingBehavior of TRU Elements from Loaded
CMPO-TRUEX Solvent
Element Strip Solution la Strip Solution 2 b
Pu Not adequate Adequate
Np Not adequate Adequate
Am Adequate --
a0.O1M HNO3/0.005M HAN
bO.lM H2C204
b. Other !;SW Components
Before stripping, the combined loaded organic phase of the cold
countercurrent experiment received two additional scrubs with 0.5M HNO3 -O.O1M Fe3+ to ensure complete removal of extracted oxalic acid and to minimize
the concentration of nitric acid in the organic phase. Stripping of the resul-tant organic phase was performed in a separatory funnel by successive contactswith strip solution 1 using an 0/A phase ratio of two. Six successive stripswere performed. The color of the organic phase changed from yellow to tan as
stripping proceeded, but all strips were colorless. Samples of the successiveaqueous phase contacts were tested for the presence of rare earths by additionof oxalic acid. The first contact contained a small quantity of pr.ecipitate,indicating that excess HNO3 was effectively removed by scrub 2. The thirdand fourth contacts contained the bulk of the rare earths, as indicated by thevolume of oxalate precipitates, whereas the sixth contact gave no precipitate.The combined rare earth oxalate precipitate had a light blue-gray color,probably from the presence of neodymium ions.
Analysis of a sample of the combined strips were performed withICP/AES. The results are shown in Tables IV-18 and IV-19. As can be seenfrom the data, the metal ion composition of the strip solution is 94.2% lanthan-ides and yttrium, with small quantities of Fe, Ru, Rh, and Pd. Because of thelow distribution ratios of yttrium and to some extent lanthanium, 72% of the

40
Table IV-18. Composition of the CombinedDilute Nitric Acid Strips ofLoaded Organic from ColdCountercurrent Run
Wt. % MetalIon Composition
Element of the Strip Solution
Rare Earth + Y 94.2Fe 2.6Ru 2.1Rh 0.4Pd 0.7All Other
Constituents NDa
aND means not detectable.
Table IV-19. Composition of Rare Earthsthe Combined Strip
and Yttrium in the Feed and
Element Wt. % Composition in Feed Wt. % Composition in Strip
La 12.1 10.9Ce 29.1 31.3Pr 11.3 12.5Nd 35.5 36.7Sm 5.4 6.0Eu 0.8 0.8Y 5.8 1.8
yttrium and 18% of the lanthanium reported to the raffinate under conditions inwhich only 0.01% of the Am(III) was detected in the raffinate.
A separate stripping experiment was performed on Tc because ofthe complexity of the analysis. Technetium was spiked into a cold feed solu-tion and extracted and scrubbed at 40*C using the appropriate phase ratio.Multiple strippings showed that 94% of the Tc was stripped after ten contacts.The 0.1M H 2 C2 04 strip solution was somewhat more effective.
c. Disengagement Behavior
The cleanup of the CMPO-TRUEX solvent was determined to be amajor factor in shortening disengagement times for stripping and for preventingcrud formation. The disengagement times for the purified TRUEX B solution werein the range of 15 seconds; under the same conditions, it took at least aminute for the TRUEX A solutions to separate. In fact, after the fifth contactwith the dilute HNO3 strip solution, a small quantity of a lipophilic precipi-tate formed in the TRUEX A solvent. This solid, which increased phase disen-gagement time, was probably dioctylphosphine oxide.

41
Disengagement times between TRUEX A solvent and the0.1M H2 C2 04 strip solution were less than one minute and showed no problemswith crud formation.
3. Relevance of Results to TRU Decontamination
One can calculate the TRU contamination of the solidified raffinate
in grout by assuming: (1) the concentrations of TRU elements believed to beappropriate for DSW (presented in Table IV-20), (2) the composition of the
solidified raffinate based on the results of the countercurrent experiment(presented in Table IV-21), (3) the salt content of the grout as 20%,* and(4) the decontamination factors for the countercurrent experiment presented inTable IV-13. The results of the calculations are summarized in Table IV-22.lo calculate the unit activity level in terms of nanocuries per gram ofraffinate, one must divide the activity level of each radionuclide in the feed
(in units of nanocuries per liter of feed) by its decontamination factor andagain by the amount of solid raffinate (230 g) derived from each liter of feed.To calculate the TRU contamination in the grout, one must multiply the activitylevel in the solidified raffinate by its dilution factor in the grout (assumedto be 0.2 for this calculation).
Table IV-20. Concentration of TRU Elements andHanford CAW and DSW
Uranium in
Concentration
Element g/L M dpm/L Ci/L
U 0.03 1 x 10"4 a a
237Np 0.05 2 x 10⁻⁴ 8 x 10⁷ 4 x iY5
239Pu 4 x 10- 4 2 x 10- 6 5 x 10 7 2 x 10⁻⁵
241Am 0.04 2 x 10⁻⁴ 3 x 10¹¹ 1 x 10⁻¹
aNegligible.
The results of this calculation (Table IV-22) show
(10 stage) batch countercurrent experiment was sufficient to
levels in the product to well below 100 nCi/g solid.
that the laboratorydecrease the TRU
4. The TRU Product Composition
Based on the stripping data for the(Tables IV-18 and 19), the composition of thethe distribution ratios of the lanthanides in
cold countercurrent experimentfeed (Table B-2, Appendix B),each stage (Table IV-15), the
*Before the use of grout is considered, 9 0 Sr must be removedfrom the raffinate.

42
Table IV-21. Probable Species inRaffinate and Theirper Volume of Feed
SolidifiedMasses
Component
NaNO3aNa2SO4Fe(N0 3)3 -9H20FePO4 -4H20Mg(N03 )2-6H20Al(N03)2 -9H20A12F6 '7H20CaSO4Cr(N03)3 25H20Mn(N03)2 -6H20Ni(N03 )2 -6H20Cu(N03)2 -6H20Zr(N03)4.5H 20Ba(NO3) 2
Total
alncludes the NaNO 3 formedof HNO3 in 1.33 liters ofneutr iized with NaOH.
Mass of Component perLiter of Feed, g
138.521.51
60.750.720.26
16.260.390.185.041.292.330.522.400.29
230.46
when the 1.5 molesraffinate are
Table IV-22. Summary of Calculations for TRU Content of SolidifiedRaffina te
Activity inActivity Solidified Activityin Feed, Decontamination Raffinate,a in Grout,b
Radionuclide nCi/L Factor nCi/g nCi/g
Am 1x 10⁸ 1.0 x 1 0 4 c 40 8Pu 2 x 10⁴ >1 x 10 5 <2 x 10⁻³ .Np 4 x 10⁴ 6 30 6
Total 1x 10⁸ 70 14
aIf the stage 0 decontamination factor were used, the Am specificactivity would drop to 9 nCi/g and the total specific activity to
40 nCi/g.
bIf the stage 0 decontamination factor were used, the Am specificactivity would drop to 2 nCi/g and the total specific activity to8 nCi/g.
cThis is the measured decontamination factor for the raffinate fromstage 1 of the countercurrent experiment. This was followed by abatch contact of the raffinate with fresh TRUEX solvent (stage 0)that increased the D.F. to 4.6 x 10⁴.

43
concentration of TRU in the simulated DSW feed (Table IV-20), and the decontam-ination factors for the TRU elements (Table IV-13), one can describe thecomposition and activity level of the TRU product.
With distribution ratios of Pr, Nd, and Sm all above five in theextraction and scrub tections, one would assume that they report in greaterthan 99% abundance to .he TRU product. The fact that the relative ratios ofthese species in the feed and in the strip solutions are experimentallyidentical is confirmation of this assumption. The composition of any of thesethree elements in the feed could therefore be used to calculate the weightof all other components of the TRU product, using Tables IV-18 and IV-19.
The summary of this calculation using the concentration of Nd (in units of g/L)
in the feed and its weight percent in the strip solution is shown inTable IV-23.
Table IV-23. Calculation of the Non-TRU Composition ofSolidified TRU Product
Wt. Relative Wt. of Metal per Form Wt. of Oxide perElement to Wt. of Nd Liter of Feed,a g of Oxide Liter of Feed, g
La 0.34 0.13 La2 03 0.15Ce 0.82 0.32 Ce02 0.39Pr 0.32 0.12 Pr601 1 0.14Nd 1 0.39 Nd203 0.45Sm 0.15 0.06 Sm203 0.07Eu 0.02 0.01 Eu2 03 0.01Y 0.16 0.06 Y203 0.08Fe 0.05 0.02 Fe203 0.03Ru 0.06 0.02 Ru02 0.02Rh 0.02 0.01 Rh203 0.01Pd 0.02 0.01 PdO 0.01
Total -- -- -- 1.36b
aOne liter of feed contains 2.7 x 10⁻³ mol
b89% of the technetium in the feed will be
(0.39 g) of Nd.
in the TRU product.
Along with the 1.36 g of non-TRU oxides in the product would be0.12 g of actinides (Table IV-20); therefore, one liter of feed would generate1.5 g of TRU product with a specific alpha activity in the solid oxide productof 0.07 Ci/g.
C' Modifications for an Improved TRUEX Flowsheet
The results of the batch countercurrent experiments have revealed areasfor improving the CMPO-TRUEX process for TRU removal from DSW:
" The split scrub can be eliminated. A single scrub with 0.5M HNO3 -0.005M Fe3+ having an 0/A phase ratio of four should be sufficient to decon-taminate the loaded organic phase from fission produ.:ts and entrained feedsolution.

44
" The 0/A phase ratio of the dilute HNO 3 strip should be decreasedfrom 2 to 1, and the concentration of HNO3 increased to 0.02M, thus increasingthe efficiency of stripping Am, Pu, Np, and Tc.
* The concentration of oxalic acid in the second strip should bedecreased from 0.1 to 0.05M to minimize the quantity of organic compound thatmust be destroyed.
The above changes are incorporated in the modified flowsheet shown inFig. IV-ll.
TRUEX Solvent0.2M CMPO
1.4M TSPConoco 12.14
(0.57)
DSW Scrub1M HNO, 0.5M HNO,
0.2M H 2C 204
(1.0) (0.14)
E~iIEI'L I~1 i3Waste
Raf finate(1.14)
To Sr Ranveryand/or
Disposal
Strip, I0.02! HNO,
0.005MHAN10.57)
T0.a7)
(0.57)
TRU
R.E.F.P., TcI =
(0.67)
To TR U Recovery Tr u p s r -
Disposal 10.141
To Disposal
Strip-Wash0.06! HC 204
(0.14)
1 Amb rly
Fig. IV- 11. An Improved CMPO-TRUEX Flowsheet for DSW Feed. (Thenumber in parentheses in each box is the relativeflow rate of that stream.)
1
1
1
1
1
1
1
1
1
1
1
1
1
Solvent
Make-up
1
1
1
1
1
1
1
1
1
1
1
1
1
1
1
1
1
1
sat
a"ap
st"A21

45
V. TRUEX PROCESS CHEMISTRY AND FLOWSHEET FEATURES
Because of its high degree of flexibility in removing soluble TRUelements from a wide variety of feeds, the TRUEX process is applicable to
many actinide separations in nuclear and defense activities. Process flexi-
bility and other chemical process concerns (third-phase formation, chemical
and radiolytic stability of TRUEX solvents, and the aqueous phase solubilityand physical parameters of TRUEX reagents) are discussed in this section.Also addressed below are other features important to judging the appropriate-
ness of a TRUEX process. These features include cost and commercial availa-bility of the extractants, estimated extractant loss and inventory, process
equipment concerns, and process safety. There is a great deal more processinformation available in the literature for the less acceptable TRUEX processextractant, DHDECMP, and most of the ANL effort has been directed towardstudying the properties of O+D[IB]CMPO.
A. Process Flexibility
The CAW and DSW feed compositions for the TRUEX process flowsheets werebased on the best information available. There is also a general knowledgeof variations in CAW composition. The composition of DSW, however, is basedon a conceptual process that includes dissolving the sludge in oxalic acid
and/or nitric acid, mixing, adjusting the volume to that of the original CAW,and perhaps adjusting the nitric acid and the oxalic acid concentrations.Because of the complexities of obtaining the DSW feed, there is bound to
be a high variability in its composition.
Studies at the Savannah River Plant (SRP) determined that 8% (1M) solu-tions of oxalic acid can dissolve '95% of PUREX process sludge at practical
rates [BRADLEY, SRL-1976, -1978]. A combination of sluicing [RASMUSSEN] andoxalic acid dissolution could be used for preparing DSW.
The following discussion deals with the effects of varying temperatureand the concentrations of nitric and oxalic acid in the feed on the extractionof Am and other feed constituents. Also, briefly discussed are the effects of
varying the solvent concentrations of TBP and the extractant.
1. Nitric Acid Concentration
Because O$D[IB]CMPO and DHDECMP are neutral extractants, cationic
species must extract as neutral salts from nitric acid medium. For example,
the extraction of americium is accomplished through the reaction:
Am3+(aq) + 3N03(aq) + 3E(org) - Am(N03)3(E)3(org) (1)
where E is the neutral extractant (DHDECMP or O$D[IB]CMPO) or its 1/1 nitricacid adduct (E-HNO3). The [HNO3] in the feed, therefore, acts as a saltingagent (i.e., a source for NO3-) and increases the extent of the extraction ofamericium and other cations as nitrate salts. Extraction of nitric acid itselfalso increases with increasing [HNO3 ] and can, therefore, limit the extractionpower of the solvent for other species by competing for extractant molecules.Figure V-1 shows how these competing reactions affect the distributioncoefficient of americium.

46
10 E I I I, i I I I Y, I I ,, ,I, , , , ,,
0.2M OqDIIBJCMPO -1.4M TBP -
10 ' Conoco (12-14)
10
10'
0.4M DHDECMP -10 1.2M TBP -
Conoco (12-14) I
Fig. V-1.
The Distribution Ratio of Am vs.[HNO3 ] for the TRUEX Solvents(at 40 C with a 1/1 Phase Ratio)
10' ' 1 i""" _
10' 10 10'[HNO3J1gs M
Figure V-2 shows how the nitric acidtitioning of oxalic acid and pertechnetate ionBecause both of these species extract into theextraction mechanism is different from that ofnitric acid is acting as a hydrogen ion donor:
C2042- + H+ HC204
HC204 ' + H+ ; H2C204
Tc04- + H+ l HTc04
concentration affects the par-by the TRUEX process solvents.
organic phase as acids, theEq. 1. In these extractions,
(2)
(3)
(4)
to form the extractable neutral species. The nitric acid concentration ofthe organic phase is also plotted in Fig. V-2 vs. that of the aqueous phase.The average distribution ratio of HNO 3 calculated from the data presentedin Fig. V-2 is 'O.3.
Because the shapes of the curves shown in Figs. V-1 and V-2 arebased on competition of two reactions that are competing for extractant mole-cules, they will be modified by the relative concentrations of the extractingspecies. The distribution ratios of Am, Tc, and H2 C2 0 4 were all measured atradiotracer concentrations of these species. At higher concentrations, theywould compete more effectively for extractant molecules, and the maximum ofeach curve would be shifted to higher aqueous-phase nitric acid concentrations.Because the mechanisms for extraction of H2 C 2 04 and HTc04 are so similar tothose of HN03 , this effect is clearer than for Am extraction, where HNO3 andAm(N0 3 ) 3 are simultaneously extracted.
E
0

47
10 --- T, ,10
H2G204
Tc
HNO 3
1-
Fig. V-2.
-11
0,z
20.1
The Organic-Phase [HNO3 ] and theDistribution Ratios of Oxalic Acidand Pertechnitic Acid vs. theAqueous-Phase [HNO3 ] for CMPO-TRUEXSolvent. (The distribution ratiodata for oxalic acid, represented bytriangles, and pertechnetate, repre-sented by squares, were measured at 40 C;the organic phase concentrations ofHNO3 , displayed as circles, were
measured at 25*C, all at a 1/1 phaseratio. The CMPO-TRUEX solvent is 0.2MO D[IB]CMPO-1.4M TBP-Conoco C1 2-C1 4.)
0.01 L ' ' ' " LL l lj 1uJ 1111L0.01
0.01 0.1 1 10
[HNOJaeq. M
An important difference between the two TRUEX process solvents ismade evident by the data in Fig. V-1. Because of the negligible effect of[HNO3 ] on its extraction power in the range of 3-6M HNO3 , DHDECMP is an effec-
tive extractant for separating americium from fission products at high acidconcentrations. Near iM HNO 3 , however, small differences in acidity have aprofound effect on DHDECMP extraction of americium [DAm(2M HNO 3 ) = 1.4;DAm(lM HNO3 ) = 0.48; DAm(0.5M HNO3 ) = 0.15]--a range of almost 10 occurringfor a fourfold change in nitric acid concentration. The data presented in
Fig. V-1 show that the CMPO-TRUEX process solvent is much more suitable foruse with feeds having a nitric acid concentration near iM. Addition of nitrateion to the feeds will, of course, increase the extracting power of both TRUEX
solvents for species that extract as nitrate salts.
2. Oxalic Acid Concentration
Oxalic acid is added to the feed solution to inhibit the extractionof troublesome fission products (i.e., Pd, Zr, and Mo) and iron by forminginextractable aqueous phase oxalato-complexes. Tables V-1 and V-2 show theinfluence of oxalic acid concentration on the extraction of a variety of metalions from a simulated waste solution that is similar in composition to DSW.Table V-3 shows some more recent data, obtained for a slightly differentcomposition of the O$D[IB]CMPO-TRUEX solvent (namely, 0.2M O$D[IB]CMPO-1. MTBP-Conoco C1 2 -C 1 4 ) and the simulated DSW solution prepared for the counter-current experiment.
0e0
U
0
o.
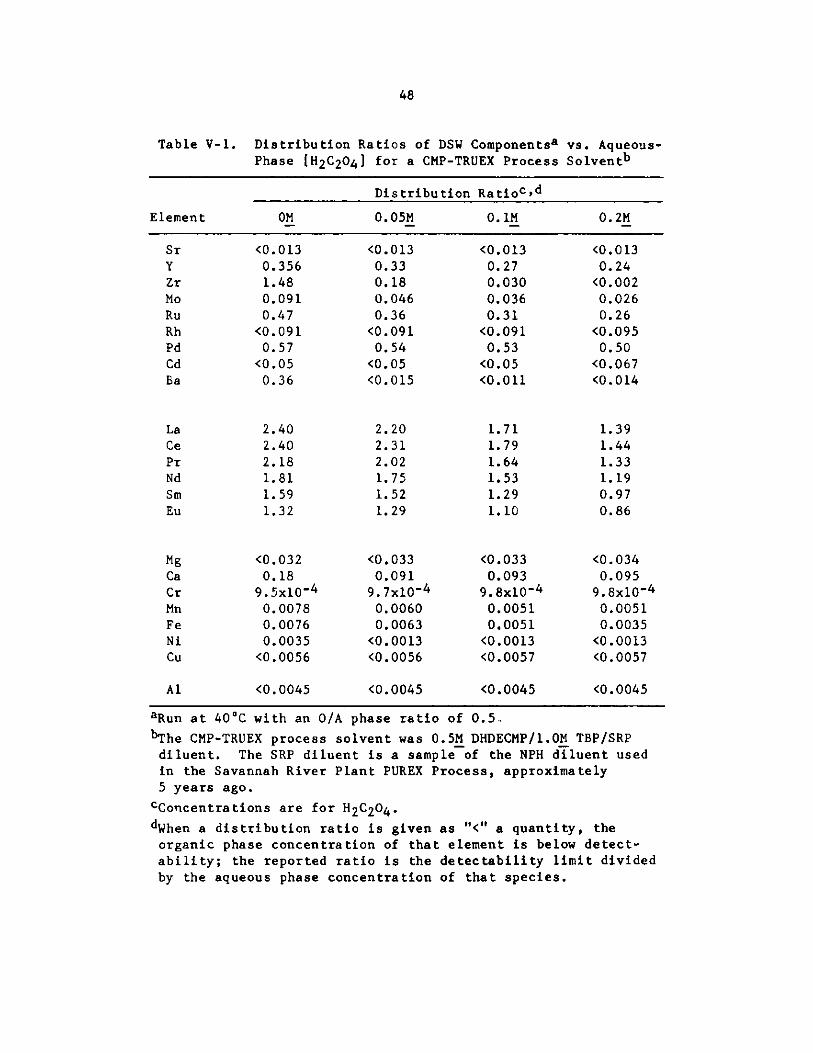
48
Table V-1. Distribution Ratios of DSW ComponentsaPhase [H2C204 ] for a CMP-TRUEX Process
vs. Aqueous-Solventb
Distribution Ratioc,d
Element OM O.05M 0.1M 0.2M
Sr
Y
Zr
MoRuRh
Pd
CdBa
LaCePr
Nd
SmEu
MgCaCr
MnFe
NiCu
Al
<0.0130.3561.480.0910.47
<0.0910.57
<0.050.36
2.402.402.181.811.591.32
<0.0320.18
9.5x10'4
0.00780.00760.0035
<0.0056
<0.0045
<0.0130.330.180.0460.36<0.0910.54<0.05<0.015
2.202.312.021.751.521.29
<0.0330.091
9.7x10' 4
0.00600.0063
<0.0013<0.0056
<0.0045
<0.0130.270.0300.0360.31
<0.0910.53
<0.05<0.011
1.711.791.641.531.291.10
<0.0330.093
9.8x10' 4
0.00510.0051
<0.0013<0.0057
<0.0045
<0.0130.24
<0.0020.0260.26
<0.0950.50
<0.067<0.014
1.391.441.331.190.970.86
<0.0340.095
9.8x10'4
0.00510.0035
<0.0013<0.0057
<0.0045
aRun at 40 C with an 0/A phase ratio of 0.5.
bThe CMP-TRUEX process solvent was 0.5M DHDECMP/1.0M TBP/SRPdiluent. The SRP diluent is a sample of the NPH diluent usedin the Savannah River Plant PUREX Process, approximately5 years ago.
CConcentrations are for H 2 C2 04 .
dWhen a distribution ratio is given as "<" a quantity, theorganic phase concentration of that element is below detect-ability; the reported ratio is the detectability limit dividedby the aqueous phase concentration of that species.

49
Table V-2. Distribution Ratios of DSW Componentsa vs. Aqueous-Phase [H 2 C2 04 ] for a CMPO-TRUEX Process Solventb
Distribution Ratioc,d
Element OM 0.05M 0.1M 0.2M
SrYZrMoRuRh
PdCdBa
<0.00461.78
13.001.210.350.191.58
<0.070.027
LaCePr
Nd
Sm
Eu(Am)
6.149.78
12.0310.649.628.38
11
MgCaCr
MnFe
NiCu
Al
<0.0290.082
<0.0010.00760.060.0036
<0.0006
6.2x10- 3
<0.00481.771.440.810.31
<0.091.13
<0.08<0.014
5.869.51
10.499.789.408.00
11
<0.0300.093
<0.0010.01020.060.0043<0.006
6.6x10- 3
<0.00461.700.240.440.33<0.100.71
<0.07<0.011
5.038.289.078.467.957.009.4
<0.0290.087
<0.0010.00870.050.0026
<0.006
4.2x10- 3
<0.00471.560.020.280.32
<0.110.44
<0.070.012
4.467.378.317.187.166.308.4
<0.0300.089
<0.0010.00870.03
<0.001<0.006
4.2x10⁻³
aRun at 40*C with an 0/A phase ratio of 0.5.
bThe CMPO-TRUEX process solvent was 0.2M 0$D[IB]CMPO/1.2M TBP/Ivorpor-12 diluent. The Norpor-12 diluent is a commercialNPH with an average carbon chain length of 12.
cConcentrations are for H2 C 2 0 4 .
dWhen a distribution ratio is given as "<" a quantity, theorganic phase concentration of that element is below detect-ability; the reported ratio is the detectability limit dividedby the aqueous phase concentration of that species.

50
Table V-3. Distribution Ratios of DSW Components vs. Aqueous-Phase [H 2 C2 04 ] under Conditions Used for FlowsheetVerification by the Batch CountercurrentExperimenta
Distribution Ratiob,c
Element 0.05M 0.10M 0.20M
<10-2
1.5
0.58
0.80
NAd
0.39
0.078
0.71
<0.04
<10-2
Sr
Y
Zr
Mo
Tc
Ru
Rh
Pd
Cd
Ba
La
Ce
Pr
Nd
Sm
Eu
Am
Al
Mn
Fe
Cu
10.0
0.012
8.5 x 10⁻³
0.057
0.014
<10-2
1.5
0.13
0.31
NA
0.38
0.080
0.65
<0.04
<10-2
5.0
8.2
8.0
8.6
7.8
6.8
10.0
0.0097
9.5 x 10⁻³
0.057
0.014
<10-2
1.1
0.013
0.11
3.0
0.30
0.11
0.44
<0.05
<10-2
3.4
5.4
5.7
5.6
5.1
4.4
6.1
<0.006
10-2
0.041
<0.007
aThe organic phase was 0.2M 0D[IB]CMPO/1.4M TBP/Conoco
C1 2 -C 1 4 diluent. The Conoco C 1 2 -C 1 4 diluent is acommercially available NPH with an average carbon chainlength of 13. The experiments were at 400C, with an 0/Aphase ratio of 0.5; the simulated DSW was used in thebatch countercurrent experiment.
bMeasured by inductively coupled plasma/atomic emissionspectroscopy except for Tc, which was measured by radiotraceranalysis. Concentrations are for H2 C 2 04 .
CWhen a distribution ratio is given as' "< a quantity, theorganic phase concentration of that element is below detect-ability; the reported ratio is the detectability limitdivided by the aqueous phase concentration of that species.
dNA means not analyzed.
5.2
8.2
9.1
9.0
7.9
6.8

51
The data of Tables V-1, V-2, and V-3 show the importance of usingfairly high concentrations (0.2M) of oxalic acid to lower the extractabilityof the troublesome elements; this is accomplished at the cost of reducing thedistribution ratio of lanthanides and TRU elements. In fact, if the concen-
tration of oxalate is made too high, precipitation of lanthanides and TRUelements might occur. Because the great proportion of oxalate is tied up inthe CAW and DSW feed solutions as oxalate complexes of iron and aluminum, thetotal oxalate concentration would have to be considerably higher than 0.3M,the highest [H 2C204 ] that has been studied. The reader is directed toAppendix C for a discussion on oxalic acid complexing of CAW and DSW componentsand the effect of this complexing on the composition of these solutions.
The actinide-oxalate complexation data in Appendix C show that bothPu(IV) and Np(IV) will be largely complexed in the aqueous feed when the totaloxalic acid concentration is 0.2M. Because these two TRU species should have adistribution ratio between 1M HNO3 and the TRUEX solvents in the range of 104,complexation with oxalate should not hinder these species from partitioningto the organic phase. Addition of oxalate to the feed is also importantbecause it should reduce Np(V) to the much more extractable Np(IV) species
[HORWITZ-1983].
The amount of oxalic acid in the TRU/lanthanide-rich organic phasedoes become important in the strip section, however, where there is no ironor aluminum ion in the aqueous strip solution to complex with oxalate. Thedouble scrub is included in the extraction section to minimize the amountof oxalic acid in the loaded solvent and, therefore, prevent lanthanide/TRUprecipitation during stripping.
3. Temperature
Data presented in Table V-4 show the typical effect of temperatureon the extraction of metal ions--the distribution of Am3 + decreases withincreasing temperature for both TRUEX process extractants. The positive
aspects of increasing temperature (faster phase disengagement and elimina-
tion of third phases) are discussed in section V.B.
4. Tributvl Phosphate
The role of TBP in TRUEX process solvent is primarily one of a phasemodifier; i.e., it allows the extraction of gross amounts of actinides andlanthanides without third-phase formation. Further discussion of the role ofTBP is given in Section V.B, which is co;.zzved with third-phase formation.
The addition of TBP to TRUEX process solvents also has a secondbenefit: it modifies the extracting power of O$D[IB]CMPO. The influence ofTBP addition on DAm for various nitric acid concentrations is illustratedin Fig. V-3. At low nitric acid concentrations, the addition of TBP lowersDAm and facilitates stripping. At high HNO3 concentrations, where extractionwill occur, TBP has the effect of flattening the curve, thus diminishing theeffect of varying nitric acid concentration on the extraction of americium.

52
Table V-4. Influence of Temperature on the Extraction of Americiumand Europium by TRUEX Process Solventsa
Temp., DHDECMP OD[IB]CMPOC DAm DEu DAm/DEu DAm DEu DAm/DEu
20 third-phase formation third-phase formation
30 6.97 5.24 1.33 19.6 14.6 1.34
40 5.62 4.29 1.31 15.8 11.9 1.33
50 4.60 3.56 1.29 12.1 9.44 1.28
aThe distribution ratios of americium and europium (DAm and DEu)were measured between CAW solution containing 0.1M oxalic acidand the TRUEX solvents (0.2M O D[IB]CMPO/1.2M TBP/Norpar-12 and0.5M DHDECMP/1.0M TBP/Norpar-12;0/A Phase Ratio s 0.5).
0.10 1.00
IHNO 3 AO'M
Fig. V-3.
Acid Dependency of DAm for 0.25M0*D[IB]CMPO in Decalin as aFunction of Added TBP at 25*C
10.0
B. Diluent Properties and Phase Compatibility
Studies of factors that influence the formation of heavy organic phasesin the extractant mixtures of TBP with the bifunctional compounds DHDECMP and
04D[IB]CMPO have defined regimes where undesirable third-phase (second organicphase) formation can occur. Factors of major importance include (1) choice ofdiluent, (2) organic phase concentration of TBP, (3) type and concentration of
bifunctional extractant, (4) aqueous phase acidity, and (5) temperature. Thesefive factors and other considerations are discussed below.
100
DAm
10
1
' / ---- 0.00 M TBP
S -- c-- 0.25 M TBP( -- 0-- 0.50 M TBP
-.-- 0.75 M TBPI
L.

53
1. Choice of Diluent
The compositions of these three commercially available NPH mixtures
(Norpar 12, SRP diluent,* and Conoco C1 2 -C1 4 ) are presented in TableV-5. Solutions of 0.20M O$D[IB]CMPO/1.2M TBP in each diluent were examinedfor loading capacity by extracting Nd(N0 3) 3 from 3.OM HNO3 at 25*C,
with dramatically different results (Table V-6). A similar effect was found
for DHDECMP/TBP mixtures. Obviously, the changes in the relative concentra-
tions of the C1 0 to C15 components in these diluents severely alter theloading capacity of the solvent. The large differences in loading capacities
of TRUEX-process extractant solutions in three similar commercially availableNPH diluents led to a more complete study of loading capacity vs. carbonchain length. To examine this phenomenon, studies of solutions with the sameextractant composition in pure aliphatic diluents were carried out (Table V-6).The drop in loading from essentially 100% of theoretical for decane to0% for preconditioned organic solutions in the C1 4 and C16 diluents isevident. The values obtained for the commercial diluents correlate well withthe loading that would be predicted based on the average chain length.Results obtained for the loading of solutions with the same extractantconcentration in different C 1 2 -C 1 3 mixtures (bottom of Table V-6) demon-
strate the large effect even a relatively low concentration of a longer chainaliphatic can have on loading.
Table V-5. Composition of NPH Diluents
Carbon Chain Conoco
Length Norpar-12 SRP C12-C14
10 13 - 1
11 36 0.5 212 44 9.5 1213 7 48 5614 - 40 2815 - 2 1
Av. 11.45 13.34 13.23
2. TBP Concentration
Although not studied in detail, the limited data show the effect ofTBP concentration on phase compatibility of the bifunctional extractants tobe great. Without added TBP, the bifunctional compounds cannot be used asextractants in NPHs due to third-phase formation on contact with acidic aqueoussolutions. Earlier studies showed that only with quite high concentrationsof TBP, or other polar compounds, can CMP and CMPO extractants be made com-patible with aliphatic diluents [HORWITZ-1984]. For 0.20M_ 0D[IB]CMPO inNorpar-12, a TBP concentration of 1.2M is sufficient to obtain adequate
*A PUREX diluent in use at the Savannah River Plant 1%5 years ago.

54
Table V-6. Effect of Diluent on theLoading Capacity of CMPO-TRUEX Process Solventsa
Diluent %, Loadingbc
Norpar-12 70-75Conoco 25-30SRP 20-25
Decane (C 1 0 ) 100Dodecane (C12 ) 70-75Tridecane (C13 ) 30-35Tetradecane (C 1 4 ) dHexadecane (C 1 6 ) d
100% C12/0% C13 70-7575% C1 2 /25% C1 3 50-5550% C12/50% C13 45-5025% C1 2/75% C13 30-350% C1 2/100% C 1 3 30-35
aPreconditioned 0.20M 0$D[IB]CMPO/
1.20M TBP mixtures with Nd(N03)3extracted from 3.01M HNO 3 at 25 C.
bBased on Nd/0$D[IB]CMPO mole ratio of1:3.
cThe range of numbers means there wasno third-phase formation at the lowerpercent but at the higher percent.
dHeavy organic phase forms with3.0M NHO3 .
loading of TRU and lanthanide salts without formation of a second organicphase. Owing to the reduced loading capacity of this extractant in a diluentof higher molecular weight paraffins, such as the Conoco C1 2-C14 , the TBP con-centration had to be raised slightly, to 1.4M, to increase the concentrationof metal that can be contained in a homogeneous organic phase (Table V-7).Extraction studies have indicated that the additional TBP does not greatlyinfluence the extraction of trivalent actinide and lanthanide ions. At veryhigh TBP concentrations, however, the potential does exist for certain fissionproducts to be extracted to a significant extent by the TBP, thus somewhatlowering the selectivity of the solvent.
3. Nature and Concentration of Bifunctional Extractant
Of lesser importance than the TBP concentration for third-phaseformation is the concentration of the bifunctional extractant itself. Earlierstudies showed that for a given TBP concentration, increases in the concentra-tion of O*D[IB]CMPO resulted in a decrease in the percentage of theoretical

55
Table V-7. Loading Capacities of Precondi-tioned 0.20M 0D[IB]CMPO inConoco C1 2 -C 1 4 SolutionsContaining TBP
[TBP], % Loading8
M [HNo3] = 1.OM [HNO3 ] = 3.0M
1.20 50-55 25-30
1.40 ti 100 50-55
aNd(NO) 3 extracted from HNO 3 solutionsat 25 C. Based on Nd/0D[IB]CMPO moleratio = 1:3.
goading that could be achieved with no third-phase formation (Table V-8). Inthis case, an increase in the concentration of 0D[IB]CMPO from 0.20 to 0.30M,although lowering the percent loading of the extractant solution, resultedin no net change in the amount of metal ion contained in the organic phase.Thus, it appears that, aside from changing the distribution ratios, changesin 0D[IB]CMPO concentration have little effect on the total metal extractionunder the limited conditions studied.
Table V-8. Loading Capacity of ODD[ IB ]CMPO/1.20MTBP Solutions in Norpar-12a
[0D[IB]CMPO], M % Loading [Nd]org, M
0.20 70-75 0.047-0.0500.25 55-60 0.046-0.0500.30 45-50 0.045-0.050
aWith Nd3+ from 3.OM HNO3 at 25*C [HORWITZ-1984].
Examination of the loading of DHDECMP under the same conditions asfor 0,D[IBJCMPO has not been possible owing to the differences in their extrac-ting power. Nevertheless, it qualitatively appears that the DHDECMP/TBP solu-tions are more prone toward third-phase formation than are solutions of0.D[IB]CMPO with TBP. For example, a solution of 0.50M DHDECMP/1.OM TBP canextract only 15-20% of the theoretical amount of Nd(N03 )3 from 3.0M HNO3without third-phase formation. This difference in loading between the twobifunctional extractant solutions may be explained by two factors: the muchhigher concentration of the DHDECMP extractant required to obtain reasonabledistribution ratios, and the lower relative ratio of TBP concentration to thatof DHDECMP which must be used to keep the total extractant concentration in anacceptable range.
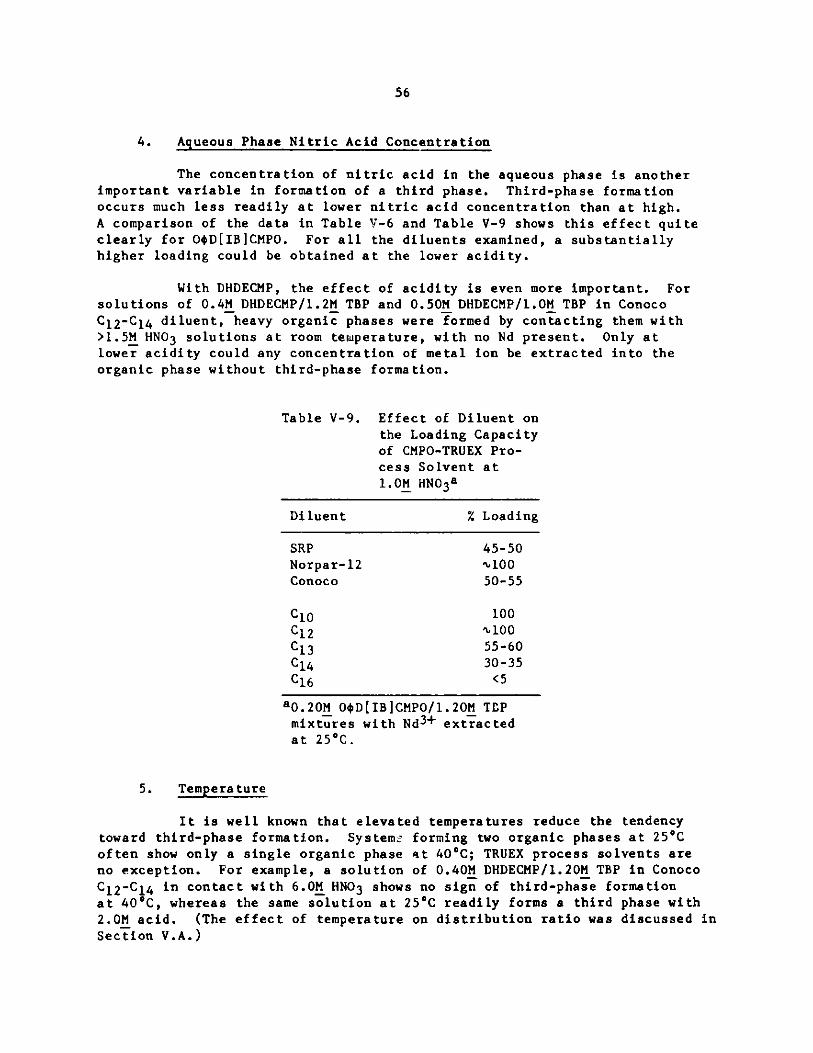
56
4. Aqueous Phase Nitric Acid Concentration
The concentration of nitric acid in the aqueous phase is anotherimportant variable in formation of a third phase. Third-phase formationoccurs much less readily at lower nitric acid concentration than at high.A comparison of the data in Table V-6 and Table V-9 shows this effect quiteclearly for O$D[IB]CMPO. For all the diluents examined, a substantiallyhigher loading could be obtained at the lower acidity.
With DHDECMP, the effect of acidity is even more important. Forsolutions of 0.4M DHDECMP/1.2M TBP and 0.50M DHDECMP/1.OM TBP in Conoco
C 1 2 -C 1 4 diluent, heavy organic phases were formed by contacting them with>1.5M HNO3 solutions at room temperature, with no Nd present. Only atlower acidity could any concentration of metal ion be extracted into theorganic phase without third-phase formation.
Table V-9. Effect of Diluent onthe Loading Capacityof CMPO-TRUEX Pro-cess Solvent at1.OM HNO3a
Diluent % Loading
SRP 45-50Norpar-12 " 100Conoco 50-55
C10 100C1 2 4100C13 55-60C14 30-35C16 <5
a0.20M 0D[IB]CMPO/1.20M TBPmixtures with Nd3 + extractedat 25*C.
5. Temperature
It is well known that elevated temperatures reduce the tendencytoward third-phase formation. Systems forming two organic phases at 25*Coften show only a single organic phase Rt 400C; TRUEX process solvents areno exception. For example, a solution of 0.40M DHDECMP/1.20M TBP in Conoco
C12-C14 in contact with 6.0M HNO3 shows no sign of third-phase formationat 40*C, whereas the same solution at 250C readily forms a third phase with2.0M acid. (The effect of temperature on distribution ratio was discussed in
Section V.A.)

57
6. Other Considerations
In all the systems discussed above, the heavy organic phases formedmake up a considerable portion of the volume of the organic phase, frequently
in the range of 40 to 60 vol %. In addition, the heavy phases are freeflowing, slightly viscous liquids that readily disperse in the lighter organicphase and readily separate from the aqueous phase. They are not solid or
semi-solid masses. It is also important to note that the third phase oftenrequires long periods of time to develop (up to several hours). Thus, theseTRUEX process solvents can be "supersaturated." The loading figures quoted inthis report are for solutions that were allowed to stand a minimum of 4 hoursbefore being examined for phase separation--much higher loadings would havebeen reported if the solutions had not been allowed to stand for this time.
7. Summary of Observations on Third-Phase Formation
Although these results are preliminary, they indicate that anextractant solution that should exhibit acceptable loading characteristicsunder process constraints can be formulated. The number of factors influencingthird-phase formation in these systems is large and the interactions among
them are complex. However, several guidelines for operation in a region witha single organic phase seem clear.
" The concentration of TBP should be kept as high as possiblewithin the constraints of viscosity, phase density, and selectivity.
* If necessary, increases in the TBP concentration may be achievedat the expense of the bifunctional extractant concentration if total extractantconcentration considerations are important. This approach carries a penalty ofreducing the extracting power of the solvent (a third-power effect for TRU andlanthanides) that must be accommodated.
" The aqueous-phase RN0 3 concentration should be kept as low as
is feasible.
" The diluent should be chosen so that the concentrations of thehigher molecular weight constituents are kept to a minimum while an adequateflash point is maintained.
TRUEX process flowsheets for DSW and CAW have been designed with theconstraint of using Conoco C1 2 -C1 4 as the NPH diluent. If a NPH mixture withlesser amounts of tetradecane were selected, process flexibility would bgreatly enhanced. A diluent with a flash point >80*C could most easily beprepared by blending Conoco C10-C12 and C1 2 -C1 4 in the correct proportions.
C. Physical Properties of Extractants
1. DHDECMP
Until very recently much of the industrially produced DHDECMPwas a technical grade chemical with a purity level <50% [SCHULZ-1982]. Theimpurities were a mixture of starting materials and a myriad of unwantedby-products of the synthesis. Many of these compounds have been identified;

58
many more are still unknown [BAHNER-1977, -1981, FAGERNESS, MCISAAC-1979,NAVRATIL, SCHULZ-1982, SCHROEDER-1980A]. Bray Oil Company (Los Angeles, CA)was, at one time, selling DHDECMP as a 86% pure product [CHAMBERLAIN]. Thispurity level was attained by distilling the <50% material at high vacuurr.
Very recently, Columbia Organic Chemical Company, Inc. (COC) devisedan improved synthesis for DHDECMP that results in a nominal purity level of '86%.This material was obtained directly from the synthes.s pot and the puritymeasured by gas chromatography (GC). Solvent extraction tests of this
material at the U.S. DOE Rocky Flats Plant [MUSCATELLO] showed it to containa large amount of high-molecular-weight, acidic material, which does notallow stripping of actinides and lanthanides by dilute nitric acid. Because
acidic compounds are not measurable by GC analysis unless they are first
converted to esters, it is more accurate to say that DHDECMP is 86% of theneutral species in this COC product. The ability to strip lanthanides and
ac.tinides by dilute nitric acid is not improved by washing of the COC materialwith solutions of sodium hydroxide or sodium carbonate. This suggests the
acidic impurities are of high molecular weight and would be removable by highvacuum distillation, washing with ethylene glycol, or by macroreticular resintreatment. These procedures and others are reviewed by Schulz and Navratil[SCHULZ-1982]. Precipitation of the mercury(II) salt of DHDECMP is the most
efficient means found to date for obtaining pure material (>95%) in high
yield ("85%) [SCHROEDER-1980B].
Practical industrial parameters such as freezing point, viscosity,and flash points of the CMP-TRUEX process solvent have not been measured.
Because the TRUEX process solvents can be envisioned as a modified PUREX pro-
cess soi vent, these parameters can be estimated by simple extrapolation of theproperties of DHDECMP and its diluent (30% TBP in NPH). Table V-10 presents
the measured and estimated physical parameters (except for aqueous phase sol-ubilty, which is treated separately in Section V.D.) of DHDECMP, TBP, Conoco
C1 2-C14 , 30% TBP in Conoco C1 2-C14 , and the CMP-TRUEX process solvent.In general, the physical parameters for the TRUEX process solvent were calcul-
ated by assuming that empirical relationships derived from TBP-diluent mixtures
[VANDEGRIFT] also approximate TRUEX process solvents. The addition of DHDECMPwas treated as if it had the same unit effect as would adding more TBP to thesolution.
2. O D[IB]CMPO
Although the synthesis of O4D[IB]CMPO is much more difficult thanthat of DHDECMP, its purification is a relatively simple matter [KAPLAN].After the synthesis step, the crude product is washed first with 1M HCl andthen 1M NaOH solutions; water washes follow each treatment. After the heptanediluent is evaporated under low vacuum, low boiling impurities are removed fromthe residue in a 1.3 Pa (0.01 torr) vacuum at 205 C. When the flask tempera-ture is raised to 220*C and the systems pressure is lowered to 0.13 Pa(0.001 torr), a "96% pure O D[IB]CMPO product (determined by GC analysis)is distilled away from the impure residue.
The mercury salt purification procedure [MCISAAC-1981, SCHROEDER-1980B] also works for O4D[IB]CMPO. A product of >98% purity (determined byGC analysis) can be obtained by this method.

Estimated Physical Properties of TRUEX Solvents and Their Constituents
Physical Propertiesa
Melting Boiling Flash Molecular
Point, Point, Point, Specific Viscosity, Weight,
Material 0C 0C *F (*C) Gravity cP g/mol
TBP -80 2 8 9b 295 0.976 3.39 266(146)
Conoco C12-C14 -12 190 210 0.7 4 5c 1.7 8 c 187d(99)
30% TBP/Conoco - - 22 6e 0. 8 1 5 f 4.1g -
C12-C14 (108)
DHDECEP Liquid at highh high 0.9881 25k 363
ambienttempera tures
0$D[IB]CMPO 44-451 high m highn 10 1 04-1 05P 407
0.4M DHDECMP/ - - 23 1r 0.856s 7t -
1.2M TBP/Conoco (111)
C12-C14 q
0.2M 0 D[IB]CMPO/ - - 236r 0.854s 7v -
1.4M TBP/Conoco (114)
C12-C14u
aGiven at 250C unless otherwise stipulated. The data provided for TBP and Conoco C12-C14 aremeasured quantities; other data are estimates. All empirical relationships used to calculate
physical parameters were taken from [VANDEGRIFT] and references therein.
bDecomposition temperature.
cAt 60 F (160C).
J0
Table V-10.

dBased on average composition: C1 3 .2 H 2 8.5-
eBased on the empirical relationship: AT = - (T02 /2300) log10 M where AT is the increase in
flash point; To is the flash point of the pure diluent in degrees Kelvin; and M is the mole
fraction of the diluent [VANDEGRIFT].
(Based on the assumption that the density of a resultant solution is equal to the sum of the
density of each component multiplied by its volume fraction. This has been proven to be valid
for TBP solutions [VANDEGRIFT].
gThe viscosity of a water-saturated TBP solution can be approximated by the empirical relationship:
logl0nmix = NTBP (1.345 + 0.36 NTBP) + Ndill0gl0ndil where NTBP = volume fraction of TBP; ndiland Ndil are the viscosity and volume fraction of the diluent [VANDEGRIFT].
hDHDECMP can not be disti. ed at atmospheric pressure because it decomposes at a temperature
below its boiling point. However, the 86% material was prepared from technical grade DHDECMP
by distillation at reduced pressures (0.001 torr, ,110*C as well as 0.2 torr and 140 C)
[SCHULZ-1982].
iThis is an assumption based entirely on its low volatility and its molecular weight being '36%
greater than TBP.
i>99% pure material [SCHROEDER-1980A]. A specific gravity of 0.985 was measured elsewhere for
99.8% pure material [GANSER].
kExtrapolated from data at 20, 30, and 500C; the measured viscosities of the >99% material at
these three temperatures are 30.8, 19.9, and 9.5 cP, respectively. DHDECMP is a Newtonian
fluid [SCHROEDER-1980A].1Although the >99% 0$D[IB]CMPO is a solid, at a parity level of <98%, t1e material is a viscousoil, which may crystallize on standing for long periods.
mA ' 95% product was distilled from the reaction flask at ',210 C and a vacuum of ',0.02 torr in
one experiment, at ',220 C and 0.001 torr in another [KAPLAN].
nBased on its low volatility and high molecular weight (53% greater than TBP). Also based on
the fact that close analogues, but with lower molecular weights, of this compound have been
patented as flame retardant finishing for pile carpeting [HOECHST].
Generally, organophosphorus compounds have densities very close to 1, in the range of
0.97-1.02 g/mL.
PBased entirely on the observation that the impure oil pours at a rate that seems lower than that
of honey.
(footnotes continued on next page)
0>

9Assuming there are no solution effects modifying partial molar volumes of species, this
solution is equivalent to 14.7 vol % DHDECMP/32.7 vol % TBP/52.6 vol % NPH and to 17.0 wt %
DHDECMP/37.3 wt % TBP/45.8 wt % NPH.
rBased on (1) the relationship of footnote e and (2) DHDECMP and 0D[IB]CMPO having the
equivalent effect per mole as does TBP.
sBased on constant molar volumes of constituents.
tCalculated from the relationship given in footnote g, assuming DHDECMP has the same effect
per volume fraction as does TBP. Data by Mclsaac et al. [MCISAAC-1979] for 30% DHDECMP in
diisopropylbenzene (DIPB) show that the calculated approximate viscosity is likely not
grossly in error. The viscosities of the water-washed DHDECMP in DIPB are 2.95 cP at 20*C,
2.38 cP at 30 C, and 1.58 cP at 50*C.
uAssuming there are no solution effects modifying partial molar volumes of species, this
solution is equivalent to 8.1 vol % 0+D[IB]CMPO/38.2 vol % TBP/53.7 vol % NPH and to 9.5 wt %
0,D[IB]CMPO/43.6 wt % TBP/46.8 wt % NPH.
vCalculated from the relationship in footnote g, assuming 0D[IB]CMPO has the same effect per
volume fraction as does TBP.

62
The highest purity O#D[IB]CMPO to date was prepared by crystallizationfrom a hexane solution of the crude NaOH-treated product. The crystallizedwhite solid was measured by GC analysis to be >99% pure.
There are no significant differences in the solvent extractionproperties of the three purified forms of O D[IB]CMPO at loading levelsanticipated in the TRUEX process. For industrial-scale production of the
extractant, the purification method employed will likely be chosen based onprice and quality control considerations.
Physical parameters (except for aqueous phase solubility, which is
,.reated separately in Section V.D) of O$D[IB]CMPO and its TRUEX process solvent
are presented in Table V-10. Very little physical information is available on
this extractant and its solutions; therefore, most of the information isextrapolated by methods explained in table footnotes.
D. Aqueous Phase Solubilities and Partitioning of Extractants
1. DHDECMP
The solubility of DHDECMP and its partition between organic and
aqueous phases is similar to that of TBP. Table V-ll records solubility and
partitioning data of several researchers and, in some instances, comparesthese data to those of TBP. The data of Table V-ll indicate that DHDECMP has
a lower solubility in aqueous phases than some of its accompanying impurities.
The partitioning of TBP between an organic solvent and an aqueous
phase is highly dependent on the organic diluent [VANDEGRIFT]. As might be
expected, the stronger the interaction between TBP and its diluent, the lower
the fraction of TBP that partitions to the aqueous phase. The association of
TBP and DHDECMP in the NPH diluent should lead to a lower loss of both species
to the aqueous phase than would be expected by the data presented in
Table V-ll.
2. O D[IB]CMPO
Results of preliminary measurements on the partitioning of CMPO
compounds and TBP between mixed CMPO/TBP solvents and aqueous phases are
listed in Table V-12.
Although the bulk of the data was obtained with (2-ethylhexyl)(phenyl)-N,N-diisobutylcarbamoylmethylphosphine oxide, the trends are clear.
Increased temperature increases the distribution ratio of TBP and CMPO extrac-
tants, and increasing the acidity of the aqueous phase decreases the distri-
bution ratios of the extractants. Higher temperatures lower the loss of
extractants to the aqueous phase; higher acidities increase extractant loss.
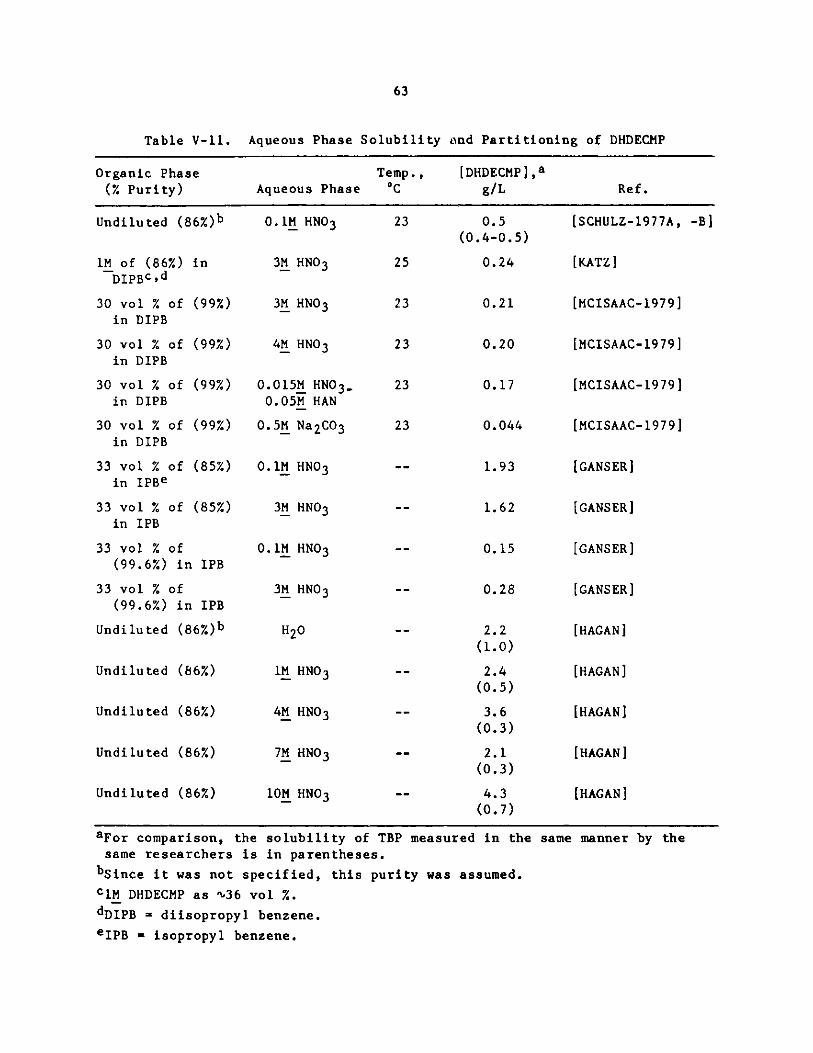
63
Table V-il. Aqueous Phase Solubility ond Partitioning of DHDECMP
Organic Phase
(% Purity)
Undiluted (8 6%)b
1M of (86%) inDIPBc,d
30 vol % of (99%)in DIPB
30 vol % of (99%)in DIPB
30 vol % of (99%)in DIPB
30 vol % of (99%)in DIPB
33 vol % of (85%)in IPBe
33 vol % of (85%)in IPB
33 vol % of(99.6%) in IPB
33 vol % of(99.6%) in IPB
Undiluted ( 8 6%)b
Undiluted (86%)
Undiluted (86%)
Undiluted (86%)
Undiluted (86%)
aFor comparison, the solubility of TBP measured in the same manner by thesame researchers is in parentheses.
bSince it was not specified, this purity was assumed.
clM DHDECMP as 'i36 vol %.
dDIPB = diisopropyl benzene.
eIPB = isopropyl benzene.
Aqueous Phase
0.1M HNO3
3M HNO3
3M HNO3
4M HNO3
0.015M HNO 3 -_0.05M HAN
0.5M Na2CO 3
0.1M HNO3
3M HNO3
0.1M HNO3
3M HNO3
H20
iM HNO3
4M HNO3
7M HNO3
10M HNO3
Temp., [DHDECMP],aC g/L
23 0.5(0.4-0.5)
25 0.24
23 0.21
23 0.20
23 0.17
23 0.044
-- 1.93
-- 1.62
-- 0.15
-- 0.28
-- 2.2
(1.0)
-- 2.4
(0.5)
-- 3.6
(0.3)
-- 2.1
(0.3)
-- 4.3
(0.7)
Ref.
[SCHULZ-1977A, -B]
[KATZ]
[MCISAAC-1979]
[MCISAAC-1979]
[MCISAAC- 1979]
[MCISAAC-1979]
[GANSER]
[GANSER]
[GANSER]
[GANSER]
[HAGAN]
[HAGAN]
[HAGAN]
[HAGAN]
[HAGAN]

Table V-12. Partitioning of CMPO Extractants under Various Conditions
Organic Solvent
0.2M 0D[IB]CMPO/1.2M TBP/Norpar 12a
0.2M EH$D[IB]CMPO/b1.2M TBP/Norpar 12
0.2M EH D[IB]CMPO/
1.2M TBP/Norpar 12
0.2M EH$D[IB]CMPO/1.2M TBP/Norpar 12
0.2M EH D[IB]CMPO/Isopar 12c
1.2M TBP/Hyframe 1 2e
aNorpar 12 is a mixture
Aqueous Phase
1M HNO 3
1M HNO3
1M HNO 3
0.25M Na2CO 3
1M HNO 3
2M HN0 3
Temperature,2C
25
25
50
25
25
21
Distribution Ratio
CMPO TBP
6.7x10³ 1.6x10³
6. 1x10 3
1.0x10 4
2.0x10⁴
1.3x10 3
1. 3x10 3
1.9x10 3
2.8x10 3
1.5x10³d
Aqueous Phase
Concentrations,M (mg/L)
CMPO TBP
3.0x10- 5 7.6x10' 4
(12) (200)
3.3x10- 5 9.1x10' 4
(13) (240)
2.0x10- 5 6.6x10' 4
(8.1) (180)
1.0x10- 5 4.3x10' 4
(4.1) (110)
1.5x10' 4 -
(61)
79x10-4d(210)
of normal aliphatic hydrocarbons with an average carbon chain length of 11.4.
0%4 -

65
E. Chemical and Radiolytic Degradation of TRUEX Process
Extractants and Solvent Cleanup
1. DHDECMP
Studies of the hydrolysis and radiolysis of DHDECMP and its analogueshave been reported by six groups of researchers: Schulz et al. [SCHULZ-1974,
-1975, -1977A, -1977B, "1982]; Mclsaac et al. [SCHULZ-1975, -1977A, -1977B,MCISAAC-1976, -1980, BAKER]; Shoun et al. [SHOUN, BAHNER-1981]; Katz and Bond
[KATZ]; Kazanjian and Killion [KAZANJIAN]; and Ganser [GANSER]. The consensusof these studies is that the stability of DHDECMP to both hydrolysis and radio-lysis is slightly less than that of TBP. (In a related study, Nowak et al.found another phosphonate, diamylamylphosphonate, to show considerablyless hydrolytic and radiolytic stability than TBP [NOWAK].) Hydrolysis andradiolysis are manifested in DHDECMP solutions as they are by TBP solutions:acidic products are formed, which do not allow the stripping of actinides andlanthanides by dilute nitric acid.
The most ambitious effort to study hydrolysis and radiolysis ofDHDECMP was performed by Bahner et al. [BAHNER-1981], who found a large varietyof hydrolysis/radiolysis products that showed attack of DHDECMP at both thephosphoryl and carbamoyl ends of the molecule. The formation of CO gas andfree amines during radiolysis points to a decarbonylation reaction as beingimportant. Acidic materials whose elemental analysis revealed the presence of
nitrogen were also present.
Although results of various studies show differences in degree,washing with 0.35-1.OM Na2 CO3 or NaOH solutions seems to remove a largeportion of these acidic degradation products.
2. 0$D[IB]CMPO
There i, very little experimental information on the radiolyticand hydrolytic decomposition of 0$D[IB]CMPO. The scant data that have beenobtained lead to the conclusion that the decomposition of the impuritiesassociated with O D[IB]CMPO may be of more importance than the decomposi-tion of the extractant itself. These impurities and their decompositionproducts, the problems they cause in the solvent extraction process, andmethods to remove them are discussed in detail below. The following isa prediction of hydrolytic and radiolytic stability of CMPO based onliterature analogies.
Two important differences exist between the chemical structures ofDHDECMP and O$D[IB]CMPO. The first is that the CMPO compound has threephosphorus-carbon bonds and the CMP compound has only one carbon-phosphorus
bond and two carbon-oxygen-phosphorus bonds (ester linkages). Carbon-phosphorus bonds are much stronger than phosphorus ester linkages and much moreresistant to nucleophilic attack of the phosphorus atom and subsequent hydro-lysis [KIRBY]. The Second important difference between O$D[IB]CMPO and DHDECMPis the inclusion of the aromatic group in the structure of OfD[IB]CMPO. It
has been generally accepted that dissolving an extractant, such as TBP, in an

66
aromatic diluent increases resistance of TBP to radiolytic damage [VANDEGRIFT].This is explained by the aromatic ring acting as an energy sink and thus
diminishing the effects of energy pulses of the incoming radiation. In a
report dealing with the radiation stability of materials used in nuclearplants [BRUCE], an approximate order of radiation stability for polymerswas given as:
substituted aromatics > aromatics > alkanes >
ethers > alcohols > esters > ketones.
Based on these facts, 0+D[IB]CMPO would be predicted to be a great
deal more resistant to radiolytic and hydrolytic damage than DHDECMP, espe-
cially at the phosphoryl end of the molecule. This aroma tic group may alsohelp to protect the carbamoyl group from radiolytic damage. The radiolysis of
the solvent modifier, TBP, should also be beneficially lowered by the presence
of O D[IB]CMPO.
Preliminary measurements of the radiation stability of CMPO indicatethat absorbed doses of 10 Wh/L cause only minor degradation. However, muchmore extensive studies will be required before definitive comparisons between
TRUEX and PUREX process solvents can be made. In all likelihood, radiolytic
degradation will parallel hydrolytic degradation, resulting in TBP degradation
products dominating the impurities in the TRUEX solvent.
Since the CMPO-TRUEX process solvent is essentially PUREX process
solvent modified by the addition of 8.15 wt % 0D[IB]CMPO, the usual radiolyticand hydrolytic degradation products that are produced in PUREX process opera-tion will also be produced in the TRUEX process. In addition, any degradation
products produced either from the 0$D[IB]CMPO itself or from its impurities
will also be present. The primary substances that have a deleterious effectin both PUREX and TRUEX process operations are acidic compounds. The presence
of acidic compounds in neutral extractants prevents efficient stripping withdilute aqueous HNO3 and frequently results in the formation of insolubleinterfacial crud with certain fission products, e.g., zirconium. A basic
difference between TBP and 0 D[IB]CMPO is in the type of acidic compounds
that can be produced from each of the two extractants by radiolytic and hydro-lytic processes. In the case of TBP, dialkyl- and monoalkylphosphoric acids
are produced, whereas with 0+D[IB]CMPO, dialkyl- and alkyl(phenyl)phosphinicacids* are the primary degradation products. In the case of 0D[IB]CMPO, theacidic compounds would be produced almost entirely from impurities rather than
directly from that extractant itself. (A carboxylic acid extractant fromO$D[IB]CMPO can be produced by hydrolysis of the amide moiety, but the resul-
tant acid is a very weak extractant of no consequence; furthermore, such acompound rapidly decarboxylates to a phosphine oxide, which also is of no
consequence to the performance of the TRUEX process.)
R 0
*These compounds have the general formula P , where R is an
R'NOH
aliphatic carbon chain and R' is an aliphatic carbon chain ora phenyl group.

67
It is important to note that alkylphosphoric acids are much morepowerful extractants than alkylphosphinic acids. In the case of the dioctylderivatives, DAm is 104 times greater for the phosphoric acid than for the
corresponding phosphinic acid [PEPPARD, MASON]. Since the TBP concentrationin TRUEX solvent is seven times higher than the CMPO concentration, the gener-ation of dialkylphosphoric acids from TBP is far more important than any degra-
dation products produced from CMPO. Because of their interfacial activity andthe low aqueous solubility of their sodium salts, however, high molecular
weight alkylphosphinic acids can interfere with phase separation and conven-
tional Na2 CO3 solvent cleanup processes.
Table V-13 lists the possible impurities in O$D[LB]CMPO, theirestimated concentrations, and potential hydrolysis products (if any).Only three compounds listed in Table V-13 appear to present any problem:diphenylphosphinic acid [0 2P(O)OH], octyl(phenyl)phosphinic acid[C 8H1 7($)P(O)OH], and dioctylphosphinic acid [(C8H17)2P(O)OH]. Thesethree phosphinic acids, or their sodium salts, are not appreciably soluble in
water and, thus, will likely not be efficiently removed by Na2 CO3 scrubbing.Furthermore, their sodium salts can cause emulsion problems, especially in
the case of (C8H1 7)2P(O)OH and C8H1 7(0)P(O)OH. The presence of(C8H1 7)2 P(O)OH and its precusor, dioctylphosphine oxide, can easily be
eliminated in the synthesis of OOD[IB]CMPO. Dioctylphosphine oxide can alsobe removed from OOD[IB]CMPO by crystallization from an unseeded hexane
solution of O$D[IB]CMPO. The concentration of dioctylphosphine oxide in thecommercial O$D[IB]CMPO used for the batch countercurrent experiment describedii Appendix B was %4% as determined by 31P nuclear magnetic resonance
(NMR).
All three of the phosphinic acids listed in Table V-13 can be removedfror. TRUEX process solvent by means of a macroporous strong base anion exchange
resin, such as Amberlyst" A-26 resin [SCHULZ-1971, -1972]. The CMPO-TRUEXprocess solvent is first equilibrated with 1M HNO3 and then with water to apH >2. This procedure ensures that the phosphinic acids are in the acidicform. In addition, dibutylphosphoric acid formed from hydrolysis of TBP isalso removed by the resin [SCHULZ-1971, -1972]. Although extensive tests on
used CMPO-TRUEX process solvent have not been performed, the use cf the anion
exchange method appears ideal for solvent cleanup. In principle, the currentlyemployed solvent cleanup procedures used for PUREX process solvent are appli-
cable to the TRUEX process solvent; however, the higher molecular weight of
the acidic degradation products arising from the bifunctional extractant mayreduce the efficiency of the sodium carbonate and hydroxide washes.
F. Potential Suppliers and Estimated Unit Prices of Extractants
Four potential suppliers of bulk quantities of DHDECMP and/or OD[IB]CMPOwere contacted for estimates of their ability to supply these extractants inthe quantities and purities needed for startup and solvent makeup during TRUEXoperation and for the cost per pound of the extractants at that supply level.
Listed in Table V-14 are these companies and the extractant(s) they arecurrently interested in supplying.

Table V-13. Possible Impurities in Crysi
Concentration,
Compound wt %
ClCH2C(O)N[CH 2CH(CH3)2 12 <0.1
HOCH2C(0)N[CH 2CH(CH3)212 <0.1
C2H50( )P(0)CH2C(0)N[CH2CH(CH 3)2] 2
HO($)P(0)CH2C(0)N[CH2CH(CH3)2 12
H( )P(0)OC2H5
*2P(0)OC2H5
*2P(0)oH
*P(0)(C8H1 7 )2
*2P(0)C8H1 7
C8H1 7( )P(o)H
(C8H1 7 )2P(o)H
0.6
Unknown
<0.1
<0.1
<0.1
<0.1
<0.1
0.3
0.25-4
tallized 0 D[IB]CMPO
Comments
Unreacted starting material.
Formed by hydrolysis ofC1CH2C(0)NLCH2CH(CH3)2]2.Neutral species that shouldeasily scrub out with base.
Result of incomplete Grignardreaction. Will hydrolyze toH0($)P(0)CH2C(0)N[CH2CH(CH 3)2]2
Should scrub out with base.
Unreacted starting material.Will hydrolyze to H($)P(0)OHbut should scrub out with base.
Impurity in H($)P(0)0C2H5. Willhydrolyze to *2 P(0)0H.
Neutral extractant of no conse-
quence.
Neutral extractant of no conse-quence.
Will oxidize to C 8H1 7($)P(0)OH.
Will oxidize to (C8H1 7)2P(0)OH.
OD

69
Table V-14. Potential Suppliers of DHDECMP and/or OD[IB]CMPOa
Supplier Extractant Comments
M&T Chemicals O$D[IB]CMPO Have prepared kg amounts of thisBio and Fine Chemicals compound using the synthesis of
Division Kaplan et al. and have testedRahway, NJ 07065 various means of purification.(201) 499-0200 Are testing other synthetic
routes.
Columbia Organic DHDECMP Have prepared impure ('50%)
Chemical Company, Inc. O D[IB]CMPO DHDECMP for years (formerly asCamden, SC 29020 Wateree Chem) and have developed
(800) 845-2202 a new synthesis route to prepare
86% material. This materialmust, however, still be purifiedfrom high boiling, acidic
materials.
Industrial Chemicals Group DHDECMP They had previously been con-Mobil Chemical Company tacted by Rocky Flats Plant toRichmond, VA 23261 produce DHDECMP for their opera-
(804) 798-4291 tion. Their interest has waned
because the potential marketdoes not appear large enough.
Geochem Minerals & DHDECMP Geochem has no experience inChemicals, Inc. 0$D[IB]CMPO manufacturing these extractants
Marysville, WA 98270 or in chemicals of this type.(206) 653-5661
aBray Oil Company, a past supplier of DHDECMP, was contacted by Rocky Flats
Plant (RFP) personnel about producing a 100-gal lot of DHDECMP. They werenot especially interested in doing this and quoted a price of 3-4 times
that of Columbia Organic Chemicals (personal communication wi hA. Muscatello, RFP).
Columbia Organic Chemical Company appears to be the most stable and reli-
able supplier of DHDECMP. This company has supplied this chemical for manyyears as a <50% technical grade material (as Wateree Chemical Company) andrecently developed an improved synthesis to prepare 86% material for a priceless than they were charging for the <50% grade chemical. This improved mat-
erial, however, still contains high molecular weight, acidic materials thatmust be removed to enable the use of dilute HNO3 strips of actinides andlanthanides. Columbia Organic is currently investigating means to further
purify the DHDECMP product so it is acceptable for TRUEX processing.
Columbia Organic is an expanding company that has progressed during itsforty years of existence from a supplier of industrial cleaners and solventsto a supplier and manufacturer of 'i4,500 cataloged chemicals; many thousandsmore have been supplied on a custom basis. Annual sales increased from
$775,000 in 1977 to $1.4 million in 1983 [COC].

70
M&T Chemicals appears to be the best source for a stable and reliablesupply of 0D[IB]CMPO. It has produced kilogram amounts of '95% pure materialby following the synthesis developed at ANL [KAPLAN]. Purified material canbe obtained by either high-vacuum distillation or by crystallization of theproduct from a paraffin solution. After testing these purification methodsin its laboratories, M&T believes crystallization is more practical for large-scale production.
Chemists at M&T are also studying the possibility of alternative synthesesthat will be more cost effective for industrial-scale production. Because M&Tproduces the requisite starting materials for synthesis of 0D[IB]CMPO, it isintensely interested in seeing markets open for use of this chemical.
M&T is a $270 million corporation wholly owned by Elf Aquitaine, a $17billion diversified oil, gas, and natural resource corporation headquarteredin Paris, France. Since 1941, the French government has owned greater than
50% of the shares of Elf Aquitaine, 67% since 1976. Elf Aquitaine was the23rd largest company in the world in terms of revenues and 14th in terms ofnet earnings at the end of 1980.
The methods and reagents for the synthesis of 0WD[IB]CMPO, the relativelysmall volume of its demand, and its chemical composition make this extractanta perfect product for M&T's Bio and Fine Chemicals Division, which accordingto M&T is "a pioneering developer and lending manufacturer of organometallic
chemicals and polymers based on tin, phosphorus, and other metals....With 30
years commercial experience, M&T is ' world leader in producing Grignard-derived chemicals [M&T]."
Both potential suppliers responded to L _.e degree to requests for pricing
information. According to COC, it is presently able to supply the first 100-gal lot of DHDECMP within 90 days of placement of the order and believes thatthe 90-day delivery time can be greatly shortened after the first batch ismade. This first batch would be priced at $400.00/gallon. This price will bereexamined and perhaps lowered after the first 100-gallon batch is prepared.
(This price does not include further purification steps to remove the acidic
impurities from the >86% material. These steps will certainly be necessary to
prepare a useful extractant and will significantly increase its unit price.)
M&T Chemicals is, at this time, still in the process of estimating thecosts of providing 0 D[IB]CMPO. Its initial estimate, based on synthesizingkilogram quantities of this material and studying various methods of purifyingit, was '$300/lb in 1000 lb lots of the >96% pure extractant. Because thepreparation and purification of this material are very labor intensive, therewould be a great saving in buying larger quantities; e.g., purchasing a 5,000-
10,000 lb lot would decrease the unit price by half. There would be no problemin supplying this extractant in greater amounts; M&T's production capacity is
very flexible.
G. Evaluation of Extractant Inventory and Loss
The extractant inventory is determined by how long the plant must be ableto operate without recycling the oranic phase. For purposes of this evalua-
tion, it is assumed that one needs enough solvent for 8 hours of operation

71
and that 107 L of aqueous feed are to be processed in 5 years at 72% plantefficiency. This gives a solvent volume, 1700 L, that is much more than the
minimum required solvent inventory, 4100 L for pulsed columns and ' 25 L forcentrifugal contactors. (The B Plant at the Rockwell Hanford Organization,originally designed for the bismuth phosphate process, is much larger than
required for the proposed TRUEX process and currently runs with a solvent
inventory of 15,000 L.) Extractant is lost because of both solubilitylosses and dispersed phase losses. Both TRUEX process extractants are
slightly soluble in aqueous solutions. This loss of dissolved extractantis the minimum possible value for extractant loss. Additional extractantlosses occur because fine droplets of organic phase are entrained in the
various aqueous effluents. For purposes of this evaluation, 0.04 vol % of
the organic phase is assumed to be entrained in each aqueous effluent. Itis expected that, during the course of process development, the range of
process conditions under which this low entrainment level could be maintained
would be determined.
The results, summarized in Table V-15, show that, although the inventorycost for DHDECMP is less than that for O*D[IB]CMPO, more DHDECMP is lostduring processing, making it less economically attractive than O$D[IB]CMPO.
Table V-15 shows the major cause of processing loss of OtD[IB]CMPO to beorganic phase droplets entrained in the aqueous phase. On a percentage basis,
the dispersion losses are 76% for O+D[IB]CMPO losses and 24% for DHDECMPlosses. Thus, there is an incentive in both cases, but especially for theO$D[IB]CMPO, which is more expensive, to reduce the volume fraction of organic
phase dispersed in the aqueous effluents.
H. Process Equipment for Solvent Extractin
Process equipment for solvent extraction falls into one of two classes,continuous (differential) contact equipment and stagewise contact equipment(mixer-settler) [TREYBAL]. For nuclear fuel reprocessing where reducedequipment size is important, continuous-contact equipment that activelyagitates the liquid-liquid dispersion has been very useful. Pulsed columns,
such as those in use at Hanford, represent a good example of agitatedcontinuous coitl:t equipment. Because of their compact size, centrifugalcontactors, which include both mixing and centrifugal-settling zones in eachstage, ha-: become a viable alternative to pulsed columns. This is especiallytrue for annular centrifugal contactors, for which a well-documented designbasis has been developed [BURRIS].
Pulsed columns and annular centrifugal contactors are compared inTable V-16. Both units can and have been adapted for remote maintenance, and
both units have been used as the extraction/scrub unit (A-Bank) of the PUREXprocess with many years of successful process operation. Compared with thecentrifugal contactor, the pulsed column has lower capital cost. However, themuch greater building height required for the pulsed column can result in an
overall lower cost for the centrifugal contactor when the cost of the unitplus the cost of the building are considered together.
For direct comparison of continuous-contact pulsed columns with stagewisecentrifugal contactors, one must know the relationship between the number ofextraction stages (ne) in the contactor and the number of transfer units

72
Table V-15. Evaluation of Extractant Lossa
DHDECMP O#D[IB]CMPO
Solubility in aqueous 200 10
phase, vppm
Volume of organic phase 16 8
that is extractant, %
Extractant dispersed in 64 32
aqueous phase, vppm
Aqueous effluent volume 2.0 1.8
per volume of aqueous
feed, volume fraction
Solvent inventory,b L 1,700 1,700
Extractant inventory, L 270 140
Extractant loss, L/yr 1,100 150
Estimated extractant 200 600cost, $/L
Cost of extractant 54,000 82,000inventory, $
Cost of lost extractant, 220,000 91,000$/yr
aBased on 107 L of aqueous feed being processed in5 years at 72% plant efficiency so that the aqueousfeed rate is 5.3 L/min when the plant is in operation.
Also based on 0.04 vol % of organic phase in theaqueous effluents. (The value of 0.04 vol % is anestimate based on observations that systems that per-form well usually have <C.1 vol % of organic phaseentrained in the aqueous effluent.)
bBased on having enough solvent inventory for 8 hours
of plant operation before reusing any solvent at asolvent feed rate of 3.53 L/min. Actual solventinventory in pulsed columns would be about 100 L;in annular centrifugal contactors, about 25 L.
(NTU) in the pulsed column. For the conditions encountered in the extractionsection with DSW and CAW feeds, i.e., dilute concentrations of metal ions, theequation given in footnote b of Table V-17 applies. Results for the four casesdiscussed in this report are shown in Table V-17. If the height of an equiva-lent theoretical stage (H.E.T.S.) is known for the pulsed column, then thenumber of extraction stages (ne) can be used directly to get the height ofthe extraction zone. Normally, NTU is used with the height of a transfer unit(HTU) to calculate the extraction zone height because H.E.T.S. varies more
widely with changes in operating conditions than does HTU.

73
Table V-16. Ccmparison of Pulsed Columns and AnnularCentrifugal Contactors for SolventExtraction
AnnularFavorable Operating Pulsed Centrifugal
Characteristics Columnsa Contactorsa
Low residence timeb - +
Stable operation with changing - +flows and flow ratiosc
Accommodation of all 0/A ratios - +
Good operation at reduce flows - +
Minimum floor space + -
Minimum vertical height - +
Minimum capital costd +
Easy to add more stages - +
Minimum energy use + -
Maintenance of concentration -gradient in the unit during
short periods of downtime
Easy to introduce or withdraw - +
side streams of liquid
Flow channeling not possible - +
aThe plus (+) or minus (-) designations shown here are rela-
tive weightings of pulsed columns with annular centrifugalcontactors. For example, while low residence time is betterfor annular centrifugal contactors than for pulsed columns,
it is better for pulsed columns than for either packedcolumns or gravity mixer-settlers.
bLow residence time reduces radiolysis of organic phase and
allows rapid startup and shutdown of the unit.
cFor stable operation as defined here, the number of the
stages in the unit should not change as flow rates and flowratios change. In addition, the extraction efficiency ofeach stage should remain high.
dFor a unit with a given throughput, the capital cost of the
annular centrifugal contactor may be about 2.5 times that ofthe pulsed column.

74
Table V-17. Number of Transfer Units (NTU) Required for AmericiumExtraction
0/A NumberFlow Distribution Extraction ofRati, Coefficient Factor Stagesa
Feed Extractant (R) (D) (RD) (ne) NTUb
DSW 0$D[IB]CMPO 0.5 12 6 7 15.1
CAW 0$D[IB]CMPO 0.5 14.4 7.2 6 13.8
DSWZ DHDECMP 0.5 4 2 14 19.4
CAW DHDECMP 0.5 4 2 14 19.4
aBased on an americium concentration in the aqueous raffinate suchthat the raffinate will have <lOOnCi/g of solidified raffinate asmetal oxides.
ne, RD = 1
bNTU = ne ln(RD)
1 - (1/RD) , RD #1
as given in [TREYBAL] is appropriate for the processing conditionsthat exist here.
cModified to a composition close to that of CAW by the addition
of Al(N03)3-
Table V-17 shows how either pulsed columns or annular centrifugalcontactors can be used to carry out the flowsheets shown in this report. Theextraction unit need only be designed with the appropriate number of transfer
units (NTU) or number of stages (Ne), respectively. As indicated byTable V-16, annular centrifugal contactors offer many advantages over pulsedcolumns for process flexibility and reliability, ease of operation, and shortresidence time. Thus, when buying new equipment, the purchase of annular
centrifugal contactors is recommended.
I. Process Safety
Because TRUEX process solvents are modified Purex solvents, safetyconcerns and practices for PUREX process operation are important also forTRUEX process operation. The major modification of PUREX process solvent inpreparing a TRUEX process solvent is, of course, the addition of eitherDHDECMP or O$D[IB]CMPO.
Because both compounds have low volatility and, therefore, are believedto have high flash points and because their solutions have estimated flashpoints above those of 30% TBP/NPH (see Table V-10), the only real safety con-cern in their use is toxicity. An Ames test has been performed on DHDECMP andbeen reported by Schroeder et al. [MCISAAC-1979, SCHROEDER-1980A]. A quotefrom SCHROEDER-1980A serves well in explaining the significance of this test:

75
The Toxic Substances Control Act (TSCA) has made thetoxicity of a compound an important physical property.Increased use by us and other researchers throughout thecountry initiated the mutagenic study as a first step indetermining the toxic properties of DHDECMP. Results ofthe mutagenic study, with and without the microsomaladdition, were negative for all strains of Salmonella.Since there is a 90% chance that compounds found mutagenicby the Ames test will cause malignant tumors [McCANN],the test indirectly screens for carcinogenicity. Cautionmust be taken from inferring too much from these tests.No single in vitro test is sufficient to clear or indicta compound. In addi ion, the test says nothing about thecompounds acute toxicity.
No such studies have been performed on 0 D[IB]CMPO.
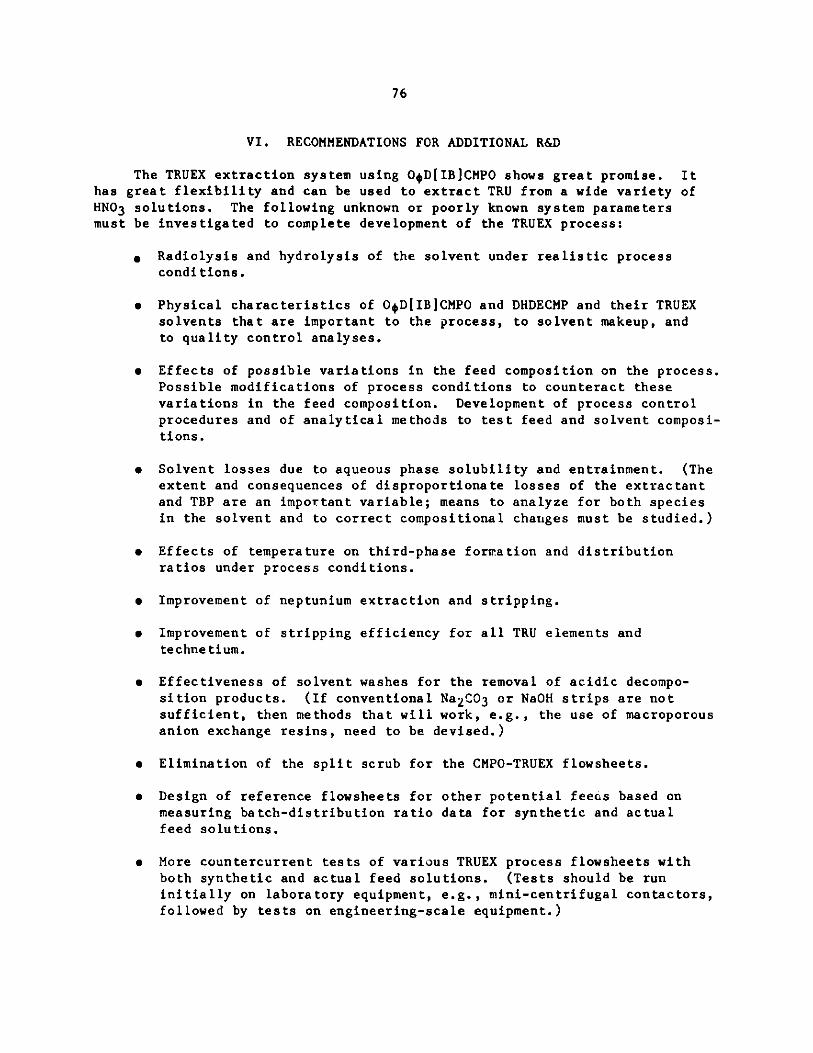
76
VI. RECOMMENDATIONS FOR ADDITIONAL R&D
The TRUEX extraction system using O D[IB]CMPO shows great promise. Ithas great flexibility and can be used to extract TRU from a wide variety ofHNO3 solutions. The following unknown or poorly known system parametersmust be investigated to complete development of the TRUEX process:
" Radiolysis and hydrolysis of the solvent under realistic processconditions.
" Physical characteristics of O0D[IB]CMPO and DHDECMP and their TRUEXsolvents that are important to the process, to solvent makeup, andto quality control analyses.
" Effects of possible variations in the feed composition on the process.
Possible modifications of process conditions to counteract thesevariations in the feed composition. Development of process controlprocedures and of analytical methods to test feed and solvent composi-tions.
" Solvent losses due to aqueous phase solubility and entrainment. (Theextent and consequences of disproportionate losses of the extractantand TBP are an important variable; means to analyze for both speciesin the solvent and to correct compositional changes must be studied.)
* Effects of temperature on third-phase formation and distributionratios under process conditions.
" Improvement of neptunium extraction and stripping.
" Improvement of stripping efficiency for all TRU elements and
technetium.
" Effectiveness of solvent washes for the removal of acidic decompo-sition products. (If conventional Na2 003 or NaOH strips are notsufficient, then methods that will work, e.g., the use of macroporousanion exchange resins, need to be devised.)
* Elimination of the split scrub for the CMPO-TRUEX flowsheets.
" Design of reference flowsheets for other potential feeos based onmeasuring batch-distribution ratio data for synthetic and actualfeed solutions.
" More countercurrent tests of various TRUEX process flowsheets withboth synthetic and actual feed solutions. (Tests should be runinitially on laboratory equipment, e.g., mini-centrifugal contactors,followed by tests on engineering-scale equipment.)

77
ACKNOWLEDGMENTS
The funding for developing conceptual flowsheets for TRU removal fromDSW and CAW was provided by Rockwell Hanford Operations. Rockwell Hanfordpersonnel who assisted us by providing information and guidance on CAW andDSW composition and o; typical plant-scale solvent extraction process param-eters are W. W. Schulz, R. A. Watrous, and J. D. Kaser.
The majority of the experimental data in the report was obtained underresearch funded to the Chemistry Division authors by DOE Basic EnergySciences.
The authors would like to acknowledge the help of P. R. Danesi,Chemistry Division, ANL, and R. Chiarizia, Chemistry Division, ENEA-Casaccia, Rome, Italy, in performing the laboratory batch countercurrentexperiments and the efforts of E. L. Callis, A. M. Essling, and E. A. Huff,Analytical Chemistry Laboratory, ANL, in providing analytical data at thefast pace required for this effort.

78
REFERENCES
BAHNER-1977C. T. Bahner, R. R. Shoun, W. J. McDowell, Impurities That Cause
Difficulty in Stripping Actinides from Commercial Tetraalkylcarba-moylmethylphosphonates, Oak Ridge National Laboratory, ORNL/TM-5878(1977).
BAHNER-1981C. T. Bahner, R. R. Shoun, and W. J. McDowell, Effects of Radiation,
Acid, and Base on the Extractant Dihexyl-[(Diethylcarbamoyl)methyl]-phosphonate, Oak Ridge National Laboratory, ORNL/TM-7494
(November 1981).
BAKERJ. D. Baker, L. D. Mclsaac, J. F. Krupa, D. H. Meikrantz, and
N. C. Schroeder, Experimental Mixer Settler Actinide Partitioning
from ICPP Acidic Wastes, Idaho Chemical Processing Plant, ICP-1181
Rev. (August 1979).
BRADLEYR. F. Bradley and A. J. Hill, Jr., Chemical Dissolving of Sludge
from a High Level Waste Tank at the Savannah River Plant, Savannah
River Laboratory, DP-1471 (November 1977).
BRUCE
M. B. Bruce and M. V. Davis, Radiation Effects on Organic Materials
in Nuclear Plants, Electric Power Research Institute, EPRI NP-2129
(November 1981).
BURRISL. Burris et al., Chemical Engineering Division Annual Technical Report,
1981, Argonne National Laboratory, ANL-82-23 (1982).
CHAMBERLAIN
D. B. Chamberlain, M. R. Maxey, L. D. Mclsaac, and G. J. McManus,Removal of Actinides from Nuclear Fuel Reprocessing Waste using an
Organophosphorus Extractant, Exxon Nuclear Idaho Company, Inc.,
ENICO-1053 (August 1980).
COCThis discussion is based on literature provided by Columbia Organic
Chemical Company.
EAGERNESSP. Fagerness and T. Elwood, work presented in Idaho Chemical Programs
Annual Technical Report Fiscal Year 1976, Idaho Chemical Processing
Plant, ICP-1102 (June 1977).
-A NSER?. Ganser, Analysis and Recovery Methods for Americium in the Nuclear
Fuel Cycle of a Pressurized Water Reactor, Kernforschungszentrum(arlsruhe, Federal Republic of Germany, KFK 3380 (1982).
79
GERMAINM. Germain and P. Pluot, Diluent Washing of Aqueous Phase UsingCentrifugal Contactors, Proc. Int. Solvent Extraction Conf., 80-218(September 1980).
HAGANP. G. Hagan and J. D. Navratil, Secondary Recovery of Plutonium andAmericium from Process Waste Streams by Solvent Extration, Rocky FlatsPlant, RFP-2708 (January 1978).
HOECHST
A. G. Hoechst, Flame-Retardant Finishing of Pile Carpeting, Ger.Offern. 2,825,818, January 11, 1979; Swiss Appl. 77/7,300, June 14, 1977.[Chemical Abstracts Reference 90:1390355]
HORWITZ-1983E. P. Horwitz, H. Diamond, and D. G. Kalina, CarbamoylmethylphosphoylDerivatives as Actinide Extractants, Their Significance in the Pro-
cessing and Recovery of Plutonium and Other Actinides, ACS Symp.Ser. 216 (Plutonium Chemistry), 433 (1983).
HORWITZ-1984E. P. Horwitz and D. G. Kalina, The Extraction of Am(III) from NitricAcid by Octyl(Phenyl)-N,N-DiisobutylcarbamoylmethylphosphineOxide-Tri-n-Butyl Phosphate Mixtures, Solv. Ext. Ion Exchange,
2, 179 (1984).
KAPLANL. Kaplan, G. W. Mason, and E. P. Horwitz, Preparation and Properties of
n-Octyl(Phenyl)-N,N-Diisobutylcarbamoylmethylphosphine Oxide(0 D[IB]CMPO), Internal Report, Chemistry Division, Argonne NationalLaboratory (August 1983).
KATZS. Katz and W. D. Bond, A Method of Estimating Distribution Coefficientsof Degradation Products from Organophosphorus Extractants, Oak Ridge
National Laboratory, ORNL/TM-6776 (May 1979).
KAZANJIANA. R. Kazanjian and M. E. Killion, Radiation Stability and AcidHydrolysis of DHDECMP, Chemistry Research and Development AnnualProgress Report, November 1, 1980 to September 30, 1981, Rocky FlatsPlant, RFP-3324, p. 14 (August 1982).
KIRBYA. J. Kirby and S. G. Warren, The Organic Chemistry of Phosphorus,Elsevier Publishing Company, New York (1967).
M&TThis discussion is based on literature provided by M&T ChemicalCompany.

80
MASONG. W. Mason, D. N. Metta, and D. F. Peppard, The Extraction of SelectedM(III) Metals by Bis 2-ethylhexylphosphoric Acid in n-Heptane, J. Inorg.Nucl. Chem. 38, 2077 (1976).
McCANNJ. McCann, Mutagenesis, Carcinogenesis, and the Salmonella Test, Chem.
Tec. 682 (November 1976).
MCISAAC-1976L. D. Mclsaac, J. D. Baker, and J. W. Tkachyk, "Actinide Removal from
ICPP Wastes," in Idaho Chemical Programs Annual Technical Report FiscalYear 1975, Idaho Chemical Processing Plant, ICP-1086, p. 100 (June 1976).
MCISAAC-1979L. D. Mclsaac, J. D. Baker, J. F. Krupa, R. E. LaPointe, D. H. Meikrantz,
and N. C. Schroeder, Study of Bidentate Compounds for Separation ofActinides from Commercial LWR Reprocessing Wastes, Idaho ChemicalProcessing Plant, ICP-1180 (May 1979)
MCISAAC-1980L. D. Mclsaac, J. D. Baker, J. F. Krupa, D. H. Meikrantz, and
N. C. Schroeder, Flowsheet Development Work at the Idaho ChemicalProcessing Plant for the Partitioning of Actinides from Acidic Nuclear
Waste, ACS Symp. Ser. 117 (Actinide Separations), 395 (1980).
MCISAAC-1981L. D. Mclsaac, J. F. Krupa, and N. C. Schroeder, Purifying Bidentate
Organophosphorus Compounds, U.S. Patent 4276235, June 30, 1981
(Chemical Abstracts, 95:133161)
MUSCATELLOPersonal communications between Anthony Muscatello (Rocky Flats Plant)and authors of this report in February and March, 1984.
NAVRATILJ. D. Navratil, Secondary Americium and Plutonium Recovery at Rocky
Flats, presented at Conf. of Actinide Recovery from Acidic Wastes,Rocky Flats Plant, Golden, CO, May 4-5, 1976.
NOWAKZ. Nowak, M. Nowak, and A. Seydel, Examination of the RadiolyticStability of DiAmyl-Amyl-Phosphonate-Dodecane-Nitric Acid System,Radiochem. Radioanal. Lett. 55, 337 (1982).
PEPPARDD. F. Peppard, G. W. Mason, and S. Lewey, Di-n-octylphosphinic Acidas a Selective Extractant for Metallic Cations, J. Inorg. Nucl. Chem.27, 2065 (1965).
RASMUSSEN0. R. Rasmussen, Hanford Radioactive Tank Cleanout and SludgeProcessing, Rockwell Hanford Operations, RHO-ST-30 (March 1980).

81
SCHROEDER-1980AN. C. Schroeder, L. D. Mclsaac, D. H. Meikrantz, J. F. Krupa, andJ. D. Baker, Purification and Properties of Dihexyl N,N-diethyl-carbamoylmethylenephosphonate, J. Inorg. Nucl. Chem. 42, 1029(1980).
SCHROEDER-1980BN. C. Schroeder, L. D. Mclsaac, and J. F. Krupa, Purification andProperties of Dihexyl N,N-diethylcarb.moylmethylenephosphonate,by Mercury (II) Precipitation, Exxon Nuclear Idaho Company, Inc.,
ENICO-1026 (January, 1980).
SCHULZ-1971W. W. Schulz, Macroreticuler Ion-Exchange Resin Cleanup of PurexProcess TBP Solvent, Proc. Int. Solvent Extraction Conf., Vol. I,Society of Chemical Industry, London, p. 174 (1971).
SCHULZ-1972W. W. Schulz, Macroreticular Anion Exchange Cleanup of TBP Solvent,
Atlantic Richfield Hanford Co., ARH-SA-129 (May 1972).
SCHULZ-1974W. W. Schulz, Bidentate Organophosphorus Extraction of Americiumand Plutonium, Atlantic Richfield Hanford Co., ARH-SA-203 (September
1974).
SCHULZ-1975W. W. Schulz and L. D. Mclsaac, Removal of Actinides from Nuclear FuelReprocessing Waste Solutions with Bidentate Organophosphorus Extractants,
Atlantic Richfield Hanford Co., ARH-SA-217 (August 1975).
SCHULZ-1977AW. W. Schulz and L. D. Mclsaac, Bidentate Organophorus Extractants:
Purification, Properties and Applications to Removal of Actinides fromAcidic Waste Solutions, Atlantic Richfield Hanford Co., ARH-SA-263(May 1977).
SCHULZ-1977BW. W. Schulz and L. D. Mclsaac, Bidentate Organophosphorus Extractants:Purification, Properties and Applications to Removal of Actinides fromAcidic Waste Solutions, Proc. of Int. Solvent Extraction Conf.,Toronto, Canada, p. 619 (1977).
SCHULZ-1982W. W. Schulz and J. D. Navratil, Solvent Extraction with NeutralBidentate Organophosphorus Reagents, Chapter 2, Recent Developments
in Separation Science, Vol. VII, N. N. Li, ed., CRC Press, Inc.,Boca Raton, FL (1982).
SHOUNR. R. Shoun, W. J. McDowell, and B. Weaver, Bidentate Organophosphorus
Compounds as Extractants from Acidic Waste Solutions: A Comparativeand Systematic Study, Proc. of Int. Solvent Extraction Conf.,
Toronto, Canada, p. 101 (1977).

82
SRL-1976Savannah River Laboratory Quarterly Report, Waste Management,April-June 1976, Savannah River Laboratory, DPST-76-125-2
(October 1976).
SRL-1978Savannah River Laboratory Quarterly Report, Waste Management,January-March 1978, Savannah River Laboratory, DPST-78-125-1.
TREYBAL
R. E. Treybal, Liquid Extraction, 2nd ed., McGraw-Hill Book Co.,New York (1963).
VANDEGRIFTG. F. Vandegrift, "Diluents for TBP Extraction Systems," Chapter 4 inThe Science and Technology of Tributyl Phosphate, Vol. I, W. W. Schulzand J. D. Navratil, ed., CRC Press, Inc., Boca Raton, FL, to bepublished, summer 1984.

83
APPENDIX A.
TRUEX FLOWSHEET CALCULATIONS
Calculations for a TRUEX flowsheet with up to 42 metallic constituents
required an overview of the process in order to determine which constituents
had to be calculated in detail. The overview process is presented first.
Then the various computational procedures are reviewed as to their relative
advantages and disadvantages. Finally, the order in which the calculations
were made is discussed.
1. Overview
An overview of the process can be gained by looking at the extraction
factor for -ach constituent in each section of the equipment. (A section con-sists of all the stages between adjacent external feed points in an extraction
unit.) The extraction factor is given by RD (the product, R x D), where R is
the O/A flow ratio in the section and D is the distribution coefficient (or
distribution ratio as it is referred to in other sections of the text) for the
element in that section. Because no liquid is added or withdrawn within the
section, R will be constant; D will normally be unchanged within a section.
Thus, the extraction factor will be usually be the same for each stage in the
section. When the extraction factor is greater than 1, more of the element
leaves a stage in the organic phase than in the aqueous phase. When the
extraction factor is less than 1, more of the element leaves a stage in the
aqueous phase than in the organic phase. When the extraction factor is 1,element leaving a stage is equally distributed between the two phases. It isassumed the two phases are equilibrated when they leave a stage.
For an extraction/scrub unit, the metal ions to be separated are in
the aqueous feed which enters the unit between the extraction and scrub sec-
tions. If RD is greater than one for both sections (Regime I), the element
is concentrated in the organic phase and is carried out in the organic product.
If RD is 1 for the extraction section but greater than 1 for the scrub section
(Regime II), most of the element (90% to 95%) will be in the organic product.
For this regime, the more extraction stages there are, the higher will be the
concentration of this element in the organic product. If RD is less than 1
for one section and greater than 1 for the other section (Regime III), then
the element will be split between the two effluents without any particular
separation of the element. One normally tries to avoid this regime. For
typical Regime III operation, the distribution coefficient does not change
much between the extraction and scrub sections so that the extraction factor
for the extraction section is less than 1 (Regime III-A). If an elementencounters Regime III-A operation, both the extraction and scrub sections
move the elementt away from the feed stage and discharge the element with theaqueous and organic effluents, respectively. For some special Regime III
operations, the distribution coefficient can be much lower in the scrubsection than in the extraction section so that the extraction factor for thescrub section is less than 1 (Regime III-B). If an element encounters RegimeIII-B operation, both the extraction and scrub sections retard the movementof the element away from the feed stage. This creates a very high concentra-tion of the element at the feed stage, which can overload the organic phaseand prevent the desired process separations from occurring. For this reason,Regime III-B is to be avoided in any process design. If RD is 1 for the scrubsection but less than 1 for the extraction section (Regime IV), most of the

84
element (90% to 95%) will be in the aqueous raffinate. For this regime, themore scrub stages there are, the higher will be the concentration of this
element in the aqueous raffinate. If RD is less than 1 for both sections
(Regime V), the element remains in the aqueous phase and is carried out in
the aqueous raffinate.
For a stripping unit, the metal ions to be stripped are in the
organic feed. For the TRUEX process, the organic feed will be the organicproduct from the extraction/scrub unit. If an -lement has an RD greater than1, it will remain in the organic phase. If the element has an RD less than 1,it will be stripped into the aqueous phase and come out in the aqueous efflu-ent. The smaller the value of RD, the fewer the number of stripping stages
that will be required to achieve a given level of decontamination.
This extraction factor analysis was used to derive an overview of
the extraction/scrub flowsheets. The results of this analysis are given in
Table A-1. For the 0*D[IB]CHPO extractant, the distribution coefficients for
DSW and CAW are not that different; this allows the metal ion regime for both
flowsheets to be listed in a single column. Note that separation works well
with all the actinides, lanthanides, technetium, and most of the yttrium in
the organic product, as well as all the other fission product ions including
most of the palladium and ruthenium in the aqueous raffinate. There are no
elements split between the effluents, i.e., in Regime III. To get this sep-
aration, the 0/A flow ratio in the extraction section (Re) must be 0.5. For
the DHDECMP extractant, the distribution coefficients for MDSW and CAW are
almost i tical; this allows the metal ion regime for both flowsheets to be
listed in a single column for a given Re value. It was first thought that a
Re value of 1.5 should be used so that DHDECMP and 0 D[IB]CMPO could be com-
pared at the same extraction factor. A review of Table A-1 shows that this
puts technetium in Regime III-B, which is unacceptable. To eliminate all
elements from Regime III, Re was decreased to 0.5. This puts Tc in the
aqueous raffinate when it is preferred to have Tc in the organic product.
Technetium in the aqueous raffinate is a trade-off that one must make when
using DHDECMP.
In the extraction factor analysis shown on Table A-1, the Ru is
listed in Regime IV because we expect about 90% of it to appear in the
aqueous effluent. A more accurate picture may be that two Ru species are
present, most in Regime V and the rest in Regime I. Thus, Ru could appear
to be a Regime IV element based on the overall separation but actually be
something more complex. Palladium may also form two species with different
distribution coefficients. The organic phase component doing the extracting
in these cases would be the TBP.
2. Calculations*
Because many appropriate equations are available in the published
literature [ALDERS, HAAS, LAWROSKI, and TREYBAL] and others have been developedhere for computer calculations of flowsheet stream compositions, the use of
computer simulation was studied. However, these equations become more diffi-
cult to use when the distribution coefficient varies from stage to stage, as
it does with some constituents in the TRUEX process. When it appeared that a
*Symbols are defined in Section 4 of this appendix.

Table A-1. Application of Extraction Factor Analysis to the Elements in the DSW or
with CMPO- or CMP-TRUEX Process SolventsCAW Solutions
Metal Ion Regimeb
RDa for DSW or CAW MDSW or CAW MSDW or CAW
Extraction and Location of with CMPO-TRUEX; with CMP-TRUEX; with CMP-TRUEX;
Regime Scrub Sections Metal Ions Re = 0.5, Rs = 2 Re = 1.5, Rs = 4.0 Re = 0.5, Rs = 2
I Both greater Essentially all in All actinides, All actinides, All actinides,
than one organic effluent all lanthanides, all lanthanides, all lanthanides
Tc Y except Gd, Y
II Factor at one Most (C.90%) in Y Pd Gd
for extraction, organic effluent
greater than
one for scrub
III One factor less Split between None Tc None
than one, the the effluents
other greater
than onec
IV Factor at one Most ("90%) in Pd, Ru Ru Pd, Tc
for scrub, less aqueous effluentthan cna forextraction
V Both less than Essentially all in All other All other All otner
one aqueous effluent metal ions metal ions metal ions
aExtraction factor for an element is given by multiplying the O/A flow ratio (R) in a section by the
distribution coefficient (D) for that element throughout the section.
bRe is the 0/A flow ratio in the extraction section; RS is the 0/A flow ratio in
MDSW is DSW modified by the addition of aluminum as given in Table IV-1.th 2 scrub section;
cTypically, the factor for the extraction section is less than one; and the factor for the scrub section
is greater than one (Regime III-A). If this situation is reversed (Regime III-B), as it is for the Tc
listed in this row, the Tc will have a difficult time getting out of the extraction unit and its
concentration in the unit will become excessive, probably overloading the capacity of the extractant.

86
split scrub would be required, this procedure was abandoned because the
equations were too cumbersome. However, two of the equations were used to
estimate the number of stages needed in the extraction and stripping sections.
For an extraction section with ne stages and a feed concentration of xf, theaqueous raffinate concentration of xw is given by
(ReD - 1)x = x (A-1)w f [(ReD)ne+l - 1]
if ReD is greater than 1 and the concentration in the organic feed is essen-
tially zero for the element. For the extraction section, the larger the
extraction factor, the fewer the stages that will be required to achieve a
given decontamination factor. For a stripping unit with nst stages and an
organic feed concentration of yf, the organic raffinate concentration of y,
is given by
[(RstDY- - 1]
y = yf -(nst+l) -11(A-2)
[(RstD) -1
if RstD is less than 1 and the concentration in the aqueous feed is essen-
tially zero for the element. For the stripping unit, the smaller the extrac-
tion factor, the fewer the stages that will be required to achieve a given
level of stripping.
The McCabe-Thiele method, which is described in detail elsewhere[HAAS, LAWROSKI, and TREYBAL], was used to complete the calculations for the
flowsheets. With this graphical method, it is easy to (1) evaluate elements
even though their distribution coefficients vary from stage to stage; (2)
calculate the effect of two scrub sections (a split scrub) in the extraction/
scrub unit; and (3) determine whether more stages in a section would improve
a separation or have very little effect. The McCabe-Thiele method gives theelement concentrations at steady-state conditions.
The two countercurrent laboratory runs reported in Appendix B involveCMPO-TRUEX solvent extraction of TRU from DSW. For these runs, it was impor-
tant to know how fast the aqueous raffinate concentration would approach a
steady-state value. The runs were labor-intensive and the amount of feed
material was limited, yet enough test steps were needed to show clearly that
the americium in the raffinate had attained a steady-state concentration that
was low enough to make it a non-TRU waste. Since the McCabe-Thiele method
works only for steady-state operation, it could not be used here. Complex
computer programs could be used to make the calculations, but too much time
would be required to bring such a program on-line, and, even then, extensive
changes would be required to replace the uranium and plutonium data with the
appropriate americium distribution coefficients. An alternative method todetermine the approach of the raffinate to a steady-state concentration is the
use of step-by-step calculations, as shown by ALDERS and TREYBAL. This calcu-lation is normally tedious; however, it was found that, by use of electronic
spreadsheets, the computation is greatly simplified. Using the DIGICALC elec-tronic spreadsheet (WHY Systems, Inc., Redmond, WA), the rate at which the

87
americium concentration in the aqueous raffinate approached its steady-state
value was calculated. These calculations give the concentration for each step*
and each stage of the run, as well as the steady-state concentration at each
stage. Besides giving steady-state concentrations, the alternative calcula-
tional method also has other features of the McCabe-Thiele method; e.g., dif-
ferent distribution coefficients can be used for each stage and two scrub
sections can be evaluated for an extraction/ scrub unit. Because the elec-
tronic spreadsheet does not have the graphical style of the McCabe-Thiele
method, it does not show process constraints as clearly. Overall, the elec-
tronic spreadsheet works well and will be used for the detailed calculations
in future flowsheet work.
3. Order of Calculations
In the order of calculations, the number of extraction stages was
calculated first. This was done by using the decontamination factor for Am in
the extraction section and Eq. A-1. Then, knowing the number of stages, one
may calculate the nitric acid concentration at each stage by the McCabe-Thiele
method. This method is then used to refine the Am calculation; this is neces-
sary because the distribution coefficient for Am depends on the nitric acid
concentration. In general, if an element was dependent on the concentration
of some other element, the latter was calculated first. Not all elements were
evaluated in detail by the McCabe-Thiele method. Evaluated in detail were
(1) americium, (2) those elements which appear in Regimes II, III, and IV in
Table A-1, (3) those key elements in Regime I whose extraction factors put
them closest to Regime II, and (4) those key elements in Regime V whose
extraction factors put them closest to Regime IV. Each key element in Regime I
is concentrated almost entirely in the organic product of the extraction/scrub
unit with a very low concentration in the aqueous raffinate. The other ele-
ments of Regime I have even lower concentrations; thus, in most cases, detailed
calculations were not made. This is noted on the flowsheet tables by showing
that the element has an aqueous-raffinate concentration less than the appro-
priate key element. Each key element in Regime V is concentrated almost
entirely in the aqueous raffinate of the extraction/scrub unit with a very low
concentration in the organic product. Because the other elements of Regime V
have even lower concentrations, detailed calculations were not made in most
cases. This is noted on the flowsheet tables by the element having an organic-
product concentration less than the appropriate key element.
4. Nomenclature
A Aqueous phase.
D Ratio of the equilibrium concentration in the organicphase and that in the aqueous phase.
ne Number of extraction stages.
nst Number of stripping stages.
0 Organic phase.
*That is, each liquid-liquid equilibration in a stage; thus a "step"corresponds to one residence time in a stage.

88
R Organic-to-aqueous (0/A) flow ratio.
Re R for extraction section.
Rs R for scrub section.
Rst R for stripping unit.
Xf Concentration of an element in the aqueous feedto the extraction section, M.
xw Concentration of an element in the aqueousraffinate from the extraction section, M.
yf Concentration of an element in the organic feedto the stripping unit, M.
yw Concentration of an element in the organicraffinate from the stripping unit, M.
REFERENCES
ALDERSL. Alders, Liquid-Liquid Extraction, 2nd ed., Elsevier Science Publishers,New York (1959).
HAASW. 0. Haas, "Solvent Extraction: General Principles," Chapter IVin Chemical Processing of Reactor Fuels, J. F. Flagg, ed., AcademicPress, New York, pp. 125-198 (1961).
LAWROSKIS. Lawroski, L. Burris, and W. A. Rodgers, "Chemistry and ChemicalEngineering," Se'c. 11 in Nuclear Engineering Handbook, H. Etherington,
ed., McGraw-Hill Book Co., New York (1958).
TREYBALR. E. Treybal, Liquid Extraction, 2nd ed., McGraw-Hill Book Co.,New York (1963).

89
APPENDIX B.
COUNTERCURRENT TESTS OF TRUEX PROCESS FLOWSHEETS--EXPERIMENTAL DETAILS
1. The Synthetic DSW Solution
a. Introduction
The relative concentrations of chemical species in DSW are basedon (1) the composition of CAW, (2) the chemistries of ions in acidic solutionas the pH is greatly increased by hydroxide addition, and (3) actual measure-ments of the concentrations of some species in Hanford PUREX sludges. Theconcentrations of species were set by postulating that the sludge could bedissolved in the same volume that it precip;tated out of; in other words,species such as lanthinides and actinides, which precipitate quantitivelyfrom CAW, would have the same concentration in DSW that they have in CAW.
Technetium (as 99 TcO4-), although not expected to precipitateby hydroxide addition in CAW, was added to the synthetic DSW to further studyits TRUEX solvent extraction chemistry. The low concentration of technetiumwould negate its effect on the extraction behavior of any other species.
The oxalate concentratici in the feed stage was chosen to be0.3M. The DSW stock solution, however, was prepared with a lower oxalic acidconcentration (0.05M). The addition of oxalic acid at this stage was madeprimarily to facilitate the dissolution of zirconium nitrate in the waste bydissolving the oxalic acid and Zr(N03) 4 together in a small volume of water.
b. Preparation of Feed
Tables B-1 through B-3 show the calculates and analyticallymeasured composition of the synthetic DSW. Most elements were measured by
inductively coupled plasma/atomic emission spectroscopy (ICP/AES) analysis;
in the case of 99 Tc and the TRU elements, measurements were made by radio-metric analysis. In Table B-1, the concentration of oxalic acid listed withthe non-fission product species is that of the final feed composition.
Two solutions, with differing neptunium concentrations, arelisted in Table B-3. Solution 1 was used for the DSW feed in the counter-current experiment (to be discussed in detail below). Solution 2 was usedfor an ancillary countercurrent experiment, which was run to test the effectof neptunium's concentration on its extractability. The rationale and resultsof this study are discussed in Section IV.B.
The americium concentration in the simulated DSW is more thanan order of magnitude less than projected to be typical in DSW. The concen-
tration of americium that we chose was based on having enough activity tomeasure the requisite decontamination of Am to produce a raffinate waste con-taining less than the 100 nCi/g TRU. Because the concentration of americiumin actual DSW is projected to be small in comparison to the concentrations ofthe lanthanides that extract along with it, the concentration of Am has nomeasurable effect on solvent loading.

90
Table B-1. Composition of the Synthetic DSW:Nonfission Products
Concentration, M
Added Founda,b
HNO3 1.0 NA
Na 0.15 NA
Mg 0.0016 0.0017
Al 0.046 0.045
Ca 0.0014 0.0014
Cr 0.014 0.013
Mn 0.0045 0.0047
Fe 0.15 0.15
Ni 0.0080 0.0086
Cu 0.0018 0.0019
F~ 0.008 NA
SO42- 0.012 NA
H2C204 0.30 NA
NOc 0.005 NA
aNA means not analyzed.
bThe ICP/AES analyses have a 3-10% error range;
the magnitude of the error is a function of the
element's concentration and the degree of inter-
ference from other elements.
cOn addition of solid NaNO2 to the feed, some
reddish-brown gas (likely NOX) was released.
The simulated DSW stock solution was prepared as follows:
(1) Oxalic acid, Zr(N03)4, and Mo(VI) solution were mixedtogether with some additional water to form a solution.
(2) All the other solid reagents were mixed together and
dissolved in water.
(3) All other volumes of standard solutions were mixed
together.
(4) The solutions from (2) and (3) were combined and the
proper amount of nitric acid was added to the mixture. (The amount of con-
centrated HNO3 was calculated by considering all the acid that had been addedto the solution from the standard solutions.)
(5)
resultant solutiondissolution of all
Solution (1) was then combined with the rest, and thewas brought to volume and warmed to 40-50 C to assurespecies.

91
Table B-2. Composition of Synthetic DSW Solution:Fission Products
Concentration, MAdded Founda
Se
Sr
Y
Zr
Mo
Tc
Ru
Rh
Pd
Ag
Cd
Te
Ba
La
Ce
Pr
Nd
Sm
Eu
Gd
9.5 x 10⁻⁵
1.4 x 10⁻³
7.3 x 10- 4
5.6 x 10⁻³
1.8 x 10⁻⁴
1.0 x 10⁻⁵
2.1 x 10⁻³
5.7 x 10~4
5.4 x 10~4
3.6 x 10⁻⁵
5.0 x 10⁻⁵
3.3 x 10⁻⁴
1.1 x 10⁻³
1.0
2.4
9.2
2.7
3.9
4.8
1.2
x 10- 3
x 10-3
x 10-4
x 10-3
x 10-4
x 10-5
x 10-5
<1.6 x
1.4 x
7.0 x
6.2 x
1.6 x
9.6 x
2.0 x
5.7 x
6.6 x
3.0 x
4.4 x
3.3 x
2.1 x
9.5 x
2.3 x
8.6 x
2.6 x
3.8 x
4.9 x
NA
10-4b
10-3
10- 4
10- 3
10-4
10-6c
i0- 3
10- 4
10-4
10-5
10-5
10-4
10-4d
10-4
10- 3
10-4
10-3
10-4
10-5
e
aThe ICP/AES analyses have amagnitude of the error is a
3-10% error range; thefunction of the element's
concentration and the degree of interference fromother elements.
bThe amount added to solution was below its ICP/AESdetectability.
cBased on radiochemical analysis of 9 9 Tc.
dThe low concentration of Ba ion is due to itsprecipitation as BaSO4 .
eNA means not analyzed.

92
Table B-3. Composition of Synthetic DSWFeed Solutions: Actinides
Conc.,M
Activity,dpm/L
SOLUTION 1
238U
2 3 7 Np- 2 3 9 Np5
241A
SOLUTION 2
2 3 8 U
2 3 7 Np-2 3 9 Np
241Am
1 x 10⁻⁴
1.0 x 10⁻⁶
1.6 x 10⁻⁶
7.0 x 10⁻⁶
1 x 10⁻⁴
2 x 10⁻⁴
1.6 x 10⁻⁶
7.0 x 10⁻⁶
2 x 10⁴
9 x 10 8b
3.3 x 10⁶
1.3 x 10¹⁰
2 x 10⁴
9 x 10⁸b
3.3 x 10⁶
1.3 x 10¹⁰
aThe bulk of the Np2 3 7 Np; the bulk ofsupplied by 23 9Np.
concentration was asits radioactivity was
bActivity level at the start of the experi-ment; the short half-life of 2 3 9 Np(2.35 days) was corrected to the same timefor comparison of all counts.
(6) On cooling, a small amount of precipitate was visible onthe bottom of the beaker and it was removed by filtering the solution througha medium glass frit. (Analysis of this solid showed it to contain Ba and alesser amount of Ag; this result explains the lower than added concentrationsof these species in the synthetic DSW solution.)
(7) Three days before the start of the countercurrent run,sodium nitrite was added to two one-liter portions of the synthetic DSW,making them 5 x 10⁻³M in nitrite. Uranium was added to the liter of solutionto be used for the non-active countercurrent experiment, and the actinides andTc mixture was added to the other liter of DSW.
Tables B-4 and B-5 are a list of ingredients for preparing fourliters of simulated, nonradioactive DOW.*
*This method was chosen based on the chemicals and solutions that wereon hand.
_

93
Table B-4. Solid Additions in Preparation of FourSynthetic DSW Solution
Amount Other Species
Species Form of Amount for 4 L, Added, Added inAdded Addition g g Conjunction
Na+ NaNO3
Fe(N03)3
- 9H20
Mg(N03)2- 4H20
Al(N03)3
- 9H2 0
Ca(N03)2
- 4H20
Cr(N03 )3
- 9H20
Fe3 +
Mg2 +
A13+
Ca2 +
Cr3 +
Mn2 +
Ni2 +
Cu2 +
MnSO4- H20
Ni(N03)2
- 6H20
Cu(N03) 2
- 3H20
NaF
SO42-
C2 -a2 4
Zr4 +
Ru(NO) 3+
Ba2 +
Na2SO4
H2C204
- 2H20
Zr(N03 )4
- 5H20
Ru(NO)
(NO3) 3
Ba(N03)2
43.18
242.2
1.64
69.03
1.28
21.61
3.04
9.31
1.69
1.34
4.26
25.22
7.10
2.66
1.15
43.19
242.25
1.64
69.04
1.28
21.63
3.04
9.32
1.69
1.34
4.26
25.25
2.67
1.15
NO3
NO3
NO3
NO3
NO3
NO3
SO4 2-
NO3
NO3
Na+
Na+
NO3
NO3
NO3
Sr2+ Sr(NO3) 2 1.18 1.18 N03
aA single addition to make the solution 0.05M and help in dissolving Zr.
bBecause an ICP/AES analysis of a solution of this salt showed a lowerconcentration than this formula weight allows, greater amounts of thismaterial were added than was calculated from the molecular weight ofZr(N0 3 ) 4 -5H 20. This weight corresponds to that difference.
Liters of

94
Table B-5. Liquid Additions in Preparation of Four Liters of SyntheticDSW Solution
Means ofaReaching Other Species
Species Form of Amount for 4 L, Volume, Added inAdded Addition mL mL Conjunction
Cd2+ 0.0120M 16.7 4(4.17) NO3(1.35 g Cd/L)Cd(N03)2solution
Mo(VI) 0.0103M 70.0 70 mL Na+Na2Mo04-2H20
y3+ 0.0843M 34.6 7(4.94) H+, NO3Y3+ solution
in 0.2M HNO3
Rh3+ 0.885M 2.58 2.58 H+, NO3(91.1 g Rh/L)solution in
3M HN0 3
Pd2+ 0.118M (12.6 g 18.2 4(4.55) H+, NO3
Pd/L) solutionof Pd(N03)2 in
5.4M HNO3
Ag+ 1M AgNO3 0.144 0.144 NO3solution
La3+ 0.144M 27.8 6(4.63) H+, NO3solution in
0.02M HNO3
Ce3+ 0.265M 36.2 8(4.53) H+, NO3solution in0.25M HNO3
Pr3+ 0.130M 28.3 6(4.72) H+, NO3solution in
0.07M HNO3
Nd3+ 0.384M 28.1 6(4.68) d+, NO3solution in0.02N HNO3
(contd)

95
Table B-5. (contd)
Means ofaReaching Other Species
Species Form of Amount for 4 L, Volume, Added inAdded Addition mL mL Conjunction
Sm3+ 0.0872M 17.9 2(5) + H+, NO3solution in 2(3.85)0.1M HNO3
Eu3+ 0.0168M 11.4 2(5) H+, NO3solution in + 2(0.7)
0.O1M HNO3
Gd3+ 0.0113M 4.25 4.25 H+, NO3solution in0.01M HNO3
2-Se04 0.8 g Se/L 37.5 38.0 H+, NO3
solution in0.005M HNO3
Te(OH)6 0.0345M 37.5 38.0 H+, NO3solution in
3M HNO3
HNO3 15.6M 241.0 2(100) -solution + 41
aFor greater accuracy and ease, multiple volumes were made with
a 0-5000 UL Pipetmanm variable volume pipette. For example, 4(4.17)
signifies 4 separate 4.17 mL aliquots.
2. Experimental Description
a. Apparatus
The countercurrent experiments were performed in a series often "4100 mL, water-jacketed separatory funnels with flared funnel tops (foreasy pouring of liquids into them). The phases in each funnel were mixed bya Sargent-Welch stainless steel centrifugal agitator rotated by a light duty,electronically controlled, variable-speed stirring motor.
The funnels were heated to 40 1C by two circulating thermo-static baths. In one set of six separatory funnels, the temperature measuredinside the funnel was 41.0 C at stage 10 and 39.2C at stage 5. In the secondset of funnels, stage 4 was 40.4 C and stage 1 was 39.6C. The organic andaqueous phases were delivered into beakers for transferring them into adjoiningfunnels. The beakers were handled with tongs to minimize the spread ofactivity.

96
b. Preparation of Solutions
(1) TRUEX Solvent
The chemicals used for the TRUEX solvent were0.2M 0$D[IB]CMPO (formula wL. = 407.6 g) and 1.4M TBP (formula wt. - 266.3 g)diluted to volume with Conoco C12-C14 . To prepare one liter of TRUEX solventrequires 372.8 g of TBP and 81.5 g of pure 0*D[IB]CMPO. Because the commer-cially prepared CMPO compound was 95% pure, 85.8 g of this material was addedto one liter.
The weighed portion of 0*D[IB]CMPO was transferred to adry, tared, one-liter volumetric flask; this transfer was accomplished byusing a powder funnel and Teflon"-coated spatula. The TBP was weighed in abeaker and then used to rinse the OOD[IB]CMPO from its beaker. Conoco 12-14was then used to rinse both beakers and the powder funnel. The 0D[IB]CMPOwas dissolved in the mixture of TBP-NPH after shaking and warming to roomtemperature. (Dissolution of TBP and O$D[IB]CMPO in NPH is an endothermicprocess.)
After standing overnight, the solution of o*D[IB]CMPO andTBP in NPH was diluted to volume with Conoco 12-14. The density of the resul-tant 0.2M CMPO-1.4M TBP-NPH solution was 0.882 g/mL.
After preparation, the TRUEX solvent was washed twice witha 0.25M Na2CO3/0.05M Na2C204 solution (2/1 phase ratio), followed by waterwashes 7 The TRUEX solvent was equilibrated with 1M HNO3 right before itsaddition to stage 1 of the countercurrent experiment.
(2) Scrub Number 1
A 500 mL solution of Scrub 1 (2.5M HNC3 and 0.06M H2C204)was prepared by diluting 113.2 g of concentrated HNO3 and 3.79 g of H2C204 -2H2 0with high purity water.
(3) Scrub Number 2
A 500 mL solution of Scrub 2 (0.5M HNO3 and 0.01M Fe3+)
was prepared by diluting 22.65 g of concentrated HNO3 and 2.02 g ofFe(N03)3 9H20 with high purity water.
(4) Strip Number 1
One liter of Strip 1 (0.01M HNO3 and 0.005M HAN) wasprepared by diluting 9.95 g of a 1.045M HNO3 solution and 1.79 mL of a 2.8M HANsolution with high purity water.
*There were phase disengagement problems with these carbonate washes that
were not noted before when the >99% pure CMPO was used. The cause of thisproblem and its solution are discussed in Section V.E.

97
(5) Strip Number 2
One liter of Strip 2 (0.lM oxalic acid) was prepared bydiluting 12.61 g of H2C204-2H20 with high purity water.
(6) DSW Feed Solution (Cold)
To two liters (2170 g) of DSW stock solution (describedearlier) was added 64.7 g of additional H2C204-2H2O (0.3M oxalic acid) and0.69 g NaNO2 (0.005M NO2-). Dilution with scrub solutions in the feed stagewould (before equilibration with the organic phase) give a total oxalate con-centration of 0.23M. The small volume change associated with the addition of
solids to the DSW was ignored.
No precipitation of species was observed on addition ofthis high concentration of oxalic acid to the DSW, and none was observed on
standing. One half of this solution was used as is (except for the additionof uranyl nitrate to bring its [U] to 1 x 10⁻⁴ M for the first cold counter-
current experiment). The other half was spiked with radionuclides for use asthe "hot" solution described below.
(7) DSW Feed Solution (Hot) 1
Uranium, neptunium, plutonium, americium, and technetiumwere introduced into the synthetic DSW solution by the following procedure.
An intermediate stock solution, 5 mL in volume and 1Min HNO3 , containing the required quantity of each nuclide was prepared.
This intermediate stock solution was then transferred into one liter ofDSW-0.30M H2C204-0.005M HNO2 , using an additional 5 mL of IM HNO3 as a rinse.All radionuclides were from ANL stocks and contained <0.1% by activity of
other radioactive isotopes other than daughters.
Neptunium-239 was prepared by its separation from 2 mg of24 3Am, using an extraction chromatographic procedure [HORWITZ]. A 9M HClsolution (prepared from Ultrex'" acid and ultrapure water) containing the243Am/239Np was loaded on a column (3-mm ID by 5-cm high) containing
Aliquat'"-336 absorbed on Porasil-C" (25 um in diameter). Under these con-ditions, neptunium is largely tetravalent and absorbs on the column as NpC162-.Americium(III) is not absorbed on the column and is thoroughly rinsed fromthe column by eluting with ten bed volumes of 9M HCl. The 23 Np is strippedfrom the column using three bed volumes of 0.lM HCl. The required quantity
of 2 3 7Np (which contained <0.05% by activity 2 38Pu) from a 2M HN03 stock solu-tion was added to the 2 39Np strip solution, and the mixture evaporated todryness twice with 6M HNO3 . After the final evaporation, the residue [probablyNp02(N03)2] was dissolved in 2 mL of 1M HNO3 and made 0.lM in NaNO2. Thenitrite reduced Np(VI) to Np(V), which was observable by the color change.The above oxidation-reduction procedure ensured isotopic equilibration of2 3 9 Np and 2 3 7 y,,

98
Aliquots from standardized stock solutions of uranium(natural isotopic abundance), plutonium (atomic weight percent: 2 4 2 Pu, 99.9;24 1Pu 0.002; 4OPu, 0.013; and 2 39Pu, 0.079), 24 1Am and 9 9Tc were added tothe 237,239Np solution. (All stock solutions were in nitric acid.) Theresultant mixture was then added to the DSW as described above.
The only difference in the procedure for the two hot DSWfeeds (Table B-3) was the addition of different quantities of 2 3 7 Np.
c. Experimental Design and Procedure
Figure B-1 shows the flow design of the countercurrent experi-ments; Table B-6 shows the volumes added at the proper stages for both experi-
ments to match the relative flows of that figure.
The countercurrent experiments were performed in the "double-diamond" mode described by Peppard [PEPPARD]. This was done to ensuresimplicity of operation and adequate volumes of raffinate and loaded-organicsamples for later experiments.
Fresh TRUEXSolvent
0.67
I
1.33
Raffinate
Fig. B-1. TCr
Z 9 S bl"uq IA
1.0 I0.17DSW Scrub ScrubFeed 1 2
he Experimental Design and Flow Ratios of the Twoountercurrent Experiments (Boxes numbered 1-10epresent the separatory funnels or stages)
(1) Procedures for Countercurrent Experiments
Scrub solutions were added by syringe (10 mL plastic, dis-posable type) with an estimated accuracy and precision of 'i5%. A graduatedcylinder was used to measure and add the organic phase to the funnel at stage 1,again with an accuracy and precision of ti5%. Because of the high activity
Loaded TRUEXSolvent
0.67
0.17

99
Table B-6. Volume Additions in the Two Counter-
current Experiments
Volume Used in
Addition Experiment,a mL
Stage No. Solution Cold Hot
CMPO-TRUEX1 Process Solvent 28 20
7 Feed 42 30
9 Scrub1 7 5
10 Scrub 2 7 5
aCold refers I:o the first experiment where all
species but the radionuclides 9 9Tc, 2 4 2Np-23 9Np,24 2 Pu, and 24 1Am were present in the feed; hot
refers to the experiment where all species were
present.
level of the hot feed solution, a Chempette" repetitive dispenser, surrounded
by lead bricks, was used to contain and dispense feed solution. A highly acid-resistant tubing transferred the feed solution to funnel 7 from the dispenser.
The dispenser is accurate to 0.5 mL (by calibration, to 0.03 mL) and isreproducible to 0.05 mL.
When solutions had been transferred to each funnel, they
were allowed to come to thermal equilibrium for "i2 minutes and were then
stirred for t4 min'ite. The stirring speed was set by visually observing
complete dispersion of phases in each funnel. After stirring was completeand the phases completely disengaged, the aqueous and organic phases wereremoved from each funnel and left to sit until this operation was complete.
Following the diagram of Fig. B-1, all the organic phases were transferredone separatory funnel to the right and each aqueous phase one funnel to theleft. Fresh feed, scrub 1, scrub 2, and organic solvent were added at theirproper stage; and the procedure was repeated, all ten stages runningsimultaneously.
As the loaded organic samples emerged from stage 10, theywere labeled by the double diamond technique; i.e., the first and secondsamples were numbered 1 and l', the third and fourth samples were numbered2 and 2', and so on. The same labeling procedure was used for the raffinatesamples. At the end of the cold run, 8 mL of the organic phase was removedfrom every stage; 16 mL of aqueous phase was removed from the extraction stages(1-7); 4 mL of aqueous phase was removed from scrub stages 8 and 9; and 2 mLof aqueous phase was removed from scrub stage 10. The remaining organic andaqueous phases were allowed to sit in the separatory funnels overnight.

100
The hot run was begun by substituting the radioisotope-
containing feed for the cold feed used the previous day. The volumes of thefeed, organic, and two scrub solutions were all reduced proportionately to
match the lower volumes of the solutions in the ten stages (Table B-6).
After the requisite number of feeds had passed throughthe system ':o reach the calculated >90% of steady-state condition for[24 1Am] in the raffinate, the separatory funnels were drained and the
organic and aqueous phases were separated and labeled for further testing
and analysis.
(2) Additional Procedures
Stage 0. A 4 mL sample was removed from the aqueous phase
of stage 1 and the remainder was contacted with fresh organic phase.
Scrub stages 11, 12, and 13. The last two loaded organicphases from the hot run Lnat left the system prior to shutdown were combined
and equilibrated with three additional portions of fresh scrub 2 in a 0/A phaseratio of 4:1.
Strips 1 through n. The loaded organic phase that emergedfrom stage 13 was equilibrated with strip solution 1 in a 0/A phase ratio of
2:1 for a number of consecutive strips (this number varied for the hot and
cold runs). For the cold run, a sample of each strip solution was tested for
the presence of lanthanides by the addition of oxalic acid; a precipitateindicated the presence of lanthanides. The progress of americium and neptunium
stripping was monitored by removing small aliquots of the organic phase fory-analysis between strips. The strips were combined for further Tc and Pu
analyses. After an average of seven strips, the organic phase was divided.
Part was saved and part was stripped further by strip 2 solution.
Oxalate Strips. After the organic phase was stripped bya series of dilute-nitric acid-HAN contacts, it was consecutively equilibratedwith two volumes of strip solution 2 in a 0/A phase ratio of 2:1. These twostrip solutions were combined and saved for later Tc and Pu analyses.
(3) A Second Hot Countercurrent Experiment
An ancillary experiment was performed after the analysisof data showed that the decontamination factor for Np in the countercurrentexperiment was a disappointing value of 6, and the efficiency of strippingneptunium was low. It was hypothesized that the low Np extraction was due tothe relatively low concentration of neptunium in the feed (Table B-3). Totest this hypothesis, a three-stage countercurrent experiment was undertakenwith the same equipment and volumes as the hot countercurrent experiment. Thefeed stage was again stage 7; boLh scrub solutions were combined in stage 8;and the TRUEX solvent entered at stage 6. Because of the limited volume of
feed, a single-diamond experiment was run in which the addition of feed instage 7 was alternated with the addition of solvent and scrub in stages 6 and8. Four raffinate samples were collected before shutdown, after which the
organic and aqueous phases from each stage were collected for analysis.

101
(4) Distribution Ratio Measurements of H2 C2 04 and HTc04
Carbon-i4 labeled oxalic acid was used to measure thedistribution ratio of oxalic acid (DH2 C0 4 ) in the near-steady-state solutions
removed from stages at the conclusion or the cold countercurrent experiment.
The labeled oxalic acid was purified by precipitating Ca14C 204 , dissolvingthe precipitate of HNO3 , and removing the Ca2+ by a cation exchange column
on the hydrogen ion cycle. (The major impurity was 14 C labeled formic acid.)The DH2C204 values were measured by spiking samples of the aqueous phases ofeach stage obtained from the cold run and equilibrating them with the corre-sponding organic phase at 40 C for four minutes. Phase ratios were the same
as shown in Fig. B-1. Radiometric assay of the 14 C oxalic acid was performed
with a liquid scintillation counter.
The distribution ratios of HTc04 were measured in the same
manner as DH2 C2 04 , namely, by spiking samples of aqueous phase from the cold
run with 99 Tc and equilibrating them with a sample of the corresponding organic
phase at 400C for four minutes. Phase ratios were the same as shown in
Fig. B-1. Radiometric assay of the 9 9Tc was performed using liquid
scintillation counting.
d. Analytical Methods
(1) ICP/AES Analysis
(a) Sample Preparation
To measure the distribution ratios of each element
in each stage, samples had to be quantitatively diluted for ICP/AES analysis
because of the high concentrations of the major constituents. The aqueous
phase dilution was a simple matter of taking a measured aliquot from each
phase and diluting it with 5M HNO3 in high purity water to volume in a 50 mLvolumetric flask. Four milliliter aliquots were taken from stages 1-7, 2 mL
aliquots from stages 8 and 9, and 1 mL aliquots from stages 10 and 11.
The procedure for organic phase analysis was more
complicated; the cations had to be first quantitatively stripped from theCMPO-TRUEX solvent before dilution. The organic phases' cationic content
was removed by four consecutive strips of (1) 1.5M HNO3/0.05M oxalic acid,(2) two water washes, and (3) 5M HNO3 . A 2 mL aliquot of each organicphase was contacted with 4 mL of each strip solution. All four strip solu-tions were combined and diluted to 50 mL with 5M HNO3. The lanthanidesprecipitated out of the organic phases during the water washes but dissolvedagain when they were combined with the 5M nitric acid solution.
(b) Analytical Measurements
The ICP/AES analysis was performed by Edmund Huff(Analytical Chemistry Laboratory, Chemical Technology Division, ArgonneNational Laboratory). The elements that were measured and the detectionlimits for each element are presented in Table B-7. Because of the dilutionof samples for analysis, the concentration limits for the actual countercurrentexperiment solutions are higher by their dilution faction (50, 25, or 12.5depending on the solution's stage number).

102
Table B-7. Elements Measured by ICP/AES Analysis andTheir Detection Limits
Detection DetectionLimit, Limit,
Element ug/mL Element Ig/mL
Ag < 0.02 Mo < 0.05Al <0.1 Nd <0.1Ba < 0.02 Ni < 0.02Ca < 0.3 rd < 0.1Ce < 0.1 Pr < 0.1Cd < 0.01 Rh < 0.1Cr < 0.02 Ru < 0.1Cu < 0.01 Sm < 0.05Eu < 0.01 Sn < 0.02Fe < 0.02 Te < 0.1La < 0.02 Y < 0.01Mg < 0.02 Zr < 0.02Mn < 0.005
(2) Americium Analysis
Aliquots of both organic and aqueous phases weredirectly in y-counting vials with no further treatment. The size ofaliquot was determined by the expected activity level of the sample.aliquots were diluted in the vials by either NPH or water to 2 niL so
their counting geometries would be similar.
placedtheThe
that
The vials were inserted into a Beckman Biogamma' auto-matic y-counter with NaI(Tl) well detector. One of the counter's energywindows was set for measuring the 59.6 keV gamma emission of 2 4 1 Am. Suitableallowances were made for background and for the appearance and decay of 2 3 9 Npactivity in the 2 4 1 Am window. The 2 4 1 Am activities were counted during andright after the countercurrent experiments for quick but inaccurate analysisto monitor the progress of the experiment and were counted again much later,after the short-li'ved 2 3 9 N1 had died away, for more accurate measurements.
(3) Neptium Analysis
The same samples that were counted by gamma analysis for2 4 1 Am activities were simultaneously counted for 2 3 9 Np activity. A secondenergy window, set for all gamma energies above 100 keV, was used to measure2 3 9 Np activity. Because initially the levels of 2 3 9 Np activity were high com-pared to all other activities with gamma emission above 100 keV in the samples,this window gave excellent correlations to the 2 3 9 Np activities in the sample.The measured activities were corrected for the short half-life of 2 3 9 Np(2.33 days).

103
Although the 2 3 9Np and 24 1 Am isotopes were the only impor-
tant source of y-activity intially, as the 23 9 Np decayed away, it was even-
tually possible to identify and use the gamma rays from 2 37 Np and 2 33 Pa to
follow changes in neptunium concentration. Their signal from an intrinsic
germanium detector was routed through a preamplifier, an amplifier, and a
4096 channel pulse height analyzer.
(4) Plutonium Analysis
Because plutonium was expected to have a high distributionratio in the CMPO-TRUEX solvent extraction system, raffinate samples were not
analyzed for their plutonium content; instead, the near steady-state aqueous
solutions were analyzed from stages 4 through 7, along with the feed solution(as a standardization point) and several strip solutions. As expected, theAqueous phase concentration of plutonium in stage 4 was barely perceptible;
thus plutonium would not be measurable in extraction stages 1 through 3 or in
the raffinate samples. Isotopic dilution/mass spectrometric analysis was
selected for plutonium analysis.
This analytical technique requires near weightless sample
and isotopic equilibrium between 2 42Pu and the 23 9Pu spike.
(a) Sample Preparation
Twenty milliliter aliquots of the feed solution andthe aqueous phases from stages 4 through 7 were combined with the requisite quan-
tities of concentrated HNO3 and NaNO2 solution to bring the HNO3 concentra-Uion to 4M and the NaNO2 concentration to 0.05M. In addition, 4 mL each of
the seven consecutive strip #1 solutions (designated E strip #1) was treated asabove. A known amount of a NBS-949e 2 3 9Pu standard was added to each sample
according to the schedule recorded in Table B-8. The spiked solutions were
allowed to stand for two days at room temperature so that the plutoniumisotopes would achieve isotopic equilibrium.
Plutonium was separated from all other constituents,except Np, by extraction of the spiked samples with 15 vol % Aliquat-336'"nitrate in xylene using an 0/A phase ratio of 1:2. After extraction, theorganic phase was scrubbed three times with an equal volume of 5M nitric acid(to ensure a high decontamination of the macroconsttituents from the Pu, thetips of the separatory funnels were carefully rinded with high puritywater during the scrubbing operations). The scrubbed organic phase wasstripped three times with an equal volume of IM formic acid-0.1M HNO3-0.05MHAN.
The combined strip solutions from each sample wereevaporated to 4 mL by mild heating. Each concentrated strip solution wasthen contacted with three 2 mL portions of 2-ethylhexanol to remove entrainedand/or solubilized extractant. The resultant washed, concentrated stripsolutions were then given to the mass spectrometry laboratory for analysis.

104
Table B-8. 2 3 9Pu Addition to Samples of 2 42Pu for IsotopicDilution/Mass Spectrometric Analysis
Stock Volume [2 39 Pu] AddedUsed, Used, to Solution,
Sample ug/mL PL ng
Feed 282.27 34.2 9.68 x 10³
Aq-7 4 .8 4 a 20 9.68 x 101
Aq-6 0 . 0 4 8 4 b 20 9.68 x 10⁻¹
Aq-5c 0.0484 20 9.68 x 10⁻¹
Aq-4c 0.0484 20 9.68 x 10⁻¹
Z Strip #1 4.84 119 5.76 x 10²
E Strip #2 282.27 15.3 4.31 x 10³
aPrepared by5M HNO3 .
bPrepared by
5M HNO3 .
diluting 17.2 iL of 282.27 Ug/mL stock to 1 mL with
diluting 10 iL of the 4.84 pg/mL stock to 1 mL with
cThe sample size of 2 3 9 Pu was not lowered beyond that of Aq-6,because the detection limit was not far below 1 ng/total sample.
(b) Analytical Measurement
The mass spectrometric analysis was performed byE. L. Callis (Analytical Chemistry Laboratory, Chemical Technology Division,Argonne National Laboratory).
Samples as delivered to the mass spectrometry labo-ratory were transferred to new clean beakers and evaporated to dryness to
remove traces of volatile organic solvents. Sample Aq-4, having the smallestPu content, was treated with perchloric acid to remove all traces of organiccompounds. All samples were redissolved in 0.1 to 1 mL 0.8M nitric acid.Aliquots of the sample solutions containing 1 to 10 ng of Pu wer loaded ontodegassed Ta filaments, dried, and inserted into a mass spectromet r.
The 2 4 2Pu/2 3 9Pu ratios in the spiked samples weremeasured on a single-stage mass spectrometer of NBS design (30-cm radius),equipped with a Faraday cup collector. For this work, triple-filament sourcegeometry was used, with the rhenium-ionizing filament operated at 2060 C. Thedetection limit for plutonium isotopes using this system is approximately1 x 10-12 g.

105
(5) Technetium Analysis
Technetium analysis of aqueous phases was performed byjust extracting the pertechnitate ion from other radionuclides and colored
species using 30 vol % Aliquat-336" in xylene and measuring 99Tc in theresultant organic phase by liquid scintillation counting.
(a) Sample Preparation
Four milliliter aliquots from each of the seven
raffinate solutions, the feed solution, and the Z strip solution were dilutedwith an equal volume of water to decrease the acidity. (The decreased acidity
enhances DTc and decreases DAm, Dpu, and DNS.) The resultant aqueous phases
were contacted with 2 mL of 30% Aliquot-336 nitrate in xylene followed by
scrubbing twice with 4 mL of 0.5M HNO3 .
(b) Analytical Measurement
After the second scrub, a 0.100 mL aliquot of eachorganic phase was added to 10 mL of a Beckman HP grade scintillation cocktail
and counted, along with blank samples for background determinations, for 50
minutes per sample or until the counting error was less than 2% (whicheveroccurred first). The feed sample was carried through the separation andcounting process as a standard for quantitating the technique.
(6) Uranium Analysis
Uranium ion concentrations were measured by using laserexcitation fluorescence spectrometry on a Scintrex Uranium Analyzer'. Whenthe uranium concentration was high enough, the same solutions prepared for
ICP/AES analysis could be used to measure uranium concentration. However, when
the uranium concentration was low, interferences from other ions in solution
made detection impossible, and uranium had to be separated from the gross
constituents before its analysis.
(a) Sample Preparation
In the case of the aqueous phases from stages 5 and6, the uranium concentration was below detectability due to interferences inthe analysis from other ions in solution. Therefore, a preliminary separation
of uranyl ion from the metal ion constituents of the waste solution had to be
made to reduce interferences. This separation was performed by increasing the
acidity of a 2 mL aliquot of 5-A and 6-A to 3M HNO3 and then extracting theuranyl ion with two successive half volumes of 30% TBP in dodecane. The com-bined organic phases re scrubbed three times with 4M HNO3, having a 0/Aphase ratio of two, th n stripped twice with half volumes of H2 0 and twicewith half volumes of 0 1M oxalic acid. The water and oxalic acid strips werecombined in a 5 mL volumetric flask and diluted to volume with water. TheTBP-dodecane solution was preconditioned using two equal volume scrubs with0.25M Na2CO3-0.05M Na2C204 followed by two equal volume scrubs with 4M HNO3 .

106
Samples of organic phases from stages 7, 6, and 5were stripped with two successive double volumes of water followed by two
successive double volumes of sodium citrate. The combined strips were dilutedto volume in a 25 mL volumetric flask. The resultant sample was used for
uranium fluorescence analysis.
(b) Analytical Measurements
Uranium ion concentrations were measured by
A. M. Essling (Analytical Chemistry Laboratory, Chemical Technology, ANL).Samples were either run as delivered or, if necessary, diluted to an appro-
priate concentration for measurement. The detection limit for measuring
uranium ion in solution is 10 ug/L for 50 L-size samples. For largersamples (<10 mL), the detection limit is in the range of 0.01 ig/L.
REFERENCES
HORWITZE. P. Horwitz and C. A. A. Bloomquist, Chemical Separations for
Super-Heavy Element Searches in Irradiated Uranium Targets,
J. Inorg. Nucl. Chem. 37, 425 (1975).
PEPPARDD. F. Peppard, "Liquid-Liquid Extraction of Metal Ions," in Advances inInorganic and Radiochemistry, Vol. 9, Academic Press Inc., New York (1966).

107
APPENDIX C.
OXALIC ACID COMPLEXING OF CAW AND DSW COMPONENTS
Oxalic acid is a diacidic compound that forms stable complexes with manymetal ions. The metal ions most important to the chemistry of the TRUEX pro-cess are Fe3 +, A13+, and Zr4 +. The mass balance equation for oxalic acid is:
[H2Ox]Total = [H2Ox] + [HOx ] + [0x2-] + [FeOx ] + 2[Fe(Ox)2 ] +
[A1Ox+ ]+ 2[Al(Ox)2-] + [ZrOx2+] + 2[Zr(Ox)2 1(0-1)
Other metal ions in CAW or DSW do not greatly affect this mass balance because
their concentrations and/or their propensity to form oxalate complexes are low.
Acid dissociation constants for oxalic acid and complex stability con-stants for oxalate complexes under flowsheet conditions were identified byroughly extrapolating the many reported values [PERRIN, MARTELL, SILLEN-1964,-1971, BJERRUM] to 40 C and high ionic strength. In this rough extrapolation,
values out of line with the general trend were ignored. Activity values forhydrogen ion (h ) in nitric acid solutions were also taken from the literature
[PAUL, DAY].
The relative concentrations of H 2Ox, HOx-, and Ox2 - in terms of the frac-tion of total uncomplexing oxalic acid in various nitric acid solutions areshown in Table C-1. These values wore calculated from Eqs. C-2 to C-5 below:
Ka1
H20x r-HOx- + H+ (C-2)
Ka2
HOx- 0x2 - + H+ (C-3)
Ka1 = [H+][HOx-]/[H2Ox] = O.10M (C-4)
Ka2 = [H+][0x2-]/[HOx-i = 5.0 x 10⁻⁴ M (C-5)
The h for each nitric acid solution and those predicted for CAW anfDSWsolution are also shown in Table C-1.
The data shown in Tables C-2 through C-5 are oxalate complex stabilityconstants for metal ion species of importance to CAW and DSW. To approximateconditions of high ionic strength solutions at 400C, these constants weretreated in the same manner as the acidity constants were. The constants inthese tables are defined by the following eight equations:

108
K1Ox2- + Mz+ M(Ox)Z-2 (C-6)
K1 = [M(Ox)Z-2 ]/[MZ+][0x2 -] (C-7)
02
20x2- + Mz+ M(Ox)2 -~ (C-8)
82 = [M(Ox)2 I]/[MZ+][0x2-]2 (C-9)
03
30x2- + MZ+ M(Ox)3-6 (C-10)
83 = [M(Ox)3]z- 6/[MZ+][0x2-]3 (C-11)
04
40x2- + Mz+ M(Ox)4-8 (C-12)
84 = [M(Ox)2-8]/[MZ+][0x2-]4 (C-13)
Table C-1. The Hydrogen Ion Activity (h ) and the Fraction ofH20x, HOx~, and 0x2- for Uncomplexing Oxalic Acidin Various Nitric Acid Media
[HNO3 ], h0, Fraction of Oxalic Acid
M M H20x HOx Ox2 -
8 x 10⁻³ 8 x 10⁻³ 0.070 0.875 0.055
0.1 0.1 0.50 0.50 2.5 x 10⁻³
0.5 0.62 0.86 0.14 1.1 x 10⁴
1.0 1.5 0.94 0.062 2.1 x 10⁻⁵
2.0 4.7 0.98 0.021 2.2 x 10⁻⁶
3.0 10.5 0.99 0.0094 4.5 x 10~7
4.0 19.5 0.995 0.0051 1.3 x 10~7
CAW (1M HNO3) 4 0.98 0.024 3.0 x 10⁻⁶
DSW (1M HNO3) 12.la 0.95 0.045 1.1 x 10⁻⁵
aObtained by interpolation of h values for solutions containing1M HNO3 , no additional nitrate, and 1M HNO3 and 3M total NO3-;DSW is 1M HNO3 and contains 1.7M total nitrate.

109
Table C-2. Logarithms of Oxalato-Complex Stability Constantsfor Me.al Ions in HighConcentration in CAW and
DSW
MetalIon K1 82 03
A13+ 7.0 12 16
Fe3+ 7.5 14 19.2
Cr3+ 5.3 10.5 15.6
Ni2+ 5.2 7.7 8.4
Mo 3 + 1.6 - -
Mo022 + 3.4 - -
Zr4+ 10.5 21 -
Table C-3. Logarithms of Oxalato-ComplexStability Constants forActinide Element Species
MetalIon K1 82 83 84
U4+
Uo2 2+
Np4 +
Np02 +
Np022 +
Pu4 +
Pu02 +
Pu022 +
8.6
6.0
8.6
3.7
6.0
8.7
3.9
6.7
16.9
10.6
16.8
6.7
10.1
16.9
10.6
11.4
22.7
11.0
23.5
27.7
27.4
23.4 27.5
Am3+ 5 9 11

110
Table C-4. Lugarithms of Oxalato-ComplexStability Constants forLanthanide Elements and YttriumSpec ies
MetalIon K1 82 03 04
y3 + 5.5 9.3 - -
La3+ 4.7 8.2 11 -
Ce3 + 5 8 9 -
Nd3+ 7.2 11.5 13
Sm3 + 6.6 - - -
Eu3+ 4.9 8.8 11.4 -
Gd3+ 4.8 8.7 - -
Tb3+ 5.2 9.0 11.9 13.4
Table C-5. Logarithms of OxalatoComplex Stability Con-stants for Noble MetalIon and Other MetalIon Species
MetalIon K1 82 03
Ru3+ 5 - 12.3
Pd2+ 8.8 12.4 -
Ag+ <2 - -
Cu2+ 6 9.9 -
Be2+ 4.3 5.5 -
Ca2+ 2.5 3.0 -
Ba2 + 0.6 - -

111
Of the other threc anionic species in solution (N03 , S042-, and F~), only
fluoride, which has a significant concentration only in CAW, has any significantcomplexing ability. Table C-6 shows the stability data for fluoride complexes
of the three metal ions which are also complexed by oxalate ion [HOGFELDT,MARTELL, SILLEN-1964, -19/1, BJERRUM]. The acid dissociation constant forhydrofluoric acid was approximated from the same sources to be 1 x 10- 3 M.
Table C-6. Logarithms for Fluoride ComplexStability Constants for MetalIons in CAW and DSW
Me ta1
Ion K1 82 83 04
A13+ 6.7 12 15.9 19.2Fe3+ 5.4 9.6 12 -Zr4+ 9.0 16 22.1 27.5
A series of massoxalic acid:
balance equations was set up for Zr, Fe, Al, F, and
[Zr]Total = [Zr4+Ifree + [ZrOx2 +] + [Zr(Ox)2] + [ZrF3+] +
[ZrF22 +] + [ZrF3 +] + [ZrF4 ]
[Al]Total = [A13+]free + [AlOx+] + [Al(Ox)2-f] + [Al(OX)3 3-]
[AlF2 +] + [AlF2 +] + [AlF3 ] + [A1F4 ~]
[Fe]Total = [Fe 3+]free + [FeOx+] + [Fe(OX)2-] + [Fe(OX) 33 ]
[FeF2 +] + [FeF2+] + [FeF3 ]
[FiTotal = [HF] + [F-] + [ZrF3 +] + 2[ZrF 22+] + 3[ZrF3 +] +
4[ZrF4 ] + [AlF2 +] + 2[AlF2 +] + 3[AlF3 ] + 4[AlF4 -] +
[FeF2 +] + 2[FeF2 +] + 3[FeF3 ]
Ka
HF = H+ + F~
Ka = [H+][F-]/[HF] = 1 x 10⁻³M
(C-14)
+
(C-15)
+
(C-16)
(C-17)
(C-18)
(C-19)

112
A second reaction
K2
HF + FHF2[ (C-20)
K2 = [HF 2 ~]/[HF] [F~] = 4M~l (C-21)
is not important in CAW or DSW solutions because of the low concentrations offree fluoride ions and hydrofluoric acid due to the presence of stablefluoro-metal ion complexes.
Table C-7 shows sample results of calculating the species present in CAW
solution at various oxalic acid concentrations. Under all conditions, most ofthe fluoride ion is tied up as AlF 2 +; in the absence of oxalate ion, greaterthan 99% of the zirconium ion is tied up as fluoro-complexes. With a totaloxalic acid concentration of 0.05M, however, the fluoro-complexes make up lessthan 0.5% of the total zirconium, and 99% of Zr4 + is present as Zr(Ox)2. At0.2M total oxalic acid, 99.9% of Zr is present as the dioxalato-complex. Ingeneral, increasing the concentration of total oxalate in the CAW solutiondoes not greatly affect the amount of iron or aluminum ion complexed withfluoride ion, but does greatly decrease the amounts of uncomplexed ions forboth metals. Zirconium is almost quantitatively transformed from fluoro- tooxalato-complexes.

Table C-7. Speciation in CAW Solution (OxalateTotal = 0.2M, 0.1M, and 0.05M; HNO3 = 1M,
Al = 0.6M, Fe = 0.15M; F = 0.15M; Zr = 2.8x10⁻³Ma)
H20x = 0.2M H20x = 0.11! H20x = 0.05M H20x = 0
Species Species % of Concentration, % of Concentration, % of Concentration, % of Concentrati
Added in Solution Added M Added M Added M Added m
H20x
HOx-
Ox2 -
HF
F-
Fe3+
FeOx
FeOx2
FeF
A13+
AlOx
A10x2
AiF
AlF2
4.7
0.31
1.5 x 1C
6.7 x 10⁻²
5.5 x 10⁻⁵
48
47
4
1
58
17
0.05
24
0.3
9.4 x 10⁻³
6.2 x 10⁻⁴
)-5 3.0 x 10⁻⁸
3.8
0.25
1.2 x 10⁻⁵
3.8 x 10-32.5 x 10-4
1.2 x 10⁻⁸
1.0 x 10⁻⁴ 5.9 x 10⁻² 8.8 x 10⁻⁵
8.3 x 10⁻⁸ 4.7 x 10⁻⁵ 7.0 x 10⁻⁸
0.072
0.070
0.0065
0.0015
0.35
0.10
0.0003
0.14
0.002
71
27
1.0
1.3
68
8.2
24
0.3
0.111
0.041
0.001
0.002
0.41
0.049
0.14
0.002
3.2 1.6 x 10⁻³
0.22 1.1 x 10⁻⁴
1.0 x 10⁻⁵ 5.2 x 10⁻⁹
5.6 x 10-24.5 x 10-7
84
14
1.4
72
3.7
24
0.3
8.4 x 10⁻⁵
6.7 x 10⁻⁸
0.13
0.021
0.002
0.43
0.022
0.14
0.002
Zr4+ Zr4+ 1.1 x 10⁻⁴ 3.1 x 10⁻⁹ 6.9 x 10⁻⁴ 1.9 x 10- 8 3.7 x 10⁻³ 1.0 x 10⁻⁷ 0.96 2.7 x 10
ZrOx 0.11 3.0 x 10⁻⁶ 2.6 x 10⁻¹ 7.4 x 10⁻⁶ 0.61 1.7 x 10⁻⁵ - -
ZrOx2 99.9 2.8 x 10⁻³ 99.3 2.8 x 10⁻³ 99.0 2.77 x 10⁻³ - -
ZrF 9.2 x 10⁻³ 2.6 -: 10-7 4.8 x 10⁻² 1.4 x 10⁻⁶ 0.26 6.9 x 10⁻⁶ 59 1.7 x 10
ZrF2 7.7 x 10⁻³ 2.1 x 10⁻⁷ 3.4 x 10⁻¹ 9.5 x 10⁻⁶ 0.16 4.6 x 10- 6 37 1.0 x 10
ZrF3 8.0 x 10⁴ 2.2 x 10⁸ 2.4 x 10⁻² 6.8 x 10⁷ 0.014 3.9 x 10⁻⁷ 2.9 8.0 x 10
ZrF4 1.7 x 10⁻⁵ 5 x 10⁻¹⁰ 5.2 x 10- 1.5 x 10⁻⁹ 2.3 x 10⁻⁴ 6.6 x 10⁻⁹ 4.8 x 10⁻⁴ 1.3 x 10
aThese calculations are based on an activity of hydrogen ion of 1.5M. According to the hydrogen ion activity data presented in Table C-1,
this value should have been 4M. This mistake has had the effect of calculating slightly higher amounts of both oxalato- and fluoro-metal
complexes and lower amounts of the species HF, H20x, and HOx. General trends would remain the same.
H2OX
Fe3 +
A13+
on,
7 x 10⁻⁵
6.2 x 10⁻⁸
4.7 x 10⁻²
4.1 x 10⁻⁵
98
1.5
76
24
0.3
0.148
0.0023
0.46
0.14
0.002
NA
-5
-3
-3
-5
-6
---

114
REFERENCES
BJERRUMJ. Bjerrum, G. Schwarzenbach and L. G. Sillen, Stability Constants ofMetal-Ion Complexes, With Solubility Products of Inorganic Substances,The Chemical Society, London (1958).
DAYJ. S. Day and P. A. H. Wyatt, H0 Measurements in Some Salt-Acid Mixturesof Fixed Total Anion Concentration, J. Chem. Soc. (B), 343 (1966).
HOGFELDTE. Hogfeldt, Stability Constants of Metal-Ion Complexes, Part A:Inorganic Ligands, IUPAC Chemical Data Series, No. 21, Pergamon Press,New York (1979).
MARTELLA. E. Martell, Stability Constants of Metal-Ion Complexes, SupplementNo. 1, Special Publication No. 25. Part II. Organic IncludingMacrocyclic Ligands, The Chemical Society, London (1971).
PAULM. A. Paul and F. A. Long, H0 and Related Indicator Acidity Functions,
Chem. Rev. 52, 1 (1957).
PERRIND. D. Perrin, IUPAC Chemical Data Series - No. 22, Stability Constantsof Metal-Ion Complexes, Part B. Organic Ligands, Pergamon Press,New York (1979).
SILLEN-1964L. G. Sillen and A. E. Martell, Fcability Constants, Special Publi-cation #17, The Chemical Society, London (1964).
SILLEN-1971L. G. Sillen, Stability Constants of :etal-Ion Complexes, SupplementNo. 1, Special Publication No. 25, Part T Inorganic Ligands,The Chemical Society, London (1971).

115
Distribution for ANL-84-45
Internal:
E. S. Beckjord R. A. Leonard (15)D. L. Bowers E. P. SteinbergL. Burris M. J. Steindler (5)F. A. Cafasso G. F. Vandegrift (15)S. L. Gawenda ANL Patent Dept.B. M. Grazis (5) ANL Contract FileD. R. Hamrin ANL LibrariesJ. E. Harmon TIS Files (6)E. P. Horwitz (15)
External:
DOE-TIC, for distribution per UC-10 and -70 (380)Manager, Chicago Operations Office, DOES. A. Mann, DOE-CHChemical Technology Division Review Committee Members:
S. Baron, Burns and Roe, Inc., Oradell, N. J.
R. Winston, U. ChicagoC. J. Ambrose, Westinghouse-Hanford Co.G. S. Barney, Rockwell Hanford OperationsG. E. Benedict, General Atomic Co.
B. C. Blanke, USDOE-DA, Miamisburg, 0.W. D. Bond, Oak Ridge National Lab.D. Bowersox, Los Alamos National Lab.
J. L. Burnett, Office of Basic Energy Sciences, USDOE
G. A. Burney, Savannah River Lab.G. R. Choppin, Florida State U.C. E. Coffey, Savannah River Lab.F. E. Coffman, Office of Terminal Waste Disposal and Remedial Action, USDOEC. R. Cooley, Jr., Div. of Waste Repository Deployment, USDOED. J. Crouse, Oak Ridge National Lab.R. Cunningham, Nuclear Materials Safety and Safeguards, USNRCG. H. Daly, Office of Dep. Asst. Secy. for Nuclear Materials, USDOEJ. T. D'Ambrosia, Div. of Defense Waste and Byproducts Management, USDOEB. R. Dickey, Exxon Nuclear Corp., Idaho Falls0. J. Elgert, Richland Operations Office, USDOEE. S. Goldberg, Savannah River Operations Office, USDOEA. P. Gouge, Savannah River Lab.W. S. Groeizier, Oak Ridge National Lab.H. D. Harmon, Savannah River Lab.T. B. Hindman, Jr., Savannah River Operations Office, USDOEM. E. Hodges, Savannah River Lab.L. J. Jardine, Bechtel National, Inc., San FranciscoA. S. Jennings, Savannah River Lab.J. J. Jicha, Div. of Defense Waste and Byproducts Management, USDOEB. F. Judson, General Electric Uranium Management Corp., SunnyvaleC. J. Kershner, Mound Lab.R. Lambert, Electric Power Research Inst., Palo AltoLos Alamos National Lab., DirectorLos Alamos National Lab., LibrarianR. Y. Lowery, Albuquerque Operations Office, USDOE

116
R. Maher, Savannah River PlantJ. C. Mailen, Oak Ridge National Lab.D. L. McIntosh, Savannah River Lab.W. H. McVey, Div. of LMFBR Fuel Cycle Projects, USDOEE. Michaels, Mound Lab.A. C. Muscattello, Rockwell International, GoldenJ. D. Navratil, Rockwell International, GoldenE. D. North, Oak Ridge National Lab.D. A. Orth, Savannah River Lab.B. Paige, Exxon Nuclear Corp., Idaho FallsJ. H. Pashley, Oak Ridge Gaseous Diffusion PlantE. S. Pierce, Office of Basic Energy Sciences, USDOEH. Ramsey, Los Alamos National Lab.
D. J. Reif, Savannah River Lab.A. D. Ryon, Oak Ridge National Lab.W. W. Schulz, Rockwell Hanford Operations (20)F. D. Stevenson, Office of Basic Energy Sciences, USDOEK. Street, Lawrence Livermore National Lab.D. W. Tedder, Georgia Inst. TechnologyM. C. Thompson, Savannah River Lab.
USDOE Office of Spent Fuel Management and Reprocessing Systems, 1MFBR FuelCycle Projects
USDOE Office of Basic Energy SciencesH. H. Van Tuyl, Battelle Pacific Northwest Lab.V. C. A. Vaughn, Oak Ridge National Lab.E. E. Voiland, Gen'ral Electric Co., Morris, Ill.R. D. Walton, Jr., Office of Defense Waste and Byproducts Management, USDOEM. E. Whatley, Oak Ridge National Lab.J. B. Whitsett, Idaho Operations Office, USDOEA. K. Williams, Bechtel National, Inc., San FranciscoD. D. Wodrich, Rockwell Hanford OperationsR. G. Wymer, Oak Ridge National Lab.