distribution and characterization of dissolved and...
TRANSCRIPT

Polar Biol (2009) 32:733–750
DOI 10.1007/s00300-008-0577-yORIGINAL PAPER
Distribution and characterization of dissolved and particulate organic matter in Antarctic pack ice
I. Dumont · V. Schoemann · D. Lannuzel · L. Chou · J.-L. Tison · S. Becquevort
Received: 2 September 2008 / Revised: 9 December 2008 / Accepted: 14 December 2008 / Published online: 14 January 2009© Springer-Verlag 2009
Abstract Distribution and composition of organic matterwere investigated in Antarctic pack ice in early springand summer. Accumulation of organic compounds wasobserved with dissolved organic carbon (DOC) and particu-late organic carbon (POC) reaching 717 and 470 �M C,respectively and transparent exopolymeric particles (TEP)up to 3,071 �g Xanthan gum equivalent l¡1. POC and TEPseemed to be inXuenced mainly by algae. Particulatesaccharides accounted for 0.2–24.1% (mean, 7.8%) of POC.Dissolved total saccharides represented 0.4–29.6% (mean,9.7%) of DOC, while dissolved free amino acids (DFAA)accounted for only 1% of DOC. Concentrations of TEPwere positively correlated with those of saccharides.Monosaccharides (d-MCHO) dominated during winter–earlyspring, whereas dissolved polysaccharides did in spring–
summer. DFAA were strongly correlated with d-MCHO,suggesting a similar pathway of production. The accumula-tion of monomers in winter is thought to result from limita-tion of bacterial activities rather than from the nature of thesubstrates.
Keywords Sea ice · Organic carbon · Monosaccharides · Polysaccharides · Amino acids · TEP
Introduction
Antarctic sea ice is a very dynamic ecosystem with anextent Xuctuating seasonally between 4 and 20 million km2
(Zwally et al. 1983). Such a vast annual formation and sub-sequent melting of sea ice have huge implications for thewhole Southern Ocean, and at a larger scale for global cli-mate (Brierley and Thomas 2002), by way of both physicaland biological processes. Sea ice provides a habitat formicroorganisms like algae, bacteria and protozoa, whichlive in the system of brine channels and pockets inside thesea ice cover. Extremely high levels of organic matter havebeen recorded in sea ice, which are up to several orders ofmagnitude greater than those in seawater (Thomas et al.1998, 2001a; Herborg et al. 2001). This organic matter iseither allochthonous, i.e. trapped during the ice formation(Giannelli et al. 2001) or autochthonous, i.e. producedwithin the sea ice via in situ biological activities.
Mechanisms of organic matter production include: extra-cellular release by microorganisms, grazer mediated releaseand excretion, release via cell lysis (by viral, bacterial,physical or osmotic mechanisms), solubilisation of particlesand bacterial transformations and release (Nagata 2000).Furthermore, in response to the extreme environmentalconditions encountered in sea ice, such as high salinity or
I. Dumont (&) · V. Schoemann · S. BecquevortEcologie des Systèmes Aquatiques, Faculté des Sciences, Université Libre de Bruxelles, Campus de la Plaine CP 221, Bd. du Triomphe, 1050 Brussels, Belgiume-mail: [email protected]
D. Lannuzel · L. ChouLaboratoire d’Océanographie Chimique et Géochimie des Eaux, Faculté des Sciences, Université Libre de Bruxelles, Campus de la Plaine CP 208, Bd. du Triomphe, 1050 Brussels, Belgium
J.-L. TisonUnité de Glaciologie, Faculté des Sciences, Université Libre de Bruxelles, CP 160/03, 50 Av. F.D. Roosevelt, 1050 Brussels, Belgium
Present Address:D. LannuzelAntarctic Climate and Ecosystems CRC, University of Tasmania, Private Bag 80, Hobart, TAS 7001, Australia
123

734 Polar Biol (2009) 32:733–750
low temperature, secretion and excretion by sea ice micro-organisms of speciWc compounds like ice-active substances(Raymond 2000; Janech et al. 2006), dimethylsulphonio-proprionate (DMSP) or extracellular polymeric substances(EPS) are enhanced (Brierley and Thomas 2002). Transfor-mations between dissolved and particulate organic poolsalso occur: dissolved organic matter can physically aggre-gate in minutes to hours to form more polymerized mole-cules (Chin et al. 1998) or conversely, particles can betransformed into dissolved form via, e.g. the enzymaticactivity of heterotrophic bacteria (Cho and Azam 1988).
The consumption of organic matter by heterotrophicorganisms is mainly due to bacteria but the uptake ofdissolved organic carbon (DOC) by protists, algae andArchaea is sometimes observed (Sherr and Sherr 1988;Marchant and Scott 1993; Palmisano and Garrison 1993;Brierley and Thomas 2002). The consumption of organicmatter by bacteria depends on the nature of the substrateand on the composition and physiological state of bacterialassemblages. Bacterial activity (e.g. enzymatic activities)and viability may be limited by low temperature (Delille1992; Nedwell 1999; Pomeroy and Wiebe 2001), highsalinity, or antibiotic eVects of compounds such as dimethyl-sulWde (DMS) and acrylic acid resulting from the break-down of DMSP (Thomas and Papadimitriou 2003).
The observed accumulation of organic matter clearlyreveals an uncoupling between these production and con-sumption processes (Carlson 2002; Thomas and Papadimitriou2003). A major consequence of this high pool of organicmatter in the ice and in particular of these EPS is a pro-found modiWcation of the habitat where microorganismslive. Indeed, gel-like particles such as transparent exopoly-meric particles (TEP), formed biotically (Passow 2002) orabiotically (Chin et al. 1998) from EPS, have been found inparticularly high concentrations in the sea ice ecosystem(Krembs and Engel 2001; Krembs et al. 2002; Meinerset al. 2004). The viscous nature of TEP yield to the brinechannels system special characteristics, notably for theretention of nutrients, organisms’ attachment, movement,space availability or protection against predators (Decho1990; Passow 2002). Then the classic microbial loop can bemodiWed and further lead to that large accumulation oforganic matter.
Improving our knowledge of the quantity and the type oforganic matter present in the sea ice is crucial to understandthe dynamics of the organic pool and to decipher the bio-logical processes governing both production and consump-tion of organic matter in sea ice. In addition, through theseasonal decay of the ice cover, the sea ice microbial com-munity and organic matter may aVect many processes in thewater column such as the initiation of blooms, the solubilityand bioavailability of iron (Geider 1999) and the eYciencyof the biological carbon pump.
In this paper, we investigate the distribution and concen-tration of the dissolved and particulate fraction of organicmatter along the size continuum in Antarctic pack ice sam-pled during the ARISE (spring 2003) and ISPOL (summer2004) cruises. In order to better tackle the processesinvolved in the removal and production of the organic mat-ter, not only are total particulate and dissolved concentra-tions described, but also the distribution of saccharides,amino acid and transparent exopolymeric particles.
Materials and methods
Sampling
Sea ice and under-ice seawater samples were collectedduring two Antarctic cruises in the pack ice zone: (a) the“ARISE IN THE EAST” (Antarctic Remote Ice SensingExperiment) research cruise onboard the RV AuroraAustralis in the Australian sector (64–65°S, 112–119°E) ofthe Southern Ocean in September–November 2003 and (b)the ISPOL (Ice Station POLarstern) cruise onboard theRV Polarstern in the Western Weddell Sea, AntarcticPeninsula (68°S, 55°W) in November 2004–January 2005(Fig. 1). The ARISE cruise was a spatio-temporal studywith the repetition of 1-day-long ice stations at diVerentlocations of a relatively limited spatial domain during theearly spring (Fig. 1). During the ISPOL cruise, the RVPolarstern was anchored to a large ice Xoe (few km in size)in order to follow the temporal variations of the physicaland biological atmospheric–ice–ocean processes at a drift-ing station during the transition from austral spring to sum-mer (Hellmer et al. 2008). Sea ice samples analysed in thisstudy have been collected, during ARISE at stations IV, V,IX and XII and at the ISPOL station on the 4/12, 9/12, 14/12, 19/12 and 30/12 (Fig. 1).
The ice covers sampled during these two cruises weretypical of Wrst year sea ice, grown in calm conditions, domi-nated by columnar/congelation ice with a thin surface layer(5–10 cm) of granular ice crystals (frazil and/or snow ice).The total ice thickness ranged from 0.6 to 0.9 m. TheARISE stations have been categorized into winter (cold)-and spring (warm)-type stations, taking into account theirrespective salinity, temperature and brine volume proWlesand related impact on the ice permeability (see classiWca-tion in Lannuzel et al. 2007). Having undergone a similargenesis, stations IV (winter type) and IX (spring type) canbe more particularly compared to each other (Lannuzelet al. 2007). The ice characteristics during the ISPOL cruisewere representative of the late spring–early summer transi-tion. Detailed ice physical properties are presented inLannuzel et al. (2007) for ARISE and in Lannuzel et al. (2008)and Tison et al. (2008) for ISPOL. On the basis of this
123

Polar Biol (2009) 32:733–750 735
broad classiWcation and textural similarity, results from thetwo cruises will be compared hereafter on a temporal scale.
Sampling was conducted at sites of 20 £ 20 m, located1 km away from the ship, using precautions to avoidorganic matter contaminations, which were also meant to
be trace metal clean (Lannuzel et al. 2006, 2007, 2008).Clean room garments (Tyvek overall, overshoes and poly-ethylene gloves) over warm clothes of operators were wornon site and a special electropolished stainless-steel corer, of14-cm diameter, was used to collect the ice cores. The ice
Fig. 1 Locations of sampling stations during ARISE and ISPOL expeditions (Schlitzer 2008)
123

736 Polar Biol (2009) 32:733–750
cores were stored at ¡28°C until further processing. Under-ice seawater (0, ¡1 and ¡30 m) was collected thanks to aportable peristaltic pump (Cole-Palmer, MasterXex E/P)and acid clean tubing. Seawater samples were transferredinto acid washed bottles abundantly rinsed with collectedsamples.
Onboard ship, ice cores used for organic carbon quantiW-cation (DOC and POC) were cut into 4 (ARISE) or 6(ISPOL) sections of 6-cm height. These 6-cm sections weresubsamples from the full length of the core, chosen on basisof the ice texture and visual observation of ice algae. A“twin” ice core (maximum 20 cm apart from the previousone) dedicated to the analysis of TEP, saccharides andamino acids was kept at ¡28°C and brought back to thehome laboratory. This ice core was then cut into 6-cm thickice sections, at the same depths as for the organic carbonquantiWcation.
Organic matter sample processing and analysis
All the material and glassware used for organic carbonsampling and measurements were either made of glasscleaned by ashing (4 h at 450°C), or washed with chromic-sulphuric acid (Merck), or made of TeXon cleaned by 10%HCl soaking and rinsed with ultra high purity water (UHP;18.2 M� cm) obtained from a water puriWcation systemequipped with a UV-lamp and organic cartridge (Milli-QElement, Millipore).
For POC and DOC, ice sections were melted onboard at4°C in the dark, during less than 24 h. Melted samples wereWltered through precombusted GF/F Wlters (Whatman,450°C, 4 h). Samples for POC were kept frozen (¡20°C).DOC samples were acidiWed with H3PO4 (0.05% Wnal con-centration) and stored in precombusted glass vials withTeXon septum in the dark at 4°C. Samples were analysedback in the home laboratories. POC was determined with aNA-2000 Fisons Instrument elemental analyzer (detectionlimit, 0.8 �mol C). DOC was measured by high-tempera-ture catalytic oxidation (HTCO; procedure of Sugimura andSuzuki 1988) using a Shimadzu TOC-5000 analyzer forARISE samples and a Dohrmann Apollo 9000 analyzer forISPOL samples. Carbon concentration was determinedusing a Wve-point calibration curve performed with stan-dards prepared by diluting a stock solution of potassiumphthalate in UHP water (Milli-Q Element system, Milli-pore). Each value corresponds to the average of at least Wveinjections. Samples were measured in duplicate and the rel-ative standard deviation never exceeded 2%. The accuracyof our DOC measurements was tested by analysing refer-ence materials provided by the Hansell laboratory (Univer-sity of Miami). We obtained an average concentration of45.1 § 0.7 �M C (n = 10) for deep-ocean reference mate-rial (Sargasso Sea Deep water, 2,600 m) and 1.4 § 0.7 �M
C (n = 10) for low-carbon reference water. Our values arewithin the nominal values provided by the Hansell labora-tory (44.0 § 1.5 and 2.0 § 1.5 �M C, respectively). Under-iceseawater DOC and POC concentrations were determinedusing the same methodology.
For qualitative analyses of organic matter (saccharides,amino acids and TEP), ice sections were thawed in pre-combusted glass beaker at 4°C in the dark. All handlingwas performed in a class 100 laminar Xow hood. For TEP,unWltered samples were poisoned with formaldehyde (2%Wnal concentration) and kept at 4°C until further process-ing. Melted samples were Wltered through precombustedGF/F Wlters (Whatman, 450°C, 4 h). Filters and Wltrateswere stored frozen (¡20°C) until analysis. Total particulatesaccharides (p-TCHO) and total dissolved saccharides(d-TCHO) were determined following the colorimetric TPTZ(2,4,6-tripyridyl-s-triazine) method of Myklestad et al.(1997), modiWed by Hung et al. (2001). The whole proce-dure was carried out in the dark because the reagents arelight-sensitive (van Oijen et al. 2003). d-TCHO includesmono- (d-MCHO) and polysaccharides (d-PCHO) whichare respectively the concentration before and after hydro-lysis (d-TCHO = d-MCHO + d-PCHO). Dissolved and par-ticulate samples were hydrolysed with HCl 0.1 N at 100°C,during 20 h (Burney and Sieburth 1977). Calibration curveswere obtained with D(+)-glucose and the values of saccha-rides were expressed as glucose equivalent. They were con-verted into carbon concentration using a conversion of6 mol of C per mole of glucose. The coeYcient of variation(CV, standard deviation/mean) of all triplicate measure-ments was below 5% and the detection limit was 1.0 �M C.Three blanks per analytical session were always treated andanalysed in the same way as the samples and subtractedfrom the concentration of the samples.
Dissolved free amino acids (DFAA) were measured fol-lowing the Xuorometric method of Parsons et al. (1984).The coeYcient of variation (CV, standard deviation/mean)of triplicate measurements was below 5%. A calibrationcurve was made with glycine. The detection limit was0.1 �M glycine. Concentrations were expressed in �M C byusing a conversion of 2 mol of C per mol of glycine. Simi-larly, the concentrations were converted into �M N using1 mol of N per mol of glycine.
Transparent exopolymeric particles were determinedaccording to the spectrophotometric method of Passow andAlldredge (1995). BrieXy, 10–15 ml subsamples were Wlteredonto 0.4-�m pore size polycarbonate Wlters (Nuclepore)using a vacuum pressure <150 mm Hg. TEP were stained withAlcian Blue solution (0.02% Alcian Blue, pH 2.5). Filterswere then extracted with 6 ml of 80% H2SO4 for 2 h, in thedark with constant stirring. Absorbance was measured againsta distilled water blank at 787 nm. The calibration was madeusing Xanthan Gum solution. Results are expressed as
123
Polar Biol (2009) 32:733–750 737
Xanthan Gum weight equivalent per litre (XAG l¡1). AllTEP determinations were performed in triplicate.
Algal and bacterial communities
For microscopic observations of algae and quantiWcation ofchlorophyll a (chl a), ice core sections were melted in thedark at 4°C in 0.2-�m-preWltered seawater (1:4, V:V;Garrison and Buck 1986). Algae were enumerated by invertedlight microscopy (100£ and 320£ magniWcations) accord-ing to Utermölh (1958) and by epiXuorescence microscopy(400£ magniWcation) after DAPI staining (Porter and Feig1980). Autotrophic biomasses were obtained using geomet-ric shapes (Hillebrand et al. 1999) and speciWc carbon bio-mass estimations from Menden-Deuer and Lessard (2000).Subsamples for chl a were Wltered onto Whatman GF/FWlters and then extracted in 90% (V:V) acetone in the darkat 4°C overnight. Chl a was quantiWed Xuorometricallyaccording to Yentsch and Menzel (1963). For bacterialcounts, ice core sections were melted in the dark at 4°C in0.2 �m-preWltered seawater (1:4, V:V) with addition offormaldehyde (2% Wnal conc.). Bacteria were enumeratedby epiXuorescence microscopy after DAPI staining (Porterand Feig 1980). Their biovolumes were estimated accord-ing to Watson et al. (1977) and converted into biomass afterSimon and Azam (1989).
Results
Algal and bacterial communities in sea ice
During both cruises, minimum chl a concentrations werefound in internal layers while maximum values wereobserved at the bottom of the ice cores (Table 1). Chl aranged between 0.14 and 27.98 �g l¡1 during ARISE andbetween 0.16 and 28.41 �g l¡1 during ISPOL. The domi-nant algal species present in sea ice are presented inTable 2. Typically, diVerent species were found in the sur-face and in the bottom layers, especially for ISPOL. Thesurface autotrophic community was dominated by dinoXag-ellates during ARISE, whereas it was dominated by theHaptophyte Phaeocystis sp. during ISPOL. Some pennatediatoms (Fragilariopsis sp.) were also observed in the sur-face layer. In the bottom layer, algal biomass was mainlycomposed of pennate diatoms. Fragilariopsis sp., Cylind-rotheca sp., Amphiprora sp. and Nitzschia sp. constitutedthe larger fraction of the diatom biomass. The bottom layerof station IX had the particularity to be the only placewhere autotrophic ciliates accounted for more than 50% ofthe algal biomass (Table 2). In the internal layers, pennateand centric diatoms were the dominant species in ARISEsamples, whereas pennates and Phaeocystis sp. were
mainly present in ISPOL internal layers. The bacteria weremore randomly distributed along the ice core with maxi-mum biomass sometimes not found in the bottom layer(Table 1). Bacterial biomasses ranged from 2.1 to 108.0 �gC l¡1 during ARISE and from 1.6 to 19.3 �g C l¡1 duringISPOL.
Distribution of particulate organic matter in sea ice
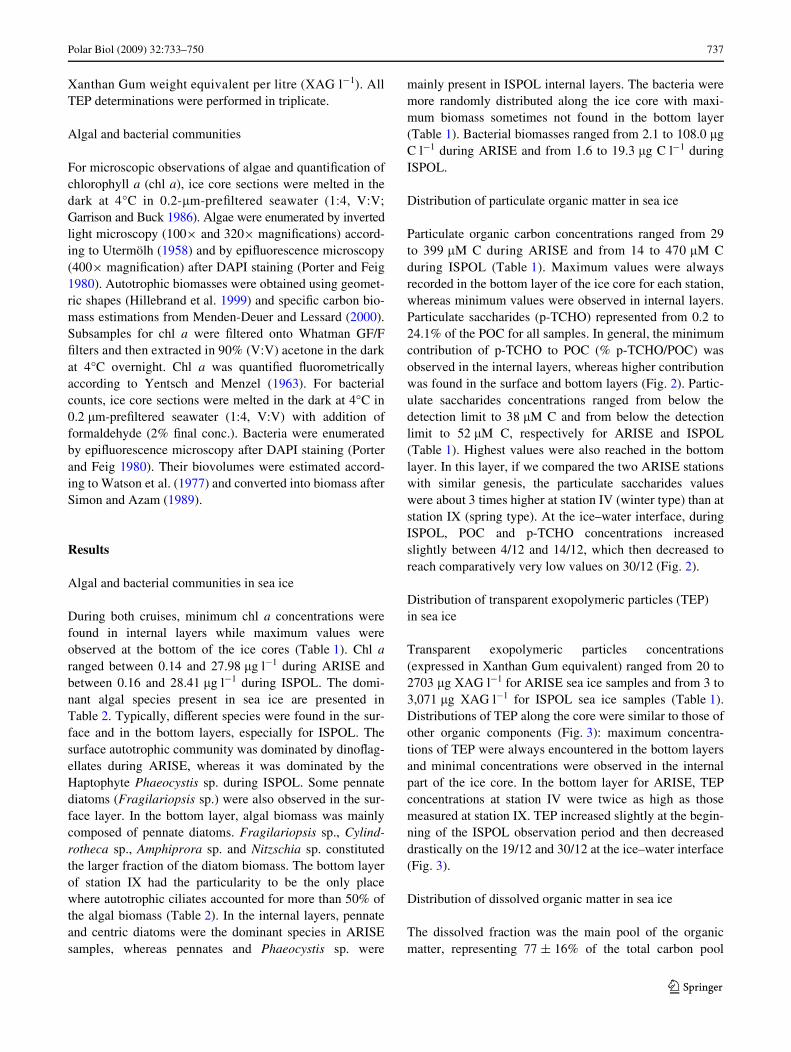
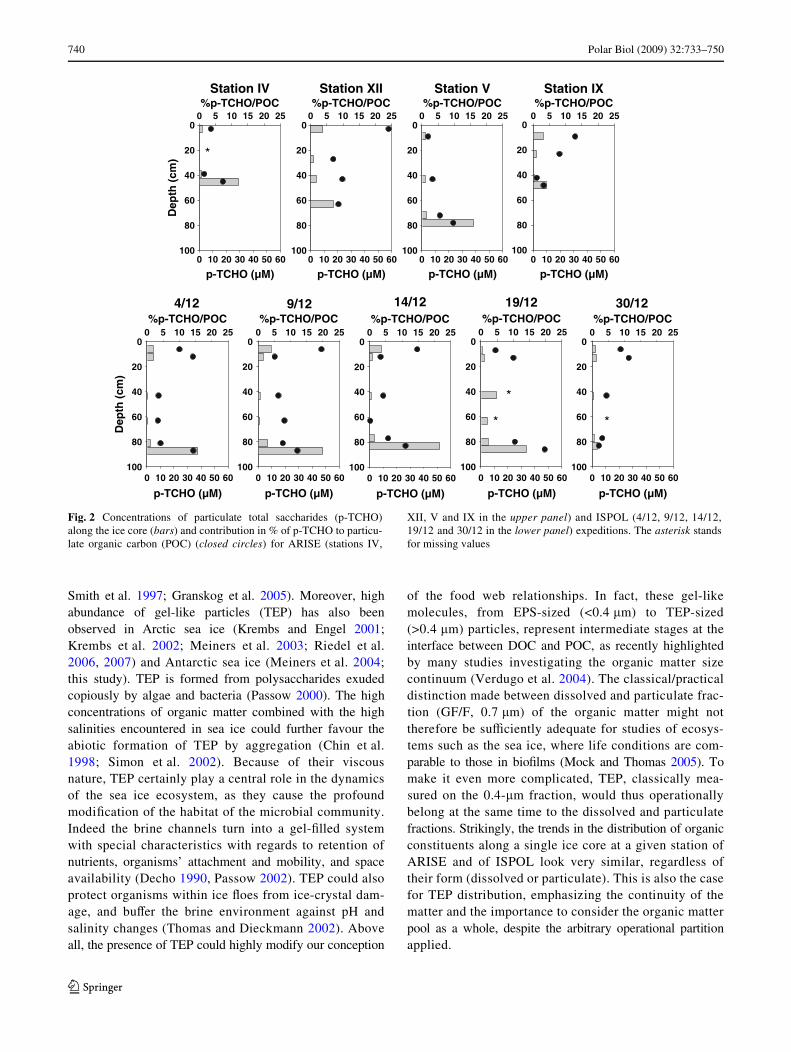
Particulate organic carbon concentrations ranged from 29to 399 �M C during ARISE and from 14 to 470 �M Cduring ISPOL (Table 1). Maximum values were alwaysrecorded in the bottom layer of the ice core for each station,whereas minimum values were observed in internal layers.Particulate saccharides (p-TCHO) represented from 0.2 to24.1% of the POC for all samples. In general, the minimumcontribution of p-TCHO to POC (% p-TCHO/POC) wasobserved in the internal layers, whereas higher contributionwas found in the surface and bottom layers (Fig. 2). Partic-ulate saccharides concentrations ranged from below thedetection limit to 38 �M C and from below the detectionlimit to 52 �M C, respectively for ARISE and ISPOL(Table 1). Highest values were also reached in the bottomlayer. In this layer, if we compared the two ARISE stationswith similar genesis, the particulate saccharides valueswere about 3 times higher at station IV (winter type) than atstation IX (spring type). At the ice–water interface, duringISPOL, POC and p-TCHO concentrations increasedslightly between 4/12 and 14/12, which then decreased toreach comparatively very low values on 30/12 (Fig. 2).
Distribution of transparent exopolymeric particles (TEP) in sea ice
Transparent exopolymeric particles concentrations(expressed in Xanthan Gum equivalent) ranged from 20 to2703 �g XAG l¡1 for ARISE sea ice samples and from 3 to3,071 �g XAG l¡1 for ISPOL sea ice samples (Table 1).Distributions of TEP along the core were similar to those ofother organic components (Fig. 3): maximum concentra-tions of TEP were always encountered in the bottom layersand minimal concentrations were observed in the internalpart of the ice core. In the bottom layer for ARISE, TEPconcentrations at station IV were twice as high as thosemeasured at station IX. TEP increased slightly at the begin-ning of the ISPOL observation period and then decreaseddrastically on the 19/12 and 30/12 at the ice–water interface(Fig. 3).
Distribution of dissolved organic matter in sea ice
The dissolved fraction was the main pool of the organicmatter, representing 77 § 16% of the total carbon pool
123

738 Polar Biol (2009) 32:733–750
Table 1 Concentrations of chlorophyll a (chl a, �g l¡1), particulateorganic carbon (POC, �M C), particulate saccharides (p-TCHO, �M C),dissolved organic carbon (DOC, �M C), dissolved monosaccharides(d-MCHO, �M C), dissolved total saccharides (d-TCHO, �M C),
dissolved free amino acids (DFAA, �M C), transparent exopolymericparticles (TEP, �g XAG l¡1) and bacterial biomass (�g C l¡1) forARISE and ISPOL expeditions
Depth (cm)
chl a (�g l¡1)
POC�M C
p-TCHO (�M C)
DOC (�M C)
d-MCHO (�M C)
d-TCHO (�M C)
DFAA (�M C)
TEP (�g XAG l¡1)
BB (�g C l¡1)a
ARISE Stn IV 0–6 0.22 57 2.0 119 3.0 3.0 0.3 556 6.2
01-oct-03 20–26 0.14 69 1.1 286 1.3 1.3 0.2 337 2.1
64°37.7�S 36–42 0.58 116 1.7 119 2.2 4.3 0.1 82 32.2
117°44.5�E 42–48 19.25 398 29.2 685 93.4 123.6 29.8 2,703 22.4
ARISE Stn V 7–10 3.93 142 2.7 244 8.1 14.9 2.0 590 19.7
07-oct–03 40–46 1.00 80 2.6 80 7.3 14.7 1.2 20 11.9
64°34.0�S 69–75 1.96 65 3.6 104 4.6 8.8 1.9 57 10.5
116°37.8�E 75–81 27.98 399 38.5 381 43.2 51.6 16.1 1,258 11.9
ARISE Stn IX 6–12 1.22 59 7.5 131 15.7 28.2 1.5 322 21.4
11-oct-03 20–26 0.62 29 2.4 101 5.1 10.0 0.5 199 52.0
64°24.1�S 39–45 0.93 67 0.7 ND 6.5 12.2 1.5 499 17.2
115°17.5�E 45–51 12.99 308 9.9 347 11.5 17.6 6.0 1,041 108.0
ARISE Stn XII 0–6 0.16 38 9.1 153 6.9 9.7 1.7 237 16.5
14-oct-03 24–30 0.28 32 2.3 ND 5.2 9.7 2.2 50 30.9
63°56.2�S 40–46 0.73 46 4.5 128 9.9 9.9 <DL 171 35.8
114°19.4�E 60–66 14.68 197 17.0 717 32.9 36.3 6.3 479 27.1
ISPOL 4/12 3–9 0.44 47 4.7 ND 9.2 22.0 0.9 52 9.8
9–15 0.44 36 5.1 ND 6.2 7.0 1.0 125 9.3
68°11.5�S 40–46 0.45 14 0.5 667 <DL 10.5 0.2 38 7.5
55°24.4�W 60–66 0.16 20 0.7 388 <DL 4.8 0.1 6 6.5
78–84 3.44 62 2.6 342 2.9 21.7 0.9 3 4.4
84–90 26.47 264 37.8 701 38.9 116.1 11.4 2,087 11.0
ISPOL 9/12 3–9 0.97 49 9.7 204 14.3 33.4 0.6 68 6.0
9–15 2.22 75 3.9 472 7.0 25.9 0.8 28 6.5
68°05.1�S 40–46 0.40 23 1.5 259 2.7 9.3 0.2 52 1.8
55°23.7�W 60–66 0.25 16 1.3 434 1.2 14.2 0.3 102 1.8
78–84 2.56 95 7.2 138 4.7 22.9 1.2 262 2.6
84–90 21.48 396 48.0 471 34.8 139.2 12.3 3,071 6.3
ISPOL 14/12 0–9 0.69 60 8.9 570 2.8 22.3 1.0 184 8.4
9–15 1.23 64 2.2 346 <DL 21.5 0.4 166 19.3
67°83.0�S 40–46 0.27 27 1.1 374 <DL 3.3 0.1 127 1.9
55°36.3�W 60–66 0.30 38 <DL 321 <DL 4.1 0.2 117 2.5
74–80 2.19 64 3.7 442 4.2 20.7 0.5 137 2.0
80–86 24.23 470 52.1 476 23.6 88.0 13.8 2,668 2.9
ISPOL 19/12 4–10 0.78 24 1.1 302 4.4 17.7 <DL 178 17.6
10–16 1.06 26 2.5 297 5.6 20.4 0.7 74 5.6
67°77.2�S 40–46 0.20 15 11.8 301 13.8 59.8 1.2 195 1.8
55°24.9�W 60–66 0.65 19 4.9 201 9.0 22.7 0.8 112 2.5
77–83 4.20 52 5.4 265 8.9 28.7 1.9 180 4.8
83–89 28.41 172 33.8 353 29.5 103.0 7.8 1,442 8.6
ISPOL 30/12 3–9 1.69 30 2.6 438 6.8 35.2 0.4 72 1.6
9–16 0.97 29 3.2 457 3.9 44.6 0.8 303 5.2
67°51.4�S 40–46 0.59 30.3 1.3 230 <DL 5.1 1.0 84 12.7
55°29.7�W 59–65 0.95 ND ND 106 1.0 7.4 0.5 86 3.5
74–80 3.62 44.5 1.4 106 0.5 15.2 0.6 37 2.5
80–86 24.77 167.3 3.6 208 16.3 38.6 6.7 385 3.3
a BB data for ARISE coming from Becquevort et al. (in revision)ND not determined, <DL below detection limit
123

Polar Biol (2009) 32:733–750 739
(TOC = DOC + POC). DOC concentrations ranged from80 to 717 �M C during ARISE and from 106 to 701 �MC during ISPOL (Table 1). Like for its particulate coun-terpart, highest concentrations were generally observed inthe bottom layer of the ice core. Dissolved saccharides(d-TCHO) and amino acids (DFAA) followed the sametrend along the core, with highest values almost alwaysfound in the layer at the interface between sea ice and sea-water (Fig. 4, 5). Total dissolved saccharides (d-TCHO)accounted for 0.4–29.6% of the dissolved organic poolfor all samples. The range of d-TCHO concentrationswas similar for the two campaigns and comprisedbetween 1.3 and 124 �M C during ARISE and between3.3 and 139 �M C during ISPOL (Table 1). However, inthe ARISE samples, monosaccharides were the mainform of d-TCHO (on average 69 § 20%) all along thecores, whereas in the ISPOL cores, polysaccharides weredominant (on average 78 § 17%). DFAA concentrationsranged from 0.1 to 29.8 �M C for the ARISE samples andfrom 0.1 to 13.8 �M C for ISPOL ones. DFAA accountedfor only 1.0 § 1.2% of the DOC for all samples. The con-tribution of dissolved saccharides to DOC (%d-TCHO/DOC) and that of dissolved amino acid (%DFFA/DOC)were generally lower in the interior of the ice (Fig. 4, 5).Comparing the results obtained at ARISE stations, higher
concentrations of d-TCHO and DFAA were observed in thebottom layer of station IV (winter type) compared to stationIX (spring type) (Fig. 4, 5). Monosaccharides reachedabout 100 �M C in this layer at station IV (Table 1). For theISPOL samples, the minimum concentration in the bottomlayer was reached on the 30/12.
Concentrations of organic matter in the water column
In the seawater underlying the sea ice, POC concentrationsaveraged 5.6 § 2.5 �M C (range, 2.3–9.6 �M C) duringARISE and 4.1 § 3.1 �M C (range, 2.0–10.8 �M C) duringISPOL. DOC concentrations were 106 § 76 �M C (range,44–272 �M C) during ARISE and a concentration of90 �M C was observed on the 25/12 during ISPOL (noother data available).
Discussion
Properties of organic matter in the sea ice environment
High levels of dissolved and particulate organic matterhave been observed in Antarctic sea ice (Tables 3, 4) aswell as in Arctic or Baltic sea ice (Thomas et al. 1995;
Table 2 Dominating taxa, % of estimated algal carbon biomass, in the surface, interior and bottom assemblages for ARISE and ISPOL expeditions
Stations Algal community composition
Surface Internal Bottom
ARISE Stn IV Pennate diatoms (98%)NanoXagellates (2%)
Pennate diatoms (66%)Centric diatoms (34%)
Pennate diatoms (72%)Centric diatoms (14%)DinoXagellates (14%)
ARISE Stn V Pennate diatoms (72%)DinoXagellates (23%)NanoXagellates (5%)
Pennate diatoms (52%)Centric diatoms (47%)NanoXagellates (1%)
Pennate diatoms (86%)DinoXagellates (8%)Ciliates (5%)Centric diatoms (1%)
ARISE Stn IX DinoXagellates (61%)Pennate diatoms (39%)
Pennate diatoms (86%)DinoXagellates (14%)
Ciliates (58%)Pennate diatoms (42%)
ARISE Stn XII DinoXagellates (97%)NanoXagellates (3%)
Pennate diatoms (50%)Centric diatoms (35%)DinoXagellates (15%)
DinoXagellates (75%)Pennate diatoms (25%)
ISPOL 4/12 Phaeocystis sp. (89%)Pennate diatoms (10%)
Phaeocystis sp. (40%)NanoXagellates (32%)Pennate diatoms (27%)
Pennate diatoms (99%)DinoXagellates (1%)
ISPOL 9/12 Phaeocystis sp. (77%)Pennate diatoms (17%)NanoXagellates (5%)
Pennate diatoms (41%)Phaeocystis sp. (36%)NanoXagellates (19%)
Pennate diatoms (99%)
ISPOL 14/12 Phaeocystis sp. (73%)Pennate diatoms (26%)NanoXagellates (1%)
Pennate diatoms (41%)Phaeocystis sp. (39%)NanoXagellates (19%)
Pennate diatoms (99%)
ISPOL 19/12 Phaeocystis sp. (71%)Pennate diatoms (28%)
Pennate diatoms (56%)Phaeocystis sp. (26%)NanoXagellates (18%)
Pennate diatoms (100%)
ISPOL 30/12 Phaeocystis sp. (78%)Pennate diatoms (22%)DinoXagellates (1%)
Pennate diatoms (66%)NanoXagellates (18%)Phaeocystis sp. (14%)
Pennate diatoms (98%)DinoXagellates (1%)
Major pennate diatoms observed in the surface layers were Fragilariopsis sp., Cylindrotheca sp. and in bottom layers were Cylindrotheca sp., Nitzschia sp., Amphiprora sp., Fragilariopsis sp
123
740 Polar Biol (2009) 32:733–750
Smith et al. 1997; Granskog et al. 2005). Moreover, highabundance of gel-like particles (TEP) has also beenobserved in Arctic sea ice (Krembs and Engel 2001;Krembs et al. 2002; Meiners et al. 2003; Riedel et al.2006, 2007) and Antarctic sea ice (Meiners et al. 2004;this study). TEP is formed from polysaccharides exudedcopiously by algae and bacteria (Passow 2000). The highconcentrations of organic matter combined with the highsalinities encountered in sea ice could further favour theabiotic formation of TEP by aggregation (Chin et al.1998; Simon et al. 2002). Because of their viscousnature, TEP certainly play a central role in the dynamicsof the sea ice ecosystem, as they cause the profoundmodiWcation of the habitat of the microbial community.Indeed the brine channels turn into a gel-Wlled systemwith special characteristics with regards to retention ofnutrients, organisms’ attachment and mobility, and spaceavailability (Decho 1990, Passow 2002). TEP could alsoprotect organisms within ice Xoes from ice-crystal dam-age, and buVer the brine environment against pH andsalinity changes (Thomas and Dieckmann 2002). Aboveall, the presence of TEP could highly modify our conception
of the food web relationships. In fact, these gel-likemolecules, from EPS-sized (<0.4 �m) to TEP-sized(>0.4 �m) particles, represent intermediate stages at theinterface between DOC and POC, as recently highlightedby many studies investigating the organic matter sizecontinuum (Verdugo et al. 2004). The classical/practicaldistinction made between dissolved and particulate frac-tion (GF/F, 0.7 �m) of the organic matter might nottherefore be suYciently adequate for studies of ecosys-tems such as the sea ice, where life conditions are com-parable to those in bioWlms (Mock and Thomas 2005). Tomake it even more complicated, TEP, classically mea-sured on the 0.4-�m fraction, would thus operationallybelong at the same time to the dissolved and particulatefractions. Strikingly, the trends in the distribution of organicconstituents along a single ice core at a given station ofARISE and of ISPOL look very similar, regardless oftheir form (dissolved or particulate). This is also the casefor TEP distribution, emphasizing the continuity of thematter and the importance to consider the organic matterpool as a whole, despite the arbitrary operational partitionapplied.
Fig. 2 Concentrations of particulate total saccharides (p-TCHO)along the ice core (bars) and contribution in % of p-TCHO to particu-late organic carbon (POC) (closed circles) for ARISE (stations IV,
XII, V and IX in the upper panel) and ISPOL (4/12, 9/12, 14/12,19/12 and 30/12 in the lower panel) expeditions. The asterisk standsfor missing values
Station IX
p-TCHO (µM)0 10 20 30 40 50 60
0
20
40
60
80
100
%p-TCHO/POC0 5 10 15 20 25
Station V
p-TCHO (µM)0 10 20 30 40 50 60
0
20
40
60
80
100
%p-TCHO/POC0 5 10 15 20 25
Station XII
p-TCHO (µM)0 10 20 30 40 50 60
0
20
40
60
80
100
%p-TCHO/POC0 5 10 15 20 25
Station IV
p-TCHO (µM)0 10 20 30 40 50 60
)mc(
htpe
D
0
20
40
60
80
100
%p-TCHO/POC0 5 10 15 20 25
*
30/12
p-TCHO (µM)0 10 20 30 40 50 60
0
20
40
60
80
100
%p-TCHO/POC0 5 10 15 20 25
19/12
p-TCHO (µM)0 10 20 30 40 50 60
0
20
40
60
80
100
%p-TCHO/POC0 5 10 15 20 25
*
* *
14/12
p-TCHO (µM)0 10 20 30 40 50 60
0
20
40
60
80
100
%p-TCHO/POC0 5 10 15 20 25
9/12
p-TCHO (µM)0 10 20 30 40 50 60
0
20
40
60
80
100
%p-TCHO/POC0 5 10 15 20 25
4/12
p-TCHO (µM)0 10 20 30 40 50 60
)mc(
htpe
D
0
20
40
60
80
100
%p-TCHO/POC0 5 10 15 20 25
123

Polar Biol (2009) 32:733–750 741
Concentrations and composition of organic matter
Particulate organic carbon concentrations reached up to470 �M C, comparably to the values previously reportedfor Antarctic sea ice (Table 3). POC may be associated withmicroorganism biomass, but a non-negligible part may nev-ertheless be detritus, non-associated with living organisms.A large fraction of detritus has already been observed at theend of winter in Antarctic sea ice (Garrison and Close1993) and in our ARISE samples where detritus can repre-sent up to 99% of the POC in some layers of the winter-type station (Becquevort et al. 2008, in revision). DOC inice cores was the major fraction of total organic carbon(TOC), accounting for 77 § 16% of TOC. This value isslightly lower than that observed in oceans where the dis-solved form typically represents 97% of TOC (Benner2002). Our Wnding can be viewed as a consequence of thepeculiarity of this highly organically concentrated andsaline system, favouring coagulation of DOC to POC. Theconcentrations of DOC measured in this study (from 80 to717 �M C) are in the same range as the few measurementspreviously reported for Antarctic sea ice (Table 4). In orderto consider TEP values expressed in �g XAG l¡1 in abroader context, they were converted into �g C l¡1 (TEP-C),thanks to an empirical conversion factor of 0.75 �g C �g¡1
XAG (Engel and Passow 2001). Caution should however
be taken while using this conversion factor because the car-bon content of TEP strongly depends on the origin of TEPprecursors and has so far been observed to vary between 39and 88% (w/w) (Engel 2004). The value of 75% used herewas determined for a diatom culture (Engel and Passow2001) and has been selected since the sea ice environmentis usually diatom-dominated. On this basis, estimated TEP-C made up on average 7.1 § 8.5% of the TOC and wouldroughly represent 25.8 § 18.9% of the POC, keeping inmind the diVerence in the Wltration porosity (0.4 vs.0.7 �m) in this case. Crude estimates of TEP-C have beenfound to reach contributions ranging between 14 and 32%of integrated POC in Antarctic sea ice (Meiners et al. 2004)and were considered as an important fraction of the particu-late pool, and of the carbon cycle. Particulate saccharides,dissolved saccharides and amino acids values measured inthis study were also in agreement with the few data earlierreported in sea ice (Tables 3, 4).
Concentrations of organic matter in Antarctic sea ice areusually up to 10- to 100-fold greater than those measured inAntarctic seawater (Thomas and Papadimitriou 2003).During ARISE and ISPOL, the concentrations of DOC andPOC in the underlying water column were indeed up to tentimes lower than those observed in sea ice. DOC and POCvalues measured during this study were in agreement withthe values found in the literature for Antarctic seawater
Fig. 3 Transparent exopolymeric particles (TEP) in �g XAG l¡1 along the ice core for ARISE (stations IV, XII, V and IX in the upper panel) andISPOL (4/12, 9/12, 14/12, 19/12 and 30/12 in the lower panel) expeditions
Station IX
TEP (µg XAG l-1)
0 1000 2000 3000
0
20
40
60
80
100
Station V
TEP (µg XAG l-1)
0 1000 2000 3000
0
20
40
60
80
100
Station XII
TEP (µg XAG l-1)
0 1000 2000 3000
0
20
40
60
80
100
Station IV
TEP (µg XAG l-1)
0 1000 2000 3000
)mc(
htpe
D
0
20
40
60
80
100
30/12
TEP (µg XAG l-1)
0 1000 2000 3000
0
20
40
60
80
100
19/12
TEP (µg XAG l-1)
0 1000 2000 3000
0
20
40
60
80
100
14/12
TEP (µg XAG l-1)
0 1000 2000 3000
0
20
40
60
80
100
9/12
TEP (µg XAG l-1)
0 1000 2000 3000
0
20
40
60
80
100
4/12
TEP (µg XAG l-1)
0 1000 2000 3000
)mc(
htpe
D
0
20
40
60
80
100
123

742 Polar Biol (2009) 32:733–750
(Tables 3, 4). Although measurements for TEP, saccharidesand amino acids were not available for seawater samplescollected during ARISE and ISPOL (except for TEP ofARISE, see Table 3), the comparison of our sea ice valueswith literature data for Antarctic waters (Tables 3, 4) seemsto show that the same trend of enrichment could also holdfor these compounds.
Until now, only a few studies have investigated the com-position of the dissolved and particulate organic matter insea ice (Tables 3, 4), and, to our knowledge, dissolved andparticulate fractions have never been reported together forthe same samples. In sea ice, the organic matter is stilllargely uncharacterized but the presence of EPS, TEP,saccharides and amino acids has already been evidenced(Herborg et al. 2001; Amon et al. 2001; Meiners et al. 2004;Riedel et al. 2006, 2007). We found a contribution ofp-TCHO to the POC pool which ranged from 0.2 to 24.1%in sea ice cores, which is similar to aquatic systems wherethe contribution of p-TCHO was reported to account for 5 to20% of the POC (Wakeham et al. 1997; Volkman andTanoue 2002). Total dissolved saccharides contributed to0.4–29.6% of the DOC. We observed a much smaller contri-
bution of dissolved free amino acids, ranging from 0.1 to4.4%, in our samples. Herborg et al. (2001) reported, in seaice core samples, an averaged saccharide contribution of29% to the DOC. Thomas et al. (2001a) found, for varioussea ice environments, a mean saccharide contribution of36% to the DOC, although their values ranged from 1 up to99%. These sea ice literature data cover obviously a widerange of contributions, which can be explained, however, bythe multitude of ice environments sampled (surface ponds,ice cores, gap layers, platelet ice and multiyear ice). Theranges found in the present study are consistent with thosegiven for oceanic systems, where saccharides and aminoacids generally account for, respectively 10–25 and 1–3% ofthe DOC in surface waters (Benner 2002). As mentionedbefore, saccharides are important precursors of polymersand thus of exopolymeric particle formation (Passow 2000).In this study, the TEP distribution was linearly positivelycorrelated with total (dissolved + particulate) saccharidesdistribution (r2 = 0.83, n = 44, P < 0.0001; Fig. 6), indicat-ing that the increase of TEP was parallel to that of the sac-charides pool. This trend supports the idea that TEP aremainly made of saccharides (Passow 2002; Engel 2004).
Fig. 4 Concentrations of dissolved total saccharides (d-TCHO) alongthe ice core, separated into monosaccharides (d-MCHO, black bar) andpolysaccharides (d-PCHO, grey bar) and contribution in % of d-TCHOto dissolved organic carbon (DOC) (closed circles) for ARISE
(stations IV, XII, V and IX in the upper panel) and ISPOL (4/12, 9/12,14/12, 19/12 and 30/12 in the lower panel) expeditions. The asteriskstands for missing values
Station IX
d-TCHO (µM)0 50 100 150
0
20
40
60
80
100
%d-TCHO/DOC0 5 10 15 20 25 30
Station V
d-TCHO (µM)0 50 100 150
0
20
40
60
80
100
%d-TCHO/DOC0 5 10 15 20 25 30
30/12
d-TCHO (µM)0 50 100 150
0
20
40
60
80
100
%d-TCHO/DOC0 5 10 15 20 25 30
19/12
d-TCHO (µM)0 50 100 150
0
20
40
60
80
100
%d-TCHO/DOC0 5 10 15 20 25 30
Station XII
d-TCHO (µM)0 50 100 150
0
20
40
60
80
100
%d-TCHO/DOC0 5 10 15 20 25 30
*
14/12
d-TCHO (µM)0 50 100 150
0
20
40
60
80
100
%d-TCHO/DOC0 5 10 15 20 25 30
9/12
d-TCHO (µM)0 50 100 150
0
20
40
60
80
100
%d-TCHO/DOC0 5 10 15 20 25 30
4/12
d-TCHO (µM)0 50 100 150
)mc(
htpe
D
0
20
40
60
80
100
%d-TCHO/DOC0 5 10 15 20 25 30
**
Station IV
d-TCHO (µM)
0 50 100 150
)mc(
htpe
D
0
20
40
60
80
100
%d-TCHO/DOC0 5 10 15 20 25 30
*
123

Polar Biol (2009) 32:733–750 743
Processes involved in organic matter distribution in sea ice
The enrichment of organic matter in sea ice is the result ofdiVerent processes, certainly co-acting. First, organic mat-ter (either microorganisms or detritus) can be physicallyconcentrated by the mechanisms of sea ice formation(Garrison et al. 1983, 1989; Grossmann and Dieckmann 1994;Giannelli et al. 2001), involving harvesting or scavengingof cells by frazil ice crystals rising through the water col-umn (Weeks and Ackley 1982) or by the increase of avail-able crystal substrate in the skeletal layer of the columnarice or in the platelet ice layer (Dieckmann et al. 1986). Sec-ond, the in situ production, by microorganism growth andsubsequent organic matter release, contribute to this highpool of organic material. High biomasses of microorgan-isms can indeed occur in the sea ice. In particular, in theautumn and in the late winter, favourable conditions suchas light and nutrient availability can be encountered in thesea ice as compared to the water column, leading to a largeaccumulation of biomass. Moreover, the narrow brinechannels exclude large heterotrophs from the sea ice matrixand therefore limit the consumption of this high biomass.Finally, limitation of bacterial activities and/or low substrate
quality (Thingstad et al. 1997) can also potentially hamperthe use of the available organic matter pool.
Production pathways
For both cruise, POC concentrations increased with chl aconcentrations (r2 = 0.74, n = 45, P < 0.0001), a commonproxy for algal biomass. This relation suggests that theincrease of POC was mainly associated with in situ algalproduction and thus that the particulate organic fractioncould be signiWcantly inXuenced by the algal biomass.However, when no chl a was recorded, a certain amount ofPOC (around 40 �M C) was nevertheless estimated to bepresent in the ice (intercept of the regression line). Possibly,a part of the POC in the ice was therefore not directlyrelated to the in situ algal activity, which would represent a“background” concentration. Such a kind of matter hasalready been observed in sea ice samples (Garrison andClose 1993). This residual fraction could be associated withthe physical incorporation of organic matter during ice for-mation, linked to organisms other than algae or result fromprevious microbial activities. Interestingly, this POC con-centration lies around the levels found in the internal layers
Fig. 5 Dissolved free amino acids concentrations (DFAA) along theice core (bars) and contribution in % of DFAA to dissolved organiccarbon (DOC) (closed circles) for ARISE (stations IV, XII, V and IX
in the upper panel) and ISPOL (4/12, 9/12, 14/12, 19/12 and 30/12 inthe lower panel) expeditions. The asterisk stands for missing values
Station IX
DFAA (µM C)
0 10 20 30
0
20
40
60
80
100
%DFFA/DOC0 1 2 3 4 5
*
Station V
DFAA (µM C)
0 10 20 30
0
20
40
60
80
100
%DFFA/DOC0 1 2 3 4 5
Station XII
DFAA (µM C)
0 10 20 30
0
20
40
60
80
100
%DFFA/DOC0 1 2 3 4 5
**
Station IV
DFAA (µM C)
0 10 20 30
)mc(
htpe
D
0
20
40
60
80
100
%DFFA/DOC0 1 2 3 4 5
30/12
DFAA (µM C)
0 10 20 30
0
20
40
60
80
100
%DFFA/DOC0 1 2 3 4 5
19/12
DFAA (µM C)
0 10 20 30
0
20
40
60
80
100
%DFFA/DOC0 1 2 3 4 5
14/12
DFAA (µM C)
0 10 20 30
0
20
40
60
80
100
%DFFA/DOC0 1 2 3 4 5
*
9/12
DFAA (µM C)
0 10 20 30
0
20
40
60
80
100
%DFFA/DOC0 1 2 3 4 5
4/12
DFAA (µM C)
0 10 20 30
)mc(
htpe
D
0
20
40
60
80
100
%DFFA/DOC0 1 2 3 4 5
**
*
123

744 Polar Biol (2009) 32:733–750
of the ARISE winter/spring ice cores (mean, 42.4 �M Cand see Table 1), suggesting that this POC had been incor-porated or produced earlier in the sea ice.
Maximal concentrations of particulate saccharides wereobserved in the bottom layer where algal biomass domi-nated, while minimal values were found in the internallayers of the ice cover. Particulate saccharides are likelyoriginating from algae since saccharides are major compo-nents of algal cells, for storage and structural functions andsince algae are major sources of organic matter (Bertillsonand Jones 2003). The co-occurrence of chl a maxima withp-TCHO maxima suggests the association of p-TCHO withalgal activity. Furthermore, the contribution of the particulatesaccharides to the POC pool (% p-TCHO/POC) paralleled
the p-TCHO distribution relatively well (Fig. 2), displayinghigher values in the bottom and surface layers and lower(minimal) values in the internal part of the ice core. Thehigher % p-TCHO/POC coincided with the layer wherehigher chl a, POC and p-TCHO concentrations wererecorded. Thus, where there is higher algal production,p-TCHO would contribute to a larger extent to the POC.The p-TCHO/POC ratio would then give an indication onthe relative “freshness” of the particulate organic matter.
Along the entire ice core, the p-TCHO/chl a ratio wasrather variable but this ratio was always smaller in the bot-tom ice (mean value, 16 § 8) as compared to internal andsurface layers. This p-TCHO/chl a ratio is very close to thevalue of 17 found in the literature and associated with living
Table 3 Concentrations of particulate organic carbon (POC, �M C), particulate saccharides (p-TCHO, �M C), and transparent exopolymeric par-ticles (TEP, �g XAG l¡1) measured in samples from Antarctic sea ice and seawater, compiled from literature
Mean values § standard deviation and ranges are given when available
<DL below detection limit
* TEP were quantiWed in abundance and not in concentration in �g XAG l¡1 in the study of Meiners et al. (2004)
Location, season and sample type POC (�M C) p-TCHO (�M C) TEP (�g XAG l¡1) Reference
1. Antarctic Sea ice
Weddell Sea,
Winter young pack (20–50 cm) 98 § 69 – – Garrison and Close (1993)
First year and older pack (<100 cm) 184 § 127 – –
Ross Sea, autumn
InWltration ice 39 – – Garrison et al. (2003)
Frazil ice 134 – –
Congelation ice 46 – –
Weddell Sea, summer/early autumn 175 § 240 – – Kennedy et al. (2002)
Bellingshausen Sea, late autumn 216 (16–832) – * Meiners et al. (2004)
Ross sea (Terra Nova Bay), spring, pack ice – 38 § 8 (18–77) – Guglielmo et al. (2000)
Australian sector (64–65°S, 112–119°E), end winter–early spring
29–399 <DL-38 20–2,703 This study, ARISE
Western Weddell Sea, Antarctic Peninsula (68°S, 55°W), spring–summer
14–470 <DL-52 3–3,071 This study, ISPOL
2. Antarctic Seawater
Weddell Sea, winter 5 – – Garrison and Close (1993)
Weddell Sea, summer/early autumn 17 § 8 – – Kennedy et al. (2002)
Bellinghausen Sea, late autumn 9 (3–30) – – Meiners et al. (2004)
Terra Nova Bay (Ross Sea), summer, under pack ice
20–100 1–7 (19% POC) – Pusceddu et al. (1999)
Ross Sea, summer 19 – Fabiano et al. (1993)
Terra Nova Bay (Ross Sea), summer 12.64 § 8.91 (1.01–39.23)
2.27 § 2.17 (0.28–14.80) (18% POC)
– Fabiano et al. (1996)
BransWeld Strait, summer – – 56.77 § 54.50 Corzo et al. (2005)
Ross Sea, Nov–Dec – – 308 (0–2,800) Hong et al. (1997)
Australian sector (64–65°S, 112–119°E), end winter–early spring
5.0 § 2.5 (1.7–9.2) – 133–853 This study, ARISE
Western Weddell Sea, Antarctic Peninsula (68°S, 55°W), spring–summer
3.56 § 2.87 (1.02–10.83) – – This study, ISPOL
123

Polar Biol (2009) 32:733–750 745
phytoplankton (Parsons et al. 1961 in Hung et al. 2003).The mean ratio observed in the bottom layer is thus inagreement with a living algal community. Variations of p-TCHO/chl a ratio are linked to the quantity of p-TCHOproduced by algae, which depends on (a) the type of thespecies present (diatoms vs. Xagellates; Hecky et al. 1973;Hung et al. 2003), (b) the growth stage (Biddanda and Ben-ner 1997) but also (c) the limitation status, by nutrient orlight, (Alderkamp et al. 2007). In our samples, complexinteractions of these diVerent parameters may explain theobserved ratios. For example, a nutrient limitation tends toincrease the speciWc (per cell) production of carbohydrates.The higher p-TCHO/chl a found in internal and surface lay-ers could be explained by an additional production of sac-charides by algae, potentially linked to a nutrient limitation.Indeed the internal and surface layers are more likely lim-ited by the availability of macro-nutrients as replenishmentfrom seawater does not occur in this closed system. Theeven higher p-TCHO/chl a ratio observed in the surfacelayer might, in the case of ISPOL samples, be linked to thepresence of Phaeocystis cells (Table 2), which can formcolonies having a matrix of polysaccharides (Alderkampet al. 2007).
Sea ice is considered as a favourable system for the abi-otic formation of TEP since aggregation depends on theconcentration of divalent cations (Simon et al. 2002) andprecursors (Chin et al. 1998) and since DOC and salinityincrease during freezing. Nevertheless, the abiotic transfor-mation of DOC to TEP via freeze-concentration has notbeen supported by observations in sea ice (Krembs et al.2002; this study). TEP can also be actively produced bymicroorganisms such as algae (Krembs et al. 2002; Meinerset al. 2003) or bacteria (Meiners et al. 2003). Hence, TEPdistribution along the ice core followed the chl a pattern,with the largest accumulation at the ice–water interface. Weobserved an increase of TEP when chl a increased(r2 = 0.65, n = 46, P < 0.0001), whereas no relationshipbetween TEP and bacterial numbers was found. This sug-gests that TEP were primarily produced by algae asobserved previously by Meiners et al. (2003, 2004) in seaice. Pennate diatoms have been shown to be the dominantproducers of TEP in sea ice (Krembs and Engel 2001). Pen-nate diatoms were indeed present in every layer sampledand dominated the autotrophic biomass in all our bottomice samples, with the exception of the bottom layer at sta-tion IX (Table 2).
Table 4 Concentrations of dissolved organic carbon (DOC, �M C), dissolved saccharides (d-TCHO, �M C), and dissolved free amino acids(DFAA, �M C) measured in samples from Antarctic sea ice and seawater, compiled from literature
Mean values § standard deviation and ranges are given when available
* Expressed in �M N
Location, season and sample type DOC (�M C) d-TCHO (�M C) DFAA (�M C) Reference
1. Antarctic Sea ice
Perennial pack ice 0–2,000 – – Thomas et al. (1998, 2001a)
Weddell Sea, April/May 109 § 83.5 (16–556) – – Thomas et al. (2001a)
Weddell Sea, January/March 207 § 239.6 (16–1,842) – – Thomas et al. (2001a)
Weddell Sea, platelet 100–200 – – Thomas et al. (2001b)
Weddell Sea, summer 254 § 133 53 § 22 (29% DOC) – Herborg et al. (2001)
Davis Station, Nov – – 8–30 Yang (1995)
Australian sector (64–65°S, 112–119°E), end winter–early spring
80–717 1.3–124 0.1–29.8 This study, ARISE
Western Weddell Sea, Antarctic Peninsula (68°S, 55°W), spring–summer
106–701 3.3–139 0.1–13.8 This study, ISPOL
2. Antarctic Seawater
Antarctic Ocean average <60 – – Ogawa and Tanoue (2003)
6°W meridian between 47° and 60°S, surface, early spring
38–55 – – Kähler et al. (1997)
Weddell Sea, summer 78 § 50 8 § 4 (18% DOC) – Herborg et al. (2001)
oV Queen Maud’s Land (69°38�S, 03°54�E), Jan
– 8–9 – Myklestad et al. (1997)
Drake Passage, BransWeld Strait, Weddell Sea, Dec
– – 0.44 § 0.16 * Hubberten et al. (1995)
Gerlache Strait, spring – – 0.3–0.6 Tupas et al. (1994)
Davis Station, May–Feb – – 0.30 Yang et al. (1990)
Australian sector (64–65°S, 112–119°E), end winter–early spring
102.5 § 66.7 (43.3–271.7) – – This study, ARISE
123

746 Polar Biol (2009) 32:733–750
In contrast with POC and TEP observations, there wasno signiWcant relation between DOC and chl a (r2 = 0.18,n = 42, P = 0.0057). This supports the view that the algalproduction and its directly associated trophic networkswere not the only factors controlling the DOC distribution;other indirect “spatio-temporal” delayed processes beingequally involved. Indeed, even if some studies have found ahigh correlation between DOC and chl a in Arctic bottomsea ice (Smith et al. 1997), the explanation of this relation-ship is not necessarily straightforward in sea ice (Thomaset al. 1995, 1998, 2001a). The DOC pool is in fact a mix-ture of compounds of diVerent origins and in various degra-dation states. A certain amount, like polysaccharides, forexample can be freshly produced by the algae, but theremaining fraction can be made of more refractory mole-cules. In the bottom layers, high DOC concentrations wereassociated with high chl a levels (Table 1) but there wereother layers where high DOC values were recordedtogether with low chl a levels. DOC did not seem to resultfrom massive breakage of POC by bacterial activities as noinverse relationship existed between POC and DOC con-centrations. Conversely, no evidence of transfer from DOCto POC was obvious from our data. Nevertheless, we can-not exclude that this mechanism has occurred as the highDOC concentrations measured in sea ice suggest that coag-ulation of DOC to TEP and POC is likely to occur in theseenvironmental conditions (Simon et al. 2002).
Dissolved total saccharides and amino acids reachedtheir maximal concentrations where chl a concentrationswere maximal. The d-TCHO and DFAA pools seemed thusrelated to the in situ algal production and then, may beconsidered as relatively fresh compounds of the DOC.d-TCHO and DFFA are indeed internal components of a cell,playing the role of osmolytes regulating vital functions insea ice (Lizotte 2003) or can also be excreted by algae. The
high positive regression between monosaccharides andamino acids (r2 = 0.91, n = 46, P < 0.0001, Fig. 7) stronglysuggests a similar production pathway of these compounds,likely cell lysis. In addition, the contribution of d-TCHO toDOC and of DFFA to DOC was higher in layers whered-TCHO, DOC and chl a concentrations were higher(Fig. 4, 5). These patterns, also noticed for % p-TCHO/POC,could be easily related to the distribution of the algalproduction in sea ice with internal layers, potentially morelimited and displaying less fresh production. Similarly the% d-TCHO/DOC and % DFAA/DOC provide informationabout the nature of the organic matter pool.
Removal pathways
The most labile components of DOM are monosaccharidesand amino acids, the latter constituting a signiWcant sourceof C and N for bacteria (Fuhrman and Ferguson 1986). Themonosaccharide pool is therefore more dynamic than thepolysaccharide one (Pakulski and Benner 1994). Low back-ground concentrations (at nanomolar level) of monosaccha-rides and DFAA are typically observed in oceanic watersbecause these compounds are directly usable (turnovertime, minutes to hours) by bacteria and generally taken uptoo rapidly to build up a detectable pool in the system(Carlson 2002). Nevertheless, accumulation of thesecompounds has sometimes been observed in seawater(Obernosterer and Herndl 1995; Williams 1995), e.g. inresponse to nutrient limitation, which aVects both algae andbacteria. In this study, an accumulation of dissolved mono-meric amino acids and sugars was recorded at the four stationsof the ARISE cruise. In particular, concentration of monosac-charides up to 100 �M C (76% of d-TCHO) was observedin the bottom layer of station IV (winter type). During ISPOL,the monomer concentrations stayed always below 40 �M C
Fig. 6 Relationship between transparent exopolymeric particles (TEP)and total saccharides concentrations (dissolved + particulate, TCHO)for sea ice samples from ARISE (black circles) and ISPOL (opendiamonds) expeditions
TCHO (µM C)
0 50 100 150 200
l G
AX
gµ( P
ET
1-)
0
500
1000
1500
2000
2500
3000
3500r² = 0.83
Fig. 7 Relationship between dissolved monosaccharides (d-MCHO)and dissolved free amino acids (DFAA) for sea ice samples fromARISE (black circles) and ISPOL (open diamonds) expeditions
DFAA (µM C)0 5 10 15 20 25 30 35
)C
Mµ( O
HC
M-d
0
20
40
60
80
100
r²= 0.91
123
Polar Biol (2009) 32:733–750 747
and the large accumulation of d-TCHO was due to theincrease of polysaccharides, representing 78 § 17%. Highmonosaccharide pools could result from massive bacterialectoenzymatic hydrolysis of polysaccharides into monosac-charides. The occurrence of such a process would beindicated by a negative correlation between d-MCHO andd-PCHO. No correlation was found for our samples. Animportant cell lysis phenomenon due to the extreme envi-ronmental conditions of the winter period could also explainthis accumulation of monomers (Thomas and Papadimitriou2003). The lysis hypothesis is actually supported by thehigh phosphate concentrations that we observed duringARISE and by the high proportion of detrital organic matter(Becquevort et al. 2008, in revision). Still regardless of theproduction pathway of these monomers, such a transientaccumulation would only be possible if their consumptionby bacteria was limited during the same period. All factorscontributing to the reduction of bacterial growth rate,biomass and carbon demand would lead to the accumulationof biodegradable DOC (Thingstad et al. 1997).
The unbalanced elemental composition of organic carbonin parallel to an inorganic nutrient limitation might hamperbacterial growth. For these monomeric organic substrates,we calculated a C/N ratio, estimated from d-MCHO andDFFA concentrations, using their carbon and nitrogen con-tent ([Cd-MCHO + CDFAA]/NDFAA). This ratio can only beregarded as a rough estimate of available substrates for bac-teria, since proteins and polysaccharides were not includedin these calculations. The C/N ratio varied between 5 and 12in the bottom layer, whereas the C/N ratio ranged from 8 to50 in the surface layers and from 2 to 37 in the internal sec-tions. If we consider the C/N ratio of bacteria being around 5(Bratbak 1985; Nagata 1986; Goldman et al. 1987; Lee andFuhrman 1987) and an estimated bacterial growth eYciency(i.e. the ratio between the C incorporated into bacterial bio-mass compared to the C taken up by bacteria, the rest beingrespired into CO2) of 20% (del Giorgio and Cole 1998), therange of C/N ratio estimated in the bottom ice can be con-sidered as a source of organic matter of very good qualityfor the consumption by bacteria. In the internal and surfacelayers, the C/N ratio can be higher meaning that the sub-strates were less well balanced regarding the bacterial meta-bolic requirements (i.e. C is in excess compared to N).Consequently, inorganic N amendment could sometimes beneeded to satisfy bacterial growth in these layers. The Pavailability for bacteria has been estimated from PO4 con-centration data (Tison et al. 2005; Becquevort et al. 2008, inrevision) as phosphorus is indeed preferentially used underits inorganic form by bacteria. The C/P ratio ranged between<1 and 32, with higher values in intermediate layers. Inregard to the highly variable C/P ratio of bacteria (8–464)depending on growth conditions (Kirchman 2000), the bac-teria seems not limited by the availability in P.
The lack of use of organic matter carbon could also beexplained by the limitation of bacteria growth due to theharsh physico-chemical conditions such as low tempera-ture, high salinity or presence of toxic compounds (Lizotte2003). This hypothesis of bacterial growth limitation lead-ing to monomers accumulation is reinforced by comparingthe winter-type station (station IV, ARISE) to the spring-type station (station IX, ARISE). A net decrease of dis-solved saccharides and amino acids in the bottom layerbetween these two stations was observed. Although keep-ing in mind the possibility of spatial heterogeneity or oforganic matter leakage into seawater, this decrease can alsobe attributed to enhanced microbial growth as evidenced bythe diVerent bacterial biomass observed at these two sta-tions (Table 1). Bacteria were indeed in higher abundancein the bottom layer of station IX compared to station IV. Ifwe consider a temporal scale, this suggests that bacteriawould have been capable of using the substrates accumu-lated during winter when the environmental conditionsbecame more favourable for growth. Unfortunately, ourdata did not enable us to conclude about which particularlimiting factor was acting at that time. The “bacterial limi-tation” hypothesis is nevertheless consistent with meltingexperiments (Kähler et al. 1997; Giesenhagen et al. 1999),in which dissolved organic matter released by sea ice hasbeen observed to be rapidly consumed by pelagic bacteria,suggesting that this material was very labile. During theISPOL cruise, conducted in December, the ice characteris-tics were representative of the spring–early summer periodwith the environmental conditions potentially more favour-able for microbial growth. Accumulation of monomericsubstrates was not observed and dissolved saccharides weremainly composed of polysaccharides, which are the mainexcretion product of algae (Myklestad 1995). This situationprobably reXects both active excretion by algae andeYcient utilization by bacteria. With the gradual warmingof the ice cover, all organic compounds concentrationsdecreased in the bottom ice, Xushed down with brines intothe seawater. In this context, our observations about, (1) thepresence and importance of TEP in sea ice and (2) the labil-ity of the organic matter, stressed the need to undertakemore studies concerning the fate of the ice-derived organicmatter in order to conclude on its impact on carbon export(through, e.g. marine snow or faecal pellets), potentialretention or export and bioavailability of the sea ice accu-mulated iron (Geider 1999).
Conclusion
This study provided a new set of data on dissolved and partic-ulate organic matter compounds in pack ice collected at twoAntarctic locations. Accumulation of dissolved and particulate
123

748 Polar Biol (2009) 32:733–750
organic matter was observed in Wrst year sea ice environmentand the importance of the size continuum, especially the roleof EPS and TEP, was pointed out through simultaneousmeasurements of all organic fractions. This gel matrix wasthought to be central to the concept of the trophic relationshipswithin the ice. Evaluation of the contribution of saccharides,amino acids and TEP to the organic matter pool has enabledus to highlight a fraction of the organic matter pool, called“fresh”, which was related to the algal production in the layerswhere algal biomass was maximal, i.e. mainly surface andbottom layers. This “fresh” production was directly reXectedby the increase of saccharides, amino acids and TEP concen-trations and by the simultaneous increase of their relative con-tribution to the total organic matter pool. The remnant part ofthe organic pool was probably made of older compounds,which eventually had already undergone transformations. Aspostulated, the saccharides represented a non-negligible partof the organic matter and showed a trend along the ice corematching that of TEP. Accumulation of monomers in winteris suggested to result from the limited bacterial activitiesrather than from the chemical nature of the substrates. Tempo-rally as the season evolved, a decrease in the organic pool wasobserved, likely due to the melting of the ice and/or theenhancement of the heterotrophic activities. If, like in oceanicsystems, a large part of the organic matter still remainsunidentiWed, our study has highlighted the importance ofTEP, saccharides and amino acids as key constituents toinvestigate in the sea ice environment.
Acknowledgments I. Dumont is supported by a FRIA (Fonds pourla Recherche en Industries Agronomiques) grant. The authors aregrateful to the oYcers and crews of the R.V. Aurora Australis and RVPolarstern for their logistic assistance during the ARISE and ISPOLcruises. We would like to thank the Australian Antarctic Division,especially Ian Allison (Expedition Leader) and Rob Massom (ChiefScientist), for inviting us on the “ARISE in the East” endeavour and theAWI, especially Michael Spindler, David Thomas and GerhardDieckmann for allowing us to take part in the ISPOL campaign. Thesupports from Bruno Delille and Jeroen de Jong for Weld assistance,from Anne Trevena for her great help in the organization of the ARISEcruise, ice core sub-sampling and salinity measurements are greatlyacknowledged. Frédéric Brabant is warmly thanked for helping withcore handling. This work was carried out in the framework of theBelgian research program Action de Recherche Concertée “Sea IceBiogeochemistry in a CLIMate change perspective” (ARC-SIBCLIM)Wnanced by the Belgian French Community under contract noARC-02/7- 318287. This is also a contribution to the EuropeanNetwork of Excellence EUR–OCEANS (contract no 511106-2) and tothe BELCANTO project (contracts SD/CA/03A&B) Wnanced by theBelgian Federal Science Policy OYce. The present study is a Belgianinput to the SOLAS international research initiative.
References
Alderkamp AC, Buma AGJ, van Rijssel M (2007) The carbohydratesof Phaeocystis and their degradation in the microbial food web.Biogeochemistry 83:99–118
Amon RMW, Fitznar HP, Benner R (2001) Linkages among the bior-eactivity, chemical composition, and diagenetic state of marinedissolved organic matter. Limnol Oceanogr 46:287–297
Becquevort S, Dumont I, Tison J-L, Lannuzel D, Sauvée M-L, ChouL, Schoemann V (2008) Biogeochemistry and microbial commu-nity composition in sea ice and underlying seawater oV EastAntarctica during early spring. Polar Biol (in revision)
Benner R (2002) Chemical composition and reactivity. In: HansellDA, Carlson CA (eds) Biogeochemistry of marine dissolvedorganic matter. Academic Press, New York, pp 59–90
Bertilsson S, JBJr Jones (2003) Supply of dissolved organic matter toaquatic ecosystems: autochthonous sources. In: Findlay SEG,Sinsabaugh RL (eds) Aquatic ecosytems: interactivity of dissolvedorganic matter. Academic Press, New York, pp 4–24
Biddanda B, Benner R (1997) Carbon, nitrogen, and carbohydrateXuxes during the production of particulate and dissolved organicmatter by marine phytoplankton. Limnol Oceanogr 42:506–518
Bratbak G (1985) Bacterial biovolume and biomass estimations. ApplEnviron Microbiol 49:1488–1493
Brierley AS, Thomas DN (2002) Ecology of Southern Ocean pack ice.Adv Mar Biol 43:171–276
Burney CM, Sieburth JM (1977) Dissolved carbohydrates in seawater.2. A spectrophotometric procedure for total carbohydrates analy-sis and polysaccharides determination. Mar Chem 5:15–28
Carlson CA (2002) Production and removal processes. In: Hansell DA,Carlson CA (eds) Biogeochemistry of marine dissolved organicmatter. Academic Press, New York, pp 91–152
Chin WC, Orellana MV, Verdugo P (1998) Spontaneous assembly ofmarine dissolved organic matter into polymer gels. Nature391:568–572
Cho BC, Azam F (1988) Major role of bacteria in biogeochemical Xux-es in the oceans interior. Nature 332:441–443
Corzo A, Rodriguez-Galvez S, Lubian L, Sangra P, Martinez A,Morillo JA (2005) Spatial distribution of transparent exopolymerparticles in the BransWeld Strait, Antarctica. J Plankton Res27:635–646
Decho AW (1990) Microbial exopolymer secretions in ocean environ-ments—their role(s) in food webs and marine processes. Ocea-nogr Mar Biol 28:73–153
del Giorgio P, Cole JJ (1998) Bacterial growth eYciency in naturalaquatic systems. Annu Rev Ecol Syst 29:503–541
Delille D (1992) Marine bacterioplankton at the Weddell Sea ice edge,distribution of psychrophilic and psychrotrophic populations.Polar Biol 12:205–210
Dieckmann GS, Rohardt G, Hellmer H, Kipfstuhl J (1986) The occur-rence of ice platelets at 250 m depth near the Filchner Ice Shelfand its signiWcance for sea ice biology. Deep Sea Res 33:141–148
Engel A (2004) Distribution of transparent exopolymer particles (TEP)in the northeast Atlantic Ocean and their potential signiWcance foraggregation processes. Deep Sea Res Part I 51:83–92
Engel A, Passow U (2001) Carbon and nitrogen content of transparentexopolymer particles (TEP) in relation to their Alcian Blueadsorption. Mar Ecol Prog Ser 219:1–10
Fabiano M, Povero P, Danovaro R (1993) Distribution and composi-tion of particulate organic-matter in the Ross Sea (Antarctica).Polar Biol 13:525–533
Fabiano M, Povero P, Danovaro R (1996) Particulate organic mattercomposition in Terra Nova Bay (Ross Sea, Antarctica) duringsummer 1990. Antarct Sci 8:7–13
Fuhrman JA, Ferguson RL (1986) Low concentrations and rapid turn-over of dissolved free amino acids in seawater: chemical andmicrobiological measurements. Mar Ecol Prog Ser 33:237–242
Garrison DL, Buck KR (1986) Organism losses during ice melting: aserious bias in sea ice community studies. Polar Biol 6:237–239
Garrison DL, Close AR (1993) Winter ecology of the sea-ice biota inWeddell Sea pack ice. Mar Ecol Prog Ser 96:17–31
123
Polar Biol (2009) 32:733–750 749
Garrison DL, Ackley SF, Buck KR (1983) A physical mechanism forestablishing algal populations in frazil ice. Nature 306:363–365
Garrison DL, Close AR, Reimnitz E (1989) Algae concentrated by fra-zil ice: evidence from laboratory experiments and Weld measure-ments. Antarct Sci 1:313–316
Garrison DL, JeVries MO, Gibson A, Coale SL, Neenan D, Fritsen C,Okolodkov YB, Gowing MM (2003) Development of sea icemicrobial communities during autumn ice formation in the RossSea. Mar Ecol Prog Ser 259:1–15
Geider RJ (1999) Biological oceanography—complex lessons of ironuptake. Nature 400:815–816
Giannelli V, Thomas DN, Haas C, Kattner G, Kennedy H, DieckmannGS (2001) Behaviour of dissolved organic matter and inorganicnutrients during experimental sea-ice formation. Ann Glaciol33:317–321
Giesenhagen HC, Detmer AE, de Wall J, Weber A, Gradinger RR,Jochem FJ (1999) How are Antarctic planktonic microbial foodwebs and algal blooms aVected by melting of sea ice? Microcosmsimulations. Aquat Microb Ecol 20:183–201
Goldman JC, Caron DA, Dennett MR (1987) Regulation of grossgrowth eYciency and ammonium regeneration in bacteria bysubstrate C:N ratio. Limnol Oceanogr 32:1239–1252
Granskog M, Kaartokallio H, Kuosa H, Thomas D, Ehn J, Sonninen E(2005) Scales of horizontal patchiness in chlorophyll a, chemicaland physical properties of landfast sea ice in the Gulf of Finland(Baltic Sea). Polar Biol 28:276–283
Grossmann S, Dieckmann GS (1994) Bacterial standing stock, activityand carbon production during formation and growth of sea ice inthe Weddell Sea. Appl Environ Microbiol 60:2746–2753
Guglielmo L, Carrada GC, Catalano G, Dell’Anno A, Fabiano M,Lazzara L, Mangoni O, Pusceddu A, Saggiomo V (2000) Struc-tural and functional properties of sympagic communities in theannual sea ice at Terra Nova Bay (Ross Sea, Antarctica). PolarBiol 23:137–146
Hecky RE, Mopper K, Kilham P, Degens ET (1973) The amino acidand sugar composition of diatom cell-walls. Mar Biol 19:323–331
Hellmer HH, Schroder M, Haas C, Dieckmann GS, Spindler M (2008)The ISPOL drift experiment. Deep Sea Res Part II 55:913–917
Herborg LM, Thomas DN, Kennedy H, Haas C, Dieckmann GS(2001) Dissolved carbohydrates in Antarctic sea ice. Antarct Sci13:119–125
Hillebrand H, Dürselen CD, Kirschtel D, Zohary T, Pollingher U(1999) Biovolume calculation for pelagic and benthic microalgae.J Phycol 35:403–424
Hong Y, Smith WO, White AM (1997) Studies on transparent exo-polymer particles (TEP) produced in the Ross Sea (Antarctica)and by Phaeocystis antarctica (Prymnesiophyceae). J Phycol33:368–376
Hubberten U, Lara RJ, Kattner G (1995) Refractory organic-compoundsin polar waters—relationship between humic substances andamino-acids in the Arctic and Antarctic. J Mar Res 53:137–149
Hung CC, Tang DG, Warnken KW, Santschi PH (2001) Distributionsof carbohydrates, including uronic acids, in estuarine waters ofGalveston Bay. Mar Chem 73:305–318
Hung CC, Guo LD, Santschi PH, Alvarado-Quiroz N, Haye JM (2003)Distributions of carbohydrate species in the Gulf of Mexico. MarChem 81:119–135
Janech MG, Krell A, Mock T, Kang JS, Raymond JA (2006) Ice-bind-ing proteins from sea ice diatoms (Bacillariophyceae). J Phycol42:410–416
Kähler P, Bjornsen PK, Lochte K, Antia A (1997) Dissolved organicmatter and its utilization by bacteria during spring in the SouthernOcean. Deep Sea Res Part II 44:341–353
Kennedy H, Thomas DN, Kattner G, Haas C, Dieckmann GS (2002)Particulate organic matter in Antarctic summer sea ice: concentra-tion and stable isotopic composition. Mar Ecol Prog Ser 238:1–13
Kirchman DL (2000) Uptake and regeneration of inorganic nutrientsby marine heterotrophic bacteria. In: Kirchman DL (ed) Micro-bial ecology of the oceans. Wiley-Liss, New York, pp 261–288
Krembs C, Engel A (2001) Abundance and variability of microorgan-isms and transparent exopolymer particles across the ice–waterinterface of melting Wrst-year sea ice in the Laptev Sea (Arctic).Mar Biol 138:173–185
Krembs C, Eicken H, Junge K, Deming JW (2002) High concentra-tions of exopolymeric substances in Arctic winter sea ice: impli-cations for the polar ocean carbon cycle and cryoprotection ofdiatoms. Deep Sea Res Part I 49:2163–2181
Lannuzel D, de Jong J, Schoemann V, Trevena A, Tison JL, Chou L(2006) Development of a sampling and Xow injection analysistechnique for iron determination in the sea ice environment. AnalChim Acta 556:476–483
Lannuzel D, Schoemann V, de Jong J, Tison JL, Chou L (2007) Distri-bution and biogeochemical behaviour of iron in the East Antarcticsea ice. Mar Chem 106:18–32
Lannuzel D, Schoemann V, de Jong J, Chou L, Delille B, BecquevortS, Tison JL (2008) Iron study during a time series in the westernWeddell pack ice. Mar Chem 108:85–95
Lee S, Fuhrman JA (1987) Relationships between biovolume and bio-mass of naturally derived marine bacterioplankton. Appl EnvironMicrobiol 53:1298–1303
Lizotte MP (2003) The microbiology of sea ice. In: Thomas DN,Dieckmann GS (eds) Sea ice-an introduction to its physics,chemistry, biology and geology. Blackwell, Oxford, pp 184–210
Marchant HJ, Scott FJ (1993) Uptake of submicrometer particles anddissolved organic material by Antarctic choanoXagellates. MarEcol Prog Ser 92:59–64
Meiners K, Gradinger R, Fehling J, Civitarese G, Spindler M (2003)Vertical distribution of exopolymer particles in sea ice of theFram Strait (Arctic) during autumn. Mar Ecol Prog Ser 248:1–13
Meiners K, Brinkmeyer R, Granskog MA, Lindfors A (2004) Abun-dance, size distribution and bacterial colonization of exopolymerparticles in Antarctic sea ice (Bellingshausen Sea). Aquat MicrobEcol 35:283–296
Menden-Deuer S, Lessard EJ (2000) Carbon to volume relationshipsfor dinoXagellates, diatoms, and other protist plankton. LimnolOceanogr 45:569–579
Mock T, Thomas DN (2005) Recent advances in sea-ice microbiology.Environ Microbiol 7:605–619
Myklestad SM (1995) Release of extracellular products by phyto-plankton with special emphasis on polysaccharides. Sci TotalEnviron 165:155–164
Myklestad SM, Skanoy E, Hestmann S (1997) A sensitive and rapidmethod for analysis of dissolved mono- and polysaccharides inseawater. Mar Chem 56:279–286
Nagata T (1986) Carbon and nitrogen content of natural planktonicbacteria. Appl Environ Microbiol 52:28–32
Nagata T (2000) Production mechanisms of dissolved organic matter.In: Kirchman DL (ed) Microbial ecology of the oceans. Wiley-Liss,New York, pp 121–152
Nedwell DB (1999) EVect of low temperature on microbial growth:lowered aYnity for substrates limits growth at low temperature.FEMS Microbiol Ecol 30:101–111
Obernosterer I, Herndl GJ (1995) Phytoplankton extracellular releaseand bacterial-growth—dependence on the inorganic N-P ratio.Mar Ecol Prog Ser 116:247–257
Ogawa H, Tanoue E (2003) Dissolved organic matter in oceanicwaters. J Oceanogr 59:129–147
Pakulski JD, Benner R (1994) Abundance and distribution of carbo-hydrates in the ocean. Limnol Oceanogr 39:930–940
Palmisano AC, Garrison DL (1993) Microorganisms in Antarctic seaice. In: Friedmann EI (ed) Antarctic microbiology. Wiley-Liss,New York, pp 167–218
123

750 Polar Biol (2009) 32:733–750
Parsons TR, Stephens K, Strickland JDH (1961) On the chemical com-position of eleven species of marine phytoplankton. J Fish BoardCan 18:1001–1016
Parsons TR, Maita Y, Lalli CM (1984) Determination of dissolved freeamino acids by Xuorimetric analysis. A manual of chemical andbiological methods for seawater analysis. Pergamon Press
Passow U (2000) Formation of transparent exopolymer particles,TEP, from dissolved precursor material. Mar Ecol Prog Ser192:1–11
Passow U (2002) Production of transparent exopolymer particles(TEP) by phyto- and bacterioplankton. Mar Ecol Prog Ser 236:1–12
Passow U, Alldredge AL (1995) Aggregation of a diatom bloom in amesocosm—the role of transparent exopolymer particles (TEP).Deep Sea Res Part II 42:99–109
Pomeroy LR, Wiebe WJ (2001) Temperature and substrates as inter-active limiting factors for marine heterotrophic bacteria. AquatMicrob Ecol 23:187–204
Porter KG, Feig YS (1980) The use of DAPI for identifying and count-ing aquatic microXora. Limnol Oceanogr 25:943–948
Pusceddu A, Cattaneo-Vietti R, Albertelli G, Fabiano M (1999)Origin, biochemical composition and vertical Xux of particulateorganic matter under the pack ice in Terra Nova Bay (Ross Sea,Antarctica) during late summer 1995. Polar Biol 22:124–132
Raymond JA (2000) Distribution and partial characterization ofice-active molecules associated with sea-ice diatoms. Polar Biol23:721–729
Riedel A, Michel C, Gosselin M (2006) Seasonal study of sea-ice exo-polymeric substances (EPS) on the Mackenzie Shelf: implicationsfor transport of sea-ice bacteria and algae. Aquat Microb Ecol45:195–206
Riedel A, Michel C, Gosselin M, LeBlanc B (2007) Enrichment ofnutrients, exopolymeric substances and microorganisms in newlyformed sea ice on the Mackenzie shelf. Mar Ecol Prog Ser342:55–67
Schlitzer R. (2008) Ocean data view, http://odv.awi.deSherr E, Sherr B (1988) Role of microbes in pelagic food webs—a re-
vised concept. Limnol Oceanogr 33:1225–1227Simon M, Azam F (1989) Protein content and protein synthesis rate of
planktonic marine bacteria. Mar Ecol Prog Ser 51:201–213Simon M, Grossart HP, Schweitzer B, Ploug H (2002) Microbial ecol-
ogy of organic aggregates in aquatic ecosystems. Aquat MicrobEcol 28:175–211
Smith REH, Gosselin M, Kudoh S, Robineau B, Taguchi S (1997)DOC and its relationship to algae in bottom ice communities.J Mar Syst 11:71–80
Sugimura Y, Suzuki Y (1988) A high-temperature catalytic-oxidationmethod for the determination of non-volatile dissolved organic-carbon in seawater by direct injection of a liquid sample. MarChem 24:105–131
Thingstad TF, Hagstrom A, Rassoulzadegan F (1997) Accumulation ofdegradable DOC in surface waters: is it caused by a malfunction-ing microbial loop? Limnol Oceanogr 42:398–404
Thomas DN, Dieckmann GS (2002) Ocean science—Antarctic Seaice—a habitat for extremophites. Science 295:641–644
Thomas DN, Papadimitriou S (2003) Biogeochemistry of sea ice. In:Thomas DN, Dieckmann GS (eds) Sea ice-an introduction toits physics, chemistry, biology and geology. Blackwell, Oxford,pp 267–302
Thomas DN, Lara RJ, Eicken H, Kattner G, Skoog A (1995) Dissolvedorganic-matter in Arctic multiyear sea-ice during winter - major
components and relationship to ice characteristics. Polar Biol15:477–483
Thomas DN, Lara RJ, Haas C, Schnack-Schiel SB, Dieckmann GS,Kattner G, Nöthig E-M, Mizdalski E (1998) Biological soup with-in decaying summer sea ice in the Amundsen Sea, Antarctica. In:Lizotte MP, Arrigo KR (eds) Antarctic Sea ice—biological pro-cesses, interactions and variability. American Geophysical Union(AGU), Washington, DC, pp 161–171
Thomas DN, Kattner G, Engbrodt R, Giannelli V, Kennedy H, Haas C,Dieckmann GS (2001a) Dissolved organic matter in Antarctic seaice. Ann Glaciol 33:297–303
Thomas DN, Kennedy H, Kattner G, Gerdes D, Gough C, DieckmannGS (2001b) Biogeochemistry of platelet ice: its inXuence on par-ticle Xux under fast ice in the Weddell Sea, Antarctica. Polar Biol24:486–496
Tison J-L, Lancelot C, Chou L, Lannuzel D, de Jong J, Schoemann V,Becquevort S, Trevena A, Verbeke V, Lorrain R, Delille B (2005)Biogéochimie de la glace de mer dans la perspective des change-ments climatiques, Annual Report ARC 2003–2004, pp 71
Tison JL, Worby A, Delille B, Brabant F, Papadimitriou S, Thomas D,de Jong J, Lannuzel D, Haas C (2008) Temporal evolution ofdecaying summer Wrst-year sea ice in the Western Weddell Sea,Antarctica. Deep Sea Res Part II 55:975–987
Tupas LM, Koike I, Karl DM, Holmhansen O (1994) Nitrogen-metab-olism by heterotrophic bacterial assemblages in Antarctic coastalwaters. Polar Biol 14:195–204
Utermölh H (1958) Zur Vervelkommnung der quantitativen Phyto-plankton-Methodik. Mitt Int Verein Theor Angew Limnol 9:1–38
van Oijen T, van Leeuwe MA, Gieskes WWC (2003) Variation ofparticulate carbohydrate pools over time and depth in a diatom-dominated plankton community at the Antarctic Polar Front.Polar Biol 26:195–201
Verdugo P, Alldredge AL, Azam F, Kirchman DL, Passow U, SantschiPH (2004) The oceanic gel phase: a bridge in the DOM-POM con-tinuum. Mar Chem 92:67–85
Volkman JK, Tanoue E (2002) Chemical and biological studies of par-ticulate organic matter in the ocean. J Oceanogr 58:265–279
Wakeham SG, Lee C, Hedges JI, Hernes PJ, Peterson ML (1997)Molecular indicators of diagenetic status in marine organic mat-ter. Geochim Cosmochim Acta 61:5363–5369
Watson SW, Novitsky TJ, Quinby HL, Valois FW (1977) Determina-tion of bacterial number and biomass in the marine environment.Appl Environ Microbiol 33:940–946
Weeks WF, Ackley SF (1982) The growth, structure, and properties ofsea ice. US Army Cold Regions Research and Engineering Labo-ratory, Monograph 82-1
Williams PJ (1995) Evidence for the seasonal accumulation of carbon-rich dissolved organic material, its scale in comparison withchanges in particulate material and the consequential eVect on netC/N assimilation ratios. Mar Chem 51:17–29
Yang H (1995) Distributions of free amino acids in sea and lake icecores from Antarctica with special reference to ice biota. P NIPRSymp Polar Biol 8:114–125
Yang H, Andrew RM, Harry B (1990) The relation of concentration ofdissolved free amino acids and Phaeocystis pouchetii cell num-bers in Antarctic coastal water. Antarct Res 2(4):43–49
Yentsch CS, Menzel DW (1963) A method for the determination ofphytoplankton chlorophyll and phaeophytine by Xuorescence.Deep Sea Res 10:221–231
Zwally HJ, Parkinson CL, Comiso JC (1983) Variability of AntarcticSea ice: and changes in carbon dioxide. Science 220:1005–1012
123