distributed'by: national technical information service … · d. statistical errors in...
TRANSCRIPT
AD-753 844
MEASUREMENT OF ELASTIC MODULI OFMATERIALS AT ELEVATED TEM-PERATURE
E. P. Papadakis,*et al
Panametrics, Incorporated.
I A
Prepared for:
Office of Naval Research
14 November 1972
DISTRIBUTED'BY:
National Technical Information ServiceU. S. DEPARTMENT OF COMMERCE5295 Port Royal Road, Springfield Va. 22151
- -
PANAMETRICS221 Crescent Street .Waltham, Massachusetts 02154 • (617) 899.2719
Measurement of Elastic Moduliof Materials at Elevated
Temperature
Progress Report for the 1 st Quarterlyt Period Ending November 14, 197Z
Performed for
Office of Naval Research
S\ underContract N00014-73-C-0023
I. D. No. NR 384-3Z0/04-Z7-72/468
Prepared by I LE. P. Papadakis C,
K. A. FowlerL. C. LynnworthE. H. Carnevale
J. Chen
Reproduced byNATIONAL TECHNICALINFORMATION SERVICE
u D e9patmen, of CommerceSprlng6I0ed VA 22151
Reproduction in whole or in part is permitted for any purpose of theUnited States Government.
-A L
I. BACKGROUND
This work was supported by the Office of Naval Research underContract N00014-73-C-0023, ONR Contract Authority IdentificationNumber NR 384-320/04-27-72/468.
II. DISCUSSION
The work reported here is a continuation of the research con-ducted under our former Contract N00014-71 -C-0050. Both theoretical-and experimental work has been undertaken. Progress in oeveral areasis summarized below.
A. Attenuation Compensation for Measuring Ultrasonic Velocityat High Temperatures in One or More Segments of Wire
Since attenuation increases with temperature, particularly abovehalf the melting point (absolute scale), it is necessary to compensate forattenuation to assure echoes of large enough amplitude to measure whenworking with wires immersed in a hot environment. A method is out-lined to calculate the echo amplitudes desirable at room temperature inorder to fabricate a wire-sonic transmiesion line for operation at hightemperatures for velocity measurements. Applications to ultrasonicthermometry are mentioned.
B. Versatile Ultrasonic Facility for Operaiion to 10000C
To facilitate measurements on wires and thin rode from roomtemperature to 1000 C, a simple and versatile vacuum furnace and heatcontroller have been built. An ultrasonic port allows the entrance ofseveral wire transmission lines and a thermocouple. Ultrasonic mea-surements of modulus and attenuation can be made.
C. Measurements on Remendur to 1000 C
In the vacuum furnace mentioned above, measurements of Young'smodulus and the attenuation of extensional ultrasonic waves have beenmade to 1000°C in Remendur, a magnetostrictive iron/cobalt alloy. Itwas deaired to study magnetostrictive metals up to and beyond the Curietemperature. Further measurements are planned.
1
'W
D. Statistical Errors in Attenuation and Reflection Coefficient
Statistical methods have been used to determine the errors to beexpected in measuring the attenuation a in a specimen of length L andthe reflection coefficient R at a buffer/specimen interface (or lead-in-wire/wire-specimen joint) with traveling wave methcds. Formulas arederived for the maximum (3ar) errors in R and 2a L.
E. Momentary Contact Experiments for Moduli andAttenuation at Elevated Temperatures
We are preparing to experiment further with superalloys at elevatedtemperatures. The next alloy to be tested will be Waspalloy, a structuralmetal used at high temperatures.
F. Polymerization of Plastics
Our work on testing the curing of epoxy resins has been writtenup for technical publication; the text appears as Appendix A. The paperhas application to various plastics and coatings, and possibly to solidsduring melting and freezing!
G. Nomogram for Attenuation and Reflection Coefficient
To familiarize the scientific and engineering community with theutility of making ultrasonic attenuation measurementa by ultrasonictraveling wave methods using buffer rods or lead-in wires, a letter hasbeen prepared for publication showing a nomogram for obtaining the at-tenuation and the reflection coefficient from the amplitudes of three echoes.This letter is given in Appendix B.
H. Ultrasonic Velocity in Sheet Material
Ultrasonic velocity in sheet material can be used to measure ormonitor the moduli of the material. Various production variables mightbe brought under closer control if the moduli of sheets could be monitored.A set of experiments was performed on various types of paper to investi-gate wave propagation in a material both high in attenuation and highlyanisotropic. A paper was written summarizing these measurements andreviewing some foreign and domestic work. This paper appears asAppendix C. It is f it that other types of sheet material could be monitoredat high temperatures by ultrasonics.
2
m. DETAILS OF WORK
A. Attenuation Compensation for Measuring Ultrasonic Velocity-at High Temperatures in One or More Segments of Wire
In certain experiments, one may be interested in measuring theultrasonic propagation constants along one or more siegments of a wirewaveguide. For example, one may wish to compare the response of twoor more different materials, e. g., pure Re, pure Mo, and Re/Mo alloys,in a given thermal and/or nuclear environment. Alternatively, one maywish to use a given material, e. g., Re, to sense the variation or profileof an environmental parameter such as temperature or neutron fluence.
At temperature below about half the absolute melting temperature,T < 0. 5 TM, the attenuation coefficient a a:ý frequencies well below 1 MHzis usually small enough so that detectable echoes can be obtained1 evenwhen the sound pressure reflection coefficient R is much less than unity;e. g., R = 0. 1. In this case at least 10 and possibly 20 segments can b,.monitored by a single transducer.
On the other hand, at temperature above -0. 5 TM, a may increaseby more than 1 order of magnitude. To provide sufficiently strong echoes,one may have to divide the available ultrasonic energy among a smallernumber of segments, e. g. , 5 or less. Correspondingly, the R's at seg-ment interfaces need to be increased.
The problem, then, is to optimize the choices of Ri, for a given
set of a Li's, where the Li's are the lengths of the segments.
Let us define "optimum" to be that set of Ri and Li which yieldsessentially equal magnitude echoes at the expected conditions of maximumattenuation, and minimum or tolerable interference echoes at temperatureswell below 0. 5 TM,1 . To illustrate one approach to this optimization pro-cedure, let us analyze the case where temperature is uniform over thesegments, and high enough above 0. 5 TM so that very small, identicalR's such as R = 0. 1 wili not suffice. Further, since moderately largeR's will be large enough to yield interfering reverberations, the lengthsof adjacent segments need to be unequal. 2,'
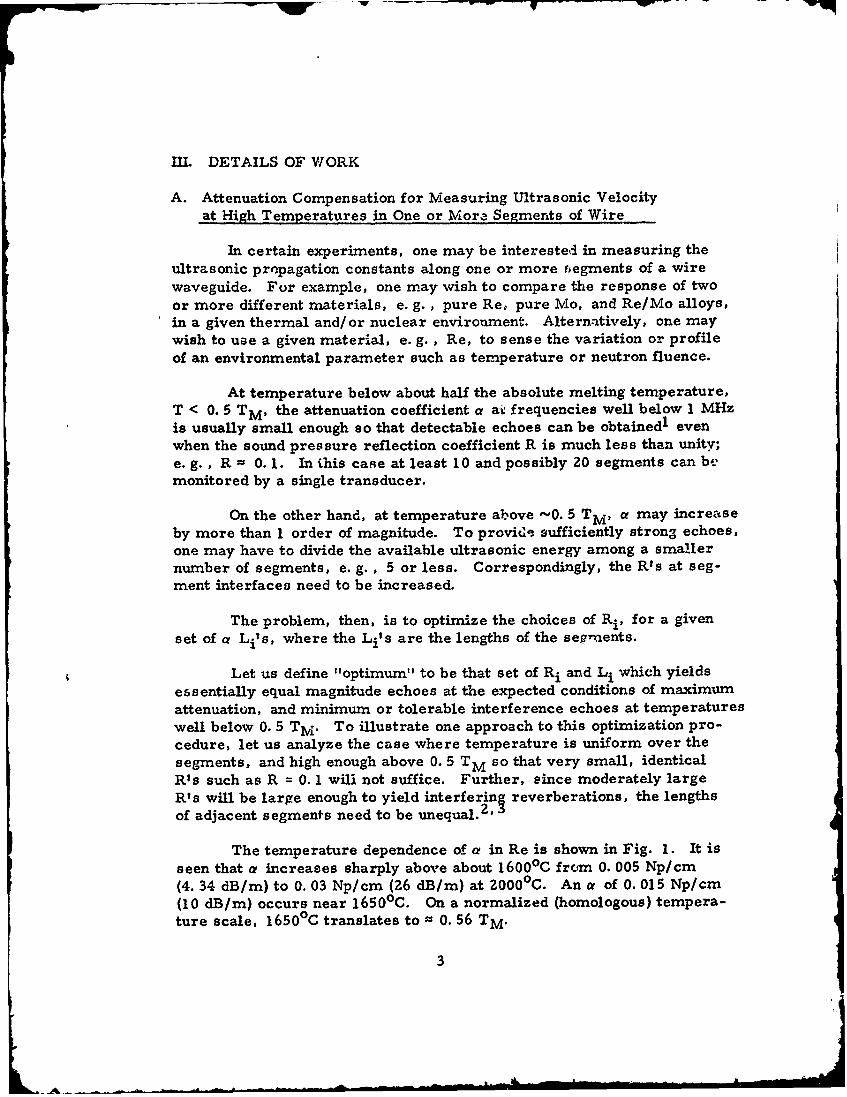
The temperature dependence of a in Re is shown in Fig. 1. It isseen that a increases sharply above about 16000 C from 0. 005 Np/cm(4. 34 dB/m) to 0. 03 Np/cm (26 dB/m) at 2000 0C. An a of 0. 015 Np/cm(10 dB/m) occurs near 1650 0 C. On a normalized (homologous) tempera-ture scale, 1650 0 C translates to = 0. 56 TM.
3
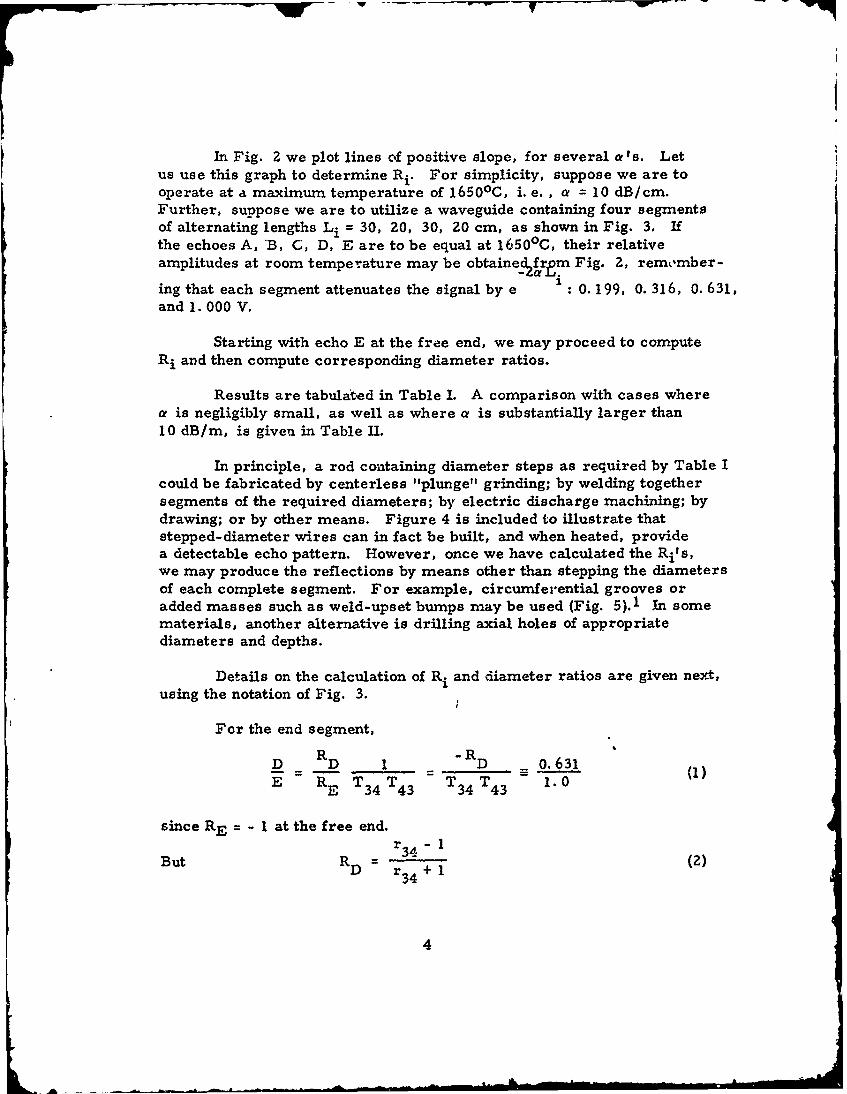
In Fig. 2 we plot lines of positive slope, for several a Is. Letus use this graph to determine Ri. For simplicity, suppose we are tooperate at a maximum temperature of 16500C, i. e. , a = 10 dB/cm.Further, suppose we are to utilize a waveguide containing four segmentsof alternating lengths Li = 30, 20, 30, 20 cm, as shown in Fig. 3. Ifthe echoes A, *B, C, D, E are to be equal at 16500C, their relativeamplitudes at room temperature may be obtainec' frm Fig. 2, remember-
1
ing that each segment attenuates the signal by e 0.199, 0. 316, 0.631,and 1. 000 V.
Starting with echo E at the free end, we may proceed to computeRi and then compute corresponding diameter ratios.
Results are tabulated in Table I. A comparison with cases wherea is negligibly small, as well as where a is substantially larger than10 dB/m, is given in Table J-.
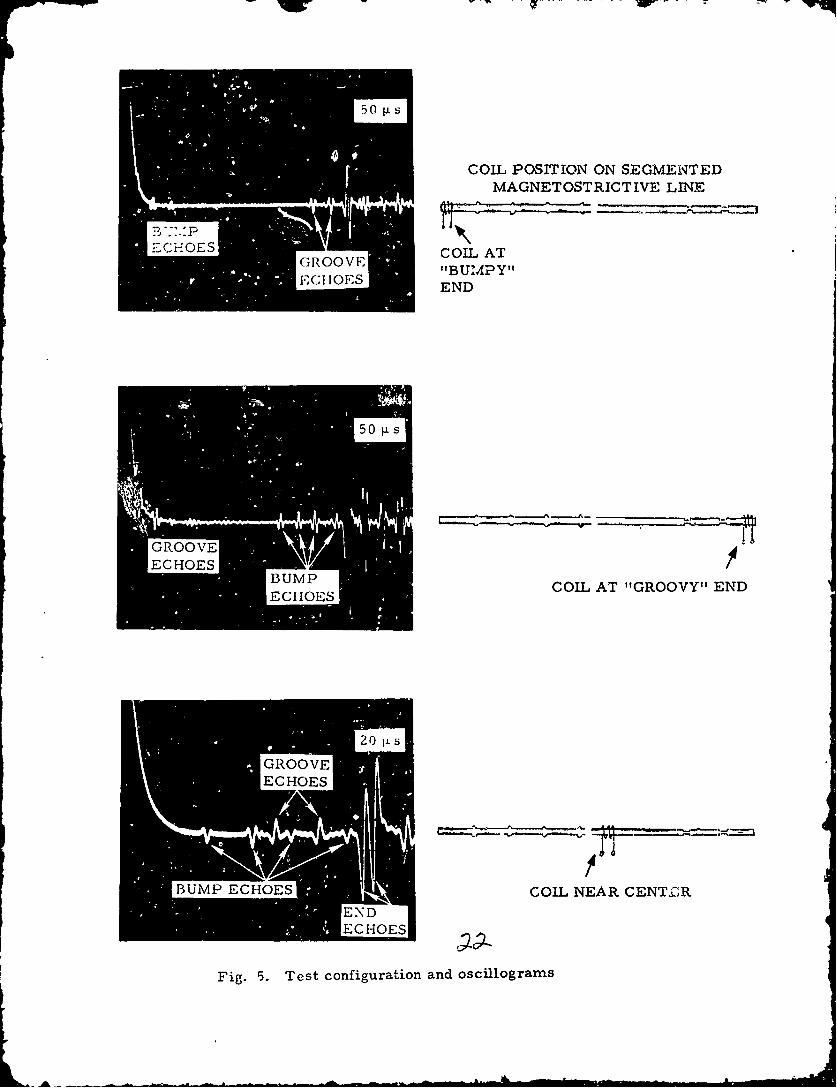
In principle, a rod containing diameter steps as required by Table Icould be fabricated by centerless "plunge" grinding; by welding togethersegments of the required diameters; by electric discharge machining; bydrawing; or by other means. Figure 4 is included to illustrate thatstepped-diameter wires can in fact be built, and when heated, providea detectable echo pattern. However, once we have calculated the Ri's,we may produce the reflections by means other than stepping the diametersof each complete segment. For example, circumferential grooves oradded masses such as weld-upset bumps may be used (Fig. 5).1 In somematerials, another alternative is drilling axial holes of appropriatediameters and depths.
Details on the calculation of Ri and diameter ratios are given next,using the notation of Fig. 3.
For the end segment,
D R D 1 R D 0. 631E RE T34 T43 T34 T43 1.0
since RE = - 1 at the free end.r34-
But RD - +1 (2)
4
Tab) • I
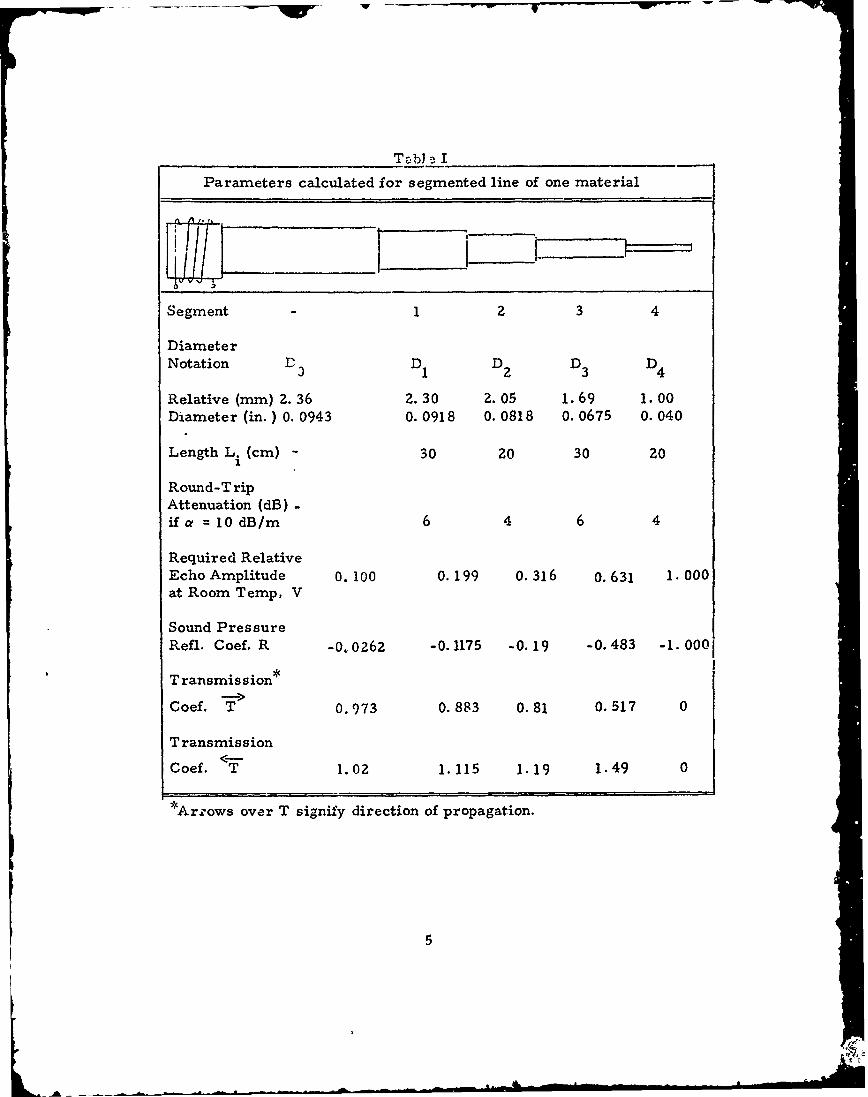
Parameters calculated for segmented line of one material
Segment 1 2 3 4
DiameterNotation D 3 D1 D2 D3 D4
Relative (mm) 2. 36 2.30 2. 05 1. 69 1.00Diameter (in.) 0. 0943 0. 0918 0. 0818 0.0675 0. 040
Length Li (cm) - 30 20 30 20
Round-T ripAttenuation (dB) -
ifa= 10 dB/m 6 4 6 4
Required RelativeEcho Amplitude 0. 100 0. 199 0. 316 0.631 1. 000at Room Temp, V
Sound PressureRefl. Coef. R -0, 0262 -0. 1175 -0. 19 -0. 483 -1. 000
T ransmis sion*
Coef. T 0.973 0. 883 0.81 0.517 0
Transmission
Coef. <-T 1.02 1.115 1.19 1.49 0
*Arrows over T signify direction of propagation.
5
hL
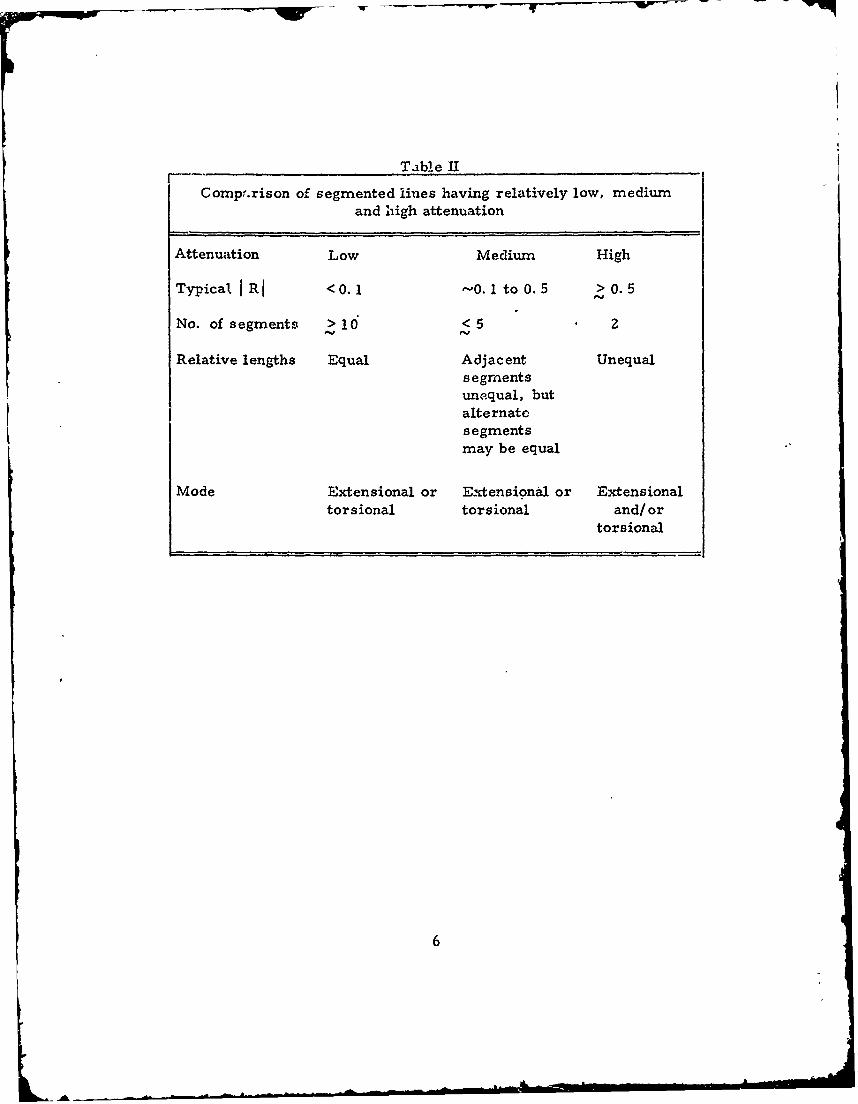
Table JI
Comp-.rison of segmented lines having relatively low, mediumand high attenuation
Attenuation Low Medium High
Typical I RI <0. 1 0. 1 to 0.5 > 0.5
No. of segments > 10 < 5 2
Relative lengths Equal Adjacent Unequalsegmentsunequal, butalternatesegmentsmay be equal
Mode Extensional or Extensional or Extensionaltorsional torsional and/or
torsional
6
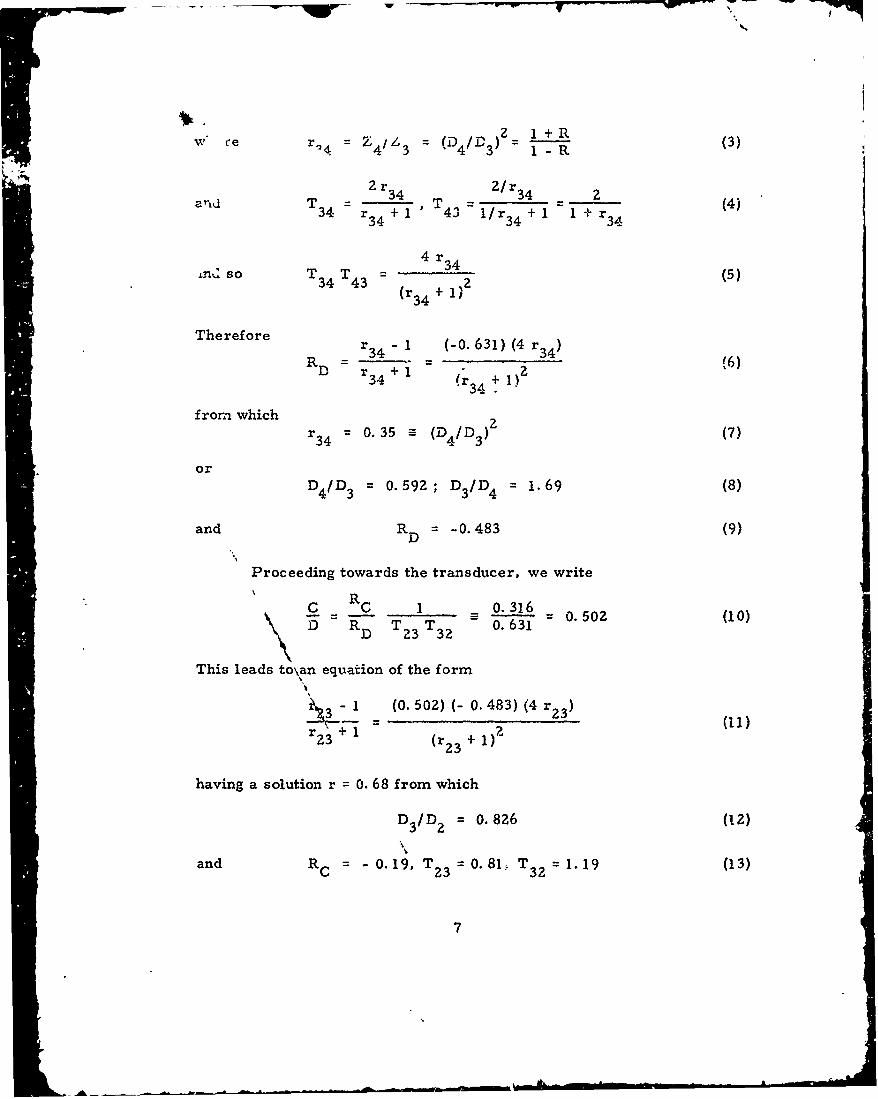
w re r.4,(D 4 /D 3 ) 2 1 +-R (3)
S2r3 4 2/r 3 4 2 t
and T- 2 3 T 2 34 (4)T34 r 3 4 +1 43 1/r 34 + 1 1 r 34
L. so T34 T43 2 (5)(r 3 4 +1)
Therefore r 341 (-0. 631) (4 r!34)R D r- 4 + -) 16)
r34 1 (ra .+ 1)Z
34-- from whichf w r 34 0. 35 a (D4 /D 3 ) (7)
I. or D4/D3 = 0.592; D -3/D4 1.69 (8)and R -0.483 (9)
Proceeding towards the transducer, we write
C RC 1 0. 316D - R T T 0 0.502 (10)
D 23 32
This leads to\an equation of the form
S- 1 (0. 502) (- 0. 483) (4 r 2 3 ) (11)r + 1 )22 (r 2 3 + 1
having a solution r 0. 68 from which
D3 /D 2 = 0.826 (12)
and R = - 0.19, T23 = 0. 81, T =1 . 19 (13)
7
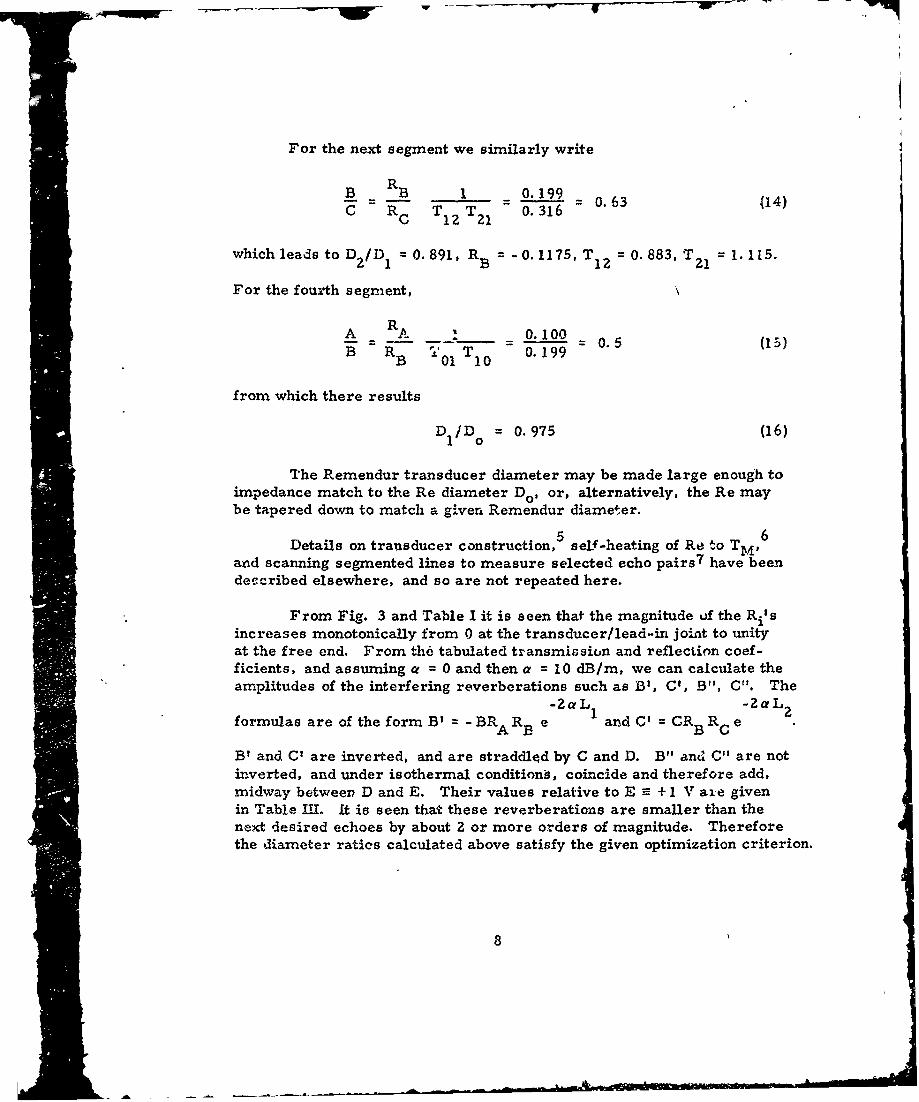
For the next segment we similarly write
B RBB" B 1 O. = 0.63 (14)C R T T21 0.316
which leads to D2 /D 1 = 0.891, RB 0.1175, T = 0. 883, T = 1115.
For the fourth segment,
A RA 1 0.100 0(1)r.T 0.199 0B 01 10
from which there results
D 1/D = 0.975 (16)
The Remendur transducer diameter may be made large enough toimpedance match to the Re diameter Do, or, alternatively, the Re maybe tapered down to match a given Remendur diameter.
Details on transducer construction, 5 self-heating of R.o TM,
and scanning segmented lines to measure selected echo pairs 7 have beendec'cribed elsewhere, and so are not repeated here.
From Fig. 3 and Table I it is seen that the magnitude uf the Ri's
increases monotonically from 0 at the transducer/lead-in joint to unityat the free end. From the tabulated transmission and reflection coef-ficients, and assuming a = 0 and then a = 10 dB/m, we can calculate the"amplitudes of the interfering reverberations such as B3, C', B", C". The
-2aL1 -ZaL_
formulas are of the form B? - - BRA RB e 1 and C' = CRB RC e
B' and C' are inverted, and are straddled by C and D. B" and CI' are notinverted, and under isothermal condition6, coincide and therefore add,midway between D and E. Their values relative to E = + 1 V aie givenin Table II. It is seen that these reverberations are smaller than thenext desired echoes by about 2 or more orders of magnitude. Thereforethe diameter ratios calculated above satisfy the given optimization criterion.
8
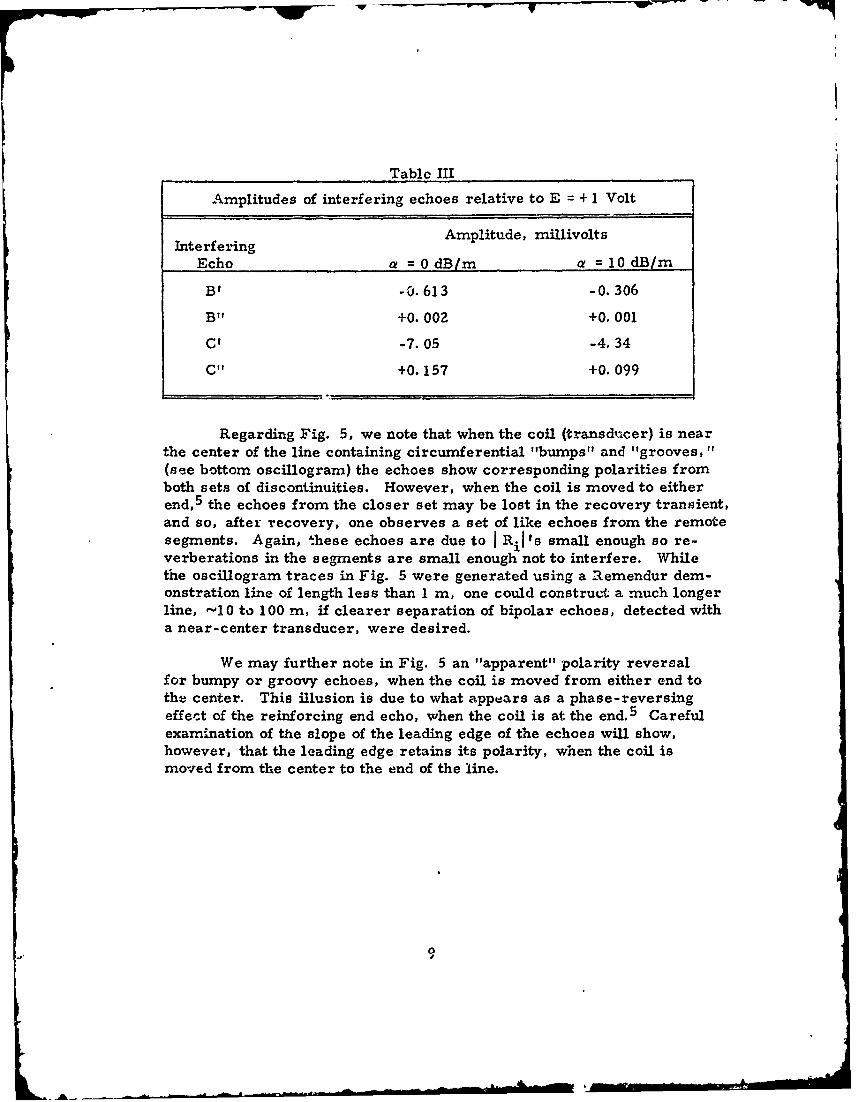
Table III
Amplitudes of interfering echoes relative to E = + 1 Volt
Interfering Amplitude, millivolts
Echo a = 0dB/m a = 10dB/m
BI -0. 613 -0. 306
B" +0. 002 +0. 001
CI -7.05 -4. 34
C" +0. 157 +0. 099
Regarding Fig. 5, we note that when the coil (transducer) is nearthe center of the line containing circumferential "bumps" and "grooves, "
(see bottom oscillogram) the echoes show corresponding polarities fromboth sets of discontinuities. However, when the coil is moved to eitherend, 5 the echoes from the closer set may be lost in the recovery transient,and so, after recovery, one observes a set of like echoes from the remotesegments. Again, these echoes are due to I Ril Is small enough so re-verberations in the segments are small enough not to interfere. Whilethe oscillogram traces in Fig. 5 were generated using a aemendur dem-onstration line of length less than 1 m, one could construct a much longerline, -10 to 100 m, if clearer separation of bipolar echoes, detected witha near-center transducer, were desired.
We may further note in Fig. 5 an "apparent" polarity reversalfor bumpy or groovy echoes, when the coil is moved from either end tothe center. This illusion is due to what appears as a phase-reversingeffect of the reinforcing end echo, when the coil is at the end. 5 Carefulexamination of the slope of the leading edge of the echoes will show,however, that the leading edge retains its polarity, when the coil ismoved from the center to the end of the line.
[0
-. -
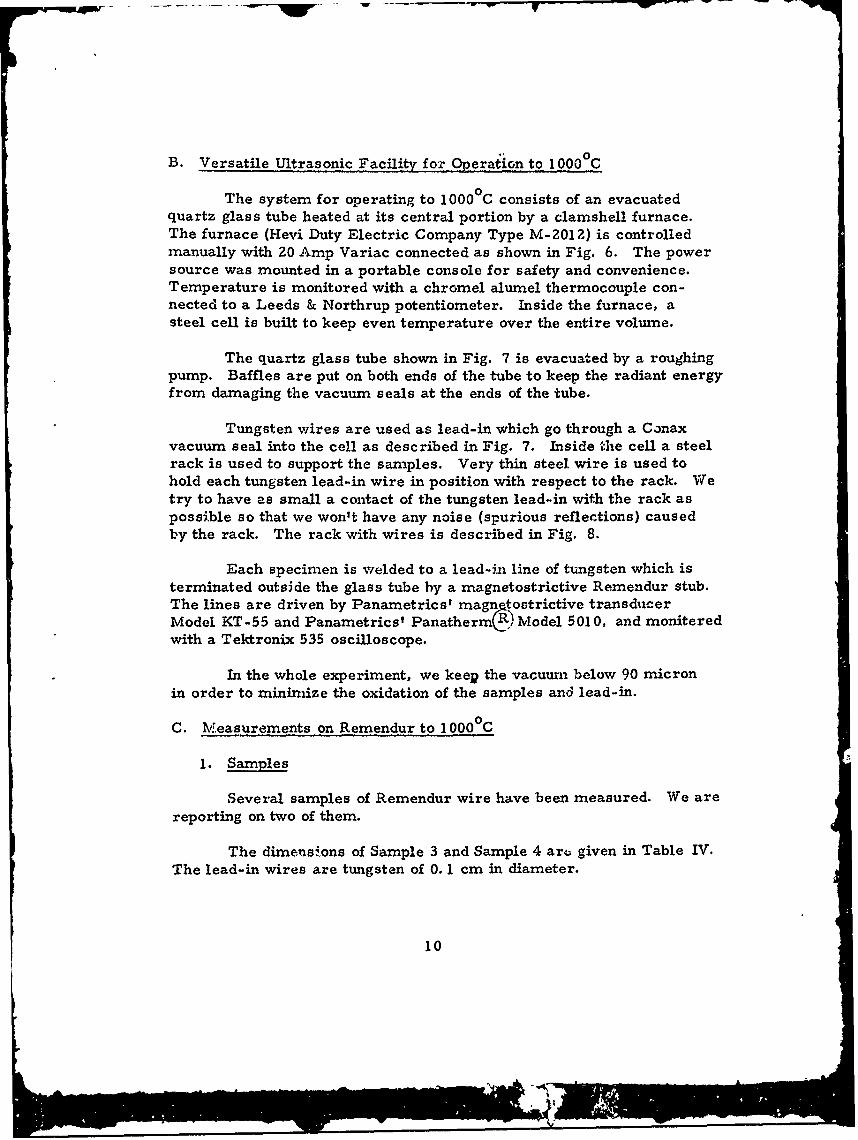
B. Versatile Ultrasonic Facility fo2Oeraion to 10000C
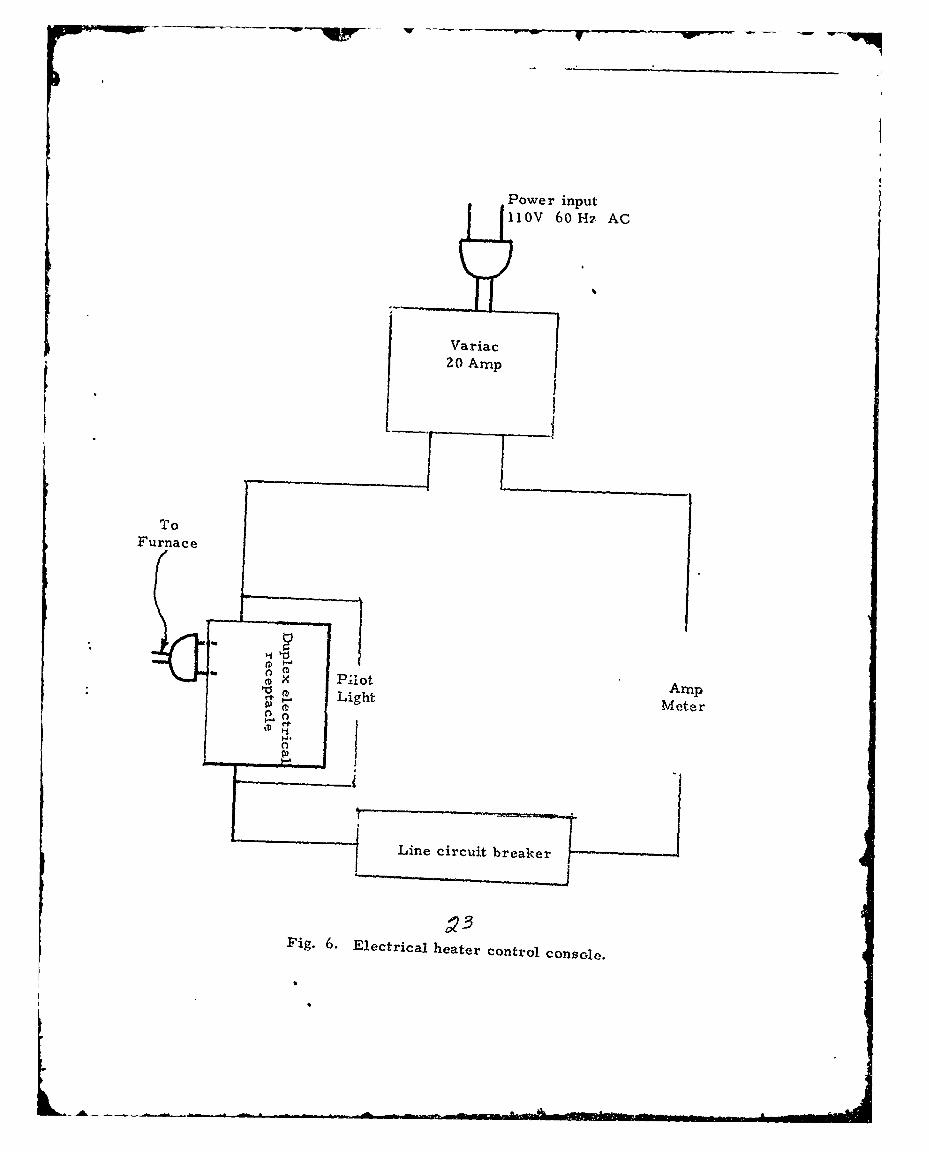
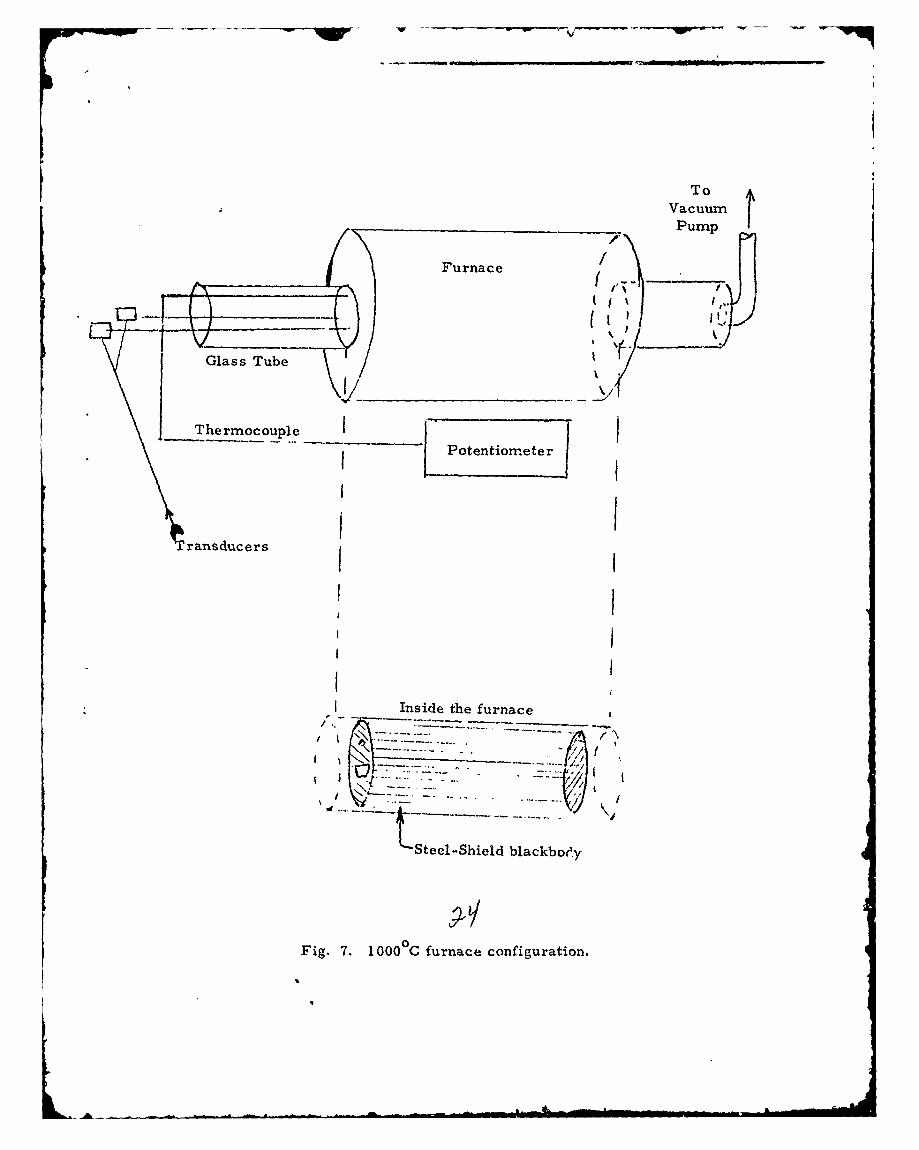
The system for operating to 10000C consists of an evacuatedquartz glass tube heated at its central portion by a clamshell furnace.The furnace (Hevi Duty Electric Company Type M-2012) is controlledmanually with 20 Amp Variac connected as shown in Fig. 6. The powersource was mounted in a portable console for safety and convenience.Temperature is monitored with a chromel alumel thermocouple con-nected to a Leeds & Northrup potentiometer. Inside the furnace, asteel cell is built to keep even temperature over the entire volume.
The quartz glass tube shown in Fig. 7 is evacuated by a roughingpump. Baffles are put on both ends of the tube to keep the radiant energyfrom damaging the vacuum seals at the ends of the tube.
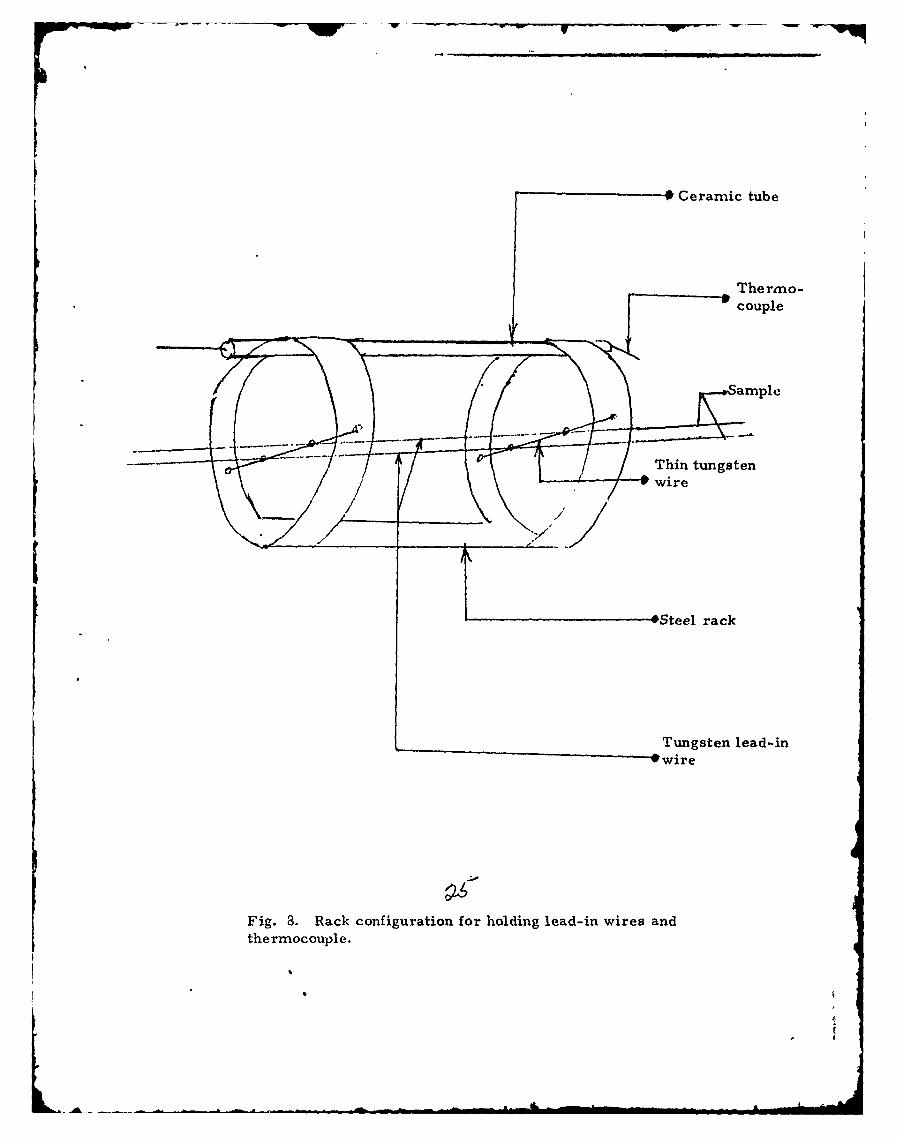
Tungsten wires are used as lead-in which go through a Conaxvacuum seal into the cell as described in Fig. 7. Inside the cell a steelrack is used to support the samples. Very thin steel wire is used tohold each tungsten lead-in wire in position with respect to the rack. Wetry to have as small a contact of the tungsten lead-in with the rack aspossible so that we won't have any noise (spurious reflections) causedby the rack. The rack with wires is described in Fig. 8.
Each specimen is welded to a lead-in line of tungsten which isterminated outside the glass tube by a magnetostrictive Remendur stub.The lines are driven by Panametrics' magn tostrictive transducerModel KT-55 and Panametrics' Panatherm®.R)lModel 5010, and moniteredwith a Tektronix 535 oscilloscope.
In the whole experiment, we keep the vacuum below 90 micronin order to minimize the oxidation of the samples and lead-in.
C. Measurements on Remendur to 10000C
1. Samples
Several samples of Remendur wire have been measured. We arereporting on two of them.
The dimensions of Sample 3 and Sample 4 art given in Table IV.The lead-in wires are tungsten of 0. 1 cm in diameter.
10
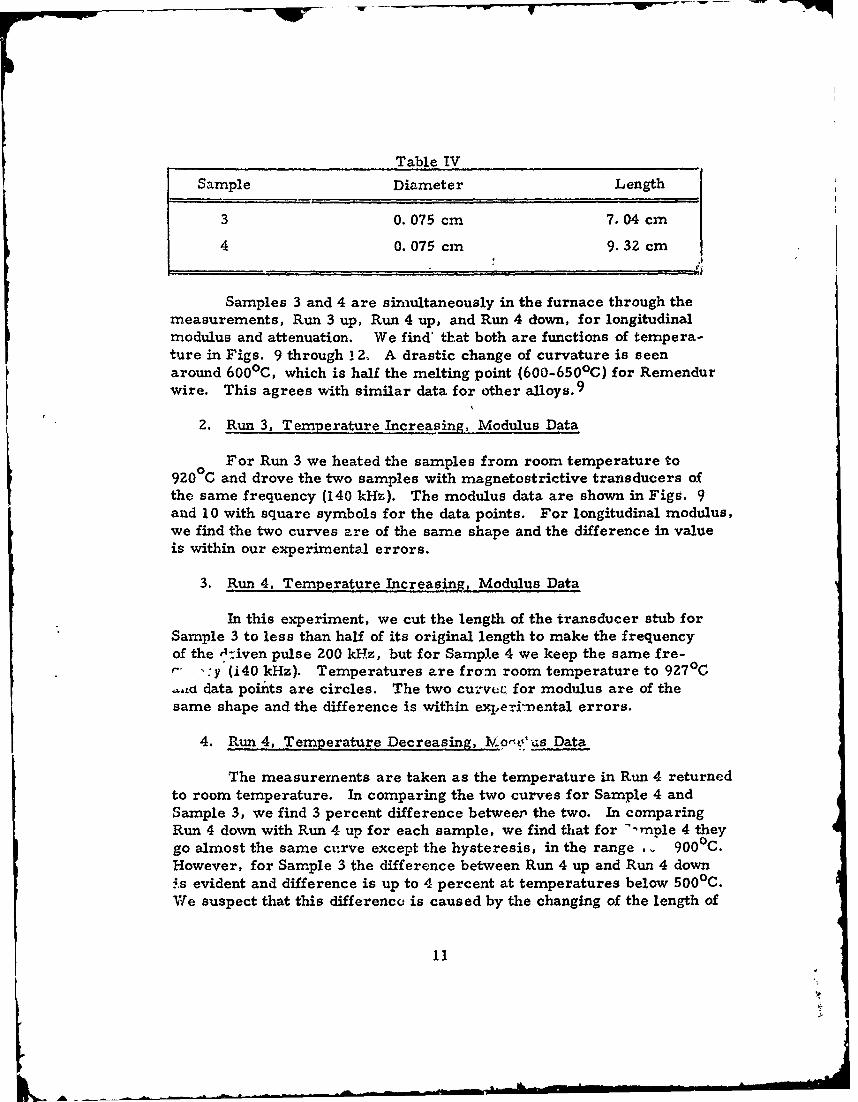
Table IV
Sample Diameter Length
3 0. 075 cm 7.04 cm
4 0. 075 cm 9.32 cm
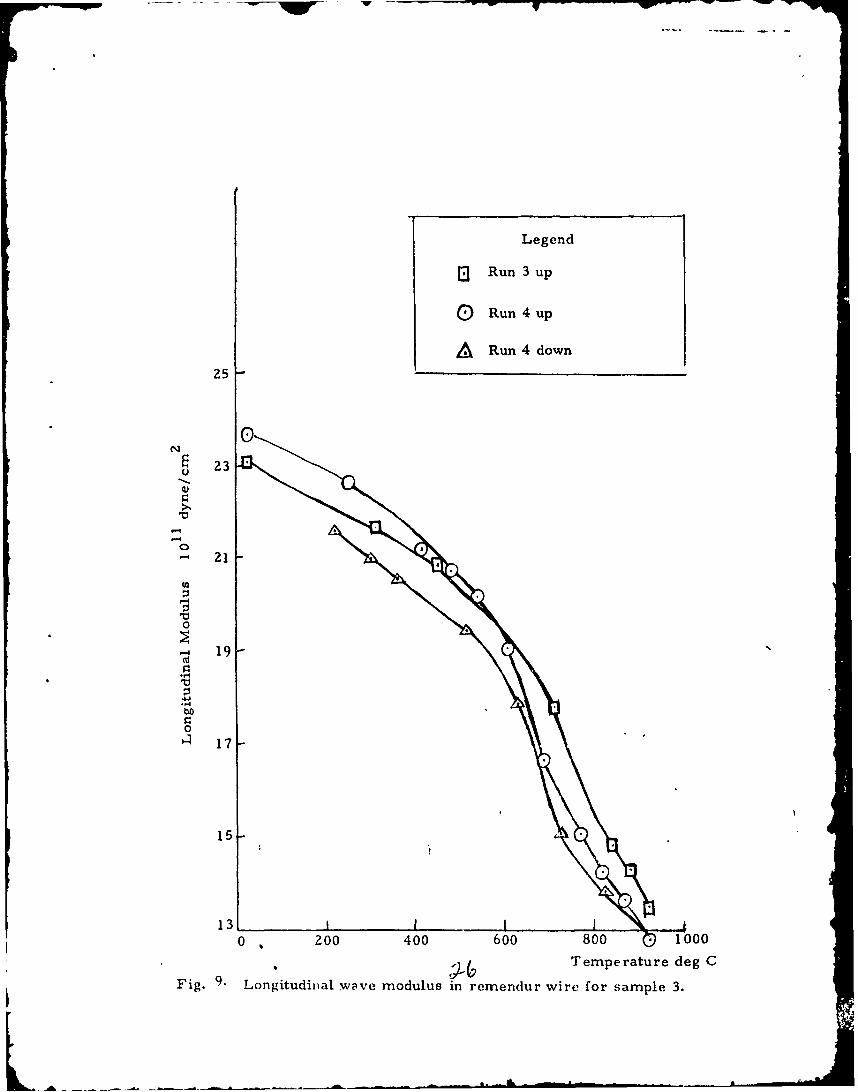
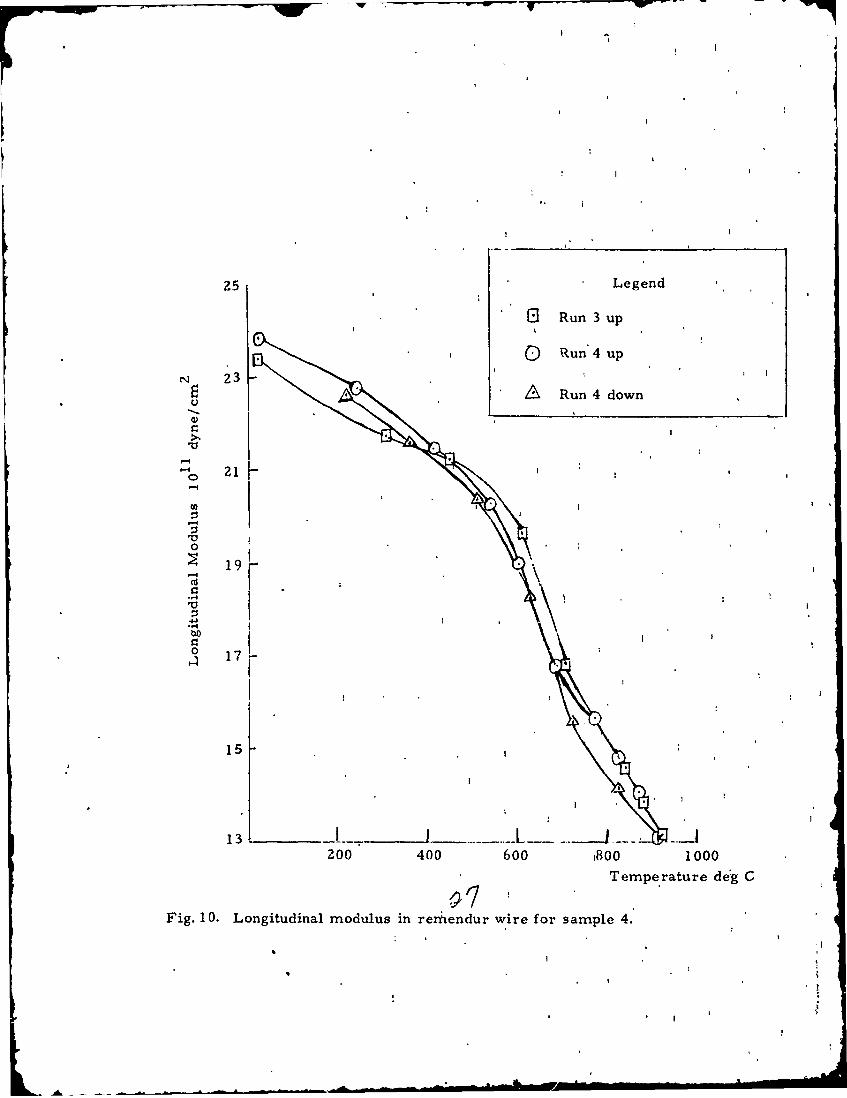
Samples 3 and 4 are simultaneously in the furnace through themeasurements, Run 3 up, Run 4 up, and Run 4 down, for longitudinalmodulus and attenuation. We find' that both are functions of tempera-ture in Figs. 9 through 3 2, A drastic change of curvature is seenaround 6000C, which is half the melting point (600-6500C) for Remendurwire. This agrees with similar data for other alloys. 9
2. Run 3, Temperature Increasing, Modulus Data
For Run 3 we heated the samples from room temperature to9200C and drove the two samples with magnetostrictive transducers ofthe same frequency (140 kHz). The modulus data are shown in Figs. 9and 10 with square symbols for the data points. For longitudinal modulus,we find the two curves are of the same shape and the difference in valueis within our experimental errors.
3. Run 4, Temperature IncreasinG, Modulus Data
In this experiment, we cut the length of the transducer stub forSample 3 to less than half of its original length to make the frequencyof the ':iven pulse 200 kFz, but for Sample 4 we keep the same fre-
- y (i40 kHz). Temperatures are fro-n room temperature to 927°C"&L= data points are circles. The two curv:c for modulus are of thesame shape and the difference is within exieri•nental errors.
4. Run 4, Temperature Decreasing, ko•9 1.us Data
The measurements are taken as the temperature in Run 4 returnedto room temperature. In comparing the two curves for Sample 4 andSample 3, we find 3 percent difference betweer the two. In comparingRun 4 down with Run 4 up for each sample, we find that for 'mple 4 theygo almost the same cvrve except the hysteresis, in the range , ý 9000C.However, for Sample 3 the difference between Run 4 up and Run 4 down..s evident and difference is up to 4 percent at temperatures below 5000C.We suspect that this difference is caused by the changing of the length of
11
I,
the transducer stub of the Remendur for Sample 3. Further experimentsare planned to study this. If this is true, the longitudinal modulus is afunction of frequency as well as temperature.
5. Reflection Coefficient
For reflection coefficient, we found it to be around 60% throughall the experiments.
6. Attenuation
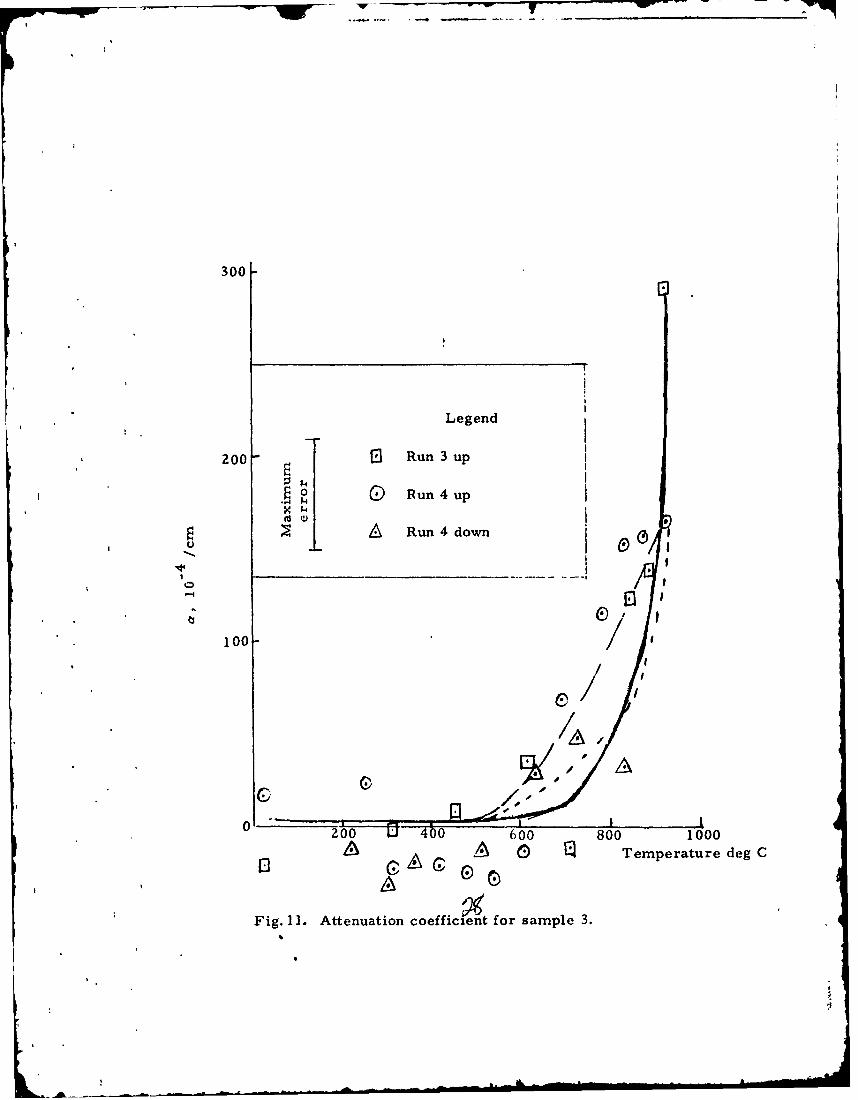
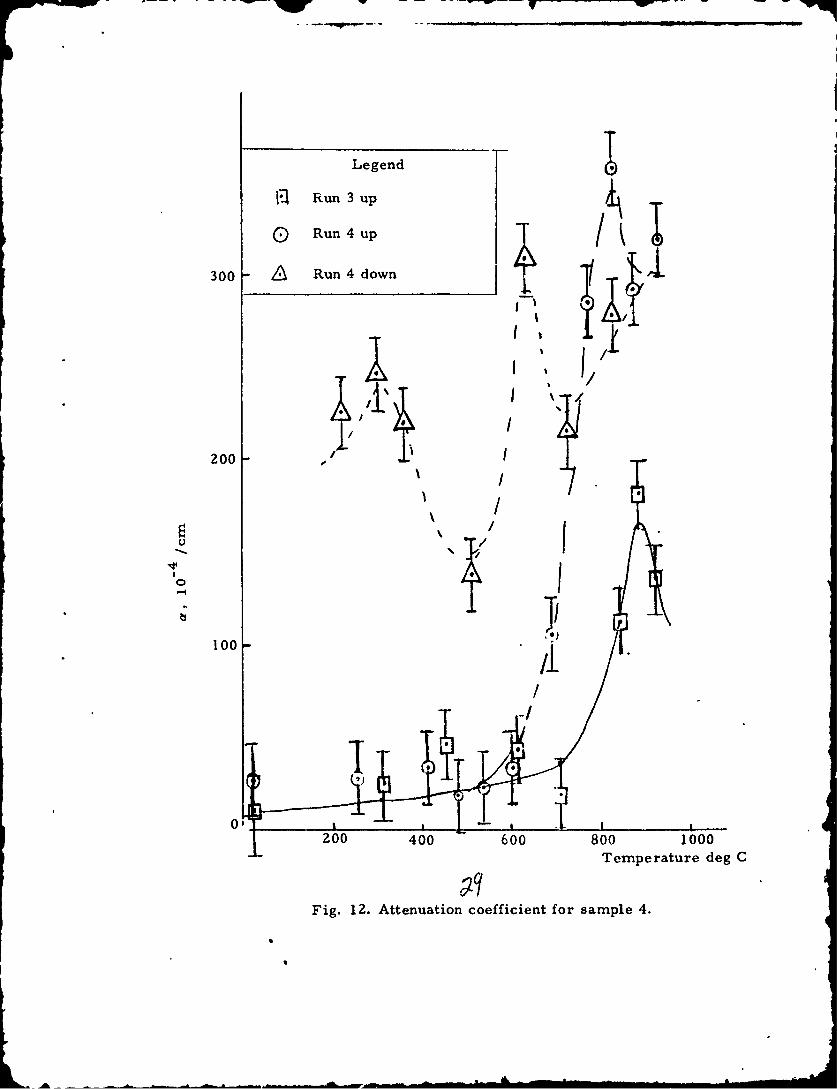
In general, attenuation began to increase drastically above halfthe melting point absolute. See Figs. 11 and 12. At lower temperatures,we find many negative points as shown in Fig. 11, but when we calculatethe maximum errors, we find that our maximrun error can be very bigwith respect to small values of a. (The calculation is in iT C. ) Reason-able curves can be drawn if the maximum errors are considered. Wefound that a is the same (within experimental errors) below 5000 C forall the runs with both samples except for Run 4 down with Sample 4. ForSample 4, the curve we get for Run 4 down is strange; we do not knowthe reason yet.
D. Statistical Errors in Attenuation and Reflection Coefficient
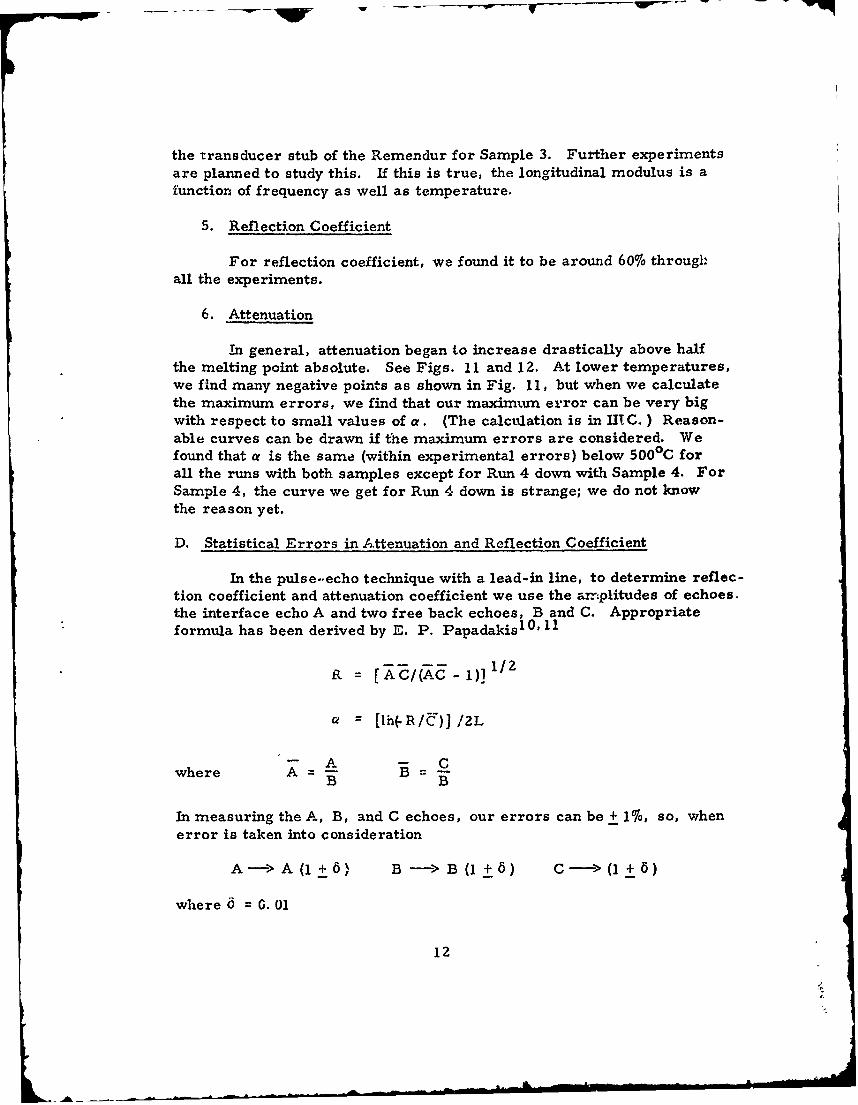
In the pulse-echo technique with a lead-in line, to determine reflec-tion coefficient and attenuation coefficient we use the arnplitudes of echoes.the interface echo A and two free back echoes, B and C. Appropriateformula has been derived by E. P. PapadakisI 0, 11
R [AC/(AC - I)] ll/
S- [1h(.R/C')J /ZL
where A = A -B B
In measuring the A, B, and C echoes, our errors can be + 10/a, so, whenerror is taken into consideration
A-> A (l+6) B -> B (I +6) C-> (+6)
where 6 G. 01
12
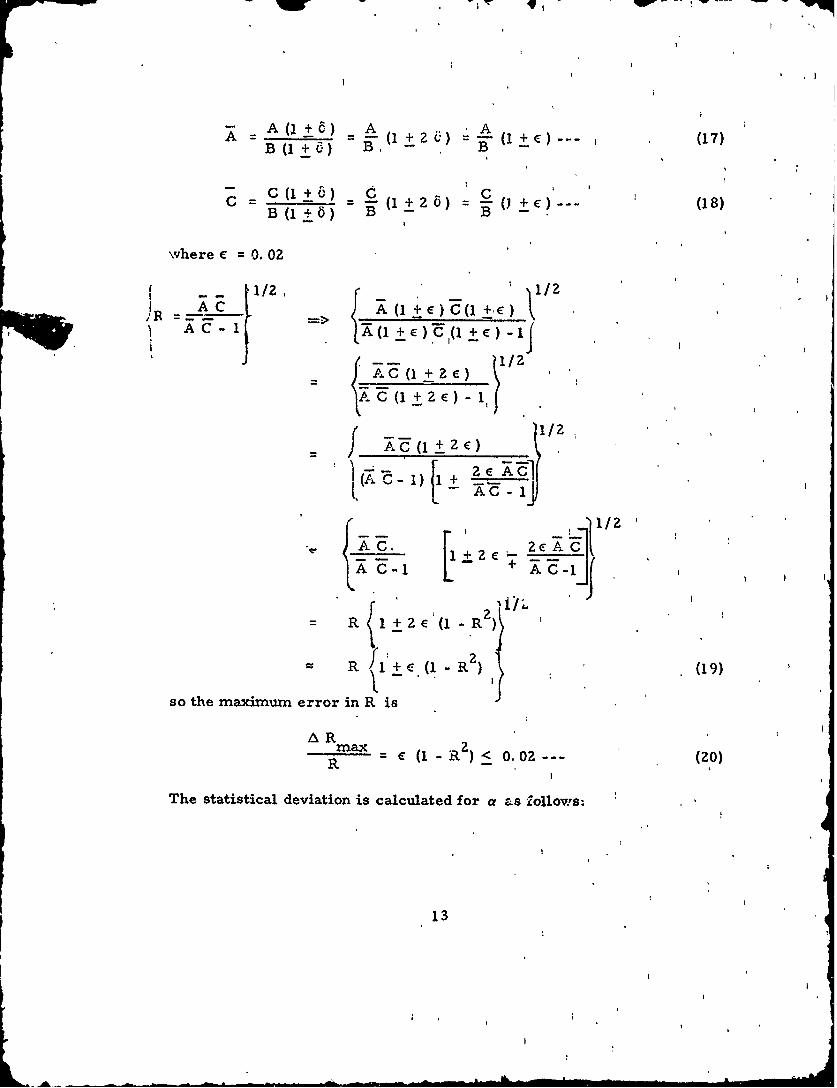
S A (J + 6) A AA - (1+•+ ) z (1+C)--- (17)
B (1 + B B
C (I
c- c(i_+6)
B (1 + BB
where C = 0. 02
[ t1/2 , .. ' / 2 " ,
- -/ 2
A 1 (1+ )C(1+R
AR {l+C(AG(1 Zc)A1/
- - -+ x- z*
- f +: (1- ,(19)
so the maximum error in R is
A RR = m (1- R2 < 0.02 --- (20)
The statistical deviation is calculated for a as lollows:
13
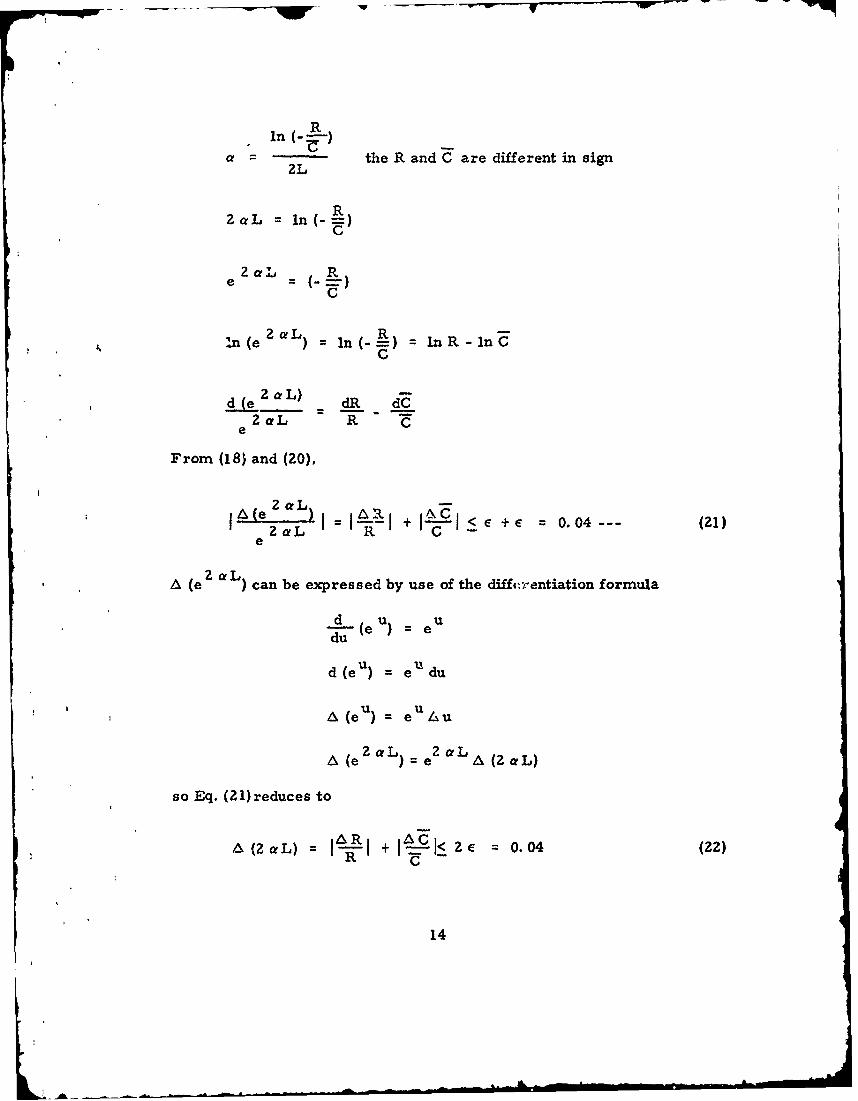
In (- R-
a= - the R and C are different in sign2L
ZaL = In(-c)
CZaL R%
nl(e ) 2 n(-) = InR-InCC
d (e Z aL) dR dCZaL Re
From (18) and (20),
) I = I + C + 0.04--- (21)
ZaL Re
A (e ZaL) can be expressed by use of the diffi-rentiation formula
d (e u e u
d (eu) = eu du
A (eu) = eU ,u
A(e = e A (2 aL)
so Eq. (21)reduces to
(c•,aL) = !- -I + I A zL 2 c 0. 04 (22)
14
Since L is held constant,
L
Using the dimensions in Table IV, in Sample 3 A a 0. 003, and a 0-4
aW temperature below 500 0 C, so percentage error can be 300076. That isthe reason that a comes out to be negative, but when the deviation is takeninto consideration we can draw a reasonable curve with a 's 0. (There isalso a curve of percentage error1 1 in R and 2 a L with respect to R inFig. 13.)
15
1W
IV. PUBLICATIONS, TALKS, COURSES, COMMITTEES, STUDENTS
A. Papers Published
The following papers on work supported wholly or in part by ONRhave been published:
E. P. Papadakis, "On the Absolute Accuracy of the Pulse-Echo-OverlapMethod and the Pulse-Superposition Method for Ultrasonic Velocity,"J. Acoust. Soc. Amer. 52, 843-846 (1972).
E. P. Papadakis, "Ultrasonic Diffraction Loss and Phase Change forBroadband Pulses," J. Acoust. Soc. Amer. 52 847-849 (1972).
E. P. Papadakis, L. C. Lynnworth, K. A. Fowler, and E. H. Carnevale,"Ultrasonic Attenuation and Velocity in Hot Specimens by the MomentaryContact Method With Pressure Coupling, and Some Results on Steel to1200C," J. Acoust. Soc. Amer. 52, 850-857 (1972).
E. P. Papadakis, "Tabulation of the Coefficients of a Quadratic Functionfor the Thermal Expansion of Various Alloys and Other EngineeringMaterials," Materials Science and Engineering 10, 195-203 (1972).
E. P. Papadakis, K. A. Fowler, and L. C. Lynnworth, "New Uses forUltrasonic Spectrum Analysis," Proc. 1972 IEEE Ultrasonics Symposium,IEEE #72 CHO 708-8 SU, IEEE, 345 E 47 St., N.Y., N.Y. 10017, 1972,pp. 81-86.
L. C. Lynnworth, "Torsional Wave Transduction in Magentostrictive Wire,"Ultrasonics 10, (5), 195-197 (Sept. 1972).
L. C. Lynnworth, "High Temperature Measurements," Research/Develop-ment 23, (10), 8 (Oct. 1972). Note: Over 100 responses were receivedconcerning this Letter to the Editor.
B. Papers Scheduled
The following papers on work supported wholly or in part by ONR"we scheduled for publication in the near future:
L. C. Lynnworth, E. P. Papadakis, and K. A. Fowler, "Ultrasound Propa-gation Measurements and Applications," Proc. ARPA-AMMRC Symposiumon Advanced NDT Techniques (to be published).
16
Aft . • .I • m dI • - •tm • f H1I
K. A. Fowler, "Ultrasonic Transducer Characterization," Proc. ARPA-AMMRC Symposium on Advanced NDT Techniques (to be published).
L. C. Lynnworth and F. H. Carnevale, "Ultrasonic Thermometry UsingPulse-Echo Techniques," Proc. 5th Symposium on Temperature-ItsMeasurement and Control in Science and Industr? (to be published).
L. C. Lynnworth, "Attenuation Measurements Using the Pulse-Echo ABMcthod," Materials Evaluation (to be published).
E. P. Papadakis, K. A. Fowler, and L. C. Lynnworth, "UltrasonicAttenuation by Spectrum Analysis of Pulses in Buffer Rods: Method andDiffraction Corrections," J. Acoust. Soc. Amer. (to be published).
E. P. Papadakis, "Lens Equation for Focused Transducers," InternationalJournal of Nondestructive Testing (to be published).
E. P. Papadakis, "Balanced Resonator for Infrasonic Measurements ofYoung's Modulus and Damping in Flexure," ASTM J. Testing and Evaluation(to be published).
L. C. Lynnworth, "Ultrasonic Measurement of Elastic Moddli in SlenderSpecimens Using Extensional and Torsional Wave Pulses," ASTM J. Testingand Evaluation (to be published).
E. P. Papadakis, "Measurement of Small Changes in Ultrasonic Velocityand Attenuation," (Invited) Crit. Rev. Solid State Sciences (to be published).
E. P. Papadakis, "Ultrasonic Diffraction From Single Apertures," PhysicalAcoustics, Principles and Methods, W. P. Mason and R. N. Thurston, Eds.,Academic Press, N. Y. (future volume to be published).
C. Talks Given
The following talks on work supported wholly or in part by ONRwere given recently:
E. P. Papadakis, "Ultrasonic Methods for Modulus Measurement in Paper,"TAPPI Testing Conference, Philadelphia, Pa., Sept. 26-29, 1972.
E. P. Papadakis, K. A. Fowler, and L. C. Lynnworth, "New Uses forUltrasonic Spectrum Analysis, " IEEE Ultrasonics Symposium, Boston,Ma!ss., Oct. 3-7, 1972.
17
Li_ -.. ,- •, , n -I:
C. A. Carey, "Sound Propagation in High-Temperature Plasmas," IEEEUltrasonics Symposium, Boston, Mass., Oct. 3-7, 1972.
L. C. Lynnworth and N. E. Pedersen, "Ultrasonic Mass Flowmeter,"
IEEE Ultrasonics Symposium, Boston, Mass., Oct. 3-7, 1972.
D. Talks Scheduled
The following talks on work supported wholly or in part by ONR arescheduled for the near future:
L. C. Lynnworth, "Ultrasonic Temp. Profiling and Attenuation," ASTM-EZO. 06, Washington, D. C. (Nov. 17, 1972).
L. C. Lynnworth, "Nuclear Reactor Applications of Ultrasound," IEEEBoston Section, Joint Meeting of Groups on Nuclear Science and on Sonics/Ultrasonics (Feb. 5, 1973).
E. Professional Societies
L. C. Lynnworth is secretary of ASTM Subcommittee E-20. 06,Acoustical Thermometry. He is also chairman of the Boston Section ofthe IEEE Group on Sonics and Ultrasonics. E. P. Papadakis is Editor ofthe Newsletter and Associate Editor for industrial ultrasonics of the Trans-actions on Sonics and Ultrasonics of the IEEE Group on Sonics and Ultra-sonics with about 1200 members. He is also serving on the Physical Acousticscommittee of the Acoustical Society of America, on the Working Group onUltrasonic Attenuation and Velocity (E-07. 06. 13) of ASTM SubcommitteeE-07. 06, on ASTM Subcommittee D-20. 15 concerned with Dynamic Propertiesof Plastics, on an ad-hoc committee for improved nondestructive testingmethods under t-he auspices of the National Science Foundation and the AirForce Materials Laboratory, and on the independent Acoustic EmissionWorking Group. K. A. Fowler is also serving on the latter group.
F. Students
James Chen, a graduate student in the Physics Dept. at BostonCollege, is working at Panametrics on this research. It is anticipated thathe will find a doctoral thesis topic within the scope of the work under thiscontract.
G. Course
Our course #2911 Ultrasonics, will be offered again at the North-eastern University Extension School when sufficient interest has been shownto warrant it in the judgment of the University administration.
18
L ,
REFEIRENCES
1. L. C. Lynnworth, E. H. Carnevale, and D. R. Patch, "UltrasonicProfile Measuring Apparatus," U.S. Patent No. 3, 636, 754 (Jan. 25,1972).
2. L. C. Lynnworth, "Dual Ultrasonic Sensors Employing a Single Modeof Ultrasonic Transmission," U. S. Patent No. 3,580, 058 (Aug. 1970).
3. L. C. L.ynnworth, "Dual Ultrasonic Sensors Employing Differing Modesof Ultrasonic Transmission," U.S. Patent No. 3,540,265 (May 1968).
4. E. P. Papadakis, J. Appl. Phys. 42 (7) 2990-2995 (June 1971).
5. i.. C. I.ynnworth and B. J. Spencer, "Magnetostrictive UltrasonicTransducer," U. S. Patent No. 3, 633, 424 (Jan. 11, 1972).
6. L. C. Lynnworth, "High Temperature Ultrasonic Measuring System,"U.S. Patent No. 3, 538, 750 (Nov. 10, 1970).
7. L. C. Lynnworth and B. J. Spencer, "Ultrasonic Sensing System,"U.S. Patent No. 3,514,747 (May 26, 1970).
8. L. C. Lynnworth, etal., IEEE Trans. Nucl. Sci. NS-18 (1) (Feb. 1971).
9. Annual Summary Report, ONR Contract N00014-71-C-0050, (Aug. 15,1971) p. 18.
10. E. P. Papadakis, L. C. Lynnworth, K. A. Fowler, and E. H.Carnevale, J. Acoust. Soc. Amer. 52, 850-857 (1972).
11. E. P. Papadakis, J. Acoust. Soc. Amer. 44, 1437-1441 (1968).
19
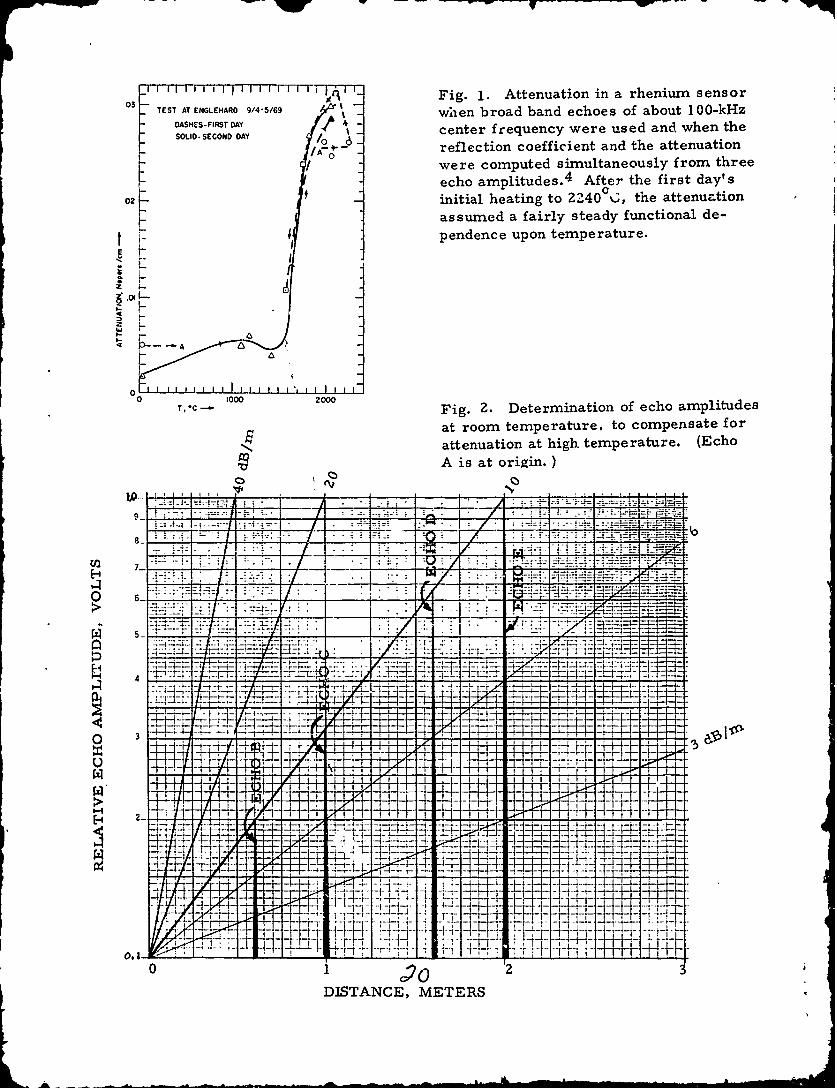
03 TES AT ENLR 9/4 I5/69 Fig. 1. Attenuation in a rhenium. sensor03 TET ATENGLHARD9/4-/69 hen broad band echoes of about 1 00-kI-z
DASHES-FIRST DAY - etrwr n hSOLID -SECOND CAY cetrfrequency weeused adwhenth
/A 0- -~reflection coefficient and the attenuationI were computed simultaneously from three
echo amplitudes.4 After the first day's
02 initial heating to 2240 ,;, the attenuationassumed a fairly steady functional de-
t I pendence upon temperature.
-- ýA4
0 LL.L 1000 2000
T, *C - Fig. 2. Determination of echo amplitudes
at room temperature, to compensate for
N attenuation at high temperature. (Echo
V A is at origin.)
0 6- M J=
-4-- 4 H 4-~
_4 -f-44-4
7- ___
I-4'
06
DISTANCE, METERS
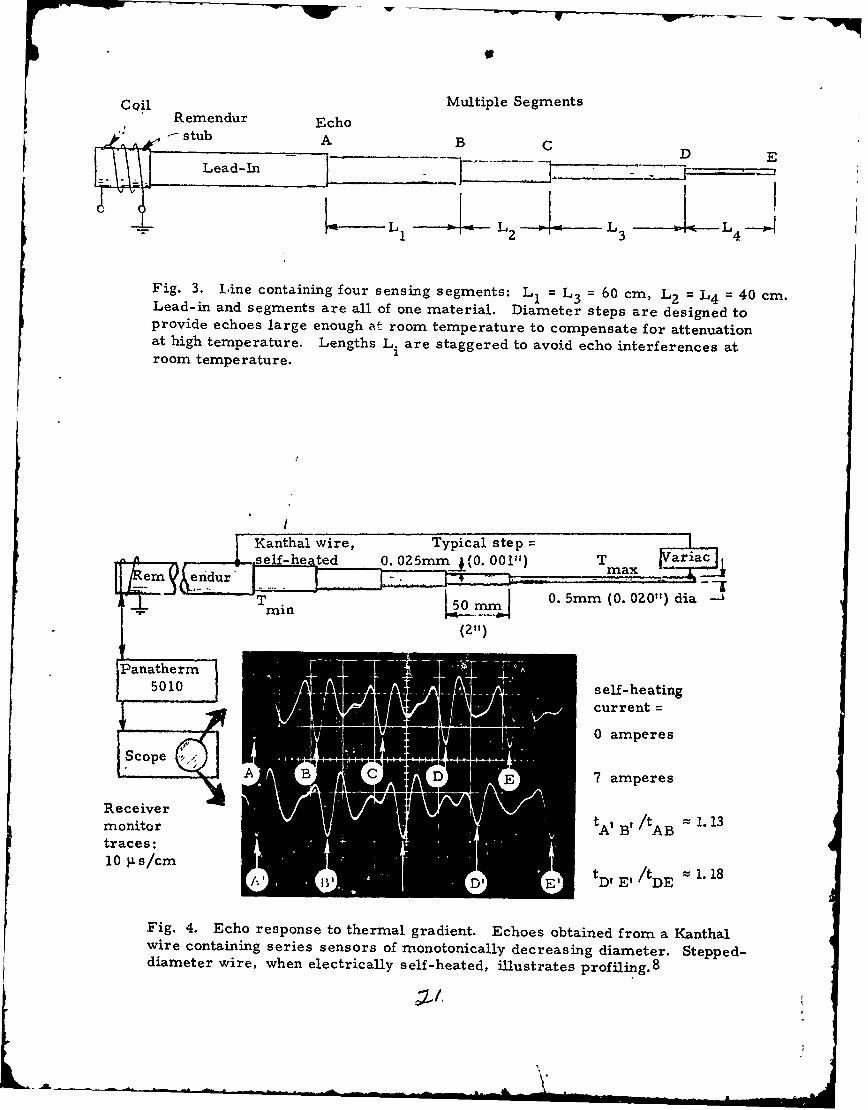
Coil Multiple SegmentsRemendur Echo
Lead- In-
L L 2L3L4--- L1 L - L3 - 4 --
Fig. 3. Line containing four sensing segments: L 1 L 3 = 60 cm, L 2 L 4 = 40 cm.Lead-in and segments are all of one material. Diameter steps are designed toprovide echoes large enough at room temperature to compensate for attenuationat high temperature. Lengths L. are staggered to avoid echo interferences atroom temperature.
|Kanthal wire, Typical step =•
A 0. OZ5m5 (. 001Z) T) da
mma
Ir em endur - "
Trmin L50.!j 0.5m(.2 )di
(2,,)
5010 self-heatingcurrent =
0 amperes
A B E7 amperes
Receivermonitor tAt B' /tAB 1.13traces:10 ps/cm A tDI E' /tDE 1.18
Fig. 4. Echo response to thermal gradient. Echoes obtained from a Kanthalwire containing series sensors of monotonically decreasing diameter. Stepped-diameter wire, when electrically self-heated, illustrates profiling. 8
AL "n •:•
l-r- W - -r - -wý
COIL POSITION ON SEGMENTEDMAGNETOSTRICT IVE LINE
COIL ATGROOVE "BU:APY"EcI IoES END
GROOVEECEHOESSBUMP COIL AT "GROOVY" END
ECIIOES
GROOVE
BUMP ECHOES COIL NEAR CENTR
ENDECHOES
Fig. 5. Test configuration and oscillograms
1W lisp-
Power input
110V 60H7 AC
Va riac20 Amp
ToFurnace
Light AmpLightMeter
I-
S Line circuit breaker .. .
ý23Fig. 6. Electrical heater control console.
L$
- ----. -w,,. - ----- " . - _i • 3 ] - -•- -- - -
To
Vacuum
Pump
Furnace/
Glass Tube
Thermocoupl.e
• I I
Transducers
I I
I Inside the furnace
'4ee-hil blackboey
.- fFig. 7. 1000°0C furnace configuration.
SCeramic tube
Therino-
IN "---------- ,Thin tungsten
OSteel rack
Tungsten lead-in*wire
Fig. 8. Rack configuration for holding lead-in wires andthermocouple.
Legend
El Run 3 up
0 Run 4 up
SRun 4 down
25
N
U 23
-4
0'-.4
S19•
"-4
"r.0
,..1 17
15
13, I0 200 400 600 800 1000
Temperature deg C
Fig. 9. Longitudinal wave modulus in remendur wire for sample 3.
K-
25 Legend
13 Run 3 up
R)kun'4 up
N 323A Run 4 down
° i 2 1o
0
191
O,. 17 jWz
15
13 _.. L .. -200 400 600 1800 1000
Temperature de~g C
Fig. 10. Longitudinal modulus in rerYiendur wire for sample 4.
I
300
Legend
200 E l Run 3 up
•o ) Run 4 up I
o-. 4 SRun 4down
100-
2040600 §00 1O000C C.) Temperature deg C
F 1
Fig l. ttnutin oefice~t orsapl 3
* ®,j. I I
Legend
1 Run 3up
( Run 4 up
300 A Run 4 down
,-
Fg i//
20040060-80 00
"[" Temperature deg C
Fig. 12. Attenuation coefficient for sample 4.
APPENDIX A
PANAMETRICS221 Crescent Street -Waltham, Massachusetts 02154 • (617) 899-2719
MONITORING THE MODULI OF POLYMERS
WITH ULTRASOUND
by
Emmanuel P. Papadakis
Alt
ABSTRACT
Two ultrasonic methods are presented for the measurement
and monitoring of the elastic moduli of polymers and other liquids
undergoing solidification. The methods are thought to be most sensitive
to the build-up of the real component of the modulus of rigidity of the
material. Ultrasonic traveling waves are used to interrogate a boundary
between the solid body transmitting the wave and the sample under test.
Data on epoxy resins are given.
Az
Li

I. INTRODUCTION
The behaviour of epoxy resins during hardening was studied as a
function of time by means of ultrasonics. Both bulk wave and wire wave
methods were employed, and were found to complement each other. The
propagation media (glass blocks and tungsten wires) were partially immer-
sed in beakers of epoxy, and the increasing energy transfer into the epoxy
noted as it hardened. Temperature was monitored simultaneously. Quanti-
tative results were obtained, but their interpretation is complicated by two
factors:
1) The exothermic nature of the polymerization and cross-linking reactions
which raised the temperature in the epoxy, and
2) The fact that the glass transition temperature rises during polymeri-
zation, being below the epoxy temperature at the start of polymerization
and above the epoxy temperature after curing. (1, 2)
The methods, however, hold promise for further study of polymers
and plastics.
II. EXPERIMENTS WITH BULK WAVES
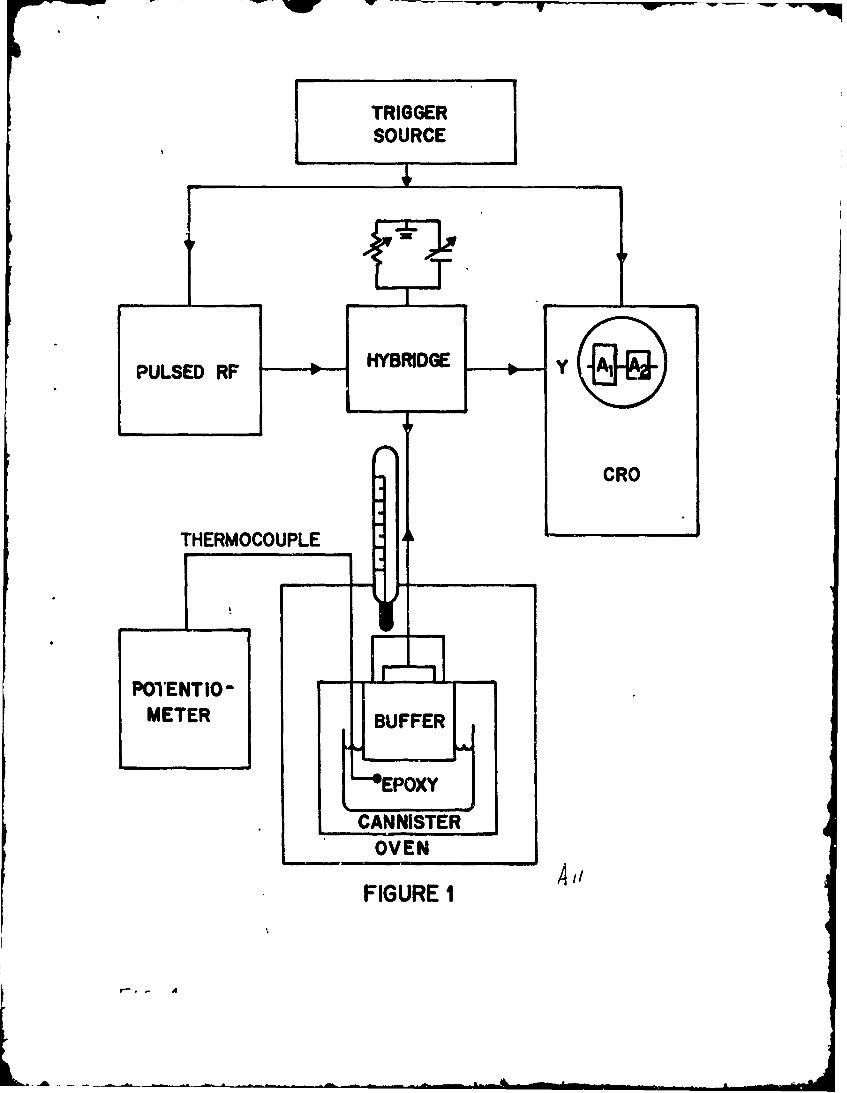
A glass buffer rod with plane parallel ends having an ultrasonic
transducer bonded to one end was inserted into a pot of epoxy mixed with
hardener as shown in Fig. 1. Echoes within the rod were observed on an
oscilloscope and recorded photographically duriag the curing process.
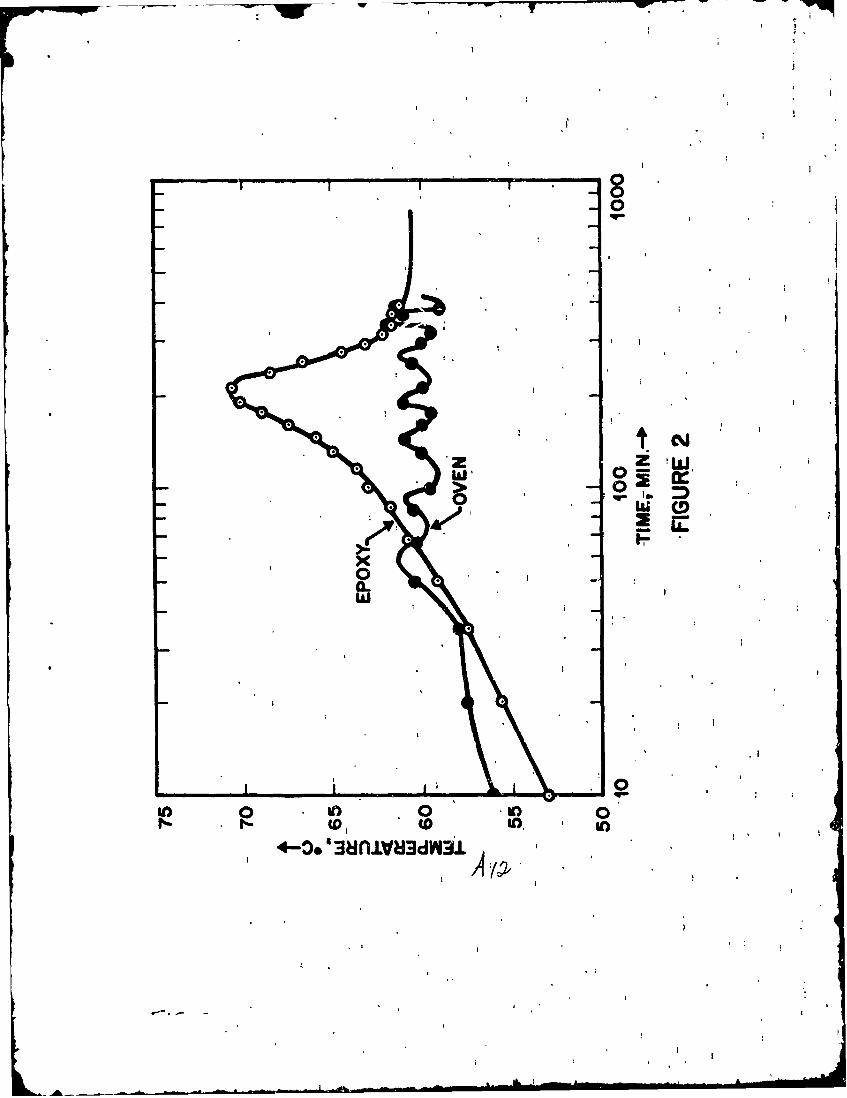
The temperature of the epoxy was monitored by a thermocouple, and is
plotted as a function of log (time) in Fig. 2, along with the temperature
of the curing oven. The pnrtion of the wave entering the epoxy did not
return to the sample because of attenuation in the epoxy and diffusion at
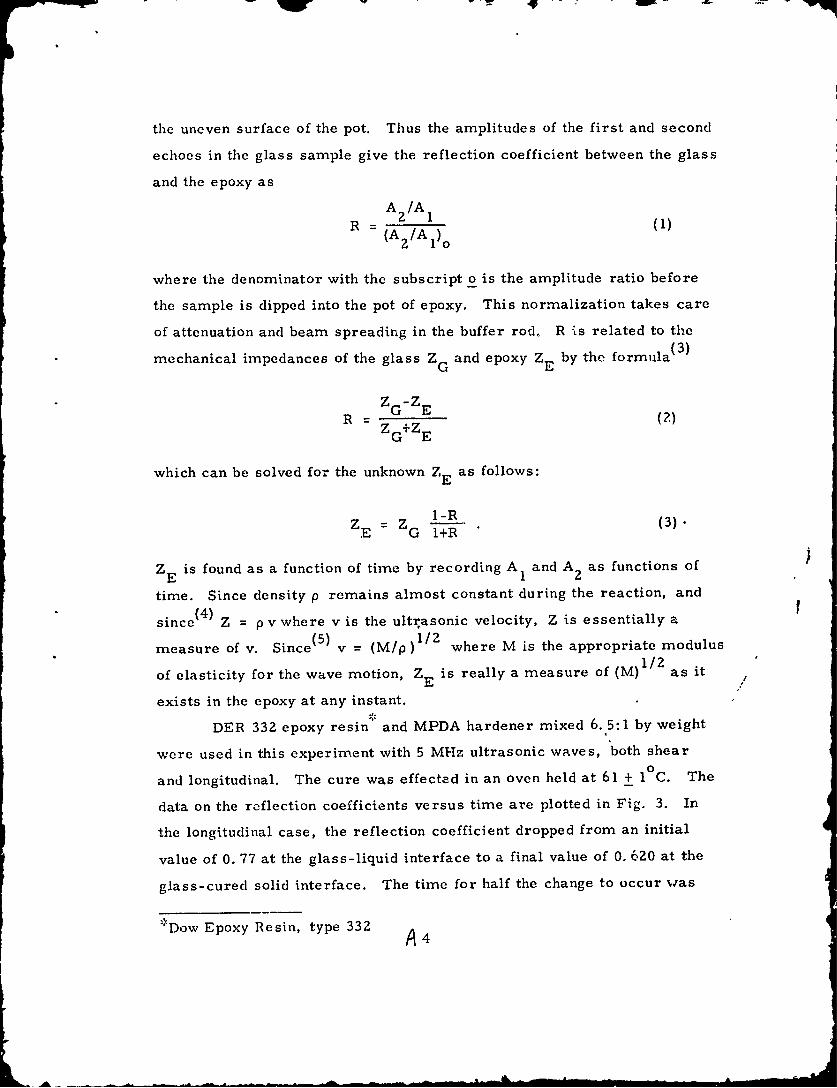
the uneven surface of the pot. Thus the amplitudes of the first and second
echoes in the glass sample give the reflection coefficient between the glass
and the epoxy as
AE/A1
R = (A/A ()2(A2/A i)o
where the denominator with the subscript o is the amplitude ratio before
the sample is dipped into the pot of epoxy. This normalization takes care
of attenuation and beam spreading in the buffer rod, R is related to the
mechanical impedances of the glass ZG and epoxy ZE by the formula(3)
ZG-E
R = (2)ZG+ZE
which can be solved for the unknown Z E as follows:
Z Z -R (3)E G 1+R
ZE is found as a function of time by recording A1 and A2 as functions of
time. Since density p remains almost constant during the reaction, and
since(4) Z = p v where v is the ultrasonic velocity, Z is essentially a
measure of v. Since(5) v = (M/p)1/ where M is the appropriate modulus1/2
of elasticity for the wave motion, ZE is really a measure of (M) as it
exists in the epoxy at any instant.
DER 332 epoxy resin and MPDA hardener mixed 6.5:1 by weight
were used in this experiment with 5 MHz ultrasonic waves, both shear
and longitudinal. The cure was effected in an oven held at 61 + 1 0 C. The
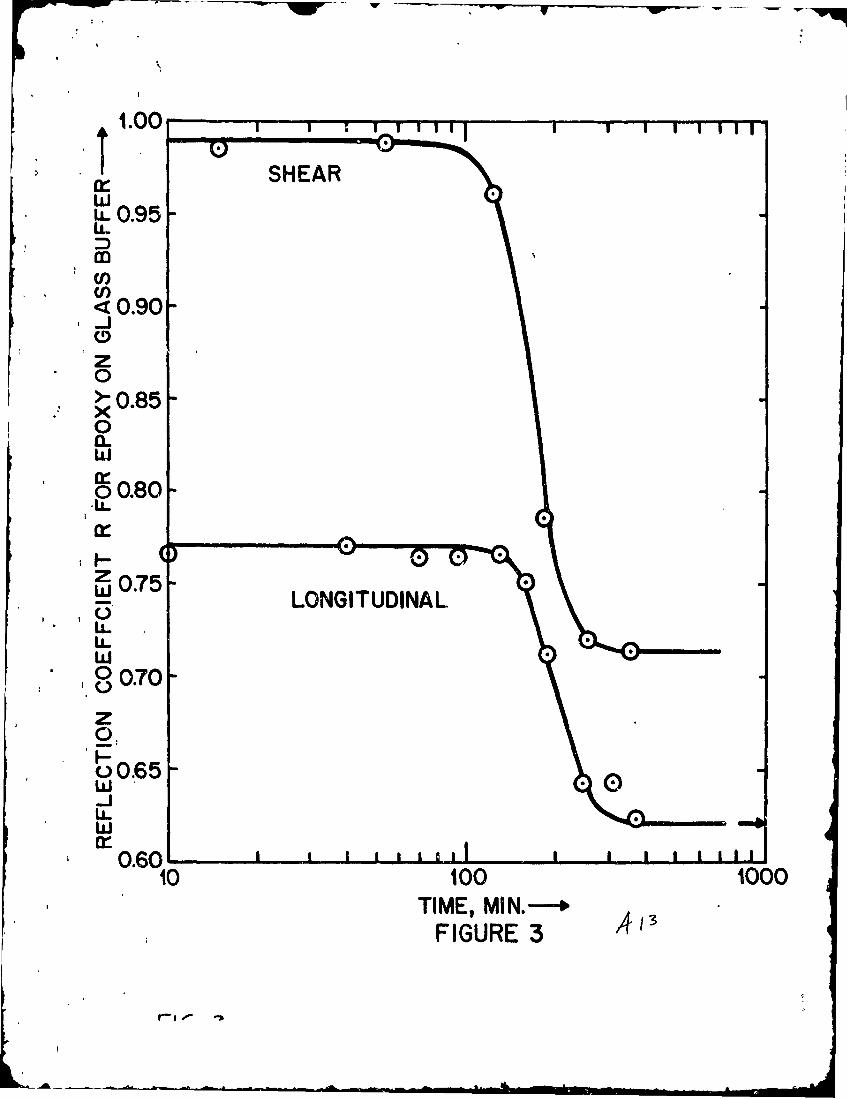
data on the reflection coefficients versus time are plotted in Fig. 3. In
the longitudinal case, the reflection coefficient dropped from an initial
value of 0. 77 at the glass-liquid interface to a final value of 0. 620 at the
glass-cured solid interface. The time for half the change to occur was
"'Dow Epoxy Resin, type 332 A4
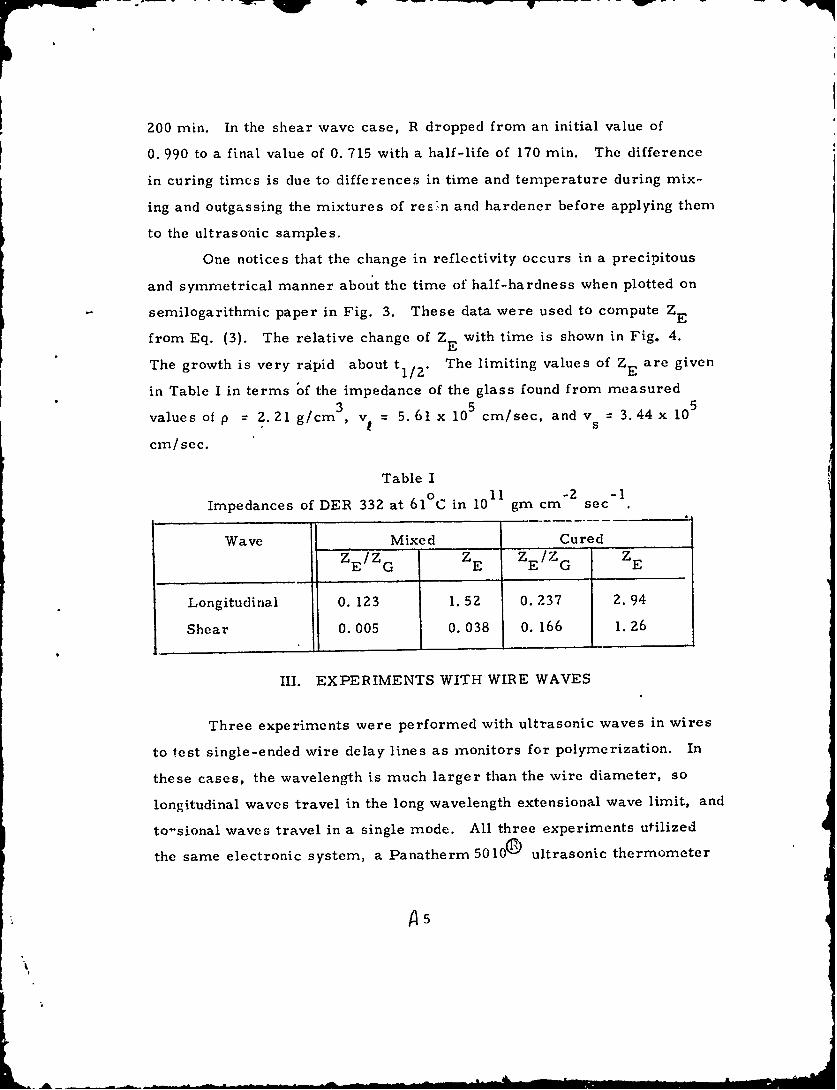
200 min. In the shear wave case, R dropped from an initial value of
0. 990 to a final value of 0. 715 with a half-life of 170 min. The difference
in curing times is due to differences in time and temperature during mix-
ing and outgassing the mixtures of reE~n and hardener before applying them
to the ultrasonic samples.
One notices that the change in reflectivity occurs in a precipitous
and symmetrical manner about the time of half-hardness when plotted on
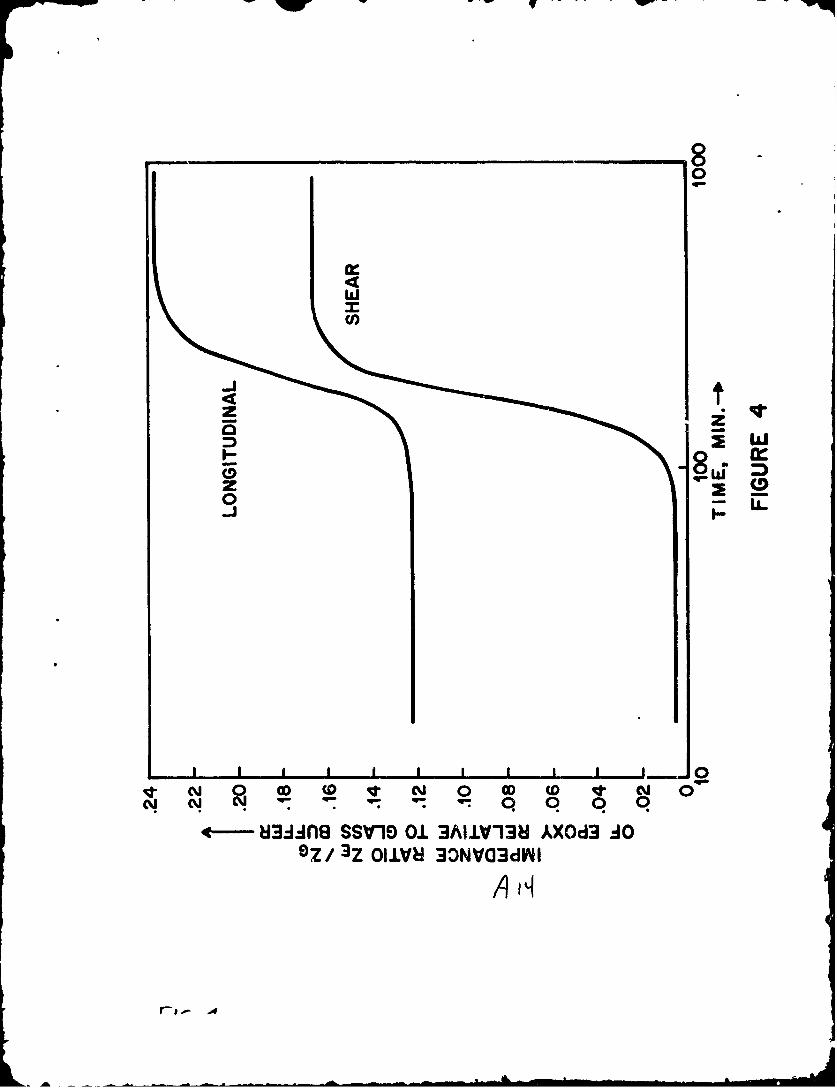
semilogarithmic paper in Fig. 3. These data were used to compute ZE
from Eq. (3). The relative change of ZE with time is shown in Fig. 4.
The growth is very rapid about t /2' The limiting values of ZE are given
in Table I in terms of the impedance of the glass found from measured
values of p = 2.21 g/cm , v, = 5.61 x 10 cm/sec, and v = 3.44x 10x
cm/sec.
Table I o 1-2 -1
Impedances of DER 332 at 61 C in 1011 gm cm sec
Wave Mixed Cured
ZE /ZG ZE ZE ZG ZE
Longitudinal 0. 123 1.52 0. 237 2. 94
Shear 0. 005 0. 038 0. 166 1. 26
III. EXPERIMENTS WITH WIRE WAVES
Three experiments were performed with ultrasonic waves in wires
to test single-ended wire delay lines as monitors for polymerization. In
these cases, the wavelength is much larger than the wire diameter, so
longitudinal waves travel in the long wavelength extensional wave limit, and
to-sional waves travel in a single mode. All three experiments utilized
the same electronic system, a Panatherm 5010e) ultrasonic thermometer
A 5
- -- - . - " w -J - - wl ..- .. . . .- T.
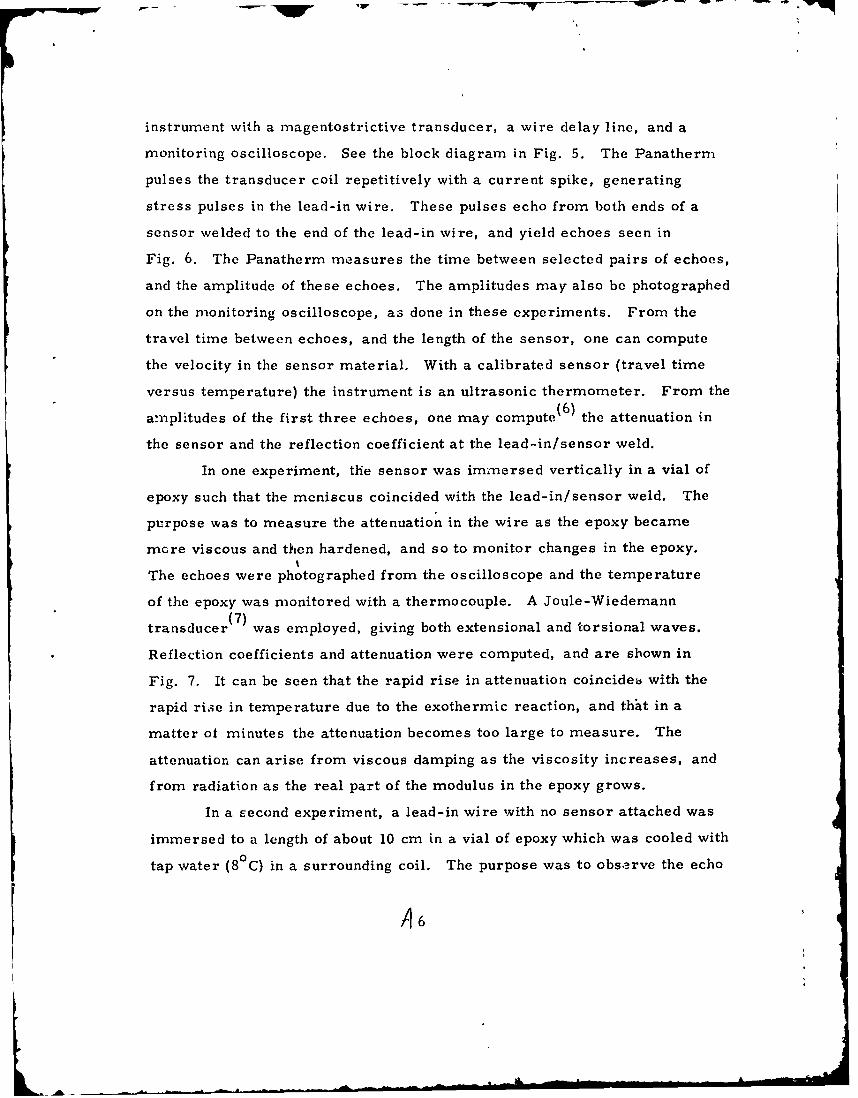
instrument with a magentostrictive transducer, a wire delay line, and a
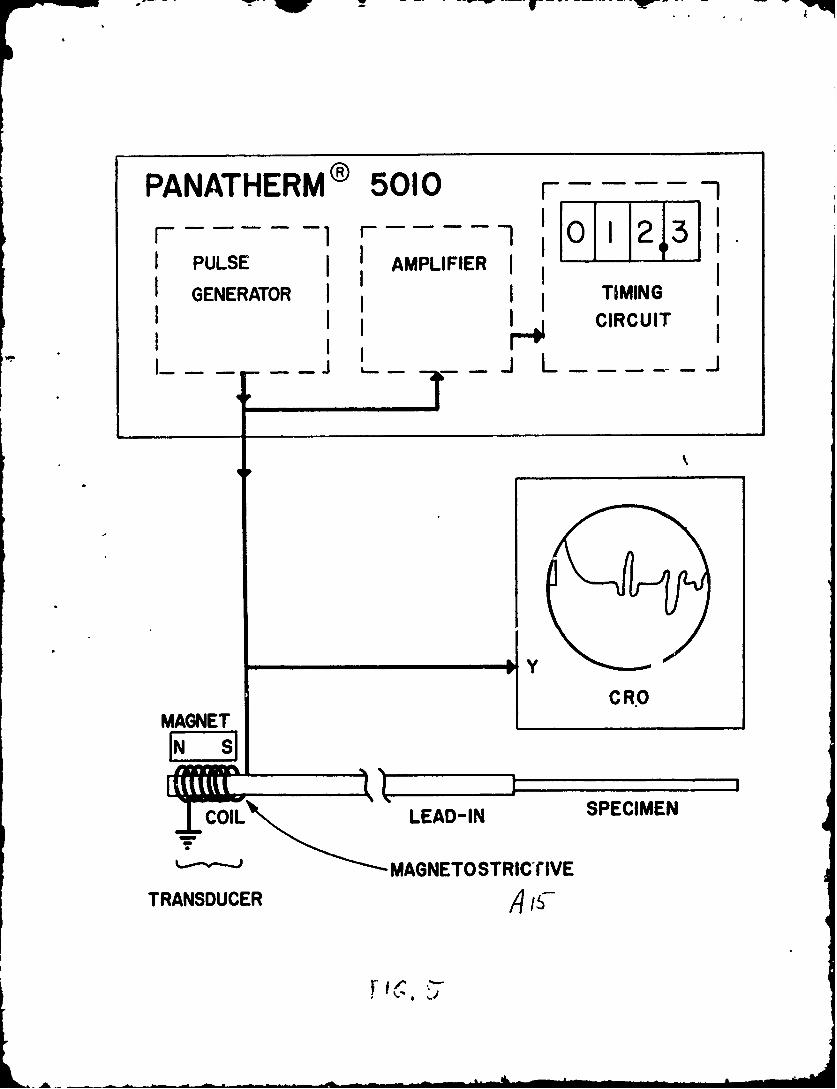
monitoring oscilloscope. See the block diagram in Fig. 5. The Panatherm
pulses the transducer coil repetitively with a current spike, generating
stress pulses in the lead-in wire. These pulses echo from both ends of a
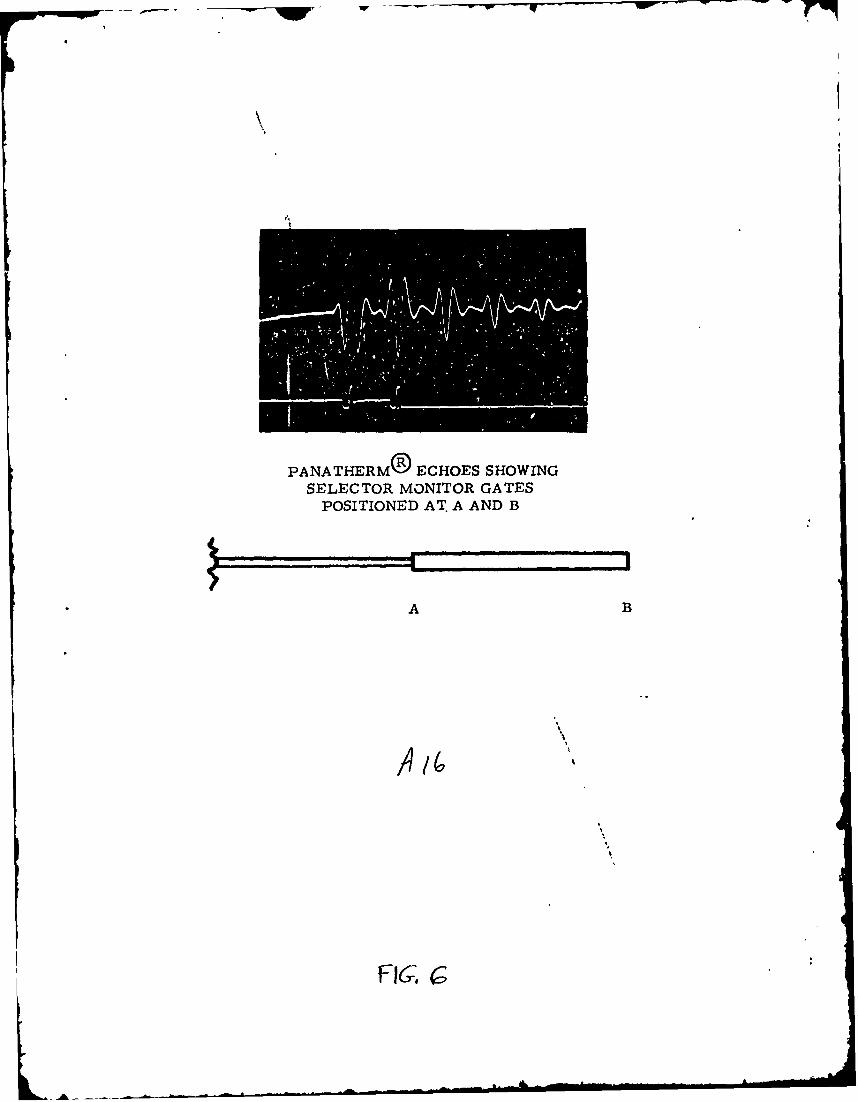
sensor welded to the end of the lead-in wire, and yield echoes seen in
Fig. 6. The Panatherm measures the time between selected pairs of echoes,
and the amplitude of these echoes. The amplitudes may also be photographed
on the monitoring oscilloscope, as done in these experiments. From the
travel time between echoes, and the length of the sensor, one can compute
the velocity in the sensor material. With a calibrated sensor (travel time
versus temperature) the instrument is an ultrasonic thermometer. From the
a:mplitudes of the first three echoes, one may compute.(6) the attenuation in
the sensor and the reflection coefficient at the lead-in/sensor weld.
In one experiment, the sensor was immersed vertically in a vial of
epoxy such that the meniscus coincided with the lead-in/sensor weld. The
purpose was to measure the attenuation in the wire as the epoxy became
more viscous and then hardened, and so to monitor changes in the epoxy.
The echoes were photographed from the oscilloscope and the temperature
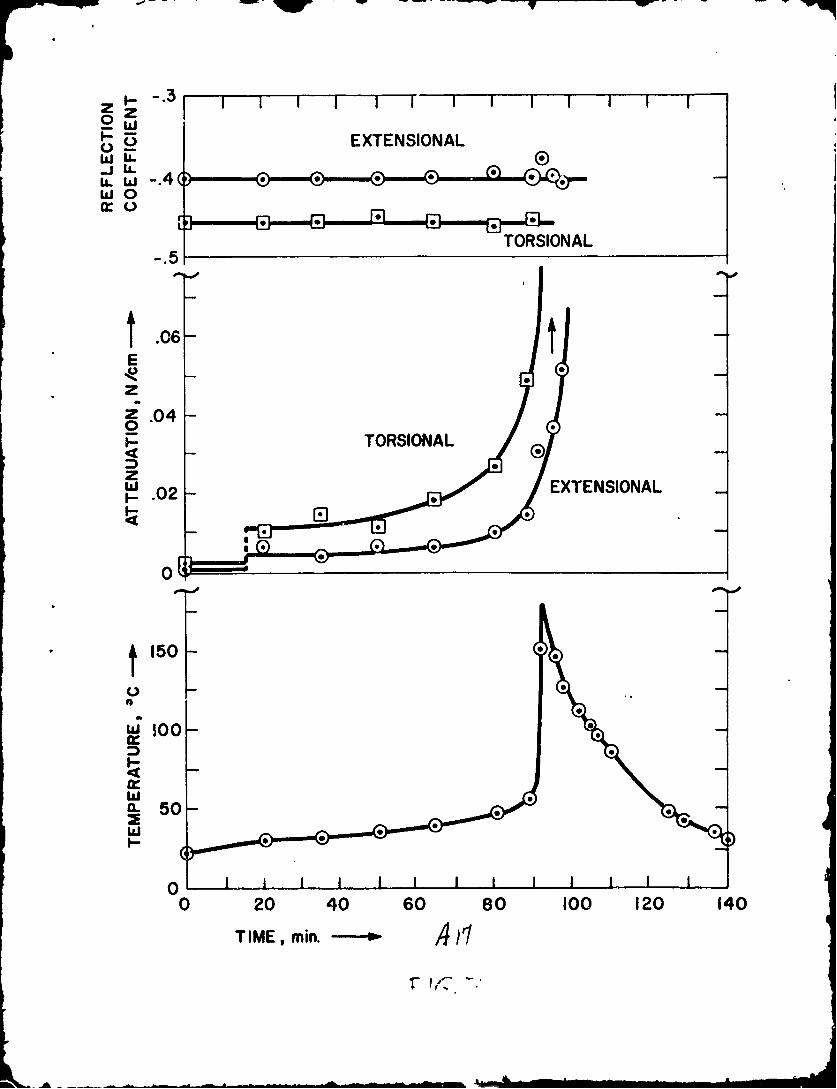
of the epoxy was monitored with a thermocouple. A Joule-Wiedemanntransuce (7)
transducer (was employed, giving both extensional and torsional waves.
Reflection coefficients and attenuation were computed, and are shown in
Fig. 7. It can be seen that the rapid rise in attenuation coincideb with the
rapid rise in temperature due to the exothermic reaction, and that in a
matter of minutes the attenuation becomes too large to measure. The
attenuation can arise from viscous damping as the viscosity increases, and
from radiation as the real part of the modulus in the epoxy grows.
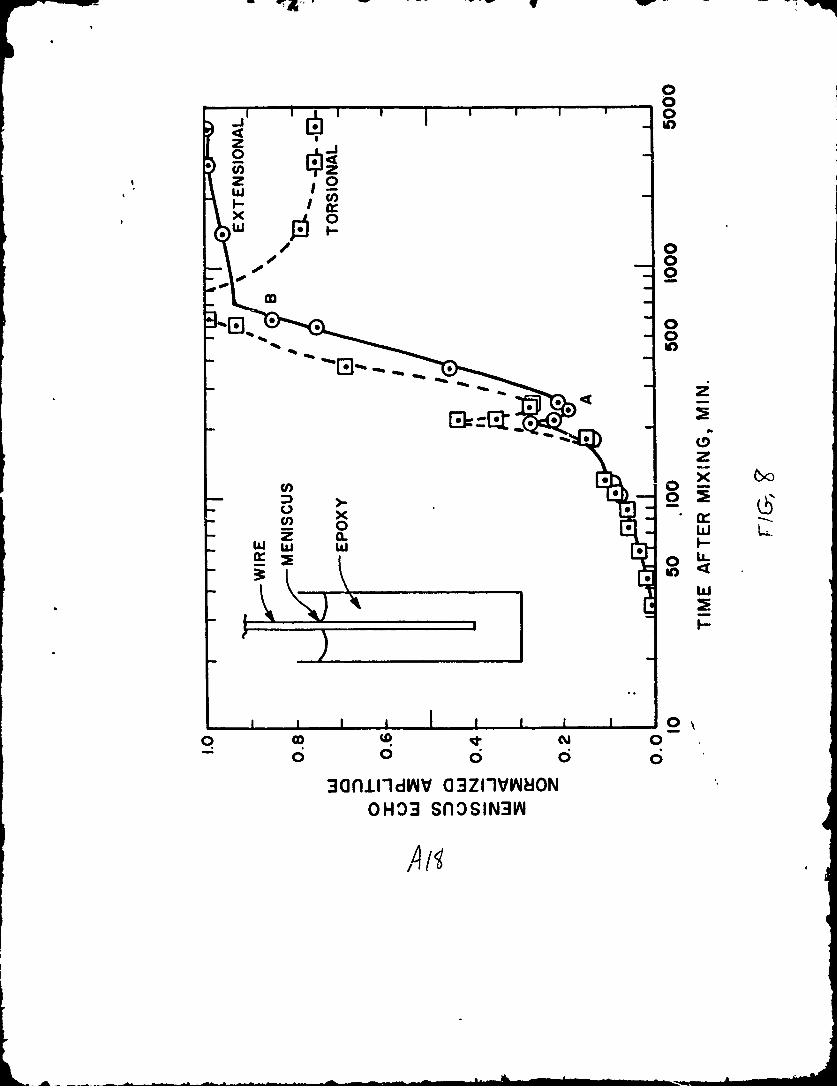
In a second experiment, a lead-in wire with no sensor attached was
immersed to a length of about 10 cm in a vial of epoxy which was cooled with
tap water (8 C) in a surrounding coil. The purpose was to observe the echo
A6
which was found to be generated at the meniscus when the epoxy begins
to solidify. On solidification, the wire within the epoxy increases in
effective acoustic impedance (4) because of the adhering epoxy, and a
definite echo is created at the meniscus. The amplitude of this echo
was followed with oscilloscope photographs as the epoxy hardened. A
plot is shown in Fig. 8. The echo becomes visible in less than 45 minutes,
and grows slowly at this temperature until -. rapid increase begins at
about 200 minutes. The climb is interrupted at point A on the graph by
an apparent partial disbonding between the wire and the epoxy. (Cracks
were visible upon inspection after the experiment. ) However, the echo
amplitude continues to climb thereafter until another discontinuity appears
at point B on the graph. It is thought that this, too, arose from partial
disbonding. The echo at the meniscus is thought to be generated by the
growth of the shear modulus (modulus of rigidity) of the epoxy.
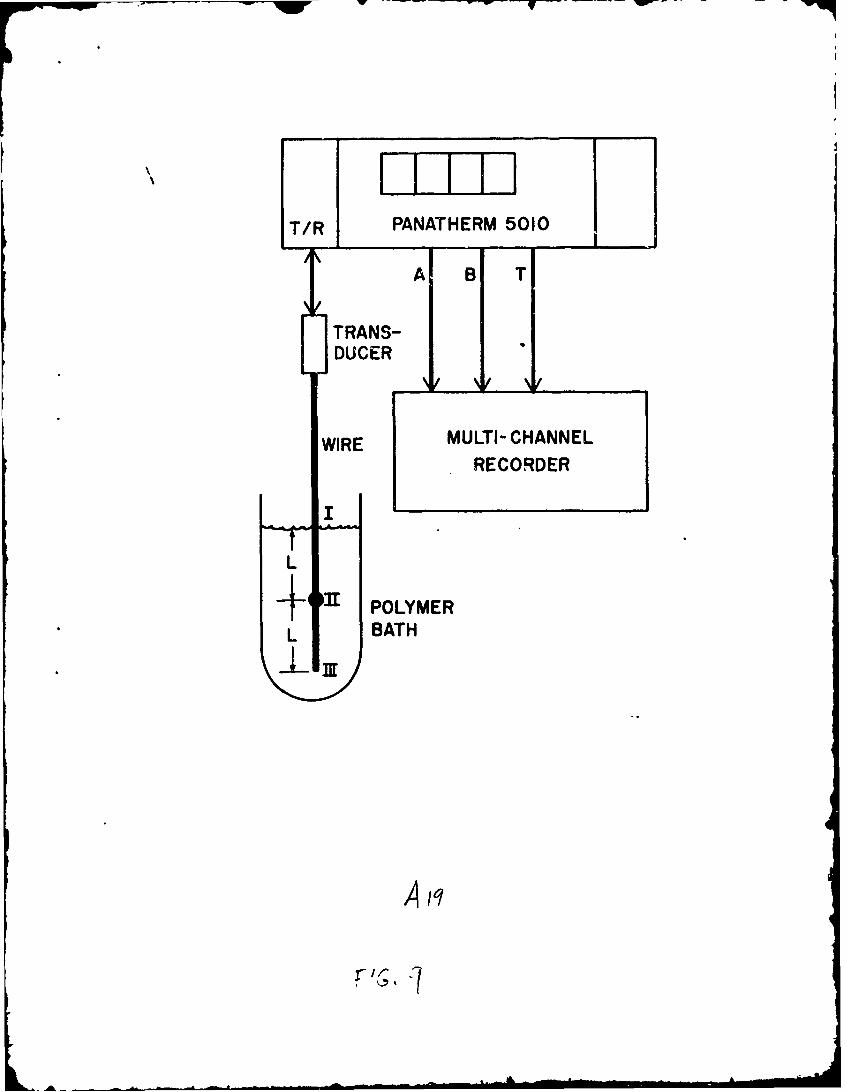
A third experiment was performed to test the automatic capabilities
of the Panatherm 5010 instrument to detect and record the initiation and
growth of the echo at the meniscus of the epoxy. The system was set up
as in Fig. 9 with the wire immersed to a depth 2L into a vial of epoxy.
The first segment of length L was a sensor, while the second segment
was part of the lead-in wire. The "Selector Monitor" of the Panatherm
was set to observe the echoes from the weld (point II) and the end of the
sensor (point III) while the echo from the meniscus was absent or small.
The amplitudes A and B as measured by the Panatherm were sent to a
multi-channel recorder. The trigger level in the Panatherm was set to
cause the instrument to begin monitoring the echo at the meniscus (point I
of Fig. 9) when it had grown to a small but finite value. The experiment
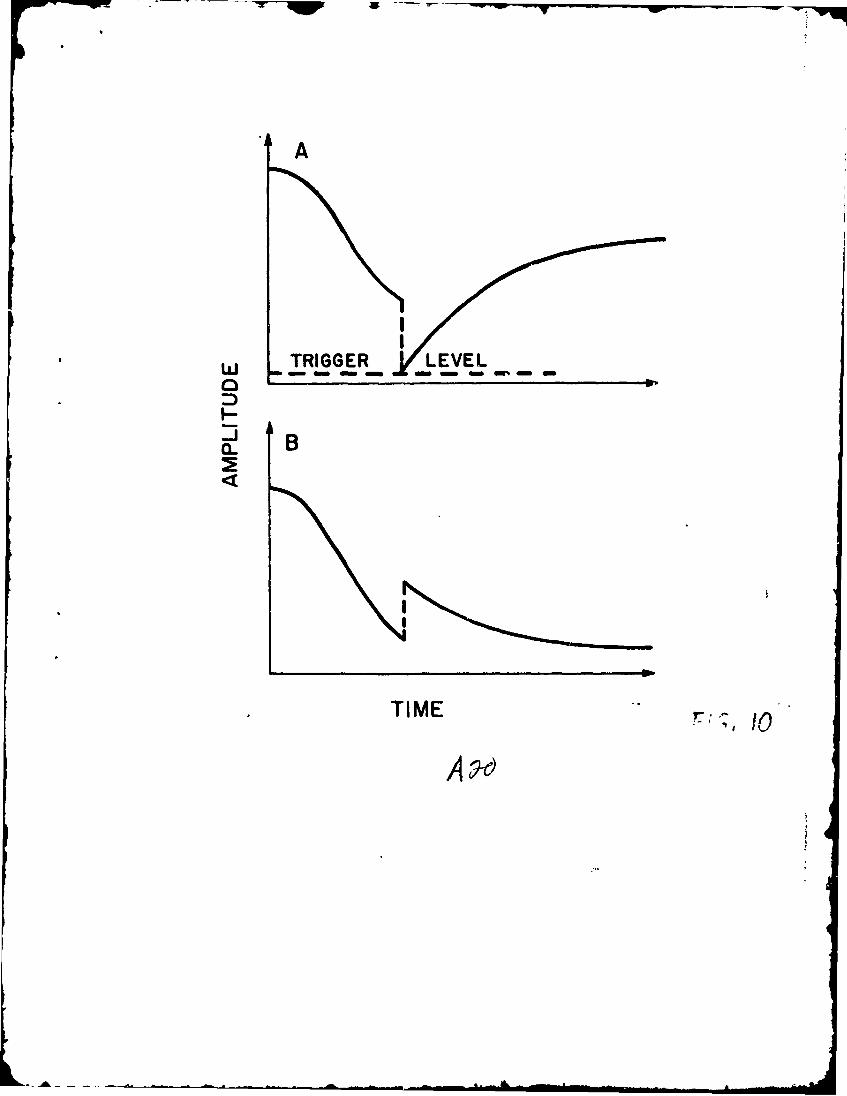
when run resulted in data sketched schematically in Fig. 10 which represents
the record on a strip chart. Initially the echoes from points II and III
(charts A and B) fall as attenuation increases. When the echo from point I,
A7
the meniscus, reaches the trigger level, the instrument jumps to monitor
points I and II on charts A and B instead. The meniscus echo grows while
the echo at point II continues to decrease in amplitude.
IV. DISCUSSION
Two ultrasonic methods have been presented for studying the growth
of the elastic moduli of epoxy resins during polymerization. By extension,
the methods could be used for other polymers and for liquids which change
to a solid phase at a melting point or go through a glass transition. The
two methods, using wire waves and bulk waves respectively, can operate
from a few kHz to several GHz. The dividing line between them is in the
range 500kHz to 2 MHz, since bulk wave tranmducers for plane waves
become excessively large below 500 kHz and since wire-sonic transmission
lines become difficult to build above 2 MHz. The methods are applicable
to the study of bulk quantities of liquids undergoing solidification. For
thin layers, surface waves, Lamb waves and interface waves might be"
preferable, although the wire waves should be as sensitive. The methods
react to relatively gross changes in system properties. For measuring
smaller changes, see Ref. 8.
ACKNOWLEDGMENTS
The author is indebted to M. Lasky and R. Faires of ONR for
continued support of this work. Conversations with E. H. Young and
T. R. Meeker of Bell Telephone Laboratories, and with L. C. Lynnworth
of this laboratory. proved valuable.
A8
KL
REFERENCES
1. N. Shito and M. Sato, J. Polymer Science: Part C 40, 1069-1078
(1967).
2. F. Nuayama and J. P. Bell, J. Polymer Science: Part A2 8, 437-445
(1970).
3. R. B. Lindsay, Mechanical Radiation, M Graw-Hill, N.Y., 1960,
pp. 74-76.
4. R. B. Lindsay, op. cit., p. 218.
5. R. B. Lindsay, op. cit., p. 21.
6. E. P. Papadakis, J. Appl. Phys. 42, 2990-299: (1971).
7. N. Tzannes, IEEE Trans. Sonics Ultrasonics 13, 33-41 (1966).
8. W. P. Mason, Physical Acoustics and the Properties of Solids, D.
Van Nostrand, Princeton, N. J., 1958, pp. 107-113.
49
CAPTIONS
Fig. 1. Block diagram of the experiment using ultrasonic bulk waves
impinging upon epoxy resin at normal incidence.
Fig. 2. Temperatltri in tae oven and in the epoxy in experiment performed
as in Fig. 1.
Fig. 3. Reflection coefficients at the buffer/epoxy interface in two experi-
ments performed as in Fig. 1 on curing epoxy.
Fig. 4. Inpeclance ratios computed from the data of Fig. 3. See Table I
for absolute values.
Fig. 5. Block diagram of the instrumentation used for waves in wires.
Specimens and thermocouples were dipped vertically into vials of
epoxy.
Fig. 6. Echoes (upper) and Selector Monitor pips (lower) photographed on
the CRO, and corresponding specimen geometry, in one experiment
performed with equipment in Fig. 5 with specimen immersed.
Fig. 7. Data on a wire specimen in epox, during curing.
Fig. 8. Amplitude of the meniscus echo from a lead..in wire (without
specimen) held in epoxy during curing.
Fig. 9. Test set to monitor polymerization automatically. The ..nplitude
outputs A and B were from the weld (II) and the specirn'bn end (III)
respectively at first. When the meniscus echo (I) grew to a prPset
trigger level channel A began monitoring the meniscus (I) and
channel B switched to the weld (II).
Fig. 10. Data from the test set in Fig. 9. When the meniscus echo reached
the trigger level, hiannels A and B switched from positions II and
III to positions I and II of Fig. 9.
2].44"
TRIGGERSOURCE
PULSED RF ABRIDGE
CRO
THERMOCOUPLE
POT ENTIO-METER BUFFER
"-EPOXY
CANNISTEROVEN
FIGURE 1
"-, A A
~~7 W F w
0
10
4-0& UNHUH3
1 .00 -
SHEARIw
0.95
mU)< 0.90
0
*>- 0.85x0
5 •0.80-a-
w LONGITUDINAL.
u-
c0.65 -
ILl
w0
tru- 0
w
060
0.60 , , ,o I, , , , ,,,1
10 100 1000TIME, MIN.--
FIGURE 3 ,413
t-~I- -"
li
wC,)
q 4 tvz3zn SI 13IV1UA~3J
OZ/ Z OILVH33Nv~dz
ALW
PANATHERM® 5010 -0 1 2T 1I PULSE I AMPLIFIER iI I
GENERATOR I I TIMINGI I I •CIRCUIT
CR9MAGNETIN S]
T100 LEAD-IN SPECIMEN
MAGNETO STRICrIVE
TRANSDUCER
PANATHERM® ECHOES SHOWINGSELECTOR MONITOR GATES
POSITIONED AT. A AND B
A B
F16 ;
L __._•• .i i
.-- -I I I I -I I
Z zow
r_ EXTENSIONALw
wo0
TORSIONAL-. 5
S. 0 6 4E
A! - 0zZ .040T
pTORSIONAL
_ EXTENSIONAL02
S150 -
00-
a- 50-
w_ 00
0 20 40 60 80 100 120 140
TIME, rain. ----- o-
x 0__ _ _ _ _ _ _ _ __ _ _ _ _ _ _ _
z C0 LL
6 003ail w aZlIWO
xH3soI3
"F- I _ 1IT/R PANATHERM 5010
A B T
TRANS-DUCER
WIRE MULTI- CHANNELRECORDER
L
+ '3 POLYMER
I_ BATH
-NA
li-
STRGGE LEVEL
B
* I I I ma
TIME
AT
I[ - Subnitd to UiLTONICS(November 1972)
APPENDIX B
Attenuation and Reflection Coefficient Nomogramby
Lawrence C. Lynnworth
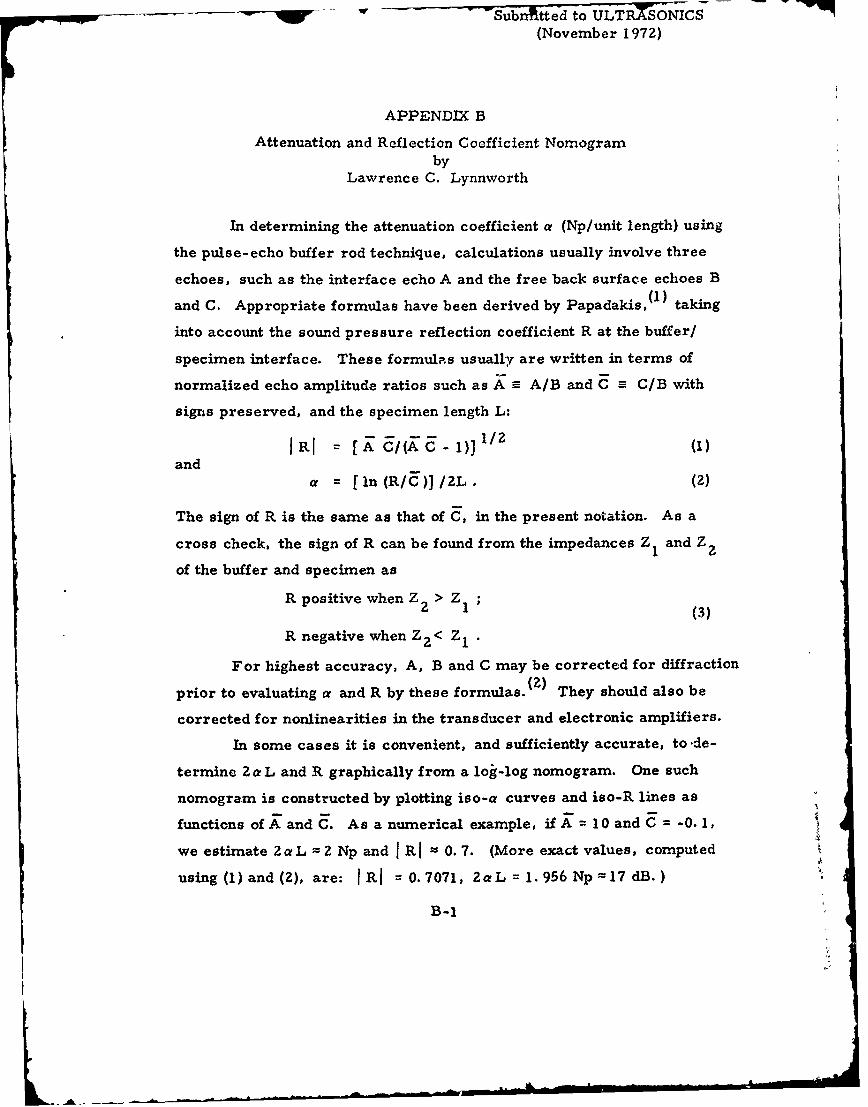
In determining the attenuation coefficient a (Np/unit length) using
the pulse-echo buffer rod technique, calculations usually involve three
echoes, such as the interface echo A and the free back surface echoes B
and C. Appropriate formulas have been derived by Papadakis,(1) taking
into account the sound pressure reflection coefficient R at the buffer/
specimen interface. These formulas usually are written in terms of
normalized echo amplitude ratios such as A - A/B and C M C/B with
signs preserved, and the specimen length L:
IRI [A C/(AC- 1)11/2 (1)and
a [In (R/C)l /ZL (2)
The sign of R is the same as that of C, in the present notation. As a
cross check, the sign of R can be found from the impedances Z1 and Z
of the buffer and specimen asR positive when Z > Z ;
R negative when Z 2 < Z 1
For highest accuracy, A, B and C may be corrected for diffraction
prior to evaluating a and R by these formulas. M They should also be
corrected for nonlinearities in the transducer and electronic amplifiers.
In some cases it is convenient, and sufficiently accurate, to -de-
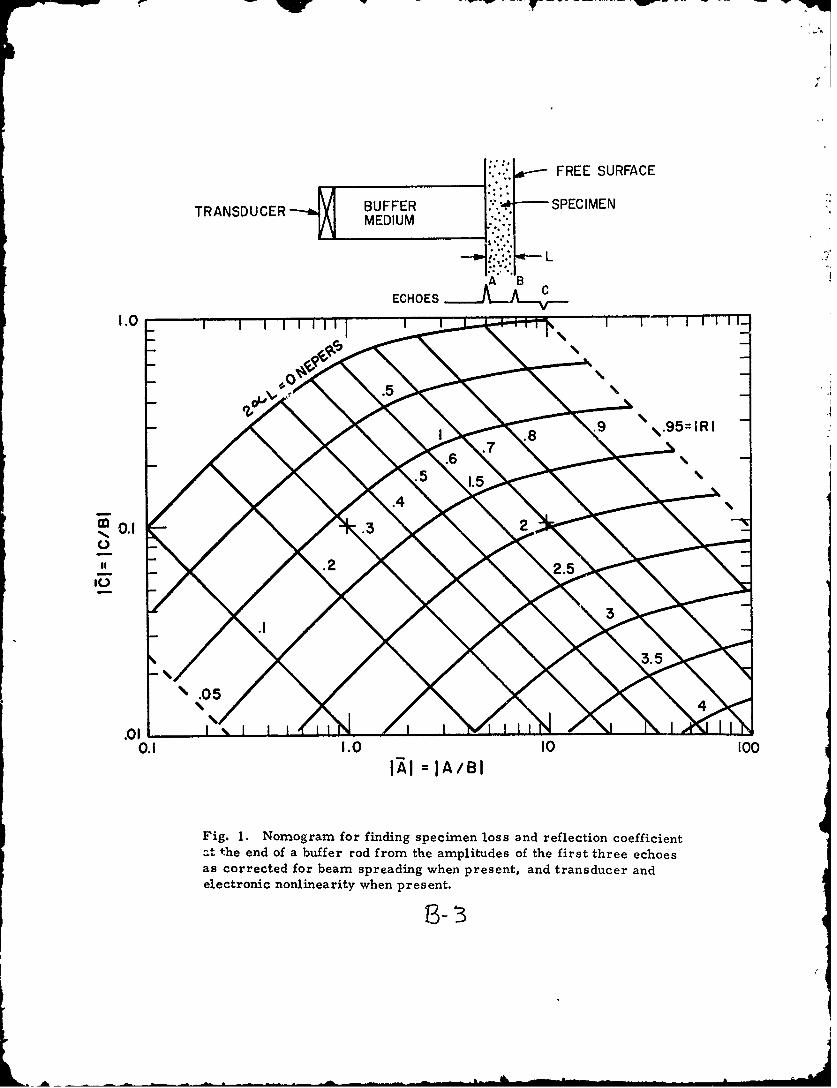
termine Z a L and R graphically from a log-log nomogram. One such
nomogram is constructed by plotting iso-a curves and iso-R lines as
functions of A and C. As a numerical example, ifA= 10 and C= -0. 1,
we estimate Za L 2 Np and RI 0. 7. (More exact values, computed
using (1) and (Z), are: R R 0.7071, 2aL 1.956 Np 17 dB.)
B-I
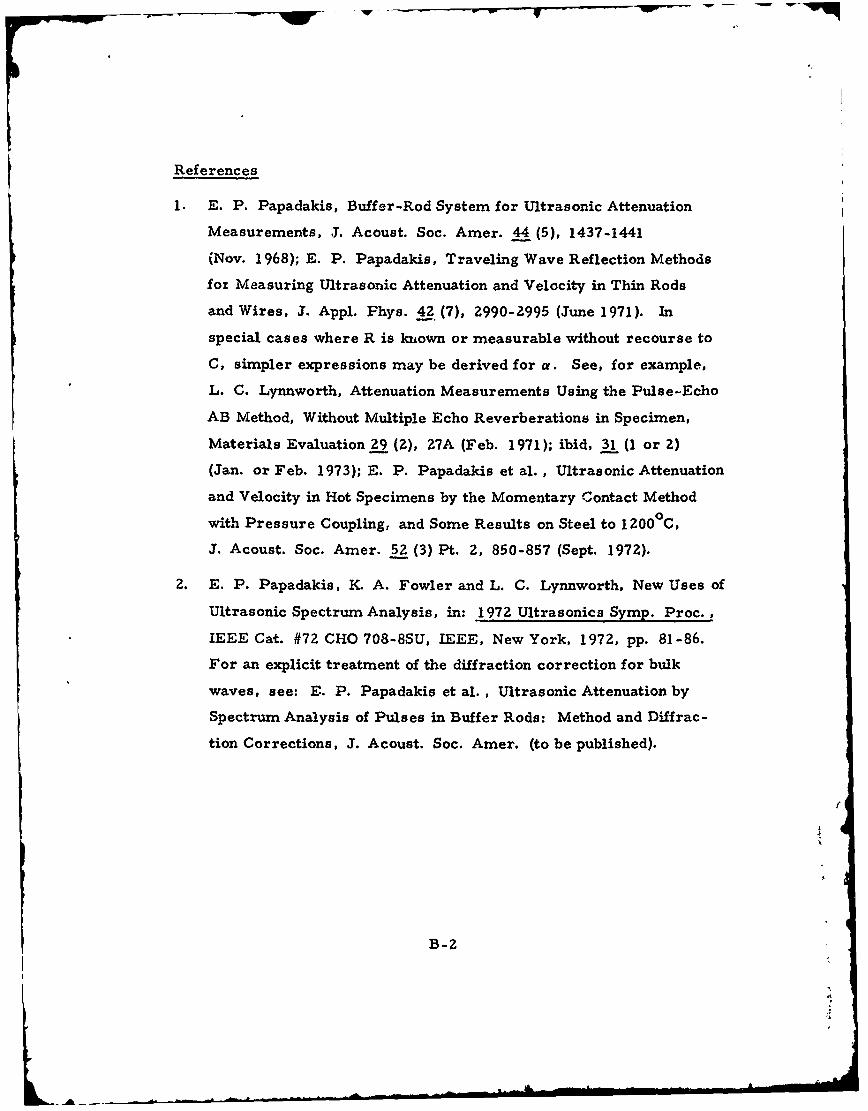
References
1. E. P. Papadakis, Buffer-Rod System for Ultrasonic Attenuation
Measurements, 3. Acoust. Soc. Amer. 44 (5), 1437-1441
(Nov. 1968); E. P. Papadakis, Traveling Wave Reflection Methods
fox Measuring Ultrasonic Attenuation and Velocity in Thin Rods
and Wires, J. Appl. Phys. 42 (7), 2990-2995 (June 1971). In
special cases where R is klown or measurable without recourse to
C, simpler expressions may be derived for a. See, for example,
L. C. Lynnworth, Attenuation Measurements Using the Pulse-Echo
AB Method, Without Multiple Echo Reverberations in Specimen,
Materials Evaluation 29 (2), 27A (Feb. 1971); ibid, 31 (1 or 2)
(Jan. or Feb. 1973); E. P. Papadakis et al., Ultrasonic Attenuation
and Velocity in Hot Specimens by the Momentary Contact Method
with Pressure Coupling, and Some Results on Steel to 12000C,
J. Acoust. Soc. Amer. 52 (3) Pt. 2, 850-857 (Sept. 1972).
2. E. P. Papadakis, K A. Fowler and L. C. Lynnworth, New Uses of
Ultrasonic Spectrum Analysis, in: 1972 Ultrasonics Symp. Proc.
IEEE Cat. #72 CHO 708-8SU, IEEE, New York, 1972, pp. 81-86.
For an explicit treatment of the diffraction correction for bulk
waves, see: E. P. Papadakis et al., Ultrasonic Attenuation by
Spectrum Analysis of Pulses in Buffer Rods: Method and Diffrac-
tion Corrections, J. Acoust. Soc. Amer. (to be published).
B-2
FREE SURFACE
TRANSDUCER BUFFER ISPECIMENMEDIUM
ECHOES
1.0 17 - 1 11
\0 .
IAI I''A/BI
.•8 .9 ",.95= 1R1 -
-3-
11 0.1 .-
k 35
S.05
.0 1
0.1 1.0 10 100
JI, =IA/BI
Fig. 1. Nomogram for finding specimen loss and reflection coefficienta'. +.he end of a buffer rod from the amplitudes of the first three echoes
as corrected for beam spreading when present, and transducer and
electronic nonlinearity when present.
APPENDIX C
D PANAMETRICS2.21 Crescent Stree Waltham, Massachusetts 02154. (617) 899-2719
Ultrasonic Methods for Modulus Measurementin Paper
Emmanuel P. Papadakis, Ph.D.
Presented at the 1972 Testing Conference of the Technical Associationof the Pulp and Paper Industry, Benjamin Franklin Hotel, Philadelphia,Pennsylvania, September 26-29, 1972.
Technical Memorandum No. 8
* This work was supported in part by the Office of Naval Research,
Acoustics Branch.
UR-116
POW -
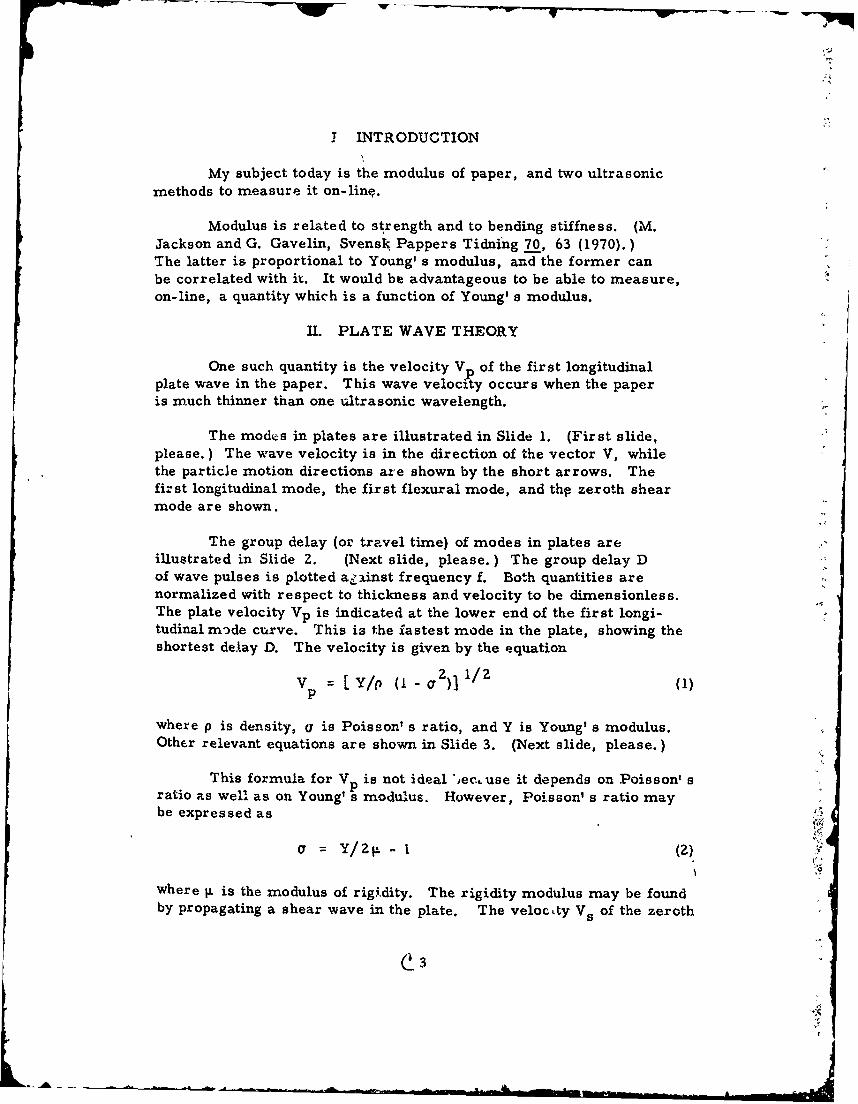
I INTRODUCTION
My subject today is the modulus of paper, and two ultrasonicmethods to measure it on-linp.
Modulus is related to strength and to bending stiffness. (M.Jackson and G. Gavelin, Svens%. Pappers Tidning 70, 63 (1970).)The latter is proportional to Young' s modulus, and the former canbe correlated with it. It would be advantageous to be able to measure,on-line, a quantity which is a function of Young' s modulus.
U. PLATE WAVE THEORY
One such quantity is the velocity V of the first longitudinalplate wave in the paper. This wave velocity occurs when the paperis much thinner than one ultrasonic wavelength.
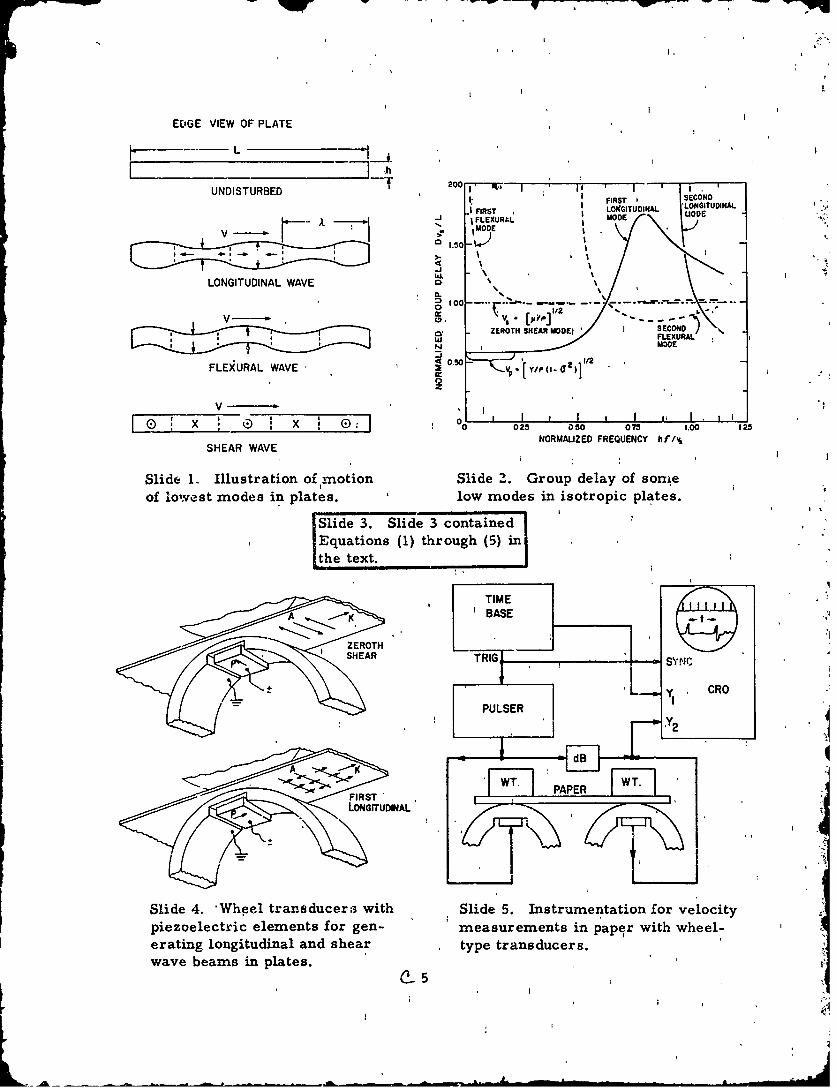
The mode-s in plates are illustrated in Slide 1. (First slide,please.) The wave velocity is in the direction of the vector V, whilethe particle motion directions are shown by the short arrows. Thefirst longitudinal mode, the first flexural mode, and thp zeroth shearmode are shown.
The group delay (or travel time) of modes in plates areillustrated in Slide 2. (Next slide, please.) The group delay Dof wave pulses is plotted against frequency f. Both quantities arenormalized with respect to thickness and velocity to be dimensionless.The plate velocity Vp is indicated at the lower end of the first longi-tudinal mode curve. This is the fastest mode in the plate, showing theshortest delay D. The velocity is given by the equation
V = [Y (I -( 2)]1/2 (1)
where p is density, a is Poisson' s ratio, and Y is Young' s modulus.Other relevant equations are shown in Slide 3. (Next slide, please.)
This formula for V is not ideal ',ec use it depends on Poisson' sratio as well as on Young' s modulus. However, Poisson' s ratio maybe expressed as
or= Y/2. - (2)
where I. is the modulus of rigidity. The rigidity modulus may be foundby propagating a shear wave in the plate, The velocty Vs of the zeroth
(h3
-A•
*__ -~ , - ---.
EDGE VIEW OF PLATE
UNDISTURBED -'-s * I II. FIRST I SECOND
I FIRSTLONGOITUDINAL. LONGITUDINAL.
v ~ .. IFLEXURAL MODE UD
I..- ~1.50
ILLkLONGITUDINAL WAVE a. 1
ZEROTH SHEAR MOOEI 5E 040-
N MODE
FLEXURAL WAVE < 0.50-G2)1/2
-
X 0 X 0 0________ 025 050 075 1.00 125
SHEARWAVENORMALIZED FREQUENCY hf/v,
Slide 1. Illustration of motion Slide 2. Group delay of somieof lowest modes in plates. low modes in isotropic plates.
Slide 3. Slide 3 containedEquations (1) through (5) inthe text.
TIMEBAM
LEONGTUHN
Slide~HEA 4.Weltrndcr ihSid5.Isrmnainfrvlct
Siertg logtuia andshareeyp transducers.wt ld .Isrmnainfrvlct
wave beams in plates.
-w - -op
VARIOUS PAPERSTYPICAL CARD STOCK
3 3'
0S
2 2
LEGEND LIS .0N
KB8E ALBANSNE DWG (E ® LI SoK B E GRAPH TRACING G9 a GLOSS CARD STOCK (D 0K aE GRAPH OPAQUE & A x aE ALBADIENE BACK E) gSAViN COPY PAPER T ALE AERBC
NEWSPRINT 0~ * MANILLA FILE FOLDER TTABLET PAPER + x
LI FRSTLONGTUDNALLI* FIRST LONGITUDINAL
SoZERDTH SHEARSoZRTSHA
0 45 so 45 9
M D C 0 M D DIRECTION, DEGREES C D
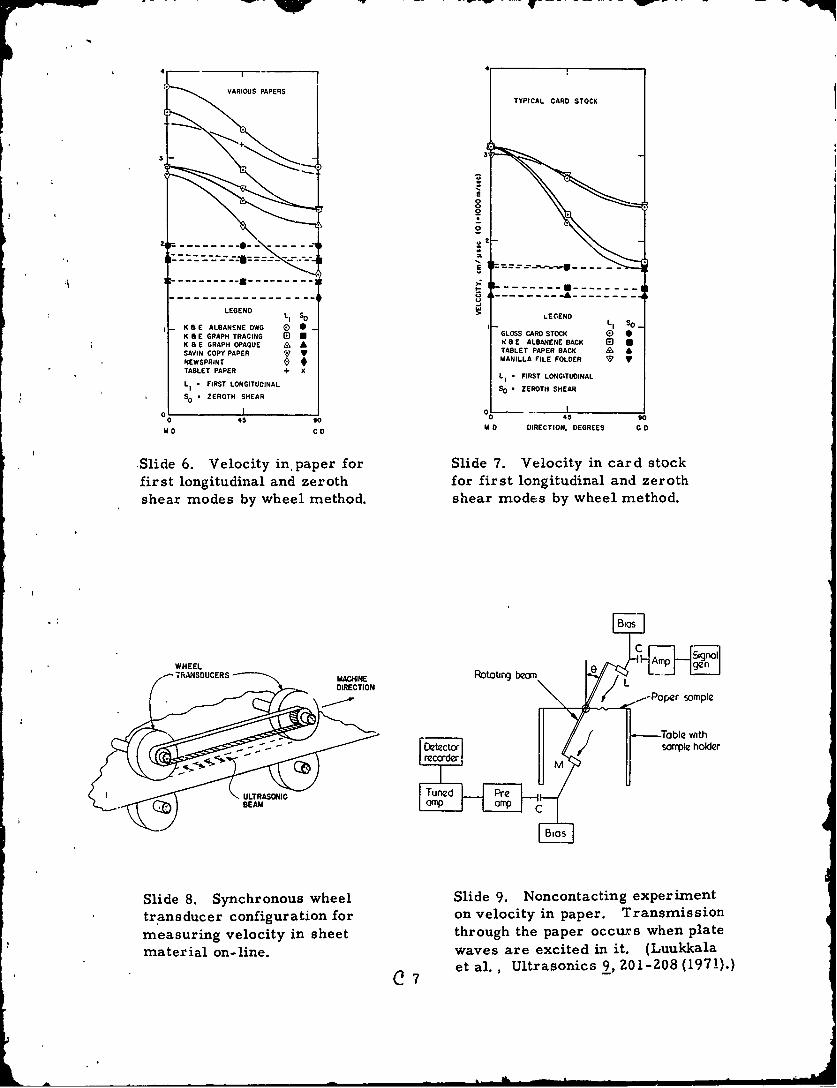
Slide 6. Velocity in, paper for Slide 7. Velocity in card stockfirst longitudinal and zeroth for first longitudinal and zerothshear modes by wheel method, shear modes by wheel method.
BIOS
WH~sUEEL Rotating beamr gen[{
-IL Paper sample
f Table with/eto samrple holder
ULRAONCTuned PreBEMamp amp
Slide 8. Synchronous wheel Slide 9. Noncontacting experiment* tr 'ansducer configuration for on velocity in paper. Transmission
measuring velocity in sheet through the paper occurs when platematerial on-line, waves are excited in it. (Luukkala
(2 et al. ,Ultrasonics 9, 20 1-208 (1971).)
Ic e,. i)N.
tm+../+• "\ xL" /- zn a....."sI..
Plate
Excn -- '7 kb ----- \w/e .._.. _ . *1:.
wave b1*
\ Transmtted
m+ m .
ko sin 0kmkb. rCF • Cb sm Ok .. •"
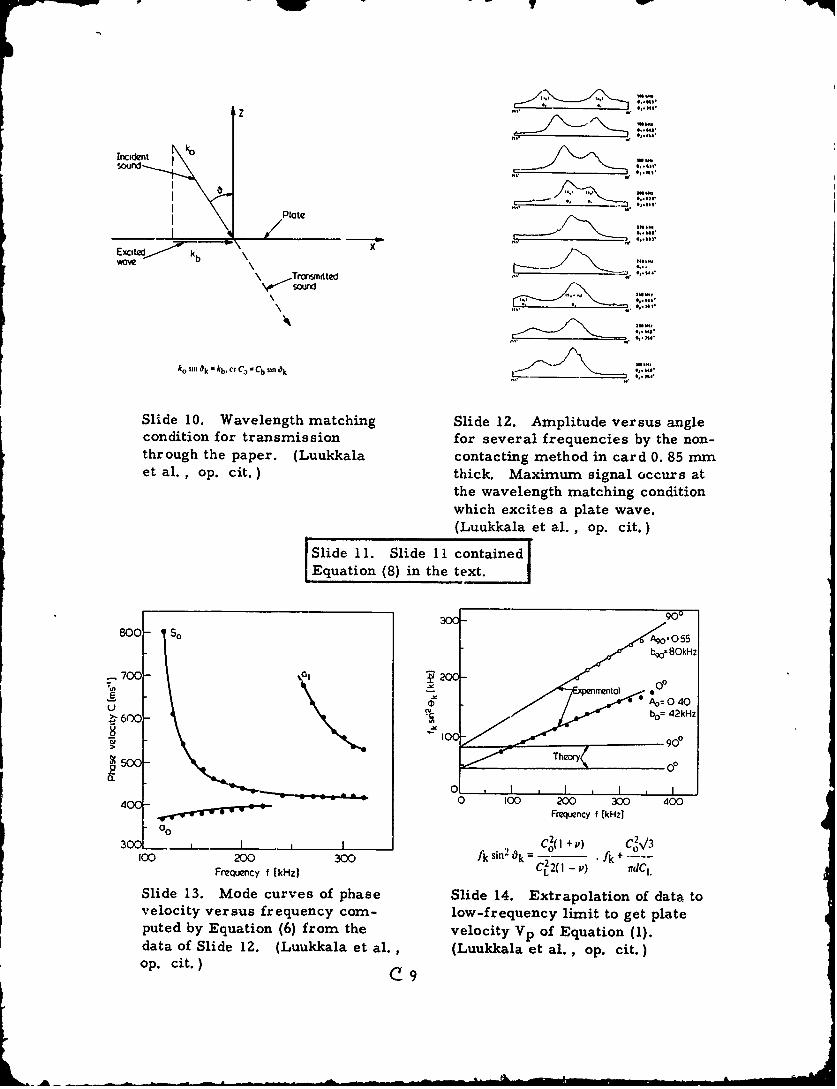
Slide 10. Wavelength matching Slide 12. Amplitude versus anglecondition for transmission for several frequencies by the non-through the paper. (Luukkala contacting method in card 0. 85 mnmet al., op. cit.) thick. Maximum signal occurs at
the wavelength matching conditionwhich excites a plate wave.(Luukkala et al., op. cit.)
Slide 11. Slide 11 containedEquation (8) in the text.
- 30C: -90o
800 So S,Itgo 80kHz
menta 01D Ao: 0 40
u bo= 42kHz"2 600
D 5009 Thery00Q.
0.. 0 * I , I I40(- 0 100 200 300 400
Frequency f [kHz]- o
300 . , I C1(+ +P) C,\13100 200 300 fk sin2 9k _- fk+ ....
FreQuency f [kHz) CL2(I - i) irdCi.
Slide 13. Mode curves of phase Slide 14. Extrapolation of data tovelocity versus frequency corn- low-frequency limit to get plateputed by Equation (6) from the velocity Vp of Equation (1).data of Slide 12. (Luukkala et al., (Luukkala et al., op. cit.)op. cit.) C 9
poor 1W
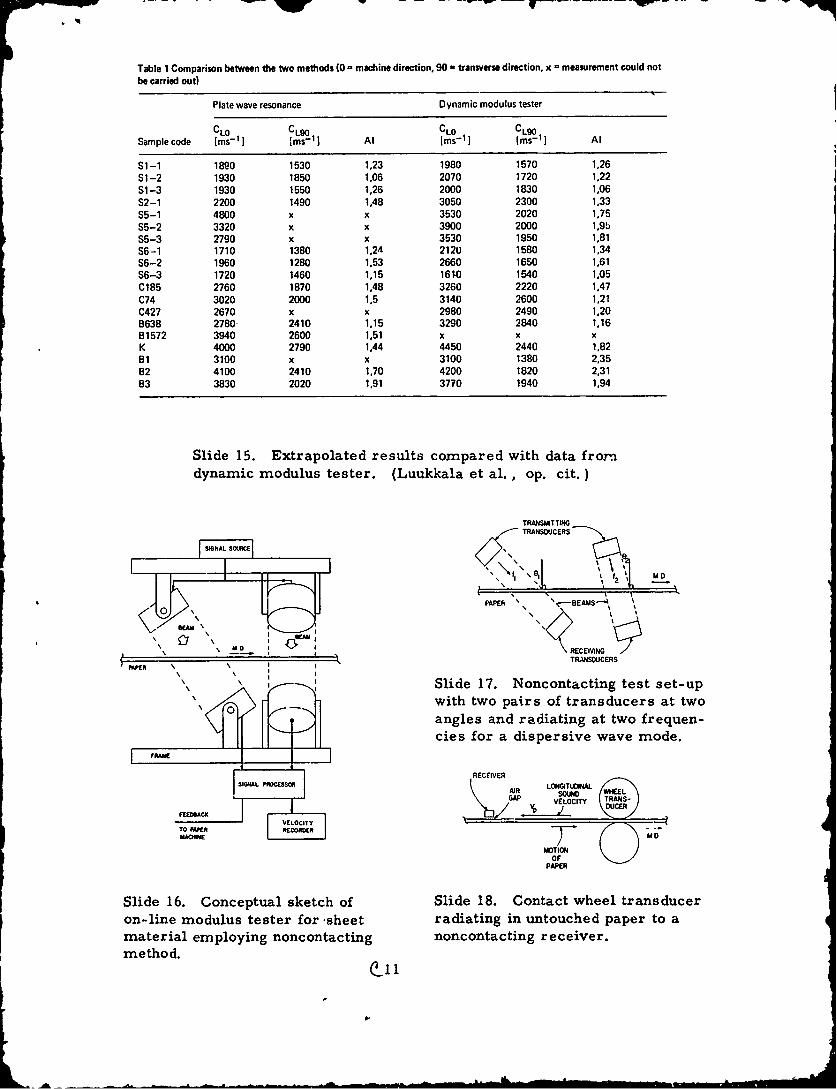
Table 1 Comparison between the two methods (0 = machine direction, 90 = transverse direction, x = measurement could notbe carried out)
Plate wave resonance Dynamic modulus tester
CL0 CL90 CLO CL90Sample code [ms- I [ms- 1 I Al ms- 1 ] ms- 1 I Al
81-1 1890 1530 1,23 1980 1570 1,26S1-2 1930 1850 1,06 2070 1720 1,22S1-3 1930 1550 1.26 2000 1830 1,06S2-1 2200 1490 1,48 3050 2300 1.33$5-1 4800 x x 3530 2020 1,75S5-2 3320 x x 3900 2000 1,9bS5-3 2790 x x 3530 1950 1,81S6-1 1710 1380 1,24 2120 1580 1,34S6-2 1960 1280 1,53 2660 1650 1,61S6-3 1720 1460 1,15 1610 1540 1,05C185 2760 1870 1.48 3260 2220 1,47C74 3020 2000 1,5 3140 2600 1,21C427 2670 x x 2980 2490 1.208638 2780- 2410 1,15 3290 2840 1.1681572 3940 2600 1,51 x x xK 4000 2790 1,44 4450 2440 1,82B1 3100 x x 3100 1380 2,3582 4100 2410 1.70 4200 1820 2,3183 3830 2020 1,91 3770 1940 1,94
Slide 15. Extrapolated results compared with data fromdynamic modulus tester. (Luukkala et al., op. cit.)
TRANSMIITTINGTRANSDUCERS
SIGSNAL S5-7 I",
'\ 1"'2PAPEF
.'t.- BEAMS
--
RECEIVING
TRANSOUCERS
I ISlide 17. Noncontacting test set-upwith two pairs of transducers at twoangles and radiating at two frequen-cies for a dispersive wave mode.
RECEIVER
AMR SOTUw WHEELGAP VELOCITY TAS
FE.EDUCK b,9DUE
VELOCITY
TO FANMR IECOROCA --TN M D
MOTIONOF
PAMER
Slide 16. Conceptual sketch of Slide 18. Contact wheel transduceron-line modulus tester for -sheet radiating in untouched paper to amaterial employing noncontacting noncontacting receiver.method.
oL~
be done directly by -otating the transducers, or it could be done in-directly by varying the frequency fed to a phased array transducer.Physical angle or frequency would have to be varied with a feedbackmechanism to hunt for maximum transmission. The hunt for maxi-mum transmission could be complicated by various ambient factorssuch as turbulent air or absorption in the paper.
Ordinary plane transducers could be used in the noncontactingcase if one chose to operate in a dispersive region of the longitudinalmode. For each direction of interest, e. g., the machine direction,two pairs of transducers would be needed. See Slide 17. (Next slide,please. ) The two pairs would be set at different angles of incidence,and the input frequency to each pair would be different and would beswept independently to find maximum transmission for each pair. Theresultant velocity of plate waves would be found by ext.-apolating a plotof f sin2 0 versus f to zero frequency as show- 2,arlier in Slide 14. Asingle system to monitor frequency at a single angle might be adequatefor practical purposes.
The contact method seems attractive at first glance if contactwere permissible. Turbulent air problems are absent, and absorptionin the paper would not be a problem as long as signal strength did notfall below a threshold. However, the rolling action under pressuremight modify the paper being measured. This problem might be over-come with an air-coupled transducer as receiver "upstream" from thewheel transmitter. See Slide 18. (Next slide, please. ) The virtue ofthis configuration would be that paper untouched by the wheel rollerworld be interrogated.
In summary, on-line modulus monitoring of paper is now withinthe realm of possibility. Work is still necessary to define the bestmethod to use, and the best configuration to exploit the method. Aclose interaction between producers and experimenters will be neces-sary to create a viable system.